rr-413a - feasibility study of reserved bus-car pool lanes
TRANSCRIPT
FEASIBILITY STUDY
OF
RESERVED BUS-CAR POOL LANES
FOR JEFFRIES FREEWAY {i-96)

FEASIBILITY STUDY
OF
RESERVED BUS-CAR POOL LAf\IES
FOR JEFFRIES FREEWAY (1-96)
JUNE, 1975
MICHIGAN STATE HIGHWAY COMMISSION
SOUTHEASTERN MICHIGAN TRANSPORTATION AUTHORITY
CITY OF DETROIT, DEPARTMENT OF TRANSPORTATION
SOUTHEAST MICHIGAN COUNCIL OF GOVERNMENTS
The preparation of this material has been financed in part through a grant from the Federal Highway Administration of the United States Department
· of Transportation and through a grant from the Michigan Highway Department.
,. ,.

TABLE OF CONTENTS
TITLE PAGE ....•...... -.· ......•. , ... ~ ............................. , ..... . TABLE OF CONTENTS. , , , ..• , ..... , . , , .. , . , ... , •...•.•......•.•• , .•.....••. LIST OF TABLES ...•• , ••... , .•• , •.• , •. , , •...• , ....• , ....• , ••.•.........•. LIST OF FIGURES, • , , .• , •..•• , •. , .• , • , ••. , ... , • , ...•••.....•.•.••..•.•... LIST OF ~PS. ·- .. , -.- .-. -.--.-, -.-. , ,-. , -.- .. _ ...... ~ . , .• , ~ . ~ .. ~ .................... . CO~ITTEE 1\ffiMBERS . .... 0 •••••• _. ••• \ • t • t • 0 • _. •• t ••••••••••• 0 D •••••••• " ••••
SUMMARY OF FINDINGS, AND RECOMMENDATIONS., .. ,, ...•.•....••.....•...•...
CHAPTER
I. Introduction A. Background of Study . . ·-. t ••• a • I 0 •••• 0 a •••••••••••••••••••
B. Objectives of Study ..•. ,,,,,.,,,,., .. , .•.•. , ....•..• , •... C. Study Organization .................................... .. D. Study Procedures. , ....... , ... , ... , ...............•...... E. Relationship of Study to Other Planning Efforts ........• ·
II. Jeffries Freeway A. Physical Characteristics .... , •. , .. , ..•........ , ....•. , .. B. Traffic and Travel Characteristics ..•......•............ C. Freeway Construction Schedule •. , .. ,;., ......•.•••.•. , •••
III. Characteristics of Transit System and Service Area A. Geographic and Social Description of the Survey Area ..•• B. Existing Transit System,, .. ,., ......•.......... , ....... .
IV. Reserved Bus-Carpool Facility A. Reserved Lane Concepts . .... , ....... , ... t • •••••••••• , ••••
B. Reasons for Selecting Jeffries Freeway ..••.....•........ C. Limits and Characteristics of Jeffries
Reserved Lane Service ....... , .• , .•......•.•..•........•.
V. Potential Transit Market A. Procedure . ......... 0 0 • 0 ••••• 0 0 • 0 ••••••••• a ••••••••••• D ••
B, Methodology ......•... ~ . , ••... , .. , ........... , .......... .
VI. Jeffries Transit System Alternatives and Costs A, Corridor Transit Service. , ........ , .......•.••... , .•.... B. Alterations to Existing Service .•...............•.....•. C. Limits and Characteristics of Jeffries
Reserved Lane Service. , ......•. , ............•...•....... D. Express Routes- Oakland County, .. , ..................••.
i
PAGE
i iii v vi vii
viii
1 2 3 4 5
6 6
15
16 21
28 29 30 30
37 37
50 50
55 59
!.

TABLE OF CONTENTS (con't)
CHAPTER PAGE
VI. (con 't)
E. Express Route Extensions" Wa)'ne County ... ,.................. 60 F. Service Summary ..... , . , ......... , . ; ............... , . . . . . . . . . . 62 G. Detroit CBD Transit Service ......•.. , .............. ,......... 66
VII. Park and Ride
A. Existing Conditions., .•...... , .. , ..... , ....... ,.............. 73 B. Site Alternatives .. , .. , .. , .. , .. , .. , ..... ,.................... 73 c. Cost ............. , ....... ~.!································· 74
VIII. Traffic Center
A. Signing and Pavement Marking .... , .. , ..... , ..... ,............. 78 B. Geometries..................................................... 82 C. Law Enforcement Program. , .. , .. , .. , . . . . . . . . . . . . . . . . . . . . . . . . . . . 87
IX. Public Information Program
A. Objectives, ........ , ..... , ..... , .. , .......... ,............... 88 B. Description. . . . . . . . . . . . . . . . . . . . . . . . . . . . . . . . . . . . . . . . . . . . . . . . . . 89 C. Cost . ................. ~ ....... , . . . . . . . . . . . . . . . . . . . . . . . . . . . . . . 89
APPENDICES
A, On-Board Transit Survey of April 24, 1974 Analysis Procedures and Results
B. Design Drawings for West Terminus of Reserved Lane C. Design Drawings for Southeast Terminus of Reserved Lane D, Construction Schedule - Jeffries Freeway E. Senate Bill No. 1364 F. Young & Rubicam, Public Information Media Plan
ii

TABLE
II-B-2
II-B-3
II-B-5
II-B-6
III-A-1
III-B-1
IV-C-1
IV-C-2
IV-C-3
V-B-1
V-B-2
V-B-3
LISTING OF TABLES
TABLE
Percent of Peak Hour* Person Trips by Occupancy .. Class Number of Occupants . , . . . . • . . . .
Pnrcent of Vehicles by. Occupancy
Travel Time and Delay Study Schoolcraft to Howard Street, . ' .
D-DOT Inbound Travel Time and Delay Study " March, 1975 . . . • .
............
... I-96 Detroit Northbound Volume at Ivanhoe.
I-96 Detroit Southbound Volume at Ivanhoe.
I-96 Detroit N-S Total Volume at Ivanhoe
1970 Census Population within the Jeffries Freeway Service Area by Band and Jurisdiction , . • • . .
D-DOT AM Peak Hour Service Description During Survey Period. . • . . •.
Effects of Diverting Vehicles with 2 and/or 3+ Occupants to Exclusive Lane ......••..
Effects of Diverting Vehicles t~ith 2 and/or 3+ Occupants to Exclusive Lane ....•••...
Effects of Diverting Vehicles with 2 and/or 3+ Occupants to Exclusive Lane
Expansion Factors, .
Off Line Modal Split by Distance from route . . . . . . .
On Line Modal Split and Transit-Auto Travel Time Ratio by Route Segment.
Second Avenue- Route Segment #4 ...
• • • 0 • • • • 0 • •
PAGE
8
8
10
11
12
13
14
20
25 - 27
34
35
36
38
40 - 41
42 - 44
45
TABLE
VI-B-1
VI-B-2
VI-F-1
VI-F-2
VI-F-3
VI-G-1
VII-B-1
VII-B-2
IX-C-1
LISTING OF TABLES (con't)
TABLE
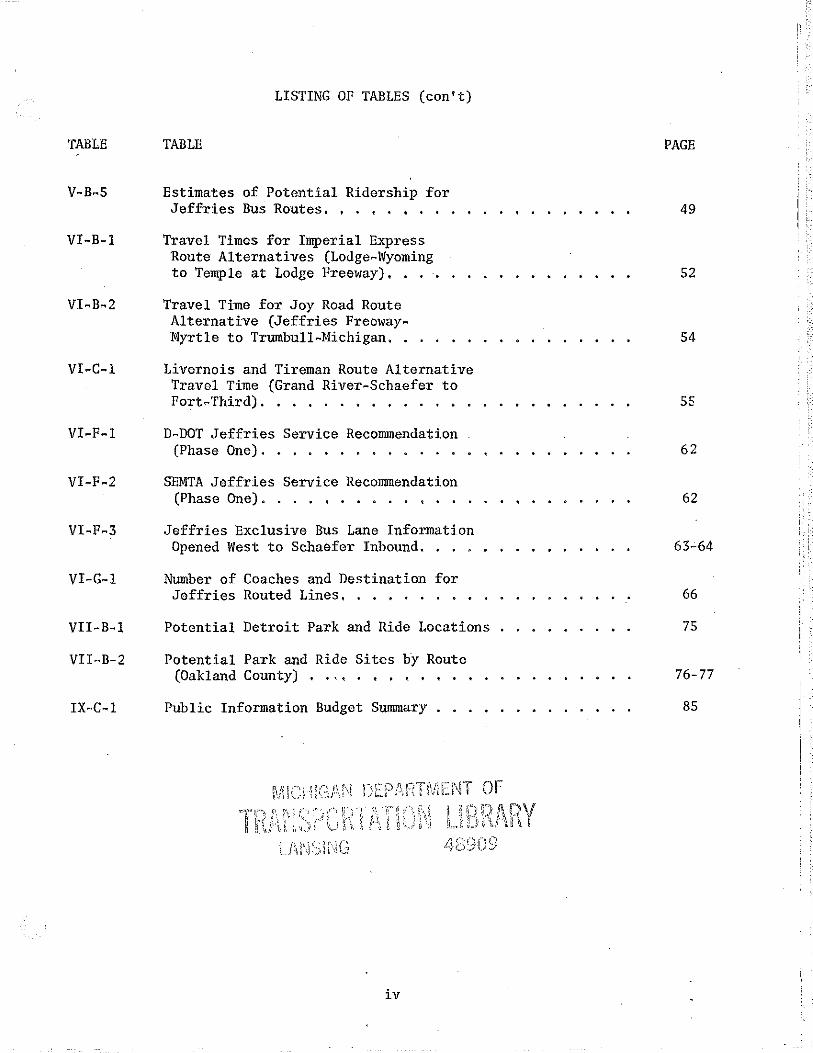
Estimates of Potential Ridership for Jeffries Bus Routes. , . , . , ,
Travel Times for Imperial Express Route Alternatives (Lodge-Wyoming to Temple at Lodge Freeway) •.
Travel Time for Joy Road Route Alternative (Jeffries FreewayMyrtle to Trumbull-Michigan, .
Livernois and 'fireman Route Alternative Travel Time (Grand River-Schaefer to Fort-Third) . . . . . . • • . . . . •
D-DOT Jeffries Service Recommendation (Phase One) . • . . . . . • . . . . . 0 • • • • • • • • • •
SEMTA Jeffries Service Recommendation (Phase One). . . . , • . . . . . . .
Jeffries Exclusive Bus Lane Information Opened West to Schaefer Inbound,
Number of Coaches and Destination for Jeffries Routed Lines, ••..
. . . . . . . . . .
Potential Detroit Park and Ride Locations
Potential Park and Ride Sites by Route (Oakland County) ... , , , , ,
Public Information Budget Summary
iv
PAGE
49
52
54
55
62
62
63-64
66
75
76-77
85
FIGURES
FIGURE TITLE PAGE
VIII-A-·1 Special Marking for Reserved Lane 81
VIII-A-·2-5 Green Lane Signing 82
VIII-A-6•7 Green Lane Signing 84 ... VIII-A-8-9 Green Lane Signing 85
v

MAP
II-A-1
III-A-1
III-A-2
III-B-1
V-B-1
V-B-2
VI-B-1
VI-B-2
VI-B-3
VI-C-1
VI-G-1
VI-G-2
VII-B-1
VII-A-1
MAPS
TITLE
J e:ffries Freeway ,. • • • • • ..;. • .
The Existing Southeastern Michigan Freeway Network by County and the City of Detroit , • • • • • • ,
Jeffries Freeway Service Area by Band Area and Municipality
CBD Routing of Surveyed Bus Lines
Bus Lines Surveyed ,
~ • • • • • • 0 0 0 0 0 •
Recommended Jeffries Route Additions and Alterations ••• , •• , ••.
Grand River Express Route Alternative
Imperial Express Route Alternative
Joy Road Express Route Alternative
Livernois-Tireman Express Route Alternative
C.B.D. Routings
Employment Accessibility by Route
Potential Park and Ride Sites
Location of Reserved Lane Signing Restrictions
vi
PAGE
17
17
19
22
39
48
51
53
56
58
69
70
73
86

SAM F. CRYDERMAN
HOMER HALL
ROBERT HICKS
JOHN KANTERS
HARRY R. KELLER
GARY KRAUSE
DONALD E. ORNE
JULIEN WOLFE
A. G. BASMADJIAN
GEORGE FRIEND
HOMER HALL
EDWARD J. KAZENKO
ROBERT KUEHNE
WILLIAM F. SAVAGE
JAMES SCHULTZ
SGT. L. SHANKS
NELSON A. STARK
KENNETH E. UNDERWOOD
JULIEN WOLFE
JEFFRIES ADVISORY COMMITTEE
- Bureau of Transportation Planning, Michigan Department of State Highways and Transportation
- Planning Department, City of Detroit, ex-officio
- Transportation Planning and Traffic Engineering Division, Department of Transportation, City of Detroit
- Department of Transportation, City of Detroit
- Federal Highway Administration
- Southeast Michigan Council of Governments
- Traffic and Safety Division, Michigan Department of State Highways and Transportation
- Southeastern Michigan Transportation Authority 1\
JEFFRIES TECHNICAL COMMITTEE
- Transportation Planning and Traffic Engineering Division, Department of Transportation, City of Detroit
- Scheduling and Planning Section, Department of Transportation, City of Detroit
- Planning Department, City of Detroit, ex-officio
- Metro Regional Planning Division, Michigan Department of State Highways and Transportation
- Mass Transportation Planning Section, Michigan Department of State Highways and Transportation
- Geometries Section, Michigan Department of State Highways and Transportation
- Southeast Michigan Council of Governments
- Police Department, City of Detroit, ex-officio
- Federal Highway Administration
- Metro Regional Planning Division, Michigan Department of State Highways and Transportation
- Southeastern Michigan Transportation Authority
vii
SUMMARY OF FINDINGS, AND RECOMMENDATIONS
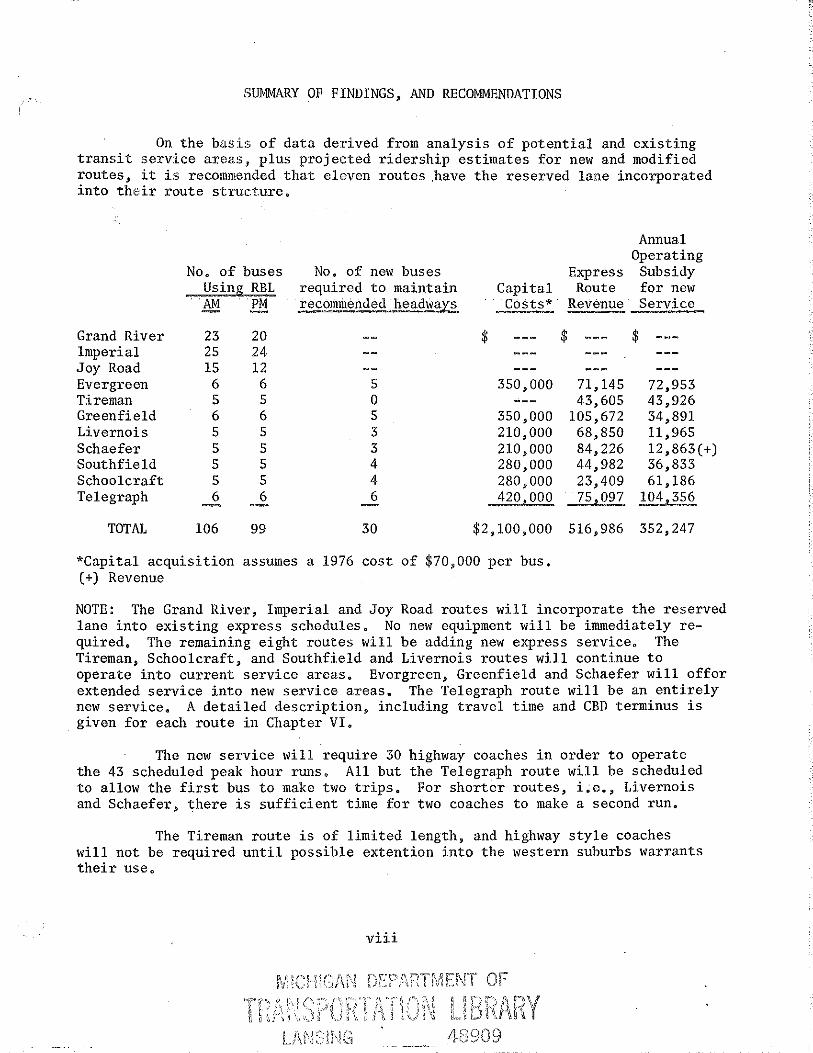
On the basis of data derived from analysis of potential and existing transit service areas, plus projected ridership estimates for new and modified routes, it is recommended that eleven routes .have the reserved lane incorporated into their route structure"
Annual Operating
No. of buses No. of new buses Express Subsidy Using RBL required to maintain Capital Route for new
. AM PM recommended headways Costs*· Revenue Service
Grand River 23 20 $ $ $ Imperial 25 24 Joy Road 15 12 Evergreen 6 6 5 350,000 71,145 72,953 Tireman 5 5 0 43,605 43,926 Greenfield 6 6 5 350,000 105,672 34,891 Livernois 5 5 3 210,000 68,850 11 '965 Schaefer 5 5 3 210,000 84,226 12,863(+) Southfield 5 5 4 280,000 44,982 36,833 Schoolcraft 5 5 4 280,000 23,409 61,186 Telegraph 6 6 6 420,000 75,097 104,356
TOTAL 106 99 30 $2,100,000 516,986 352,247
*Capital acquisition assumes a 1976 cost of $70,000 per bus. (+) Revenue
NOTE: The Grand River, Imperial and Joy Road routes will incorporate the reserved lane into existing express schedules" No new equipment will be immediately required. The remaining eight routes will be adding new express service. The Tireman, Schoolcraft, and Southfield and Livernois routes will continue to operate into current service areas" Evergreen, Greenfield and Schaefer will offer extended service into new service areas" The Telegraph route will be an entirely new service. A detailed description, including travel time and CBD terminus is given for each route in Chapter VI.
The new service will require 30 highway coaches in order to operate the 43 scheduled peak hour runs. All but the Telegraph route will be scheduled to allow the first bus to make two trips. For shorter routes, i;e., Livernois and Schaefer, there is sufficient time for two coaches to make a second run.
The Tireman route is of limited length, and highway style coaches will not be required until possible extention into the western suburbs warrants their use.
viii
T !! ~ F)! ~:~j ,[~ F? '{ L.".J'.-JIH
4E3909
-- - - -.~
~·'
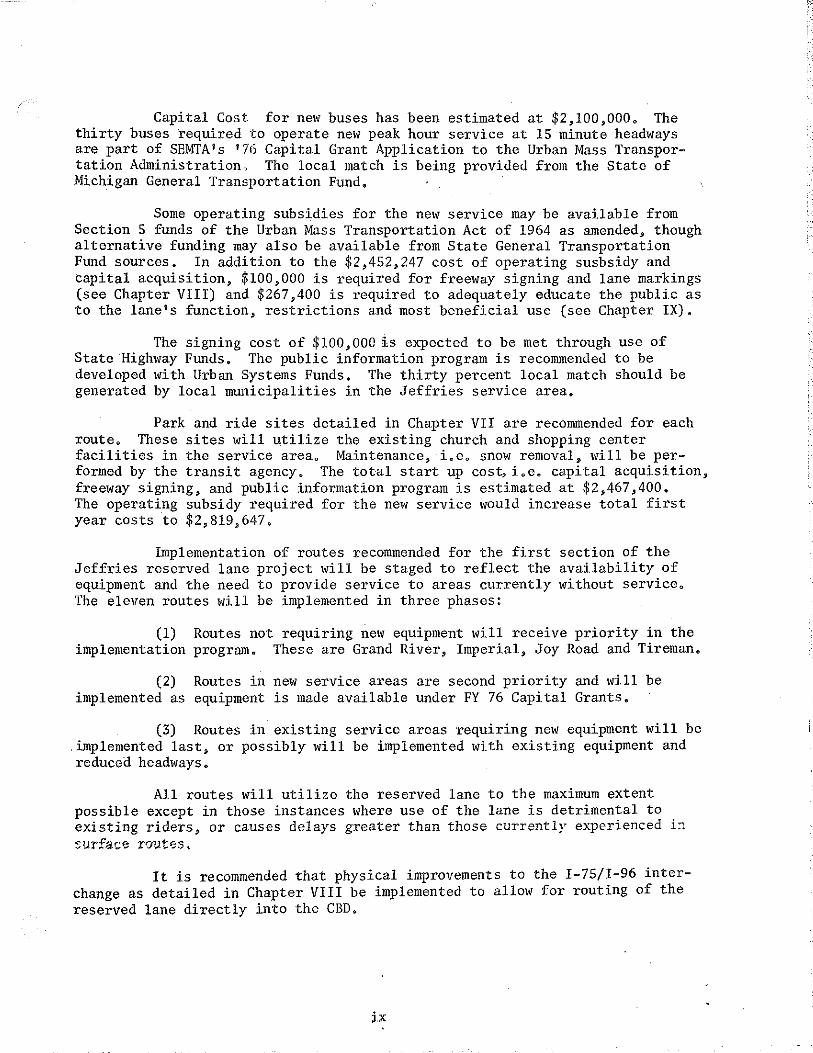
Capital Cost for new buses has been estimated at $2,100,000, The thirty buses required to operate new peak hour service at 15 minute headways are part of SEMTA's ''76 Capital Grant Application to the Urban Mass Transportation Administration, The local match is being provided from the State of Michigan General Transportation Fund,
Some operating subsidies for the new service may be available from Section 5 funds of the Urban Mass Transportation Act of 1964 as amended, though alternative funding may also be available from State General Transportation Fund sources. In addition to the $2,452,247 cost of operating susbsidy and capital acquisition, $100,000 is required for freeway signing and lane markings (see Chapter VIII) and $267,400 is required to adequately educate the public as to the lane's function, restrictions and most beneficial use (see Chapter IX).
The signing cost of $100,000 is expected to be met through use of State Highway Funds. The public information program is recommended to be developed with Urban Systems Funds. The thirty percent local match should be generated by local municipalities in the Jeffries service area.
Park and ride sites detailed in Chapter VII are recommended for each route. These sites will utilize the existing church and shopping center facilities in the service area. Maintenance, i.e. snow removal, will be performed by the transit agency. The total start up cost, i.e. capital acquisition, freeway signing, and public information program is estimated at $2,467,400. The operating subsidy required for the new service would increase total first year costs to $2,819,647.
Implementation of routes recommended for the first section of the Jeffries reserved lane project will be staged to reflect the availability of equipment and the need to provide service to areas currently without service. The eleven routes will be implemented in three phases:
(1) Routes not requiring new equipment will receive priority in the implementation program. These are Grand River, Imperial, Joy Road and Tireman.
(2) Routes in new service areas are second priority and will be implemented as equipment is made available under FY 76 Capital Grants.
(3) Routes in existing service areas requiring new equipment will be .implemented last, or possibly will be implemented with existing equipment and reduced headways.
All routes will utilize the reserved lane to the maximum extent possible except in those instances where use of the lane is detrimental to existing riders, or causes delays greater than those currently ex~erienced i~ surface rout~s~
It is recommended that physical improvements to the I-75/I-96 interchange as detailed in Chapter VIII be implemented to allow for routing of the reserved lane directly into the CBD.
ix

The ~;t.a!{ed implementation program would be:
Phase I Grand River September 1, 1975 Imperial September 1, 1975 Joy Road September 1, 1975 Tire man September 1, 1975
Phase II Telegraph* September 1, 1975 Evergreen* September 1, 1975 Greenfield* September 1, 1975
Phase III Livernois January 1976 Schaefer January JCl76 Southfield January 1976 Schoolcraft January 1976
*SEMTA operated :routes
The Michigan Department of State Highways and Transportation estimates that the next section of I-96 tc be opened to the public will be that portion from Schaefer, the current te':'minus, west to the Southfield Freeway (M-39). Completion date is projected to be September, 1976. At this time a number of routes, Le., C:reenf:i.eld, Southfield, Evergreen and Telegraph will be rerouted to take advantage of the larger segment of the Reserved Lane. Likewise, routes into western Wayne County, i.e., Fenkell, Second, and Plymouth and a north western extention of Grand River to Halsted Road, which currently have a lower priority will also be implemented. (see Chapter VI for a detailed description of proposed Western Wayne County routes.) In addition,, routes on arteries perpend.i<:ulaT to the Jeffries will be investigated as to their potential to servu CBD commuters.
The entire length of the I-96 when extended to I-275, is scheduled for completion by Fall of 1977. An extension of the reserved lane restriction beyond M-39 will depend on the degree of traffic congestion; commuter response to new bus service, and; the use by car pools of the existing reserved lane.
X

I - INTRODUCTION
A. BACKGROUND OF STUDY
The 1990 Transportation Plan for the Southeast Michigan Region, prepared by the Southeast Michigan Council of Governments (SEMCOG), stresses the. need for a greatly improved high and intermediate levei public transportatio·n network for 1990. In outlining the transportation needs of the region, SEMCOG's Transportation Goal Statement calls for a balanced system of public and private transportation as follows:
"To achieve a functionally related system of the various modes of transportation at a capacity to handle trips generated by land use, on behalf of the people of the Region and their economic and social interests:•
"Such a related system must include highways, public transit, air, rail, and water carriers. For the people, this involves both highway and public transit facilities within the Region, providing services from home to major employment centers and sub-centers, to shopping places, to recreational areas, to educational and cultural institutions, etc. For economic enterprises, such a system needs to be geared to the effective and economical movement of goods and materials within the Region and into and out of the Region. In both cases, attendant terminal and parking facilities of an appropriate character and scale are essential:'
"The public transit system is essential in order to relieve traffic congestion on streets and highways and to accommodate the needs of people. It should be of the character and extent required to:
(1) Encourage the use of public transit by providing riders with convenience, comfort, and speed, thus offering a choice of mode of transportation for people who would use public transit rather than motor carso
(2) 9rovide mobility for those for whom public transportation is a necessity.
(3) Aid in shaping the regional pattern of growth and development:'
"The achievement of a regional transportation system must be viewed costwise in the light of technical alternatives and both obvious and hidden social costs to the governmental and private sectors. The establishment of a regional system of transportation as a set of service facilities to support not only land uses and other facilities, but also the overall goals of the people of the Region is of vital significance. In the long run, all public facilities are paid by the people by means of one or another form of taxation. Public highways have reached their high level of use and social value with the substantial benefits of gasoline and weight taxes. Public transit also will need to be supported by governmental funds - local, state and federal:'
-1-

"Fm.'ther" the regional transportation system - in all its modes should seek to provide the highest degree of safety for the people who use it and for the safe delivery of the goods and materials carried upon it. Likewise, the total system should be so planned and constructed that the minimum practical negative environmental impact is made by any of its functional elements."
While stated explicitly in 1974, an understanding of the need for quick action resulted in the initiation of discussions by several levels of government in 1971 concerning actions that might be taken towards freeway express bus service. At that time, the widely publicized I-495 "Contra-flow" bus lanes in New Jersey had been in operation for one year, and the technique of reserving freeway lanes for peak hour use by buses (or other high capacity vehicles) had successfully moved from theory to practice.
Also of importance at that time was the imminent opening of a portion of the I-96 "Jeffries Freeway" within the City of Detroit, which, when timed with the I-495 project in New Jersey, raised questions at both the technical and policy level as to whether such a program could be utilized to improve both transit service and freeway performance in Detroit. This was especially important given the relatively long lead time projected for implementation of a rapid transit system within the Grand River Corridor.
During 1972 an informal Jeffries Freeway Committee was formed, compr1s1ng representatives from the Federal Highway Administration (FHA); Michigan Deparlment of State Highways (MDSH) 1 Detroit Department of Street Railways (DSR); Detroit. Department of Streets and Traffic (DDST); Southeastern Michigan Council of Governments (SEMCOG) and the Southeastern Michigan Transportation Authority (SEMTA). The committee met several times during the year, but no firm action was taken until February, 1973, at which time a comprehensive study was proposed by SEMTA, with funding promised by the Federal Highway Administration and the State Highway Department. A work program and contract were finalized during 1973, and initial work was formally authorized to begin as of December 20, 1973.
1The title of Michigan Department of State Highways has since been changed to the Michigan Department of State Highways and Transportation
2As of July 1, 1974 the Detroit Department of Street Railways and the Department of Streets and Traffic were merged into the Detroit Department of Transportation.
B. OBJECTIVES OF STUDY
The basic objective of the Study was to determine the technical and economic feasibility of implementing a reserved bus and car pool lane on a segment of the Detroit freeway network; Of particular importance was the need to identify the specialized requirements of a reserved lane which was not "contra-flow", but rather, operated in the same direction as the adjacent traffic lanes. (See description of Reserved Lane Concepts, Chapter IV).
-2-

/;--
In reviewing the Study requirements in detail, it became clear that a comprehensive "systems'' approach would be required for the transit study. Specifically, the ability of the bus lane to attract passengers would depend upon availability of parking spaces located along major bus routes; service frequency as well as speed; Central Business District (CBD) distribution; program image and publicity techniques, and enforcement of reserved lane vehicle prohibitions.
It was also essential that an inventory of existing bus system and freeway characteristics be developed prior to projecting future use of the reserved lane.
A further objective was to understand the impact of a reserved lane upon existing transit service. It would be wrong to develop a freeway express bus system to serve Detroit's outer areas and suburbs at the expense of innercity transit users. To insure that all segments of ridership were given representative input into a system emanating from an exclusive lane concept, a survey was designed which inventoried user characteristics of existing riders in the Jeffries service grea.
Finally, a fun operating and capital cost breakdown would be required to assess the financial ~easibility of the program.
It was understood that techniques to be developed through this Study would serve as a pilot for further implementation programs along the freeway network in Southeastern Michigan,
C. STUDY ORGANIZATION
The work program was divided into 10 subtasks:
Task 1. Study Definition
This task provided for identification of the service area most likely to benefit from implementation of Jeffries Freeway reserved bus-car pool lane operation.
Task 2. Transit Survey
This task was designed to meet two objectives: (1) provide a basic data base for existing transit services and user characteristics, against which future service changes would be measured, and; (2) generate information as to the transit service available to inner city residents so as to prevent the rerouting of heavily used local service onto the freeway. (A full description of work accomplished under Task 2 is presented in Appendix A.)
Task 3. Freeway Traffic Analysis
Vehicle counts, vehicle occupancy surveys and installation of a permanent traffic recorder (PTR) were carried out under this work element. Also, the Michigan Department of State Highways and Transportation conducted travel time studies along the Jeffries, and parallel Grand River Avenue, to provide basic data required for bus route revisions , and "before-after" analysis.
-3-
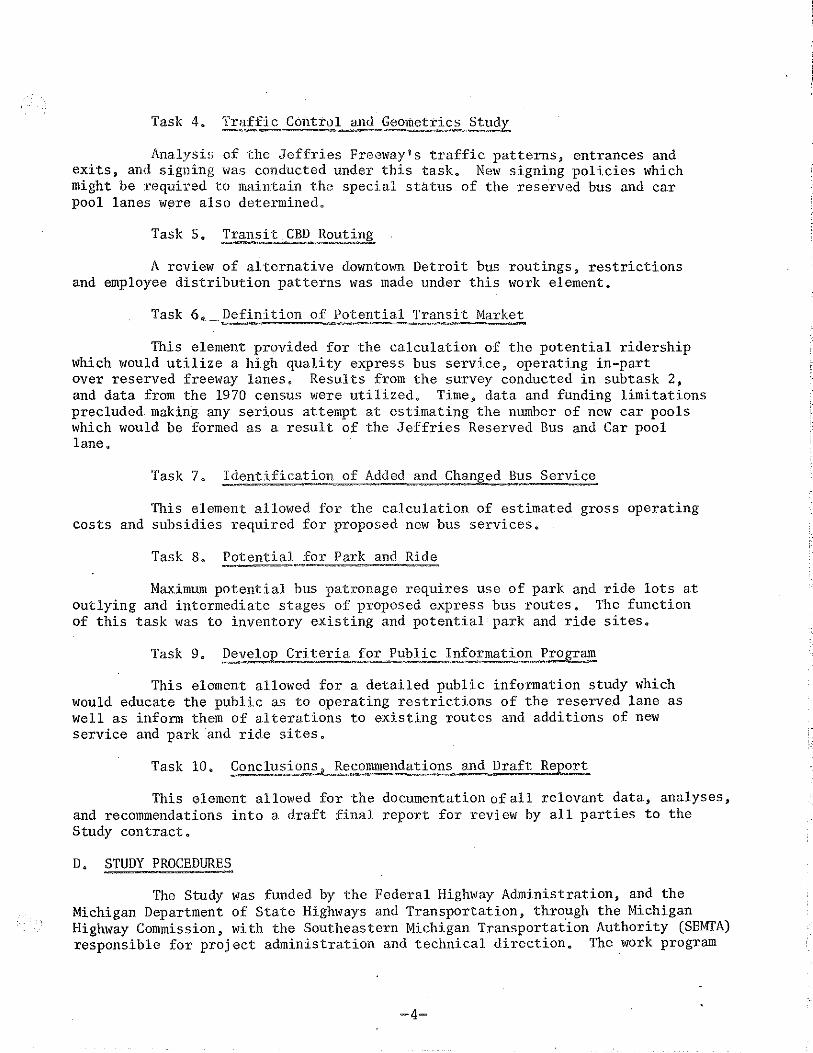
Task 4. Traffic Control and Geometries Studz
Analysis of the clef fries Freeway's traffic patterns, entrances and exits, and signing ~<as conducted under this task. Nco~< signing policies which might be :required to maintain the special status of the reserved bus and car pool lanes were also determined.
Task s. Tran~it CBD Routing
A review of alternative downtown Detroit bus routings, restrictions and employee distribution patterns was made under this work element.
Task 6, _Definition of Potential Transit Market
This element provided for the calculation of the potential ridership which would utilize a high quality express bus service, operating in-part over reserved freeway lanes. Results from the survey conducted in subtask 2, and data from the 1970 census were utilized. Time, data and funding limitations precluded making any serious attempt at estimating the number of new car pools which would be formed as a result of the Jeffries Reserved Bus and Car pool lane.
Task 7. Identification of Added and Changed Bus Service
This element allowed for the calculation of estimated gross operating costs and subsidies required for proposed new bus services.
Task 8. Potential for Park and Ride
Maximum potential bus patronage requires use of park and ride lots a.t outlying and intermediate stages of proposed express bus routes. The function of this task was to inventory existing and potential park and ride sites.
Task 9. Develo£ Cri teriil; Jar Public Information Program
This element allowed for a. detailed public information study which would educate the public as to operating restrictions of the reserved lane a.s well as inform them of alterations to existing routes and additions of new service and park and ride sites.
Task 10. Conclusions 1 Recommendations and Draft Report
This element allowed for the documentation of all relevant data., analyses, and recommendations into a. draft final report for review by all parties to the Study contract.
D. STUDY PROCEDURES
The Study was funded by the Federal Highway Administration, and the Michigan Department of State Highways and Transportation, through the Michigan Highway Commission, with the Southeastern Michigan Transportation Authority (SEMTA) responsible for project administration and technical direction. The work program
-4-
f-!

was divided into 10 subtasks with part or all of each subtask assigned to SEMTA; the Michigan Department of State Highways and Transportation (MDSH&T); SEMCOG; and D-DOT.
While not directly involved in the .work program, under terms of the contract, the FHA was appointed as an ex officio member of the Advisory Committee which was created to review work progress and policy matters arising in conjunction with the Study.
A technical committee was also formed, comprised of members of each above-named agencies, as well as representation from the Detroit Police Department, Detroit Department of Economic and Community Development. Meetings of both committees were held monthly, or more frequently, if necessary, to review work output and overall Study progress.
The Study was authorized to start on December 20, 1973, and extend for one year. A two month extension authorized late in 1974 carried the work program through to February, 1975.
E. RELATIONSHIP OF THE STUDY TO OTHER PLANNING EFFORTS
A CBD orientated exclusive bus lane for the Jeffries Freeway (I-96) is included in the SEMCOG 1990 Regional Transportation Plan. The plan recommends a network of intermediate level busways which will feed and supplement the proposed High Level rapid transit system, as well as provide for non-radial high speed trips. Grand River Avenue is one of the corridors selected for a High Level system. Prior to construction of such a system the busway system would carry commuters into the CBD. In addition to facilitating commuter trips to ·the CBD, the Jeffries busway is also viewed as a prototype for other area freeways which are similarly CBD orientated and likewise experiencing congestion.
Members of the Jeffries Technical Advisory Committee represent a broad spectrum of transit expertise. Aside from developing a specific Jeffries exclusive lane project, they, in their capacities as representatives of federal, state, local and regional agencies, will be monitoring and evaluating the performance of the lane with the possibility of recommending the exclusive lane concept for other freeway rights-or-way.
-5-

II. JEFFRIES FREEWAY
A. PHYSICAL CHARACTERISTICS
The Jeffries Freeway is a high speed-limited access highway which when completed will facilitate movement of cross regional traffic and provide direct access from the northwest area of Wayne County and Detroit, as well as from Southwest Oakland County, to Detroit's Central Business District. Construction of the freeway began in February, 1968. Since then, three linear segments, totaling 6.4 miles in length, have been completed and opened to the public. (See map II-A-1) The first segment was opened in July, 1971; it extends from a turning roadway configuration which funnels traffic to and from the Fisher and Lodge Freeways, northward to Wreford Avenue, a distance of 1. 7 miles. This freeway segment is basically four lanes wide in each direction, and includes an exit at Warren Avenue and the interchange with the Ford Freeway (I-94).
The second segment to Elmhurst is 2.9 miles long and has four lanes in each direction. Ingress and egress to this segment is possible ·at West Grand Boulevard/Tireman and Livernois/Grand River. This section of the Jeffries was opened to the public in December, 1972.
The third section of 1. 8 miles was opened in September, 1974 and extends from Elmhurst to Schaefer. There are 4 lanes in each direction from Elmhurst to a point approximately .6 miles westerly. At that point a "dualdual" portion begins. This "dual-dual" roadway will be approximately 5. 7 miles long and will consist of 4 three lane roadways. In the interim, until more of the "dual-dual" section is completed, traffic is required to use only the outer 3 lane roadways to the temporary freeway ending at Schaefer. The remaining 10 miles of I-96 will be an 8 lane divided freeway with the final sections to be completed by the fall of 1977.
B. TRAFFIC AND TRAVEL CHARACTERISTICS
1. Vehicle Occupancy Rate
During January and February, 1974, the Michigan Department of State Highways and Transportation conducted vehicle occupancy counts during the morning and afernoon peak traffic periods on the Jeffries freeway in the vicinity of Ivanhoe Avenue. (See Map II-A-1) Counts were also taken on the Ford and Lodge Freeways at Brush Street and Milwaukee Avenue, respectively. The Jeffries occupancy rates were computed prior to opening of the third segment.
The data gathered from these counts indicated that over 65 percent of all person trips made during the peak periods were in single occupant vehicles and only nine percent of the trips were in v·enicles with three or more persons. (The figures are the averages of occupancy rates found on the three
-6-

I
" I
.I ~
~ I I I
I I
a
ffi 1
COMPLETION DATE
SEPT. 1976
SEGMENT3. 1.8Mi.
JEFFRIES FREEWAY
;i~ CF
0 1
jim ....,..IIIIJIIIIIIIJ Mile
/
/ MAP 11-A-1
SEGMENT 2. 2.9 Mi.
' /
/
-----
I I
SEGMENT 1.
1.7Mi,
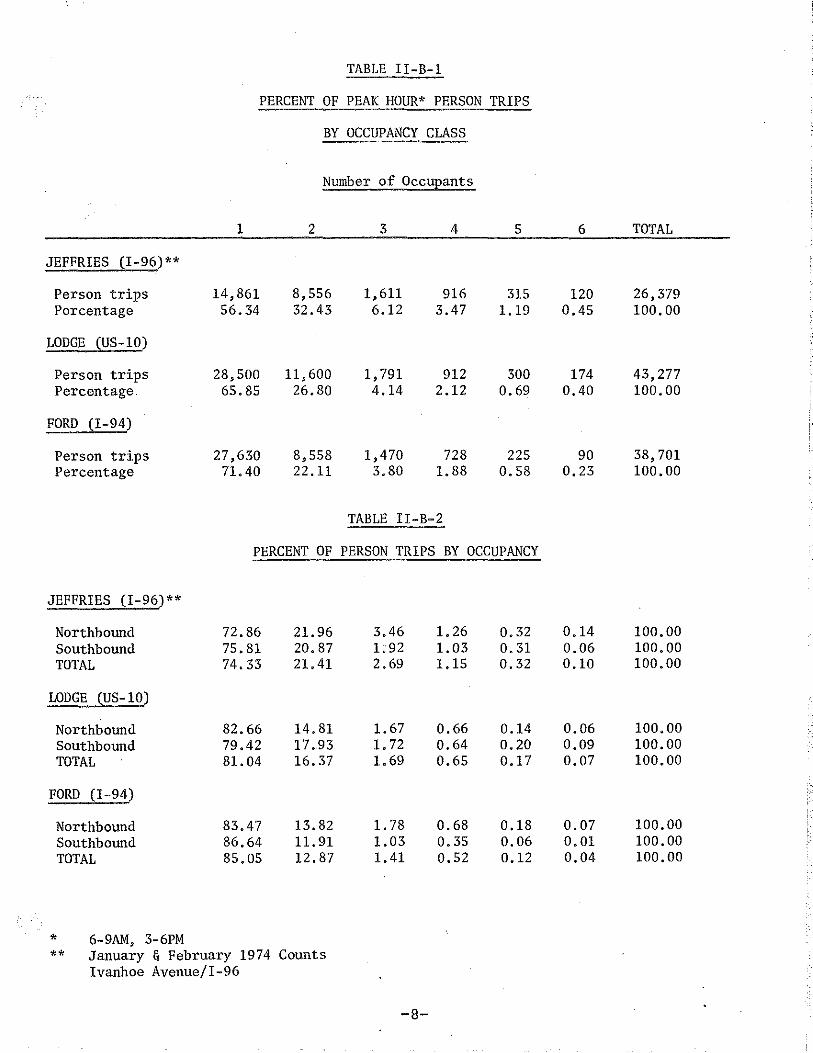
TABLE II-B-1
PERCENT OF PEAK HOUR* PERSON TRIPS
BY OCCUPANCY CLASS
Number of Occupants
1 2
JEFFRIES (I-96)**
Person trips 14,861 8,556 Percentage 56.34 32.43
LODGE (US-10)
Person trips 28,500 11,600 Percentage. 65.85 26.80
FORD (I-94)
Person trips 27,630 8,558 Percentage 71.40 22.11
PERCENT OF
JEFFRIES (I-96)**
Northbound 72.86 21.96 Southbound 75.81 20.87 TOTAL 74.33 21.41
LODGE (US-10)
Northbound 82.66 14.81 Southbound 79.42 17.93 TOTAL 81.04 16.37
FORD (I-94)
Northbound 83.47 13.82 Southbound 86.64 11.91 TOTAL 85.05 12.87
6-9AM, 3-6PM * ** January & February 1974 Counts
Ivanhoe Avenue/I-96
3 4 5
1,611 916 315 6.12 3.47 1.19
1,791 912 300 4.14 2.12 0.69
1,470 728 225 3.80 1.88 0.58
TABLE II-B-2
PERSON TRIPS BY OCCUPANCY
3.46 1. 26 0.32 1;92 1.03 0.31 2. 69 1.15 0.32
1.67 0.66 0.14 1.72 0.64 0.20 1.69 0.65 0.17
1. 78 0.68 0.18 1.03 0.35 0.06 1.41 0.52 0.12
-8-
6 TOTAL
120 26,379 0.45 100.00
174 43,277 0.40 100.00
90 38,701 0.23 100.00
0,14 100.00 0.06 100.00 0,10 100,00
0.06 100.00 0.09 100.00 0.07 100.00
0.07 100.00 0.01 100.00 0.04 100.00

freeways.) Figures dealing specifically with the Jeffries Freeway illustrate higher rates of vehicle occupancy: 56 percent of autos with single occupant, 32-percent of autos with two occupants; 11 percent with three or more occupants. Table II-B-1 illustrates the variations in freeway vehicle occupancy rates, which ranged from a high of 71 percent single on the Ford to the low of 56 single on the Jeffries. (All during peak periods)
Transforming this data into vehicle trips, over 80 percent of all peak hour vehicle trips on the three freeways were with a single occupant while 17 percent carried two persons and only 2.8 percent of the vehicle trips had three or more occupants. The Jeffries percentage (Table II~B-2) of vehicles by occupancy is of course higher; 74% single occupant, 21% carried two persons, and, 4.2% carried 3 or more persons. ·
Average vehicle occupancy for the three freeways is 1.23 persons per vehicle, The Jeffries exhibited the highest occupancy rate of 1,32 persons per vehicle, the Ford had the lowest, at 1,19 persons per vehicle, and the rate on the Lodge was found to be 1.23 persons per vehicle. These figures are somewhat higher than the average for all SMSA's in the United States, which is 1.17, and are also higher than the full Detroit rate of 1.16 persons per vehicle.
2, Travel Time
Travel time and delay studies by the Highway Department were conducted along the Jeffries corridor between Schoolcraft Avenue and Howard Street during the morning and afternoon peak traffic periods in March, 1974.
Two routes, one surface and the other partially utilizing the Jeffries route, were used to compare total travel and delay time. The surface route consisted of Grand River Avenue (I-96 BS) from Schoolcraft to Cass Avenue, and Cass Avenue to Howard Street. The partial freeway route consisted of: Grand River Avenue from Schoolcraft to the Jeffries (I-96) Freeway; Grand River to Cass; and Cass to Howard Street. The surface route was 7.9 miles in length while the partial freeway route was 8.6 miles long. Runs were made for both in-bound and out-bound trips.
Table II-B-3 illustrates the results of the study which show driving speed on the Jeffries (I-96) route. Overall speed increased from 19,2 mph on the surface route to 29.5 mph on the partial freeway route. Travel time decreased on the freeway route· by almost 30 percent from 25'17" to 17 145", for a time savings of 7'32". Travel time delay time showed a significant decrease of 68.5 percent from an average delay time of 7'43" on the surface route to 2'26" on the freeway route. Total stop time decreased 72 percent on the freeway route to an average of. l 1 35" per trip.
The major travel and delay time savings on the freeway route stems from the avoidance of traffic sigoals, surface railroad crossings and the queuing of vehicles at these locations on surface streets. Even though the freeway route is 0.7 mile longer, MDSHT found that it offered an opportunity for sizeable savings in travel and delay time, resulting in higher average speeds, and more reliable service.
lsource: Urban Transportation Fact Book, Part 11 Motor Vehicle Manufacturers Association of the U.S,, Inc.
-9-
' !'-:
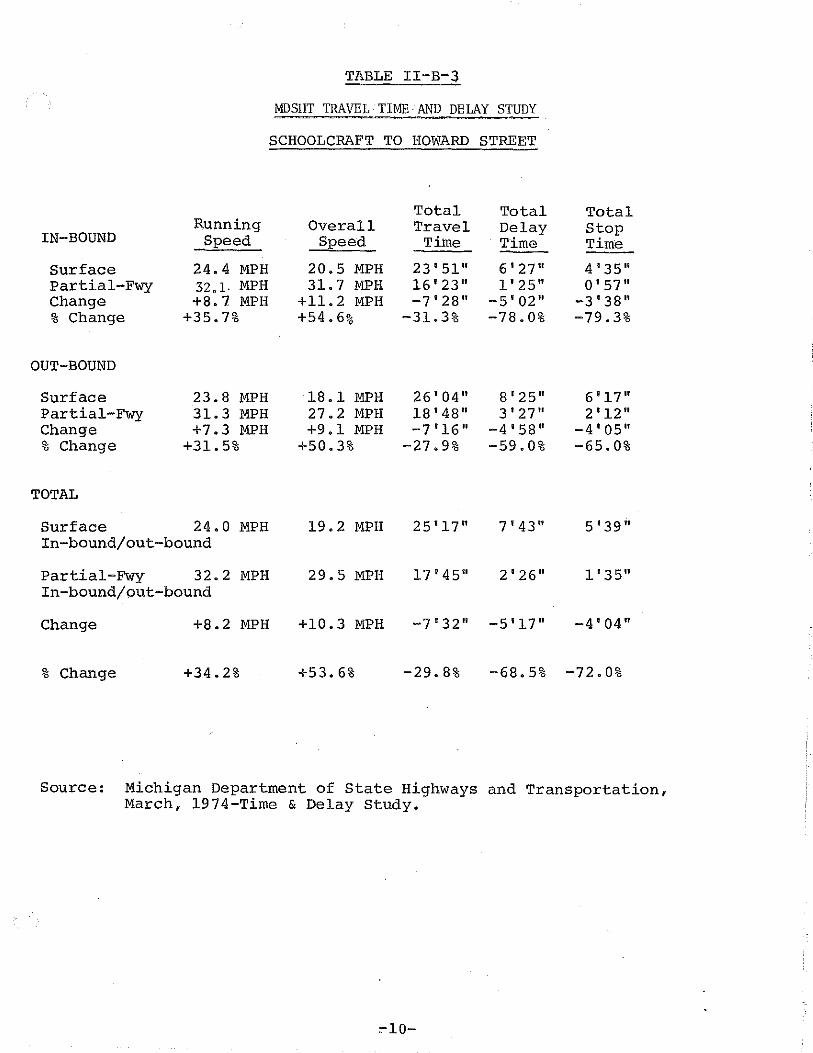
TABLE II-B-3
MDSHT TRAVEL TIME.· AND DELAY STUDY
SCHOOLCRAFT TO HOWARD STREET
Total Total Total Running Overall Travel Delay Stop
IN-BOUND Speed Speed Time Time Tim~
Surface 24.4 MPH 20.5 MPH 23'51" 6'27" 4'35" Partial-Fwy 32.1· MPH 31.7 MPH 16'23" 1'25" 0'57" Change +8. 7 MPH +11. 2 MPH -7'28" -5'02" -3'38" % Change +35.7% +54.6% -31.3% -78.0% -79.3%
OUT-BOUND
Surface 23.8 MPH 18.1 MPH 26'04" 8'25" 6'17" Partial-Fwy 31.3 MPH 27.2 MPH 18'48" 3'27" 2'12" Change +7.3 MPH +9.1 MPH -7'16" -4'58" -4'05" % Change +31. 5% +50.3% -27.9% -59.0% -65.0%
TOTAL
Surface 24.0 MPH 19.2 MPH 25'17" 7'43" 5'39" In-bound/out-bound
Partial-Fwy 32.2 MPH 29.5 MPH 17'45" 2'26" 1'35" In-bound/out-bound
Change +8.2 MPH +10.3 MPH -7'32" -5'17" -4'04"
% Change +34.2% +53.6% -29.8% -68.5% -72.0%
Source: Michigan Department of State Highways and Transportation, March, 1974-Time & Delay Study.
:-10-

The use of the curb lane on Grand River for the time and delay study offered some question as to the relevancy of data to actual day to day operation of transit vehicles. Buses are not restricted to the curb lane. During times of traffic congestion bus drivers do in fact operate in other lanes to avoid queuing of vehicles. By elim'inating the stipulation that vehicles operate only in curb lane, the Street and Traffic Division of D-DOT arrived at the following time and delays for the corridor alternatives:
Time of S1:t!dY
0730 0745 0800
TABLE II-B-4
D-DOT IN-BOUND TRAVEL TIME AND DELAY STUDY - MARCH, 1975
SCHOOLCRAFT TO HOWARD STREET
1. Grand River/Schaefer to Grand Blvd. via Jeffries
6 115" 8 I 2511
7'31"
Route
.2. Grand River & Schaefer to Grand Blvd. via Grand River
8 1 55" 8 I 5311
8'5311
3, Grand Blvd to Third and Fort Street via Jeffries, then Grand River
8 1 1511
8 1 07" 8 1 07"
The D-DOT maintains that with the current rate of traffic on surface and freeway routes, routing of buses on the freeway does not offer an applicable savings in time for transit commuters. A basic problem in the reserved lane designation on the Jeffreis Freeway is its termination at the I-75/I-96 interchange. The funnelling of CBD bound vehicles into two lanes creates a bottleneck which causes substantial delays for commuters. Preferential bus treatment at this point would greatly enhance the attractiveness of the freeway route over the current (and temporary) faster surface route.
3. Traffic Volume
Traffic volume over the freeway has been steadily increasing since the opening of the first segment of I-96. Though the Michigan Department of State Highways and Transportation (MDSH&T) estimates that the Jeffries will not attain level D conditions (1,800 vehicles per hour per lane) until 1990, all day (24 hour) counts taken at Ivanhoe Street indicate that conditions currently exist for peak hour congestion. Tables II-B-5, II-B-6 and II-B-7 list 24 hour counts taken at Station 9920 (Ivanhoe) during November. 1974. Maximum daily volume for the month was attained on Thursday, November 14, when 90,759 vehicles passed the count point. Maximum one hour volume was established for inbound traffic between 0700 and 0800 on November 20, with 6,701 vehicles passing, and for outbound traffic with 5,782 vehicles passing the count point on November 13, between 1600 and 1700.
-11-

~~"''' ,,
M!CHIGA~ STATE HIGHWAY OEPA~T~ENT Table II-B-5 I-96 Detroit
STATION YE:Aq MONTH North B_ound Volume At Iva!'hqe 9910 74 ! I
!A~ 2A~ 3A• 4AM SAM 6A~ . 7AM SAM 9AH lOAM !!AM !2AM !PM 2PM 3PM 4p~ ~PM 6PM 7PM. 8PM 9PM !OPM 1!PM !2PH TOH~
1 6 112~ 654 50ry 26!. 2!7 3A8 893 !357 1362 1oB9 u7s !452 !595 !6o2 2001 32~9 4j42 3842 t999 t5!4 !279 !!86 !?47 :•so 3srot 2 7 !456 !o9! 9:?] 532 357 3o~ 555 763 Mo 877 !004 13!5 !539 t6o7 !67 3 ~272 !075 t7So !6 02 !338 1227 1009 1213 !332 2e~p 3 l !266 799 816 5t9 330 • 2?4 32? 395- 4?8 53o 739 039 95! !276 14!8 !5 nB 1A9-R !17R 1?.58 !!94 10!7 9 38 962 884 2t7o9 4 2 5n 323 2"1 ! 59 !57. 3j5 852 !240 ! >77 toto 11!6 137j !432 !556 t9oo l298 4!64 38!4 tR•B !229 !!20 976 ~39 !005 31 ·~~ 5 3 tn36 6<;4 430 t97 !65 206 76 3 !268 136! 968 no !239 ! 37! 15!! !95~ 333! 3A39 3449 t72o !27 0 1036 1 o92 !o!9 t!OO 3t9e9 6 4 1 o54 oos 5t4 ?I 7. 2o3 3;1 B4t !345 1349 1 oo7 1 o•s 1237 1422 !49 0 19 2! 3350 ·~36 3R6n 1sso !248 !!99 ·1232 1?38 I !8 0 3 .. 30 7 5 95t 6z6 5R7 ns t87 3ntJ 89 3 133! 1332 1013 !025 !3! 0 !45! !562 ! 997 l3o8 4453 384; 2oe• t396 1256 !!66 I o76 1205 34592 8 6 ItS 0 7t;; 5~ 3 255 209 347 86 0 !364 !349 1!21 1227 1435 j6 36 ! 59t 2o• 8 3358 4~8 2 JA8t 2076 j576 '!285 !!68 !?47 !456 36'i56
·g 7 !4o7 992 8~! 488 314 3;6 552 7 02 8?0 9 o7 1002 1!72 !524 !639 !626 t975 j967 t865 !644 [427 !274 1 oro 1!05 !247 270 65 I 0 '1 ! orr 709 855 543 332 228 29 0 4!3 4!8- 57! 7 4 t 8 35 !023 1357 j487 t 6 ~ 3 !484 jlA l D86 !343 12!5 !121 IOO~ 1001 22537 11 2 64o 342 3t4 21! j6 0 3n8 7 23 1 !14 12'5 ! 0 !5 1 oo7 !5 o7 1454 I 39 o 1756 ?9?4 3'i64 32 04 !67 2 ! 222 1!28 977 1114 951 297!2 12 3 !o55 666 439 ~00 t66 296 774 !29! ns6 984 932 ! 2 6! !397 !518 199! 3393 3909 3'i!5 1754 1293 1055 !II 0 lo35 !!20 32562 !3 4 1269 73¢ 6?? 257 236 3Q3 I 01! t63o !6?8 !2 <)4 !3!6 !50! 17 22 ! 8 0! 235 2 4!44 578 2 48t5 2292 j5t5 !458 !5\4 j499 I 44 3 • 2 , 38 !4 5 !402 868 7 nS 388 56o 1500 3029 4316 4212 2642 2251 28!2 29 !3 9 01 sse !0!3 132! 4Q56 3286 2249 !886 2001 !156 ! 9 44 ~8653 ,s 6 !)4? 8j6 6~ ~ ,o 2 236 39 4 987 !596 15~6 '29 4 !412 !66 3 19 00 ! 8 30. 2488 41! 7 578! 48 !7 2495 j8 42 !478 !348 !!!47 j7.t4 43'\5! j6 7 t6!5 \114 I On3 546 345 JoT_ 6t? 78! 013 !004 !!17 ! 3! 2 \f! 7 jB51 j8 4 3 ?.26! 2235 2!2n jR7j ! 6 ~3 1433 I 2 04 ! ?9 0 !4!5 3!562 !7 l I o66 774. 84~ 5 34 325 2?2 28 I 4 02 a 04 555 7 23 8t7 I 004 1335 !467 t629 146~ n67 !375 !328 1203 uoa 996 9>o 22~ 13 ,s 2 6j7 332 3n? ?.nl !55 29 6 7 00 1 o7 a I? 9 0 91lj 97 3 1459 1433 !34 I j697 ?.8!3 34 20 3077 !6 I 2 !184 1 o9 3 944 789 9t7 2$654
" j9 3 -1 o29 648 4 ,. j9 2 j6 0 29' 757 ! 26! !351 962 9! 7 1233 136 0 ! 5 Ol ! 9 4 3 ~3j8 3~25. 3430 11 o6 !259 1028 1 oer lo13 I 09 I 3!789 J .2 0 4 to65 6!o 5 16 ~17 201 310 846 1362 130 I 0 !6 11 o6 !246 !436 15 o3 )952 ;452 4Aj5 3995 jA84 ! 26 2 1210 !248_ !251 j!QS 35 ~131
2! :1 1103 699 554 298 427 11~8 2312 3zBs 32!5 2 o38 175 0 ,22!8 229 0 7 09 457 866 !155 320~ 2562 17 as !479 !56 3 j378 ! 5 25 3~ o2 I 22 6 jj97 7 •1 6 o6 ?6 4 2!5 36 Q 89A 1424 t• oB !!67 128 0 1lfg9 17 n7 !6 6! 2!9 2 ;5 02 476 7 4 o• <; 2!65 16 45 134! 12!9 1'00 !51'1 35 ! 21 23 7 t47R I o 17 9!7 q9 8 3·5 3?6 56 1 7j9 R 39 92o !024 ! 2 o4 15 6 I !69 1 j68! 2 072 2 n39 j929 17 o5 t456 1299 1097 !177 12R7 288 n7 ' . 24 1 1162 Boa 9 ;>I 585 355 242 3 o9 443 447 6 12 798. 899 1!03 !465 !6 06 ! 77 3 !6 02 14 9 0 t•98 !449 !3!2 1211 1 nA 4 1 oa o 24294 25 2 66o 35 2 3?2 2!6 162 318 744 I 15 3 1331 I o5 0 1 o4 2 ! 56 1 !5 37 !4 4! !812 'l 002 365 3 32R7 j7?7 ! 26 3 1 !'66 lOll ~ 38 9$4 3 0~ 32 26 3 1 o7 o· 67~ 4~1 ! 9~ j65 3oo 78 4 !3!ry 14 o6 997 946 1278 j4j7 156 2 2023 345! 30.76 3';7<; t779 1l!2 1067 !!27 I o5 I !135 33n44 27 4 11 6a 667 565 ?.36 218 )<;9 9 26 !497 j496 !112 1209 !365 t577 j648 2!48 38 z7 5354 44 39 2ore p86 !329 !37 3 1375 ! 3!5 3~667 28 5 r75~ 1185 9?3 559 4 38 56 3 tn79 14 7 0 16" 7 ! 615 !5 23 24~8 2134 ! 964 2!74 ~79j 29!3 2824 235R (!3S1 !954 !845 !9 06 t87 0 4 23 26 29 6 1162 727 5;6 258 210 35 3 88 3 14 o5 !JAB !!53 1264 1476 t685 !6 37 2 !6 2 ')474 4757 4 018 214! 162 I !3!8 1 j99 1::-8 2 !5 00 37~~9 Jo 7 1548 1 oB6 969 533 341 353 6os 765 R95 99 0 to97 !28 2 ! 67 4 !8 02 1788 2!76 2t67 2049 tB o8 t562 1397 1175 "58 !37 0 3069 0
AVE, NO, ave:. NO·, AVE; NO, NO, TOTAL PCT, · PCT, SUN, su~ ~EE~. W~DAYS SAT, SAT, AQT OAVS TRAffiC GAIN LOS.S
74 22688 4 35995 2! 29527 5 33170 30 994288
MA~!MUM OAY MAXIMUM MOUR vnLUME DAY OATE VOLU"E HOUR DAY OATE
48653 T~UR 14 57;82 SPM wto 13

' Table II-B- 6 '" I-96 Detroit
MICHIGA~ STATE HIGHWAY OEP.ARTMENT South Bound Volume At Ivanhoe STATION YEAR MO~TH
/ 9920 74 11 /
1A~. 2AM 3AM 4AM SAM 6AH . TAM 8AM 9AH lOAM !!AM 12AM !PM 2PM 3PM APM SPM 6PM 7PM 8PM 9PM 10PM iiPM 12PM TOT/.1,.
1 6 559 343 296 t8 3 377 1222 2524 s 3 o9 4a77 t 964 t63z !635 j666 j687 2207 2355 2t56 j86t !746 t6T4 !26 0 1235 1j67 1!29 Ao~~~ 2 7. 857 684 6•4 At9 345 6So· to94 1376 1278 !379 !522 t6 !6 t61B · t6o5 t97 4 2159 1669 t56 3 j595 t554 !293 tM6 !166 11 <;9 30''? 3 I 76 0 641 736 ,,e 303 242 526 593 5!9 848 !308 !Hz !6~9 !3o9 ! 36 3 1 3.~9 1766. t'i36 !3 !A !102 765 617 913 19~ 2iH I 4 2 375 . 212 223 -16 0 296 11o6 2 a67 s2ea 4444 1974 149 3 t55 0 t577 17 ~5 2028 233! zn7 3 ! 739 !386 \!16 773 856 A74 7! t 31->•n 5 3 5O! z7o 200 t55 3!4 1!;5 213! 4320 36t9 !949 !4 oa !5 02 !533 j645 2138 2255 2n3! t774 j562 t223 828 923 672 757 3'50•)'; 6 4 . .479 2~9 2o7 1 ~ 0 31 o· tns 24•t 5242 4a?9 t932 1436 15 !2 t593 !6 7 3 2 o9s 2157 2o29 t794 17 o<i t'382 69t 856 9:15 785 31' •H\ 3 7 5 548 32! 255 j';5 296 1 t;7 2394 5129 4674 2o64 !525 !446 t525 !695 2! !9 ?.24 0 2o46 t868 t676 t289 9So 1026 994 88t 35 ~-) a 6 549 371 279 !65 .3o6 11~7 2414 s216 4739 2 o8 3 t589 !59 0 17!2 !8 7 4 2207 2306 2!0! t8<; 3 !746 t6!2 128 0 1!73 .1!20 !1 10 4n~•~ 9 7 779 574 5H ;58 367 4~3 tn6! 1?83 !?'l 0 14 40 !5 38 1525 t654 t679. \887 t869 !767 t65t 16 38 t566 124! !160 1120 1089 24''1
to I 8Jo 6o9 67? 458 3t 3 282 549 627 an 898 !322 !243 ! 135 ! 36 3 16 19 t645 !4 3~ j54'; !574 1335 1035 9q ~89 84~. ',ft'\''3 11 2 G5 0 2•o 2';'l !50 266 toao zo91 a 2a9 36!0 t82o 1405 1475 1526 1677 !972 2113 10 ~~ 1573 !368 1094 B22 784 •oo 723 3 '·l '" i 12 3 47 3 25 3 I~ 7 j45 <95 !QH ?016 4 0s6 34?2 \84 3 !333 1421 j449 !556 2023 H34 1Q2t 1678- !47~ !!57 78 2 873 ~25 . 716 31\4(\ !3 4 5!4 310 2?4 !72 336 !?o" 2559 5452 46::>4 2o•5 !5 34 t6t7 11 os t702 2237 229 4 2t64 !9 3 0 !A 4j t484 96 0 915 90 0 843 3-J r 1 n !4 5 589 36\ 3!~ ns 4!3 !5?2 292o 544! 5100 2364 !7 22 ji 6! 2 nos 12!0 2 t65 2266 !79 4 2035 t97 0 1571 ! o55. !211 1 n82 1006 4 ,, t oe. 15 6 6?o 4t7 312 t85 344 !3;3 2695 5771 5? ;7 233! t788 17 89 t9 z9 2!07 2476 ?587 2;59 2 0~ 3 j067 1 e t4 !4 4 1 t322 !?63 ! 25 0 ·~·~n 16 7 9oo 662 69 1 411 4?4 5?2 !216 !473 1440 16 6z 178 n t7 64 19 18 1044 2:<4 HA4 2 oS; j9j ~ j898 18 o8 !429 J338 ~ ?94 125~ )(1 I ·16 17 ! 671 637 7 o2 ae o 3::>6 ;>0 3 576 659 si3 942 !39 2 1> 09 \ j9 0 !43! j699 t73o IS 0~ t62A !662 t 4 0 I , oe 6 HT 934 092 '@" ol.~ 18 2 463 2?S 2'l4 tS 2 272 !oR! V39 46 nB 39 25 t9 22 !465 !529 t583 j745 2073 2210 j99R j6 34 !4 n6 "!123 8 37 8os ~ 32 74! 3 ;\ \ ·~ '1 j9 3 649 4 03 2° I t79 4oo !412 2975 6399 5351 2575 t9! 0 !95 o 2ors 2247 2639 ; or 3 3o!! 239! 1977 t618 1 Q7j 1!7 0 1 o9 2 I G~ 0 Q 7 Q 'll'. 20 4 62° 39! 200 19 '- 39 3 t4';ll ?.944 67 D! 5695 25 n6 t8 4 2 196 0 2061 2220 27 08 2eo8 2725 2 I 9 4 2o84 t647 1 o9 o 11 oS 1175 g?7 <70j3 21 s 7 21 385 317 t96 4!0 14!0 2924 6 34 3 5937 2552 185 0 t8 8 2 2004 2 o87 2655 Hoo 279! 2364 2\0I t66! !24 0 124 0 1?62 I oTS Q f\ ~,. i' 22 6 . s7 • 376 2' 3 t65 31! 1t7o 2•7o 5955 5?32 2197. t714 ! 7 04 18 o5 19 4 7 2306 26 oB 2'l 1 4 2 Q47 j797 t745 137 3 !225 \j68 !13A Q l ~ ,,4 23 7 87~ 9 02 a ;ry 530 42o To 2 138 7 16!4 ! A 'l! t788 199 6 2 o7 3 2173 2os o 24 2A ~5?o 2337 ~22 n ?!?.9 ?. oss 0' 15-1 fl ~=;~8 : •22 'h~ ~r! 20 1 12! 3 94j \ 0?? AJ2 G68 3Q7 Ho 8 32 A'l9 II~ 4 j849 1975 2 012 19 4 5 21 rr 23nt 2o76 213~ 224·2 t7 oJ !345 j 29 7 ?Tt . ~I 4 11'. 0 25 2 46 2 296 2'\7 !5 L 27 2 ton 2t9o 449 3 3•?5 19 04 j46 3 !529 1585 !142 2 o54 2201 j99 3 !6 37 1414 !132 847 e o9 A3! 749 3 ~ •J (\? 26 3 433 2'~4 t•• u• 265 !Q,~q 2t53 4. 02 3975 t8 46 t32o !344 !4 3! !552 187 2 219 4 2t42 t68t nso 11!6 732 8t2 71l6 7?.6 34 0~6 21 4 633 398 ?'7 no 4 r5 !415 2976 6542 57t1 26 o7 j9 52 2 tee 2 t7 3 2399 278s 30!3 27 !3 2228 10B 3 t7 02 1246 !251 !?52 109. • 9 t t6 28 5 to14 . 6!2 563 4 o2 279 4B9· 1276 26 o3 284 l t745" !28 3 j79 6 t84 0 1779 2154 2212 21 os t787 t778 1821 pso·t349 t• n5 !2 14 3'\ 110 29 f t3 34o ?<9 tAT 3t4 1112 2524 6~46 <;? <;8 22A5 1716 1737 1 8o2 !894 2266 ?.69 1 2'\72 2020 ! 763 1849 1496 ·1268 1188 !10\ • 4 I I 1 Jo 6t 779 ,s 456 364 69(j 1229 !44 1 1463 t579 1rs4 ! 8t5 19 os 1826 2!36 22t8 2o46 t952 j8$ 0 t8 38 1482.!376 t364 1259 3022
AVE •. No. AVE'.----- No-.- A VEe NO, No. TOTAL F'_C_T "• PCT, SUN• SUN wEEK WKDAYS SAT, SAT, ACT DAYS T~AfF! C QAIN LOSS
74 26!59 4 M2!8 21 335?5 5 37253 -30 11!6848
MA~H!UM DAY MAXIMUM HOU~ vOLUME DAY DATE VOLU>J.E HOUR DAY OATE
49116 WEO 27 6701 8AH 1ttt:O 20
··:- '·· ··- ·,

M!CH!GAN STAiE HIGHWAY DEPA~TMENT Tab l.e ll-B-7 I-96 Detroit
STATION YEAR MONTH N-S Bd. Total Volume At Ivanhoe 9929 74 II .:-·- ·:~- ··:.. ~
lAM 2AM JA~ 4A~ SAM 6a" 7AM SAM 9AM lOAM 11AM !2AM · !PM 2PM 3PM ~PM 5PM 6PM 7PM 6PM 9PM 10PH 11PM !2PH TOHL
1 6 j66 3 997 888 444. 594 1so 0 34 t7 6666 5839 3o5J 281o Jo67 326t 3489 •zoe 'j 6 24 6296 57o3 3745 )!58 2559 242! 24!4 2609 76567 2 7 23!3 t775 tSS7 95! 7 o2 954 !649 2t39 2t68 2256 2526 2931 3217 34!2 3647 443! 3644 332?. 3!97 zB92 2520 2077 2379 249! 59!50 3 I 2n26 j44 0 t57? 947 6)3 466 848 988. 947 !378 2o47 23!! 2640 2585 2761 2BQ7 3t66 2';14 25_72 2296 !78 2 !8!5 jA75 t 67 4 44200 4 2 974 595 S o4 3!9 453 I 5!! 3319 6528 SA?.! 2994 2609 2921 3oo9 33o 1 3928 9629 6?31 5553 3?34 2345 j893 1832 17 t 3 t1t~ 689 28 5 3 !5 37 9z4 6~o 352 479 !41! 2A94 5588 49R 0 2917 2328 27 4! z9 o4 3!56 4092 'i586 5A7n 5223 328 2 2493 !864 20!5 t•9! t857 6T034 6 4 !533 897 7?t ;77. 5t3 !466 3:?8 2 6587 5778 ?.9 39 2534 2749 30!5 3163 4016 ~5o7 6665 5654 3559 ?.630 2o9o 209 0 2 t 6 3 1965 it 89 3 7 5 t499 9A7 842 J9n 48 3 !4;7 3287 6 460 6oo6 3o77 255n 2756 2976 3257 4!16 5548 ~499 5711 3765 2685 2206 2!92 2o7o ?.086 7;B45 ~
8 6 j699 1 ()8 3. 8~2 420 515 !534 3274 65Bo 6 088 32ry4 28!6 3025 3348 3465 4305 5664 6683 5734 3822 3!88 2565 2341 2;67 2566 77!48 9 7 2186 t556 t478 Aq6 68t 7A 3 16!3 1985 2or o 2347 254o 2697 3t7B 3318 35!3 ;844 3734 35t6 3?.82 ~99 3 25!5 2230 2265 2336 575l6
10 ~l t9n7 1398 j527 l~o! 645 5tn 839 1040 9j(} !469 2o63 2078 21 s 8 2720 3106 J2•A 292ry 292~ 296o 2678 225o 2062 jA93 ! 847 4,;!95 II 2 I o9 n 632 569 ;6 1 428 \348 2At4 5363 4A95 28 35 2412 298 2 3nto 3 ry67 3728 5 037 547 0 4777 3040 23!6 !95 0 176! I~ 14 t674 6 317 3 !2 3 !52~ 919 6?6 345 46j 1372 279 n 5 377 4An8 ,a 21 2265 268 2 2846 3o9 4 4 014 ~5 2 7 5A3o 519; 3232 245 0 !8 37 j98 3 IA6 0 1.13 36 65 7 QZ 13 4 j78 3 1044 846 429 572 t 6 n I 357 0 7o82 6?52 3249 285o 31!.8 3427 359 3 4589 ~436 7946 6745 4133 2999 2418 2429 2489 228 6 81888 !4 5 j9 91 !249 !023 613 973 3n8 2 5949 97~7 93!2 5 on6 397 3 457 3 49j8 2 II! 27 23 3279 ; 1 ! ; 6 o9 I 5258 38 20 294 3 3212 2838 295 0 9 0159 !5 6 1969 !233 99, 477 sao 17,7 368 2 7 ;67 6An3 36 25 3200 3452 38 29 39 46 4964 6 7 n4 8t40 69 on 4462 ;656 29! 9 267 0 2710 2o 5o 88~71 t6 7 25!5 ! 776 169" 9 ;7 769 879 18 28 2254 23';3 2666 2897 3n7 6 J6J5 3795 4n27 4425 4288 4 o3~ 3769 34 II 2862 2542 2';8 4 2668 657 08 17 I j9 37 14 II . !54 4 I nt4 65! 5t5 857 I o6! 9j7 !497 2!15 2!26 2,94 2766 ;j66 ;359 2or a 2295 lo37 2729 2289 2o95 t• 30 1~82 47 r,61 t8 2 tnfl n 677 556 35 3 4,7 1 37 7. ?.9 39 5686 5,65 29 03 2438 2988 30!6 3ry86 377 0 <;023 54 jA .r II 30!8 '3o7 19 30 !749 1 <?I !658 f 3~ 46 j9 3 16 78 ! o5! 7t5 ,, 1 56 0 t7 ?4 37 32 766 0 67 02 35 37 26 27 3J8J 3435 375 0 455 2 ~ 39! 68 36 5A2! 3683 2577 2o99 2257 21 o5 215 i 797 27 20 4 ! 6 9. tOOl Bta 4n9 59 4 j7 6 4 379 0 a 063 7 0-;a 35?.2 29 48 l2o6 3497 37 ?3 466 0 ~ 35 0 7540 6 !A~ 39<8 29 o9 2300 2353 2426 7222 8 2996
I 2! ·s jA 24 1 0a• 89! 49 4 a 3r ?598 5236 96 28 9152 459 0 36 00 4!oo 429 4 2796 3!12 J966 3946 5566 4663 34 o9 27!9 28 Ol 264 0 ?6 00 56548 ,.. 22 6 177! I !17 f3~~;9 4 29 526 !5' 0 3 368 7]79 6640 3 364 299 4 32n3 3512 J6 0a 4498 Hto 1 ,a 1 ~ o9 2 J9 62 J39 0 21u 24~4 24~8 2656 B\945 ..
! 23 7 23"5 I" t9 19 t74? !n?R 735 !! t' j94 3 2333 249 0 27 o8 Jo2o 3277 37 34 377! 4199 • 59 2 4 31 1 4 !49 3A 34 )544 3ooo 2667 27 )5 ,r 0 9 67(;7-e; 24 I 2375 !789 ! 9 43 12!7 6 23 6 ~9 I n79 1275 I I o6 j776 2647 2874 3 !15 3410 I~ '_17 'l ,. 7' .)f; 7'5 ~r .on 1!52 2657 25 oa 2355 2294 5793A 25 2 1122 6 48 579 367 434 t39 I 29 34 5646 5 1s6 ?95 4 ;:5 05 3n9 0 3! 22 318 3 ::06~ '52o3 '-5f.46 49 24 3 I 4 1 z395'-2o!3- \E2o l6ii9 1 r 3 3 6:;5Q! 26 3 1so:r 9 )8 6'n l\2 43o 13 o9 29 37 6tt2 538! 2843 2266 26(2 2~4B ltt• J89 5 <;645 6 II R 5 2o6 3t29 2426 1799 j9)9 j797 I B6! 67 :! 2 27 4 !R 0! to6S A 52 456 623 179 4 39 02 8 039 7 2 n7 3719 3!6! 3473 375 0 4 o•7 49 36 66 4 0 a 067 6667 4 o6 1 ;o88 257s 26 24 2627 2e o9 8778 3 29 5 2766 t797 1ttAA 961 7 !7 I ~o; 2 2355 4..,73 4'3?8 3 35 c 28 06 4224 J97 4 37 4 3 432A t5co3 5o21 46!1 4! 36 42o2 3334 319 4 3311 3 c·'34 7~ ~56 29 6 t775 I n67 865 4?5 5?4 15?5
'" 0
7 7 45 1 6646 34!8 298 0 3213 3487 353! 4428 6!65 7 J29 6 o3A J9 o4 3470 28!4 2467 247 0 26 01 8 2 000
Jo 7 23o9 t865 1Mi 989 7 05 I043 j834 22o6 2J~8 2569 285! 3 o97 3579 36 28 39 24 4 39 4 4?!3 4 001 3688 34oo 28"79 255 I 2'22 ?62o 65 012
AvE~ NO, AVE• NO, AVE," NO, NO, TOTAL PCT. P-CT, SUN 9 SUN l!EEK · WKOAYS. SAT. SAT, ADT DAYS TRAFFIC GAIN LOSS
74 48847 4 H2t3. 21 63052 5 7o423. 3o 2111!36
MAXIMUM DAY MAXIMUM ~OUR VOLU"E DAY DATE VOLUME HOUR OAY DATE
90759 THUR !4 9757 8AM THUR !4

The opening of the next segment, scheduled for the fall of 1976, which will extend I-96 to the Southfield Freeway (M-39), will assure an increasing growth in vehicular traffic on the Jeffries.
C, FREEWAY CONSTRUCTION SCHEDULE
The Michigan Department of State Highways and Transportation estimates that the next extension of I-96 to be opened to the public will be the portion from Schaefer, west to Southfield (M-39), projected for September, 1976.
Remaining segments are not scheduled to be completed in sequential order. However the final section, which will allow direct access from I-275 to the Detroit CBD, is scheduled for completion in the Fall of 1977. This segment is the portion of I-96 extending west from Southfield (M-39) to Evergreen Road.
A complete construction schedule for the Jeffries Freeway Project is included in Appendix D. ;
-15-

III - CHARACTERISTICS OF TRANSIT SYSTEM AND SERVICE AREA
A, GEOGRAPHIC AND SOCIAL DESCRIPTION OF THE SERVICE AREA
Detroit is the economic and geographical center of the seven county southeast Michigan region. As a result of being a port as well as a gateway to Canada, a substantial international movement of freight and passengers is funnelled into and through the Southeast Michigan region.
The existing transportation systems (transit and highway) are a product of regional growth and the international trade centered in the city and its CBD. The primary freeways in the metropolitan Detroit area are: The Ford Freeway (I-94), which extends through Detroit in a northeast to south-west crosstown direction; the Lodge Freeway (US-10) which extends from the northwest suburbs to Detroit's CBD; and I-75, which extends down the Ohio border in Monroe County through Detroit and continues northward to the northern boundary of Oakland County. (The portion of I-75 from the northeast corner of the CBD to the southern border of Wayne County is called the Fisher Freeway, while the portion extending northward from the CBD through Detroit and Oakland County is referred to as the Chrysler Freeway. The Chrysler Freeway also includes I-375, a one mile link which forms the eastern border of the CBD and terminates at Jefferson Avenue).
The freeway network is supported by a standard mile grid arterial road system superimposed upon the seven major arterial streets ~1hich radiate outward from the CBD. The major arterials are: East Jefferson, radiating eastward, parallel to the Detroit River shoreline; Gratiot (US-25) radiating in a northeasterly direction; Woodward, (M-1) bisecting the Detroit metropolitan area; Grand River (I-96 BS) radiating in a northwesterly direction; Michigan Avenue (US-12), radiating westward from the Detroit CBD; Fort Street (M-85), heading in a south-southwest direction; and West Jefferson, radiating southward, parallel to the Detroit River shoreline.
This extensive roadway system is being extended by the Jeffries Freeway. The Jeffries extends from just west of the Detroit CBD (at the foot of the Ambassador Bridge, and the juncture of I-75) northward to Grand River Avenue, then parallel to Grand River until Livernois Avenue, where it will ultimately extend west, beyond the Detroit City Limits, ultimately intersecting I-275 (See Map III-A-1).
The primary service area for the express buses which will use this facility is also indicated on Map III-A-1. Its approximate description is the area bounded by Livernois on the east, Tireman Road on the south, Haggerty Road on the west and I-96 to the north. Additional park and ride transit riders are anticipated from areas external to .the primary service area, especially the areas to the west and north where transit service is presently not available.
-16-

THE EXISTING SOUTHEASTERN MICHIGAN FREEWAY NETWORK BY COUNTY
ST. CLAIR CO.
AND THE CITY OF DETROIT
OAKLAND CO.
LIVINGSTON CO. -""• - --
MONROE CO.
-
MILES ~
.02"46810
JEFFRIES PRIMARY:-:·:·:·:·:·:':':':':;:;:;: SERVICE AREA :;:;:;:;:;:;:;:;;;:;;:;:;:
FISHER
MAP iii-A-1
-----·-
FORD
MACOMB CO.
JEFFERSON
asemTa

The Jeffries' service area includes the northwest portion of Detroit, the north central portion of outer Wayne County (essentially the municipalities of Livonia, Redford, and Redford Township) and the south central portion of Oakland County (including portions of the cities of Farmington, Farmington Hills, Oak Park, and Southfield). The 1970 census popula1ion of the primary service area is presented by county and band area in Table III-A-1.
To relate socio-economic characteristics of the area population by a more discrete delineation, north-south bands approximately two to three miles wide were established. (see Map III-A-2). The north and central Detroit portions are primarily medium density residential with heavy strip connnercial land use on the property adjacent to the mile grid road network. The southern third of the entire service area has a relatively greater reliance on industrial land uses. The outer Wayne County area is primarily medium to low density single family residential, with moderate strip connnercial land usage on the mile grid roads. There are also pockets of industrial usage scattered in this area. It is in this area westward of the city limits that the transition from urban to suburban to semi-rural is found. This is the only portion of the Jeffries service area with large tracts of land presently unused.
Oakland County lies north of both Detroit and the western section of Wayne County. The county consists primarily of low density residential dwellings, with only slight industrial land usage. However, there has been increasing development of both high and low rise office buildings and consequently land in this area now ranks among the most valuable in the region. Further to the north, in Oakland County finds a greater incidence of strip connnercial land use and shopping centers. Northland (located in Southfield and at one time the world's largest mall) and the Livonia Mall (located in outer Wayne County) are examples of major shopping centers within the Jeffries service area; many smaller centers exist, too.
The service area is populated by families with above average incomes. Four to six census tracts were selected from each band in such a way as to insure that all areas within the subdivision were adequately represented. This analysis indicated that the 1970 mean average family· income was in excess of fifteen thousand dollars ($15,000), with higher family incomes found in the northern and western suburban areas, and lower incomes found within the City of Detroit.
The average Oakland County service area family earned in excess of twenty-one thousand dollars ($21,000) in 1970. It was found that for the Wayne County portion (including Detroit), family incomes increased from a low of less than twelve thousand dollars ($12,000) to high of nearly eighteen thousand dollars ($18, 000).
-18-

I 1-' 1.0 I
JEFFRIES FREEWAY SERVICE AREA BY BAND AREA AND MUNICIPALITY '·
1:125,000
' 2 1 ()
PRIMARY SERVICE AREA iii& I 1!1
BANDAREAN0-1-7 __,......,..
------ --
MAP 111-A-2 asemTa ' ,---

---.,,
'·: ,. TABLE III~A-1
1970 CENSUS POPULATION WITHIN THE JEFFRIES FREEWAY SERVICE AREA
BY
BAND AND JURISDICTION
-20-
--- ---------- --------------~-- ------------ ---~- -- ---- -----r?
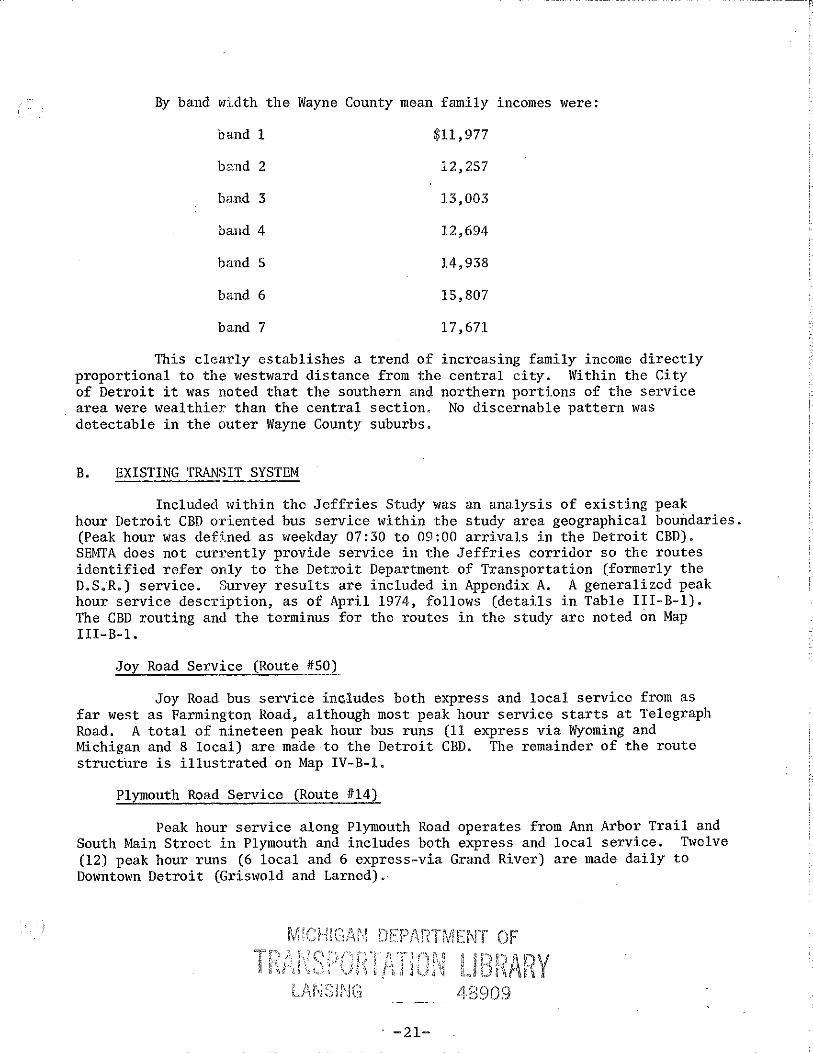
By band width the Wayne County mean family incomes were:
band 1 $11 '977
band 2 12,257
band 3 13,003
baud 4 12,694
band 5 14,938
band 6 15,807
band 7 17' 671
This clearly establishes a trend of increasing family income directly proportional to the westward distance from the central city. Within the City of Detroit it was noted that the southern and northern portions of the service area were wealthier than the central section. No discernable pattern was detectable in the outer Wayne County suburbs.
B. EXISTING TRANSIT SYSTEM
Included within the Jeffries Study was an analysis of existing peak hour Detroit CBD oriented bus service within the study area geographical boundaries. (Peak hour was defined as weekday 07:30 to 09:00 arrivals in the Detroit CBD). SEMTA does not currently provide service in the Jeffries corridor so the routes identified refer only to the Detroit Department of Transportation (formerly the D.S.R.) service. Survey results are included in Appendix A. A generalized peak hour service description, as of April 1974, follows (details in Table III-B-1). The CBD routing and the terminus for the routes in the study are noted on Map III-B-1.
Joy Road Service (Route #SO)
Joy Road bus service includes both express and local service from as far west as Farmington Road, although most peak hour service starts at Telegraph Road. A total of nineteen peak hour bus runs (11 express via Wyoming and Michigan and 8 local) are made to the Detroit CBD. The remainder of the route structi1re is illustrated on Map IV-B-1.
Plymouth Road Service (Route #14)
Peak hour service along Plymouth Road operates from Ann Arbor Trail and South Main Street in Plymouth and includes both express and local service. Twelve (12) peak hour runs (6 local and 6 express-via Grand River) are made daily to Downtown Detroit (Griswold and Larned).
T
-21-

I
" " I
, Legend Route Numbers >-
14 Plymouth · 16 Grand River
33 Dexter 35 FenkeU 41 HamiltOn 44 Imperial 50 Joy Road 83 Second
---. 86 Tireman
e Express-··--L Local ··
I
: CBD ROUTING OF SURVEYED BUS LINES '-

Fenkell Road Service (Route #35)
The most morning peak hour service along Fenkell is from Dale Road and Fenkell (Detroit City Limits), although there is some service from Middlebelt Road. There·are twenty"three·peak hour runs .to.Griswold and Jefferson (10 express via the Lodge Freeway and 13 local runs).
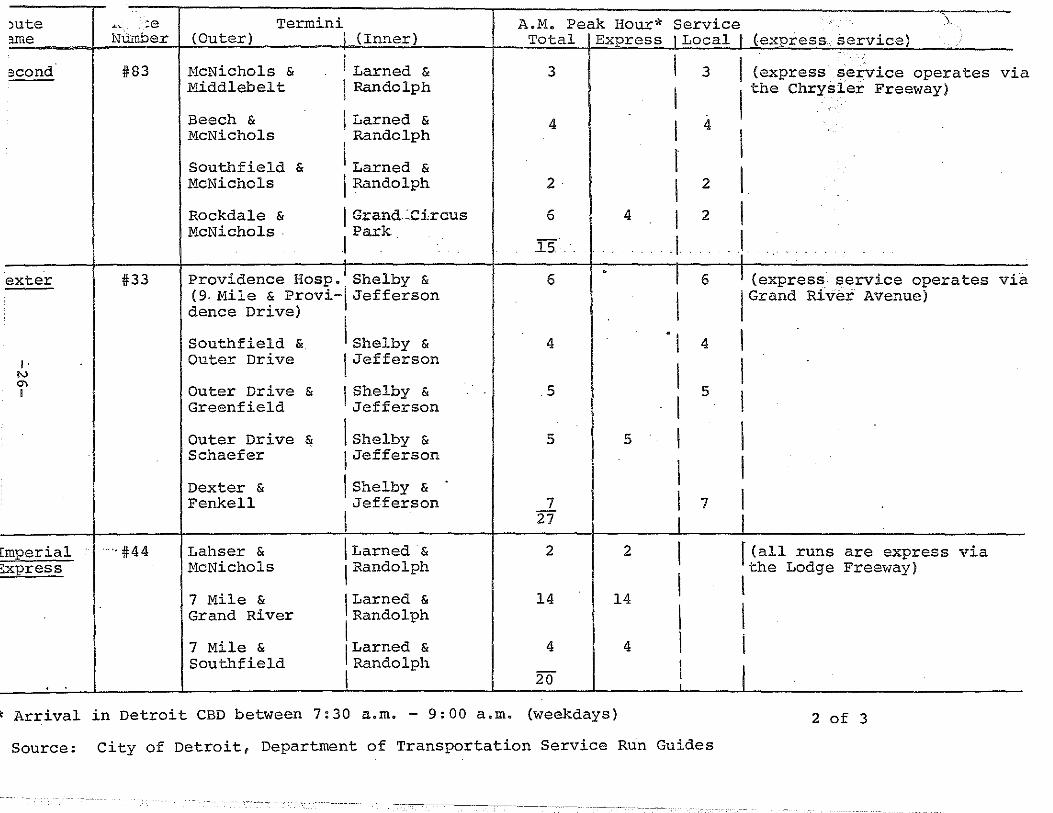
Second Avenue Service (Route #83)
Second Avenue bus service along McNichols (6 Mile Road) starts at Middlebelt Road although most of the service originates at Rockdale and McNichols (just within the west boundary of the City of Detroit). Morning peak hour bus service totals fifteen trips to downtown Detroit (11 local and 4 express, via the Chrysler Freeway).
Dexter Avenue Service (Route #33)
Twenty-seven morning peak hour bus trips to the Detroit CBD (Shelby and Jefferson) are operated daily as part of the Dexter Avenue service. The outer most terminal point is at. Providence Hospital, 9 Mile Road and Providence Drive in Southfield) with intermediate stops at Southfield and Outer Drive, Greenfield and Outer Drive, Schaefer and Outer Drive, and Fenkell and Dexter. Five peak hour express runs, via Grand River Avenue, originate from Schaefer and Outer Drive.
Imperial Express Service (Route #44)
All Imperial Express service operates along the John Lodge Freeway to downtown Detroit (Larned and Randolph). Twenty peak hour trips are made, beginning at Lahser and McNichols, with intermediate origin points at 7-Mile and Grand River, and 7-Mile and Southfield.
Tireman Avenue Service (Route #86)
This route operates five bus trips (no express service) from Spinoza and Tireman to Fort and Shelby during the morning peak hour period.
Hamilton Avenue Service (Route #41)
Hamilton Avenue buses operate twenty-two morning peak hour runs to downtown Detroit (Cobo Hall). This service includes both express (5 runs via the Lodge Freeway) as well as surface street local service. Redford Road and Grand River Avenue is the outermost point of origin for this service.
Grand River Avenue Service (Route #16)
A total of thirty-seven peak hour bus trips to the Detroit CBD make up the Grand River Avenue service. There are sixteen peak hour express runs (operating in mixed traffic via the Jeffries Freeway) and twenty-one local runs operating via Grand River Avenue.
-23-
i;-
i " L i !
1.
I
Schoolcraft Avenue Service (Route #82)
Schoolcraft Avenue Service provides peak hour employment service; however, not to the Detroit CBD but rather to the Sears Complex (in Highland Park). Four trips, originating as far west as Middlebel.t Road and Schoolcraft Avenue, comprise the peak hour Schoolcraft service (no express service).
-24-
--~
I
'

TABLE III-B-1
0-DOT AM PEAK HOUR SERVICE DESCRIPTION DURING SURVEY PERIOD*
mte Route Termini I A.M. Peak Hourlli Service . . une Nurnber (Outer) (Inner) Total ·Express I Local I (express service)
-
. . . I )Y._ Road #50 Farm~ngton Rd. I Cadillac Square 7 4 I 3 I (express service operates vi
Joy Rd. I ·1 Wyoming & Michigan Avenue) I I Telegraph & Joy I Cadillac Square 12 7 5 I
Rd. I 19 I I .
ly_mouth Rd #14 Ann Arbor Trail I Griswold & 1 I 1 I (express service operates vi and South Main Larned Grand River to Larned and
I I I Griswold) Farmington Rd. I Griswold & 1 • 1 anQ. Plymouth Rd., Larned I
I Telegraph & I Griswold & I I Plymouth Larned 2 . 2 , .
I •.
I -Mall Griswold 1 I Wonderland
I & 6 5
Larned I I G.M. Deisel I Griswold & 2 ! 2 I I Larned
I 12 I I ~enkell #35 Middlebelt & I Griswold·& 2 1 I 1 I (express service operates VJ
Fenkell I Jefferson I I
the Lodge Freeway)
Dale & Fenkell I Griswold & 18 8 I
10 I I
Jefferson I I Southfield & I Griswold & 3 1 I
2 Fenkell I Jefferson
I 23 I i .
* April 24, 1974 **I~rival in Detroit CBD between 7:30a.m. - 9:QQ a.m. (weekdays)
Source: City of Detroit, Department of Transportation Service Run Guides 1 of 3
.. \ )Ute ., . ;e Termini A.l"l • Peak Hour* Service
ll!le Nlli-uber (Outer) } (Inner) Total Express 1 Local I (express service) ••
: I I (express service operates acond #83 NcNichols & 1 Larned & 3 3 via Niddlebelt j Randolph
I 1
the Chrysler Freeway)
Beech & I Larned & 4 4 McNichols Randolph I I I Larned & r Southfield &
I NcNichols j Randolph 2 I 2
Rockdale & I G:rand.~Circus 6 4 I 2 I McNichols. Park .
I ! I . . ·. . l5.
#33 Providence Hosp. 1Shelby & 6 . I 6 I (express service operates via exter
(9. Mile & Provi-IJefferson I !Grand River Avenuei dence Drivel
Southfield & !Shelby & 4 . I 4 I I. Outer Drive 1 Jefferson
I I N
"' I Outer Drive & 1 Shelby & 5 5 I Greenfield Jefferson I Outer Drive & I Shelby & 5 5 I I Schaefer 1 Jefferson
I I I Shelby & · Dexter & I I Fenkell Jefferson 7 7
I 27 I I [mperial .. #44 Lahser & !Larned·& 2 2 I [<all runs are express via !:xpress NcNichols I Randolph the Lodge Freeway)
I I 7 Mile & !Larned & l4 l4 Grand River I Randolph I I
I I 7 Mile & !Larned & 4 4 Southfield I Randolph I I 20
I
-~Arrival in Detroit CBD between 7:30a.m.- 9:00a.m. (weekdays) 2 of 3
Source: City of Detroit, Department of Transportation Service Run Guides
; --,·~

lute Rc . .:e Termini A .J\1. Peak Hour* Service illle Nurn..ber (Outer) .I (Inner) Total · Exuress 1 Local I (express service)
I I , I
I I (no express service) Lreman #86 Spinoza &
! For·t & 5
I 5
Tirem?3-n Shelby I I
o.milton #41 Redford & I Cobo Hall 8 ' 8 ' ( . via
I I express serv~ce operates
Grand River I - the Lodge Freeway)
7 Mile & l Cobo Hall 3 I 3 I Southfield
I I I Northland Cobo Hall 3 I
3
I I 7 Mile & James Cobo Hall 8 • 5 3 Couzens I I I -
22 I I I I I (express service operates :rand River #16 Oakland & Grand I Capitol Park 19 8 I 11 vic
River lthe Jeffries Freeway)
I Capitol Park· 12 I Southfield & 6 6 I Grand River
I I J I " I Schaefer & Capitol Park 6 2 4 I Grand River I I 37 I I I I I I I (no 3choolcraft #82 Middlebelt & I Woodward Loop** 3 I 3 express service)
Schoolcraft I I I Inkster & Woodward Loop** 1 1 I Schoolcraft I I L
4 1 I
* Arrival in Detroit CBD between 7:30 a.m. - 9:00 a.m. (weekdays **Schoolcraft (#82) does not go to Detroit CBD; Services the Highland Park Sears (Woodward Loop)
Source: City of Detroit, Department of Transportation Service Run Guides 3 of 3
"---,o
---------------------------------------·----,1!1
IV. RESERVED BUS/CAR POOL FACILITY
A. RESERVED LANE CONCEPTS
Federal Transportation programs over the past 14 years have brought about many improvements to urban public transportation systems. By far the best known, and also the most expensive, have been the re-equipping and/or expansion of urban commuter rail and rapid transit systems. During the late 1960's and continuing into the 1970's, federal programs for urban mass transit, though expanding in scope, were found to be inadequate for the even greater expansion of grant requests which streamed into the U. s. Department of Transportation's Urban Mass Transit Administration (UMTA). To cope with the public transit needs of the cities, yet do so within UMTA's budgetary constraints, a greater attempt was made to utilize low cost capital intensive projects.
Records compiled by the American Transit Association during the post World War II years, to the present, have indicated that surface systems (bus and streetcar combined) lost almost two-thirds of their 1947 ridership, while rapid rail systems retained two-thirds of their ridership base. Though the forces acting upon both modes were complex, and often opposite in their effect, one underlying factor emerged to explain the disparite ridership trends: namely, that rail rapid transit systems operated over their own rights of way, and thus experienced stable, or even increasing commercial schedule speeds during the post-war years, whereas increasing congestion resulted in lower commercial speeds for local bus routes.
It has become clear that major improvements to the nation's public transit networks can be made by improving bus service, primarily through provision of faster service. The lowest costs, particularly within the urbanized parts of the nation's metropolitan regions would, of course, be for service schemes not requiring construction of new facilities. One obvious solution was to operate buses along urban freeways during peak hours, thereby by-passing congested surface streets. Unfortunately, the freeways during peak hours were often congested, providing little relief from slow bus schedules.
Research had shown that three alternative freeway treatments could be used to operate express bus service through peak hour congestion:
(1) Build new bus lanes, either in the median or alongside the freeway, as was constructed along Los Angeles' San Bernardino Freeway;
(2) Utilize capacity within special purpose lanes, such as might be built for reversible traffic peaks. The successful Shirley Busway, over I-95 between Washington, D.C. ·and its Virginia suburbs, is an example of use of such lane capacity.
(3) Reserve existing freeway lanes for buses, and possibly for other high capacity vehicles, such as car pools, either in the prevailing direction, or by use of reverse, or "contra-flow" lanes, such as has been operating since 1970 over the I-495 Lincoln Tunnel connector in New Jersey.
-28·-
These techniques by no means exhaust the possibilities for enhanced freeway or arterial flow. Additional procedures include use of metered ramps; reserved entrances and exits for buses only, bypass lanes at toll booths; etc ..
While allowing for enhanced bus operation, it should be noted that caution must be exercised to insure that persons enjoying the benefit of the special lanes aren't outnumbered by persons who may suffer a degradation of service on adjacent lanes due to capacity restraints. The total person-delay with the inclusion of a reserved lane must be equal or less than total person-delay without the lane.
B. REASONS FOR SELECTING JEFFRIES FREEWAY
In reviewing service concepts for bus use of Detroit area freeways, the original task force arrived at a consensus that the then under construction Jeffries Freeway (I-96) would be the most logical starting point for implementation of a reserved bus and car pool lane. The primary reason for this consensus was the belief that the freeway should serve as a test bed for future expansion to other area freeways, and that the proposed lane had a greater chance of public acceptance by being placed on a freeway that had not yet reached peak hour capacity.
By operating prior to full extension of I-96 into western Wayne County, the exclusive lane would exist prior to any large increase of Jeffries traffic, and hopefully would not be viewed as taking away "vested" automobile capacity rights.
Further, even though capacity traffic loads had not been attained on the Jeffries, the experience in signing, policing, and car pooling that would be gained was considered essential prior to introduction of reserved lanes on the more heavily used freeways, suc.h as I-75 or U.S.-10.
The committee elected to study a "normal flow" lane instead of "contraflow" lanes. This was due to the area freeway's failure to meet two* basic requirements of contra-flow use:
(1) All freeway traffic in the reverse direction can be accomodated in the remaining lanes at level of service D or better, and;
(2) All normal freeway entrances and exits are to the right of the through traffic lanes.
Even though portions of I-96 met these requirements, the Jeffries reserved lane concept was part of a demonstration proposal and therefore was to be a prototype for implementation on other area freeways which unfortunately fail to meet these two standards of acceptability. In addition, vehicles traveling in a non segregated contra flow lane would pose a safety hazard to oncoming vehicular traffic. Whereas buses are highly visable to uncoming traffic, the
*Levinson, H, et al. Reserved Bus Lanes on Urban Freeways: A Macromodel, Transportation Research Record, #513 .
. -29-

number of buses projected for the lane is too few to create a continous or solid line of tre.:ffic. Private vehic.les \•Jhich a:r.e expected to eonsti tute the bulk of lane traffic, are less visable to U')•~oming traffic and more apt to be a safety hazard. Likewise, bus drivers a:ce professionals and would be expected to react more judiciously than average commnters in an· emergency situation.
In conjunction with the decision to study a "normal flow" lane, the committee <1ecided that there would be no physical barrier segregating the lane from non e:::clusive lanes. This decision would keep capital expenditures to a m1n1mum. Likewise daily use of cones or other dividers were not considered as this would incur a continuing operating cost for the lane itself.
Th•> committee further decided to consider a 24 hour restriction on the lane. If this proved to be too stringent or difficult to enforce, gradations were devi,·ed which would reduce the reserved use designation to weekdays and if necessary to peak hour only. The 24. hour restriction was felt to induce greater acceptance by the public.
From the beginning, the Jeffries teehnical committee considered the lane to be one important element in a systems approach to improved transit service. Provision of the lane, with no other improvements, would not appreciably attract new transit ridership. To bring about a total improvement in service, use of park and ride lots, new routes, revised CBD distribution, and an agressive public information program were proposed, and incorporated into the Study.
B. LIMITS AND CHARACTERISTICS OF .JEFFRIES RESERVED LANE SERVICE
(1) Downtown Distribution
The degree to which traffic flow on I-96 will be expedited by installation of an exclusive bus-car pool lane is directly related to the disposition of emerging traffic patterns at the origin and terminus of the designated lane.
The exclusive lane is currently planned to terminate in the vicinity Seldon. Beyond this point four lanes of I-96 are funneled into a turning roadway configuration. Vehicles are either directed into a dual lane approach to the Lodge Freeway (US-10) or the Fishe}' Freeway (I-75). The reduction in the number of lanes and the tendency of drivers to reduce speed at points of increased lane changing leads to peak hour congestion at the Jeffries-Fisher interchange.
The initial recommendation of both the Jeffries Technical and Advisory Committees was to terminate the exclusive lane prior to the turning roadway and encourage buses and carpools to utilize the Michigan Myrtle exit.· In utilizing this exit, bus.es and carpool vehicles would leave the freeway prior to reaching the congested area. Egress of a substantial number of vehicles would facilitate traffic flow on unrestricted lanes since there would be an overall reduction in the number of vehicles converging at the turning roadway. However, exiting at Michigan/Myrtle was found to include considerable lane weaving as vehicles would have to cross to the left to reach the turning roadway (either US-10 or I-75) or cross right to exit at Myrtle. Because of the congestion at the turning roadway
-30-

and in anticipation of extensive weaving, MDSHT has proposed an exclusive exit ramp to Michigan (alternative one) to be constructed if initial results of ,Jeffries reserved lane service are successful. Geometries of the ramp at the southern terminus of the Jeffries are discussed in Chapter VI, and are included in Appendix "C".
A second alternative would be to terminate the service at some point closer to the Detroit CBD than Buchanan Avenue, After a thorough review of the existing freeway network it was found that a logical termination would be at a ramp to Third Avenue, which then utilized Grand River as the means of entering and leaving the CBD, a distance of approximately two blocks. To extend the exclusive lane to Third Avenue would require some additional construction which is detailed in Chapter VI.
It is estimated that construction costs for alternative two, exclusive of engineering and administration, would be 2.7 million dollars.
(2) Grand River Distribution
At the northern terminus, exiting the exclusive lane and egressing the freeway poses a similar, though simpler problem. Traffic signal progression, the influx of new riders since the second freeway segment opened, plus the novelty of line haul buses operating on the freeway has created peak hour congestion where freeway traffic leaves the Jeffries, at Grand River and Schaefer. This congestion should dissipate with the opening of the next segment, in September, 1976. For the interim, MDSHT proposes a slip ramp to route reserved lane users onto Grand River (see Chapter VIII and Appendix "B").
Limits on use of the lane itself includes under or over utilization of it. Tables III-·C-1 and III-C-2 illustrate the average lane volumes which will develop if the exclusive lane is restricted to vehicles with either 3 or more occupants, or 2 or more occupants.
The morning and afternoon peak hour counts listed in the tables are for the month of November, 1974. These counts were used as they represent the hours of maximum daily use for inbound and outbound traffic.
Based on MDSHT data, 2.8 percent of the vehicles on Detroit area freeways carry 3 or more occupants, while 17 percent carry 2 occupants. (Table II-B-2) Using just the volume from the 7-8 AM and 4-5 PM traffic counts (the maximum use hour) it is possible to compute the car pool volume for the exclusive lane. Tables IV-C-1 and IV-C-2 illustrate that the reserved lane, if used for vehicles with 3 or more people, appears to be under utilized, while the traffic in the remaining lanes becomes heavy. The highest hourly volume for November was 6701 vehicles. Under the three or more occupant restriction, 187 vehicles could be allowed in the exclusive lane while each remaining lane would be assigned 2171 vehicles.
-31-

MDSHT reports that the lane design capacity of a freeway is approximately 1800 vehicles per hour. However, the practical lane volume is 1,500 vehicles per hour. Using the three or more occupancy .requirement, the anticipated lane assignments exceed both the design and the practical capacity.
Use of a two person minimum (19.8 percent of area vehicles) increases vehicle volume in the exclusive lane to a point where flow is not appreciably better than the remaining three lanes. With a total one-direction traffic flow of 6,701 vehicles, the two person or more minimum would allow 1,326 vehicles into the exclusive lane and 1,791 into each remaining lane, per hour.
Though vehicles with three or more persons are now few, the lane will also accomodate 63 scheduled D-DOT buses (Grand River, Imperial, Joy Road) in the peak hour, as well as bus~s generated by eight new routes recommended by SEMTA and D-DOT. Asswning 15 minute headways on these new routes, they would add an additional 40-43 buses per peak hour, for a peak hour total of 103-106 buses. Although fewer vehicles would be operating in the exclusive lane, more individual person trips would be completed.
At the maximum recorded peak hour volume of 6,701 vehicles, 187 vehicles with three or more occupants would carry a minimum of approximately 560 passengers in autos, in the reserved lane, plus the 103-106 buses, for an additional 4,635 to 4,770 passengers. (The assumption that buses would be operating at full seating capacity (45 passengers per coach) reflects the market estimates developed in Chapter V, and the transit occupancy rate found on peak hour Grand River buses). In the remaining three lanes, a total of 5,374 people would be driving alone, while 1,139 would be in cars carrying two persons. A full comparison of person trips per lane, per hours, has the exclusive bus lane carrying between 4,800 to 5,000 people, while each remaining lane would carry 2,550 persons.
It has been assumed there will be an overall shift from two person occupancy to three person vehicle occupancy, which will reduce congestion in the remaining lanes, but is not expected to be beyond the capacity of the exclusive lane.
The figures in Table IV-C-1 and IV-C-2 reflect area wide vehicle occupancy rates. The actual rates for the Jeffries freeway are higher. For morning trips, 3.32 percent of the inbound vehicles carry three or more persons; 20.87 percent have at least two occupants. For afternoon outbound trips 5.18 percent of the vehicles have three or more occupants and 21.96 percent have at least two occupants. For comparison, the area wide occupancy rates were used since it is assumed that as additional segments of the Jeffries are opened to the public and the nwnber of CBD orientated trips increase, occupancy rates will decrease to conform to the area norm.
-32-
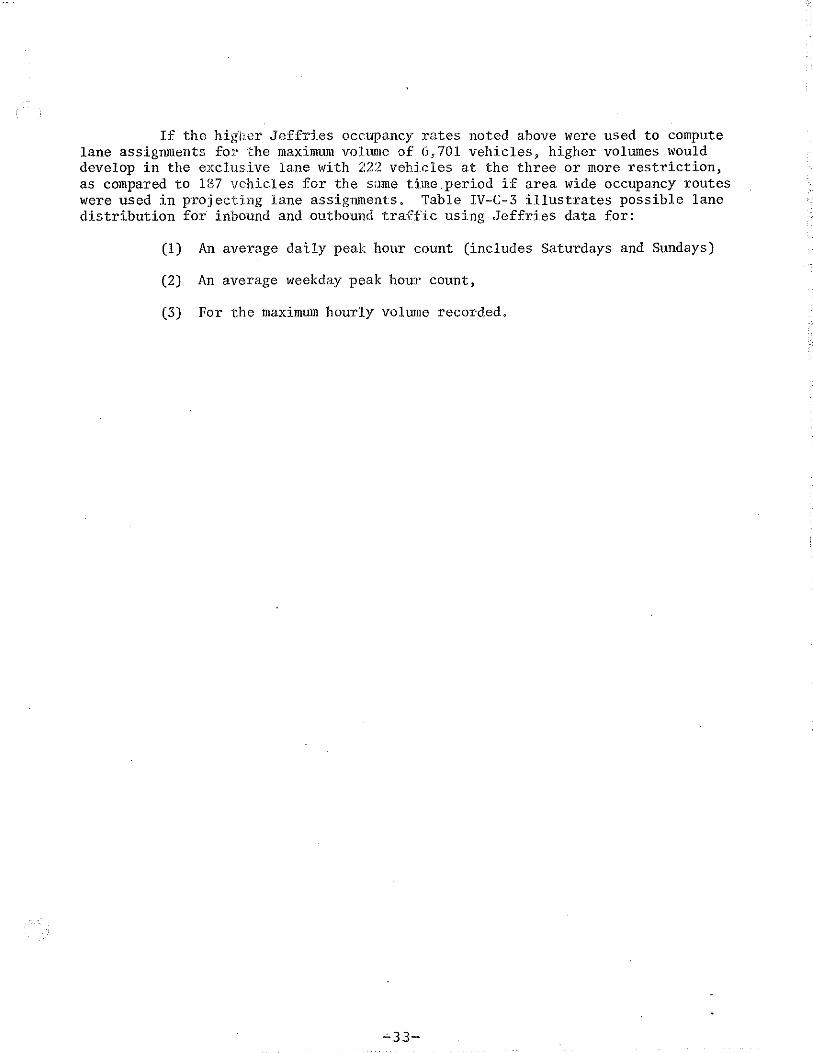
If the higl1er Jeffries occupancy rates noted above were used to compute lane assignments fo1· the maximum volume of 6, 701 vehicles, higher volumes would develop in the exclusive lane with 22:2 vehicles at the three or more restriction, as compared to 187 vehicles for the same time .period if area wide occupancy routes were used in projecting lane assignments. Table IV-C-3 illustrates possible lane distribution for inbound and outbound traffic using Jeffries data for:
(1) An average daily peak hour count (includes Saturdays and Sundays)
(2) An average weekday peak hour count,
(3) For the maximum hourly volume recorded.

i
I. ··' I
TABLE IV-C-2 EFFECTS OF DIVERTING VEHICLES WITH 2 AND/OR 3+ OCCUPANTS TO EXCLUSIVE LANE*
PM Peak Hour Traffic Count (for hour ending)
Vehicles in** Average ff of**** Vehicles in***Average # o£**** RBL at 3+ vehicle/non RBL at 2+ vehicle/non Restriction exclusive lane Restriction exclusive lane
4 5
F 3269 4142
Sat. 2272' 1975
s ·1508 1893
M 3298 4164
T 3331 3839
IV 3350 4636
Thurs. 3308 4453
F
Sa to
s
M
T
3358
1975
1643
2924
3393
w 4144
Thurs. 1013
F 4117
Sat. 2261
.s 1629
M 2813
T 3318
w 3452
Thurs. 866
F 3502
Sat. 2072
s 1773
M 3002
T 3451
w 3827
Thurs. 2791
F 3474
Sat. 2176
4582
1967
1484
3564
3909
5782
1321
5781
2235
1466
3420
3825
4815
1155
4767
2039
1602
3653
3976
5354
2913
4757
2167
6
3842
1759
1178
3814
3449
3860
3843
3881
1865
1381
3204
3515
4815
4056
4817
2120
1367
3077
3430
3995
3202
4045
1929
1490
3287
3575
4435
2824
4018
2049
116
55
53
116
107
129
124
128
55
41
99
109
161
36
161
62
41
95
107
134
32
133
57
44
1Q2
111
149
81
!33
60
1342
640
615
1349
1243
1502
1442
1484
637
480
1154
1266
1873
428
1873
724
474
1108
1239
1560
374
1544
650
519
1183
1288
1734
943
1541
702
Source: Michigan Department of State Highways and Transportation
820
391
375
824
760
917
881
907'
389
293
705
773
1144
261
1144
442
290
677
757
953
228
943
403
317
723
787
1060
576
941
429
24 hour counts - I-96 Northbound volume at Ivanhoe~ November, 1974
* 4-5 P.m. traffic counts used to maximize effects~
•~ Area freeway peak hour average of 2.8% vehicles ·with 3+ occupancy rate
*~*Area freeway·peak hour average of 17% vehicles' with 2 person occupancy plus additional 2.8% for 2+ occupancy
·****Average number of veh:ic.les in each of the 3· remaining bnes, after car noolers. - - ___ ..,_ L----- t...~-~ u""'~OnAd f:Q the exclusive lane
1107
527
537
1113
1026
1239
1190
1224
525
396
953
1043
1545
353
1545
597
391
' 914
1022
1287
308
1274
545
428
976
1062
353
778
1271
579
·. ~ ....
J
I I I ! .. I
l

I w 0'1 I
TABLE IV-C-3
EFFECTS OF DIVERTING VEHICLES WITH 2 AND/OR 3 OR MORE OCCUPANTS TO THE EXCLUSIVE LANE 1
Exclusive* Lane Volume at
AM-Inbound (7-9) · 3+ · Rest:dction
Average daily peak period count 3754 125
Average weekday peak period count 4907 163
Maximum hour count. 6701 222
PM-Outbound (4-6)
Average dilay peak period count 3212 166
Average weekday peak period count 3828 198
Maximum hour count 5782 299
1 Based on Jeffries Freeway Vehicle Occupancy,
* Inbound 3+ Occupants 3,32% Outbound 3+ Occupants 5,18%
**Inbound 2+ Occupants 24,19 Outbound 2+ Occupants 27,14
Average Volu..ue Exclusive** Ave:i~age Volwae in each non Lane Volume at in each non
Exclusive lane 2+ Restriction Exclusive lane
1209 908 948
1581 1187 1240
2159 1620 1693
1015 871 780
1210 1038 930
1872 1569 1404

V. POTENTIAL TRANSIT MARKET
A. PROCEDURE
A market analysis of the Jeffries Corridor was undertaken to determine the extent to which both reduced trip time and new services offered through use of the exclusive bus-car pool lane would affect transit ridership. The analysis was concerned with ridership potential of routes presently within the corridor and for proposed routes in areas not currently served08y transit.
The deficiencies of 1970 census data in an area which has experienced marked:' population changes was determined, and led to the use of a non-elaborate model. The model incorporated the April 27, 1974 Jeffries survey data as weLt. as a minimum of census information, in order to produce an accurate marhlt estimate. The model utilized factored survey responses and 1970 census info~mation, such as local CBD employment, to simulate the current modal split for the Jeffries Corridor, Auto-bus travel time ratios were developed for CBD oriented trips. These ratios were changed to reflect the proposed transit (bus) times possible, by route, if the Jeffries (I-96) exclusive bus and car pool lane were to be used. Coupled with census data as to the extent of CBD employment in specific study areas, the reduction in absolute travel time became a significant factor in projecting ridership estimates.
B. METHODOLOGY
1) Riders of 10 existing Detroit DOT routes which displayed potential for inco1~oration into the Jeffries exclusive bus lane project were surveyed. Respondents were asked to supply their home address. A total of 2,340 respondents provided this information which was then compiled in a computer printout according to census tract and block number. Analyses of the survey design, administration, and results are documented in Appendix A.
2) Total number of riders by specific bus route was tabulated and factored. (See Table 19, Appendix A). It was anticipated that the rate of questionnaire return would vary for bus riders having different socioeconomic characteristics. To help correct this, separate expansion factors were developed for the express and local bus runs on each bus line. This approach was based on suggested procedures described in the report, Urban Mass Transportation Travel Surveys.*
* Urban l·1ass Transrortntion Travel Surveys, Urban Trans System Association for U.S., -DOT (l'Jashington, D.C., 1972), P. 31
-37-
: !-' ,'

Run
Hamilton Grand River Tireman Joy Road Second Plymouth Fenkell Imperial Express Dexter Schoolcraft
TABLE V-B-1 Expansion Factors
Express Local
3,15 4.57 3.83 7.48
4.58 2.58 6.13 2. 72 4.04 2.88 5.81 3.51 6.82 3.14 4.24 6.09
5.16
3) The routes were plotted on a census tract map, (see Appendix A), and divided, Depending on the length of tl1e. route, the absolute bus travel time, and the number of points at which a rider could disembark, or transfer, routes were divided into 4 to 6 segments (see Map V-B-1). This was necessary to determine CBD trip time from various points along the route and to determine how the modal split for each route segment would be affected by an alternation in the transit trip time to the CBD.
4) In addition (and prior) to dividing the routes, the census tracts for western Wayne County and southern Oakland County were divided into sub-tracts. Based on response from existing riders and service request data, this area was designated as the Jeffries' market. Tracts were subdivided since they vary in size and are either bordered or bisected by major thoro11gh-fares. Since the surveyed bus routes followed major arterials (Grand River, Fenkell, Second, Joy, etc.), arbitrarily assigning the socio-economic characteristics of a tract to the routes which traversed it was not feasible, as this would have resulted in assigning the projected transit ridership of one tract to two or even three routes, and ultimately would lead to an inflated market estimate.
In most cases, tracts were halved. Since bus patrons traditionally travel to the bus route nearest their home, If a tract has a major CBD oriented route at both the north and south border, dividing it at the. center should assign area transit users to the route they would most logically choose.
If a number of routes passed through a market area, thereby offering more alternatives, or a greater option for transfering between routes, the tract was quartered. Obstacles to easy access to a route, such as parks, drainage ditches or large undeveloped areas, resulted in the land area being assigned to the tract segment which was most accessible to the route even if the result was unequal zonal segmentation. Innercity tracts, which tend to be smaller, were either not segmented, or were halved. Suburban tracts, being much larger, were divided to. conform to the normally accepted
-38-

1-96
14
ford Rd
'.
Bus line 16 (Grand River) runs to Farmington Road.
Sus line 14 (Plymouth) runs to Ann Arbor Trail.
MAP V-B-1
• BUS LINES SURVEYED
16- Grand River 50-Joy 86- Tireman 82 .,- Schoolcraft 41 - Hamilton
14- Plymouth 33- Dexter 83-Second 35- Fenkell 44- Imperial Express •
·.;n
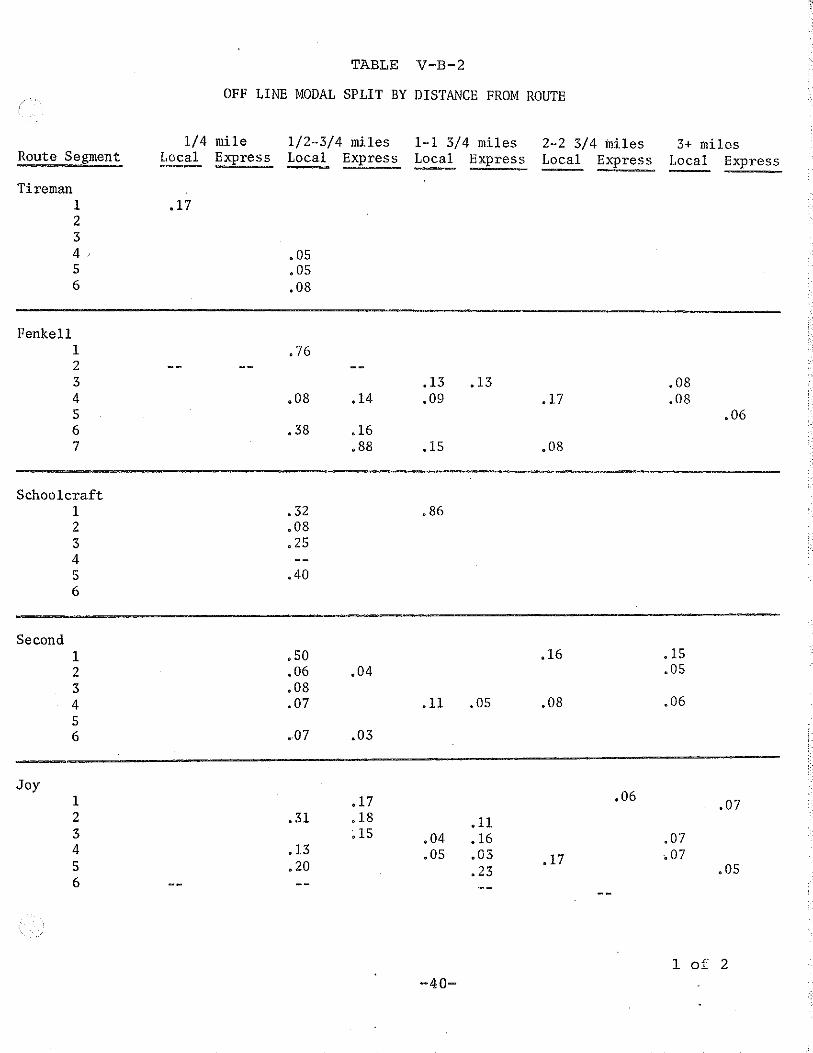
TABLE V-B-2
OFF LINE MODAL SPLIT BY DISTANCE FROM ROUTE
1/4 mile 1/2-3/4 miles 1-1 3/4 miles 2-2 3/4 miles 3+ miles Route Segment Local -- Express Local Express Local Express Local Express Local Express
Tireman 1 .17 2 3 4 • OS s • OS 6 ,08
Fenkell 1 .76 2 3 .13 .13 .08 4 .08 .14 .09 .17 .08 5 .06 6 .38 .16 7 • 88 .1S .08
Schoolcraft 1 • 32 .86 2 .08 3 • 25 4 s .40 6
Second 1 .so .16 .1S 2 .06 .04 .OS 3 .08 4 .07 .11 .os .08 .06 5 6 .07 .03
Joy .06 1 .17 .07
2 .31 .18 .11 3 ;1S .04 .16 .07 4 .13 .OS .03 .17 ,07 s .20 .23 • OS 6
1 of 2 -40-

1/4 mile 1/2-3/4 miles 1-1 3/4 miles 2-2 3/4 miles 3+ miles Route Segment Local Express Local Express Local Express Local Express Local Express ---l:lamilton
1 .os .08 .40 .16 2 • 37 .12 3 .27 .11 .03 .18 .08 4 .15 .11. 5 ,02 .02 • 35 .14 .06 .04 6
Plymouth 1 .22 il5 .15 .12 .21 2 .14 .17 3 .44 .18 .10 4 .10 5 100 .02 6 .14 .13 7
Imperial Exp. 1 .22 .22 .12 ., o13
2 .11 3 100 • 20 .ll .24 4 .26 .07 .07 .07 .03
Grand River .37 .15 .20 1 100 .17 2 .10
.31 ,40 3 .14 .13 .23 .39 ,35
4 .68 .12 .16 .11 .47 .14
5 .15 .13 .13 .60
6 .14 .23 .11 .10 6 .42 .19 .os .11 .07
7 .14 .88 .36 .70 .09
2 of 2
-41-

TABLE V-B-3 ..
ON LJ:NE MODAL SPLJ:T AND '!il~SIT-AUTO TR..lWEL TIME RATIO BY ROUTE SEGMENT ~-- ----
Time to CBD
Route Segmentl of Riders2 Factored Ridership3 CBD Employment4 Modal Bplit5 (minute) II Transit Auto Ratio
Local Express Local Express· Local Express
Tirerilan Ill 15 69 455 15 60 21.7 2.76 2 5 23 155 14 52 18.4 2.82 3 6 27 193 14 45 15.9 2.83 4 15 69 480 15 41 14.4. 2. 22 5 18 82 208 40 36 12,9 2.79
•6 10 45 321 14 TOTAL 69 315 1812 17
.Femkell · :dll l 6 53 13 80 31.4 2.54 2 3 4 20 14 279 07 05 58 25.9 2.23 3 4 11 27 38 330 08 12 so 21.5 2.32
I 4 4 9 27 31 570 04 05 43 19e9 2.16 .,. N 5 20 27 136 97 609 22 16 35 18,6 1.88 i 6 7 8 47 28 221 22 13 2&. 16.7 1.67
7 2 4 13 14 159 9 9 22 15. 1.46 TOTAL 41 63 276 222 2221 12 10
Schoolcraft 1 4 20 91 23 30.6 2 8 41 347 12 25,4 3 20 103 497 21 19 .. 4 4 10 51 391 18 15.6 5 7 36 171 21 12,5
TOTAL 49 251 1497 17
Second ill 2 8 114 07 81 28.8 2.81 2 9 36 242 15 55 24.8 2.21 3 12 16 48 43 555 09 08 48 21.8 2.19 4 38 '1 h 153 29 ,, 733 21 04 40 18.7 2.13 5 17 11 68 29 494 14 06 35 15.3 2.28 6 12 3 48 8 382 • 13 02 30 13.7 2~17
TOTAL 90 41 261 109 2520 14 04
1 of 3

TABLE .V-B-3
ON LINE MODAL SPLIT AND TRANSIT-AUTO TRAVEL TIME RATIO BY ROUTE SEGMENT
Time to CBD
Modal Split 5 (minute) :oute Segmentl II of Riders2 Factored Ridership3 CBD Emp1oyment4 Transit Auto Ratio
Local Express Local Express Local Express
.2l. Ill 1 18 6 46 484 1 10 74 31.5 2.34 2 28 72 373 19 66 26.4 2.50 3 5 23 30 59 437 7 14 57 21.4 2.66 4 13 23 79 59 455 18 13 47 16.2 2.90 5 24 "10 147 25 644 23 04 41 13.4 3.05 -6 18 llO 244 45 10.2
TOTAL 61 82 372 241 2637 14 09
amilton. #1 18 72 764 . 10 67 25.9 2.58 2 10 40 366 11 58 23.2 2.49 3 8 3 32 9 299 11 03 38 20.2 1.88 4 18 15 72 47 332 22 14 34 19 1.77 5 36 23 145 72 411 35 18 32 17.9 1. 78
TOTAL 90 41 361 128 2172 17 06
1vmouth Ill 11 31 175 18 57 30.8 1.85 2 5 12 29 34 213 14 16 50 26.4 1.89 3 3 25 17 72 661 03 11 41 22.1 1.85 4 11 ·2o 63 57 502 13 11 32 . 17 .s 1.82 5 11 19 63 54 489 13 11 25 14.4 1. 73 6 12 69 306 23 22 11.4 1.91 7 5 29 191 15 13.4
TOTAL 47 97 270 248 2537 11 10
nperial Ill . 21 65 505 13 51 25.4 2.0 2 13 40 410 09 44 23.3· 1.88 3 71 222.· 1051 21 37 19.9 1.85 4 30 94 526 18 31 17.2 1.80
TOT~L 145 421 2492 17
2 of 3
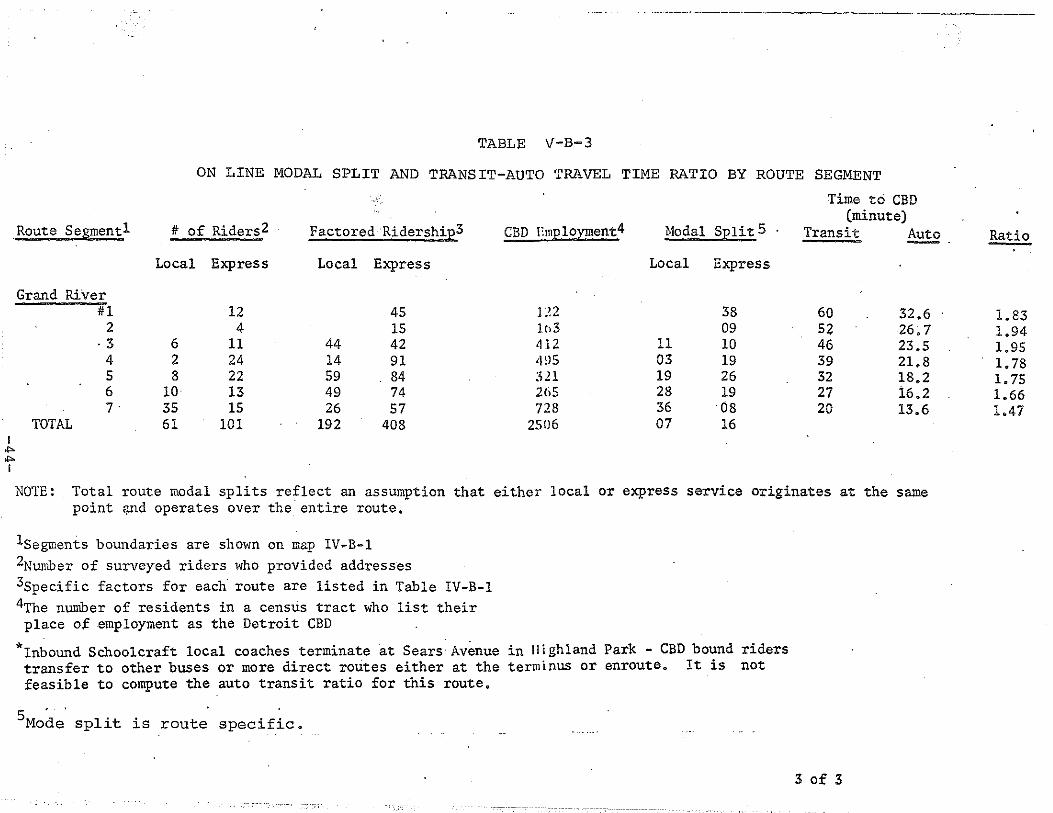
Route Segment!
Grand River itl
2 ·3
4 5 6 7·
TOTAL I
TABLE V-B-3
ON LINE MODAL SPLIT AND TRANSIT-AUTO TRAVEL TIME RATIO BY ROUTE SEGMENT
Time to CBD
it of Riders2 Factored Ridership3 CBD Employment4 Modal Split 5 · (minute)
Transit ~ _
Local Express Local Express Local Express
12 45 U2 38 60 32.6 4 15 lt>3 09 52 26.7
6 11 44 42 412 11 10 46 23.5 2 24 14 91 "~)5 03 19 39 21.8 8 22 59 84 321 19 26 32 18.2
10 13 49 74 265 28 19 27 16.2 35 15 26 57 728 36 08 20 13.6 61 101 192 408 2506 07 16
""" """ I
NOTE: Total route modal splits reflect an assumption that either local or express service originates at the same point ~d operates over the entire route.
lsegments boundaries are shown on map IV~B-1 2Number of surveyed riders who provided addresses 3specific factors for each route are listed in Table IV-B-1 4The number of residents in a census tract who list their place of employment as the Detroit CBD
*Inbound Schoolcraft local coaches terminate at Sears Avenue in Highland Park - CBD bound riders transfer to other buses or more direct routes either at the terminus or enroute. It is not feasible to compute the auto transit ratio for this route.
5Mode. split is route specific.
3 of 3
Ratio
1.83 1.94 1.95 1.78 1. 75 1.66 1.47
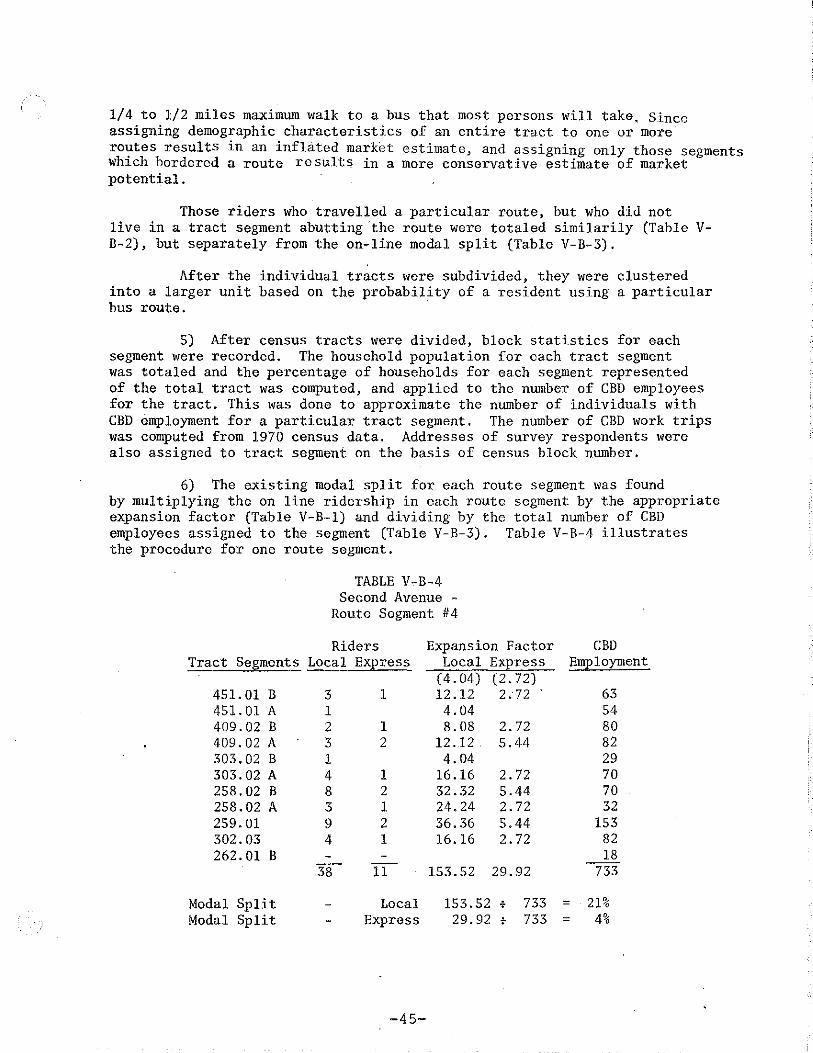
1/4 to 1/2 miles maximum walk to a bus that most persons will take. Since assigning demographic characteristics of an entire tract to one or more ro~tes results in an inflated market estimate, and assigning only those segments wh1ch bordered a route results in a more conservative estimate of market potential.
Those riders who travelled a particular route, but who did not live in a tract segment abutting the route were totaled similarily (Table VB-2), but separately from the on-line modal split (Table V-B-3).
After the individual tracts were subdivided, they were clustered into a larger unit based on the probability of a resident using a particular bus route.
5) After census tracts were divided, block statistics for each segment were recorded. The household population for each tract segment was totaled and the percentage of households for each segment represented of the total tract was computed, and applied to the number of CBD employees for the tract. This was done to approximate the number of individuals with CBD employment for a particular tract segment. The number of CBD work trips was computed from 1970 census data. Addresses of survey respondents were also assigned to tract segment on the basis of census block number.
6) The existing modal split for each route segment was found by multiplying the on line ridership in each route segment by the appropriate expansion factor (Table V-B-1) and dividing by the total number of CBD employees assigned to the segment (Table V-B-3). Table V-B-4 illustrates the procedure for one route segment.
Tract Segments
451. 01 B 451. 01 A 409.02 B 409.02 A 303.02 B 303.02 A 258.02 B 258.02 A 259.01 302.03 262.01 B
Modal Split Modal Split
TABLE V-B-4 Second Avenue -
Route Segment #4
Riders Expansion Factor Local ExEress Local ExEress
(4.04) (2. 72) 3 1 12.12 2 o72 1 4.04 2 1 8.08 2. 72 3 2 12.12 5.44 l 4. 04 4 1 16.16 2.72 8 2 32.32 5.44 3 1 24.24 2. 72 9 2 36.36 5.44 4 1 16.16 2. 72
38 11 153.52 29.92
Local 153.52 < 733 Express 29.92 t 733
-45-
CBD EmEloyment
63 54 80 82 29 70 70 32
153 82 18
733
= 21% = 4%

7) For each route segment, the current transit-auto travel time ratio was also established. Transit time points equated to the center of each segment were supplied by the Detroit-DOT. 1975 auto travel time was derived from SEMCOG's 1975 Highway Networlc SKIM THREE, tape iiS449,
It was found that the greater the distance to the CBD (as equated to higher transit time), the higher the transit-auto ratio. It was also found, however, that the modal split was also higher at longer distances, indicating a propensity by some riders to forego the time savings of a private vehicle for the convenience of transit when long distances are involved. Analyses of survey results (Appendix A) indicates that express bus riders were concerned at high CBD parking costs, which was another factor in their choosing transit.
As distance to the CBD descreased, and the travel time ratio declined, the modal split also decreased. It is this mid-point where the trip is not sufficiently arduous but when the transit to auto time ratio is still substantial, that the modal split appears to be lowest. Closer to the CBD, the transit auto ratio is q·1ite small and the transit modal split again increases. At this distanc ,, the time saving of a private vehicle over a bus is minor and is most likely offset by the high cost and access time from the parking site. Survey data indicates that many innercity residents are also transit "captives".
Table V-B-3 lists the on-line specific modal split and auto transit ratio of the surveyed* routes by segment. Utilizing information as to travel time savings possible through use of express bus service, preferably on an exclusive right-of-way, it was possible to determine the shift in the auto-transit travel time ratio. This resulted in a ridership projection reflecting the modal split of the route segment closest to the CBD, i.e., the highest modal split, for each existing route. Like ratios were also computed for areas currently without service, or with no express service.
In addition, segment attributes which were considered to affect the ultimate modal split projection were factored by a judgemental basis. These included density; level of existing transit services; and proximity to the CBD. For routes offering only local service, such as Tireman, the addition of express service necessitated stronger weighting to the level of service factor.
Results:
Projections of potential ridership were develope.d for existing route, which would not be altered, other than to incorporate the exclusive bus lane
*After reviewing the route structure of Dexter Avenue runs, with its high degree of local ridership, it was determined that it would be unfeasible to reroute any segment of it into the Jeffries freeway. Therefore, Dexter was excluded from the modal split process.
-46-

into their route structure, such as Tireman and Joy Road. These two routes bisect an area which would not appreciably benefit from extended service.
Routes which are recommended t~ be extended (lengthened) on the basis of ridership projections include Fenkell, Plymouth, Second, and Grand River. Analysis also indicates a ridership potential sufficient to warrant a number of new express routes, including Livernois, Shaefer, Greenfield, Evergreen Southfield, Telegraph and Lahser. These routes are shown in Map V-B-2.
Detailed projections of new ridership potential by route segment are included in Table V-B-5. The projections are based on:
1) Speedy ingress and egress to and from the exclusive bus lane.
2) Buses capable of comfortable express service. 3) Limited stop express service. 4) No major alteration in fare structure. 5) An extensive public information campaign to acqu~nt
existing and potential riders with the service. 6) Headways 7) Improved transit/auto ratio.
In determining the type of service alterations best suited to an area, the following items were reviewed:
1) Census data. Population and the number of residents employed in the CBD.
2) Survey responses. The number of survey respondents who lived ·in the area, who currently had to travel to ride one of the surveyed route, but who would commuter via a closer, faster service.
3) Accessability to existing service. Proximity of a market segment to existing, though non-express, non-direct transit service.
-47-
I I
I

RECOMMENDED JEFFRIES ROUTE ADDITIONS & ALTERATIONS
)VI
2 2 MAP ;\/-B-2
-
1- LIVERNOIS
2-SCHAEFER
PHASE I 3- GREENFIELD 4- SOUTHFIELD
5 - EVERGREEN
6- TELEGRAPH
1- GRAND RIVER
8-SECOND
9- FENKELL
t:ISEmTa
----~-----------,~

''
- -------------- ------------ --------- ----------------- - ---------------------- ----------~~
TABLE V-B-5 ESTI~IATES OF POTENTIAL RIDERSHIP FOR JEFFRIES BUS ROUTES
Estimated 3 Nwnber4 5' CBD 1 Number 2 .new Total not Total ··
Route EmEloyment Q.!.Y3.!!5~ Riders Riders Diverted Sum ---, New Service
Livernois non-service area* 595 2 107 109 7 116 0-DOT service area** 1591 42 149 191 49 240'
Total 2186 44 256 300 56 356
Schaeffer non .. service area 439 2 92 95 0 95 D-DOT service area 1526 139 133 212 61 333
Total 1965 142 225 367 61 428
Greenfield Non-service area 466 3 87 90 0 90 D-DOT service area 1102 92 77 169 197 366
Total 1568 95 164 259 197 456
Southfield D-DOT se;rvice area 989 145 51 196 86 282
Evergreen Non~service area 243 3 52 55 1 56 D-DOT service area 714 46 54 100 91 191
Total 957 49 106 155 92 247
Lasher ~ervice area 186 17 37 54 0 54
D-DOT service area 609 93 61 154 11 165 Total 795 110 98 208 11 219
Telerrraph Non-service area 792 71 74 155 25 180
Sub Total 9252 656 984 1640 528 2168
Bxtended·service
Grand River '665 168 68 236 0 236 Second 362 43 47 90 5 95 Plymouth 350 32 60 92 0 92 Fenkell 312 24 90 114 2 116
Sub Total 1689 267 265 532 7 539
Express Service
Tireman 1812 190 Joy 4207' 148
Sub Total 6019 338
TafAL 16,960 923 1,587 2,172 535 2,707
1 Number of people living within 1/2 mile of the route who acCOrding to the 1970 census claim employment in the Detroit CBD
2 Number of riders who currently use D-DOT serv.ice but who would divert to the new service 3 Number of new riders estimated to use servi~e 4 Numbel' of people who currently use D-DOT service and would continue
to use the same service and would not divert to a new route. These riders are shown as they are included in total zonal modal split calculations
5sum total of transit users for the area
* Areas not included in current D-DOT **Area currently served by D-DOT
service area
~49-
r·
j; (
I : ~
'l ! ·;,
.t
J ' ' j '
.:.:.,
i
'·.
VI. JEFFRIES TRANSIT SERVICE: ALTERNATIVES AND COSTS
A. CORRIDOR TRANSIT SERVICE
Three forms of Jeffries bus service were studied:
(a) Existing DOT service, rerouted via the Jeffries; (b) New express serVice over DOT routes, lfia the Jeffries; (c) New service beyond Detroit, to be operated by SEMTA;
B. ALTERNATIVES TO EXISTING.ROUTE
Three existing routes were found to have potential for use over the Jeffries reserved lanes. The heaviest route, Grand River, currently operates a high density local and express peak hour service. The Detroit DOT recommended that the three existing routes be diverted to Jeffries service as follows:
1) Grand RiVer
The Detroit Department of Transportation proposed to operate 23 Grand River Expresses via the Jeffries route nuring the morning peak hours of 0645 to 9910 and 20 coaches during the 1610 to 18ZO peak period. These coaches are, in fact, currently using the Jeffries Freeway in mixed traffic service and are known as the Grand River "Red" Expresses. However, under the reserved lane program, the "Red" expresses would proceed local via Grand River to Schaefer and then use the Jeffries only between Schaefer and Scotten, where the coaches would leave the freeway in the morning to serve the busy Grand Boulevard stop. Afternoon service would be the reverse of this routing (See MapVI-B-1).
The DOT currently operates another express service on Grand River, known as the "Blue" line, which stops only at express stops between Schaefer and the CBD via Grand River.
No. of buses Using RBL AM PM
23 20
No. of new buses required to maintain recommended headways
$
Capital Costs Revenue
$
2) Seven Mile Road Imperial Express
Annual Operating Subsidy for New Service
$
Implementation Date
September 1975
The Seven Mile Road Imperial Express bus service presently operates along 7 Mile Road to Wyoming, then via Wyoming to the Lodge Freeway. Coaches leave the freeway, at the Temple "off" ramp at Grand River.
Three alternative routings of the Imperial Express for Jeffries service were studied, as follows (see Map VI B):
1. Exit onto the eastbound Ford Freeway to the Lodge Freeway to the Temple/Grand River exit.
2. Exit at the Warren Av'enue ramp; eastbound onto Warren to Grand River, then to the northbound Lodge service drive to Temple.
-50-

I U1 1-' I
GRAND RIVER EXPRESS ROUTE AlTERNATIVE
il - _j, ll i, ''-JL __ .J I 'I- ··:! If i r ,-- l ll ,,
\ i !! I
1:
,, J~ ) l Pu<!m.~o~ .) L\ L ____ ]
' I ~ --- --, .
,i :I "
,, ' '-----'
1" = 1 MILE -MAPVI-B-1
I I '
I I I I
!
r
! I I i
-!
! I i I

3. Exit at the Myrtle Avenue ramp, eastbound on Myrtle to Grand River, then to the northbound Lodge service drive to Temple.
Travel time and delay runs were·conducted for the three route alternatives from the Wyoming Lodge Freeway interchange to the Temple Lodge northbound service road intersection. Speed runs were also made along the present Lodge routing of the Imperial Express between these two points. The following chart summarizes the average of the various runs made on each of these routes:
Route
TABLE VI-·B-1
Travel Times for Imperial Express ~odge-Wyoming to Temple at
Route Lodge
Alternatives Freeway)
Travel Times
Time of Run Period: 7:30AM 7:45 AM 8:00AM
John Lodge Wyoming-Jeffries-Ford-Lodge Wyoming-Jeffries-Warren-Grand River Wyoming-Jeffries-Myrtle-Grand River
15' 14' 14' 14'
30" 17' 00" 18 1
55" 16' 0011 18'
40" NA 00" 16 1 2511
55" 15' 38" 0011 17 1 15"
Results of the travel time runs, field checks of each route alternative, and D-DOT observations as to transit vehicle maneuverability over each route indicate that the most desirable alternative would incoporate a Warren Avenue exit. This is identified as Route 2 on Map IV-C-2.
Preliminary planning indicates that this line could proceed south on Wyoming until it reaches the Jeffries Freeway, where it would proceed inbound to the Warren "off" ramp. On Warren it would proceed to Grand River where it will travel to the northbound Lodge service drive at which point it would turn left to first drop-off point at Temple. This routing assumes that Grand River will have a 24-hour left turn lane, or that some provision will be made to allow buses to make left turn movements from Grand River, which are currently illegal. The Imperial bus would then proceed along its existing route into the.CBD.
As with the Grand River Express coaches, the Imperial route would not utilize the reserved lane to the maximum extent. Time and delay studies indicate that for the present, leaving the freeway at an earlier point and traveling via a surface route is more expedient than remaining on the freeway and being delayed by traffic congestion at the junction with I-75. Until physical construction at the interchange eliminates the traffic delay, it is reco@nended that the Imperial Express coaches (like Grand River service) be routed in a manner which provides the best service for commuters. However, since 7 4 .. 6 percent of the commuters who utilize the Imperial Express are CBD oriented, (see Table 32, p.52 Appendix A), they should derive the benefit accrued by direct access. After the construction of preferential
-52-·

l '-" w I
IMPERIAL EXPRESS ROUTE AlTERNATIVE
0 "" ..J w .. . , u. :I: ,- 1-,. :::> 0
"'
Link Distance
A-C 7.63 A-B 4.85 B-C1 3:32 B-C2 2:85 B-C3 3.71
A-B-C1 A-B-C2 A-B-C3
1"=1MILE
. I .J • I c I '" ]r ,.
I _j, i l rv<~oT~N li
!
7:30 7:45 Time Speed Time Speed 15:30 29.6 17.40 25.9
11:30 34.1 10:30 27.9 7:20 27.2 7:20 27.2 6:25 26.6 6:25 26.6 3:11 40.3 7:30 29.7
TOTAL TIME
15:50 17:50 14:55 14:00
16:55
18:00
'-JC ___ jl ~l"'~~ILHI.l1.' ...JI ___!I u·· ,. ,\ 11 . !~ ,,
~•Q••"'"I J ·; ,. I. JL .... j[ "' ~
Time Speed
9:05 32.1 7:20 27.2 6:25 26.6 8:10 27.3
16:25 15:30 17:15
MAPVI-B-2
"•.....,.L!....,. . \\'"-"""
\\ II ..
.•·· ~~ 'i,
···' ··"

treatment facilities for transit vehicles is completed, it is recommended that Imperial Coaches be routed directly via the reserved bus lane to the CBD. A continuation of the present route structure after interchange modification would not be justified, unless two routings.and distribution patterns were instituted,
No. of new buses Annual Operating No. of buses required to maintain Capital Subsidy for New Implementation Using RBL recommended headways Costs* Revenue Service Date AM PM
25 24 $ $ $ September 1975
3) JOY ROAD EXPRESS
Two alternate routings were studied for the Joy Road Express which must continue down Michigan Avenue east of Trumbull:
1. Exit off of the Myrtle Avenue ramp, continue over the service road to Michigan, turn left and continue on Michigan inbound to Trumbull.
2. Stay on the exclusive bus lane to the interchange and then proceed on to the Jeffries-Fisher ramp that leads to the Fourteenth Street exit, and continue to Trumbull via the service road, south on Trumbull to Michigan and left onto Michigan.
Both of these routes are shown on Map VI-B-3, The comparable travel times and distances are shown below:
Route
TABLE VI-B-2
TRAVEL TIME FOR JOY ROAD ROUTE ALTERNATIVE (JEFFRIES FREEWAY-MYRTLE TO TRUMBULL-MICHIGAN)
Distance Travel Times
Time of Run Period: 7:30AM 7:45AM 8:00AM
Michigan Fisher
1.45 1.30
3' 30" 3 I 1011
3' 30" 3' 50"
The selected routing of the Joy Road Express is designated "1" on Map VI-B-3.
3 1 30" 4' 10"
The Joy Road Express would operate along Joy Road until it reached the entrance to the Jeffries Freeway. At that point it would enter the freeway and continue past Myrtle, the ramp leading to the Twelfth-Fourteenth Street exit from the Fisher freeway. From there it would follow the service road to Trumbull where it would turn southward to Michigan, continuing as at present.
-54-

The pr.imary consideration for Lis route was not the time diff,orence, but rather the greater ease of operation of route "1", rather than the alternative of cross:.ng three lanes of traffic to exit from the Myrtle ramp.
A total of 148 new riders were projected for this route, based on time savings estimatc·d for the Jeffries routing.
The projected ridership estimates for all new bus routes was derived from the market analysis conducted in Chapter V, as summarized in Table V-B"5. It is impo1'tant to note that the reference to higher express or Jeffries speeds includes' tatal time savings for new express routes, not· just the saving, if any, derived fl·om the reserved lane.
No. of buses Using RBL AM PM
15 12
No. of new buses required to maintain recmmnended head·
C. NEW EXPRESS SERVICE
Annual Operating Capital Subsidy for New Coo;ts Revenue Service __ _::.==-.;c.::.;:::=__
Implementation Date
September '75
The following are new express bus services that could be placed in service at short notice, given availability of new buses.
Livernois and Tireman Express
For each of these two new express bus lines, three routes were again studied, as shown on Map VI-C-1, and desribed as follows:
1. Exit from the Third Street ramp off the Fisher Freeway, travel southbound on Third to Fort.
2. Exit on the Fourteenth Street ramp from the Fisher Freeway to Trumbull, southbound to Fort, eastbound to Third,
3. Exit from the Myrtle ramp off the Jeffries freeway, southbound on the service road to Michigan, inbound to Trumbull, southbound to Fort and eastbound to Third.
Comparable travel times for the three alternatives routes are shown below:
TABLE VI-C-1
LIVERNOIS AND TIREMAN ROUTE ALTERNATIVE TRAVEL TIMES (GRAND RIVER-SCHAEFER TO FORT-THIRD)
Route Travel Times
Time of Run Period:
Grand River-Third Jeffries-Michigan-Trumbull-Fort Jeffries-Fisher-Trumbull-Fort Jeffries-Fisher-Third
7;30 AM
16 1 30" 15 I 35" 15 1 15" 14 1 35"
7:45 AM
16' 30" 15'25" 15'34" 15 1 15"
The recommended alternative for the rcutes arc as follows:
-55-
8:00 AM
16'30" 14 I 5011
15 I 3011
13 1 55"

JOY ROAD EXPRESS ROUTE ALTERNATIVE
1" = 1 MILE MAPVI-B-3
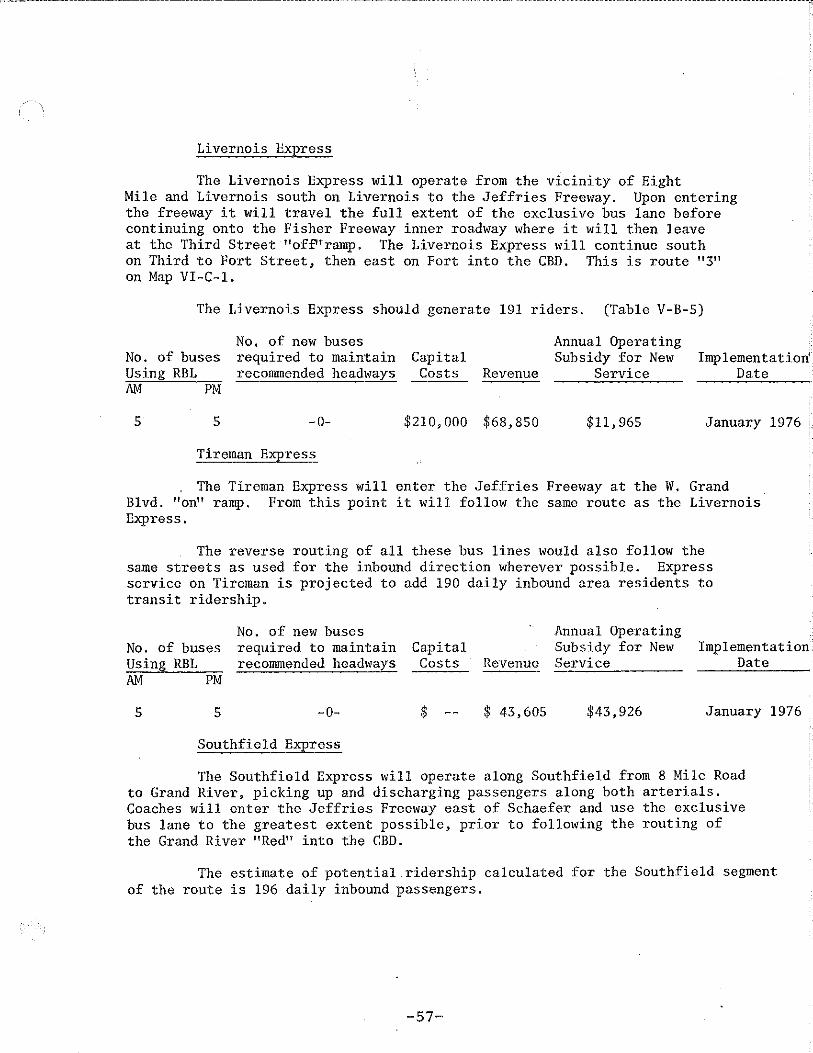
Livernois Express
The Livernois Express will operate from the vicinity of Eight Mile and Livernois south on Livernois to the Jeffries Freeway. Upon entering the freeway it will travel the full extent of the exclusive bus lane before continuing onto the Fisher Freeway inner roadway where it will then leave at the Third Street "off''ramp. The Livernois Express will continue south on Third to Fort Street, then east on Fort into the CBD. This is route "3" on Map VI-C-1.
The Livernois Express should generate 191 riders. (Table V-B-5)
No. of buses Using RBL
No. of new buses required to maintain recommended headways
Capital Costs Revenue
Annual Operating Subsidy for New
Service Implementation'
Date AM PM
5 5 -0- $210,000 $68,850 $11,965 January 1976
Tireman Express
The Tireman Express will enter the Jeffries Freeway at the W. Grand Blvd. "on" ramp. From this point it will follow the same route as the Livernois Express.
The reverse routing of all these bus lines would also follow the same streets as used for the inbound direction wherever possible. Express service on Tireman is projected to add 190 daily inbound area residents to transit ridership.
No. of buses Using RBL
No. of new buses required to maintain recommended headways
Capital Costs
Annual Operating Subsidy for New Service
Implementation. Revenue Date
AM PM
5 5 -0- $ $ 43,605 $43,926 January 1976
Southfield Express
The Southfield Express will operate along Southfield from 8 Mile Road to Grand River, picking up and discharging passengers along both arterials. Coaches will enter the Jeffries Freeway east of Schaefer and use the exclusive bus lane to the greatest extent possible, prior to following the routing of the Grand River "Red" into the CBD.
The estimate of potential.ridership calculated for the Southfield segment of the route is 196 daily inbound passengers.
-57-
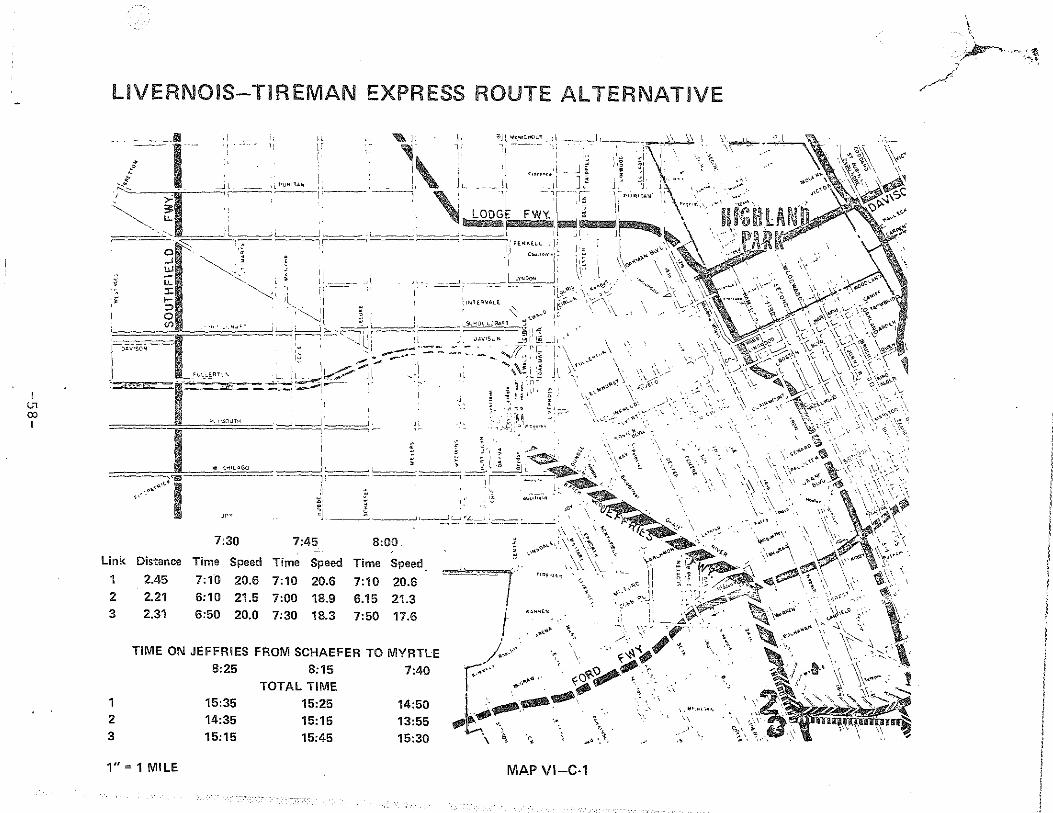
I Ul 00 I
LIVERNOIS-TIREMAN EXPRESS ROUTE ALTERNATIVE
link Distance Time Speed Time Speed Time Speed 1 2.45 7:10 20.6 7:10 20.6 7:10 20.6 2 2.21 6:10 21.5 7:00 18.9 6.15 21.3 3 2.31 6:50 20.0 7:30 18.3 7:50 17.6
TIME ON JEFFRIES FROM SCHAEFER TO MYRTLE 8:25 8:15 7:40
TOTAL TIME 1 15:35 15:25 14:50 2 14:35 15:15 13:55 3 15:15 15:45 15:30
1" = 1 MILE MAP VI-C-1
I
\ ' .~·
j { I ~ ;:
i i I
I I • i
{ l ' I I ~ . 1
i I
f :j i ! : l
I I I I I l I I

No. of buses Using RBL AM .. PM
5 5
No. of new buses required to maintain recommended head~ays
4
. D. EXPRESS ROUTES - OAKLAND COUNTY
Capital Costs
$ 280,000 $44,982
Annual Operating Subsidy for New
Service
$36,833
Implementation Date
Jan. 1976
In addition to the routes to be operated by D-DOT, SEMTA reviewed several new express bus routes to serve Oakland County residents (see Map V-B-2).
Schaefer
Originates at Schaefer and 10-Mile Road and follows Schaefer to Grand River, to the Jeffries Freeway, thence exiting at the Michigan/Mp:tle· exit the Jeffrie·, route would then follow Michigan Avenue into the CBD. The approximate time for a run has been estimated at 31 minutes.* Estimate of ridership potc;ntial
. for the route is 272 riders. ·
No. of buses Using RBL
No. of new buses required to maintain recommended headways
Capital Cost Revenue
Annual Operating Subsidy for New
Service Implementation
Date AM PM
5 5 3 $210,100 $84,226 January 1976
Greenfield (17.5 miles)
Originate at 12 Mile and Greenfield, via Greenfield to Grand River; Grand River to Jeffries, to Michigan-Myrtle exit; Michigan to Cadillac Square terminal area. The route was estimated to generate 90 riders, while the portion in Detroit if utilized, will add 169 riders. Revenue is computed at an average fare of 85 cents. The running time for this route was estimated at 39 minutes.*
No. of new buses Annual Operating No. of buses required to maintain Capital Subsidy for New Implementation Using RBL recommended headways Costs* Revenue Service Date -----AM PM
6 6 5 $350,000 $105,672 $34,891 Sept. 1975
*Speed runs conducted November 22, 1974
-59-
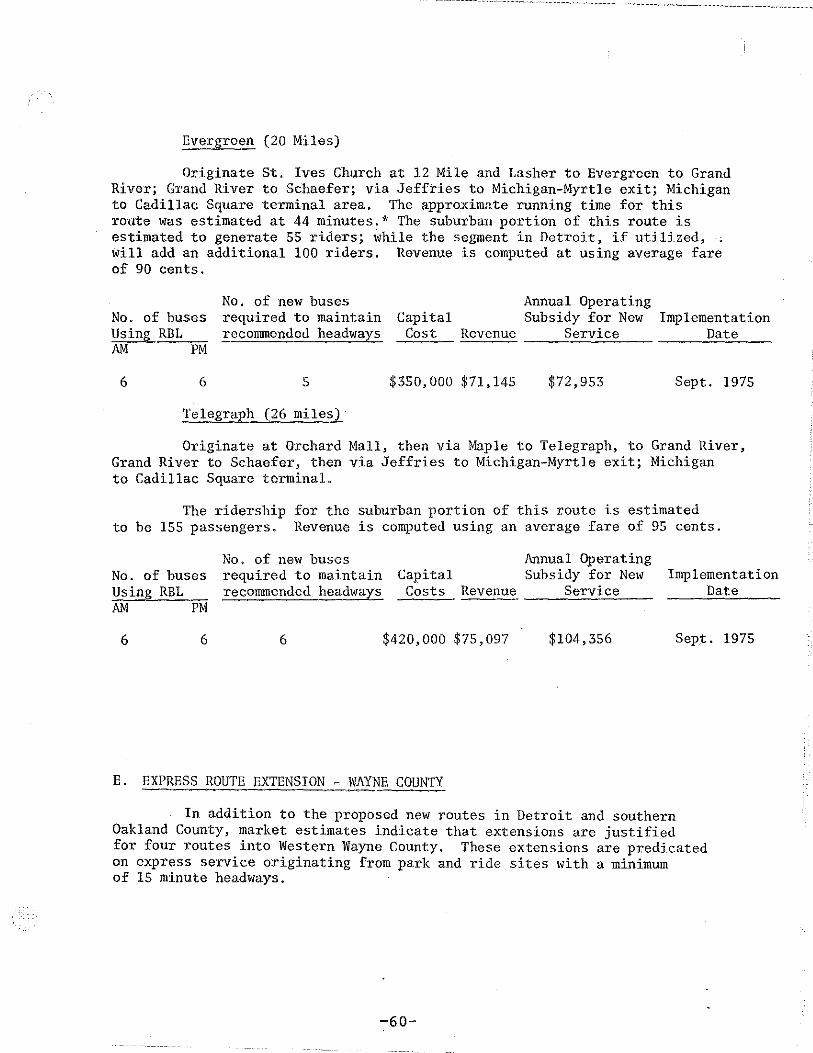
Evergreen {20 Miles)
Originate St. Ives Church at 12 Mile and Lasher to Evergreen to Grand River; Grand River to Schaefer; via Jeffries to Michigan-Myrtle exit; Michigan to Cadillac Square terminal area. The approximate running time for this route was estimated at 44 minutes.* The suburban portion of this route is estimated to generate 55 riders; while the segment in Detroit, if utilized, • will add an additional 100 riders. Revenue is computed at using average fare of 90 cents.
No, of new buses Annual Operating No. of buses required to maintain Capital Subsidy for New Implementation Usin!l RBL recommended headwars Cost Revenue Service Date AM PM
6 6 5 $350,000 $71,145 $72,953 Sept. 1975
Telegraph (26 miles)
Originate at Orchard Mall, then via Maple to Telegraph, to Grand River, Grand River to Sehaefer, then via Jeffries to Michigan-Myrtle e:xit; Michigan to Cadillac Square terminal.
The ridership for the suburban portion of this route is estimated to be 155 passengers. Revenue is computed using an average fare of 95 cents.
No. of buses Using RBL AM PM
6 6
No. of new buses required to maintain recommended headwars
6
Annual Operating Capital Subsidy for New Costs Revenue ----~S~er~v~l~·c~e~---
$420,000 $75,097 $104,356
E. EXPRESS ROUTE EXTENSION - WAYNE COUNTY
Implementation Date
In addition to the proposed new routes in Detroit and southern Oakland County, market estimates indicate that extensions are justified for four routes into Western Wayne County. These extensions are predicated on express service originating from park and ride sites with a minimum of 15 minute headways.
-60-

1. Grand River
The proposed terminus is in Oakland County, though most of the route is in Wayne County. It is proposed to extend the route from its current terminus at Grand River and Farmington Road to Grand River and Halsted Road. Approximate running time for express service would be 46 minutes to Detroit's CBD. Ridership potential for this route segment area is estimated at 236 one-way riders. Adequate park and ride facilities accessible to I-96 and I-696 might generate further ridership from Livingston County and Western Oakland County commuters.
2. Second
Extend the route beyond its current terminus at Middlebelt Road, to Seven Mile and Novi Road in Northville. The proposed route would be Seven Mile to Newberg Road; south on Newberg to McNichols, east·on McNichols to Grand River, to the Jeffries, via Jeffries to the Michigan/Myrtle exit, and then Michigan Avenue to Detroit's CBD. Approximate running time would be 50 minutes. Ridership for the route extension is estimated at 90 riders, though the park and ride facilities might generate additional riders from beyond the study area.
3. Fenkell
Extend route beyond its current terminus at Farmington Road to Haggerty Road. Proposed route originates at Five Mile Road and Haggerty and follows Five Mile to Grand River; southeast on Grand River to the Jeffries; exiting at the Michigan/Myrtle exit; and to the CBD as above. Approximate express running time was estimated at 43 minutes. A.total of 114 new inbound riders were estimated to be generated by this extension.
4. Plymouth
Retain current terminus, but maintain 15 minute headways. Run originates at Sheldon Road and Ann Arbor Trail and follows Ann Arbor Trail to Plymouth; Plymouth to Grand River and then via the Jeffries; exiting at the Michigan/Myrtle exit, as above. Approximate running time is 57 minutes. The suburban portion of this route is estimated to generate 92 additional riders.

-- ----~-----------~-------------------~--------·------------~----- --~ ------------------- --
F. SERVICE SUMMARY
On the basis of data derived from analysis of potential and existing transit service areas, plus projected ridership estimates for new and modified routes it is recommended that eleven routes utilize the reserved lane. As discussed above, SEMTA will operate three of the routes originating in Oakland County and terminating in the CBD: Evergreen, Telegraph, and Greenfield. Further discussion with officials of D-DOT and the City of Detroit will be held to determine the feasibility of SEMTA buses handling limited passenger loadings for these routes within Detroit.
TABLE VI-F-1
D-DOT JEFFRIES SERVICE RECOMMENDATION (PHASE ONE)
No. of new buses Annual Operating No. of buses required to maintain Capital Subsidy for New
Line Using RBL recommended headways Costs Revenue Service AM PM
Grand River 23 20 $ $ $ Imperial 25 24 Joy Road 15 12 Tireman 5 5 0 43,605 43,926 Livernois 5 5 3 210,000 68,850 11' 965 Schaefer 5 5 3 210,000 84,226 12,863(+) Southfield 5 5 4 280,000 44,982 36,833 Schoolcraft 5 5 4 280,000 23,409 61,186
D-DOT TOTAL 88 81 14 $980,000 $275' 072 $141,047
( +) Profit TABLE VI-F-2
SEMTA JEFFRIES SERVICE RECOMMENDATION (PHASE ONE)
No. of new buses Annual Operating No. of buses required to maintain Capital Subsidy for New
Line Using RBL recommended headways Costs * Revenue Service AM PM
Greenfield 6 6 5 $ 350,000 $105,672 $ 34,891 Evergreen 6 6 5 350,000 71,145 72,953 Telegraph 6 6 6 420,000 75' 097 104,356
SEMTA TOTAL 18 18 16 $1,120,000 $251,914 $212,200
*Capital acquisition assumes a 1976. cost of $70,000 per bus.
-62-
fil
!--
j:

Bus Line -
Number Of Busses Entrance
Between 6:45-9:10 am Ramo
Imperial \'lyoming
25
Grand River Grand River
23
'
Joy Joy
15
Livernois Livernois
5
Schoolcraft Hyoming
5
-H·. Chicago Livernois
3
I
TABLE VI-F=3
JEFFRIES EXCLUSIVE BUS LANE INFO~~TION OPENED HEEIT TO SCHAEFER
INBOUND
Enters Enters Bus Leaves Bus Exit Freewav Lane Lane Ramo**
2500' 482 4000' West of Ford E. of 2500' Warren Fwy.
Wyoming Eo of Wyoming Warren
1200' 398 4000' Wo l. G:r. E. of 2500' of Blvd, Grand E. of W. Gr. Blvd. River Wyoming
1000' 589' Gr. River Wisher* E. of I 3400' R.R. Joy E. of Crossing
Joy
1200' 567 Gr, River !Fisher E. of 3600 E. I R.R.
Livernois of Livernois Crossing
2500' 2sOO' Gr. l<iver ~isher E. of E. of R.R.
Hyoming viyoming Crossing
1200' ~gJo• Gr. River Fisher E. of E. of R.R.
Livernois Livernois Crossing
FLeaves At reeway Station**
200' W. of
1700' Wo of W.
Gr. Blvd,
600' South
ef :Hyrtle
600' South
of 1'-lyrtle
600' South
of Hyrtle
600' South
of :Hyrtle
Distance of Bus Lana :!fules
3o 10
2.00
2 0 10
2,55
4.35
2,55
1 of 2
I Distance j Changing ' LB.nes
Miles
.45
.45
o45
.45
0
,45
i I I ' ! I ' ' ' ' ! ' /
! !
i
I i I I
I I i i
I '
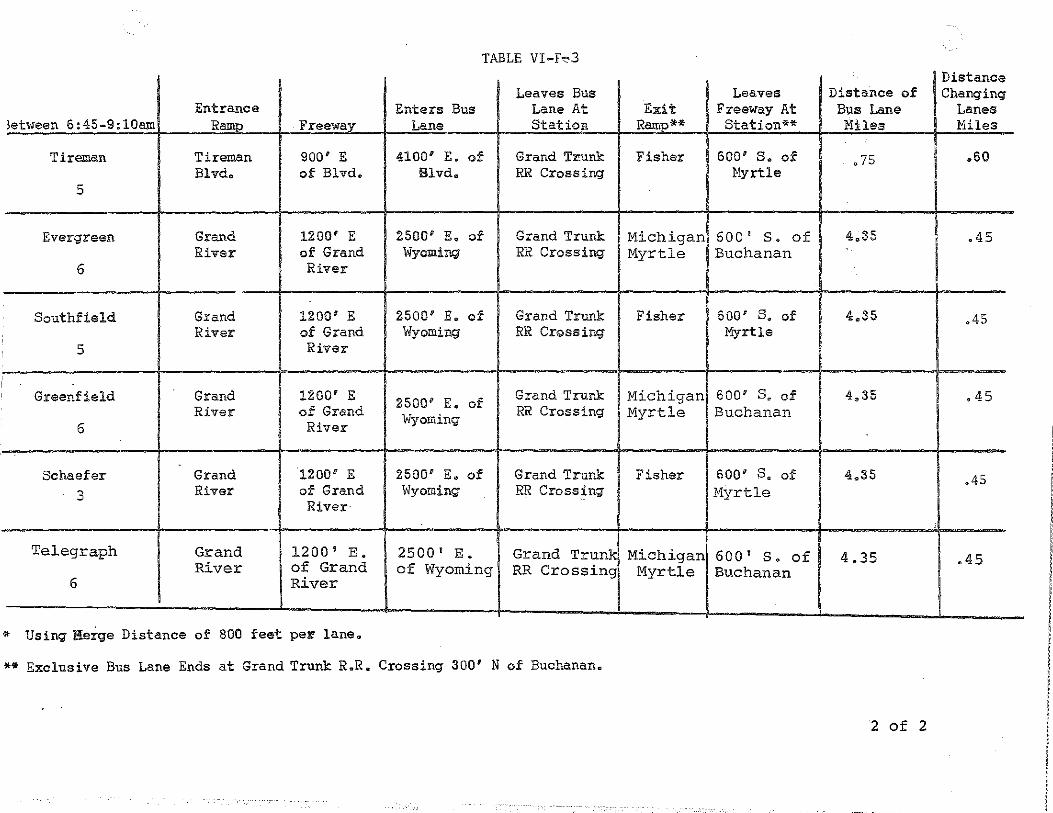
TABLE VI-F,.3
Leaves Bus Entrance Enters Bus Lane At
letween 6:45-9:10am Ramp Freeway Lane Station
Tireman Tireman 900' E 4100' E. of Grand Trunk Blvd. of Blvd. Blvd. RR Crossing
5
Evergreen Grand 1200' E 2500' E. of Grand Trunk River of Grand Wyomi:nq RR Crossing
6 River
Southfield Grand 1200' E 2500' E. of Grand Trunk River of Grand Wyoming RR Crossing
5 River
' Greenfield Grand 1200' E 2500' E. of Grand Trunk River of Grand Wyorrdng RR Crossing
6 River
' Schaefer Grand 1200' E 2500' E. of Grand Trunk
3 River of Grand Wyoming RR Crossing River·
Telegraph Grand 1200' E. 2500' E. Grand Trunk River of Grand of Wyoming RR Crossing
6 River
* Using Kerge Distance of BOO feet pe~ lane.
** Exclusive Bus Lane Ends at Grand Trunk R.R. Crossing 300' N of Buchanan.
Leaves Distance of Exit Freeway At Bus Lane
Ramp*" Station** Miles
Fisher 600' s. of .75 Myrtle
1 Michigan 600' s. of 4 0 35 Myrtle Buchanan
Fisher 600' s. of 4.35 Myrtle
Michigan 600' S. of 4,35 Myrtle Buchanan
Fisher 600' s. of 4.35 Myrtle
Michigan 600' s. of 4.35 Myrtle Buchanan
2 of 2
1s ance Changing
Lanes i Miles
I .60
l .45
.45
.45
.45
.45
l l : I
1 ! I ! ! l '
r
! I ! ' I I I '~ I ~ ' ~ 1 I
I ' I I
! i : • :
I l
·A

Implementation of routes recommended for the first section of the Jeffries reserved lane project will be staged to reflect the availability of equipment and the need to provide service to areas currently without service. The eleven routes will be implemented in three phases:
(1) Routes not requiring new equipment will receive priority in the implementation program. These are Grand River, Imperial, Joy Road and Tireman.
(2) Routes in new service areas are second priority and will be implemented as equipment is made available under FY 76 Capital Grants.
(3) Routes in existing service areas requiring new equipment will be implemented last, or possibly will be implemented with existing equipment and reduced headways.
All routes will utilize the reserved lane to the maximum extent possible except in those instances where use of the lane is determined to existing riders, or causes delays greater than those currently experienced in surface routes.
This report recommends that physical improvements to the I-75, I-96 interchange as detailed in Chapter VIII of this report be implemented to allow for routing of the reserved lane directly into the CBD.
The staged implementation program would be:
I
II
III
Line
Grand River Imperial Joy Road Tireman Schoolc:raft
Telegraph Evergreen Greenfield
Livernois Schaefer Southfield
Possible Date of
September September September September Septel)lber
September September September
January 1, January 1, January 1,
Implementation
1, 1975 1, 1975 1, 1975 1, 1975 1, 1975
1, 1975 1, 1975 1, 1975
1976 1976 1976
The Michigan Department of State Highways and Transportation estimates that the next section of I-96 to be opened to the public will be that portion from Schaefer, the current terminus_, west to the Southfield Freeway (M-39). Completion date is projected to be September, 1976. _ At that time a number of routes (Greenfield, Southfield, Evergreen and Telegraph) would be rerouted to take advantage of the larger segment of the reserved lane. Similarily, routes into Western Wayne County (Fenkell, Second, and Plymouth), and the
-65-
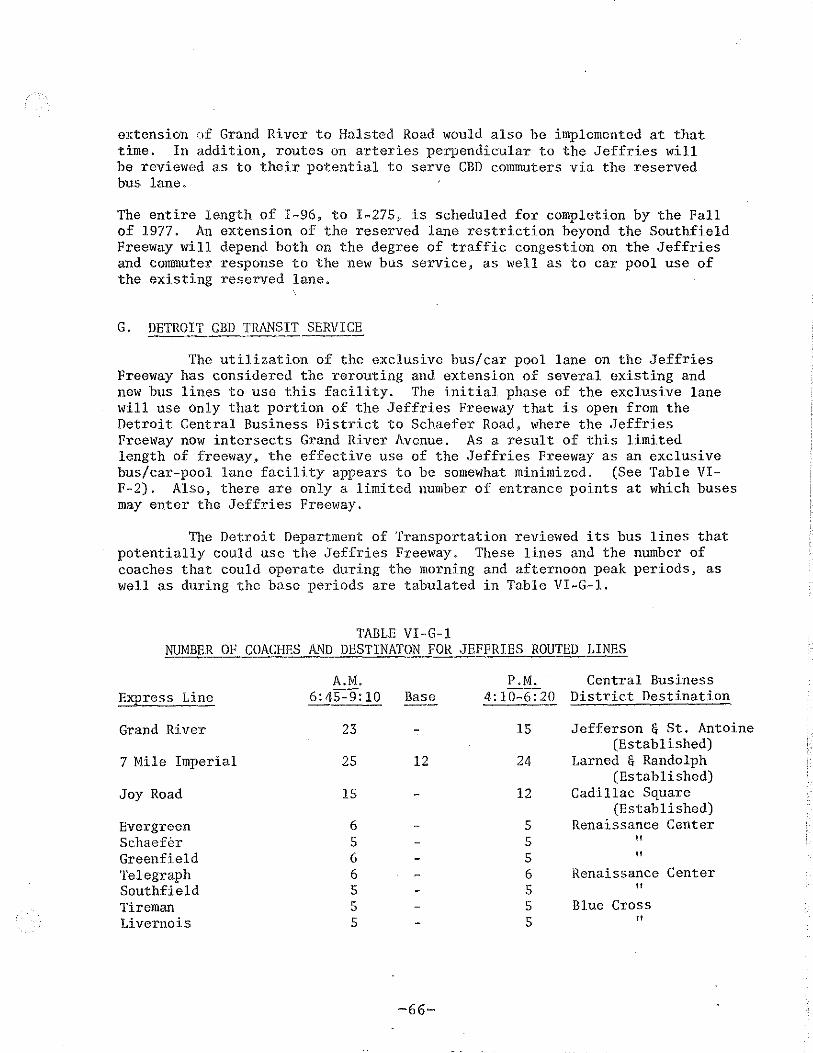
extension of Grand River to Halsted Road would also be implemented at that time. In addition, routes on arteries perpendicular to the Jeffries will be reviewed as to their potential to serve CBD commuters via the reserved bus lane.
The entire length of I-96, to l-275, is scheduled for completion by the Fall of 1977. An extension of the reserved lane restriction beyond the Southfield Freeway will depend both on the degree of traffic congestion on the Jeffries and commuter response to the new bus service, as well as to car pool use of the existing reserved lane.
G. DETROIT GBD TRANSIT SERVICE
The utilization of the exclusive bus/car pool lane on the Jeffries Freeway has considered the rerouting and extension of several existing and new bus lines to use this facility. The initial phase of the exclusive lane will use only that portion of the Jeffries Freeway that is open from the Detroit Central Business District to Schaefer Road, where the Jeffries Freeway now intersects Grand River Avenue. As a result of this limited length of freeway, the effective use of the Jeffries Freeway as an exclusive bus/car-pool lane facility appears to be somewhat minimized. (See Table VIF-2). Also, there are only a limited number of entrance points at which buses may enter the Jeffries Freeway.
The Detroit Department of Transportation reviewed its bus lines that potentially could use the Jeffries Freeway. These lines and the number of coaches that could operate during the morning and afternoon peak periods, as well as during the base periods are tabulated in Table VI-G-1.
TABLE VI-G-1 NUMBER OF COACHES ~~D DESTINATON FOR JEFFRIES ROUTED LINES
Express Line
Grand River
7 Mi 1 e Imperial
Joy Road
Evergreen Schaefer Greenfield Telegraph Southfield Tireman Livernois
A.M. 6:45-9:10
23
25
15
6 5 6 6 5 5 5
Base
12
-66-
P.M. 4:10-6:20
15
24
12
5 5 5 6 5 5 5
Central Business District Destination
Jefferson & St. Antoine (Established)
Larned & Randolph (Established)
Cadillac Square (Established)
Renaissance Center " 11
Renaissance Center 11
Blue Cross "

The proposed routing of buses through the CBD depended upon whether the bus service was new or already existing (see Map VI··G-1).
Three existing express bus lines (Grand River "Red" Express, Seven Mile Imperial, and Joy Road Express) will use portions of the Jeffries bus lane. In each case, buses to operate over each line will make its first CBD stop as at present. This was necessary to provide continuity in transit patterns for existing patronage. The existing stops serve many passengers, nnd to change them could reduce current patronage levels. At the same time it was also recognized that some other portions of the CBD are not adequately serviced by express bus operations. Thus, the new bus lines will provide service beyond established travel corridors which presently connect the northwest part of Detroit and the CBD.
The proposed CBD routing of the Livernois and Tireman lines, (as well as re-routed bus service) is shown on Map VI-G-1. The new bus li11e will proceed from Fort and Third, eastward on Fort to Cadillac Square, then via Randolph, Larned, and the Northbound Chrysler Freeway service drive. The line will continue north to Lafayette, then to the southbound Chrysler service drive and the Blue Cross Building. The afternoon layover point for the return outbound trip will be on the southbound service road next to the Blue Cross Building. The reverse direction flow will be: Chrysler southbound service drive to Congress, to Randolph, to Cadillac Square and then to Fort Street. The bus will then follow Fort to Second, proceed north on Third, crossing Michigan to Bagley, where they will then return to Second and continue northward to the westbound Fisher service drive. At this point the afternoon peak hour express buses will enter the westbound Fisher Freeway and proceed onto the Jeffries Freeway.
The Southfield and Schaefer routes will follow the Grand River "Red" Express routing and layover points, as these essentially correspond to the Grand River "Red" CBD routing.
The Plymouth and Fenkell routes will retain their current CBD routing and layover points, as these essentially correspond to the Grand River "Red" CBD routing.
The Evergreen, Greenfield, and Telegraph routes are planned to exit at Michigan-Myrtle, and travel via Michigan to Griswold, then south to Fort Street. Layover points have not yet been determined, but coaches are expected to cross Woodward Avenue. PM returns will be the reverse of the AM route.
The CBD corridors selected for Jeffries oriented service provide maximum accessibility to downtown employment centers. (See Map VI-G-2)
An analysis of TALUS 1968-1990 CBD employment yielded information concerning distribution of Detroit's projected 1978 CBD population of 125,000*, which was used to plan for optimal bus routing.
The route currently utilized by the Grand River Express (Grand River to Cass, to State, to Griswold, to Larned, to Beaubien, to Jefferson), offers
*For the purposes of this analysis the projected 1978 Renaissance Center employment level of approximately 10,000 persons was not included.
-67-
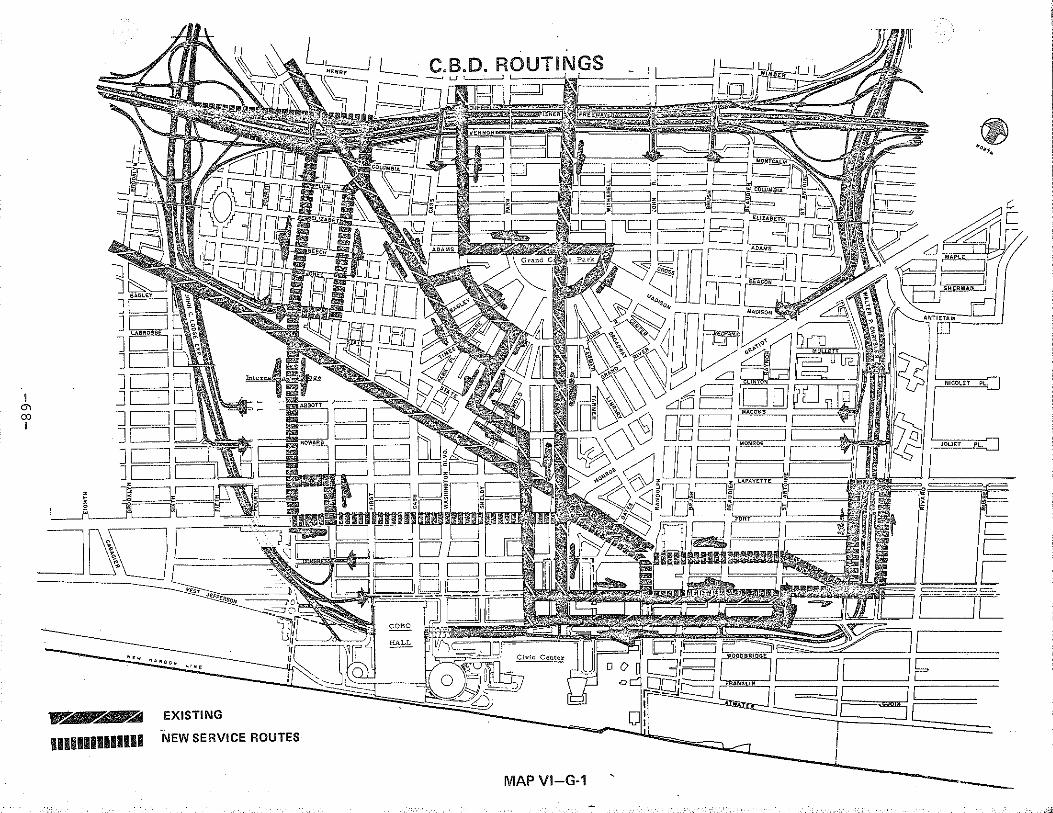
I 0'\ 00 I
- 1!i'iii1 EXISTING
MAP VI-G-1 '

I
"' "' I
EMPLOYMENT ACCESSIBILITY BY ROUTE
-~--..
-DETROIT RIVER -
MAPVI-G-2 ----
BEIIIDIIlllll&l!!!lllll~ Fort Corridor .D'Lf!'HHII Michigan Corridor
Woodward Corridor
:·. -- -- -- -·.;-r,o:

the highest degree of accessibility for CBD employees.· The only area of employee concentration in the CBD more than 800 feet from this route is the northeast section near Gratiot and I-75 (Detroit General Hospital and Recorder's Court Building). Approximately 100,000 employees have access to this route, which currently terminates at Jefferson, across from the Renaissance Center developments.
Other D-DOT routes utilizing the Grand·River Corridor offer similarly high accessability for employees. The Plymouth Express, via Grand River, is within the 800 foot range of 89,000 commuters. The fact that this route does not cross Woodward Avenue, but rather circles the Michigan Gas Company, at Griswold and Jefferson, accounts for the lower accessibility.
Routes utilizing Michigan Avenue and terminating at the Cadillac Square Building are accessible to 81,000 employees. This route is less accessible than the Grand River Corridor for commuters to the Grand Circus Park area and to the Blue Cross-Blue Shield building. This routing could be improved by having Michigan coaches turn south on either Griswold, Woodward, or Brush, and operates east via Larned to Beaubien.
Coaches bisecting the CBD via Woodward are accessible to only 87,700 commuters. Employees of the Edison Company, I.R. S. and the soon to be completed McNamara Federal Office Building are beyond the 800 foot circle. The Hamilton, Fenkell, Second (local) and the Imperial Express routes enter·the CBD via Woodward. The Second Express operates on I~75 to Lafayette. The segment from Lafayette to Cadillac Square offers tne least accessibility (15,709).
The other route variation is utilized by Joy coaches; Lafayette, to Cass, to Fort to Cadillac Square, serving 79,500 persons. Of course, the 800 foot distance has been arbitrarily selected, as an indicator of excellent access distance. Were the "normal" yardstick of 1,500 feet to be used, virtually 100 percent of CBD employment would be within walking distance of each route. To stay within the 800 foot radious boundary however, buses are planned to be routed via Grand River and Michigan wherever possible.
The possibility of exclusive or reserved bus lanes in the Central Business District was also reviewed. Several streets that are now being used by bus routes planned for Jeffries service were investigated for their possible use as reserved lanes for exclusive bus operation, including Woodward Avenue, Michigan and Fort. After the review, it was determined that the benefits derived from an exclusive bus lane on surface streets in downtown Detroit would not be practicle or worthwhile. With present traffic volumes, traffic movement on these CBD streets now moves well. The use of an exclusive bus lane would unnecessarily restrict traffic operation and would not significantly improve transit movement service in the CBD, including
-70-

express buses, serve all coach stops. For these reasons no exclusive bus lanes are recommended. for the Central Business District.
As mentioned above, all service·entering the CBD from the Jeffries bus lane will use established bus stops. Some additional signing will be necessary to indicate the discharge and pick-up locations for the new express bus service, This work should commence prior to initiating the new service.
-71-
! .
, I
. j
I
i I . I

POTENTIAL PARK AND RIDE SITES
FARMINGTO
196
(.&:) IIR
POTENTIAL
1:125,000
2 1 0 2 .O.nn .4rhM \~.
MAPVII-B-1 asemTa

VII - PARK AND RIDE
A. EXISTING CONDITIONS
The region's main railroad commuter service provides the best example of traditional park and ride serviceo Approximately 750 spaces are provided at eight Grand Trunk Western railroad stations in Oakland County, with expansion slated for the near futureo
Until recently there was only one park and ride site in Southeast Michigan specifically associated with bus serviceo A parking lot, on the western boundary of Detroit's CBD, includes a pass permitting use of a shuttle bus loop through the downtown area in the monthly rental feeo
With no other formal park and ride lots available, some commuters have resorted to parking on streets (where allowable), near bus stops, or in some cases, using parking areas adjacent to regional shopping centerso In the latter case, uniformed security guards either prohibit parking .on the lots, or direct the bus riders to park their vehicles at the fringe of the parking areao
During 1973 and 1974, SEMTA inaugurated a series of premium fare express bus services, known as "DASH" runs, connecting residential districts with major employment centers, not all in Detroit's CBDo A key element of the 12 DASH services currently in operation has been the provision of free parking spaces for riders at church, school, and ~hopping center lotso
B, SITE ALTERNATIVES
A list of probable park and ride sites was compiled for possible use within the Jeffries service area, as follows:
(1) Sites were reviewed using Sanborn maps, with field surveys made afterwardso Review of the potential for park and ride sites within Detroit was confined to the Grand River/Jeffries Corridor. (See Map VII-B-1)
(2) The selection of park and ride lots included consideration of several factors:
a. proximity to bus lines which will use the Jeffries freeway.
bo availability of parking spaces during the daytime hours.
c. convenience of lots, and access and exit characteristicso
do security of vehicle and lot user.
-73-
I~

The availability of the park and ride lots was not determined" Property owners will be contacted during the initial phase of implementation of the Jeffries reserved lane.
Table VII-B-1 lists possible park 1md ride locations within Detroit.
(3) Oakland County potential park and ride sites were reviewed along five major arterials, as shown in Table VII-B-2,
( 4) Potential park and ride locations have been plotted on Map VII-B-1, A review of the sites indicates tha.t there are more locations shown than would be necessary. Therefore, the most preferred lots of this group were identified in accordance to their adaptability to transit use, and geographic location" In the event that these lots are not available, other alternative lots from the list would be selected.
C. COST
In both the Detroit and suburban areas, no recommendations for specific park and ride sites have been set forth, as mentioned above. It is anticipated that during the implementation process contacts with lot owners will be made. Thus, no operating or rental costs have been calculated for use of privately owned lots for Jeffries parking spaces. Current SEMTA policy is to solicit use of lots on a rent free basis and assist in defraying the cost of maintenance and snow clearance of that portion of the lot used by transit patrons.
Not previously discussed has been the concept of land purchase, either by SEMTA or the Highway Department" This option will be explored during the implementation stage of the project, thus making specific costing calculations difficult to develop at this time" If negotiations fail to develop free use of existing lots for park and ride service, SEMTA and MDSH&T will have to consider purchase of land for park and ride lots"
-74-

!:"~
TABLE VII-B-1
POTENTIAL DETROIT PARK AND RIDE LOCATIONS Number
Number Spaces Location Owner Spaces Lighting Available (Est)
1. 6 Mile-Lodge Detroit Bank & Trust 50 No 10
2. Outer Drive-Lodge Church 80 No 50
3, Puritan-Lodge Top Hat 35 Yes 20
4. Greenfield-N of 7 Mile Seven-Green Shopping Center 300 Yes 200
5. Evergreen··7 Mile Seven-Evergreen 600 Yes 200
6. Grand River-N of 7 Mile Shopping Center
7. 7 Mile-W of Berg 100 No 100
8. Grand River-Greenfield Federal's 200 Yes 3Dr
9. Schoolcraft-Memorial Methodist Church 150 No 100
10. Schoolcraft-Telegraph Shopping Center Yes 40
11. Plymouth-Burt Bretton Pool-Rouge Park No 100
12. Plymouth-Evergreen Plymouth-Evergreen Shopping Center 1000 No 700
13, Plymouth-Southfield K-Mart 1000 Yes 20-100
14, Plymouth-Schaefer American Motors No 100
15. Chicago-Greenfield Shopping Center No 30
16. Joy-Greenfield Shopping Center 800 Yes 100
17. Schaefer-S of Grand River No 100
18. Schaefer-Lyndon No 100
19. Schaefer.6 Mile Shopping Center Yes 300
20. Livernois-8 Mile Yes 200
21. Livernois-7 Mile Municipal Parking Authority Yes 200
-75-

TABLE VII-B-2
POTEN'l'IA.L PARK AND RIDE SITES BY ROUTE (OAKLAND COUNTY)
Parking Spaces Location (EST) Lighting
Coolidge/Schaefer
22. Nine Mile/Coolidge (South)
23. Nine Mile/Coolidge (North)
24. McClain/Coolidge
25. Allan/Coolidge
26. Ten Mile/Coolidge
27. Harvard/Coolidge •
28. Oak Park Blvd./1/2 Mile West of Coolidge
(currently being used by DASH)
Greenfield
400
180
325
80
200
225
165
29. Eight Mile/Greenfield 1,500
30. Eight Mile/Greenfield 10,000
31. James Street/Greenfield 250
32. Providence Dr./Greenfield 800
33. Lincoln Dr./Greenfield 700
34. Oxford/Greenfield 35
35. Oxford/Greenfield 50
36. Nine Mile/Greenfield
Yes
Yes
Yes
Yes
Yes
No
Yes
Yes
Yes
Yes
Yes
Yes
No
No
No
-76-
Owner
Oak Park Center
Oak Park Plaza (rear)
Oak Park Lanes & Frank's Nursery
Young Israel
Dexter-Davison Plaza
Our Lady of LaSalette Hall, School & Church
Oak Park Community Ctr.
Green-8 Shopping Ctr.
Northland
Kodak Building
Americana Theatre
Lincoln Center
Greenfield Presbyterian Church
Greenfield Church of Christ
Vacant Property
1 of 2
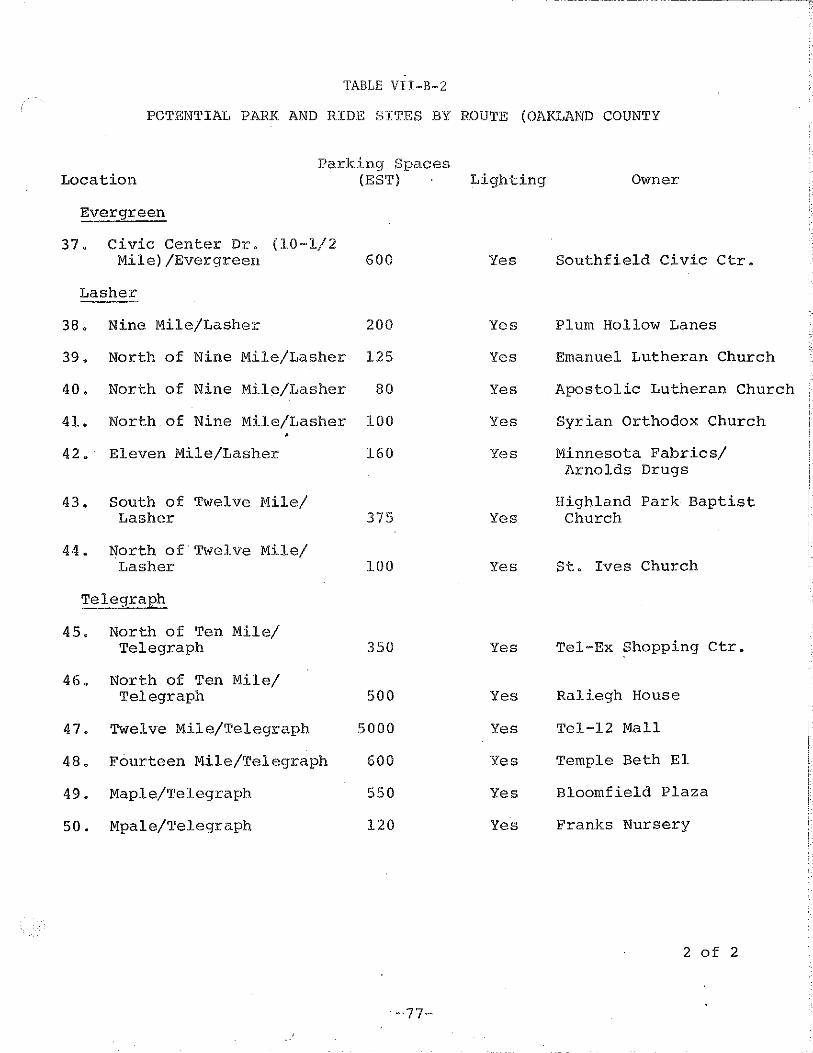
TABLE VII-B-2
POTENTIAL PARK AND RIDE SITES BY ROUTE (OAKLAND COUNTY
Parking Spaces Location
Evergreen
37. Civic Center Dr. (10-1/2 Mile)/Evergreen
Lasher
38. Nine Mile/Lasher
39. North of Nine Mile/Lasher
40. North of Nine Mile/Lasher
41. North of Nine Mile/Lasher •
42. Eleven Mile/Lasher
43. South of Twelve Mile/ LashE~r
44. North of Twelve Mile/ Lasher
Telegraph
4 5. North of Ten Mile/ Telegraph
46. North of Ten Mile/ Telegraph
47. Twelve Mile/Telegraph
48. Fourteen Mile/Telegraph
49. Maple/Telegraph
50. Mpale/Telegraph
(EST) Lighting Owner
600
200
125
80
100
160
375
100
350
500
5000
600
550
120
Yes Southfield Civic Ctr.
Yes Plum Hollow Lanes
Yes Emanuel Lutheran Church
Yes Apostolic Lutheran Church
Yes Syrian Orthodox Church
Yes Minnesota Fabrics/
Yes
Yes
Yes
Yes
Yes
Yes
Yes
Yes
Arnolds Drugs
Highland Park Baptist Church
St. Ives Church
Tel-Ex Shopping Ctr.
Raliegh House
Tel-12 Mall
Temple Beth El
Bloomfield Plaza
Franks Nursery
2 of 2
VIII - TRAFFIC CONTROL -···-·-----
A. SIGNING AND PAVEMENT MARKING
The success of the reserved bus lane is to a very large measure dependent upon traffic restrictions being self enforcing. Signing and pavement markings will be the major information source for motorists. The effectiveness of these devices will determine if this form of joint transit-ear pool reserved lane use is viable.
Because of its importance, considerable effort was put into this phase of the project. The signing relies heavily on the symbol of a bus and a vehicle occupied by three persons, combined with the "GREEN LANE" theme denoting speed or the "go" characteristic of the lane. The reserved lane will be delineated from non-exclusive lanes by a six-inch, solid white line and by crystal raised pavement markers at 50 foot intervals. A normal four inch, solid yellow line will mark the median side of the lane. Placed every 750 feet in the center of the reserved lanes will be a 2 .. foot by 12 foot diamond shaped symbol formed by six-inch white lines. (See Figure VIII-A-1). This symbol has been approved by the Federal Highway Administration for use on all exclusive bus lanes. Permission to experiment with these distinctive signs and markings has been received from the National Advisory Committee.
1. The Symbols
The United States is moving toward an international system of traffic control devices, which emphasizes pictures and syniliolic signs rather than written messages. Therefore, it was decided that the signing for the Jeffries reserved lane should be developed with the understanding that the message be carried primarily by symbols rather than words.
At the present time, national symbols have been adopted for trucks, airplanes, and even snowmobiles, but not for public transit vehicles. Because the Jeffries reserved lane will be used by buses, a vehicle symbol was designed that would quickly and unmistakably be identified as a bus. Specifications, photographs and drawings from several bus manufacturers were studied before a bus symbol was created. The result is the symbol shown in Figure VIII-A-2. This symbol, which includes a bus operator, parallels the simplistic style of other nationally accepted vehicle symbols. It will be easily recognized, and clearly conveys the message of the lanes restricted.
The Jeffries reserved lane is not intended to be limited to bus use only. It was decided that any vehicle occupied by three or more people could travel in the reserved lane, thus encouraging the formation of car pools for home to work trips. During the peak hours, the average occupancy of an automobile in Detroit is only 1.6 persons. A significant increase in the number of vehicles occupied by three or more people will serve to reduce traffic volume and the level of congestion.
Although trucks and other vehicles such as campers, and vans also occupied by three or more people, will not be bannc)d by ordinance from the reserved lane, the majority of vehicular traffic w:ll be private automobiles.
-78-

Therefore, the automobile was selected as the vehicle symbol to convey the message, "a vehicle occupied by three or more people." The symbol, show~ in Figure VIII-A-3, represents a typical up-to-date passenger car. Three f1gures are clearly shown inside the automobile.
These two symbols, the bus, and the automobile with three occupants, are used together on the sign shown in Figure VIII-A-4. This sign displayed prominently over the reserved lane will inform the Jeffries Freeway driver of exactly who is eligible to use the lane.
2, The "Green Lane" Lettering
As previously outlined, the theme "GREEN LANE" was chosen to characterize the Jeffries reserved lane. This theme will appear throughout the entire public information program. The words "GREEN LANE" will appear on freeway signs to coordinate them with the advertising campaign.
The freeway scene is already a myriad of destination, directional, and regulatory signs. Therefore, while conforming to the standards set forth in the Manual on Uniform Traffic Control Devices, the "GREEN LANE" signs should be distinct. As mentioned.earlier, one reason the term "GREEN LANE" was chosen was because in traffic "GREEN" denotes "GO." The advantage of the reserved lane is that by using it one can "go faster" by avoiding the congestion in other lanes.
The best way to visually depict this message on a freeway sign is with stylized lettering. The problem is to find a type of lettering which creates the illusion of motion and yet which is highly legible at freeway speeds. After researching and testing nearly one thousand types of stylized lettering, the decision was made to use the type illustrated in Figure VIII-A-S. The fact that the lettering is Italic, gives the sense of motion desired: The use of upper and lower case letters makes the message easily readable.
3, Color
In keeping with national standards for freeway directional guidance signs, as well as conveying the "GREEN LANE" theme, the freeway signs for the Jeffries reserved lane will be primarily green and white.
Since these signs are also regulatory signs, the word messages with the exception of "GREEN LANE" will appear in black on white in compliance with the Manual on Uniform Traffic Control Devices.
4. Word Messages
The Jeffries Freeway reserved lane project is unique. Therefore, none of the standard wordings shown in the Manual as sign legends are applicable. Because of the limited space and reading time available for a freeway sign, the challenge was to convey a rather complicated message as briefly as possible.
The initial concept was to reserve a lane for car pools as well as buses. The term "car pool" became controversial in that the lane was not restricted to car pools in the strict dictionary sense of the word. Usually, a car pool is defined as
-79-
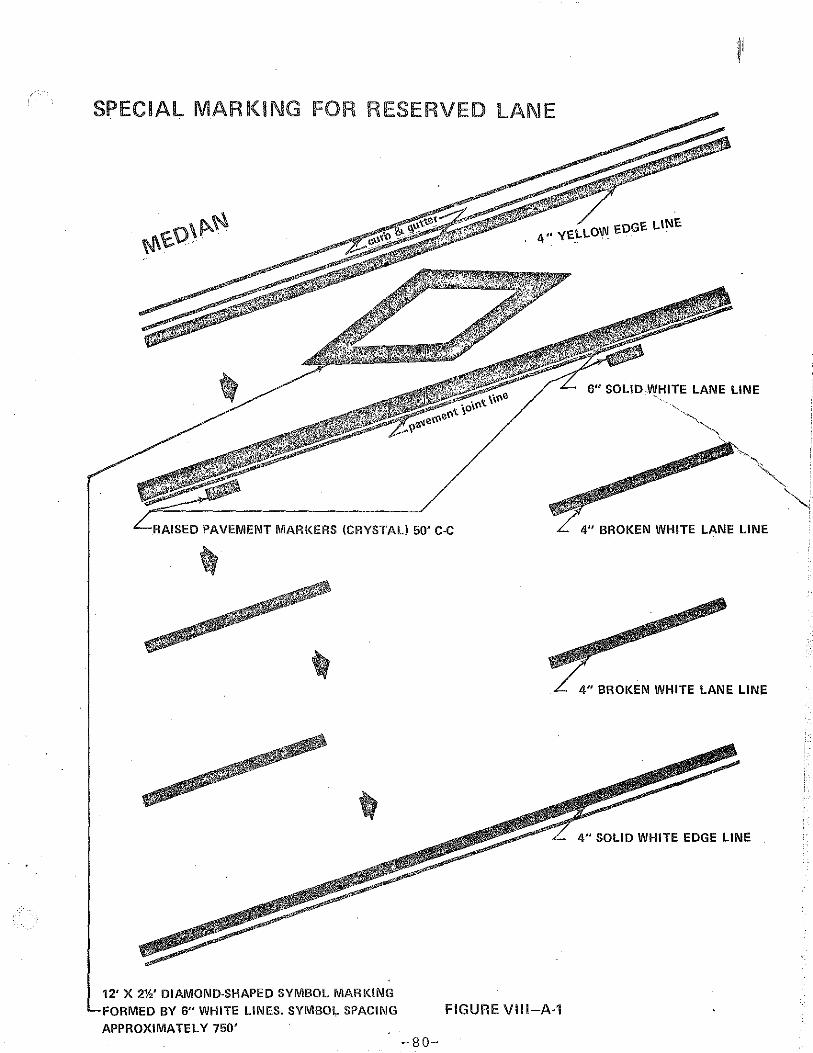
SPECIAL MARKING FOR RESERVED LANE
12' X 2%' DIAMOND-SHAPED SYMBOL MARKING
'-I'OFIMEoD BY 6" WHITE LINES. SYMBOL SPACING
APPROXIMATELY 750'
FIGURE VIII-A-1
-80-
6" SOLID WHITE LANE LINE ',
·._ ,_
4" BROKEN WHITE LANE LINE
4" BROKEN WHITE LANE LINE
4" SOLID WHITE EDGE LINE

FIGURE VIII-A-2 FIGURE VIII-A'3
FIGURE VIII-A-4
FIGURE VIII-A-5

-- ------------------------------------·-~-------"-•-•-
" ••. a joint arrangement by a group of private automobile owners in which each in turn drives his own car and carries the other passengers."
This could conceivably prevent the reserved lane from being used by those who are not in an organized "car pool." In order to avoid any confusion in this ·area the message will read:
VEHICLES 3 OR MORE
PEOPLE
BUSES
This makes it absolutely clear that the lane is reserved for any vehicle occupied by three or more people and for buses.
5. ~cifications
Details for the Jeffries reserved lane freeway signs are shown in Figures VIII-A-6 through VIII-A-9. Included is a sign for advance warning near the beginning of the reserved lane, one to be used at intervals over the reserved lane, one to be added on light poles or bridge piers and along entrance ramps, and one to be used at the termination of the reserved alne. Map VIII-A-1 details the locations of specific signs along the Jeffries route.
The total cost of recommended pavement markings and signing of the reserved lane is estimated to be $100,000.
B. GEOMETRICS
The capacity of the reserved lanes is expected to be ample since no more than 250 vehicles during any peak hour are initially anticipated.
Capacity restraints are expected, however, at both ends of the reserved lane section where vehicles will be required to mix with other traffic. Contingency plans for geometric revisions have been prepared for implementation should other solutions prove insufficient in reducing delays to reserved lane vehicles. The possible geometric revisions are as follows:
1. West Terminus of Reserved Lane - westbound afternoon peak hour traffic is now experiencing five to ten minute delays at the temporary ending of the Jeffries (I-96) Freeway, at Grand River. This condition was reviewed by analyzing aerial video tapes taken by the Highway Department during the afternoon peak. The analysis reveal that minor signalization revisions would considerably reduce existing delays; however, if the improvement is not sufficient two additional plans have been prepared. Both plans are similar in that they will be used only until the freeway is opened further to the west, and will use currently unopened, but existing lanes to accommodate reserved lane vehicles.
-82-

9"
" ~ ----------------- --- ---------- -------- ------ ---- - ----- ------------ <:::;
SIGN TO BE ADDED AT RANDOM LOCATIONS IN MEDIAN ON LIGHT POLES OR BRIDGE PIERS. SIGN ALSO TO BE USED ALONG EACH
ENTRANCE RAMP. ar.''
w;s
7!l!JZiil, @zii llmm.m' . .··
=-·- .-. -~ 1 .13/w . •
. CEFT A IE : . ---- - L f\ l
1~ BISCRV£0 - !
!:cvEniCLES · I II - · - · -- ------ I
~ !
3 _ORlVIDRE i t~ ~-; ' r, - "- .. . - . --- ·--· .. ....
.
PED:PLE_ l i ,, :.! .d l
' ;~~ t:::= -----" ~--+- - ----suscs-:··r
I . ' .,.:
-~ t\ -~::i . ~- -- ·- .- . ·-~ -- ---- --
~· 13·
9 3" I"
.q·
'!'0
--2.
Fl GU R E VI,;,;II,..-;.;A.,o·6....,.....,.....,"""'"""'""""'"""",...,""""''"""'"""'"""".....,"""'""""'""""..,.......,.
SIGN TO BE USED AT TERMINATION OF RESERVED LANE
!'I'
W.r; : . . . t . ?$;_-+~- .. . .. . . ...
:17@@/i) /l!f}[J}@ y;
4 . - . . -
B/w ' !O.'S END -t '!-"
RE5Ef~VtD 'LAf\IE- f lfl''[)
' ,,,.
"-FIGURE VIII-A-7
-83-

ADVANCE SIGN FOR USE NEAR BEGINNING OF RESERVED LANE
~~· ~
~ o/a . !m£?tR!PizJ7l!!J!iJ@
.. . ,. --· .. ., ..• .•. -~-- ·-· ... ... ---·---- . . .
9 -: 1-_..,. f-· RESERVED·_ FOEl-- 1- ~ --· . -~- --JI~E
/() • --· 1%- 3ZEH I CLES .. ----
.
1/eAJ".:Ie 3 0!-=?.IVIORE Sfn~i:.~l - .
( :-( Dota;l ~ . PEOPI.E . --- .. -- . - -- . ' . -
" lifo: .
.. . ·- . . ... 8J.I.S.- ---- -BUSES.- -- .. . ·- . . - --
Symb•l-
.- - ~olwv--/
--·· ·-·----- ---------43"
FIGURE VIII-A-8
SIGN TO BE USED AT . INTERVALS OVER RESERVED LANE
9'• 14'
w;.., . .? ' !EJZl..... .. -- !Lrf1 .........
Cftl@j}j) 0 1iJ fll .. .. . . -- ... - .. - ..
~ -z::; 1-
' ' _>;' !] I?' a ' "'I,. DeT4fi.A
/3 .. .. . ... --- . ----- --J4h~~le "1lvs · .S'fml.o/ .S?mbo/
·- -- "· -:... .. .. ... . ;' . -
---!.
e/w
LY* ON "'- /
FIGURE VIII-A-9
All signs will be reflectorized
WIG -white on green
B/W - black on white
-84-
I" I
' ••
I I'
I
I ,.
•• to"E
•• lo- E
. DETA tL "A"

I 00 Ul I
Green Lone.
R ESERVE.D FOR ,---- YEI-llCLES
""" 3 OR )o'IORE
~ P~Of'LE
""' BUSES ~
I v:: ... l ~~ .. 1· ONLY Q
LOCATION OF RESERVED LANE SIGNING RESTRICTIONS
Green Lan<2·
END RESERVED LANE
@] Sogns. oocl<-tQ-bad( on .\!ghtmg supports
[§] S<ngle s<gn, romp foc.obon,
Gn.wn Lom
LEFT lPNE RESERVED
VEHICLES 3 CR MORE
PWR-1; 6USES
MAP VIII-A-1

The plans differ in that one proposes construction of an additional lane to the south of the exit ramp. Reserved lane traffic would stay in that lane nntil it reached a special signal, thus allowing vehicles to be in proper position to make right turns at the cross street. The cost of this improvement was estimated at $70,000.
The second plan called for.the westbound reserved lane to cross the nnopened eastbound roadway, then proceed to lane on the north side of the entrance ramp, intersecting the signalized cross street. The estimated cost of this proposal was $95,000. Design drawings for the west terminus of the reserved lane is included as Appendix "B".
2. Southeast Terminus of Reserved Lane - Alternative One - A capacity restraint is now evident during morning peak periods for eastbound traffic on I-75, just north of the Jeffries Freeway. This bottleneck causes traffic to reduce to level "E" or level "F" condition:; on eastbound I-96, and onto the northbound I-74 two-lane turning roadway. This backup will seriously impede reserved lane traffic to the CBD. A plan wAs thus developed to allo~J reserved lane traffic to by-pass·this congested are8. The plan would provide for both directions of traffic and would connect tbs end of the reserved lane dil:ectly with Michigan Avenue. The estim1ted cost n+' this improvement is $600,000. Design drawings of the southeast terminus ··: the reserved lane are included in Appendix C.
Alternative Two - In order to implement a successful reserved bus lane on the Jeffries Freeway, it was considered necessary to terminate the lane at same point closer to the Detroit CBD than Buchanan Avenue, on I-96. After a review of the existing freeway network it appeared that one logical termination point would be at a rmnp to Third Avenue from I-75, with buses then utilizing Grand River to the CBD. To extend the exclusive lane to Third Avenue would require some construction, as follows:
1. Ramp in the median up to the Third Street Bridge, at $480,000.
2. From southeast bound I-96 on tun1ing roadway to I-75, widening existing structure 30 feet to accommodate both directions of lane flow. Addition of a median barrier separating hi directional flow, at $275,000.
3. From southbound I-96, crossing I-75 connecter, widen 30 ft. to accommodate both directions of lane flow. Addition of a median barrier separating hi directional flow, at $375,000.
4. Road and shoulder work to remove I-75 median barrier and construct concrete barrier at $1.6 million.
It is estimated that total construction costs exclusive of engineering and administration would be 2.7 million dollars.
Design drawings of the southeast terminus of the reserved lane are included in Appendix C.
-86-
----------:q

~ ~~----------- -------------
C. LA\'1 ENFORCEMENT PROGRAM
The exclusive bus-car pool lane is to be located in the high speed (median) lane of the Jeffries Freeway fro111 Grand River-Schaefer to near the Michigan-Myrtle exit. The lane will be i<'cntified by overhead signs and pavement markings. Unlike exclusive bus/ca:t pool lanes in other areas of the county, there will be no physical barrier segregating the lane from the normal traffic flow.
Success of the project is predicated on the exclusion of vehicles with less than three occupants from the exclusive lane. Prior to, and during the initial stage of designating this exclusive lane, an educational and promotional campaign will be initiated to instruct drivers as to the purpose and proper use of the lane. However,, there is indication that such a program still will not induce total compliance, as there are drivers who habitually disregard non-monitored ordinances. Since success of the project relies on a high degree of compliance, adequate police monito-ring ·tnd enforcement are vital.
Act 1364 of 1974, amending .section 642 of Act No. 300 of the Public Acts of 1949, allows traffic control devices to be erected directing specified traffic to use designated lanes. A copy< i' Lhe Act which was signed into law on October 15, 1974 is included as .lppenJj L.
Realizing the need for active police monitoring and enforcement of the lane restrictions, a representative of the City of Detroit Police Department was invited to be a member of the Jeffries Technical Committee. The expertise brought to the Technical meetings was valuable in ascertaining problems which might arise in regard to lane restrictions. ·
-------------- ----_,
The initial proposal for assuring compliance with the lane restriction was to fund a separate police unit to patrol the lane throughout the day. Patrols were expected to be intense during the early days of the project and to decrease as compliance increased. Initially, only warnings would be issued to errant drivers. After a two week adjustment period, summonses would be issued for non-compliance with the exclusive lane's rules. A six month demonstration program requiring a minimum of three officers plus appropriate equipment was proposed. The Law Enforcement Assistance Association (LEAA) was considered as a possible funding source.
The Police Department representative, after conferring with police and municipal officials, stated that the department regarded patrol of the freeway and enforcement of ordinances governing lane restrictions as an assignment which the police had already undertaken. Monitoring and enforcement necessary to insure compliance with regulations would be assumed by existing staff of the Motor Traffic Division and any additional costs incurred would be absorbed in the Police Department budget. Since the entire length of the exclusive bus-car pool lane is located within the confines of the City of Detroit and since the Police Department is the designated law enforcing body of the City, members of the Technical-Advisory Committee recommended acceptance of the Police Department proposal.
-87-
IX - PUBLIC INFORMATION PROGRAM
A. OBJECTIVES
As has been mentioned earlier in this report, the implementation of an exclusive bus and car pool lane on the Jeffries Freeway will entail certain law enforcement problems, as the reserved lane will be adjacent to and not separated from other freeway lanes. Being aware of this problem, the Jeffries task force wrote a public information program into the work program. The public information campaign was considered necessary for both auto and transit passengers, with different levels of information required to be transmitted to each. ·
A basic aim of the public information program was to inform potential freeway users of the reserved lane restrictions. Through use of the media, and a pre-implementation program, residents of the region could become familiar with the reserved lane program.
The concentration of publicity v·ould not be limited just to the project 1 s transit service area.. Due to tl •··· i dely dispersed travel characteristics in Southeast Michigan, auto us •. ,; . . . vrved lane could potentially have initiated their trips at any point. within the 7-county region. It was also recognized that some users, such as truck .and bus drivers, as well as·-o).ltstate residents, would be driving towards the Jeffries reserved lane with no pr'io~'information as to the lane restrictions. A signing program was investigated so as to'-~ inform these drivers, as well as remind regional residents of the existence ~
and conditions governing of the reserved lane. ~·
After setting out these basic objectives of the public information program, it was considered essential to develop a project "theme", such as had been done in Seattle, with their very successful "Blue Streak" express bus program. The resulting "Green Lane" concept, described in Chapter VIII of the report, was accepted as the theme for the Jeffries project.
The next objective to be met was the identification of existing and potential bus riders, and development of procedures to inform these persons of both the new services which would become available to them, as well as alterations to existing services.
After identification of the potential and existing market, it is essential to determine what information is to be disseminated prior to the implementation date; during the implementation state; and as continuing education during the post implementation period.
Another objective was to identify information outlets, such as radio TV, newspaper, billboards, etc., and schedule their use prior to, during and after project implementation. To prepare the basic media coverage and cost estimates, SEMTA retained the noted advertising firm of Young and Rubicam, of Detroit.
-88-
B. DESCRIPTION
The Young and Rubicam recommendations, incorporated in this report as Appendix "F", outline a program to cover the region with multi-media informational messages prior to, during and after: implementation of the Jeffries Freeway program. While stressing concentration within the Jeffries service area through use of newspapers (sub-regional editions) and billboards, the regional coverage would accomplish two goals:
1. Provide information to auto users of the Jeffries Freeway who reside beyond the Jeffries service area.
2. Provide background knowledge of the principle of reserved bus and car pool lanes to persons who normally wouldn't use the Jeffries Freeway, but who use other freeways that might receive Q reserved lane in the future.
TheY & R program recommends starting TV, newspapers, radio and outdoor advertising at least one month prior to inauguration of the project. Emphasis among the media is shifted during the pre- and post-implementation period. For example, large illuminated painted bulletiu boards would be scheduled during the six-month implementation period, while ,;maller outdoor posters would be used in the immediate service area during the "pre-opening" and immediate "post-opening" period.
Radio spots would be placed on ten Detroit radio stations, with a total 120 announcements per week, scheduled at various weekday and weekend hours.
Television announcements would be placed during the early and late news blocks, and in prime time, when most adults watch television.
As discussed above, the use by Detroit newspapers of "sub-regional" editions allows heavy concentration of messages to certain areas, thus maximizing coverage in an economical manner.
C. COST
Based on the six month pre- and post- implementation schedule recommended by Young and Rubicam, total advertising expenditures would be $267,410, spread as follows:
-89-

MEDIA
OUTDOOR - PAINT
OUTDOOR - POSTER
RADIO
TELEVISION
NEWSPAPER
PRODUCTION
OUTDOOR
RADIO
TELEVISION
NEWSPAPER
PUBLIC RELATIONS CONSULTANT
SEMTA STAFF
TABLE IX-C-1 BUDGET SUMMA.RY
$
$ 29,700
15,362
89,446
26,600
29,932
8,000
15,000
15,000
5,000
GRAND TOTAL
-- -- ---------------------------------------~ ..
$191,060
$ 43,000
$ 20,000
$ 13,350
$267,410
NOTE:· Cost based on rates prevailing at this time and subject any economic increases that may be announced prior to implementation of these schedules.
-90-
---·· ··----