rr 795 - triaxial measurements of the performance of anti ... · pdf fileexecutive health and...
TRANSCRIPT

Executive Health and Safety
Triaxial measurements of the performance of anti-vibration gloves
Prepared by Health and Safety Laboratory for the Health and Safety Executive 2010
RR795 Research Report
Executive Health and Safety
Triaxial measurements of the performance of anti-vibration gloves
Sue Hewitt Health and Safety Laboratory Harpur Hill Buxton Derbyshire SK17 9JN
Previous studies of anti-vibration gloves have typically only considered the effect that a glove might have in the direction of compression of the glove material. This project investigates the performance of an anti-vibration glove taking account of the influence that the glove might have in three axes. This requires consideration of the performance of the glove material in both compression and shear. Since the adoption of the revised international standard ISO 5349-1:2001 in the UK as BS EN ISO 5349-1:2001 and the implementation of the Control of Vibration at Work Regulations 2005, the technique for assessment of exposure to vibration requires the measurement of data in three axes to provide a total vibration value. It therefore follows that any estimate of the performance of a glove intended to reduce the vibration exposure of an operator should also consider all three vibration axes.
The aim of this investigation is to either confirm or challenge the assertion made by a particular machine manufacturer, that the glove they supply will provide useful attenuation of the vibration generated by their hand-held power tool products.
This report and the work it describes were funded by the Health and Safety Executive (HSE). Its contents, including any opinions and/or conclusions expressed, are those of the author alone and do not necessarily reflect HSE policy.
HSE Books

© Crown copyright 2010
First published 2010
All rights reserved. No part of this publication may be reproduced, stored in a retrieval system, or transmitted in any form or by any means (electronic, mechanical, photocopying, recording or otherwise) without the prior written permission of the copyright owner.
Applications for reproduction should be made in writing to:Licensing Division, Her Majesty’s Stationery Office,St Clements House, 2-16 Colegate, Norwich NR3 1BQor by e-mail to [email protected]
ii

CONTENTS
1 INTRODUCTION ......................................................................................11.1 Background ............................................................................................. 11.2 Aims .................................................................................................. 2
2 METHOD ..................................................................................................32.1 Details of glove and tests......................................................................... 32.2 Measurements of transmissibility using a shaker .................................... 3
2.2.1 Equipment and technique ............................................................. 32.2.2 Shear and compression performance ........................................... 82.2.3 Measurements of bare hand transmissibility ................................. 82.2.4 Test signals................................................................................... 82.2.5 Measurements of glove transmissibility ........................................ 82.2.6 Estimation of effect of glove on the frequency weighted vibration. 9
2.3 Direct triaxial measurement of transmissibilities on tool handles............. 9
3 RESULTS...............................................................................................103.1 Measurements of glove transmissibility using a shaker ......................... 10
3.1.1 Transmissibility in the x-axis ....................................................... 103.1.2 Transmissibility in the y-axis ....................................................... 103.1.3 Transmissibility in the z-axis ....................................................... 103.1.4 Estimating effect of glove on the frequency weighted vibration .. 16
4 DISCUSSION .........................................................................................184.1 Influence of measuring technique on results ......................................... 184.2 Measurements of transmissibility using a shaker .................................. 19
4.2.1 Data for x- and z-axes................................................................. 194.2.2 Data for y-axis............................................................................. 20
4.3 Estimates of effect of glove on frequency weighted vibration ................ 204.3.1 Effects of dominant operating frequency of tools ........................ 214.3.2 Effects of different physical characteristics and applied forces ... 22
5 CONCLUSIONS .....................................................................................24
6 REFERENCES .......................................................................................25
APPENDIX A – DIRECT MEASUREMENT ON MACHINE HANDLES ............26A.1 Direct measurements on machine handles............................................ 26A.2 Validation of measurement technique.................................................... 27A.3 Discussion ............................................................................................. 29
APPENDIX B – MULTIPURPOSE MACHINE – ESTIMATED TRANSMISSIBILITIES ............................................................31
APPENDIX C – ANGLE GRINDER – ESTIMATED TRANSMISSIBILITIES ....39
iii

iv
EXECUTIVE SUMMARY
Objectives
Previous studies of anti-vibration gloves have typically only considered the effect that a glove might have in the direction of compression of the glove material. This project investigates the performance of an anti-vibration glove taking account of the influence that the glove might have in three axes. This requires consideration of the performance of the glove material in both compression and shear. Since the adoption of the revised international standard ISO 5349-1:2001 in the UK as BS EN ISO 5349-1:2001 and the implementation of the Control of Vibration at Work Regulations 2005, the technique for assessment of exposure to vibration requires the measurement of data in three axes to provide a total vibration value. It therefore follows that any estimate of the performance of a glove intended to reduce the vibration exposure of an operator should also consider all three vibration axes.
The aim of this investigation is to either confirm or challenge the assertion made by a particular machine manufacturer, that the glove they supply will provide useful attenuation of the vibration generated by their hand-held power tool products.
Main Findings
The performance of a glove determined by measuring using an adaptor in the palm of the hand is influenced by the test method itself. The adaptor may have significant resonances in the hand-arm vibration frequency range and these resonances affect the results of transmissibility measurements. Wide variations in transmissibility measurements occur due to slight changes in the measurement conditions.
Due to the problems associated with the measurement technique and the wide variability in the results obtained, it is not clear from the results of this study, whether the glove supplied is likely to effectively attenuate the vibration of the manufacturer’s product range.
The measurement technique described here is not suitable for assessing the vibration reduction achievable when using anti-vibration gloves with particular machines, i.e. is not suitable for confirming suitability as required by the Personal Protective Equipment at Work Regulations 1992.
Recommendations
Extensive development of new performance assessment methodologies should be researched if the exposure attenuation provided by anti-vibration gloves is to be quantified satisfactorily in three axes.
v

vi
1.1
1 INTRODUCTION
BACKGROUND
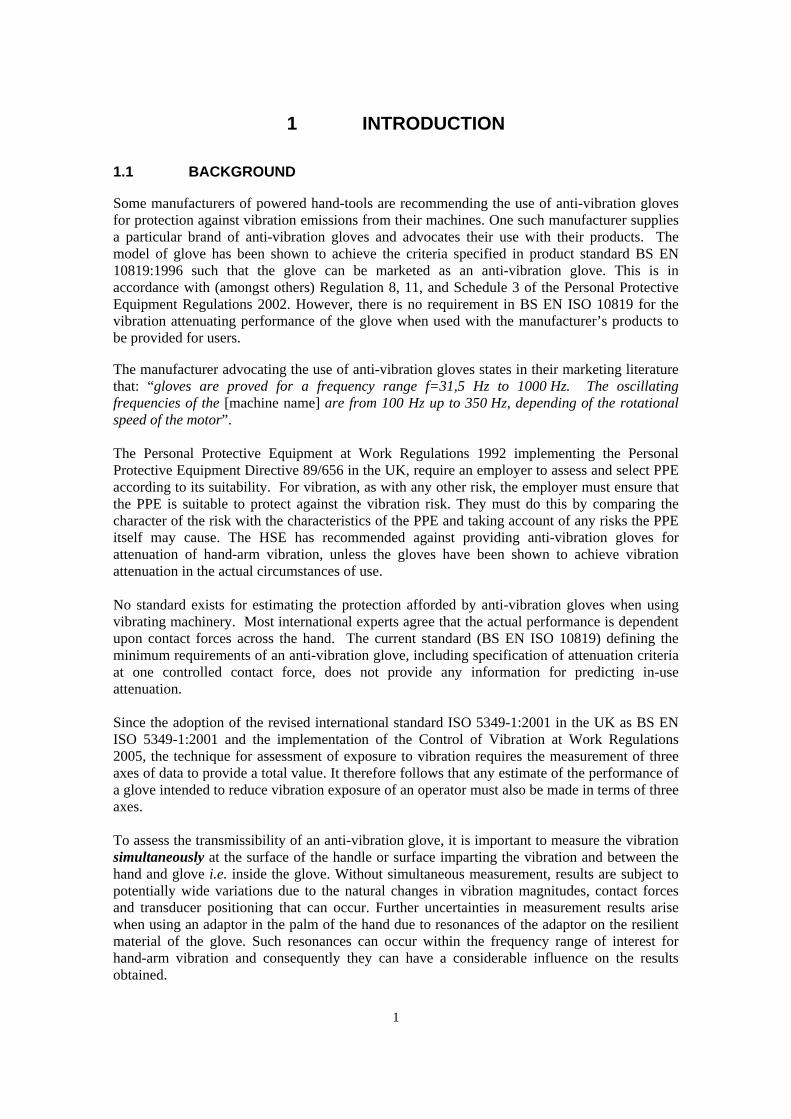
Some manufacturers of powered hand-tools are recommending the use of anti-vibration gloves for protection against vibration emissions from their machines. One such manufacturer supplies a particular brand of anti-vibration gloves and advocates their use with their products. The model of glove has been shown to achieve the criteria specified in product standard BS EN 10819:1996 such that the glove can be marketed as an anti-vibration glove. This is in accordance with (amongst others) Regulation 8, 11, and Schedule 3 of the Personal Protective Equipment Regulations 2002. However, there is no requirement in BS EN ISO 10819 for the vibration attenuating performance of the glove when used with the manufacturer’s products to be provided for users.
The manufacturer advocating the use of anti-vibration gloves states in their marketing literature that: “gloves are proved for a frequency range f=31,5 Hz to 1000 Hz. The oscillating frequencies of the [machine name] are from 100 Hz up to 350 Hz, depending of the rotational speed of the motor”.
The Personal Protective Equipment at Work Regulations 1992 implementing the Personal Protective Equipment Directive 89/656 in the UK, require an employer to assess and select PPE according to its suitability. For vibration, as with any other risk, the employer must ensure that the PPE is suitable to protect against the vibration risk. They must do this by comparing the character of the risk with the characteristics of the PPE and taking account of any risks the PPE itself may cause. The HSE has recommended against providing anti-vibration gloves for attenuation of hand-arm vibration, unless the gloves have been shown to achieve vibration attenuation in the actual circumstances of use.
No standard exists for estimating the protection afforded by anti-vibration gloves when using vibrating machinery. Most international experts agree that the actual performance is dependent upon contact forces across the hand. The current standard (BS EN ISO 10819) defining the minimum requirements of an anti-vibration glove, including specification of attenuation criteria at one controlled contact force, does not provide any information for predicting in-use attenuation.
Since the adoption of the revised international standard ISO 5349-1:2001 in the UK as BS EN ISO 5349-1:2001 and the implementation of the Control of Vibration at Work Regulations 2005, the technique for assessment of exposure to vibration requires the measurement of three axes of data to provide a total value. It therefore follows that any estimate of the performance of a glove intended to reduce vibration exposure of an operator must also be made in terms of three axes.
To assess the transmissibility of an anti-vibration glove, it is important to measure the vibration simultaneously at the surface of the handle or surface imparting the vibration and between the hand and glove i.e. inside the glove. Without simultaneous measurement, results are subject to potentially wide variations due to the natural changes in vibration magnitudes, contact forces and transducer positioning that can occur. Further uncertainties in measurement results arise when using an adaptor in the palm of the hand due to resonances of the adaptor on the resilient material of the glove. Such resonances can occur within the frequency range of interest for hand-arm vibration and consequently they can have a considerable influence on the results obtained.
1
Although work has been done to investigate the performance of gloves in one axis, there has been little work to investigate the vibration attenuation (or amplification) of a glove, based on triaxial measurements. Where studies have been done they have not involved simultaneous measurements at the surface of the handle and inside the glove.
It is important to realise that there are many limitations to the use of data produced by even the simultaneous measurement technique for estimating the attenuation provided by a glove. As well as the effects of resonance of the adaptor, the data may only be valid in work situations where the contact forces such as grip and feed forces are the same or similar to those used for the test. There are also other variables that can influence the results of transmissibility measurements, such as physical characteristics of the wearer, temperature, humidity etc. Therefore, the approach adopted in this study has been to make a very basic estimation of the potential that the glove has to protect the wearer. It is definitely not advisable to incorporate the type of assessment described here in to a vibration risk assessment with the aim of extending the length of time for which a particular machine can be used.
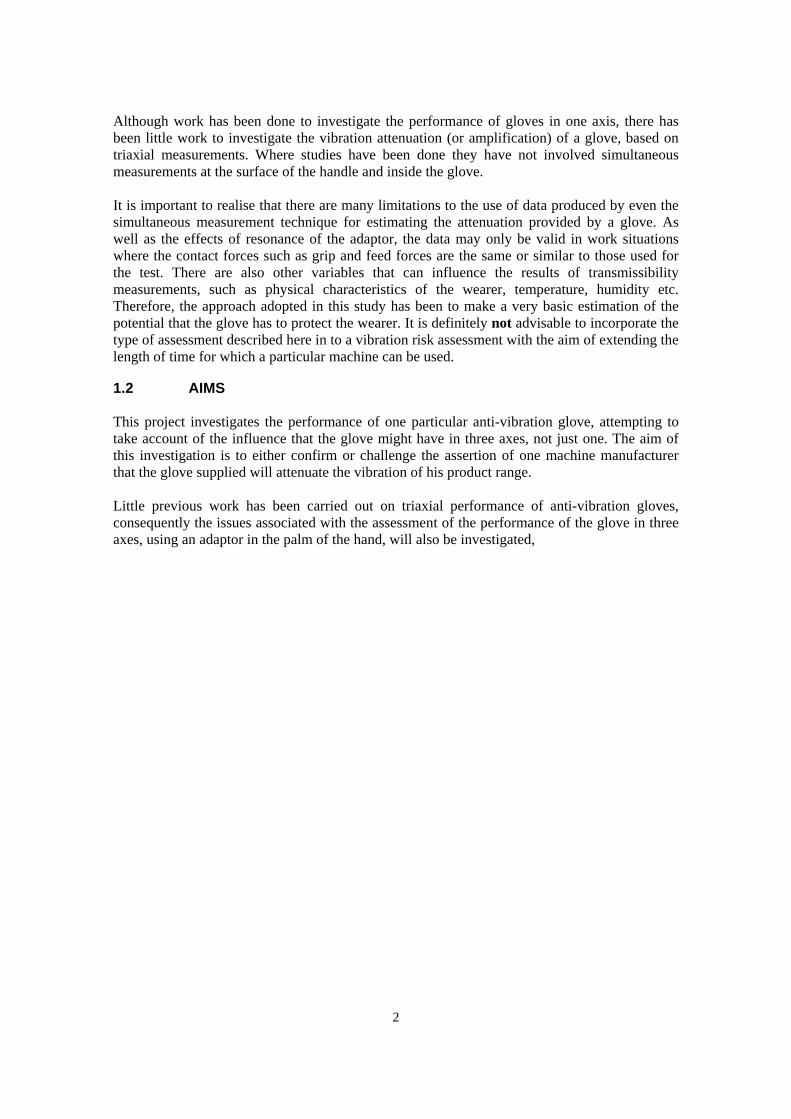
1.2 AIMS
This project investigates the performance of one particular anti-vibration glove, attempting to take account of the influence that the glove might have in three axes, not just one. The aim of this investigation is to either confirm or challenge the assertion of one machine manufacturer that the glove supplied will attenuate the vibration of his product range.
Little previous work has been carried out on triaxial performance of anti-vibration gloves, consequently the issues associated with the assessment of the performance of the glove in three axes, using an adaptor in the palm of the hand, will also be investigated,
2
2.1
2 METHOD
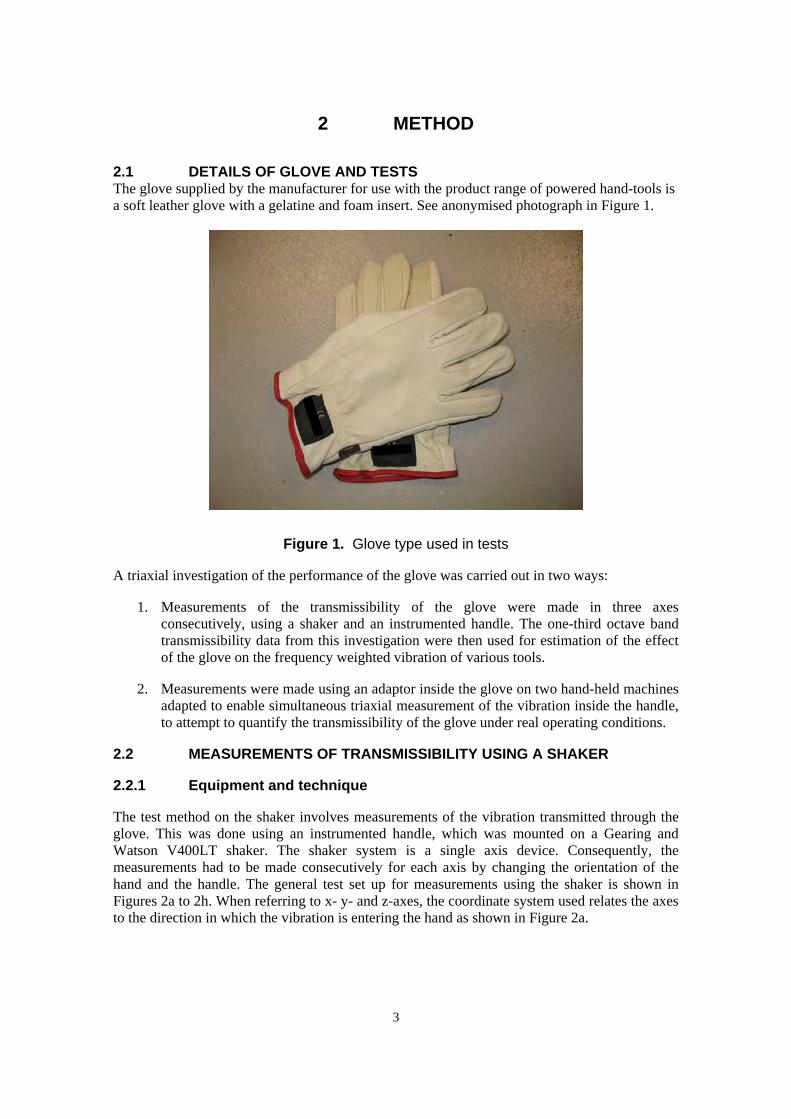
DETAILS OF GLOVE AND TESTS The glove supplied by the manufacturer for use with the product range of powered hand-tools is a soft leather glove with a gelatine and foam insert. See anonymised photograph in Figure 1.
Figure 1. Glove type used in tests
A triaxial investigation of the performance of the glove was carried out in two ways:
1. Measurements of the transmissibility of the glove were made in three axes consecutively, using a shaker and an instrumented handle. The one-third octave band transmissibility data from this investigation were then used for estimation of the effect of the glove on the frequency weighted vibration of various tools.
2. Measurements were made using an adaptor inside the glove on two hand-held machines adapted to enable simultaneous triaxial measurement of the vibration inside the handle, to attempt to quantify the transmissibility of the glove under real operating conditions.
2.2 MEASUREMENTS OF TRANSMISSIBILITY USING A SHAKER
2.2.1 Equipment and technique
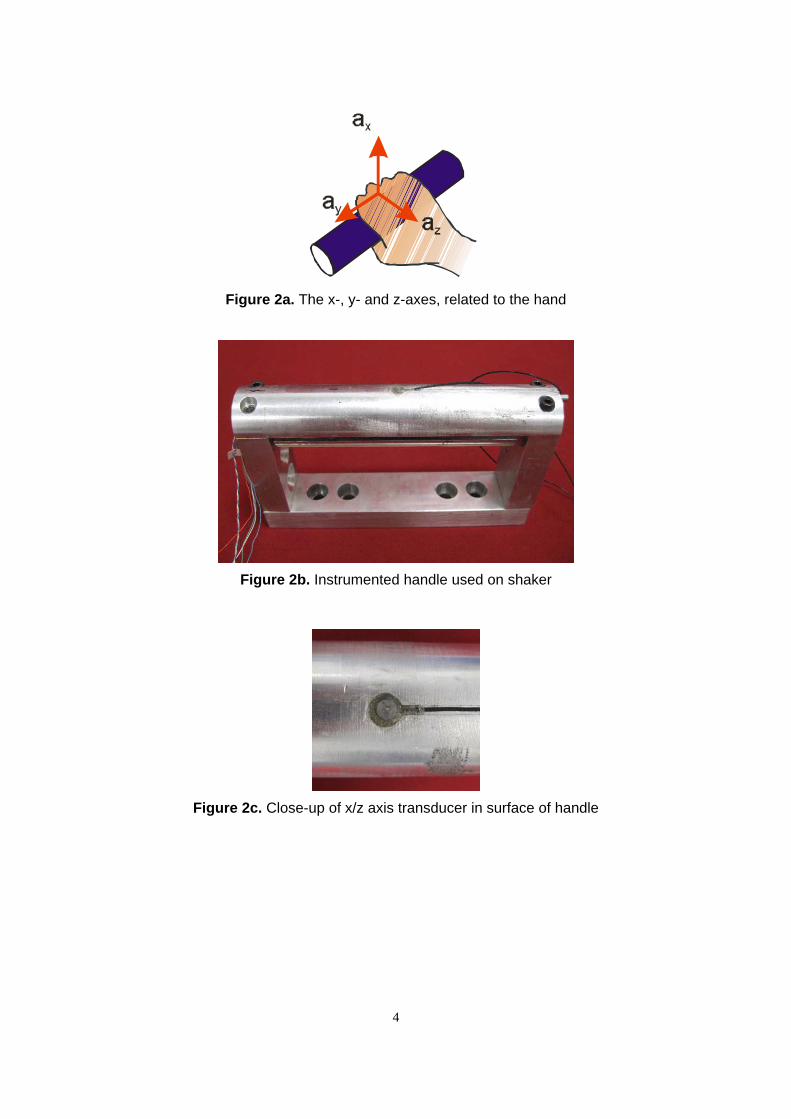
The test method on the shaker involves measurements of the vibration transmitted through the glove. This was done using an instrumented handle, which was mounted on a Gearing and Watson V400LT shaker. The shaker system is a single axis device. Consequently, the measurements had to be made consecutively for each axis by changing the orientation of the hand and the handle. The general test set up for measurements using the shaker is shown in Figures 2a to 2h. When referring to x- y- and z-axes, the coordinate system used relates the axes to the direction in which the vibration is entering the hand as shown in Figure 2a.
3
4
Figure 2a. The x-, y- and z-axes, related to the hand
Figure 2b. Instrumented handle used on shaker
Figure 2c. Close-up of x/z axis transducer in surface of handle
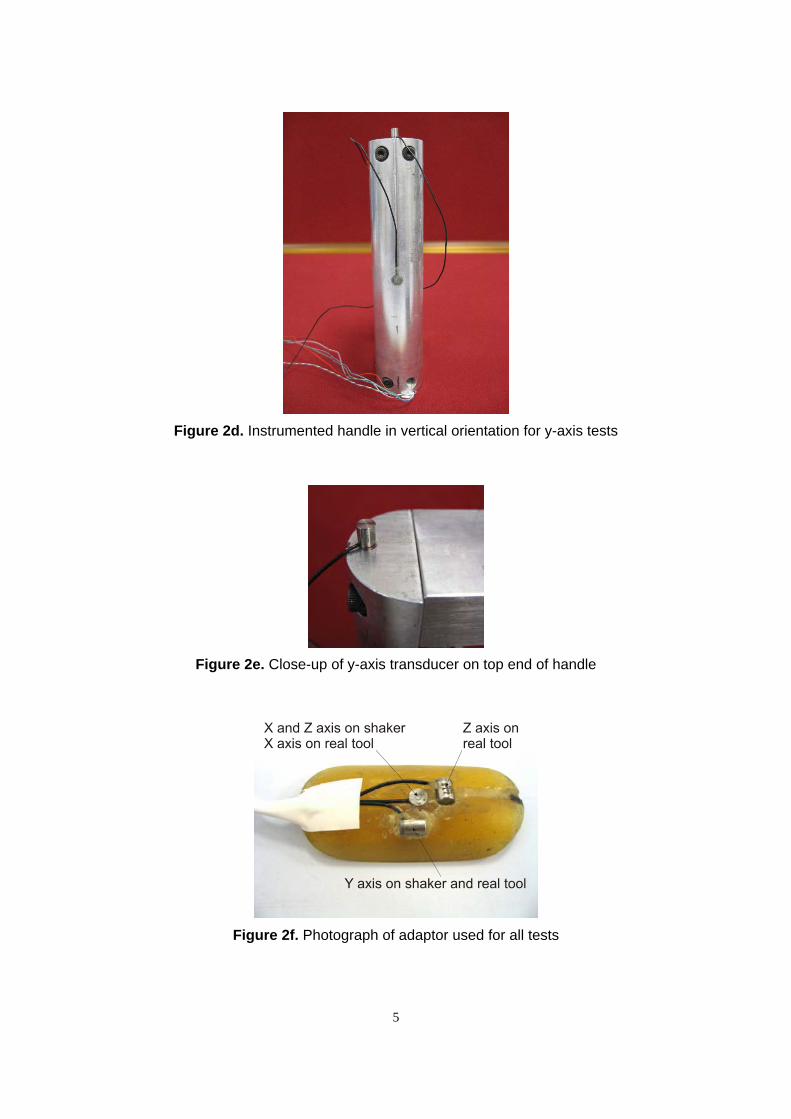
Figure 2d. Instrumented handle in vertical orientation for y-axis tests
Figure 2e. Close-up of y-axis transducer on top end of handle
Figure 2f. Photograph of adaptor used for all tests
5

Figure 2b shows a photograph of the instrumented handle, which was mounted on the shaker for the tests. The vibration on the handle was measured using a B&K type 4374 accelerometer. For the x- and z- axes this accelerometer was fitted inside the handle, in the centre just below the surface and was secured in position using wax as shown in Figure 2c. Figure 2d shows the vertical orientation of the handle for the y-axis tests. For the y-axis, the accelerometer was glued to the end of the handle as shown in Figure 2e.
The vibration in the direction of motion of the shaker at the palm of the hand was measured simultaneously by a second B&K type 4374 accelerometer fixed into a small, lightweight adaptor held in the palm of the hand inside the glove. By simultaneously measuring the vibration inside and outside the glove, the vibration transmission through the glove can be calculated. The signals from the two transducers were amplified using a B&K Nexus amplifier and then analysed using a B&K Pulse frequency analysis module.
Figure 2f shows the adaptor used for measurements in the palm of the hand for both the shaker tests and the test on real machines.
Figures 3a, 3b and 3c show the gloved hand holding the handle and the direction of the vibration entering the hand.
During the tests each test subject was asked to maintain a grip force of approximately 30 Newtons and apply a feed force of around 50 Newtons. Grip force monitoring was based on the outputs of two load cells fitted within the test handle for measurements in all three axes. Push force monitoring was based on the push-direction output of a force platform upon which the test subject stood.
In the z-axis the push force was monitored by the operator standing on a force platform. In the x- and y -axes, the required proximity of the operator to the shaker meant that the force platform could not be used. Control relied on the training and experience of the operator to apply approximately the correct push force. If the required grip and push forces are not applied, it is often the case that the initial bare hand transmissibility measurements do not meet the necessary criteria.
6
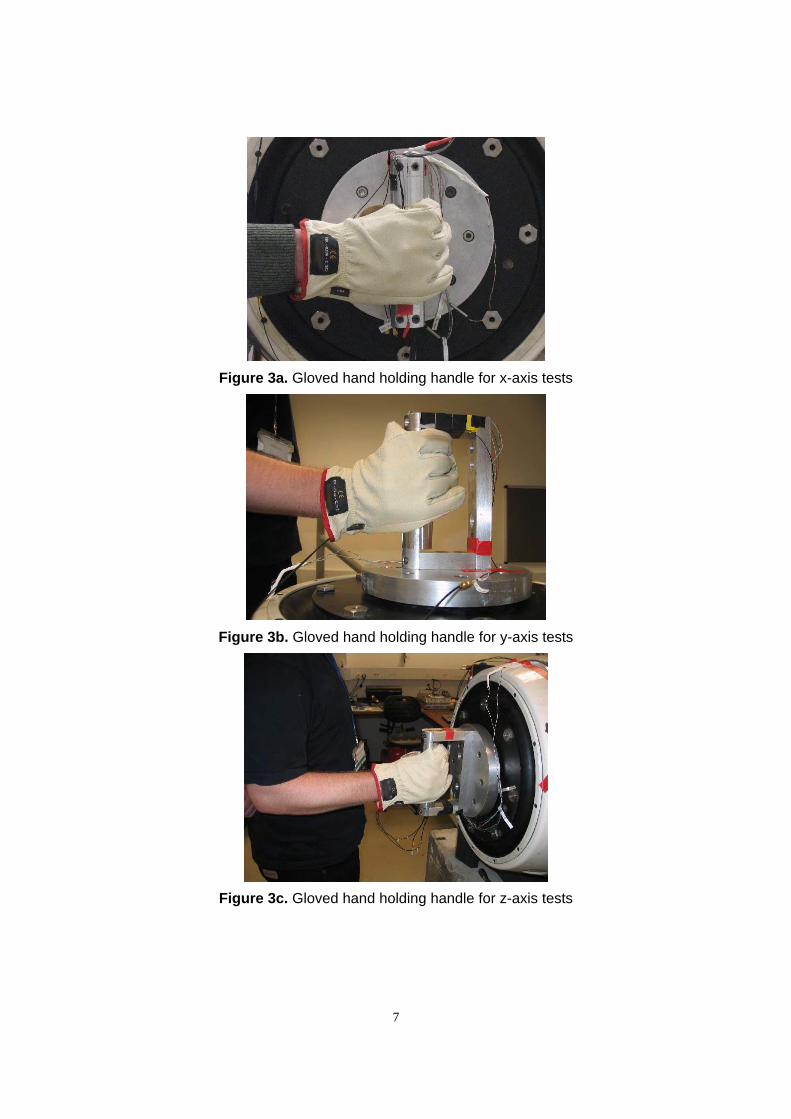
Figure 3a. Gloved hand holding handle for x-axis tests
Figure 3b. Gloved hand holding handle for y-axis tests
Figure 3c. Gloved hand holding handle for z-axis tests
7
8
zcompression
zshearXcompression
Xshear
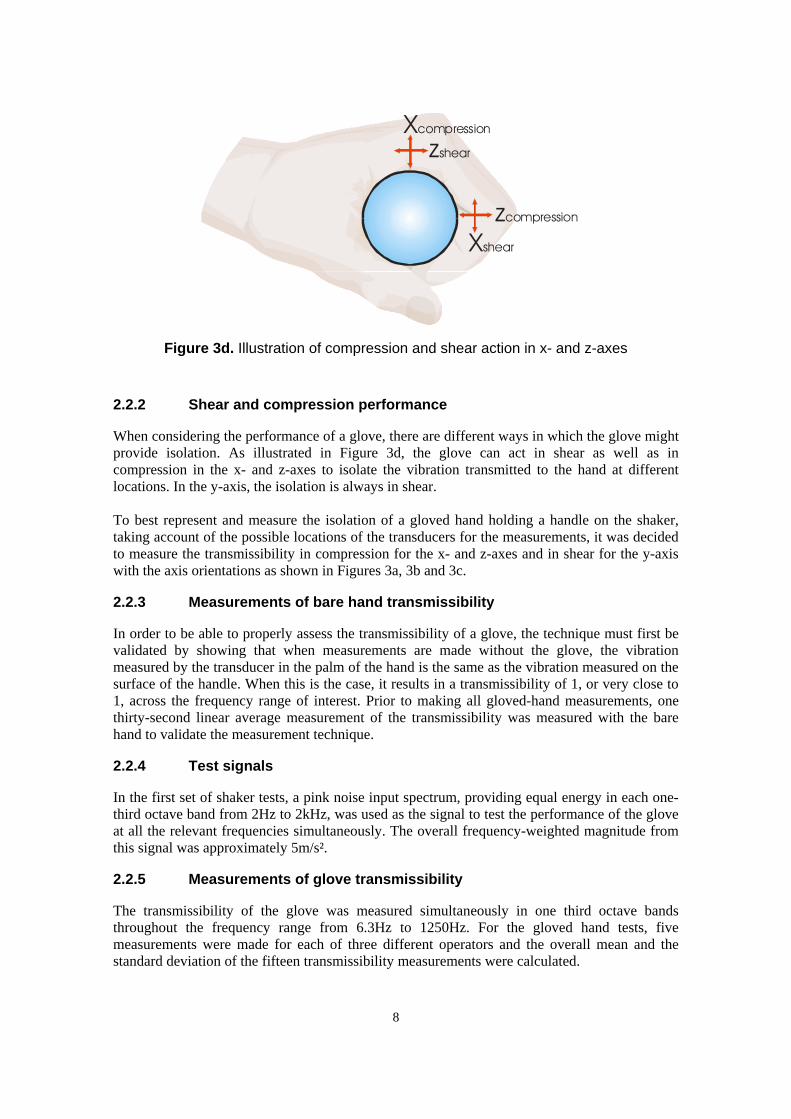
Figure 3d. Illustration of compression and shear action in x- and z-axes
2.2.2 Shear and compression performance
When considering the performance of a glove, there are different ways in which the glove might provide isolation. As illustrated in Figure 3d, the glove can act in shear as well as in compression in the x- and z-axes to isolate the vibration transmitted to the hand at different locations. In the y-axis, the isolation is always in shear. To best represent and measure the isolation of a gloved hand holding a handle on the shaker, taking account of the possible locations of the transducers for the measurements, it was decided to measure the transmissibility in compression for the x- and z-axes and in shear for the y-axis with the axis orientations as shown in Figures 3a, 3b and 3c.
2.2.3 Measurements of bare hand transmissibility
In order to be able to properly assess the transmissibility of a glove, the technique must first be validated by showing that when measurements are made without the glove, the vibration measured by the transducer in the palm of the hand is the same as the vibration measured on the surface of the handle. When this is the case, it results in a transmissibility of 1, or very close to 1, across the frequency range of interest. Prior to making all gloved-hand measurements, one thirty-second linear average measurement of the transmissibility was measured with the bare hand to validate the measurement technique.
2.2.4 Test signals
In the first set of shaker tests, a pink noise input spectrum, providing equal energy in each one-third octave band from 2Hz to 2kHz, was used as the signal to test the performance of the glove at all the relevant frequencies simultaneously. The overall frequency-weighted magnitude from this signal was approximately 5m/s².
2.2.5 Measurements of glove transmissibility
The transmissibility of the glove was measured simultaneously in one third octave bands throughout the frequency range from 6.3Hz to 1250Hz. For the gloved hand tests, five measurements were made for each of three different operators and the overall mean and the standard deviation of the fifteen transmissibility measurements were calculated.

2.2.6 Estimation of effect of glove on the frequency weighted vibration
Vibration measurements according to BS EN ISO 5349-1:2001 were made on two types of powered hand-held machine. It is for these machines that the manufacturer was recommending the anti-vibration gloves being investigated here. The two machines were:
1. A multipurpose sanding and cutting machine and
2. A 230mm angle grinder.
Typical vibration spectra were obtained for three different tasks with the multi-purpose machine and one task with the angle grinder. These were:
• Sanding plywood with the multipurpose machine
• Sanding chipboard with the multipurpose machine
• Cutting chipboard with the multipurpose machine
• Grinding a mild steel bar with the 230mm angle grinder
The one-third octave band vibration spectra measured on the handles of the two machines were imported into a spreadsheet so that estimates could be made of the attenuation provided by the glove. To do this the mean plus one standard deviation transmissibility figures for the glove measured in each one-third octave band for each axis were multiplied by the vibration magnitudes measured in each one-third octave band for each of the machine and operation combinations. The mean plus one standard deviation figures are used to determine values that apply to approximately 84% of the general population, i.e. according to statistics, only ~16% of the population will get less protection than estimated.
2.3 DIRECT TRIAXIAL MEASUREMENT OF TRANSMISSIBILITIES ON TOOL HANDLES
Following the sequential measurements of each axis on the shaker, simultaneous triaxial measurements were carried out on two other hand-held machines. These were:
1. A 180mm pneumatic vertical grinder
2. A 125mm electric angle grinder
As with the shaker measurements, the first stage of the technique was to try to verify the measurements with the bare hand to prove the measurement system.
Repeated attempts were made to validate the measuring technique by attempting to get agreement in all three axes simultaneously between the measurements inside the handle and those using the palm adaptor in the bare hand. These attempts were all unsuccessful. It was not possible to validate the measurement technique because agreement could not be obtained between all three axes at the same time. Details of the measurements are included in Appendix A of this report for information and to highlight the pitfalls of attempting to measure the performance of a glove by using an adaptor in the palm of the hand.
9

3 RESULTS
3.1 MEASUREMENTS OF GLOVE TRANSMISSIBILITY USING A SHAKER
3.1.1 Transmissibility in the x-axis
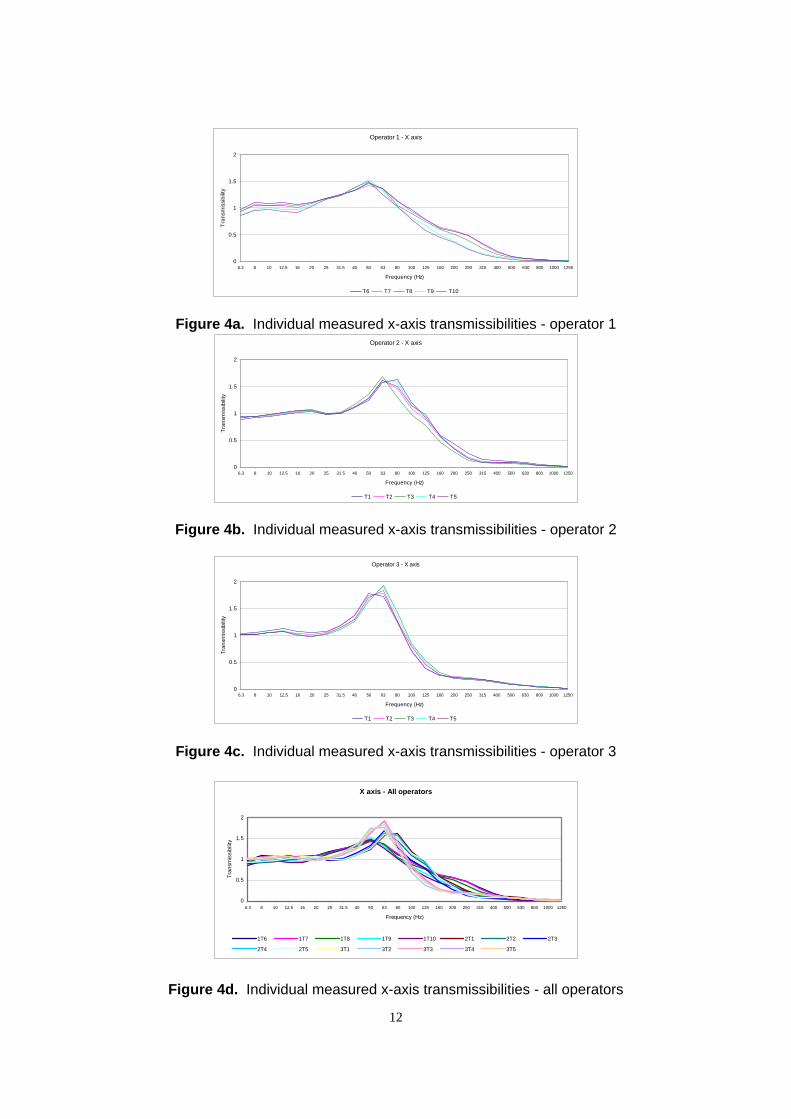
Figures 4a, 4b and 4c show the measured x-axis transmissibilities for operators 1, 2 and 3 respectively and Figure 4d shows the data for all three operators on the same graph, to illustrate the spread of the data. The results show that there is a resonance around 50Hz to 80Hz, depending on the operator. The peak of this resonance causes amplification that ranges from 50% (transmissibility = 1.5) to close to 100% (transmissibility = 2), again depending on the operator.
Looking at frequencies above the resonance, there is attenuation, which starts to take effect from around 100Hz and reduces the transmissibility to a factor of 0.5 or less in the 125Hz or 160Hz third octave band and above. Figure 4d highlights the differences between subjects, particularly in the frequency of the peak of the first resonance.
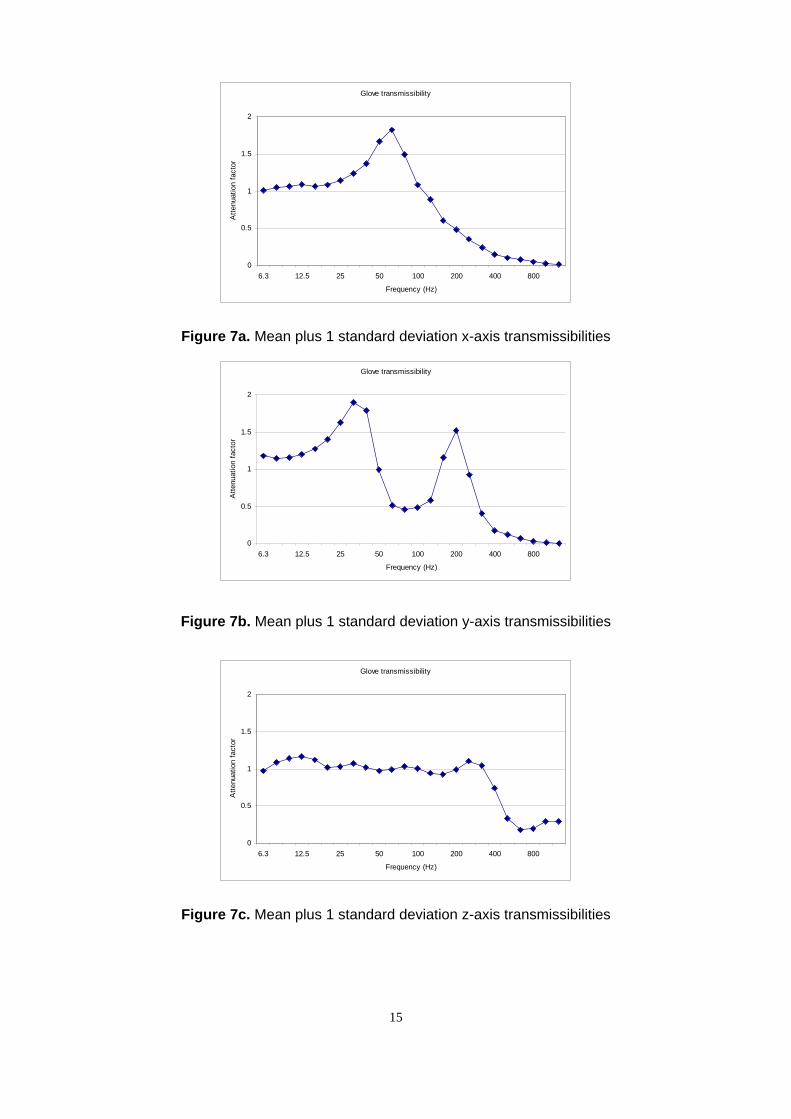
For the calculations of glove attenuation, the mean plus one standard deviation of all fifteen measurements, five for each of the three operators, is taken. The mean plus one standard deviation of the fifteen measurements on three operators in the x-axis is shown in Figure 7a.
3.1.2 Transmissibility in the y-axis
The measured y-axis transmissibilities for each of the three operators are shown in Figures 5a, 5b and 5c. Figure 5d shows the data for all three operators on the same graph. The characteristics of a glove in shear have not previously been measured at HSL. The results show that there is a first resonance around the 31.5Hz third octave band. After this there are varying degrees of attenuation resulting in a typical transmissibility of around 0.4 in the 80Hz third octave band. This is followed by a second resonance at around 200Hz. Both resonances vary greatly in their magnitude from one operator to another.
The mean plus one standard deviation of the fifteen measurements on three operators is shown in Figure 7b. Despite the fact that the curve is an average, which might be expected to smooth out the peaks, there are still two prominent areas of apparent amplification at 31.5Hz and 250Hz. In between these frequencies, there is some attenuation of the vibration. The attenuation is greatest between 63Hz and 100Hz and above about 400Hz.
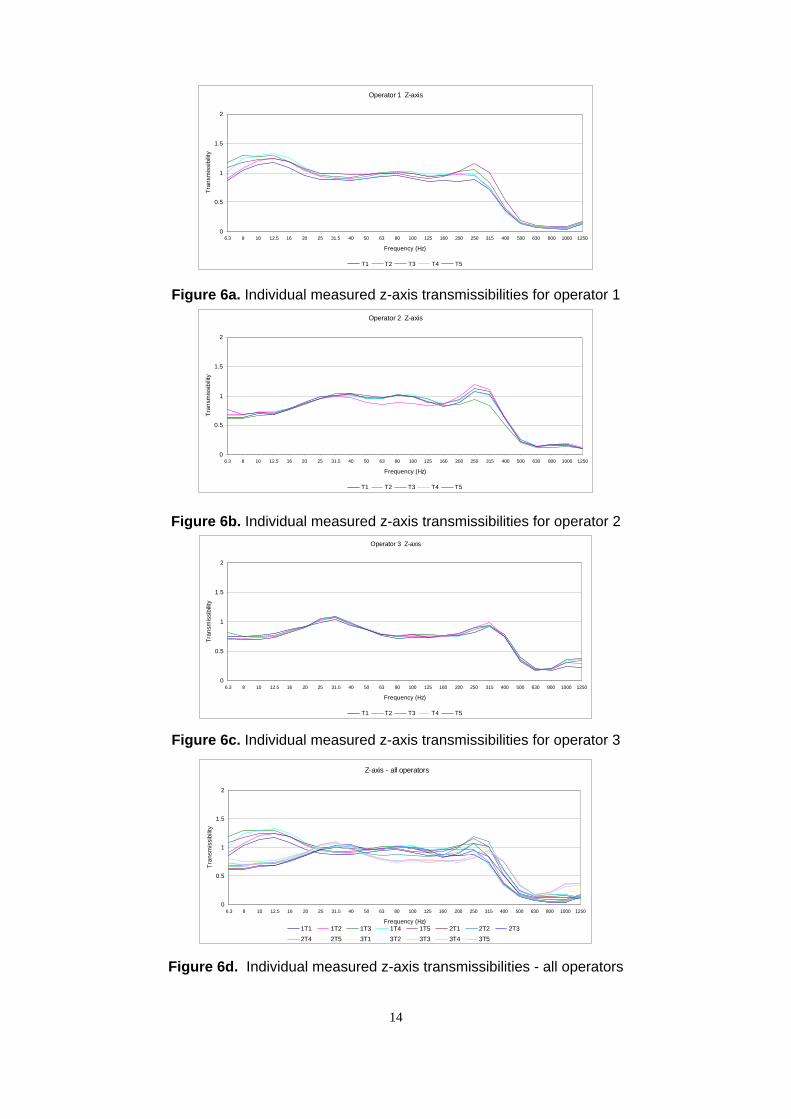
3.1.3 Transmissibility in the z-axis
The measured z-axis transmissibilities are shown in Figures 6a to 6d. At low frequencies there is a big difference between the results for Operator 1 compared with Operators 2 and 3. Operator 1 shows amplification between 8Hz and 12.5Hz, whereas Operators 2 and 3 show an apparent reduction in transmissibility below 20Hz.
For Operators 1 and 2 there is then little or no effect on the vibration from 25Hz up to around 250Hz to 315Hz, when there is some slight amplification followed by a gradual increase in attenuation at frequencies after that. For Operator 3 as shown in Figure 6c, there is some attenuation of vibration at about 50Hz, which continues up to the resonance at around 250Hz.
At frequencies above 250Hz the attenuation pattern is similar for all three Operators.
10

Figure 7c shows the mean plus one standard deviation of the transmissibility measurements in the z-axis. When the individual characteristics of the three operators are averaged in this way, the outcome is response-curves that are smoothed. For the z-axis this means that the glove appears to neither attenuate or amplify very much at all up to 250Hz, after which there is a rapid reduction in transmissibility to a factor of 0.2 at 630Hz.
11
is
0
1
2
6.3 8 10 12.5 20 25 31.5 40 50 63 100 125 160 200 250 315 500 630 800 1000 1250
( )
T6 T7 T8 T9
Operator 1 - X ax
0.5
1.5
16 80 400
Frequency Hz
Tran
smis
sibi
lity
T10
Figure 4a. Individual measured x-axis transmissibilities - operator 1 is
0
1
2
6.3 8 16 20 25 31.5 40 50 63 125 160 200 250 315 400 500 1250
( )
ibi
T1 T2 T3 T4 T5
Operator 2 - X ax
0.5
1.5
10 12.5 80 100 630 800 1000
Frequency Hz
Tran
smis
slit
y
Figure 4b. Individual measured x-axis transmissibilities - operator 2
is
0
1
2
8 10 20 25 31.5 40 63 80 100 250 630 800
)
T1 T2 T3 T4 T5
Operator 3 - X ax
0.5
1.5
6.3 12.5 16 50 125 160 200 315 400 500 1000 1250
Frequency (Hz
Tran
smis
sibi
lity
Figure 4c. Individual measured x-axis transmissibilities - operator 3
0
1
2
8 10 16 20 25 40 50 63 80 100 125 160 200 250 315 400 500 630 800 1000 1250
ii
y
1T6 1T7 1T8 1T9 1T10 2T1 2T2 2T3
2T4 2T5 3T1 3T2 3T3 3T4 3T5
X axis - All operators
0.5
1.5
6.3 12.5 31.5
Frequency (Hz)
Tran
smss
bilit
Figure 4d. Individual measured x-axis transmissibilities - all operators
12

is
0
1
2
8 10 16 20 25 40 50 63 80 100 125 160 200 250 315 400 500 630 800 1000 1250
ii
y
T1 T2 T3 T4 T5
Operator 1 Y-ax
0.5
1.5
6.3 12.5 31.5
Frequency (Hz)
Tran
smss
bilit
Figure 5a. Individual measured y-axis transmissibilities for operator 1 is
0
1
2
8 10 16 20 25 40 50 63 80 100 125 160 200 250 315 400 500 630 800 1000 1250
ii
y
T1 T2 T3 T4 T5
Operator 2 Y ax
0.5
1.5
6.3 12.5 31.5
Frequency (Hz)
Tran
smss
bilit
Figure 5b. Individual measured y-axis transmissibilities for operator 2is
0
1
2
8 10 16 20 25 40 50 63 80 100 125 160 200 250 315 400 500 630 800 1000 1250
ii
y
T1 T2 T3 T4 T5
Operator 3 Y-ax
0.5
1.5
6.3 12.5 31.5
Frequency (Hz)
Tran
smss
bilit
Figure 5c. Individual measured y-axis transmissibilities for operator 3
0
0.5
1
1.5
2
6.3 8 10 12.5 16 20 25 31.5 40 50 63 80 100 125 160 200 250 315 400 500 630 800 1000 1250
( )
Tran
smis
sibi
lity
1T1 1T2 1T3 1T4 1T5 2T1 2T2 2T3
2T4 2T5 3T1 3T2 3T3 3T4 3T5
Y-axis - all operators
Frequency Hz
Figure 5d. Individual measured y-axis transmissibilities - all operators
13
is
0
1
2
8 10 16 25 40 50 80 100 315 800
( )
ii
T1 T2 T3 T4 T5
Operator 1 Z-ax
0.5
1.5
6.3 12.5 20 31.5 63 125 160 200 250 400 500 630 1000 1250
Frequency Hz
Tran
smss
iblit
y
Figure 6a. Individual measured z-axis transmissibilities for operator 1 is
0
1
2
8 10 16 20 40 63 80 100 125 200
( )
ii
T1 T2 T3 T4 T5
Operator 2 Z-ax
0.5
1.5
6.3 12.5 25 31.5 50 160 250 315 400 500 630 800 1000 1250
Frequency Hz
Tran
smss
iblit
y
Figure 6b. Individual measured z-axis transmissibilities for operator 2is
0
0.5
1
1.5
2
8 16 40 80 500 630
)
ili
T1 T2 T3 T4 T5
Operator 3 Z-ax
6.3 10 12.5 20 25 31.5 50 63 100 125 160 200 250 315 400 800 1000 1250
Frequency (Hz
Tran
smis
sib
ty
Figure 6c. Individual measured z-axis transmissibilities for operator 3
i l
0
0.5
1
1.5
2
8 20 25 40
)
ili
Z-ax s - al operators
6.3 10 12.5 16 31.5 50 63 80 100 125 160 200 250 315 400 500 630 800 1000 1250
Frequency (Hz
Tran
smis
sib
ty
1T1 1T2 1T3 1T4 1T5 2T1 2T2 2T3 2T4 2T5 3T1 3T2 3T3 3T4 3T5
Figure 6d. Individual measured z-axis transmissibilities - all operators
14
Glove transmissibility
Atte
nuat
ion
fact
or
2
1.5
1
0.5
0 6.3 12.5 25 50 100 200 400 800
Frequency (Hz)
Figure 7a. Mean plus 1 standard deviation x-axis transmissibilities
Glove transmissibility
2
1.5
acto
r A
ttenu
atio
n f
1
0.5
0 6.3 12.5 25 50 100 200 400 800
Frequency (Hz)
Figure 7b. Mean plus 1 standard deviation y-axis transmissibilities
Glove transmissibility
2
1.5
Atte
nuat
ion
fact
or
1
0.5
0 6.3 12.5 25 50 100 200 400 800
Frequency (Hz)
Figure 7c. Mean plus 1 standard deviation z-axis transmissibilities
15
3.1.4 Estimating effect of glove on the frequency weighted vibration
The full results of the vibration measurements on the hand-held machines and the transmissibility evaluation of the glove are shown in detail in Appendices B and C.
The estimated effect of the glove on the overall frequency weighted vibration magnitudes using the mean plus one standard deviation transmissibility in each one-third octave band is shown in Table 1 for each individual axis as well as the total value. The estimation has been made by:
1. Measuring the one-third octave band vibration spectra for each axis on the machine handle
2. Calculating an assumed protection spectrum for the glove in each axis (using the mean plus one standard deviation transmissibility value from the measurements of glove transmissibility made on the shaker)
3. Multiplying the unweighted vibration spectrum in each axis, by the glove’s assumed protection spectrum
4. Calculating the Wh frequency weighted value from the resultant “protected” spectra, to give x-, y- and z-axis weighted and protected vibration magnitudes
5. Taking the root-sum-of-squares of the three axis frequency weighted magnitudes to give the vibration total value
From the data in Table 1, it is estimated that the glove could provide between 3% amplification and 30% reduction in the total value frequency weighted vibration for the two tools on which vibration measurements were made. The calculations assume that the grip and feed force and other influencing conditions such as temperature and humidity are the same as in the test conditions.
16

Table 1. Estimated effect of gloves on frequency weighted magnitudes of machines using mean plus one standard deviation measured transmissibilities
Multipurpose tool cutting chipboard X Y Z Total
Frequency weighted acceleration (m/s²) Without glove 5.3 1.0 9.2 10.7 With glove 1.7 0.8 9.8 10.0
% reduction/amplification 68 20 7 7
Multipurpose tool sanding plywood Frequency weighted acceleration (m/s²)
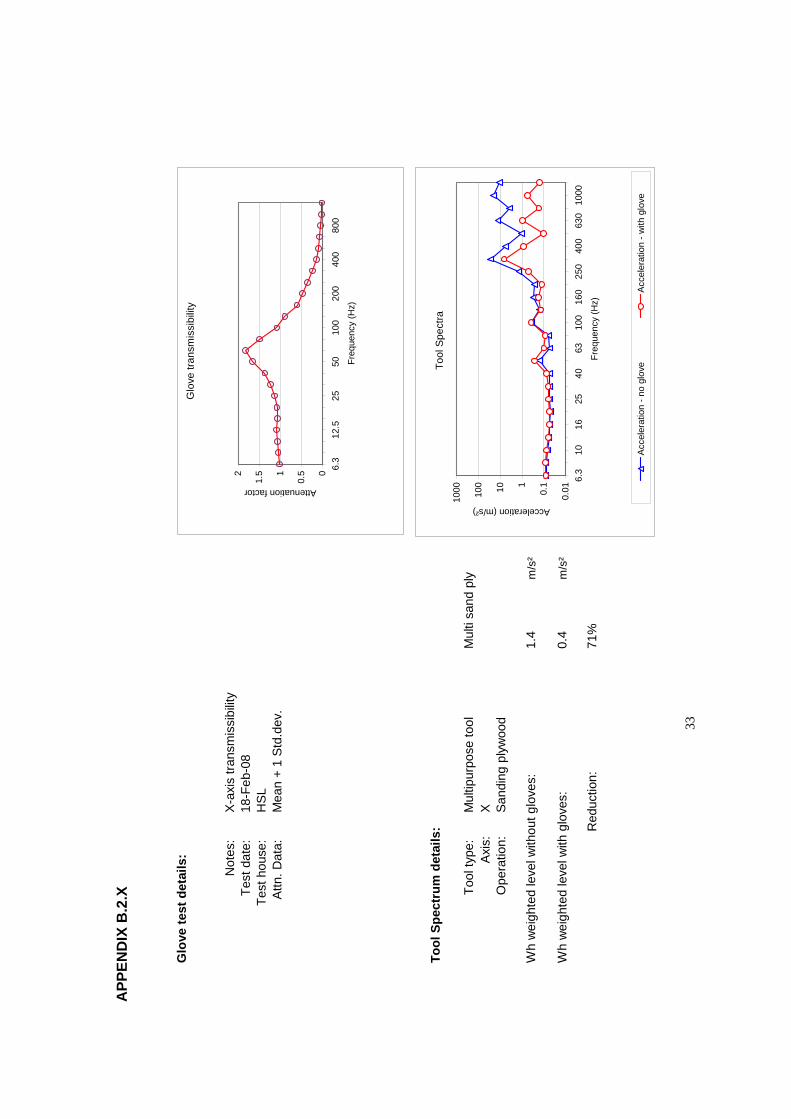
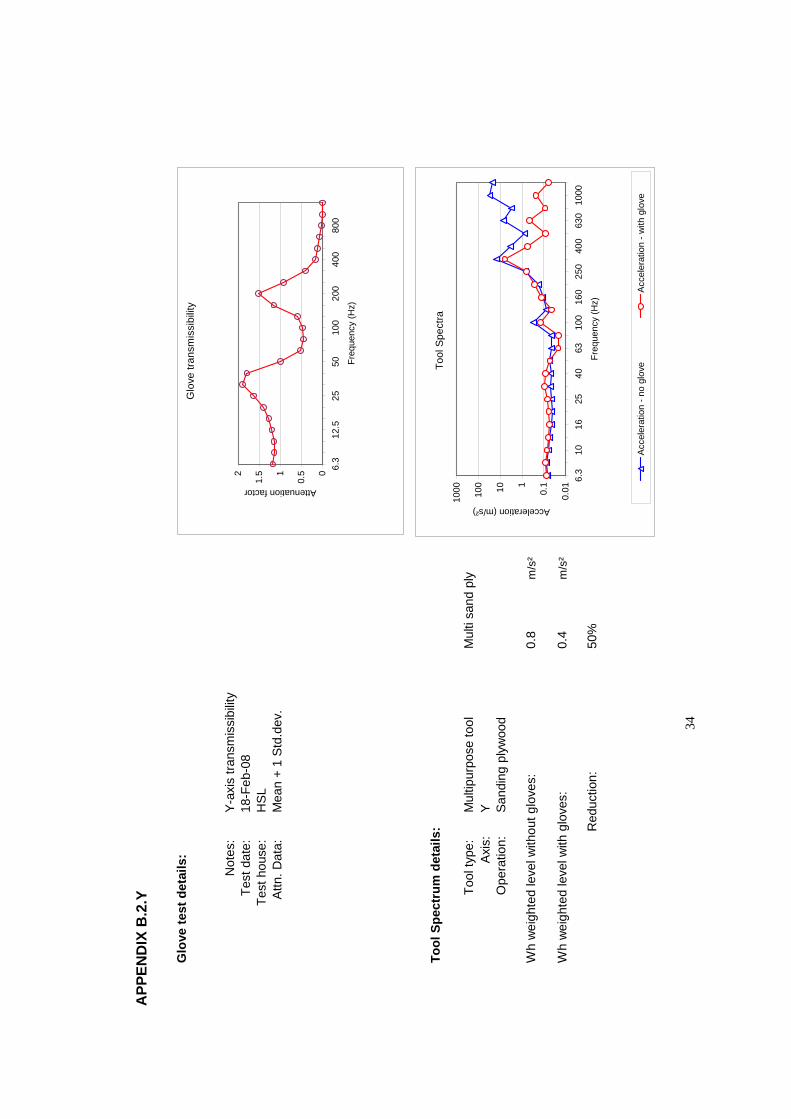
Without glove 1.4 0.8 1.2 2.0 With glove 0.4 0.4 1.3 1.4
% reduction/amplification 71 50 8 30
Multipurpose tool sanding chipboard Frequency weighted acceleration (m/s²)
Without glove 1.3 0.8 1.4 2.1 With glove 0.4 0.4 1.4 1.5
% reduction/amplification 69 50 0 29
Grinder grinding mild steel – front hand Frequency weighted acceleration (m/s²)
Without glove 1.8 0.8 2.1 2.9 With glove 1.9 0.7 2.2 3.0
% reduction/amplification 6 13 5 3
Grinder grinding mild steel – rear hand Frequency weighted acceleration (m/s²)
Without glove 1.0 1.3 1.1 2.0 With glove 1.1 0.7 1.1 1.7
% reduction/amplification 10 46 0 15
17

4.1
4 DISCUSSION
INFLUENCE OF MEASURING TECHNIQUE ON RESULTS
The technique used in this investigation for measuring the vibration attenuation of a glove is adapted from that employed in the standard test for verification of an anti-vibration glove, as defined in BS EN ISO 10819:1996. An adaptor containing an accelerometer is held in the palm of the hand. This technique inevitably means that the adaptor, which contains the transducer, becomes a part of the mechanical system. There is potential for this measuring technique to generate results that are an artefact of the measurement system, rather than an indication of how the vibration is really being transmitted through the glove.
To illustrate the problem of adaptor resonance, a section of the palm material from the anti-vibration glove was taped around the instrumented handle and the adaptor was then taped on top of the resilient material. The transmissibility of the material was measured both with and without contact from an operator’s hand. Figure 8 shows the measured transmissibilities and highlights the resonance of the adaptor on the glove material.
Tran
smis
sibi
lity
1211109876543210
6.3 10 16 25 40 63 100 160 250 400 630 1000 Frequency (Hz)
Y axis no hand Y axis with hand X/Z axis no hand X/Z axis with hand
Figure 8. Resonances of adaptor on glove material
The resonance in the x/z-axis (compression) is at around 400Hz. The resonance in the y-axis (shear) is between 200Hz and 250Hz. When the system is damped by the operator’s hand and arm, as indicated by the dashed lines in Figure 8, the magnitude and the frequencies of the resonances are reduced and the peaks are less well defined, but they still remain.
18

When an adaptor is used to hold transducers to assess the transmissibility of a resilient material, resonances of the adaptor can influence the results. The frequency and magnitude of the resonances that any adaptor will undergo vary depending on many factors including:
• size of the adaptor • mass of the adaptor • location of the adaptor • properties of the resilient material • differences in grip and feed forces applied • differences in the physical characteristics of the operator.
Some aspects of the transmissibility data that are measured and reported here are due to resonances of the adaptor and are therefore artefacts of the measuring technique employed. If the measurement could be made without the adaptor, these resonances would not exist. Resonances of the hand-arm system, on the other hand, are not artefacts of the measuring technique. They exist and may cause amplification of the vibration transmitted to the hand-arm system. The presence of the glove may accentuate these effects, but is not necessarily solely responsible for them.
All of the measurements made and reported here show evidence of various resonances, the difficulty is in identifying which are relevant in terms of the performance of an anti-vibration glove or material and which are measurement artefact.
4.2 MEASUREMENTS OF TRANSMISSIBILITY USING A SHAKER
4.2.1 Data for x- and z-axes
The x-/z-axis resonance of the adaptor at 400Hz (shown in Figure 8) is not evident in the x-axis transmissibility measurements made on the shaker (shown in Figure 4). The data for the x-axis is dominated by a lower frequency resonance. This resonance may be a resonance of the hand and forearm as described in Dong et al (2009). Dong et al (2009) have developed and validated a model of the hand-arm system which identifies a resonance related to the palm contact stiffness and the mass of the palm-wrist-forearm system, this resonance occurs at 33Hz for the bare hand in the z-axis in their model.
The HSL individual measurement data for all three operators and axes in Figure 4, 5 and 6 show varying magnitudes of resonance, ranging in frequency from 31.5Hz to 80Hz. These may well be attributable to a resonance of the hand-wrist-forearm system. The effect of the resonance persists in the x-axis mean plus 1 standard deviation transmissibility data as shown in Figure 7a. In the z-axis data, the effect of any resonances around this frequency are less apparent and become negligible in the mean plus 1 standard deviation transmissibility data shown in Figure 7c.
When spectral data are averaged across subjects, peaks in the spectra relating to individual characteristics can become smoothed and less well defined. This raises the question of the validity of averaging across individual subjects. Some smoothing has clearly occurred in the x-axis data (Figure 7a) and z-axis data (Figure 7c) but for the purposes of this investigation, the consequences for the overall outcome are likely to be negligible.
The measured z-axis transmissibilities show big differences between the results for Operator 1 compared with Operators 2 and 3 at low frequencies. The model developed by Dong et al (2009) shows a first resonance of the hand arm system at 7Hz, which is related to the motion of the upper arm and shoulder mass and stiffness. This resonance may be responsible for the low
19

frequency response seen in z-axis. Other causes may also be possible, but it is not likely to be related to the performance of the glove.
The z-axis data above 25Hz are typical of what is usually measured for a glove of this type in compression when grip and feed forces are controlled as in the BS EN ISO 10819 test procedure. There is no appreciable amplification or resonance effect until around the 250Hz or 315Hz third octave band, where there is an indication of some slight amplification before the glove begins to attenuate. Both the resonance of the adaptor and the resonance of the fingers may contribute to this effect, although for the gloved hand the resonance is a little high to be related to the resonance of the fingers as described by Dong et al. At frequencies of 400Hz and above, the glove shows good reduction in vibration transmission.
4.2.2 Data for y-axis
The y-axis data exhibit two resonances; the first resonance may be associated with the palm-wrist-forearm system as already described. There is also a second resonance that occurs at around 200Hz to 250Hz. This resonance is likely to be related to the resonance of the adaptor on the glove material as shown in Figure 8. The model proposed by Dong et al indicates a resonance of the fingers between 180Hz to 250Hz, depending on whether the hand is gloved or un-gloved and depending on the properties of the glove. It is not known how the resonances of the hand-arm system may change when the vibration is in the y-axis. It is possible that in the measurements presented here, resonances of the adaptor and the fingers have coincided to increase the measured transmissibility at these frequencies. Both resonances persist in the mean plus 1 standard deviation transmissibility data shown in Figure 7b. As in the x- and z-axes, at frequencies of 400Hz and above, the glove shows good reduction in vibration transmission.
4.3 ESTIMATES OF EFFECT OF GLOVE ON FREQUENCY WEIGHTED VIBRATION
The one third octave band mean plus one standard deviation transmissibility data for all three axes have been used as simple multiplication factors to estimate the frequency weighted level that an operator will experience for two tools. These data are presented in Table 1. The data from Table 1 have been summarised in Table 2. It is estimated that the glove could provide between 3% amplification and 30% reduction in the total value frequency weighted vibration for the two tools on which vibration measurements were made.
The calculations assume that the grip and feed force and other influencing conditions such as temperature and humidity are the same as in the test conditions.
When considering the data presented in Table 1 for the individual axes, the z-axis has the strongest overall influence on the vibration total value because the vibration magnitudes are usually the largest. The glove is estimated to amplify the vibration in all cases by up to 8%. In the shaker tests, the glove is acting in compression in the z-axis.
In the x-axis, the estimate of the performance of the glove ranges from 71% reduction to 10% amplification depending on the tool and mode of operation. Again the glove is acting in compression in the x-axis but the palm adaptor is located in a different part of the hand as can be seen in Figure 3d.
In the y-axis, the glove is estimated to reduce vibration by between 13 and 50%, but the vibration magnitudes are generally smaller than in the x- or z-axes so marginalising the attenuation provided by the glove. The glove is acting in shear in the y-axis.
20

Table 2. Summary of the range of percentage reduction in vibration total value using shaker test transmissibilities and example applications of the glove
Tool Extremes in percentage reduction/amplification in
vibration total value
230mm angle grinder 3% 15%
Multipurpose tool 7% 30%
4.3.1 Effects of dominant operating frequency of tools
From the transmissibility measurements on the shaker shown in Table 1, the best case indication of attenuation (-71%) is for the x-axis on the cutting tool when sanding plywood. Figure 9 shows the mean plus one standard deviation transmissibility curve measured for the glove in the x-axis compared to an example vibration spectrum for the x-axis of the multipurpose tool. This figure helps to illustrate the influence that the dominant frequency of operation of the tool has on the estimate of the protection that a glove can provide.
Figure 9 shows that for the multipurpose tool, the dominant frequency of operation is in the 315Hz one third octave band. Most of the vibration energy of the tool is at this frequency or above. At 315Hz the measured mean plus one standard deviation transmissibility factor is 0.24, which means that the estimated effect of the glove on the vibration magnitude at this frequency is to reduce it by approximately 76%. The amplification caused by the glove at low frequencies (around 63 Hz) is applied to insignificant vibration magnitudes and the attenuation achieved at high frequencies (400 Hz and above) is applied to high magnitudes of vibration, so the overall effect in the x-axis alone is estimated to be a reduction in frequency weighted vibration of 71%.
0
1
2
6.3 10 16 25 40 100 160 250 400 630 1000
( )
iib
ility
0.01
0.1
1
10
100
li
/
Gl Vi i
63
Frequency Hz
Tran
smss
Acce
erat
on (m
s²)
ove attenuation brat on spectrum
Figure 9. X-axis glove transmissibility and x-axis vibration spectrum for multipurpose tool
21
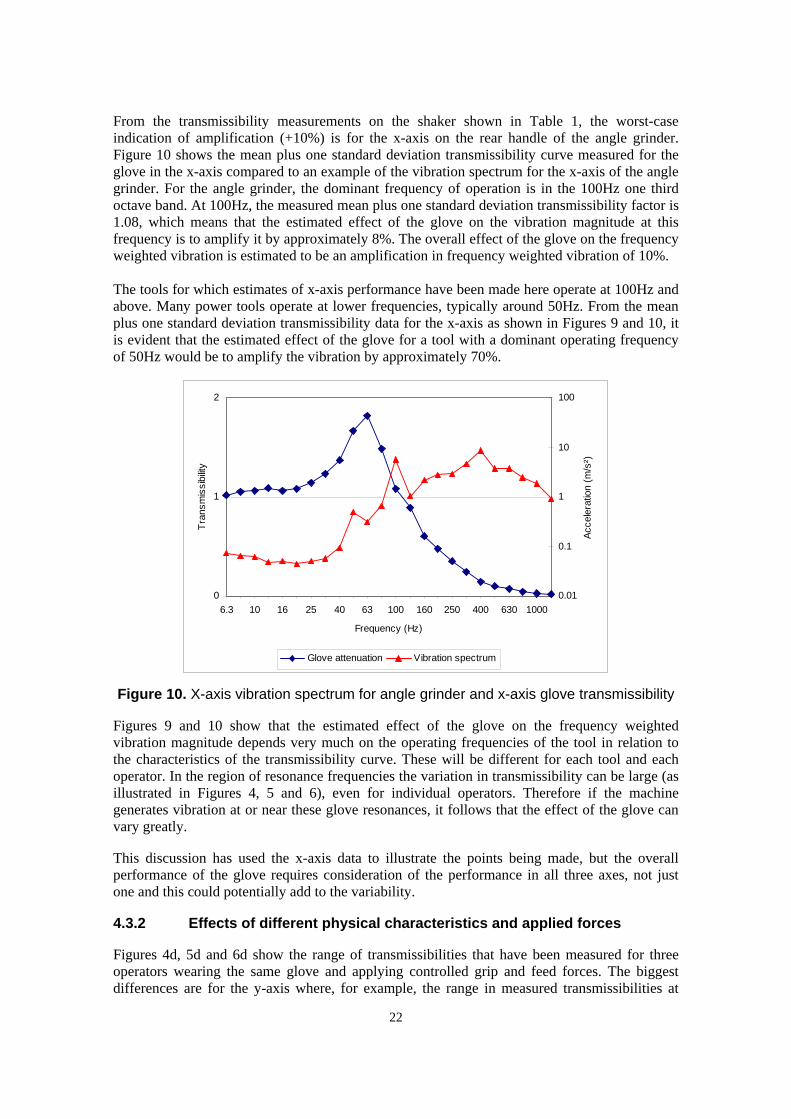
From the transmissibility measurements on the shaker shown in Table 1, the worst-case indication of amplification (+10%) is for the x-axis on the rear handle of the angle grinder. Figure 10 shows the mean plus one standard deviation transmissibility curve measured for the glove in the x-axis compared to an example of the vibration spectrum for the x-axis of the angle grinder. For the angle grinder, the dominant frequency of operation is in the 100Hz one third octave band. At 100Hz, the measured mean plus one standard deviation transmissibility factor is 1.08, which means that the estimated effect of the glove on the vibration magnitude at this frequency is to amplify it by approximately 8%. The overall effect of the glove on the frequency weighted vibration is estimated to be an amplification in frequency weighted vibration of 10%.
The tools for which estimates of x-axis performance have been made here operate at 100Hz and above. Many power tools operate at lower frequencies, typically around 50Hz. From the mean plus one standard deviation transmissibility data for the x-axis as shown in Figures 9 and 10, it is evident that the estimated effect of the glove for a tool with a dominant operating frequency of 50Hz would be to amplify the vibration by approximately 70%.
0
1
2
6.3 10 16 25 40 100 160 250 400 630 1000
( )
iib
ili
0.01
0.1
1
10
100
li
/
Gl Vi i
63
Frequency Hz
Tran
smss
ty
Acce
erat
on (m
s²)
ove attenuation brat on spectrum
Figure 10. X-axis vibration spectrum for angle grinder and x-axis glove transmissibility
Figures 9 and 10 show that the estimated effect of the glove on the frequency weighted vibration magnitude depends very much on the operating frequencies of the tool in relation to the characteristics of the transmissibility curve. These will be different for each tool and each operator. In the region of resonance frequencies the variation in transmissibility can be large (as illustrated in Figures 4, 5 and 6), even for individual operators. Therefore if the machine generates vibration at or near these glove resonances, it follows that the effect of the glove can vary greatly.
This discussion has used the x-axis data to illustrate the points being made, but the overall performance of the glove requires consideration of the performance in all three axes, not just one and this could potentially add to the variability.
4.3.2 Effects of different physical characteristics and applied forces
Figures 4d, 5d and 6d show the range of transmissibilities that have been measured for three operators wearing the same glove and applying controlled grip and feed forces. The biggest differences are for the y-axis where, for example, the range in measured transmissibilities at
22
160Hz between the three operators is from 0.36 for operator 1 to 1.79 for operator 3. This means that for a tool with a dominant frequency at around 160Hz, the difference in y-axis performance could be from 36% reduction to 79% amplification in vibration magnitude.
Differences in grip and feed force can have a considerable effect on measured vibration transmissibility. During the bare hand measurements made to validate the technique used on the shaker, it was found to be important to apply a reasonable amount of grip and feed force (30N grip and 50N feed force were used) to get agreement between the measurement on the handle and the measurement with the palm adaptor. If less force was used, resonances prevented the two measurements from adequately corresponding.
In the results of the transmissibility evaluations shown in Figures 4, 5 and 6, the differences in resonances within operators, are thought to be partly attributable to slight differences in forces applied and location of the adaptor with in the palm of the hand. Since the grip and feed forces that different operators use when operating a power tool can vary greatly from tool to tool and from application to application, it is likely that there will be a wide natural variation in frequencies and magnitudes of the peaks and troughs in the transmissibilities that might be result from wearing of a glove. Therefore the amount of protection that the glove might afford even for one operator, will also be highly variable.
If we examine the y-axis transmissibility curves for operator 3 shown in Figure 6c at 160Hz, the range of evaluated transmissibilities is from 0.40 to 1.79, which is almost as much as the difference between all three operators. If slight changes in the measurement conditions can result in a change from 60% reduction in frequency weighted vibration to 79% amplification, then it is clear that the uncertainty apparent in the test method, combined with the variability in performance of the glove, makes it totally inadequate for assessing the likelihood that a glove can provide protection to the wearer.
23
5 CONCLUSIONS
The Control of Vibration at Work Regulations (2005) require assessment of vibration exposure in three orthogonal axes. Consequently, any test to assess the performance of an anti-vibration glove, whether for the purposes of declaration, or as part of a risk assessment, should take account of the likely properties of the glove in three axes. To achieve this, it is necessary to consider the properties and performance of a glove in shear as well as in compression modes.
The use of an adaptor in the palm of the hand to measure transmissibility of a glove, is the technique applied in BS EN ISO 10819:1997. It has been shown that the use of an adaptor can heavily influence the results, whether measurements are made under controlled conditions in the laboratory using a shaker, or by measuring directly on a tool handle.
Indications from the evaluation of glove transmissibility made using a shaker in the laboratory show that for the two tools for which the manufacturer is advocating glove use, the glove may provide up to a 30% reduction in the total frequency weighted vibration transmitted to the hand in some instances. In other instances, results show that the glove may cause 3% amplification of the total value. The glove was shown to provide good reduction in vibration transmission in all axes at frequencies above 400Hz.
The attempts reported here to make triaxial measurements of the performance of anti-vibration gloves on the handles of real machines showed that it was not possible to make a satisfactory reference measurement, i.e. to get agreement between simultaneous measurements on the handle and at the palm of the bare-hand. The conclusion is therefore that, any data obtained by using an adaptor for triaxial evaluation of gloves on real machines should be regarded with great caution.
The vibration attenuating performance of the glove tested here is shown to be heavily dependent on the main operating frequency of the tool with which the glove will be used as well as the individual operator and the grip and feed force which will be applied by the operator during its use. Therefore it would be necessary to make individual assessments of the properties and performance of a glove for each tool and operator combination to meet the requirements of the PPE at Work Regulations 1992 and even this level of assessment could be subject to considerable uncertainty.
The vibration reducing potential of the gloves tested is small and uncertain and includes the potential for amplification. Gloves can not be relied upon to reduce an operator’s exposure to vibration, even when the vibration characteristics of the tool are known.
Further work is necessary to develop a satisfactory test method for assessing the performance of anti-vibration gloves in three axes.
24

6 REFERENCES
Boileau P-E, Boutin J, Rakheja S and Dong R (2002). Critical evaluation of a laboratory test procedure for measuring the vibration transmissibility of gloves. Proceedings of 37th UK Conference on Human Response to Vibration, Loughborough University, UK. pp 106 –117.
British Standards Institute (1997) Mechanical vibration and shock – Hand arm vibration – Method for the measurement and evaluation of the vibration transmissibility of gloves at the palm of the hand. BS EN ISO 10819.
British Standards Institute (2001) Mechanical vibration – Measurement and evaluation of human exposure to hand-transmitted vibration. BS EN ISO 5349.
British Standards Institute (1995) Hand-held portable power tools – Measurement of vibrations at the handle. Part 4. Grinding machines. BS EN ISO 8662-4.
Control of Vibration at Work Regulations 2005. Statutory Instrument 2005 No. 1093
Council Directive 89/656/EEC on the minimum health and safety requirements for the use by workers of personal protective equipment at the workplace (third individual directive within the meaning of Article 16 (1) of Directive 89/391/EEC). Official Journal L93 , 30/12/1989, P18-28.
Dong R G, Mc Dowell T W, Welcome D E, Warren C, Wu J Z and Rakheja S. (2009) “Analysis of anti-vibration gloves mechanism and evaluation methods”. Journal of Sound and Vibration, Volume 321, Issues 1-2, pages 435-453. 20 March 2009.
Pinto I, Stacchini N, Bovenzi M, Paddan G S and Griffin M J (2001) “Protection effectiveness of anti-vibration gloves: field evaluation and laboratory performance assessment”. Paper presented at 9th International Conference on Hand-arm Vibration, Nancy, France.
The Personal Protective Equipment at Work Regulations 1992. Statutory Instrument No. 2966.
25

APPENDIX A – DIRECT MEASUREMENT ON MACHINE HANDLES
A.1 DIRECT MEASUREMENTS ON MACHINE HANDLES
Following the sequential measurements of the transmissibility of each axis on the shaker, simultaneous triaxial measurements were carried out on two machines:
• A 180mm pneumatic vertical grinder
• A 125mm electric angle grinder
The vertical grinder has a hollow but rigid, metal handle and is shown in Figure A.1a. For this tool, attempts were made to measure the effectiveness of the glove at reducing the vibration magnitude at the operator’s hand when running the vertical grinder under BS EN ISO 8662-4 (1995) emission test conditions.
The 125mm angle grinder has a hollow plastic side handle as shown in Figure A.1b. The tool is part of an HSL vibration demonstration and is fitted with an out-of-balance wheel which generates high levels of vibration.
For the measurements on tool handles, a triaxial block fitted with three type 4374 transducers was bolted to the inside of the hollow handle of the grinders in the centre of the gripping zone. The M3 screw used to attach the block to the inside of the handle was countersunk in to the handle surface so that the palm adaptor could fit flush with the surface of the handle. Figure A.1c shows the mounting block with three B&K type 4374 transducers attached. The palm adaptor was the same as used for the shaker measurements as shown in Figure 2f with three B&K type 4374 transducers waxed in to position for the measurements.
Figure A.1a. Vertical grinder used for tests on tool handles (handle to right of photograph used for measurements)
26

Figure A.1b. 125mm angle grinder used for tests on tool handles
Figure A.1c. Mounting block with 4374s glued in position
A.1.1 Verification of measurement technique
As with the shaker measurements, the first stage of the technique was to verify the measurements with the bare hand to prove the measurement system. For measurements on tool handles, it is only expected that verification can be achieve at frequencies where there is a good signal-to-noise ratio, such as at the main operating frequency of the tool. At frequencies where the tool produces little vibration, the differences between the small vibration signal and background noise can heavily influence the apparent transmissibility.
A.2 VALIDATION OF MEASUREMENT TECHNIQUE
For the transmissibility measurements made on the 180mm vertical and 125mm angle grinders, repeated attempts were made to validate the method by attempting to get agreement between the
27

measurements inside the handle and those using the adaptor in all three axes simultaneously without using a glove. These attempts were all unsuccessful. It was not possible to validate the measurement technique because agreement could not be obtained between all three axes at the same time.
The results of the bare hand measurements made with one operator on the 180mm vertical grinder and the 125mm angle grinder are shown in Table A.1. In the Table, text in red indicates amplification.
Table A.1 Results of bare hand measurements
File Frequency weighted acceleration on adaptor
(m/s2)
Frequency weighted acceleration on tool
handle (m/s2)
% Difference between handle and adaptor
X Y Z SUM X Y Z SUM X Y Z TOT 180mm Vertical grinder
T1 2.6 1.0 4.9 5.7 1.5 1.3 5.5 5.9 77 -22 -11 -3 T2 2.7 1.0 5.0 5.8 1.5 1.3 5.6 6.0 73 -23 -11 -3 T3 1.8 0.9 5.1 5.5 2.5 2.0 5.2 6.1 -27 -53 -2 -10
After T3 modifications were made to set up to try to improve agreement T5 1.9 1.0 4.7 5.2 1.9 1.6 4.8 5.4 0 -34 -2 -4 T6 1.8 1.1 4.8 5.2 1.8 1.7 4.8 5.3 2 -33 0 -3 T7 1.8 0.7 5.7 6.0 1.6 1.4 5.6 6.0 9 -46 3 1
125mm Angle grinder T8 7.9 7.4 9.3 14.3 8.2 5.1 9.5 13.5 -4 45 -2 5 T9 9.4 6.9 15.1 19.1 9.0 4.9 13.9 17.3 4 41 9 10
For the vertical grinder, in terms of the total values the range of variation is from +1% to -10%. Bearing in mind that for the bare hand transmissibility, the magnitudes should be the same on the handle and on the adaptor, this is not considered to be within acceptable limits. When each axis is considered individually, the maximum difference is +77% in the x-axis and -46% in the y-axis. The ranges on the individual axes are clearly far too great to be acceptable. The variation on the angle grinder showed particularly unacceptable variation in the y-axis and again the total values are not within acceptable limits.
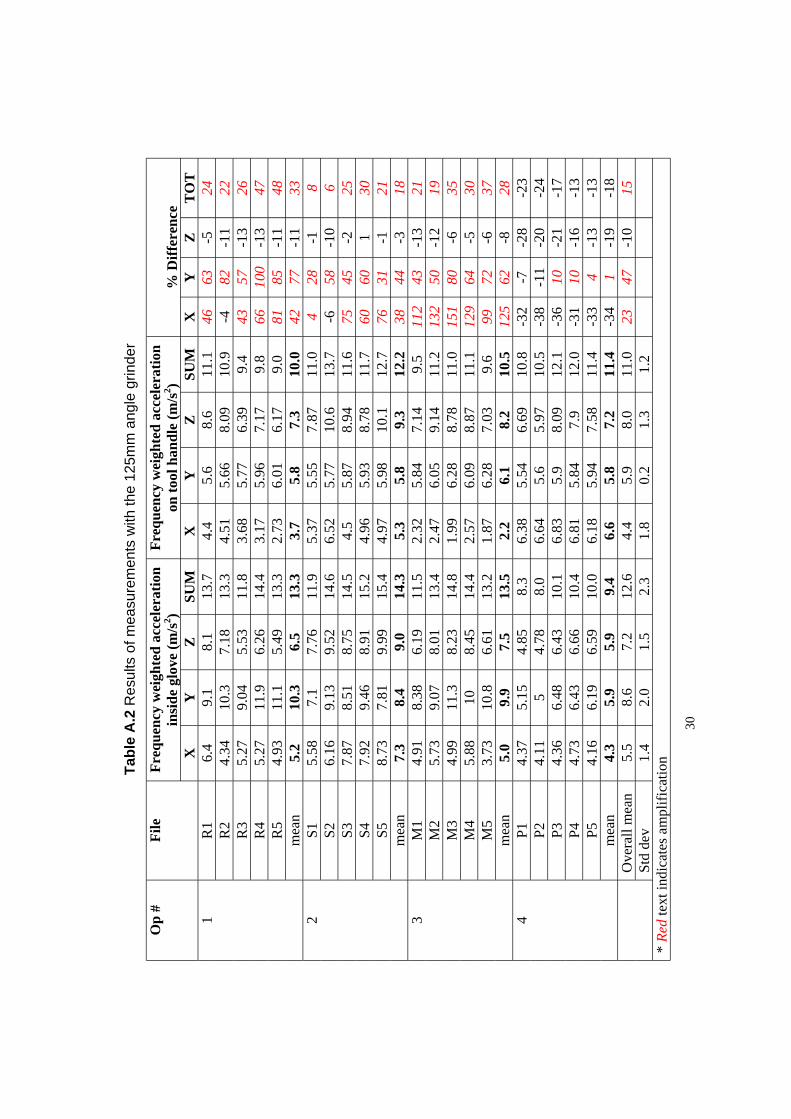
The data in Table A.1 show that the technique on real tools was not validated. The results of further tests are presented to show the range and variation in apparent attenuation values that might be obtained when measuring vibration on a power tool using an adaptor inside a glove and to compare these with the magnitudes measured for the bare hand. Table A.2 contains the results of the measurements made with four different operators on the angle grinder.
NB. It is important to note that the results presented here do not reflect the true performance of the glove.
For the 125mm angle grinder, the transmissibility evaluation, in terms of the vibration total value, ranges from an apparent reduction of 24% to an apparent amplification of 48%. Considering the effect of the glove on each axis, the maximum apparent reduction was 38% for P2 in the x-axis and the maximum apparent amplification is 151% for M3 in the x-axis.
28
A.3 DISCUSSION
The measurement technique used was to measure simultaneously inside the handle and in the palm of the hand using an adaptor. However, validation of the technique was not achieved because there was no agreement between the magnitudes measured on the handle and those measured by the adaptor without a glove, as shown in Table A.1. This problem occurred at the main frequency of operation of the tools which was 100Hz.
The data in Table A.2 were collected to get an indication of the range of apparent values that can be measured. Wide ranges of values were measured and these wide variations are taken to be an indication of the unsuitability of using a palm adaptor to attempt to measure hand-arm vibration and anti-vibration glove attenuating properties in this way. It is important to recognise that these results do not reflect the true performance of the glove.
Other measurements of glove performance have been reported in the literature for example Pinto et al (2001). Pinto measured on the handles of power tools using an adaptor, first with and then without a glove to compare the difference. She also used measurements on a shaker to predict the effectiveness of the same gloves. Examination of the data shows that there is a similar pattern of variation to the data measured using an adaptor inside the glove, with large variations between measurement results for different tests.
29
Tabl
e A
.2 R
esul
ts o
f mea
sure
men
ts w
ith th
e 12
5mm
ang
le g
rinde
r
Op
# Fi
le
Freq
uenc
y w
eigh
ted
acce
lera
tion
insi
de g
love
( m/s
2 ) Fr
eque
ncy
wei
ghte
d ac
cele
ratio
n on
tool
han
dle
(m/s
2 ) %
Diff
eren
ce
X
Y
Z
SUM
X
Y
Z
SU
M
X
Y
Z
TO
T
1 R
1 6.
4 9.
1 8.
1 13
.7
4.4
5.6
8.6
11.1
46
63
-5
24
R
2 4.
34
10.3
7.
18
13.3
4.
51
5.66
8.
09
10.9
-4
82
-1
1 22
R
3 5.
27
9.04
5.
53
11.8
3.
68
5.77
6.
39
9.4
43
57
-13
26
R4
5.27
11
.9
6.26
14
.4
3.17
5.
96
7.17
9.
8 66
10
0 -1
3 47
R
5 4.
93
11.1
5.
49
13.3
2.
73
6.01
6.
17
9.0
81
85
-11
48
mea
n 5.
2 10
.3
6.5
13.3
3.
7 5.
8 7.
3 10
.0
42
77
-11
33
2 S1
5.
58
7.1
7.76
11
.9
5.37
5.
55
7.87
11
.0
4 28
-1
8
S2
6.16
9.
13
9.52
14
.6
6.52
5.
77
10.6
13
.7
-6
58
-10
6 S3
7.
87
8.51
8.
75
14.5
4.
5 5.
87
8.94
11
.6
75
45
-2
25
S4
7.92
9.
46
8.91
15
.2
4.96
5.
93
8.78
11
.7
60
60
1 30
S5
8.
73
7.81
9.
99
15.4
4.
97
5.98
10
.1
12.7
76
31
-1
21
m
ean
7.3
8.4
9.0
14.3
5.
3 5.
8 9.
3 12
.2
38
44
-3
18
3 M
1 4.
91
8.38
6.
19
11.5
2.
32
5.84
7.
14
9.5
112
43
-13
21
M2
5.73
9.
07
8.01
13
.4
2.47
6.
05
9.14
11
.2
132
50
-12
19
M3
4.99
11
.3
8.23
14
.8
1.99
6.
28
8.78
11
.0
151
80
-6
35
M4
5.88
10
8.
45
14.4
2.
57
6.09
8.
87
11.1
12
9 64
-5
30
M
5 3.
73
10.8
6.
61
13.2
1.
87
6.28
7.
03
9.6
99
72
-6
37
mea
n 5.
0 9.
9 7.
5 13
.5
2.2
6.1
8.2
10.5
12
5 62
-8
28
4
P1
4.37
5.
15
4.85
8.
3 6.
38
5.54
6.
69
10.8
-3
2 -7
-2
8 -2
3 P2
4.
11
5 4.
78
8.0
6.64
5.
6 5.
97
10.5
-3
8 -1
1 -2
0 -2
4 P3
4.
36
6.48
6.
43
10.1
6.
83
5.9
8.09
12
.1
-36
10
-21
-17
P4
4.73
6.
43
6.66
10
.4
6.81
5.
84
7.9
12.0
-3
1 10
-1
6 -1
3 P5
4.
16
6.19
6.
59
10.0
6.
18
5.94
7.
58
11.4
-3
3 4
-13
-13
mea
n 4.
3 5.
9 5.
9 9.
4 6.
6 5.
8 7.
2 11
.4
-34
1 -1
9 -1
8 O
vera
ll m
ean
5.5
8.6
7.2
12.6
4.
4 5.
9 8.
0 11
.0
23
47
-10
15
Std
dev
1.4
2.0
1.5
2.3
1.8
0.2
1.3
1.2
* Re
d te
xt in
dica
tes a
mpl
ifica
tion
30

APP
END
IX B
– M
ULT
IPU
RPO
SE M
AC
HIN
E –
ESTI
MA
TED
TR
AN
SMIS
SIB
ILIT
IES
APP
END
IX B
.1.X
Glo
ve te
st d
etai
ls:
Not
es:
T est
dat
e:
Test
hou
se:
Attn
. Dat
a:
Tool
Spe
ctru
m d
etai
ls:
Tool
type
: A
x is:
O
pera
tion:
X-a
xis
trans
mis
sibi
lity
18-F
eb-0
8 H
SLM
ean
+ 1
Std
.dev
.
Mul
tipur
pose
tool
X C
uttin
g ch
ipbo
ard
Wh
wei
ghte
d le
vel w
ithou
t glo
ves:
Wh
wei
ghte
d le
vel w
ith g
love
s:
Red
uctio
n:
Mul
ti cu
t chi
p x
5.3
m/s
²
1.7
m/s
²
68%
110
10
25
63
l
ll
il
012 6.3
25
Attenuation factor
Tool
Spe
ctra
0.01
0.1
100
1000
6.3
16
40
100
160
250
400
630
1000
Freq
uenc
y (H
z)
Acceeration (m/s²)
Acc
eler
atio
n - n
o g
ove
Acc
eer
atio
n - w
th g
ove
Glo
ve tr
ansm
issi
bilit
y
0.5
1.5
12.5
50
10
0 20
0 40
0 80
0
Freq
uenc
y (H
z)
31

APP
END
IX B
.1.Y
Glo
ve te
st d
etai
ls:
Not
es:
Y-ax
is tr
ansm
issi
bilit
y Te
st d
ate:
18
-Feb
-08
T est
hou
se:
HSL
A
ttn. D
ata:
M
ean
+ 1
Std
.dev
.
Tool
Spe
ctru
m d
etai
ls:
Tool
type
: M
ultip
urpo
se to
ol
Ax i
s:
Y
Ope
ratio
n:
Cut
ting
chip
boar
d
Wh
wei
ghte
d le
vel w
ithou
t glo
ves:
Wh
wei
ghte
d le
vel w
ith g
love
s:
Red
uctio
n:
Mul
ti cu
t chi
p y
1.0
m/s
²
0.8
m/s
²
20%
110
10
25
63
ll
il
012 6.3
25
Attenuation factor
Tool
Spe
ctra
0.01
0.1
100
1000
6.3
16
40
100
160
250
400
630
1000
Freq
uenc
y (H
z)
Acceleration (m/s ²)
Acc
eler
atio
n - n
o g
ove
Acc
eer
atio
n - w
th g
ove
Glo
ve tr
ansm
issi
bilit
y
0.5
1.5
12.5
50
10
0 20
0 40
0 80
0
Freq
uenc
y (H
z)
32
APP
END
IX B
.2.X
Glo
ve te
st d
etai
ls:
Not
es:
Test
dat
e:
Test
hou
se:
Attn
. Dat
a:
Tool
Spe
ctru
m d
etai
ls:
Tool
type
: A
x is:
O
pera
tion:
X-a
xis
trans
mis
sibi
lity
18-F
eb-0
8 H
SLM
ean
+ 1
Std
.dev
.
Mul
tipur
pose
tool
X S a
ndin
g pl
ywoo
d
Wh
wei
ghte
d le
vel w
ithou
t glo
ves:
Wh
wei
ghte
d le
vel w
ith g
love
s:
Red
uctio
n:
33
Mul
ti sa
nd p
ly
1.4
m/s
²
0.4
m/s
²
71%
110
10
25
63
li
il
012 6.3
25
Attenuation factor
Tool
Spe
ctra
0.01
0.1
100
1000
6.3
16
40
100
160
250
400
630
1000
Freq
uenc
y (H
z)
Accelerati on (m/s ²)
Acc
eler
atio
n - n
o g
ove
Acc
eler
aton
- w
th g
ove
Glo
ve tr
ansm
issi
bilit
y
0.5
1.5
12.5
50
10
0 20
0 40
0 80
0
Freq
uenc
y (H
z)
APP
END
IX B
.2.Y
Glo
ve te
st d
etai
ls:
Not
es:
Y-ax
is tr
ansm
issi
bilit
y Te
st d
ate:
18
-Feb
-08
T est
hou
se:
HSL
A
ttn. D
ata:
M
ean
+ 1
Std
.dev
.
Tool
Spe
ctru
m d
etai
ls:
Tool
type
: M
ultip
urpo
se to
ol
Ax i
s:
Y
Ope
ratio
n:
Sand
ing
plyw
ood
Wh
wei
ghte
d le
vel w
ithou
t glo
ves:
Wh
wei
ghte
d le
vel w
ith g
love
s:
Red
uctio
n:
Mul
ti sa
nd p
ly
0.8
m/s
²
0.4
m/s
²
50%
110
10
25
63
li
il
012 6.3
25
Attenuation factor
Tool
Spe
ctra
0.01
0.1
100
1000
6.3
16
40
100
160
250
400
630
1000
Freq
uenc
y (H
z)
Accelerati on (m/s ²)
Acc
eler
atio
n - n
o g
ove
Acc
eler
aton
- w
th g
ove
Glo
ve tr
ansm
issi
bilit
y
0.5
1.5
12.5
50
10
0 20
0 40
0 80
0
Freq
uenc
y (H
z)
34

APP
END
IX B
.2.Z
Glo
ve te
st d
etai
ls:
Not
es:
Z-ax
is tr
ansm
issi
bilit
y Te
st d
ate:
18
-Feb
-08
T est
hou
se:
HSL
A
ttn. D
ata:
M
ean
+ 1
Std
.dev
.
Tool
Spe
ctru
m d
etai
ls:
Tool
type
: M
ultip
urpo
se to
ol
Ax i
s:
Z O
pera
tion:
Sa
ndin
g pl
ywoo
d
Wh
wei
ghte
d le
vel w
ithou
t glo
ves:
Wh
wei
ghte
d le
vel w
ith g
love
s:
Red
uctio
n:
Mul
ti sa
nd p
ly
1.2
m/s
²
1.3
m/s
²
-8%
110
10
25
63
li
il
012 6.3
25
Attenuation factor
Tool
Spe
ctra
0.01
0.1
100
1000
6.3
16
40
100
160
250
400
630
1000
Freq
uenc
y (H
z)
Accelerati on (m/s ²)
Acc
eler
atio
n - n
o g
ove
Acc
eler
aton
- w
th g
ove
Glo
ve tr
ansm
issi
bilit
y
0.5
1.5
12.5
50
10
0 20
0 40
0 80
0
Freq
uenc
y (H
z)
35

APP
END
IX B
.3.X
Glo
ve te
st d
etai
ls:
Not
es:
Test
dat
e:
Test
hou
se:
Attn
. Dat
a:
Tool
Spe
ctru
m d
etai
ls:
Tool
type
: A
x is:
O
pera
tion:
X-a
xis
trans
mis
sibi
lity
18-F
eb-0
8 H
SLM
ean
+ 1
Std
.dev
.
Mul
tipur
pose
tool
X S a
ndin
g ch
ipbo
ard
Wh
wei
ghte
d le
vel w
ithou
t glo
ves:
Wh
wei
ghte
d le
vel w
ith g
love
s:
Red
uctio
n:
Mul
ti sa
nd c
hip
x
1.3
m/s
²
0.4
m/s
²
69%
110
10
25
63
li
il
012 6.3
25
Attenuation factor
Tool
Spe
ctra
0.01
0.1
100
1000
6.3
16
40
100
160
250
400
630
1000
Freq
uenc
y (H
z)
Accelerati on (m/s ²)
Acc
eler
atio
n - n
o g
ove
Acc
eler
aton
- w
th g
ove
Glo
ve tr
ansm
issi
bilit
y
0.5
1.5
12.5
50
10
0 20
0 40
0 80
0
Freq
uenc
y (H
z)
36
APP
END
IX B
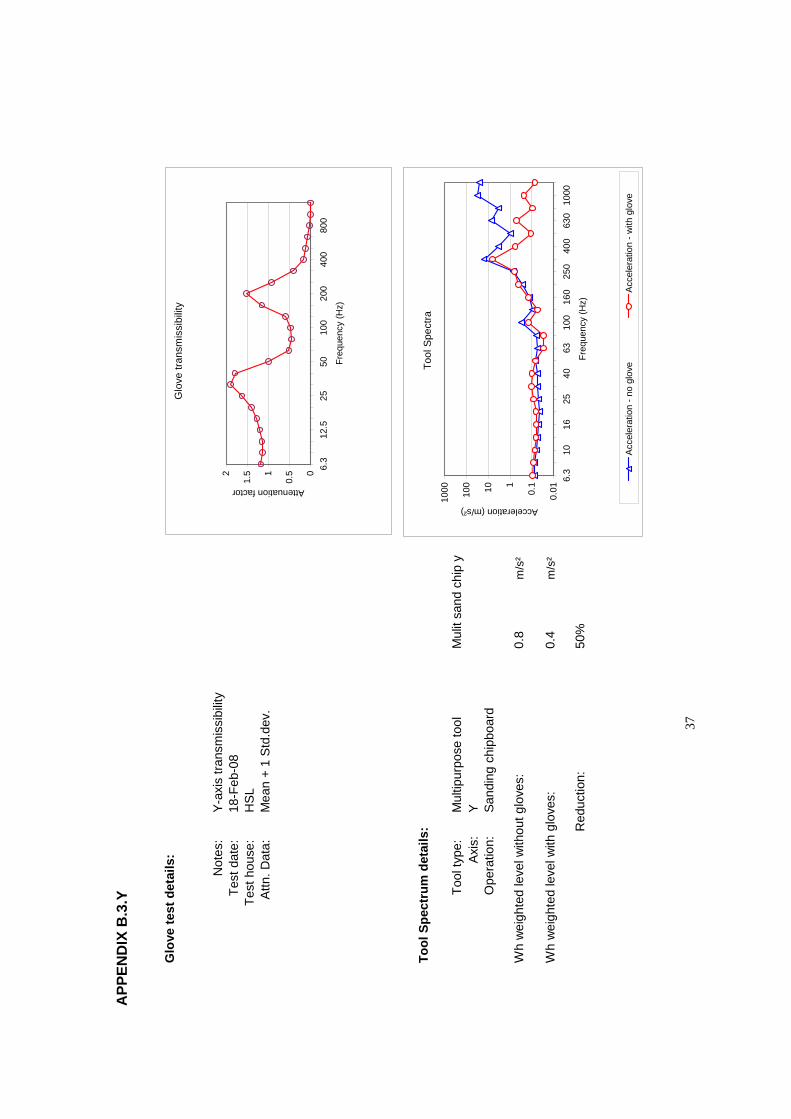
.3.Y
Glo
ve te
st d
etai
ls:
Not
es:
Y-ax
is tr
ansm
issi
bilit
y Te
st d
ate:
18
-Feb
-08
Test
hou
se:
HSL
A
ttn. D
ata:
M
ean
+ 1
Std
.dev
.
Tool
Spe
ctru
m d
etai
ls:
Tool
type
: M
ultip
urpo
se to
ol
Ax i
s:
Y
Ope
ratio
n:
Sand
ing
chip
boar
d
Wh
wei
ghte
d le
vel w
ithou
t glo
ves:
Wh
wei
ghte
d le
vel w
ith g
love
s:
Red
uctio
n:
Mul
it sa
nd c
hip
y
0.8
m/s
²
0.4
m/s
²
50%
110
10
25
63
li
il
012 6.3
25
Attenuation factor
Tool
Spe
ctra
0.01
0.1
100
1000
6.3
16
40
100
160
250
400
630
1000
Freq
uenc
y (H
z)
Accelerati on (m/s ²)
Acc
eler
atio
n - n
o g
ove
Acc
eler
aton
- w
th g
ove
Glo
ve tr
ansm
issi
bilit
y
0.5
1.5
12.5
50
10
0 20
0 40
0 80
0
Freq
uenc
y (H
z)
37
APP
END
IX B
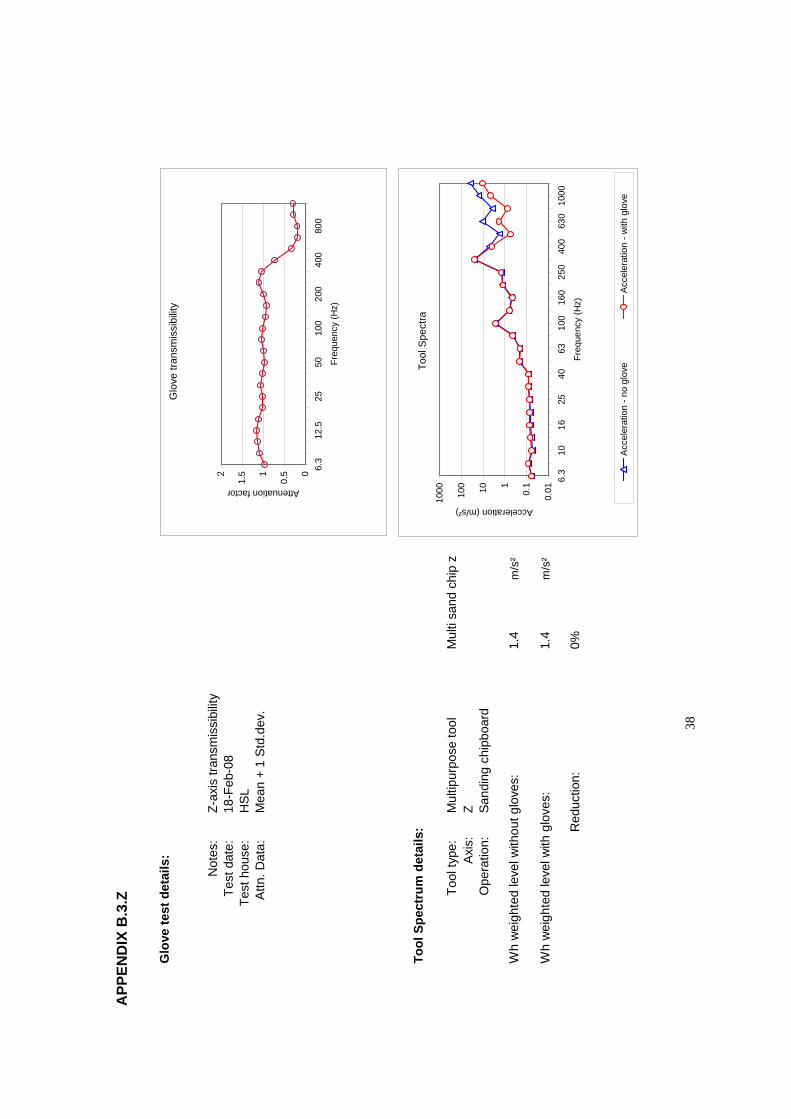
.3.Z
Glo
ve te
st d
etai
ls:
Not
es:
Test
dat
e:
Test
hou
se:
Attn
. Dat
a:
Tool
Spe
ctru
m d
etai
ls:
Tool
type
: Ax
is:
Ope
ratio
n:
Z-ax
is tr
ansm
issi
bilit
y 18
-Feb
-08
HSL
Mea
n +
1 S
td.d
ev.
Mul
tipur
pose
tool
Z Sa
ndin
g ch
ipbo
ard
Wh
wei
ghte
d le
vel w
ithou
t glo
ves:
Wh
wei
ghte
d le
vel w
ith g
love
s:
Red
uctio
n:
Mul
ti sa
nd c
hip
z
1.4
m/s
²
1.4
m/s
²
0%
110
10
25
63
li
il
012 6.3
25
Attenuation factor
Tool
Spe
ctra
0.01
0.1
100
1000
6.3
16
40
100
160
250
400
630
1000
Freq
uenc
y (H
z)
Accelerati on (m/s ²)
Acc
eler
atio
n - n
o g
ove
Acc
eler
aton
- w
th g
ove
Glo
ve tr
ansm
issi
bilit
y
0.5
1.5
12.5
50
10
0 20
0 40
0 80
0
Freq
uenc
y (H
z)
38

APP
END
IX C
– A
NG
LE G
RIN
DER
– E
STIM
ATE
D T
RA
NSM
ISSI
BIL
ITIE
S
APP
END
IX C
.1.X
Glo
ve te
st d
etai
ls:
Not
es:
Test
dat
e:
Test
hou
se:
Attn
. Dat
a:
Tool
Spe
ctru
m d
etai
ls:
Tool
type
: A
x is:
O
pera
tion:
X-a
xis
trans
mis
sibi
lity
18-F
eb-0
8 H
SLM
ean
+ 1
Std
.dev
.
Angl
e gr
inde
r fro
nt h
andl
e An
gle
X fr
ont
X Grin
ding
mild
ste
el
Wh
wei
ghte
d le
vel w
ithou
t glo
ves:
1.
8 m
/s²
Wh
wei
ghte
d le
vel w
ith g
love
s:
1.9
m/s
²
Red
uctio
n:
-6%
39
110
10
25
63
li
il
012 6.3
25
Attenuation factor
Tool
Spe
ctra
0.01
0.1
100
1000
6.3
16
40
100
160
250
400
630
1000
Freq
uenc
y (H
z)
Accelerati on (m/s ²)
Acc
eler
atio
n - n
o g
ove
Acc
eler
aton
- w
th g
ove
Glo
ve tr
ansm
issi
bilit
y
0.5
1.5
12.5
50
10
0 20
0 40
0 80
0
Freq
uenc
y (H
z)
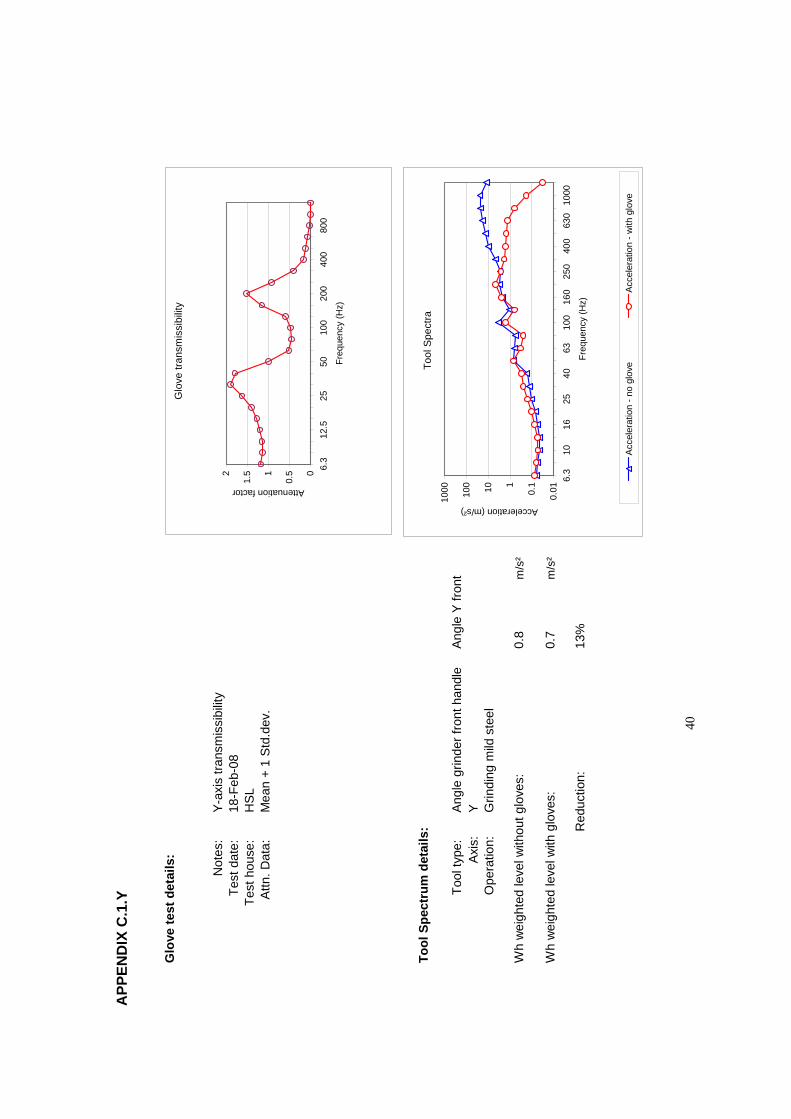
APP
END
IX C
.1.Y
Glo
ve te
st d
etai
ls:
Not
es:
Y-ax
is tr
ansm
issi
bilit
y Te
st d
ate:
18
-Feb
-08
Test
hou
se:
HSL
A
ttn. D
ata:
M
ean
+ 1
Std
.dev
.
Tool
Spe
ctru
m d
etai
ls:
Tool
type
: An
gle
grin
der f
ront
han
dle
Ax i
s:
Y
Ope
ratio
n:
Grin
ding
mild
ste
el
Wh
wei
ghte
d le
vel w
ithou
t glo
ves:
Wh
wei
ghte
d le
vel w
ith g
love
s:
Red
uctio
n:
Angl
e Y
front
0.8
m/s
²
0.7
m/s
²
13%
110
10
25
63
li
il
012 6.3
25
Attenuation factor
Tool
Spe
ctra
0.01
0.1
100
1000
6.3
16
40
100
160
250
400
630
1000
Freq
uenc
y (H
z)
Accelerati on (m/s ²)
Acc
eler
atio
n - n
o g
ove
Acc
eler
aton
- w
th g
ove
Glo
ve tr
ansm
issi
bilit
y
0.5
1.5
12.5
50
10
0 20
0 40
0 80
0
Freq
uenc
y (H
z)
40
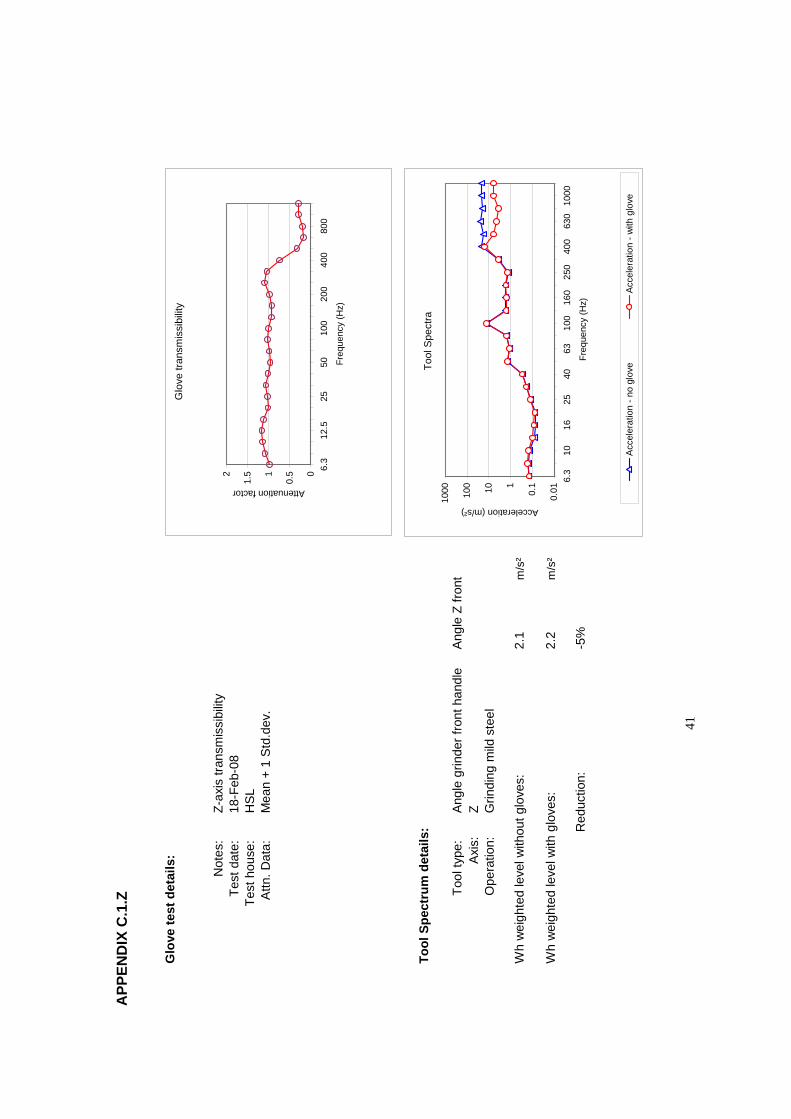
APP
END
IX C
.1.Z
Glo
ve te
st d
etai
ls:
Not
es:
Z-ax
is tr
ansm
issi
bilit
y Te
st d
ate:
18
-Feb
-08
Test
hou
se:
HSL
A
ttn. D
ata:
M
ean
+ 1
Std
.dev
.
Tool
Spe
ctru
m d
etai
ls:
Tool
type
: An
gle
grin
der f
ront
han
dle
Ax i
s:
Z O
pera
tion:
G
rindi
ng m
ild s
teel
Wh
wei
ghte
d le
vel w
ithou
t glo
ves:
Wh
wei
ghte
d le
vel w
ith g
love
s:
Red
uctio
n:
Angl
e Z
front
2.1
m/s
²
2.2
m/s
²
-5%
110
10
25
63
li
il
012 6.3
25
Attenuation factor
Tool
Spe
ctra
0.01
0.1
100
1000
6.3
16
40
100
160
250
400
630
1000
Freq
uenc
y (H
z)
Acceleration (m/s²)
Acc
eler
atio
n - n
o g
ove
Acc
eler
aton
- w
th g
ove
Glo
ve tr
ansm
issi
bilit
y
0.5
1.5
12.5
50
10
0 20
0 40
0 80
0
Freq
uenc
y (H
z)
41

APP
END
IX C
.2.X
Glo
ve te
st d
etai
ls:
Not
es:
Test
dat
e:
Test
hou
se:
Attn
. Dat
a:
Tool
Spe
ctru
m d
etai
ls:
Tool
type
: A
x is:
O
pera
tion:
X-a
xis
trans
mis
sibi
lity
18-F
eb-0
8 H
SLM
ean
+ 1
Std
.dev
.
Angl
e gr
inde
r rea
r han
dle
X Grin
ding
mild
ste
el
Wh
wei
ghte
d le
vel w
ithou
t glo
ves:
Wh
wei
ghte
d le
vel w
ith g
love
s:
Red
uctio
n:
Angl
e X
rear
1.0
m/s
²
1.1
m/s
²
-10%
110
10
25
63
li
il
012 6.3
25
Attenuation factor
Tool
Spe
ctra
0.01
0.1
100
1000
6.3
16
40
100
160
250
400
630
1000
Freq
uenc
y (H
z)
Accelerati on (m/s ²) A
ccel
erat
ion
- no
gov
e A
ccel
erat
on -
wth
gov
e
Glo
ve tr
ansm
issi
bilit
y
0.5
1.5
12.5
50
10
0 20
0 40
0 80
0
Freq
uenc
y (H
z)
42

APP
END
IX C
.2.Y
Glo
ve te
st d
etai
ls:
Not
es:
Y-ax
is tr
ansm
issi
bilit
y Te
st d
ate:
18
-Feb
-08
Test
hou
se:
HSL
A
ttn. D
ata:
M
ean
+ 1
Std
.dev
.
Tool
Spe
ctru
m d
etai
ls:
Tool
type
: An
gle
grin
der r
ear h
andl
e A
x is:
Y
O
pera
tion:
G
rindi
ng m
ild s
teel
Wh
wei
ghte
d le
vel w
ithou
t glo
ves:
Wh
wei
ghte
d le
vel w
ith g
love
s:
Red
uctio
n:
Angl
e Y
rear
1.3
m/s
²
0.7
m/s
²
46%
110
10
25
63
li
il
012 6.3
25
Attenuation factor
Tool
Spe
ctra
0.01
0.1
100
1000
6.3
16
40
100
160
250
400
630
1000
Freq
uenc
y (H
z)
Accelerati on (m/s ²) A
ccel
erat
ion
- no
gov
e A
ccel
erat
on -
wth
gov
e
Glo
ve tr
ansm
issi
bilit
y
0.5
1.5
12.5
50
10
0 20
0 40
0 80
0
Freq
uenc
y (H
z)
43
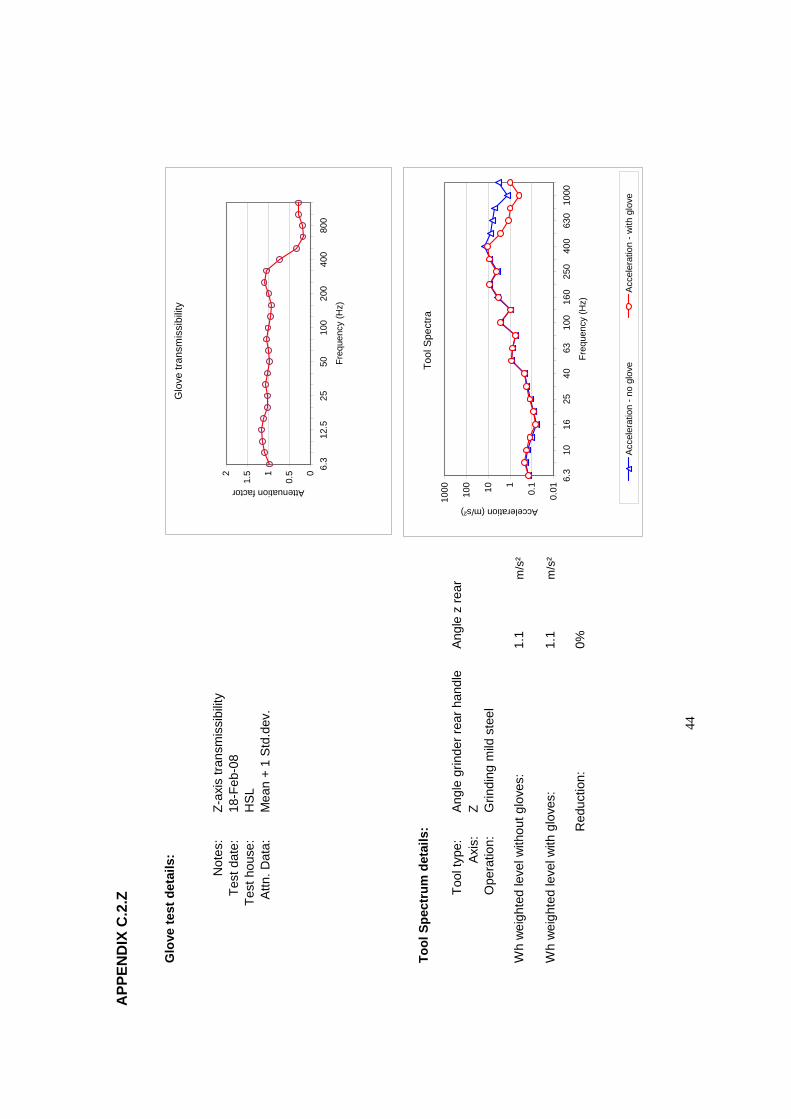
APP
END
IX C
.2.Z
Glo
ve te
st d
etai
ls:
Not
es:
Z-ax
is tr
ansm
issi
bilit
y Te
st d
ate:
18
-Feb
-08
Test
hou
se:
HSL
A
ttn. D
ata:
M
ean
+ 1
Std
.dev
.
Tool
Spe
ctru
m d
etai
ls:
Tool
type
: An
gle
grin
der r
ear h
andl
e A
x is:
Z
Ope
ratio
n:
Grin
ding
mild
ste
el
Wh
wei
ghte
d le
vel w
ithou
t glo
ves:
Wh
wei
ghte
d le
vel w
ith g
love
s:
Red
uctio
n:
Ang
le z
rear
1.1
m/s
²
1.1
m/s
²
0%
110
10
25
63
li
il
012 6.3
25
Attenuation factor
Tool
Spe
ctra
0.01
0.1
100
1000
6.3
16
40
100
160
250
400
630
1000
Freq
uenc
y (H
z)
Accelerati on (m/s ²)
Acc
eler
atio
n - n
o g
ove
Acc
eler
aton
- w
th g
ove
Glo
ve tr
ansm
issi
bilit
y
0.5
1.5
12.5
50
10
0 20
0 40
0 80
0
Freq
uenc
y (H
z)
44


Published by the Health and Safety Executive 04/10

Executive Health and Safety
Triaxial measurements of the performance of anti-vibration gloves
Previous studies of anti-vibration gloves have typically only considered the effect that a glove might have in the direction of compression of the glove material. This project investigates the performance of an anti-vibration glove taking account of the influence that the glove might have in three axes. This requires consideration of the performance of the glove material in both compression and shear. Since the adoption of the revised international standard ISO 5349-1:2001 in the UK as BS EN ISO 5349-1:2001 and the implementation of the Control of Vibration at Work Regulations 2005, the technique for assessment of exposure to vibration requires the measurement of data in three axes to provide a total vibration value. It therefore follows that any estimate of the performance of a glove intended to reduce the vibration exposure of an operator should also consider all three vibration axes.
The aim of this investigation is to either confirm or challenge the assertion made by a particular machine manufacturer, that the glove they supply will provide useful attenuation of the vibration generated by their hand-held power tool products.
This report and the work it describes were funded by the Health and Safety Executive (HSE). Its contents, including any opinions and/or conclusions expressed, are those of the author alone and do not necessarily reflect HSE policy.
RR795
www.hse.gov.uk