rr1080 - a study of the generic safety-integrity
TRANSCRIPT

A study of the generic safety-integrity requirements of fairground rides
Prepared by the Health and Safety Executive
RR1080 Research Report

© Crown copyright 2016 Prepared 2014 First published 2016 You may reuse this information (not including logos) free of charge in any format or medium, under the terms of the Open Government Licence. To view the licence visit www.nationalarchives.gov.uk/doc/open-government-licence/, write to the Information Policy Team, The National Archives, Kew, London TW9 4DU, or email [email protected]. Some images and illustrations may not be owned by the Crown so cannot be reproduced without permission of the copyright owner. Enquiries should be sent to [email protected]. This report and the work it describes were funded by the Health and Safety Executive (HSE). Its contents, including any opinions and/or conclusions expressed, are those of the authors alone and do not necessarily reflect HSE policy.
The use of computer-based control systems allows modern fairground rides to perform increasingly complex functions at very high speeds. In some cases, passenger safety will depend on the correct operation of these control systems, so their failure could compromise passenger safety. As a result, it is important that the rate of potentially dangerous control-system failures is adequately low in relation to the hazard level associated with the functions that they carry out. Quantitative risk assessment techniques are used in, for example, the process and manufacturing industries, but these techniques have been slow in moving to the fairground industry. To try and rectify this, this report sets out to illustrate how quantitative risk assessment techniques can be used to determine the target Safety Integrity Level (SIL) for the control systems of three diverse types of fairground ride, with the intention of encouraging the use of these techniques and also to indicate the expected target SIL requirements for the control systems of these typical types of ride. Having determined the target SIL, the designer can use appropriate techniques (e.g. multiple channels, extensive internal diagnostics, etc.) to ensure that the rate of potentially dangerous control system failures is adequately low, using the guidance provided by standards such as BS EN 13849 or BS EN 61508/IEC 61508.
HSE Books

Lorem ipsum dolor sit amet consectetuer adipiscing elit
A M Wray Health and Safety Executive Harpur Hill Buxton Derbyshire SK17 9JN
A study of the generic safety-integrity requirements of fairground rides

EXECUTIVE SUMMARY
Objectives
To determine generic Safety Integrity Requirements appropriate to three diverse types of fairground ride.
Main Findings
1. The probability of a typical person receiving a serious non-fatal injury when goingabout his/her normal daily life is about 1.910
-2per year.
2. The safety functions of a large rollercoaster should be designed to have a targetdangerous fault rate of no more than 1.3410
-8 per hour and be specified, designed,manufactured, documented, commissioned and operated according to the requirementsof SIL3 and any other supplementary safety-performance requirements.
3. The safety functions of a transportable lug-flume ride should be designed to have atarget probability of failure on demand of no more than 5.3610
-4 and be specified,designed, manufactured, documented, commissioned and operated according to therequirements of SIL3.
4. The safety functions of a Crazy Frog ride should be designed to have a target dangerousfault rate of no more than 2.3610
-7 per hour and be specified, designed, manufactured,documented, commissioned and operated according to the requirements of SIL2 andany other supplementary safety-performance requirements.
5. Ride manufacturers should provide appropriate documentation facilitating thecommissioning, maintenance and operation of rides in order to ensure that the as-designed SILs can be maintained throughout the lives of the rides.
1

CONTENTS
1 INTRODUCTION ..................................................................................... 3
2 BASIC SAFETY FUNCTIONS FOR EACH RIDE GROUP ..................... 5
2.1 Rollercoasters .......................................................................................... 5
2.2 Log-flume rides ........................................................................................ 7
2.3 Crazy Frog rides ...................................................................................... 8
3 QUANTIFIED RISK ASSESSMENT ........................................................ 9
3.1 Brief glossary of terms ............................................................................. 9
3.2 Rollercoaster blocking function .............................................................. 10
3.3 Log-flume ride low-water interlock ......................................................... 15
3.4 Crazy Frog ride Restraint interlock ........................................................ 24
4 COMMENTS BY THE AUTHOR ........................................................... 29
5 CONCLUSIONS .................................................................................... 31
6 REFERENCES ...................................................................................... 32
2

1 INTRODUCTION
Fairground ride examiners are often required to examine and certify rides, which have complex control systems for which little information is available. This leads at the very least to the examination being difficult, and in the worst case to it being inadequate.
Ride manufacturers have a number of standards that can be used to provide guidance in the design of rides, for example, BS EN 13814 (Reference 3.). However, although BS EN 13814 provides very detailed guidance on the physical requirements of a wide range of rides, the control-system-related guidance is comparatively sparse.
Standards such as EN 1050:1996 (Principles for risk assessment)1, EN 60204-1:2006 (Electrical equipment of machines), EN 61496 (Electro-sensitive protective equipment), and IEC 61508 (Functional safety of electrical/electronic/programmable electronic safety-related systems – Reference 2) provide useful guidance, especially IEC 61508, which can be used to specify/design/build/document/operate control systems for any application.
EN 13849, has been developed as the successor to the now withdrawn EN 954, a simple (but effective) standard that was based on the somewhat subjective principle of the Risk Graph. Like EN 954, EN 13849 is calibrated for use with industrial machinery where, although failures may infrequently lead to death, the most severe injuries that would be expected to occur in practice would be finger, or hand, amputations. As a result, the risk assessment described in EN 13849 may be inappropriate for use on a rollercoaster ride where a failure could result in, for example, multiple deaths.
IEC 61508 and EN 13849 are based on the concept of Safety Integrity Levels (SILs) and Performance levels (PLs), respectively. These provide a convenient means of describing the reliability (in terms of resistance to dangerous failures) of the control system. IEC 61508 describes an exceptionally versatile approach to risk that can be applied to any control system. This is based on the concept that the individual safety functions carried out by a control system must each have an integrity that is appropriate to the risk that susceptible persons should be allowed to face.
This report describes a number of quantitative risk assessments applied to three diverse fairground ride types in order to provide an indication of appropriate Safety Integrity Levels for these generic types of ride and to illustrate an approach that may be used to determine these SILs.
A Safety Integrity Level can range from SIL1 to SIL4. The equivalent of SIL0 would have too high a failure rate, so would be inappropriate for even the most trivial of safety applications; and the equivalent of SIL5 is not considered to be achievable in practice.
It will be noted that the methodology used in this report is based on first principles, so is independent of any standard. However, tables from IEC 61508 are used in the final stage to convert the calculated target failure2 rate, or probability of failure on demand3, to a SIL. This
1 Originally superseded by EN ISO 14121-1, but has now been absorbed into EN ISO 12100 2 This report is concerned with only safety-related failures. Clearly, if a control system fails, the failure could lead to a shut-down, which would be safe; or an aberrant stroke, which would be dangerous. This report considers only those failures that would be dangerous. (One aim of a control-system designer would be to convert potentially
3

report may be used to provide assistance in the determination of an appropriate SIL, but designing the control system to meet the requirements of the SIL is beyond the scope of this report. Therefore, having determined the required SIL, an appropriate standard (e.g., EN 13849 or, in particular, IEC 61508) can be used to specify:
• the design of the control system (together with its architecture, diagnostic and otherrequirements) that carries out the relevant safety function;
• the maintenance requirements, and
• the documentation needed to ensure that the testing, maintenance, operation, and otheraspects of the lifecycle of the ride and its control system can be carried outappropriately.
This report was intended as a discussion document in order to illustrate the use of quantitative risk assessment and to provide an indication of the SIL requirements for typical fairground rides. It was produced in conjunction with a steering group which provided information and comment throughout its development. The steering group included members from the following organizations, who have provided comment on this report.
• Amusement Devices Safety Council (ADSC)
• National Association For Leisure Industry Certification (NAFLIC)
• HSE (Mr M Sandell, chairperson of the group
• The author
The data and ideas expressed in this report are those of the author and the steering group, and not necessarily those of HSE.
dangerous faults to safe failures by means of, for example, internal diagnostics.) Therefore, in terms of this report, unless specified to the contrary, the word failure should be interpreted as a failure to danger. 3 The probability of failure on demand (PFD) is applied to protection systems that normally lie dormant until another system fails. When this happens, the protection system receives a demand and must respond by bringing the equipment into a safe state. The PFD defines the probability that the protection system will fail to respond to such a demand.
4
2 BASIC SAFETY FUNCTIONS FOR EACH RIDE GROUP
This report is intended to cover the control-related aspects of modern rides, which are progressively becoming more dependent on computer-based technology. With these types of system, it is necessary to take an organized approach that is based on the safety functions that are carried out by the control system (or systems).
To determine these safety functions, one must first determine the hazards that are associated with the ride and then identify those hazards for which the risk is controlled – at least in part – by a control system. By considering how the ride control system prevents those hazards from occurring, it will be possible to determine the basic4 safety functions associated with the control system. Clearly, any assessment of the ride must ensure that the basic safety functions operate satisfactorily; however, as will be described, not only must they operate at the outset, but also their probability of failure over the life of the ride must be adequately low.
Fairground rides come in a multitude of shapes and sizes, and each of the major groups has different safety requirements. The following ride groups will now be considered.
• Rollercoasters• Log-flume rides• Crazy Frog rides
2.1 ROLLERCOASTERS
A rollercoaster normally takes the form of a train, which is taken up a ramp by means of, for example, a chain5 lift. At the top of the ramp, the train travels under gravity until it returns to the station, from where it started.
Modern rollercoasters “cling6” to the track. Therefore, when a train passes at high speed over a point on the track where it curves downward in the pitch axis, passengers will experience a negative g force, as may passengers on rides whose track is arranged in loops or helixes. As this could lead to passengers being ejected from the train, especially those in the rear car, a restraint system is required. Clearly, passenger safety will depend on the correct operation of the restraints.
4 We are considering only those basic safety functions that will directly prevent hazards from occurring. As will be described later, there will be many other “hidden” safety functions that in themselves will not prevent the hazard, but which will ensure that the basic safety functions will be able to so do. Such “hidden” safety functions are the diagnostic functions that, for example, check the correct operation of a sensor and so ensure that the sensor is available for use by a basic safety function when required. These diagnostic functions effectively convert dangerous faults to safe failures in order to increase the SIL of a safety function so, for the purposes of this report, can be considered part of that function. 5 The lift on a rollercoaster normally uses a chain, which engages with a pawl beneath the leading car. As the chain rotates around its sprockets, it drags the train to the top of the lift. Rollback dogs, which can prevent reverse movement, may be fitted. Lifts may have other formats, for example the cars on log-flume rides may have flat bottoms allowing their operation as boats. Therefore, instead of a drive chain, the lift on a log-flume ride may employ, for example, a wide rubber belt. Clearly, the rollback dog carries out a safety function, which will require consideration even when carrying out a risk assessment associated with the control system of the ride as will become apparent. 6 Unlike a railway train, which runs on the tops of the rails and has flanges to maintain the alignment of the wheels on the track, modern (metal) rollercoaster cars have wheels above (to carry the weight of the car), inside (to ensure the car is centred on the track), and below (to ensure that the car cannot lift off the track).
5

If there were only one train on the track, it would be necessary to bring the train to a halt within the station, but braking at other points on the track would be unnecessary unless trimming of the train speed was required to compensate for passenger mass, wind speed/direction, or passengers increasing their wind resistance by, for example, holding their arms in the air.
If there were more than one train running, a mechanism must be provided that will prevent one train colliding with another. This normally takes the form of several brakes7, which are able to grip a brake fin beneath each car and either control the speed (Trim Brake), and/or bring the train to a halt (Block Brake), as appropriate.
The design of the brakes may be such that they are able to stop a car only if the speed is within certain limits. If this is the case, and the previous brake must control the train speed in order for the block-function to operate, the correct operation of the speed-control function of such a Trim Brake forms part of the block-control function.
Each brake would be located at the end of a block, this being a section of the track in which only one train is allowed at any time, the brake at the end of the previous block preventing a second train entering any particular block. The number of blocks, and, hence, brakes, will depend on many factors, including the maximum number of trains that can be on the track at any time.
The lift (of which there may be more than one) will be located at the end of a block as, by stopping its drive motor, one can prevent a car being released from the top. Smaller rollercoasters may employ drive wheels8 around the track, and larger rollercoasters may employ them in the station area. These can be used as brakes when located at the end of a block. Therefore, the number of blocks will usually be equal to the sum of the numbers of brakes, block-related drive wheels and lifts; however, extra brakes may be present in the station area in order to allow more-precise speed/position control or the queuing of trains.
To be included in this group of rides, it is immaterial whether the passenger sits in a car running above the track, or is suspended below it, and travels along a helical, circular, or other complex path – the hazards of passenger ejection, and collision between trains, will apply.
Passengers must enter and leave the cars and it is important that the cars do not move when this is being done. Therefore, prevention of unexpected start-up becomes an additional safety function. Passenger access to the station platform when trains enter the station may lead to a potential hazard, which may also need to be controlled by a safety function.
If the track allows cars, or trains of cars, to be added, or removed, from the running track, it is important that the train-transfer mechanism does not come into use whilst passengers are travelling around the track as this could result in a collision, or a derailment. Therefore, an interlock between train movement and the train-transfer system forms an additional safety function.
7 The author will use the term “brake” to mean a group of individual brake units each capable of gripping brake fins attached to the bottom of each car. 8 A drive wheel can take the form of a rubber-tyred wheel located on the track where its rotation can drive a car forward along an almost level section of track. Conversely, by stopping a drive wheel, one can bring a car to a halt.
6

Therefore, the basic safety functions considered in this report, that could contribute to a passenger fatality9 and which are associated with the rollercoaster group are:
• track-section block-control function; • ensuring passenger restraint during the ride; • prevention of premature dispatch from the station; • interlocking the train-transfer mechanism with ride operation; • prevention of passenger access to the edge of the station platform whilst trains
enter/leave the station, and • speed control. Even if the design of the rollercoaster is such that speed will not directly
lead to a hazard, speed control may be essential in order to ensure that Block Brakes, used to ensure train separation, are able to bring trains to a halt in order to avoid collisions.
The control of vertically moving passenger platforms has been considered, but excluded, as a safety function because it is considered that the failure of this safety function would most likely lead to leg/foot injuries and not death. This is especially true because the cars of the “dangly leg” rollercoasters associated with these platforms tend to enter stations at significantly lower speeds than those of conventional coasters. Nevertheless, when considering a specific rollercoaster fitted with a moving passenger platform, this may need to be considered if it can contribute to the risk.
The emergency-stop function is not considered to be a safety function because its failure may not in itself lead directly to a hazard. In addition, the use of the emergency-stop function is likely to be limited to operator observations of activities within the station, which should adequately have been addressed by other safety functions. Its failure would be very unlikely to even contribute to a fatality, and its use could potentially increase the risk to passengers of trains already travelling round the track.
This leads to a large rollercoaster having 6 safety functions having potentially fatal contributions to passenger risk.
Depending on the type, or size, of a rollercoaster, not all of these basic safety functions may be present; conversely, others may exist.
2.2 LOG-FLUME RIDES
A log-flume ride is very similar to a small rollercoaster, but has at least one water-splash10 at the foot of a steep drop in the track.
Restraints may, or not, be required but, as with a rollercoaster, if there is more than one car/boat on the track at any one time, a blocking system will be required. The blocking function can be implemented using brakes, lifts or drive wheels.
In addition to the safety requirements associated with a rollercoaster, the level of water in the Splash is very important. Because the deceleration is critically dependent on the level of water
9 In the case of a fast rollercoaster, the calculations will be based on the assumption that the potential hazard level is sufficient to lead to passenger deaths. Only those safety functions that may potentially lead to a fatality are considered. 10 The Splash takes the form of a long tank into which the cars enter at speed and are decelerated by the resistance caused by the cars displacing water forming a splash.
7

in the Splash in relation to the car (which will be running on rails as it enters the splash), accurate control of the water level becomes an important safety function for a log-flume ride.
For example:
• if the level is too low, cars may not decelerate sufficiently, leading to them leaving the Splash at high speed. This could lead to passenger ejection at a sharp curve in the track, or a high-speed (as opposed to the normal low-speed) collision with the preceding car whilst floating in the water channel, or
• if the level is too high, cars may be subjected to excessive deceleration, leading to passengers being ejected in the Splash itself. In fact, if passengers sit too far back and the water level in the splash is too high, there is a possibility of aquaplaning, leading to insufficient deceleration when the water level is too high.
Therefore, water level control is an important safety function in a log-flume ride, in addition to those associated with rollercoasters.
2.3 CRAZY FROG RIDES
A Crazy Frog ride takes the form of a number of cars, each supported at the end of an arm. The opposite ends of the arms meet at a central hub, which is able to rotate. The height of the arms is controlled by, for example, air pressure in a cylinders, one of which supports each arm, the latter being attached to the hub by means of a hinge, allowing vertical movement. Therefore, each car has two degrees of freedom: rotation about the central hub and vertical movement. These lead to passengers experiencing a high centripetal force, due to the rotation, and variations in the vertical g-force, which can potentially reach zero.
Therefore, ensuring passenger restraint is an important safety function with a Crazy Frog ride.
As the cars can be raised to a significant height, and, potentially, the air can quickly be released from the cylinder, leading to the arm supporting a car undergoing an uncontrolled collision with its lower end-stop, control of the speed at which cars approach their lower limits is an additional safety function (which need not necessarily be carried out by the electronic control system).
Passengers enter and leave the cars whilst they are located close to a platform that surrounds the ride. Clearly, if the ride were to begin to rotate whilst passengers were doing this, there would be a potential for their injury. Therefore, the prevention of unexpected start-up (including both rotational and vertical car movement) becomes another safety function.
8

3 QUANTIFIED RISK ASSESSMENT
As the author is unaware of any Risk Graph that has been appropriately calibrated for use determining the Safety Integrity Levels associated with the control systems of fairground rides, we shall now work through some simple examples of quantified risk assessments in order to illustrate the process for determining the Safety Integrity Level of typical safety functions associated with fairground rides, and to determine generic Safety Integrity Levels for common types of ride.
The research considered:
• a large (fast) rollercoaster on which more than one train may be running, leading to the possibility of collisions between trains that could cause passenger deaths;
• the water-level interlock of a log-flume ride, whose failure could lead to serious injury, but a passenger death is unlikely, and
• the lap-bar interlock of a Crazy Frog type of ride. This is another safety function whose failure could lead to serious injury, but experience suggests may be unlikely to cause a passenger death.
Before describing the risk assessment, a brief glossary of some of the terms used in the risk assessment will be given.
3.1 BRIEF GLOSSARY OF TERMS
3.1.1 Fault
BS EN 61508-4:2010 describes a fault as “An abnormal condition that may cause a reduction in, or loss of, the capability of a functional unit to perform a required function”. Therefore a fault could be the result of a relay in a control system sticking in either: the energized, or the de-energized, state.
In a dual-channel system, a fault in one channel should not affect the other channel, so the entire system may continue to operate safely, or shut down safely, depending on the design.
In this report, the research considered only those faults that move the system in the unsafe direction, i.e., will lead to an increase in the probability of a dangerous failure of the safety function.
3.1.2 Catastrophic fault
The author has used the term catastrophic fault to refer to a fault that will affect all channels of a single-channel, or a multi-channel, system. Therefore, a catastrophic fault will lead to the system failing to carry out the safety function if a demand on it occurs.
3.1.3 Failure
A failure manifests itself when a demand is placed on a safety system containing a fault. It will be noted that the failure does not occur until a demand is placed on the safety function. For example, the brakes of a car containing no hydraulic fluid (a catastrophic fault) do not fail until the driver presses the brake pedal (i.e., the driver places a demand on the braking safety function).
9

3.1.4 Probability of failure on demand
Some devices remain dormant until a demand is placed on them. The simplest example of these would be a fuse or circuit breaker. The probability of failure on demand (PFD) is the probability that the safety function would fail when a demand occurs, e.g., the probability that a circuit breaker would fail to trip if, for example, a short-circuit were to occur. Clearly, the PFD must be below a target value.
3.1.5 Background risk
The background risk is the risk of injury from all potential sources that a person faces during his normal daily life.
3.2 ROLLERCOASTER BLOCKING FUNCTION
The blocking function on a rollercoaster prevents collisions between trains by ensuring that no two trains can be present in the same section of track (i.e., block), and is a very important function on a fast rollercoaster whilst more than one car/train is on the track. As the hazard level associated with the blocking function is most probably higher than that associated with any other safety function on the rollercoaster, this will form the starting point of this assessment.
Table 1 shows the data and calculations needed to determine the Safety Integrity Level of the control system for the ride as will now be explained.
1 Background risk of death 1.00E-04 per year2 Duration of rollercoaster ride 3 minutes3 Active length of passenger day 14 hours4 Target risk of death for duration of one rollercoaster ride 9.78E-10 per passenger ride5 Number of potential deaths per incident per train 2 deaths/incident/train6 Number of seats on train 30 seats/train7 Probability of our passenger being killed if an incident occurs 6.67E-028 Target probability of an incident 1.47E-08 per ride9 Number of safety functions (SF) 610 Target probability of a catastrophic fault in any one safety function 2.44E-09 faults/SF/ride11 Mean number of block stops per working day 512 Target probability taking block stops into account 2.69E-09 faults/SF/ride13 Target probability of a catastrphic fault in any one safety function 5.38E-08 per hour14 Target Safety Integrity Level (SIL) per safety function (individual risk) SIL315 Total number of potential deaths 4 deaths/incident16 Target proability of catastrophic fault taking into account societal risk 1.34E-08 per hour17 Target Safety Integrity Level (SIL) per safety function (societal risk) SIL3
Table 1: Quantified risk assessment for a typical large rollercoaster ride
We shall consider the risk associated with a passenger on the rollercoaster, who is an individual member of the public. For brevity, our passenger will be referred to as Joe.
As the trains on large rollercoasters reach speeds of ~100mph, the potential hazards are significant and could lead to multiple deaths if an incident were to occur. Therefore, our risk assessment will be based on the probability of such deaths occurring on the ride.
Reference 1 indicates that the background risk of the accidental death of a member of the public from all causes is no more than about 1.010
-4 per year. Therefore, assuming that Joe faces no risks from other sources during his ride, if we maintain this level of risk throughout his time on the ride, as Joe’s other risks (e.g., due to road-related incidents, etc.) will no longer be present, Joe’s level of background risk of death will be maintained during his ride.
10

Assuming that Joe spends 8 hours per day asleep and another couple of hours relaxing in his home, his risk of death will be low for about 10 hours per day. Therefore, his risk of death of 1.010
-4 per year will be associated with the remaining 14 hours a day during which Joe is actively going about his daily business. This allows us to determine his risk of death during his active day in the form of deaths per hour or, more appropriately, in terms of Joe’s probability of death over the duration of a single ride on the hypothetical rollercoaster that we are considering.
Let us assume that the duration11 of a ride on our hypothetical rollercoaster is 3 minutes.
If we multiply the background risk by the ride duration and divide by Joe’s total yearly active time, we can determine what fraction of his annual target risk of death would apply over each of the many such time slots equivalent to the duration of one rollercoaster ride.
It will be realised that the target risk per ride will be a constant fraction of Joe’s annual risk, so will not depend on which of these time slots his ride on the rollercoaster falls into. More importantly, the target risk per ride will be the same regardless of whether Joe uses up one, or many of his time slots on the ride. Therefore, the calculation will apply if Joe rides on the rollercoaster once per year, or spends all of his active time on the ride – his annual probability of death due to an accident will remain at 1.010
-4.
Let us assume that a train carries thirty passengers and, if a collision occurs, four passengers will be killed. (This is based on the assumption that, when a collision between two cars occurs, the two rear passengers of the leading car and the two front passengers of the following car receive fatal injuries. This may not be the worst possible case, but is far more serious than any of the incidents involving rollercoasters that the author has either investigated, or been advised12.)
Joe can sit anywhere on the train, but the deaths will be associated with certain seats (in particular those at the front or rear of the train). Assuming that the train is completely13 filled, the seat that Joe sits in will be randomly selected according to his position in the queue. Therefore, if a collision were to occur, Joe will have a 2 in 30 chance of sitting in an affected seat in the train he rides in. (He could have ridden in the other train involved in the collision; however, if we had considered both trains together, the calculation would have given him a 4 in 60 chance of being killed, so his risk would have remained the same.) Using this information, we can calculate the target probability of a collision occurring during Joe’s ride. (See Row 8 of Table 1.)
11 In fact, the duration of the ride is irrelevant, as it is used twice in the calculations resulting in its eventual cancellation. This is because, if the ride had a longer duration, it would be allocated more of Joe’s available risk, but the actual risk due to the ride would rise in exactly the same proportion. Therefore, the target rate of incidents remains constant but applies over a longer period. (Readers will realise that this also means that the number of rides that Joie takes in a year will not affect his annual risk for the same reason – he could spend all of his waking year on the ride and his risk of death would remain at 1.010
-4/year.) Despite its redundancy, the duration of the ride will be included in the calculation so as to allow the modelling logic to be more-easily followed. 12 Although a collision at the bottom of a dip could occur, a collision resulting from a train coming to a halt near the bottom of a dip on a metal rollercoaster was considered to be extremely unlikely and the most probable collision would occur at a brake or, possibly, at a roll-back arrester, where train speeds would be significantly reduced. If the design is such that collisions at the bottoms of dips become potential, this aspect will need to be reconsidered. 13 If the train is not completely filled, the same probability of 2 in 30 will apply if Joe were to select his seat randomly; however, Joe may make a personal decision to sit in a preferred seat at the front of the train. If he does this, his risk will increase from 2 in 30 to 2 in 2 if Joe chooses to sit at the front of an otherwise empty train that runs into the back of another, or zero, if he sits at the front of the leading train. Fortunately for our calculations, trains are normally filled (and trains will be swapped out of service when they are not), so our assumption of 2 in 30 is likely to be typical. 11
We have actually calculated Joe’s overall target risk during his ride. Despite basing the previous calculation on a collision between cars, Joe’s injuries could arise from a failure of any of the safety functions associated with the ride. At Section 3.1, we identified 6 basic safety functions, which provide protection against a similar number of hazards. The potential failure of the other five safety functions will also affect Joe’s risk during his ride, so we must allow for their contribution.
If the probability of failure of each of the six safety functions led to the same contribution to Joe’s risk, we could simply divide the overall target risk by six and use this as the target risk for each safety function. The risks associated with the failure of each safety function are unlikely to be the same but, nevertheless, must contribute to the overall risk. In addition, we have already based our calculations on the number of deaths resulting from a collision between two trains; fortunately, this will provide us with a worst-case value (compared to the risks associated with the other lesser hazards) for the overall target risk.
If there were only one safety function associated with the ride, it could be allocated all of the target risk. This would be the equivalent of the other five safety functions in our example having no contribution at all to the overall risk. However, as their contribution increases, the lower will be the fraction of the risk available to the blocking function.
In the author’s opinion, the rollercoaster-related risks associated with the blocking, or passenger-restraint, safety functions are likely to provide the main contributions to the overall risk. If we were to assume that these provided all of the risk, each would be allocated half of the target risk. However, if we were to assume that all of the safety functions contributed equally to the risk, each would be allocated one sixth of the target risk. Therefore, if we were to assume that each safety function contributes equally to the target risk, by determining the target risk using the most onerous safety function (i.e., the blocking function), we are taking a worst-case approach.
Therefore, we shall allocate each safety function one sixth of the overall target risk in our example, in order to obtain the target catastrophic fault rate for each of our safety functions as shown at Row 10.
Because the rate of demands on the block-control function and the assumed proof-test frequency are closely similar, it would be inappropriate to determine the probability of failure on demand of the block-control function and multiply this by the demand rate (the frequency of block stops) in order to determine the collision rate. Therefore, we must take a different approach.
If there were a catastrophic fault of the blocking function, the fault would lead to a failure and, hence, a collision, only if a train became stopped and a following train caught up with it. Under normal circumstances, the ride operators will be able to exchange the passengers of a train and then dispatch the train whilst another train is travelling round the track. If they work efficiently, the actions of the operators will ensure that the separation of the trains is maintained, so no demand will be placed on the blocking function. Therefore, the most likely cause of a demand on the blocking function will be the result of an unexpected delay at the station. This could result, for example, from a passenger leaving a purse, or mobile telephone, on a train, leading to its despatch being delayed and, as a result, the following train having to be prevented from entering the station by the blocking function. The author has been advised that such demands on the blocking function are infrequent, occurring only a few times each day.
As a collision between trains can occur only if we get both a need for a block stop, and a catastrophic fault in the blocking function, it will be possible that a catastrophic fault associated with the blocking function will not lead to a collision. Such a condition would exist if the fault
12

occurred near the end of the day and no block stop were subsequently required. In this case, the blocking-function fault would safely be revealed by the early morning test carried out before ride operation starts on the following day.
If we assume that all catastrophic faults14 associated with the blocking function lead to a collision, our calculations will not take into account faults that occur after the last block stop of the day. Any faults occurring after this time will not lead to a passenger-related collision, but will be identified when the early morning block test15 is carried out. Therefore, the blocking function can have a slightly higher target fault rate without Joe’s target risk being exceeded; however, this will depend on the number of block stops that occur each day.
For example, if there were only one block stop per day, this would occur (on average) half way through the working day. Therefore, only blocking faults occurring during the first half of the day could lead to collisions, as (on average) no block stop would occur following faults occurring after the middle of the day. Therefore, in this case, only half of the faults could lead to a failure16 of the blocking function and, hence, a collision; so the target fault rate associated with the blocking function can be doubled, without the target risk being exceeded, as can be seen at Figure 1.
If several block stops occur each day, the last block stop of the day will, on average, occur closer to the last ride of the day, so the period in which a catastrophic fault associated with the blocking function will not lead to a collision is reduced. Therefore, the increase in the acceptable catastrophic fault rate is also reduced.
Figure 1 shows how the increase in the target probability will vary in relation to the number of routine block stops that occur each day. It will be noted that, assuming that two, or more, block stops occur each day, the target probability of a catastrophic fault associated with the blocking function (Row 12) will increase by no more than about 33%, so will have only a small17 effect on the calculations. Nevertheless, the increase has been taken into account at Row 12 of Table 1.
14 In this report, a fault refers to some defect within the control system that will cause the operation of the control system to deviate from its specification, but which may, or may not, prevent the control system from carrying out its intended function. For example a single fault will not prevent a dual-channel protection system from shutting down a process, but it could certainly prevent the operation of one channel. The term catastrophic fault refers to a fault (multiple faults in a multi-channel system) which will lead to a failure of the safety function if a demand on it occurs. A failure of the blocking function occurs when the blocking function does not operate as intended – clearly, even if there is a catastrophic fault present, a failure cannot occur until there is a demand. 15 It should be noted that the daily block test is actually a functional test and confirms only that the blocking function is operative. It is not a proof test, which will ensure that there are no faults present (e.g., in one channel of a dual-channel system). 16 A failure occurs when the control system is unable to carry out its intended function. Clearly, a failure of the blocking function can occur only immediately prior to a collision, i.e., until Train 2 is allowed into the same block as Train 1, there has been only a fault associated with the blocking function, not a failure. 17 This does NOT mean that the early morning block test is unimportant because it will identify failures that occur overnight (e.g., due to temperature changes, condensation, water ingress, etc.), and will allow brake performance to be monitored. Here,”small” should be considered in relation to the width of a SIL, which is a factor of 10.
13

100
110
120
130
140
150
160
170
180
190
200
0 1 2 3 4 5 6 7 8 9 10
Incr
ease
in ta
rget
faul
t rat
e (%
)
Mean number of block stops in an operational day
Increase in target risk (%)
Figure 1: The increase in target risk resulting from the period after the last block stop of the day
The safety function that we are considering is the block-control function, which our approach assumes is a control18 function that must operate continuously. Therefore, we must look to Table 3 of Part 1 of IEC 61508 (Reference 2) in order to determine the target Safety Integrity Level for the blocking function of our rollercoaster, which Table 1 indicates is SIL3.
This gives the target Safety Integrity Level based on Joe’s individual risk. If we design, build, document, commission, maintain, and operate the equipment that carries out the blocking function (or, in fact, any of the functions) of our rollercoaster according to the requirements for SIL3, the risk of death of any individual passenger will not be increased above his/her background level as a result of riding on the rollercoaster.
Unfortunately, this may not be the end of the matter because, for example, the public perception of risk will depend on the source of that risk and there may be a public aversion when multiple deaths occur. Therefore, it may be necessary to consider the societal risk associated with a failure of the safety function. Reference 1 provides little guidance in this respect, so we shall assume a simple linear relationship19 by dividing the target fault rate by the number of potential deaths resulting from a collision.
18 There are two types of safety function: a) control functions which must operate continuously, or b) protection functions which come into play only when a demand is made on them, e.g., when a primary safety/control system fails. The difference relates to whether their integrity is defined in terms of failure/fault rate or probability of failure on demand. The approach taken in this report requires the former. 19 For the purpose of this report, the target background risk of death has been assumed to be 1.010
-4 per year as specified by Reference 1, and that societal risk follows a linear relationship with the number of fatalities involved in a particular incident. There may be arguments for the relationship being non-linear, in cases of incidents that may lead to multiple fatalities, in order to take into account the public perception of the risk in such cases. Consideration of the actual target risk that should be used in any particular circumstance is beyond the scope of this report.
14
Because each SIL is an order of magnitude wide, and the target probability of a fault occurring was near the middle of the range for SIL3, it will be seen that, despite decreasing the target fault rate by a factor of 4, the target Safety Integrity Level remains at SIL3 when we take societal, rather than individual, risk into account in this way.
Therefore, if we consider the individual risk of each passenger, we shall require the blocking safety function to have a target fault rate of 5.3810
-8 dangerous faults per hour together with the requirements associated with a SIL3 system. However, if we consider societal risk, we shall require the safety function to have the slightly lower target fault rate of 1.3410
-8 dangerous faults per hour, again together with the design/manufacture/documentation/maintenance requirements of a SIL3 system.
3.2.1 Important notes
1) The calculations assume that the blocking function is a high-demand-rate function and so we have used the failure-to-danger rate in our calculations. This is because the demand rate is comparable to the rate of proof tests. (See Note 2.)
2) The “previous train” to the first train that travels around the track at the start of the working day would have travelled around the track some 12 hours earlier, giving a considerable20 opportunity for a fault to have occurred. Therefore, it is important that the first train to circumnavigate the track each day is a test train that fully tests the blocking function, e.g., is fully loaded (e.g., with sand bags) and is stopped at every brake. It should be noted that, this daily test is a functional test and not a full proof test, which would test also test the diagnostic functions.
3) By carefully recording (either automatically, or manually) the performance (e.g., the stopping distance associated with each brake) of the early-morning block test, the deterioration of those components subject to wear can be monitored, allowing them to be maintained before a failure to stop a train can occur. This type of function forms part of the diagnostic functions used to ensure that the safety function achieves the required SIL, so need not be considered in the determination of the target SIL.
3.3 LOG-FLUME RIDE LOW-WATER INTERLOCK
Let us now consider a log flume ride. Although a log-flume ride is effectively a rollercoaster, it would be expected to be much smaller than the large rollercoaster considered at Section 3.2 and, instead of being a fixed installation, could be transportable using several articulated road trailers. This is the type of ride that we shall consider in this assessment.
Because of the lower speeds involved, a fatality is considered to be extremely unlikely; however, relatively severe injuries could be sustained if a passenger were to be thrown out of a car.
As with a rollercoaster, log-flume rides operate with several cars, so a blocking function is required whose integrity can be determined following the principles used at Section 3.2; however, because the cars travel at their highest speed on a log-flume ride as they enter the splash, a low level of water here is considered to be the most-serious hazard.
20 A 12-hour overnight period of dormancy represents 240 ride durations of, for example, 3 minutes. Therefore, the risk associated with the first train of the day will be significantly higher than that of the subsequent trains, assuming that faults continue to arise even when the ride is dormant, which is only partially true.
15

Because the car deceleration in the splash of a log-flume ride is critically dependent on the level of water in the splash, in our assessment, we shall consider the water-level-interlock function, that prevents ride operation if the water level in the splash(es) is inadequate.
Each splash normally consists of a long tank containing rails that slope downward away from the “drop”. As the cars travel along the rails, the car bodies gradually move deeper into the water, giving a controlled deceleration. If the water level were:
• too low, cars would not be decelerated sufficiently, so they could be travelling too quickly when they reach the first bend in the tank. This could lead to a high lateral acceleration that could cause passengers to become ejected from the car. Alternatively, as cars bunch together in the water channel as they approach the station driven by the flow of water, insufficient deceleration could lead to an energetic collision between cars, again leading to passenger injury, or
• too high, the initial deceleration as the cars enter the splash would be excessive, leading to passengers being thrown forward relative to the car. Alternatively, there may be a possibility of aquaplaning, leading to insufficient deceleration – especially if the passenger load is to the rear of the car. However, we shall consider a ride in which the upper level of water in the splash is controlled by the height of the sides of the tank, any excess of water from the continuously running pump pouring over the sides. As the sides of the tank are fixed relative to the rails an excessively high water level cannot occur.
Therefore, the basic safety function that we shall consider is that which interlocks the operation of the ride with the water level. In this case, whenever the water level is below a specified minimum, the ride will be stopped, or at least, no car will be allowed to reach the drop that precedes the splash.
The quantified risk assessment for the large rollercoaster was able to draw upon Reference 1 in order to determine the background risk of its passengers. Unfortunately, Reference 1 is intended to apply to high-hazard events, so does not consider hazards that may result in non-fatal injuries. Therefore, we must determine the background risk from first principles.
3.3.1 Background risk of injury
We need to know the risk to our typical member of the public (who for brevity will be referred to as Joanne) due to incidental21 injury, but not from any form of illness. A potential means of obtaining this information is from records of attendances at hospital Accident and Emergency units (A&E). Such data can be obtained from Reference 4.
The data at Reference 4 are published summaries of A&E attendance data in England. Specific data searches may be obtained (for a fee) from the NHS; however, for the purposes of this risk assessment, we shall consider only published data. Table 2 shows data extracted from Reference 4, together with some calculated results that will now be described.
Rows 1 to 9 show the raw data, which lead to the totals at Row 10. However, we are interested in only incident-related injuries, so we can exclude:
21 The word ”accident” normally refers to an “act of God”, i.e., incidents that could not foreseeably be prevented. The word “incident” includes “accidents” together with other events that could be foreseeably prevented or, in fact, may even have been deliberately caused.
16

• Row 1 (Other), which is presumed to refer to emergency illness-related attendances, e.g., heart attacks;
• Row 3 (Not known). In order to ensure that the calculated probability of injury is not inflated by unknowns (which are unlikely to be the result of obviously severe injuries) we shall err in the safe direction by excluding this row;
• Row 7 (Deliberate self harm), and • Row 9 (Brought in dead), as we are considering only non-fatal22 injuries.
It may be thought that Row 6 (Assault) should be excluded; however, when Joanne is not on the ride, she may be subjected to injury caused by an assault and so, by being on the ride, she will be protected from this type of injury. Therefore, we must take this into account. A similar argument applies to Row 8.
We can now add the various rows to obtain the total number of relevant A&E attendances (Row 11); however, as not all A&E departments submit their data to HESonline (Only about 187 of 327 did so in 2010-11.) we must allow for this. As HESonline recorded 15.8 million attendances, but QMAE23 recorded 21.4 million (See Reference 4.), we shall scale our calculations by the ratio of these values in order to determine the total number of non-fatal incident-related A&E attendances at Row 12. The severity of the injuries could range from minor bruising to an irreversible injury such as an amputation. One would expect there to be few of the latter and, potentially, many of the former; however, it will be assumed that, if the recipient of the injury considers attendance at A&E necessary, the injury will be significant, but not necessarily life threatening.
Although the HESonline data include attendances grouped according to age, this grouping is done as a whole and is not associated specifically with the incident-related data. Therefore, this analysis includes attendances for all age groups from 0 to 90 and over. The attendance for each decade of age from 0-9 to 40-49 is almost constant before decreasing steadily from 50-59 onwards. In 2010-11, 14.5% of attendees were in the 0-9 age group, suggesting that any age-related errors due to, for example, incidents involving babies too young to experience even the smallest of fairground rides, will be significantly less than ~14% (See “Table 6: A&E attendances by age group, 2009-10 and 2010-11” from Reference 4.). Therefore, as age related errors are likely to be insignificant in relation to the decade span of each SIL division, age will not be considered in this analysis.
22 Patients that die in A&E will be excluded later (at Table 3). 23 QMAE: Accident and Emergency Quarterly Monitoring data.
17
Row 2007-08 2008-09 2009-10 2010-111 Other 7,689,063 8,754,164 9,968,845 10,661,5882 Other accident 3,331,231 3,676,438 3,935,210 3,913,9153 Not known 558,465 581,425 801,058 763,1104 Sports injury 252,505 274,056 314,166 352,8995 Road traffic accident 211,384 221,174 244,572 245,9136 Assault 175,927 181,568 193,529 186,2767 Deliberate self-harm 94,488 101,670 108,312 112,6698 Firework injury 2,952 1,643 2,141 6,1739 Brought in dead 2,036 1,934 1,903 2,391
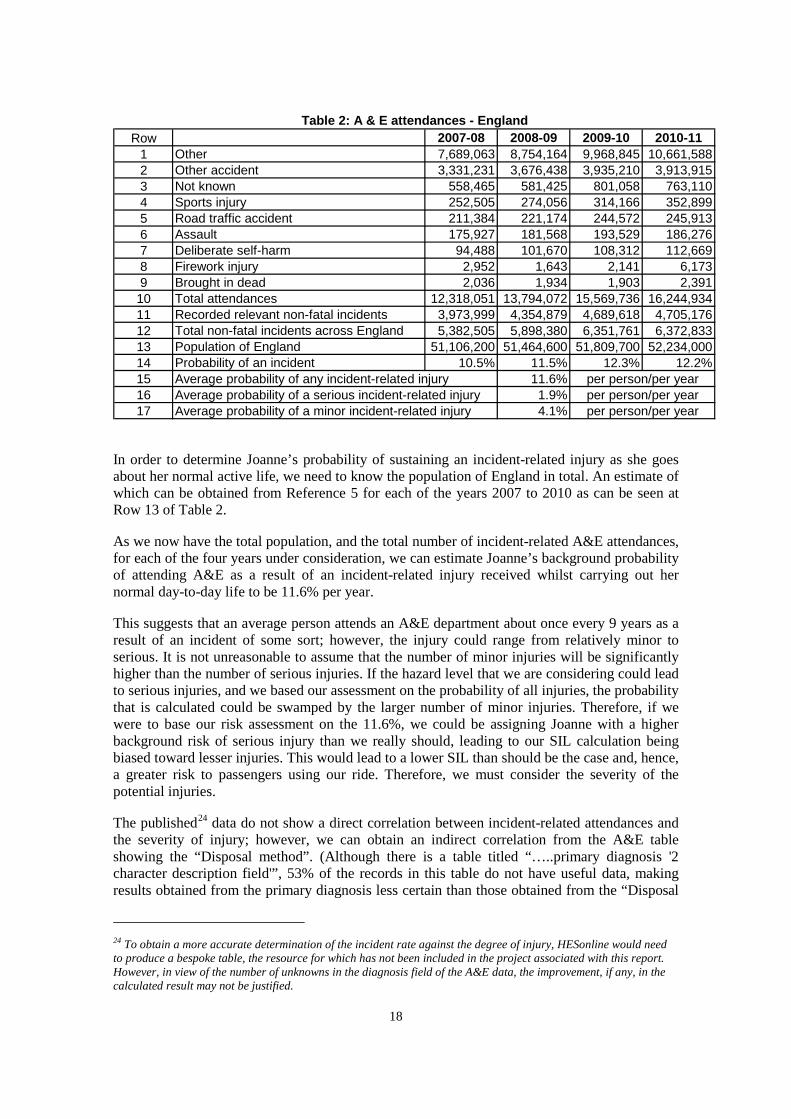
10 Total attendances 12,318,051 13,794,072 15,569,736 16,244,93411 Recorded relevant non-fatal incidents 3,973,999 4,354,879 4,689,618 4,705,17612 Total non-fatal incidents across England 5,382,505 5,898,380 6,351,761 6,372,83313 Population of England 51,106,200 51,464,600 51,809,700 52,234,00014 Probability of an incident 10.5% 11.5% 12.3% 12.2%15 11.6%16 1.9%17 4.1%Average probability of a minor incident-related injury per person/per year
Table 2: A & E attendances - England
per person/per yearAverage probability of any incident-related injuryAverage probability of a serious incident-related injury per person/per year
In order to determine Joanne’s probability of sustaining an incident-related injury as she goes about her normal active life, we need to know the population of England in total. An estimate of which can be obtained from Reference 5 for each of the years 2007 to 2010 as can be seen at Row 13 of Table 2.
As we now have the total population, and the total number of incident-related A&E attendances, for each of the four years under consideration, we can estimate Joanne’s background probability of attending A&E as a result of an incident-related injury received whilst carrying out her normal day-to-day life to be 11.6% per year.
This suggests that an average person attends an A&E department about once every 9 years as a result of an incident of some sort; however, the injury could range from relatively minor to serious. It is not unreasonable to assume that the number of minor injuries will be significantly higher than the number of serious injuries. If the hazard level that we are considering could lead to serious injuries, and we based our assessment on the probability of all injuries, the probability that is calculated could be swamped by the larger number of minor injuries. Therefore, if we were to base our risk assessment on the 11.6%, we could be assigning Joanne with a higher background risk of serious injury than we really should, leading to our SIL calculation being biased toward lesser injuries. This would lead to a lower SIL than should be the case and, hence, a greater risk to passengers using our ride. Therefore, we must consider the severity of the potential injuries.
The published24 data do not show a direct correlation between incident-related attendances and the severity of injury; however, we can obtain an indirect correlation from the A&E table showing the “Disposal method”. (Although there is a table titled “…..primary diagnosis '2 character description field'”, 53% of the records in this table do not have useful data, making results obtained from the primary diagnosis less certain than those obtained from the “Disposal
24 To obtain a more accurate determination of the incident rate against the degree of injury, HESonline would need to produce a bespoke table, the resource for which has not been included in the project associated with this report. However, in view of the number of unknowns in the diagnosis field of the A&E data, the improvement, if any, in the calculated result may not be justified.
18

method”.) Although the data in the “Disposal method” table apply to all attendees, not just those resulting from incidents, if we assume that the disposal method is somewhat similar for all A&E attendances, we can obtain a better estimate of the SIL required for control systems associated with the more serious injuries. Although the severity spectrum of the incident attendances, and the whole, may differ, it will be assumed that they are unlikely to differ significantly.
We shall consider data for only the year 2010-11, which can be seen at Table 3.
Row Disposal Method Number of 2010-11 A&E attendees1 1. Admitted / became a lodged patient 3,565,357 2 2. Discharged - follow up by GP 3,055,861 3 3. Discharged - no follow up required 6,266,428 4 4. Referred 2,135,781 5 Referred to A&E Clinic 447,861 6 Referred to Fracture Clinic 677,239 7 Referred to other OP Clinic 616,003 8 Referred to other health care professional 394,678 9 5. Others 1,221,507 10 Left Department before being treated 557,864 11 Transferred to other Health Care Provider 280,462 12 Other 249,718 13 Left Department having refused treatment 67,807 14 Not known 40,989 15 Died in Department 24,667 16 Total 16,244,934 17 Serious but non-fatal attendances (Referred: Row 4 + admitted: Table 4) 2,674,235 18 Fraction of serious but non-fatal attendances (See text) 16%19 Serious but less severe non-fatal attendances (Rows 1 + 4) 5,701,138 20 Fraction of serious but less severenon-fatal attendances 35%21 All non-serious non-fatal attendances (Rows 2, 3 and Row 9 less Row 15) 10,519,129 22 Fraction of all non-serious non-fatal attendances 65%
Table 3: A&E disposal method for 2010-11 attendees
We need not consider Row 15 of Table 3, because we are considering only non-fatal injuries in our risk assessment. Of the remaining rows, we shall divide them into two groups associated with either minor, or serious, injuries.
For minor injuries, we shall consider only Rows 2, 3, 10, 11, 12, 13 and 14, leading to 65% of all attendances.
For serious injuries, if we consider only Rows 1, 5, 6, 7 and 8, this leads to 35% of all attendances. Unfortunately, many patients may be admitted to hospital for reasons other than injury (or because of attendance at A&E), and so should be excluded. Although the A&E diagnostic data were found to include many invalid fields, this is not true of the in-patient diagnostic data for which greater time is available for its completion. Therefore, by looking at the in-patient diagnosis table for 2010-11 (Reference 8), we can get a better estimate of the number of patients admitted to hospital as a result of injury.
Table 4 shows data extracted from Reference 8, which suggests that the sum of the admissions resulting from injuries from all of the age groups was only 804,549. The 75+ group is unlikely to experience a fairground ride, so should be excluded, reducing the total admissions to 538,454. If we use this value instead of that at Row 1 of Table 3, together with that at Row 4, our fraction of serious injuries reduces from 35% to 16%.
19

Primary diagnosis: summary code and description Admissions Mean length of
stay
Median length of
stay
Mean age Age 0-14 Age 15-59 Age 60-74 Age 75+
S00-S09 Injuries to the head 182,536 2.9 1 47 36,513 88,743 20,105 60,127S10-S19 Injuries to the neck 8,552 10.2 2 52 586 5,422 1,640 2,734S20-S29 Injuries to the thorax 17,707 6.7 2 60 511 9,906 4,409 8,513S30-S39 Injuries to abdomen, lower back, lumbar spine & pelvis 34,385 8.9 3 60 3,257 16,199 5,645 20,998S40-S49 Injuries to the shoulder & upper arm 44,467 5.4 1 57 6,693 17,428 8,612 20,637S50-S59 Injuries to the elbow & forearm 74,896 2.7 1 45 20,288 31,039 12,941 18,336S60-S69 Injuries to the wrist & hand 86,308 1.1 0 36 12,036 63,914 7,268 6,639S70-S79 Injuries to the hip & thigh 89,995 18.8 13 77 2,888 10,552 18,204 92,874S80-S89 Injuries to the knee & lower leg 79,068 6.6 3 51 7,707 46,670 15,104 23,131S90-S99 Injuries to the ankle & foot 17,402 3.5 1 46 2,449 10,805 2,508 3,936T00-T07 Injuries involving multiple body regions 3,330 7.6 2 48 489 2,126 528 1,112T08-T14 Injuries to unspecified part of trunk limb or body 2,269 5.8 1 57 289 960 290 1,100T15-T19 Effects of foreign body entering through natural orifice 15,090 1.1 1 30 7,385 5,913 1,836 1,667T20-T32 Burns and corrosions 11,968 4.2 1 27 5,740 5,237 906 1,033T33-T35 Frostbite 84 9.7 4 47 1 81 22 7T66-T78 Other and unspecified effects of external causes 14,796 1.5 0 39 3,969 8,036 2,112 2,374T79 Certain early complications of trauma 2,432 8.6 3 51 166 1,867 459 877Total admissions including diagnoses not shown above 14,890,844 5.5 1 51 1,992,277 7,463,084 3,773,052 3,982,390Total injury-related admissions (S00 to T79) 804,549 105 2 110,967 324,898 102,589 266,095Injury-related admissions excluding 75+ column 538,454
Table 4: Hospital inpatient admissions data for 2010-11
We can now use these values in our calculations to determine the probability of serious or minor injuries as shown at Rows 18 and 22, respectively, of Table 3. Readers should note that:
• the probability of a minor injury shown at Row 22 of Table 3 is likely to be an underestimate as there will be many recipients of minor injuries that do not consider a visit to A&E to be justified (This is exemplified by the number of attendees that leave without being attended to.), and
• in the risk assessment, we must consider the background probability associated with the most serious injury that Joanne might receive if the safety function under consideration were to fail. Therefore, the probability of minor injury may be of importance when considering only children’s rides but the data used to determine this value are biased toward adults. Therefore, this value should be used with some caution.
Therefore, we can conclude that Joanne’s background risk of serious, but non-fatal, injury from all sources is about 1.910
-2 per year (i.e., 16% of the 11.6% determined at Table 2), suggesting that an average person receives a serious injury in the region of once every 53 years. Although the data used to determine this value apply specifically to England, the value should be valid throughout the UK.
3.3.2 Quantified risk assessment
Having determined Joanne’s background risk of serious injury, we can use this in the calculation to determine the Safety Integrity Level of our protection system.
Whilst Joe’s risk of death was considered to be applicable over 14 hours per day, Joanne will face risks of serious injury over a slightly longer period, as serious injuries are more probable than those leading to death whilst she is at home. For example, she could drop something on her foot, trip over a carpet, or even fall out of bed. Therefore, we shall consider her risk of injury to take place over the slightly longer active day of 16 hours.
Unlike the blocking function of a large rollercoaster, the low-water interlock is not required to operate continuously – it needs to operate only when a demand is made of it. Therefore, we must calculate:
• the demand rate, i.e., the rate at which the water level becomes low, and • probability of failure on demand of the interlock.
20
3.3.2.1 The demand rate: Low-water interlock
We shall assume that a power failure, which will lead to the main water pump being stopped, will also prevent cars from being released down the drop. Therefore, a power failure will not be considered as a source of demands on the low-water interlock. (It will result in a need to restart the ride; however, as the number of power failures is likely to be insignificant when compared to the number of daily starts, it can be neglected.)
The ride will be out of service overnight, so there is a potential demand each morning when the ride is started. It will be presumed that the pump will be allowed to run all day, if only to entice potential passengers to the ride, even whilst the operator is taking breaks. Therefore, the daily starting of the pump will provide one potential demand on the low-water interlock each day. This assumes that the ride could be started, and a car reach the first splash before the water level in that splash has fully stabilized. This may not be the case, but the assumption errs in a safe direction.
Reference 10 indicates that the failure rate of a centrifugal pump is typically 50 per million hours. Reference 11 suggests that similarly sized (51 to 100kW) pumps have a mean critical failure rate of 71.35 per million hours, which corresponds very closely to the value from Reference 10. As the environment associated with Reference 10 may be more appropriate to a log-flume ride, the lower value of 50 failures per million hours will be assumed.
The pump will be required to pump water from the Lake25 into the splashes. Because the Lake is beneath the ride, detritus (e.g., paper/plastic cups, chip trays, etc.) will build up in it, which will be drawn toward the pump by the recirculating water. Although the inlet to the pump will be provided with a strainer for protection, the strainer could become blocked by debris. If the inlet were to become blocked, leading to reduced flow through the pump, the water level in the splashes could fall leading to a demand on the interlock.
Regular cleaning of the pump inlet could prevent such a demand; however, the rate at which detritus accumulates could vary, depending on the weather, the season, and other factors. Assuming that the inlet is cleaned at weekly intervals, it will be assumed that a potentially hazardous build-up of detritus, that is not cleaned away in time, occurs at 6-monthly (180 day) intervals.
The ride operator may turn off the pump in order to carry out minor maintenance tasks during the operation of the ride. It will be assumed that he does so at approximately monthly (28 day) intervals.
25 Log-flume rides incorporate a large tank beneath the ride from which all of the water used in the ride is circulated by the pump. Because the entire ride is built over this tank, it is referred to as the Lake.
21

3.3.2.2 The target probability of failure on demand: Low-water interlock
Row Event Value Units Rate per 106h
1 Background risk of serious injury 1.90E-02 per year 2.17E+002 Active length of passenger day 16 hours3 Target (individual) risk of injury 2.85E-02 per year 3.25E+00
4 Daily start-ups 1 per day 4.17E+045 Ride operator turns off for maintenance 7 days per event 5.95E+036 Operator error rate 1 %7 Operator-related demands from Rows 4 & 5 88 days per event 4.76E+028 Pump-inlet blockage 180 days per event 2.31E+029 Pump failure 833 days per event 5.00E+01
10 7.58E+0211 Number of safety functions 4
12 Target PFD per safety function 1.07E-0313 Target safety Integrity Level SIL 2
14 Numbers of passengers susceptible to interlock failure 215 Target PFD 5.36E-0416 Target safety Integrity Level SIL 3
Probability of failure on demand: societal risk
Overall demand rate
Table 5: Quantified risk assessment: Log-flume ride
Target risk
Demand rate
Probability of failure on demand: individual risk
Table 5 shows the values that we have just determined. Joanne’s target risk is 2.8510-2 per year,
based on her being at risk for 16 hours/day, so we must ensure that the rate of low-water incidents during her ride is no higher than this.
If the low-water interlock were to fail, this would not necessarily lead to a collision – the water level must also fall. Therefore, we must consider a collision to occur if there is a coincidence between a low water event and an interlock failure. Therefore, we must now determine the frequency of low-water events.
The most obvious cause of a low-water event is a loss of electrical power; however, as this would also prevent the operation of the ride, this cause has not been considered.
Another cause would be the ride operator dispatching a car without first starting the pump. The operation of the pump could be interlocked to the ride; however, if a car were immediately dispatched, it may be possible for it to reach the first drop before the Tank has been adequately filled. We shall make the worst-case assumption that the first car can do this.
The operator may need to turn off the pump when the ride is running for a variety of reasons. The frequency of either of these events requires a somewhat subjective estimate to be made as can be seen at Rows 4 and 5 of Table 5 in order to determine the number of pump start-ups. If the operator dispatches a car without first starting the pump, the car could reach the splash before the water level had risen sufficiently.
We must give the ride operator some credit in the calculations, and this is done at Row 6, which assumes he has a 1% error rate, i.e., he will forget to turn on the pump once in every 100 starts – even the most conscientious operator can be distracted. This leads to the overall rate of operator-related low-water events shown at Row 7, which shows the rate of pump start-ups for which the operator inadvertently dispatches a car before the water level in the splash is adequate.
22

The other potential causes of a low-water event are a failure of the pump, or the inlet of the pump becoming blocked by detritus in the Lake. The failure rate of the pump has already been discussed and, if the Lake is cleaned regularly, a blockage will be infrequent. However, if a large object ends up in the water (e.g., a plastic raincoat), the operation of the pump could quickly be compromised – 6 months has been assumed.
Again we must take into account the number of safety functions. As we are considering only a small (i.e., transportable) log-flume ride, the number of safety functions controlling significant hazards is small. We shall assume the following. (See Row 11.)
• Control of low water level. This is considered the most serious hazard on a log-flume ride.
• Control of high water level may be important on some rides; however, on our small transportable ride, the level will be limited by overflow from the splash tank. Therefore, we shall exclude this safety function from this particular assessment; however, it may need to be considered in others.
• Rollback on a ramp. If rollback were to occur, there would be a possibility of a boat entering the tank backward with potentially unexpected consequences.
• Blocking function.
• Unexpected start-up in the station.
Therefore, there are 4 safety functions associated with the small log-flume ride that we are considering.
The probability of failure on demand of the low-water-level function is the overall demand rate (at Row 10) divided by the target risk (at Row 3) and the number of safety functions. This leads to the target probability of failure on demand of the low-water interlock shown at Row 12
We have considered only Joanne’s individual risk in determining the target probability of failure on demand at Row 12; however, she would not be the only person in the car - on the small log-flume ride that we are considering, each car has only two passengers. Reference 1 gives little advice for dealing with incidents involving more than one person, so we shall assume a simple linear relationship between individual and societal risk, and divide the individual target probability of failure on demand by the number of passengers in the car in order to obtain the societal target probability of failure on demand shown at Row 14, and the Safety Integrity Level for our low-water interlock as shown at Row 15.
3.3.2.3 Qualitative aspects
The calculations in the previous section determine the target failure rate of the low-water interlock function. There will be two main contributors to the actual failure rate:
a) random hardware failures of the various components used to carry out the safety function, and
b) systematic failures. Systematic failures will include those caused by design errors, inadequate maintenance, abuse, and, especially in the case of mobile rides, errors and abuse occurring during transport and (dis)assembly. Therefore, the design of the ride should be such that it meets the requirements of the SIL in all aspects. This will include
23
all of the stages of its lifecycle, including design, manufacture, documentation, operation and maintenance.
3.4 CRAZY FROG RIDE RESTRAINT INTERLOCK
The Restraint (lap-bar) interlock should prevent the ride from moving or, if it is moving, it should bring the ride to a safe (i.e., not necessarily an abrupt) stop if any one of the lap bars is not safely locked in place.
We shall assume that:
1) the interlock function of each Restraint is independent of any other;
2) the function of the interlock is to prevent movement of the ride if any of the Restraints is not locked in place;
3) each car carries two passengers. (It may be possible for 3 smaller passengers to be accommodated on some rides.);
4) the ride operator fails to lock down every 100th Restraint;
5) there is one Restraint per car;
6) both passengers of a car will be ejected if the Restraint becomes unlocked;
7) both ejected passengers will receive serious, but non-fatal, injuries;
8) the duration of a ride on a Crazy Frog is 3 minutes and,
9) because Crazy Frog rides are normally mobile, they:
a. operate from mid-March to mid-October, i.e., 30 weeks per year (Reference 15);
b. have 3.5 working days per week (Reference 15) during this period, and
c. operate for 619 hours per year (Reference 15), making a working day 5.9 hours.
The background rate of serious, but non-fatal, injury for the passenger in our Crazy Frog ride, whom we shall refer to as Joshua, will be the same as that of Joanne, i.e., 1.910
-2 per year.
We shall assume that the Restraint interlocks are individually tested26 prior to daily use, so that faults occurring overnight do not lead to an interlock failure during the first ride of the day.
As we are considering Joshua’s safety, we need to consider only the Restraint interlock associated with Joshua’s car. The fact that there may be 13 other cars is irrelevant to Joshua’s safety, so the safety function must be associated with the interlocking of a single arm. Whilst this may not actually represent the physical reality of the interlock, we shall first assume that the
26 The daily test is a functional test, which verifies that the interlock is functional, not a proof test, which would ensure that the interlock is completely fault free. This difference would become important if, for example, a multi-channel system were employed. For the purposes of the calculations in this report, the daily functional test will be considered to be a proof test.
24
components of the Restraint interlock are associated with only the car that Joshua rides in. This would be the case if the interlock consisted of, for example, a switch and separate pneumatic valve interlocking the air supply to the cylinder providing the vertical movement of each arm. Although this is an unlikely design with respect to the valves, each Restraint will definitely have an individual interlock switch/sensor, wiring and, possibly, a control relay, or PLC input, associated with it.
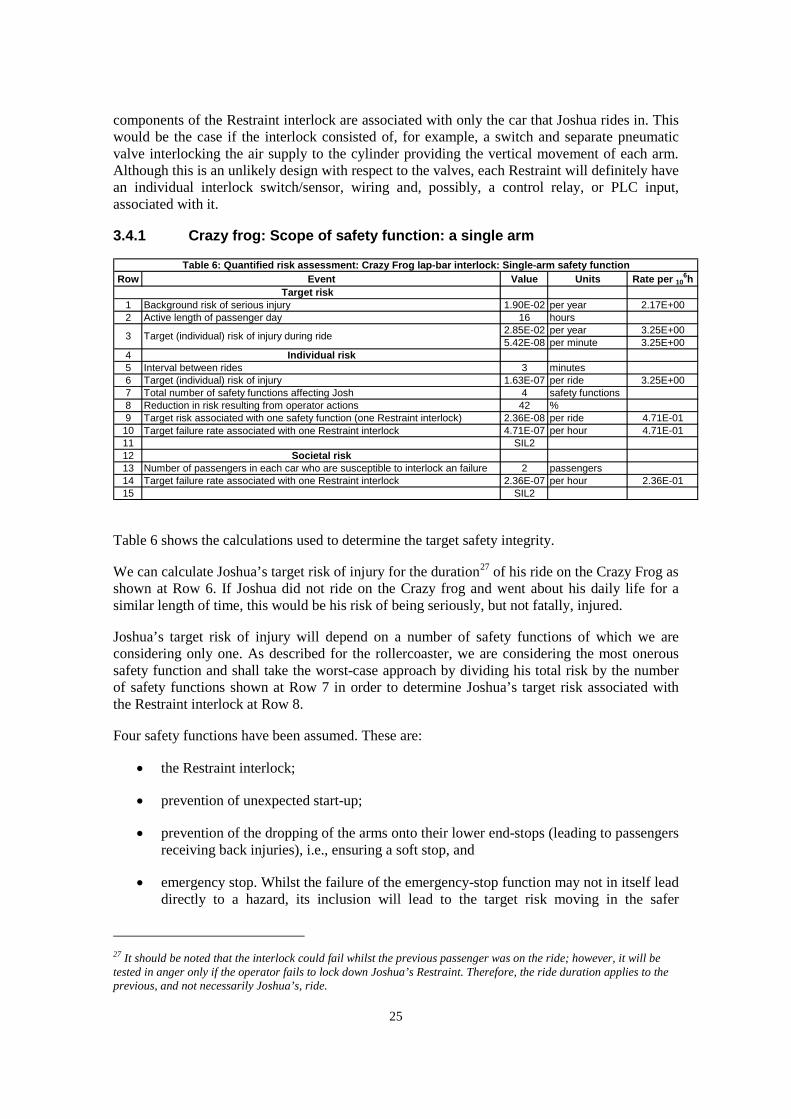
3.4.1 Crazy frog: Scope of safety function: a single arm
Row Event Value Units Rate per 106h
1 Background risk of serious injury 1.90E-02 per year 2.17E+002 Active length of passenger day 16 hours
2.85E-02 per year 3.25E+005.42E-08 per minute 3.25E+00
4 Individual risk5 Interval between rides 3 minutes6 Target (individual) risk of injury 1.63E-07 per ride 3.25E+007 Total number of safety functions affecting Josh 4 safety functions8 Reduction in risk resulting from operator actions 42 %9 Target risk associated with one safety function (one Restraint interlock) 2.36E-08 per ride 4.71E-0110 Target failure rate associated with one Restraint interlock 4.71E-07 per hour 4.71E-0111 SIL212 Societal risk13 Number of passengers in each car who are susceptible to interlock an failure 2 passengers14 Target failure rate associated with one Restraint interlock 2.36E-07 per hour 2.36E-0115 SIL2
Table 6: Quantified risk assessment: Crazy Frog lap-bar interlock: Single-arm safety function
Target risk
3 Target (individual) risk of injury during ride
Table 6 shows the calculations used to determine the target safety integrity.
We can calculate Joshua’s target risk of injury for the duration27 of his ride on the Crazy Frog as shown at Row 6. If Joshua did not ride on the Crazy frog and went about his daily life for a similar length of time, this would be his risk of being seriously, but not fatally, injured.
Joshua’s target risk of injury will depend on a number of safety functions of which we are considering only one. As described for the rollercoaster, we are considering the most onerous safety function and shall take the worst-case approach by dividing his total risk by the number of safety functions shown at Row 7 in order to determine Joshua’s target risk associated with the Restraint interlock at Row 8.
Four safety functions have been assumed. These are:
• the Restraint interlock;
• prevention of unexpected start-up;
• prevention of the dropping of the arms onto their lower end-stops (leading to passengers receiving back injuries), i.e., ensuring a soft stop, and
• emergency stop. Whilst the failure of the emergency-stop function may not in itself lead directly to a hazard, its inclusion will lead to the target risk moving in the safer
27 It should be noted that the interlock could fail whilst the previous passenger was on the ride; however, it will be tested in anger only if the operator fails to lock down Joshua’s Restraint. Therefore, the ride duration applies to the previous, and not necessarily Joshua’s, ride.
25
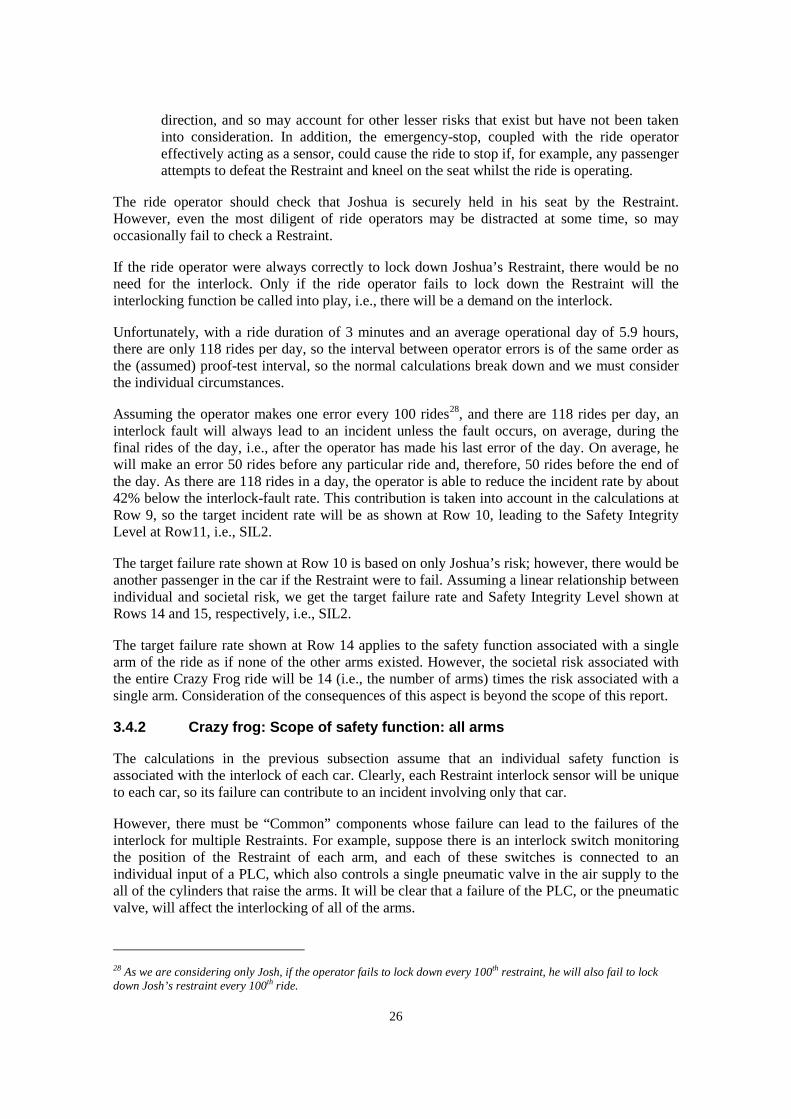
direction, and so may account for other lesser risks that exist but have not been taken into consideration. In addition, the emergency-stop, coupled with the ride operator effectively acting as a sensor, could cause the ride to stop if, for example, any passenger attempts to defeat the Restraint and kneel on the seat whilst the ride is operating.
The ride operator should check that Joshua is securely held in his seat by the Restraint. However, even the most diligent of ride operators may be distracted at some time, so may occasionally fail to check a Restraint.
If the ride operator were always correctly to lock down Joshua’s Restraint, there would be no need for the interlock. Only if the ride operator fails to lock down the Restraint will the interlocking function be called into play, i.e., there will be a demand on the interlock.
Unfortunately, with a ride duration of 3 minutes and an average operational day of 5.9 hours, there are only 118 rides per day, so the interval between operator errors is of the same order as the (assumed) proof-test interval, so the normal calculations break down and we must consider the individual circumstances.
Assuming the operator makes one error every 100 rides28, and there are 118 rides per day, an interlock fault will always lead to an incident unless the fault occurs, on average, during the final rides of the day, i.e., after the operator has made his last error of the day. On average, he will make an error 50 rides before any particular ride and, therefore, 50 rides before the end of the day. As there are 118 rides in a day, the operator is able to reduce the incident rate by about 42% below the interlock-fault rate. This contribution is taken into account in the calculations at Row 9, so the target incident rate will be as shown at Row 10, leading to the Safety Integrity Level at Row11, i.e., SIL2.
The target failure rate shown at Row 10 is based on only Joshua’s risk; however, there would be another passenger in the car if the Restraint were to fail. Assuming a linear relationship between individual and societal risk, we get the target failure rate and Safety Integrity Level shown at Rows 14 and 15, respectively, i.e., SIL2.
The target failure rate shown at Row 14 applies to the safety function associated with a single arm of the ride as if none of the other arms existed. However, the societal risk associated with the entire Crazy Frog ride will be 14 (i.e., the number of arms) times the risk associated with a single arm. Consideration of the consequences of this aspect is beyond the scope of this report.
3.4.2 Crazy frog: Scope of safety function: all arms
The calculations in the previous subsection assume that an individual safety function is associated with the interlock of each car. Clearly, each Restraint interlock sensor will be unique to each car, so its failure can contribute to an incident involving only that car.
However, there must be “Common” components whose failure can lead to the failures of the interlock for multiple Restraints. For example, suppose there is an interlock switch monitoring the position of the Restraint of each arm, and each of these switches is connected to an individual input of a PLC, which also controls a single pneumatic valve in the air supply to the all of the cylinders that raise the arms. It will be clear that a failure of the PLC, or the pneumatic valve, will affect the interlocking of all of the arms.
28 As we are considering only Josh, if the operator fails to lock down every 100th restraint, he will also fail to lock down Josh’s restraint every 100th ride.
26

Therefore, a fault in a Common Component could lead to the Restraint of every car failing. This would have a number of consequences.
1) We calculated the target failure rate of the interlock function for the car that Joshua decided to sit in. If a Common Component were to fail, his target risk would be unaffected, as the target risk would apply to only the car that he rides in. (Joshua cannot ride in more than one car, so whether the interlock of the Restraint of the car in which he is riding, or those in all of the cars on the ride, were to fail would be immaterial to him as his risk would be the same in each case.)
2) A fault in a Common Component would lead to all of the Restraint interlocks failing. Let us assume that the ride operator fails properly to secure every 14th Restraint and there are 14 arms (Restraints) on the ride, although on average he would fail to lock down each Restraint only once in every 14 rides, he would be expected to fail to lock down the Restraint on one (random) car every ride. Therefore, the failure of a Common Component would not lead to every passenger on the ride becoming ejected, but only those passengers riding in the car with the Restraint that the operator first fails to secure following the failure of the interlock.
The operator is unlikely to make two errors for the same ride. If he/she fails to lock down every 100th Restraint, the Poissonian probability of him/her making a double error when 0.14 [i.e., 14/100] are expected is 0.85%, i.e., one double error in every 117 rides; however, he would be expected to make a single error every 8.2 rides, a factor of about 14 more. On average, the operator will make an error every 7.1 rides.
As the demand rate on the interlock (1 in 7.1 rides) considerably exceeds the proof-test rate (1 in 118 rides – the number of rides per day), the difference between the incident rate and the Restraint failure rate will be insignificant in comparison, so will not be taken into consideration. Therefore, we can determine the target fault rate of Joshua’s Restraint as shown at Row 8 of Table 7 by dividing his target risk by the number of safety functions.
Row Event Value Units Rate per 106h
1 Background risk of serious injury 1.90E-02 per year 2.17E+002 Active length of passenger day 16 hours3 Target (individual) risk of injury during ride 2.85E-02 per year 3.25E+004 Individual risk5 Duration of ride 3 minutes6 Target (individual) risk of injury 1.63E-07 per ride 3.25E+007 Total number of safety functions affecting Josh 48 Target catastrophic fault rate of Josh's Restraint 4.06E-08 per ride 8.13E-019 Number of arms on the Crazy Frog ride 1410 Target catastrophic fault rate of the common interlock 5.69E-07 per ride 1.14E+0111 Target catastrophic fault rate associated with one Restraint interlock 1.14E-05 per hour 1.14E+0112 No SIL13 Societal risk14 Number of passengers in each car who are susceptible to interlock failure 215 Target failure rate associated with one Restraint interlock 4.06E-07 per hour 4.06E-0116 SIL2
Table 7: Quantified risk assessment: Crazy Frog Restraint interlock assuming a Common Interlock
Target risk
Although we can assume that all interlock failures will always lead to an incident if the operator fails to lock down the Restraint, the incident could affect a car other than the one in which Joshua is riding.
27

For the first ride after the fault occurs, there is a 1/100 chance of the operator failing to lock down Joshua’s restraint, but there is a 13/100 chance (assuming 14 arms on the ride) that the operator will fail to lock down another restraint and, although this is likely to cause someone else serious injury, it will not be Joshua. As far as Joshua is concerned, an incident affecting a different car will merely identify the fault, and the interlock can be repaired – in effect, when this situation occurs, the other unfortunate passengers have carried out a proof test on the Common Interlock.
For the second ride after the fault occurs, Joshua will again have a 1/100 chance, but we must first remove the probability associated with the testing carried out by the passengers on the previous ride, i.e., the probability of the operator failing to lock down Joshua’s lap bar if he is on the second ride after the fault occurs will be 1/100*(1-14/100), and so on.
Because of the relatively high rate of operator errors, an incident is almost inevitable once an interlock fault occurs – it is just a matter of on which Restraint the operator makes his first error following the fault occurring. In fact, if we continue to expand the function shown in the previous paragraph indefinitely, it turns out to be 14 times more likely for the incident to involve either a passenger in another car, or a previous passenger in Joshua’s car, and leads to a target failure rate for the Common Interlock to be as shown at Row 11 of Table 7.
Counter-intuitively, this leads to the conclusion that no SIL is required, i.e., the required integrity is less than SIL1. The reason for this is that, because we are considering a Common Interlock, Joshua need not be in the car whose Restraint the operator fails to lock down, leading to other passengers being affected and, effectively, proof testing the interlock for Joshua. The situation would lead to Joshua’s risk being maintained at the target level, but this would be achieved at the expense of others, so would be an unacceptable situation overall.
If we were to consider societal risk, following the interlock fault occurring, there would be no “lottery” in which the operator would effectively choose which pair of passengers would be injured, so the target failure rate considering societal risk would be as shown at Row 15.
28

4 COMMENTS BY THE AUTHOR
A quantitative risk assessment can be used to determine the SIL of each safety-related function. Each safety-related function will be carried out by a number of components and subsystems. These will include, for example:
• one or more sensors (e.g., car sensors on a rollercoaster track, lap-bar switches, etc.);
• the device that implements the control logic (e.g., a number of relays, one or more PLCs, hardwired electronic logic, etc.), and
• one or more actuators ( hydraulic valves and cylinders, motors, pneumatic brake control valves - including the brakes themselves, etc.)
Although the control system may allow the SIL of each safety-related function to be achieved immediately after the commissioning of the ride, the subsequent safety of the passengers on the ride will depend increasingly on other factors. The author has investigated a number of incidents involving fairground rides, some of which involved minor injuries and others that proved fatal. Of these incidents the primary29 causes were distributed as follows (See Reference 16.).
• 27%: Design of the ride
• 20%: Operator action
• 13%: Poor safety culture
• 13%: Inadequate fault reporting/maintenance
• 13%: Manually defeated protection system
• 7%: Inadequate ride documentation
• 7%: Inadequate system of work
Consideration of the above list shows that nearly ¾ of the incidents (including the two that led to injuries that proved fatal) had a primary cause associated with those parts of the ride lifecycles subsequent to commissioning.
Therefore, it is ESSENTIAL that the commissioning, maintenance and operation of rides and their control systems is appropriate to the SIL determined for the relevant safety functions, for example, the higher the SIL, the higher should be the quality of the maintenance.
In order to achieve a high SIL, the designer should incorporate diagnostic functions which may be hidden to the user. Other safety functions may lie dormant until a fault elsewhere arises. As a result, there may be safety functions that the user may not be aware of but which, nevertheless, require to be periodically checked in order to maintain the SIL. (For example, in the case of a log-flume ride, the operation of the low-water interlock needs to be periodically checked and the water level at which it operates confirmed to be appropriate.)
29 Incidents mostly result from a number of factors becoming concurrent. The primary cause is that factor which, in the author’s opinion, was the most important.
29

Therefore, it is important that the designer of the ride provides documentation indicating the requirements for commissioning, maintenance and operation, and that the instructions within this documentation are carefully followed.
Although this report focusses on Safety Integrity levels, associate them with the rates of unsafe failures, or probabilities of failure on demand, it should be pointed out that for some applications, a SIL (or PL – performance level) specification can also be accompanied by particular fault tolerance requirements (e.g., hardware fault tolerance [HFT] of 1, i.e., Category 3, meaning that the function must be able to tolerate a single fault without failing to a dangerous state). Although SIL2, and to a lesser extent SIL3, could in theory be achieved by a system having zero HFT, some applications may require a fault tolerant architecture.
30

5 CONCLUSIONS
1) The probability of a typical person receiving a serious non-fatal injury when going about his/her normal daily life is about 1.910
-2per year.
2) The safety functions of a large rollercoaster should be designed to have a target dangerous fault rate of no more than 1.3410
-8 per hour and be specified, designed, manufactured, documented, commissioned and operated according to the requirements of SIL3 and any other supplementary safety-performance requirements.
3) The safety functions of a transportable lug-flume ride should be designed to have a target probability of failure on demand of no more than 5.3610
-4 and be specified, designed, manufactured, documented, commissioned and operated according to the requirements of SIL3.
4) The safety functions of a Crazy Frog ride should be designed to have a target dangerous fault rate of no more than 2.3610
-7 per hour and be specified, designed, manufactured, documented, commissioned and operated according to the requirements of SIL2 and any other supplementary safety-performance requirements.
5) Ride manufacturers should provide appropriate documentation facilitating the commissioning, maintenance and operation of rides in order to ensure that the as-designed SILs can be maintained throughout the lives of the rides.
31

6 REFERENCES
1) Reducing Risks, Protecting People, HSE’s decision-making process, HSE Books, 2001, ISBN 0 7176 2151 0.
2) BS EN 61508-1:2010, Functional safety of electrical/electronic/programmable electronic safety related systems, Part 1: General requirements, BSI Standards, ISBN 978 0 580 56233 4
3) BS EN 13814:2004, Fairground and amusement park machinery and structures – Safety, BSI Standards, ISBN 978 0 580 75299 5.
4) HOSPITAL EPISODE STATISTICS: Accident and Emergency attendances in England (experimental statistics) for the years 2007/08 to 2010/11 downloaded from HESOnline at http://www.hesonline.nhs.uk/Ease/servlet/ContentServer?siteID=1937&categoryID=1272
5) Population Estimates Quinary Age Groups for UK Constituent Countries - Mid 1971 to Mid-2010, Office of National Statistics, downloaded from http://www.ons.gov.uk/ons/publications/re-reference-tables.html?edition=tcm%3A77-247414
6) BS EN 61508-2:2010, Functional safety of electrical/electronic/programmable electronic safety related systems, Part 2: Requirements for electrical/electronic/programmable electronic safety-related systems, BSI Standards, ISBN 978 0 580 56234 1
7) 2011 Annual book of ASTM standards, Volume 15.07, ASTM International, ISBN 978-0-8031-8431-2
8) The NHS Information Centre, Hospital Episode Statistics for England. Inpatient statistics, 2010-11, downloaded from HESOnline at http://www.hesonline.nhs.uk/Ease/servlet/ContentServer?siteID=1937&categoryID=202
9) Examination of the Jungle River log-flume ride at Bridlington following an incident in which a woman and a child were ejected from the car in which they were travelling, A M Wray, Health & Safety Laboratory Incident Report XS/11/108, December 2011
10) Reliability, Maintainability and Risk – Practical methods for engineers, David J Smith, Butterworth Heinmann, ISBN 0 7506 0854 4
11) OREDA-97 (Offshore reliability data) 3rd edition, SINTEF Industrial Management, ISBN 82-14-00438-1, 1997
12) BS EN ISO 13849-1:2006, Safety of machinery — Safety related parts of control systems. Part 1: General principles for design, BSI Standards, ISBN 978 0 580 50882 0
13) BS EN ISO 13849-2:2012, Safety of machinery — Safety related parts of control systems. Part 2: Validation, BSI Standards, ISBN 978 0 580 66820 3
32

14) BS EN 61508-5:2010, Functional safety of electrical/electronic/programmable electronic safety related systems, Part 5: Examples of methods for the determination of safety integrity levels, BSI Standards, ISBN 978 0 580 65449 7
15) Private communication: Meeting with Melvin Sandell, HSE, at the Health & Safety Laboratory, 21/12/2012.
16) A summary of the causes of fairground incidents related to control systems over the period 1993 to 2011, A M Wray, BSc PhD, Health and Safety Laboratory Internal Report MH/13/17, January 2013
33

Published by the Health & Safety Executive 11/16

A study of the generic safety-integrity requirements of fairground rides
RR1080
www.hse.gov.uk
The use of computer-based control systems allows modern fairground rides to perform increasingly complex functions at very high speeds. In some cases, passenger safety will depend on the correct operation of these control systems, so their failure could compromise passenger safety. As a result, it is important that the rate of potentially dangerous control-system failures is adequately low in relation to the hazard level associated with the functions that they carry out. Quantitative risk assessment techniques are used in, for example, the process and manufacturing industries, but these techniques have been slow in moving to the fairground industry. To try and rectify this, this report sets out to illustrate how quantitative risk assessment techniques can be used to determine the target Safety Integrity Level (SIL) for the control systems of three diverse types of fairground ride, with the intention of encouraging the use of these techniques and also to indicate the expected target SIL requirements for the control systems of these typical types of ride. Having determined the target SIL, the designer can use appropriate techniques (e.g. multiple channels, extensive internal diagnostics, etc.) to ensure that the rate of potentially dangerous control system failures is adequately low, using the guidance provided by standards such as BS EN 13849 or BS EN 61508/IEC 61508.
This report and the work it describes were funded by the Health and Safety Executive (HSE). Its contents, including any opinions and/or conclusions expressed, are those of the authors alone and do not necessarily reflect HSE policy.