rr855 - the burden of occupational cancer in great … · the burden of occupational cancer in...
TRANSCRIPT

Prepared by Imperial College London and the Institute of Occupational Medicine for the Health and Safety Executive 2012
Health and Safety Executive
The burden of occupational cancer in Great BritainCancer of the larynx
RR855Research Report
Léa Fortunato, Sally Hutchings, Lesley Rushton Department of Epidemiology and BiostatisticsImperial College LondonNorfolk PlaceLondon W2 1PG
John Cherrie, Martie Van TongerenInstitute of Occupational MedicineResearch Avenue NorthRiccartonEdinburgh EH14 4AP
The aim of this project was to produce an updated estimate of the current burden of cancer for Great Britain resulting from occupational exposure to carcinogenic agents or exposure circumstances. The primary measure of the burden of cancer was the attributable fraction (AF) being the proportion of cases that would not have occurred in the absence of exposure; and the AF was used to estimate the number of attributable deaths and registrations. The study involved obtaining data on the risk of the cancer due to the exposure of interest, taking into account confounding factors and overlapping exposures, as well as the proportion of the target population exposed over the relevant exposure period. Only carcinogenic agents, or exposure circumstances, classified by the International Agency for Research on Cancer (IARC) as definite (Group 1) or probable (Group 2A) human carcinogens were considered. Here, we present estimates for cancer of the larynx that have been derived using incidence data for calendar year 2004, and mortality data for calendar year 2005.
The estimated total (male and female) attributable fractions, deaths and registrations for cancer of the larynx related to occupational exposure is 2.61% (95% Confidence Interval (CI)=0.83-4.32), which equates to 20 (95%CI=5-101) attributable deaths and 56 (95%CI=8-101) attributable registrations.
This report and the work it describes were funded by the Health and Safety Executive (HSE). Its contents, including any opinions and/or conclusions expressed, are those of the authors alone and do not necessarily reflect HSE policy.
The burden of occupational cancer in Great BritainCancer of the larynx
HSE Books
Health and Safety Executive
© Crown copyright 2012
First published 2012
You may reuse this information (not including logos) free of charge in any format or medium, under the terms of the Open Government Licence. To view the licence visit www.nationalarchives.gov.uk/doc/open-government-licence/, write to the Information Policy Team, The National Archives, Kew, London TW9 4DU, or email [email protected].
Some images and illustrations may not be owned by the Crown so cannot be reproduced without permission of the copyright owner. Enquiries should be sent to [email protected].
ACKNOWLEDGEMENTS
Funding was obtained from the Health and Safety Executive (HSE). Andrew Darnton from the HSE was responsible for the work on mesothelioma. The contributions to the project and advice received from many other HSE and Health and Safety Laboratory staff is gratefully acknowledged. Two workshops were held during the project bringing together experts from the UK and around the world. We would like to thank all those who participated and have continued to give advice and comment on the project. We would also like to thank Helen Pedersen and Gareth Evans for their help in editing and formatting the reports.
ii
EXECUTIVE SUMMARY The aim of this project was to produce an updated estimate of the current burden of cancer for Great Britain resulting from occupational exposure to carcinogenic agents or exposure circumstances. The primary measure of the burden of cancer used in this project was the attributable fraction i.e. the proportion of cases that would not have occurred in the absence of exposure; this was then used to estimate the attributable numbers. This involved obtaining data on the risk of the disease due to the exposure of interest, taking into account confounding factors and overlapping exposures, and the proportion of the target population exposed over the period in which relevant exposure occurred. Estimation was carried out for carcinogenic agents or exposure circumstances classified by the International Agency for Research on Cancer (IARC) as definite (Group 1) or probable (Group 2A) human carcinogens. Here, we present estimates for cancer of the larynx that have been derived using incidence data for calendar year 2004, and mortality data for calendar year 2005. Asbestos, mustard gas, and strong inorganic mists containing sulphuric acid have has been classified by IARC as a definite human carcinogen for laryngeal cancer and work in the rubber industry has been classified by IARC as a probable human carcinogen. Historical exposure to asbestos occurred in manufacture of, insulation, among cement workers, vermiculite workers, miners and millers, railroad car construction workers, shipyard workers, and asbestos textile workers. Current exposure occurs particularly in the construction industry. Workers exposure to strong inorganic acid mists can occur during production of isopropanol and ethanol, steel pickling, battery manufacture and sulphuric acid production, and manufacture of soaps and detergents. Mustard gas exposure occurred to workers employed in manufacture before the Second World War. As very few workers have been exposed since no estimation has been carried out for this carcinogen. Other exposures that have been considered as possible risk factors for cancer of the larynx include metal working fluids and wood dusts.
Due to assumptions made about cancer latency and working age range, only cancers in ages 25+ in 2005/2004 could be attributable to occupation. For Great Britain in 2005, there were 605 total deaths in men aged 25+ and 161 in women aged 25+ from laryngeal cancer; in 2004 there were 1748 total registrations for laryngeal cancer in men aged 25+ and 364 in women aged 25+. The estimated total (male and female) attributable fractions, deaths and registrations for cancer of the larynx related to occupational exposure is 2.61% (95% Confidence Interval (CI)=0.83-4.32), which equates to 20 (95%CI=5-101) attributable deaths and 56 (95%CI=8-101) attributable registrations. Results for individual carcinogenic agents for which the attributable fraction was determined are as follows:
The estimated total (male and female) attributable fraction for cancer of the larynx associated with exposure to asbestos is 0.37% (95%CI=0.17-0.60), which equates to 3 (95%CI=1-5) deaths and 8 (95%CI=4-13) registrations.
The estimated total (male & female) attributable fraction for cancer of the larynx associated with occupational exposure to strong inorganic acid mists is 2.13% (95%CI=0.77-4.76), which equates to 16 (95%CI=6-36) attributable deaths and 46 (95%CI=17-102) attributable registrations of laryngeal cancer.
The estimated total (male & female) attributable fraction for cancer of the larynx associated with work in the rubber industry is 0.12% (95%CI=0.00-0.44), which equates to 1 (95%CI=0-3), attributable death and 3 (95%CI=0-10) attributable registrations of laryngeal cancer.
iii

iv
CONTENTS
1. INCIDENCE AND TRENDS 1
2. OVERVIEW OF AETIOLOGY 4
2.1 Introduction 4
2.2 Exposures 7
2.2.1 Asbestos 7
2.2.2 Mustard Gas 8
2.2.3 Strong inorganic-acid mists containing sulfuric acid 9
2.3 Exposure Circumstances 10
2.3.1 Isopropanol manufacture, strong-acid process 10
2.3.2 Rubber industry 10
2.4 Other Exposures 12 3 ATTRIBUTABLE FRACTION ESTIMATION 13
3.1 General Considerations 13 3.2 Asbestos 14 3.3 Mustard Gas 18 3.4 Strong Inorganic-Acid Mists Containing Sulfuric Acid 18 3.6 Rubber Industry 21
4. OVERALL ATTRIBUTABLE FRACTION 24
4.1 Exposure Map 24 4.2 Summary Of Results 24 4.3 Exposures By Industry/Job 26
5. BIBLIOGRAPHY 27
6. STATISTICAL APPENDIX 32
APPENDIX 1: META-ANALYSIS FOR ASBESTOS 34
v

vi

1. INCIDENCE AND TRENDS Laryngeal cancer (ICD-9 161; ICD-10 C32) is the eighteenth worldwide most common cancer with an estimated 159,000 new cases (about 2% of the total world cancer cases) and 90,000 deaths in the year 2002 (Parkin et al. 2005). In the UK, 2,166 (1,789 males and 377 females) new cases and 786 (620 males and 166 females) deaths have been reported for the year 2004. It is usually squamous and arises in three locations: glottic (vocal cords), supraglottic, and subglottic. Most laryngeal cancers originate in the glottis (ICD-9 161.0; ICD-10 C32.0). Supraglottic cancers are relatively rare (ICD-9 161.1; ICD-10 C32.1), and subglottic tumours are least frequent (ICD-9 161.2; ICD-10 C32.2). This disease is markedly more frequent in males than in females (Rafferty et al, 2001) and there is a large geographic variability in disease frequency.
In the UK and Ireland in the 1990s, laryngeal cancer accounted for around 1 in 70 diagnosed cases of cancer. Overall, the age-standardized incidence rate (using the European standard population) was 6.3 per 100,000 males and 1.2 per 100,000 females (Quinn et al, 2005). Moreover, cancer of the larynx is a disease that mainly affects elderly people. Incidence was considerably lower than the overall rate in those aged under 50, and then rose rapidly to peak in those aged 75-79 (29.4 per 100,000 males in 2004, Cancer Research UK, 2007). Within the countries of the UK, the highest incidence rates for cancer of the larynx occurred in Scotland, where the age-standardized incidence in males was 57% higher than the average (8.3 versus 5.3) in 2004. Incidence rates were closer to the average in the other constituent countries. However, Quinn et al. (2005) observed a large variability within England, where there was a very clear North-South divide (with incidence rates being higher than average in the North West, and Northern and Yorkshire regions), as well as between the health authorities within a country or region. The geographical variations in incidence are likely to reflect the corresponding variation in the historical patterns of prevalence of smoking and alcohol consumption, both of which are established risk factors. Patterns of mortality across the UK and Ireland were similar to those of incidence: the highest mortality rate was seen in Scotland.
Time trends in incidence and mortality are presented in Tables 1 and 2, respectively. There was a little apparent variation in the incidence among males with a peak in 2000 (6.6 per 100,000 males). After 2000, it seems to decrease with an incidence rate of 5.8 in 2004. Among females, the rate was relatively stable.
1

Table 1: Laryngeal cancer registration trends in England and Wales for 1992-1994, in England only for 1995-2004 (source: Office of National Statistics, 2007)
Males Females
Year Total* Laryngeal cancer
% total Rate** /100,000
Total* Laryngeal cancer
% total Rate** /100,000
1992& 109,336 1,681 1.5 6.7 112,247 365 0.3 1.4 1993& 109,414 1,597 1.5 6.3 109,891 398 0.4 1.5 1994& 112,145 1,714 1.5 6.8 112,175 362 0.3 1.4 1995# 103,986 1,449 1.4 6.0 105,151 345 0.3 1.4 1996# 104,103 1,471 1.4 6.1 105,461 328 0.3 1.3 1997# 104,335 1,482 1.4 6.1 107,289 330 0.3 1.3 1998# 106,745 1,461 1.4 6.0 109,957 329 0.3 1.3 1999# 108,827 1,451 1.3 5.9 112,237 318 0.3 1.3 2000# 111,543 1,578 1.4 6.6 112,066 325 0.3 1.3 2001# 112,516 1,477 1.3 6.1 112,134 328 0.3 1.3 2002# 112,579 1,374 1.2 5.7 112,210 300 0.3 1.2, 2003# 112,732 1,380 1.2 5.7 114,740 318 0.3 1.2, 2004# 117,805 1,424 1.2 5.8 115,816 269 0.2 1.1
Average 109,697 1,503 1.4 6.1 110,875 332 0.3 1.3 * all cancers excluding non-melanoma skin cancer (nmsc), all ages ** crude rate per 100 000 population of newly diagnosed cases, all ages & England and Wales # England only
Table 2 Laryngeal cancer mortality trends in England and Wales for 1999-2005 (source: Office of National Statistics, 2007)
Males Females
Year Total* Laryngeal cancer
% total Rate** /1,000,000
Total* Laryngeal cancer
% total Rate** /1,000,000
1999 264,299 584 0.22 22 291,819 156 0.05 6 2000 255,547 570 0.22 21 280,117 139 0.05 5 2001 252,426 612 0.24 22 277,947 142 0.05 5 2002 253,144 584 0.23 21 280,383 148 0.05 5 2003 253,852 571 0.22 18 284,402 150 0.05 4 2004 244,130 534 0.22 17 268,411 136 0.05 3 2005 243,324 524 0.22 17 269,368 136 0.05 3
Average 252,389 568 0.23 19.7 278,921 144 0.05 4.4 * number of deaths, all causes, all ages ** crude rate per 1,000,000 population
Survival from cancer of the larynx in England and Wales is moderately good. Based on male patients diagnosed in 2000-2001, the age-standardized 1-year relative survival rates was 85% and after 5 years of 65%. Survival was poorer for females than males (Quinn et al, 2005).
Incidence data available from population-based registries on five continents vary considerably (Parkin et al, 2005). The disease is markedly more frequent in males than in females with a male:female ratio of 12:1 and 6:1 in developing and developed countries, respectively. For men, high-risk countries were
2

found in Southern Europe (France, Italy and Spain, with an age-adjusted incidence rate of 10.8, 10.2 and 12.8 respectively for the year 2002), Eastern Europe (Russia, Ukraine, and Poland), South America (Uruguay, Argentina, and Brazil) and Western Asia (Turkey, Iraq). In comparison, incidence rates for men were lower than 5 per 100,000 in most registries in Africa, China, Japan, Northern Europe, UK, and Canada. Among females, the age-adjusted incidence rates are usually less than 1 per 100,000 and vary a little. Mortality rates from laryngeal cancer are prone to error due to difficulty in distinguishing between larynx and hypopharynx, but similar patterns emerge to those of incidence (Bray et al, 2002).
3
2. OVERVIEW OF AETIOLOGY
2.1 INTRODUCTION
The main risk factors for cancer of the larynx are tobacco and alcohol, each of which has a multiplicative effect (Altieri et al, 2005, IARC 2004, Pelucchi et al, 2006).
Case-control and cohort studies have consistently reported an elevated risk of laryngeal cancer in current smokers compared with people who have never smoked. Moreover, these studies found that the increase in RR was directly related to the numbers of cigarettes smoked and the duration of smoking (IARC, 2004). A pattern of decreasing risk with increasing time since smoking cessation has been reported. Tobacco smoking is estimated to cause two-thirds of all cases in men (Pelucchi et al. 2006). A recent Italian case-control study, including 527 cases and 1,297 hospital controls, found that 90% of cases could be attributable to tobacco (Altieri et al, 2002).
A meta-analysis of 20 case-control studies of laryngeal cancer (Bagnardi et al, 2001), including 3,759 cases, reported a strong direct relationship between alcohol consumption and risk of laryngeal cancer with a significant trend: people who consumed 25, 50 or 100g of alcohol per day had RRs of 1.38 (95%=1.32-1.45), 1.94 (1.78-2.11), 3.95 (3.43-4.57), respectively. When restricted to studies that reported adjustment for tobacco, a pooled RR of 2.8 (2.4-3.3) for 100g of alcohol per day was found. Despite the dose-response pattern with amount of drinking, studies have not found a clear trend of increasing duration with increasing risk. After stopping drinking, some fall in risk becomes apparent in the long term (more than 20 years) (Altieri et al, 2002, Altieri et al, 2005)). The supraglottis is more closely related to alcohol consumption, as compared to the glottis/subglottis.
In summary, tobacco is the best-described and most important risk factor for laryngeal cancer (Olshan, 2006). The reported effect estimates have been generally strong, consistent, and show a pronounced dose-response relationship. The etiologic role of alcohol is less clear, but evidence suggests both a weaker dependant and a joint effect with tobacco. From these findings, tobacco and alcohol should be controlled when assessing epidemiologic evidence for associations between occupational exposures and laryngeal cancer.
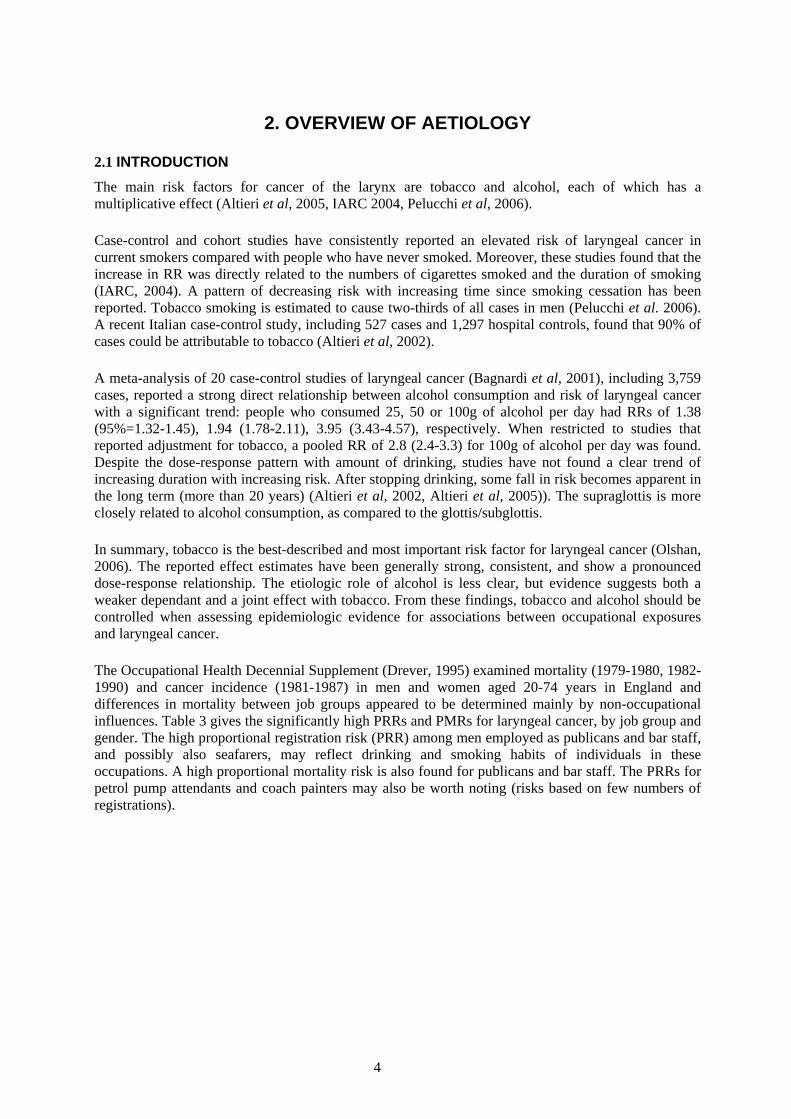
The Occupational Health Decennial Supplement (Drever, 1995) examined mortality (1979-1980, 1982-1990) and cancer incidence (1981-1987) in men and women aged 20-74 years in England and differences in mortality between job groups appeared to be determined mainly by non-occupational influences. Table 3 gives the significantly high PRRs and PMRs for laryngeal cancer, by job group and gender. The high proportional registration risk (PRR) among men employed as publicans and bar staff, and possibly also seafarers, may reflect drinking and smoking habits of individuals in these occupations. A high proportional mortality risk is also found for publicans and bar staff. The PRRs for petrol pump attendants and coach painters may also be worth noting (risks based on few numbers of registrations).
4

Table 3 Job codes with significantly high PRRs and PMRs for laryngeal cancer. Men and women aged 20-74 years, England Job group Registrations PRR* 95% CI Deaths PMR** 95% CI
SIC code Description (1981-87) (1979-1980 and 1982-90)
Men
036 Seafarers 33 173 119-243 67 242 188-307 043 Fishmongers and poultry 9 219 100-417 045 Publicans and bar staff 75 194 153-244 119 262 217-314 051 Launderers and dry cleaners 8 233 101-461 055 Petrol pump attendants 6 368 135-801 066 Fishing and related workers 14 279 152-467 120 Other metal manufacturers 27 154 102-225 40 153 109-208 146 Metal plate workers 37 205 144-283 147 Steel erectors 21 182 112-278 150 Riggers 12 219 113-383 158 Coach painters 5 365 119-853 173 Mains and service layers 16 224 128-364 183 Lorry drivers 249 132 116-150 194 Boiler operators 34 166 115-232
Women
124 Machine tool operators 5 325 204-6080 Source: Drever et al. (1995) Occupational Health Decennial Supplement * p<0.05, based on at least 3 registrations. Adjusted for age, social class and region of registration ** p<0.05, based on at least 3 registrations. Adjusted for age and social class The recent Occupational Health Decennial Supplement examined mortality for the period 1991-2000 in men and women aged 20-74 years in England (Table 4) (Coggon et al, 2009). For laryngeal cancer several of the jobs identified in the earlier supplement occur again, e.g. seafarers, publicans, fishermen and metal plating workers. Both supplements identify jobs within construction although the exact job groups vary. In the recent supplement painters, plasterers, roofers, other construction workers and crane drivers are highlighted for men. Publicans are identified for women as well as men in the recent supplement.
5
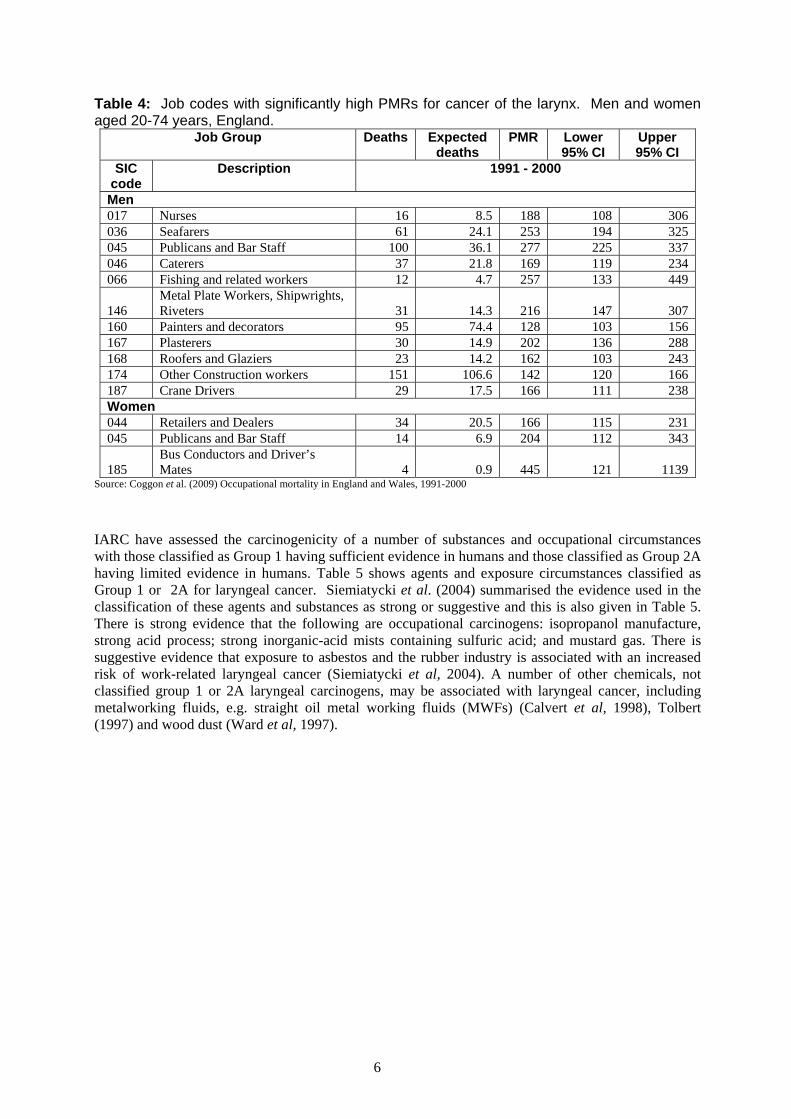
Table 4: Job codes with significantly high PMRs for cancer of the larynx. Men and women aged 20-74 years, England.
Job Group Deaths Expected deaths
PMR Lower 95% CI
Upper 95% CI
SIC code
Description 1991 - 2000
Men 017 Nurses 16 8.5 188 108 306 036 Seafarers 61 24.1 253 194 325 045 Publicans and Bar Staff 100 36.1 277 225 337 046 Caterers 37 21.8 169 119 234 066 Fishing and related workers 12 4.7 257 133 449
146 Metal Plate Workers, Shipwrights, Riveters 31 14.3 216 147 307
160 Painters and decorators 95 74.4 128 103 156 167 Plasterers 30 14.9 202 136 288 168 Roofers and Glaziers 23 14.2 162 103 243 174 Other Construction workers 151 106.6 142 120 166 187 Crane Drivers 29 17.5 166 111 238 Women 044 Retailers and Dealers 34 20.5 166 115 231 045 Publicans and Bar Staff 14 6.9 204 112 343
185 Bus Conductors and Driver’s Mates 4 0.9 445 121 1139
Source: Coggon et al. (2009) Occupational mortality in England and Wales, 1991-2000
IARC have assessed the carcinogenicity of a number of substances and occupational circumstances with those classified as Group 1 having sufficient evidence in humans and those classified as Group 2A having limited evidence in humans. Table 5 shows agents and exposure circumstances classified as Group 1 or 2A for laryngeal cancer. Siemiatycki et al. (2004) summarised the evidence used in the classification of these agents and substances as strong or suggestive and this is also given in Table 5. There is strong evidence that the following are occupational carcinogens: isopropanol manufacture, strong acid process; strong inorganic-acid mists containing sulfuric acid; and mustard gas. There is suggestive evidence that exposure to asbestos and the rubber industry is associated with an increased risk of work-related laryngeal cancer (Siemiatycki et al, 2004). A number of other chemicals, not classified group 1 or 2A laryngeal carcinogens, may be associated with laryngeal cancer, including metalworking fluids, e.g. straight oil metal working fluids (MWFs) (Calvert et al, 1998), Tolbert (1997) and wood dust (Ward et al, 1997).
6

Table 5 Occupational agents, groups of agents, mixtures, and exposure circumstances classified by the IARC Monographs, Vols 1-77 (IARC, 1972-2001), into Groups 1 and 2A, which have the larynx as target
Agents, mixture, circumstance
Main industry, use Evidence of carcinogenicity in humans
Strength of evidence
Other target organs
Group 1: carcinogenic to humans Agents, groups of agents
Asbestos Mining and milling; by-product manufacture; insulating; shipyard workers; sheet-metal workers; asbestos cement industry
Sufficient Suggestive Lung Mesothelioma GI tract
Mustard gas Production; used in research laboratories; military personnel
Sufficient Strong Lung Pharynx
Strong inorganic-acid mists containing sulfuric acid
Pickling operations; steel industry; petrochemical industry; phosphate acid fertilizer manufacturing
Sufficient Strong Lung
Exposure circumstances
Suspected substance
Isopropanol manufacture, strong-acid process
diisopropyl sulfate; isopropyl oils; sulfuric acid
Sufficient Strong Paranasal sinuses Lung
Rubber industry Aromatic amines; solvents Sufficient Suggestive Bladder Stomach Leukaemia Lung
Group 2A: probably carcinogenic to humans None identified
2.2 EXPOSURES
2.2.1 Asbestos According to CAREX, approximately 95,000 workers were exposed to asbestos in Great Britain, primarily in the construction industry (48.5%), and also in personal and household services (23.2%) and other mining (14.8%). Exposure to asbestos is via inhalation or ingestion. All forms of asbestos, serpentine (chrysotile) and amphiboles (crocidolite, amosite, tremolite, etc.) are carcinogenic to humans, although the potency of chrysotile might be lower than that of other types (IARC (1987). However, the role of asbestos in causing laryngeal cancer remains controversial (Siemiatycki et al, 2004). Recent reviews (Browne and Gee, 2000, Edelman, 1989, Griffiths and Molony 2003, Wight et al, 2003) concluded that the evidence does not indicate that asbestos exposure increases the risk of laryngeal cancer; positive results are probably due to a missing or sufficient adjustment for alcohol and tobacco consumption. For case-control studies, associations were significant without adjustment for smoking and alcohol consumption, or borderline significant with these adjustments. Among cohort studies, no associations were found.
Goodman et al. (1999) reviewed 69 asbestos-exposed occupational cohorts, 42 in Europe, 22 in North America and the remainder elsewhere. The results of the study are therefore portable. The earliest
7

study was published in 1967 and the most recent in 1997. The studies covered a variety of occupations, including: asbestos products manufacture (22%); cement workers (20%); shipyard workers (12%); asbestos miners and millers (10%); and textile workers (10%). The pooled analysis had 4 cohorts that provided results with latency and 27 without. Overall, the meta-SMR for laryngeal cancer, without taking into account latency and confounding factors (tobacco and alcohol), was 1.33 (95% CI=1.14-1.55), with a very high degree of homogeneity (p=0.99). In addition, a proxy of dosage exposure (using deaths from mesothelioma) showed no dose-response in laryngeal cancer. A weak association between laryngeal cancer and asbestos was concluded.
Browne and Gee (2000) reviewed 22 cohort studies including observed and expected numbers of laryngeal cancer deaths. The summary of all cohorts showed a mean SMR for laryngeal cancer of 1.08 (O=114, E=105.8); among these 22 studies, 17 are common with the meta-analysis by Goodman et al. (1999). In addition, 17 case-control studies were also reviewed (9 with adjustment for smoking and alcohol, 4 with adjustment for only smoking and 4 without adjustment): of the 17 studies, 8 showed no increase in relative risk; of the remaining nine, the increase in seven was not significant and the significance was only borderline in the 2 remaining (RR=1.8, 95% CI=1.0-3.4 (Olsen et al, 1984); RR=2.4, 95% CI=1.0-5.9 (Blot et al, 1980). The mean RR for 7 of the 9 case-control studies with adjustment for smoking and alcohol was 1.25. Two studies were not included in the meta-analysis: Elwood et al, 1984 did not give figures and mentioned that no indication of any substantial relationship was found; Zagraniski et al. (1986) used two methods, one based on self-reported exposure and the other one based on occupations but only the last one was retained.
Gustavsson et al. (1998) conducted a population-based case-control study in Sweden during 1988-1990, including 161 male cases of laryngeal cancer and 641 male controls. The study subjects were interviewed about several lifestyle factors (alcohol consumption and smoking habits) and a life history of occupations and work tasks; an occupational hygienist coded the exposure to 17 specific agents. After adjusting for alcohol and tobacco consumption, exposure to asbestos was associated with an increased risk of laryngeal cancer: the RR was 1.69 (95% CI=1.05-2.74) for the group of workers ever exposed to asbestos. In addition, a significant dose-response relation was present (ranging from RR=1.16 (1.02-1.32) for the lower class of exposure to RR=1.82 (1.08-3.04) for the highest class of exposure, p-value=0.02).
Marchand et al. (2000) conducted a hospital-based case-control study in France between 1989 and 1991. This study involved 315 male cases of laryngeal cancer and 315 male controls. The subjects’ past occupational exposures to asbestos were evaluated based on their job history, with the aid of a job-exposure matrix. Exposure to asbestos resulted in a non-significant increase in the risk of laryngeal cancer (OR=1.24, 95% CI=0.83-1.90, adjustment for alcohol and tobacco consumption).
In the most recent cohort (Purdue et al, 2006), including 307,799 male workers followed during 1971-2001 in the Swedish construction industry, asbestos exposure was related to an increased laryngeal cancer incidence, with a RR of 1.9 (95% CI=1.2-3.1) for workers ever exposed to asbestos (adjustment for smoking). This association was stronger for workers with a moderate exposure level (RR=2.3, 95% CI=1.4-3.8); however, there were only two laryngeal cancers in the high-exposure group.
2.2.2 Mustard Gas Mustard gas was used in chemical warfare during the First World War (but not in the Second World War). Currently, this chemical is not produced anymore, except in military research. The main routes of potential human exposure to mustard gas are inhalation and dermal contact; however, the general population is typically not exposed.
Based on the studies of manufacturers, mustard gas is clearly carcinogenic in humans (Blair and Kazerouni, 1997, IARC 1987). Laryngeal cancer among workers engaged in the manufacture of mustard gas has been studied in Japan (Nishimoto et al, 1988) and in England (Easton et al, 1988).
8

Nishimoto et al. (1988) studied 1,632 workers employed at a mustard gas factory between 1929 and 1945 and followed through 1980. There appeared to be an excess of cancer of the larynx but the SMR was not presented.
In a cohort study of 2,498 men and 1,032 women in England (Easton et al, 1988) followed up from 1945 to 1984, a significant increased mortality from laryngeal cancer (SMR=273, p<0.001) was found in workers employed in the manufacture of mustard gas during the second world war, compared with national death rates. The effect of smoking could not be controlled for. The SMR for laryngeal cancer was higher in workers employed for 3 or more years than in those employed for less than 3 years by a factor of 1.4 (323 versus 238); the difference in SMR was not significant. Moreover, no consistent relation with time since first exposure was found. In a previous study in this same manufacture, including 511 workers, Manning et al. (1981) reported a significant excess of laryngeal cancer (7 cases compared with 0.75 expected, p<0.001).
However, in the UK, manufacture of mustard gas ceased in the 1940s, and it is unlikely that attributable cases now occur in any number (Coggon, 1999). Indeed, CAREX estimated there were only 213 workers possibly exposed to this chemical in 1990-1993. The industries involved are education services (57%), research and scientific institutes (21%) and medical, dental, other health and veterinary services (22%).
2.2.3 Strong inorganic-acid mists containing sulfuric acid An increased risk has been suggested in workers exposed to strong inorganic acid, e.g. sulfuric acid, in a number of industries, including production of isopropanol and ethanol, steel pickling, battery manufacture and sulfuric acid production, and manufacture of soaps and detergents, and treatment of metals. IARC, on the basis of numerous epidemiological studies, have stated the association with laryngeal cancer is sufficient (IARC, 1987) and the evidence of carcinogenicity was considered as strong by Siemiatycki et al. (2004). In 1997, a review of literature (Blair & Kazerouni (1997), based on 12 studies (6 cohort, 4 case-control, 1 PMR and 1 geographic correlation studies), considered that the risk of laryngeal cancer was consistently raised among exposed workers. Epidemiologic studies of cancer and sulfuric acid exposures, with adjustment for smoking and alcohol, are summarized in Table 6. Brown et al. (1988) failed to find an association; their study dichotomized exposure into “ever versus never exposed” and thereby reduced its ability to detect “high-level exposure” effects. Risks for laryngeal cancer rose to fourfold or more in heavily exposed workers and over longer periods (Soskolne et al, 1984, Soskolne et al, 1992); results were similar with and without adjustments for tobacco and alcohol. However, the most recent case-control study (Shangina et al, 2006) did not find an association between laryngeal cancer and exposure to inorganic acid mists.
According to CAREX, approximately 42,000 workers are exposed to strong inorganic acid mists in Great Britain, mainly in the manufacture of industrial chemicals (26.9%), fabricated metal products (13.0%), electrical machinery (11.3%) and in nonferrous metal basis industries (10.1%).
9

Table 6 Selected epidemiologic studies of sulfuric acid and laryngeal cancer (with adjustments for tobacco and alcohol) Reference Industry
/product Country Design Study size
Period Exposure assessment
Results
Cohort studies
Steenland et al. (1988)
Metal treatment
US Industry 1,156 M workers employed 1940-65 follow-up 1985-94
Duration SIR=2.2 (1.2-3.7)CSIR=2.5 (O=14, E=5.6)
Case-control studies
Brown et al. (1988)
Job history US Hospital 183 M cases diagnosed 1980-81 250 M controls
Industrial hygienist estimation
RR=0.76 (0.42-1.35) CRR=0.69 (Ca=22, Co=42)
Soskolne et al. (1984)
Chemical workers
US Industry 30 M cases diagnosed 1944-80 175 M controls
Average level Moderate level: OR=4.6 (0.83-25.4), p<0.10 High level: OR=13.4 (2.08, 86.0), p<0.05
Soskolne et al. (1992)
Job history Canada Population 204 cases diagnosed 1977-79 204 controls
Level, frequency, probability
OR=2.90 (1.62-5.20), p<0.001 Low: OR=1.91 (0.97-3.78) High: OR=4.28 (2.13-8.58), p<0.001
Shangina et al. (2006)
Job history Romania Poland Russia Slovakia
Hospital 316 M cases diagnosed 1999-2002 728 M controls
Industrial hygienist estimation
OR=0.94 (0.60, 1.49)
Abbreviations: M, male; CRR/CSIR: crude RR/SIR
2.3 EXPOSURE CIRCUMSTANCES
2.3.1 Isopropanol manufacture, strong-acid process Manufacture of isopropanol by the strong acid process has been linked with increased of laryngeal cancer (IARC, 1987). Currently, only one British company is thought to use this process, with a few relatively few workers involved (Coggon, 1999). Only one study reported results on the association between laryngeal cancer and “working in isopropanol production” (Teta et al, 1992). The authors observed excesses of laryngeal cancer, based on two cases only.
2.3.2 Rubber industry The evidence of a carcinogenic risk in the rubber industry has been reviewed by IARC in 1982 (IARC, 1982) and in summary form in 1987 (IARC, 1987). They concluded that there was sufficient evidence that employment in this industry entails a carcinogenic risk for laryngeal cancer. The strength of the
10
evidence was considered ‘suggestive’ by Siemiatycki et al. (2004). Kogevinas et al. (1998), Ward et al. (1997) and Wight et al. (2003) reviewed the literature and concluded that there was an excess risk, not significant but consistent between studies (Table 7). In a recent meta-analysis of mortality among workers in the synthetic rubber-producing industry (Alder et al, 2006), a meta-SMR for laryngeal cancer was 1.19 (95% CI=0.88-1.60), based on 13 cohort studies, with a high level of heterogeneity (p=0.01). In addition, they calculated a pooled estimate of 1.39 (95% CI=0.75-2.59) for incidence (3 studies).
Table 7 Epidemiological studies of rubber industry and laryngeal cancer Reference Country Study size
Period Exposure assessment
Results
Industry-based cohorts (no adjustment for tobacco and alcohol) Bernardinelli et al. (1987) Italy 4,917 M workers
employed 1962-1972follow-up 1962-1983
Job history SMR=129 (O=2)
Negri et al. (1989) Italy 6,629 M workers employed 1946-81 follow-up 1946-81
Job history SMR=1.26 (0.67-2.16)
Solionova & Smulevich (1993) Russia 3,670 workers employed 1979-83 follow-up 1979-88
Job history SIR=88 (O=2, E=2.2) all M workers Production subgroup SIR=121 (O=2, E=1.6) Non production subgroup SIR=0 (O=0, E=0)
Last update: Sorahan et al. (1989)
UK 36,691 M workers employed 1946-60 job history 1976-85 mortality 1946-85
Job history SMR=119 (O=33, E=27.8)
Weiland et al. (1998) Germany 11,663 M workers employed 1910-91 mortality 1981-91
Job history SMR=129 (69-221) Preparation of materials SMR=253 (93-551) Technical rubber goods SMR=106 (29-271) Tyres SMR=146 (40-373) Storage-dispatch SMR=0 (O=0)Maintenance SMR=154 (42-394) Others SMR=73 (O=1)
Straughan & Sorahan (2000) Last update:Dost et al. (2007)
UK 7,561 M workers employed 1982-91 follow-up 1983-2004
Job history SMR=103 (3-574), O=E=1
Hospital-based case-control studies (with adjustment for tobacco and alcohol) Muscat & Wynder (1992) US 194 M cases
diagnosed 1985-90 184 M controls
Self-exposure assessment
RR=6.4 (0.8-7.9)
Zagraniski et al. (1986) US 92 M cases diagnosed 1975-80 181 M controls
Job history OR=2.0 (0.7-6.1)
Meta-analysis Alder et al. (2006) World 16 cohorts
(3 cancer incidence) 1966-2003
meta-SMR=1.19 (0.88-1.60) heterogeneity: p=0.01, 13 studies meta-SIR=1.39 (0.75-2.59) heterogeneity: p=0.58, 3 studies
11
2.4 OTHER EXPOSURES The following occupational exposures are not included in IARC classification but some studies found that they are possible risk factors for laryngeal cancer.
Metalworking fluids Mineral oils (mineral oils include metalworking fluids) are known to be human carcinogens based on sufficient evidence of carcinogenicity that exposure to these types of mineral oils causes cancer. The International Agency for Research on Cancer concluded that there was sufficient evidence for the carcinogenicity of untreated and mildly treated mineral oils in humans (IARC, 1984, IARC , 1987). Metalworking fluids (MWFs) are commonly used in variety of industrial machining and grinding operations. CAREX did not estimate the number of workers exposed to mineral oils or MWFs. According to Labour Force Survey (LFS), some 1.7 million workers (95% males) were exposed to mineral oils in 1979.
Several studies suggest that MWFs may be associated with laryngeal cancer (Calvert et al, 1998). In particular, the studies by Eisen et al. (1992), Eisen et al. (1994) and Tolbert et al. (1992) found that laryngeal cancer is associated with exposure to straight oil MWFs. Zagraniski et al. (1986) found that workers ever employed as a metal grinder or as a machinist had an elevated risk with OR of 2.1 (1.0,4.7) and 2.5 (1.2,5.2) respectively.
Wood dust An IARC review of wood dust concluded that it was not a laryngeal carcinogen (IARC, 1995). However, occupations related to working with wood have been found to affect risk of laryngeal cancer (Ward et al, 1997) in case-studies, while cohort studies have not found excess mortality from laryngeal cancer. The most important association was found by Pollan and Lopez-Abente (1995): Workers in wood-related occupations (wood-workers and furniture workers) exposed over 20 years showed elevated risk (OR=5.63, 95% CI=1.15-6.64 for wood-workers; OR=6.67, 95% CI=1.05-42.57 for furniture workers subgroup) in a case-control study conducted in Madrid.
12
3 ATTRIBUTABLE FRACTION ESTIMATION 3.1 GENERAL CONSIDERATIONS
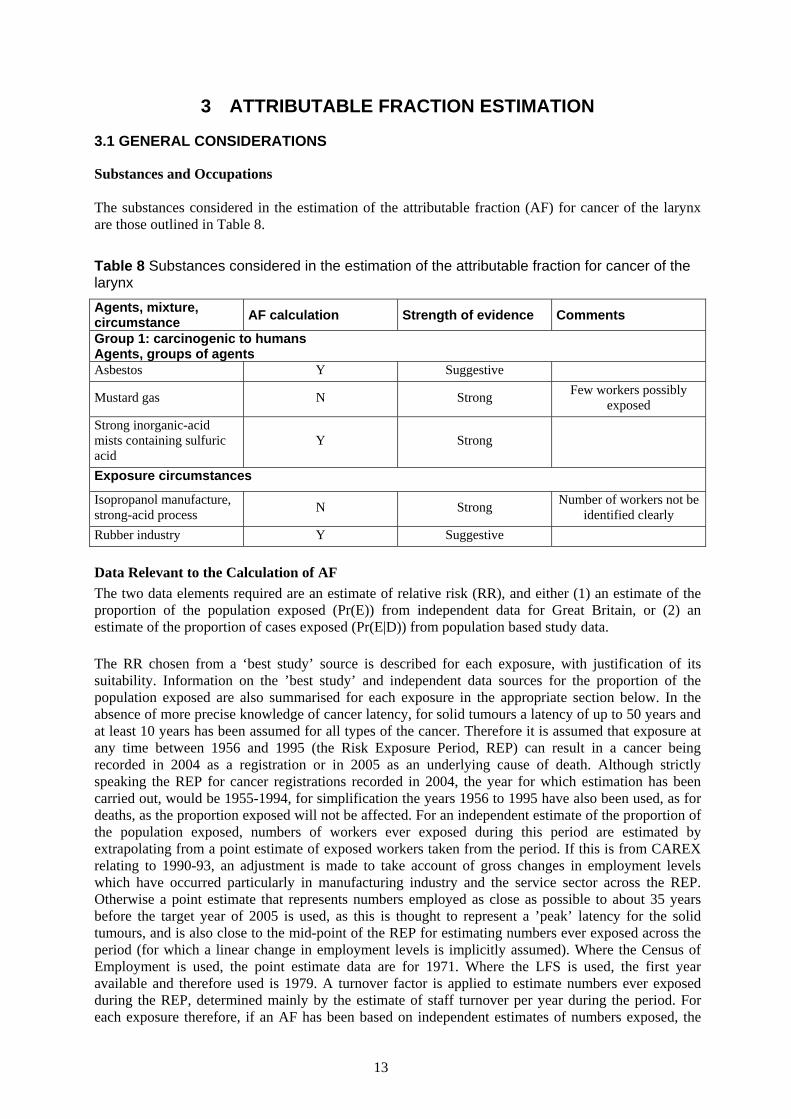
Substances and Occupations The substances considered in the estimation of the attributable fraction (AF) for cancer of the larynx are those outlined in Table 8.
Table 8 Substances considered in the estimation of the attributable fraction for cancer of the larynx Agents, mixture, circumstance AF calculation Strength of evidence Comments
Group 1: carcinogenic to humans Agents, groups of agents Asbestos Y Suggestive
Mustard gas N Strong Few workers possibly exposed
Strong inorganic-acid mists containing sulfuric acid
Y Strong
Exposure circumstances
Isopropanol manufacture, strong-acid process N Strong Number of workers not be
identified clearly Rubber industry Y Suggestive Data Relevant to the Calculation of AF The two data elements required are an estimate of relative risk (RR), and either (1) an estimate of the proportion of the population exposed (Pr(E)) from independent data for Great Britain, or (2) an estimate of the proportion of cases exposed (Pr(E|D)) from population based study data.
The RR chosen from a ‘best study’ source is described for each exposure, with justification of its suitability. Information on the ’best study’ and independent data sources for the proportion of the population exposed are also summarised for each exposure in the appropriate section below. In the absence of more precise knowledge of cancer latency, for solid tumours a latency of up to 50 years and at least 10 years has been assumed for all types of the cancer. Therefore it is assumed that exposure at any time between 1956 and 1995 (the Risk Exposure Period, REP) can result in a cancer being recorded in 2004 as a registration or in 2005 as an underlying cause of death. Although strictly speaking the REP for cancer registrations recorded in 2004, the year for which estimation has been carried out, would be 1955-1994, for simplification the years 1956 to 1995 have also been used, as for deaths, as the proportion exposed will not be affected. For an independent estimate of the proportion of the population exposed, numbers of workers ever exposed during this period are estimated by extrapolating from a point estimate of exposed workers taken from the period. If this is from CAREX relating to 1990-93, an adjustment is made to take account of gross changes in employment levels which have occurred particularly in manufacturing industry and the service sector across the REP. Otherwise a point estimate that represents numbers employed as close as possible to about 35 years before the target year of 2005 is used, as this is thought to represent a ’peak’ latency for the solid tumours, and is also close to the mid-point of the REP for estimating numbers ever exposed across the period (for which a linear change in employment levels is implicitly assumed). Where the Census of Employment is used, the point estimate data are for 1971. Where the LFS is used, the first year available and therefore used is 1979. A turnover factor is applied to estimate numbers ever exposed during the REP, determined mainly by the estimate of staff turnover per year during the period. For each exposure therefore, if an AF has been based on independent estimates of numbers exposed, the
13
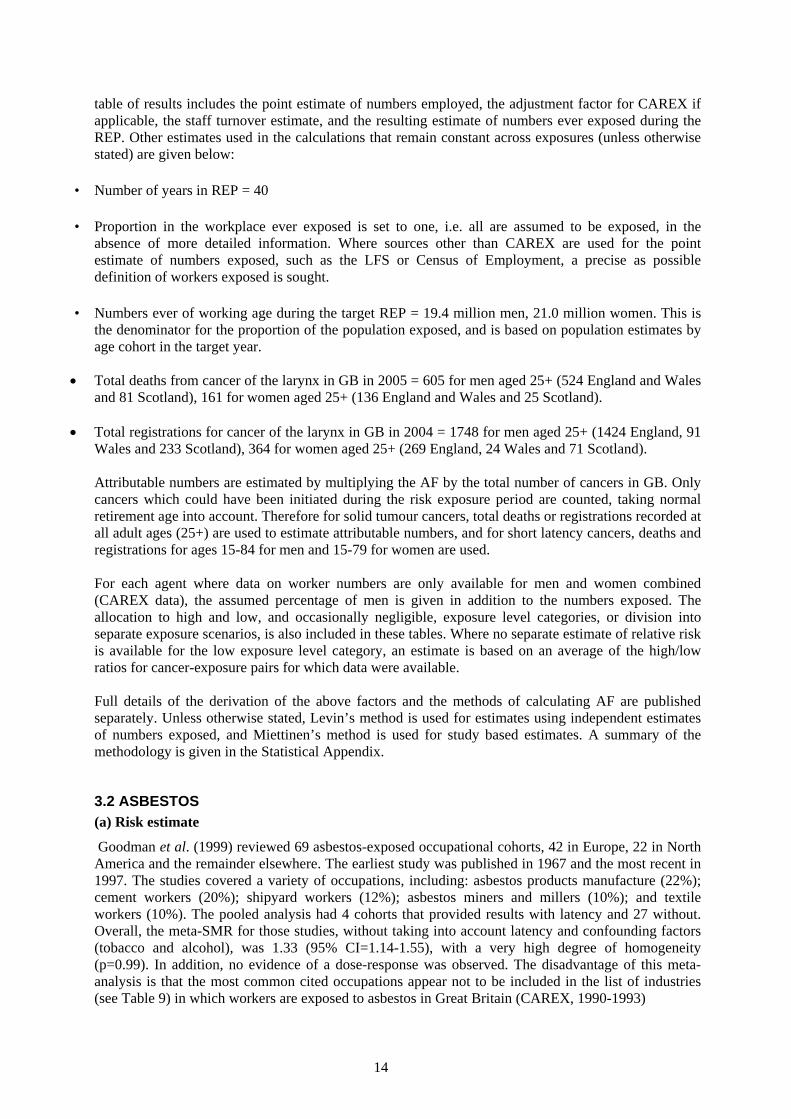
table of results includes the point estimate of numbers employed, the adjustment factor for CAREX if applicable, the staff turnover estimate, and the resulting estimate of numbers ever exposed during the REP. Other estimates used in the calculations that remain constant across exposures (unless otherwise stated) are given below:
• Number of years in REP = 40
• Proportion in the workplace ever exposed is set to one, i.e. all are assumed to be exposed, in the absence of more detailed information. Where sources other than CAREX are used for the point estimate of numbers exposed, such as the LFS or Census of Employment, a precise as possible definition of workers exposed is sought.
• Numbers ever of working age during the target REP = 19.4 million men, 21.0 million women. This is the denominator for the proportion of the population exposed, and is based on population estimates by age cohort in the target year.
• Total deaths from cancer of the larynx in GB in 2005 = 605 for men aged 25+ (524 England and Wales and 81 Scotland), 161 for women aged 25+ (136 England and Wales and 25 Scotland).
• Total registrations for cancer of the larynx in GB in 2004 = 1748 for men aged 25+ (1424 England, 91 Wales and 233 Scotland), 364 for women aged 25+ (269 England, 24 Wales and 71 Scotland). Attributable numbers are estimated by multiplying the AF by the total number of cancers in GB. Only cancers which could have been initiated during the risk exposure period are counted, taking normal retirement age into account. Therefore for solid tumour cancers, total deaths or registrations recorded at all adult ages (25+) are used to estimate attributable numbers, and for short latency cancers, deaths and registrations for ages 15-84 for men and 15-79 for women are used. For each agent where data on worker numbers are only available for men and women combined (CAREX data), the assumed percentage of men is given in addition to the numbers exposed. The allocation to high and low, and occasionally negligible, exposure level categories, or division into separate exposure scenarios, is also included in these tables. Where no separate estimate of relative risk is available for the low exposure level category, an estimate is based on an average of the high/low ratios for cancer-exposure pairs for which data were available. Full details of the derivation of the above factors and the methods of calculating AF are published separately. Unless otherwise stated, Levin’s method is used for estimates using independent estimates of numbers exposed, and Miettinen’s method is used for study based estimates. A summary of the methodology is given in the Statistical Appendix.
3.2 ASBESTOS (a) Risk estimate
Goodman et al. (1999) reviewed 69 asbestos-exposed occupational cohorts, 42 in Europe, 22 in North America and the remainder elsewhere. The earliest study was published in 1967 and the most recent in 1997. The studies covered a variety of occupations, including: asbestos products manufacture (22%); cement workers (20%); shipyard workers (12%); asbestos miners and millers (10%); and textile workers (10%). The pooled analysis had 4 cohorts that provided results with latency and 27 without. Overall, the meta-SMR for those studies, without taking into account latency and confounding factors (tobacco and alcohol), was 1.33 (95% CI=1.14-1.55), with a very high degree of homogeneity (p=0.99). In addition, no evidence of a dose-response was observed. The disadvantage of this meta-analysis is that the most common cited occupations appear not to be included in the list of industries (see Table 9) in which workers are exposed to asbestos in Great Britain (CAREX, 1990-1993)
14
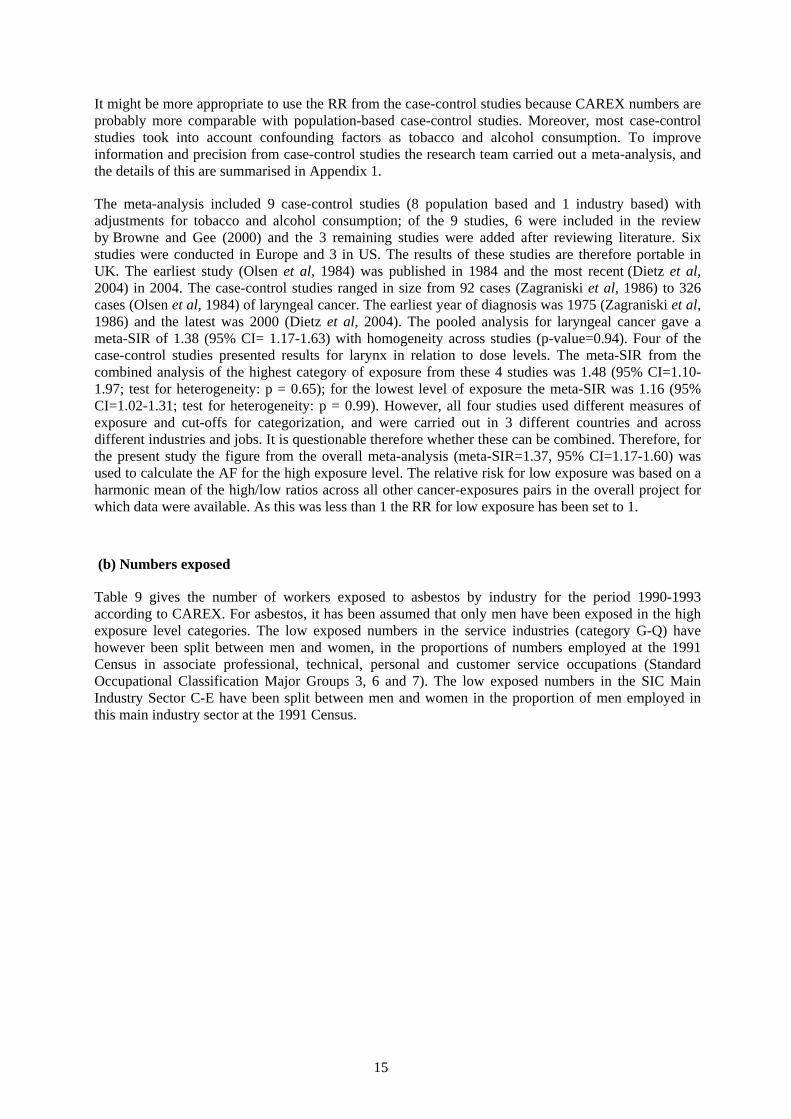
It might be more appropriate to use the RR from the case-control studies because CAREX numbers are probably more comparable with population-based case-control studies. Moreover, most case-control studies took into account confounding factors as tobacco and alcohol consumption. To improve information and precision from case-control studies the research team carried out a meta-analysis, and the details of this are summarised in Appendix 1.
The meta-analysis included 9 case-control studies (8 population based and 1 industry based) with adjustments for tobacco and alcohol consumption; of the 9 studies, 6 were included in the review by Browne and Gee (2000) and the 3 remaining studies were added after reviewing literature. Six studies were conducted in Europe and 3 in US. The results of these studies are therefore portable in UK. The earliest study (Olsen et al, 1984) was published in 1984 and the most recent (Dietz et al, 2004) in 2004. The case-control studies ranged in size from 92 cases (Zagraniski et al, 1986) to 326 cases (Olsen et al, 1984) of laryngeal cancer. The earliest year of diagnosis was 1975 (Zagraniski et al, 1986) and the latest was 2000 (Dietz et al, 2004). The pooled analysis for laryngeal cancer gave a meta-SIR of 1.38 (95% CI= 1.17-1.63) with homogeneity across studies (p-value=0.94). Four of the case-control studies presented results for larynx in relation to dose levels. The meta-SIR from the combined analysis of the highest category of exposure from these 4 studies was 1.48 (95% CI=1.10-1.97; test for heterogeneity: p = 0.65); for the lowest level of exposure the meta-SIR was 1.16 (95% CI=1.02-1.31; test for heterogeneity: p = 0.99). However, all four studies used different measures of exposure and cut-offs for categorization, and were carried out in 3 different countries and across different industries and jobs. It is questionable therefore whether these can be combined. Therefore, for the present study the figure from the overall meta-analysis (meta-SIR=1.37, 95% CI=1.17-1.60) was used to calculate the AF for the high exposure level. The relative risk for low exposure was based on a harmonic mean of the high/low ratios across all other cancer-exposures pairs in the overall project for which data were available. As this was less than 1 the RR for low exposure has been set to 1.
(b) Numbers exposed
Table 9 gives the number of workers exposed to asbestos by industry for the period 1990-1993 according to CAREX. For asbestos, it has been assumed that only men have been exposed in the high exposure level categories. The low exposed numbers in the service industries (category G-Q) have however been split between men and women, in the proportions of numbers employed at the 1991 Census in associate professional, technical, personal and customer service occupations (Standard Occupational Classification Major Groups 3, 6 and 7). The low exposed numbers in the SIC Main Industry Sector C-E have been split between men and women in the proportion of men employed in this main industry sector at the 1991 Census.
15

Table 9 Number of workers exposed to asbestos according to CAREX in 1990-1993, Great Britain
Carex Data 1990-1993 Main industry
sector Industry Number exposed
Number in industry
Exposure level
Other Mining 14,075 28,150 L Manufacture of paper and paper products 577 119,050 H Manufacture of industrial chemicals 1,006 130,000 H Manufacture of other chemical products 1,077 175,175 H Petroleum refineries 588 18,075 H Manufacture of transport equipment 1,792 456,900 H
C-E
Electricity, gas and steam 304 140,975 H F Construction 46,096 1,753,450 H
Wholesale and retail trade and restaurants and hotels 4,046 4,459,525 L Land transport 2,660 671,050 H Sanitary and similar services 824 274,225 L
G-Q
Personal and household services 22,066 686,750 L Total 95,111 8,913,325
Main industry sector % Male
A-B Agriculture, hunting and forestry; fishing
High Low
0 0
C-E Mining/quarrying, electricity/gas/steam, manufacturing industry
High Low
5,34414,075
100% 71%
F Construction
High Low
46,0960
100%
G-Q Service industries
High Low
2,66026,936
100% 38%
(c) AF calculation: The estimated total (male and female) attributable fraction for cancer of the larynx associated with exposure to asbestos is 0.37% (95%Confidence Interval (CI)=0.17-0.60), which equates to 3 (95%CI=1-5) deaths and 8 (95%CI=4-13) registrations. The estimated AF for men is 0.47% (95%CI=0.22-0.76) resulting in 3 (95%CI=1-5) attributable deaths and 8 (95%CI=4-13) attributable registrations; and for women the AF is 0% resulting in 0 attributable deaths and 0 attributable registrations (Table 12).
16
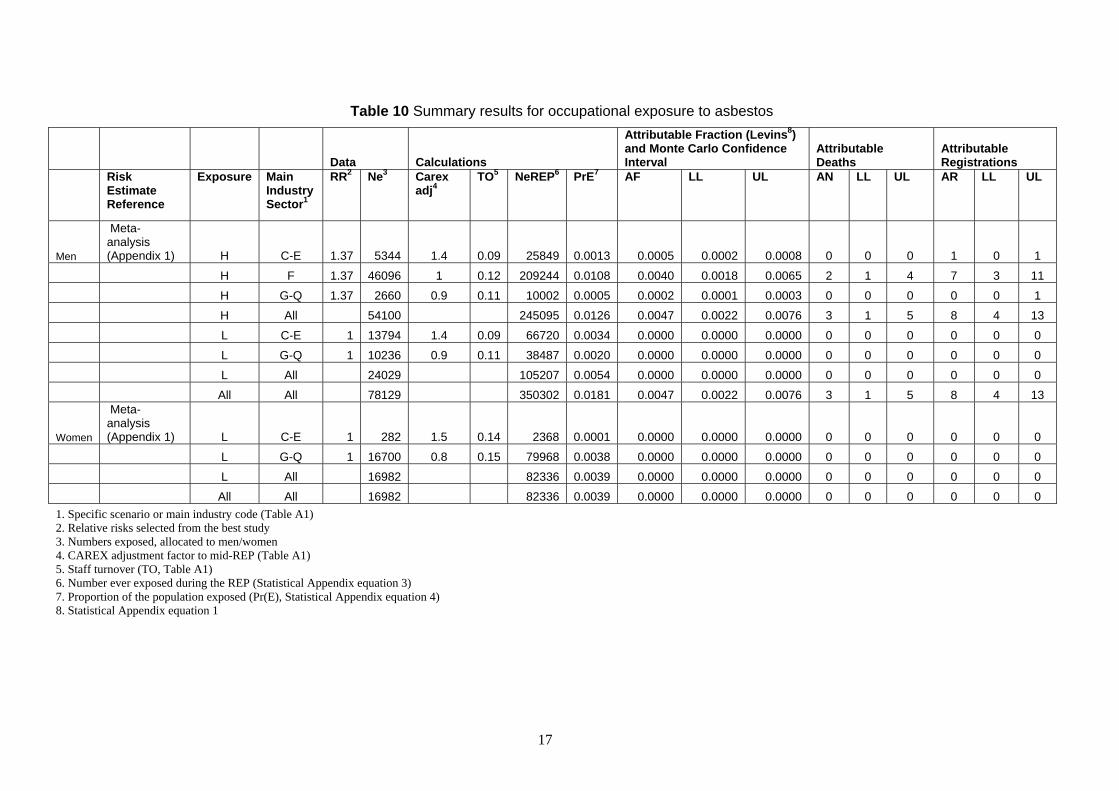
Table 10 Summary results for occupational exposure to asbestos
Data Calculations
Attributable Fraction (Levins8) and Monte Carlo Confidence Interval
Attributable Deaths
Attributable Registrations
Risk Estimate Reference
Exposure Main Industry Sector1
RR2 Ne3 Carex adj4
TO5 NeREP6 PrE7 AF LL UL AN LL UL AR LL UL
Men
Meta-analysis (Appendix 1) H C-E 1.37 5344 1.4 0.09 25849 0.0013 0.0005 0.0002 0.0008 0 0 0 1 0 1
H F 1.37 46096 1 0.12 209244 0.0108 0.0040 0.0018 0.0065 2 1 4 7 3 11
H G-Q 1.37 2660 0.9 0.11 10002 0.0005 0.0002 0.0001 0.0003 0 0 0 0 0 1
H All 54100 245095 0.0126 0.0047 0.0022 0.0076 3 1 5 8 4 13
L C-E 1 13794 1.4 0.09 66720 0.0034 0.0000 0.0000 0.0000 0 0 0 0 0 0
L G-Q 1 10236 0.9 0.11 38487 0.0020 0.0000 0.0000 0.0000 0 0 0 0 0 0
L All 24029 105207 0.0054 0.0000 0.0000 0.0000 0 0 0 0 0 0
All All 78129 350302 0.0181 0.0047 0.0022 0.0076 3 1 5 8 4 13
Women
Meta-analysis (Appendix 1) L C-E 1 282 1.5 0.14 2368 0.0001 0.0000 0.0000 0.0000 0 0 0 0 0 0
L G-Q 1 16700 0.8 0.15 79968 0.0038 0.0000 0.0000 0.0000 0 0 0 0 0 0
L All 16982 82336 0.0039 0.0000 0.0000 0.0000 0 0 0 0 0 0
All All 16982 82336 0.0039 0.0000 0.0000 0.0000 0 0 0 0 0 0 1. Specific scenario or main industry code (Table A1) 2. Relative risks selected from the best study 3. Numbers exposed, allocated to men/women 4. CAREX adjustment factor to mid-REP (Table A1) 5. Staff turnover (TO, Table A1) 6. Number ever exposed during the REP (Statistical Appendix equation 3) 7. Proportion of the population exposed (Pr(E), Statistical Appendix equation 4) 8. Statistical Appendix equation 1
17

3.3 MUSTARD GAS (a) Risk estimate A strong association was found between laryngeal cancer and exposure to mustard gas in three studies. However, subjects were workers employed in manufactures before the Second World War, period where mustard gas was still produced and used. (b) Numbers exposed According to CAREX, only 213 workers were exposed to mustard gas for the period 1990-1993. This number exposed in the GB over the risk exposure period is therefore very small. (c) AF calculation The AF calculation is therefore omitted. 3.4 STRONG INORGANIC-ACID MISTS CONTAINING SULFURIC ACID (a) Risk estimate An industry-based case-control study in US (Soskolne et al, 1984)) and a cohort study of US male workers in pickling operations in the steel industry (Steenland et al, 1988)) found an excess of laryngeal cancer, even after adjusting for smoking and alcohol. These two studies were based on specific workers (chemical workers and metal treatment), with very high exposure level to sulfuric acid that does not represent all workers exposed to strong inorganic-acid mists. Brown et al. (1988) did not find any association with exposure to sulfuric acid (RR=0.76, 95% CI=0.42-1.35); with adjustment for smoking and alcohol, estimations were the same or increased. Shangina et al. (2006) evaluated many exposures and were not able to separate out risk for sulfuric acid; moreover, this study was conducted in four countries in Eastern Europe and the main results were found only in Poland then exposures could not be portable in Great Britain. Soskolne et al. (1992) conducted a population-based case-control study in Canada, including 183 male laryngeal cases diagnosed between 1977 and 1979, and 183 male controls. Although it is based on the general population, exposure assessment was excellent. From the questionnaires, each work experience was extracted (including period, occupation, job title and employer) and a retrospective assessment of exposure to sulfuric acid for each job held by all the study subjects (blind of case or control status). No measurements were carried out for this study; however, discussions with various local hygiene and engineering experts were carried out to assist authors to assess the specificity of the local situation. The estimates reported by Soskolne et al. (1992) were adjusted for both alcohol and tobacco consumption. The exposure distribution of all of the study subjects is as following: 133 male cases and 94 male controls were exposed to sulfuric acid; among the exposed cases, 60 were classified with a low exposure level and 73 with a high exposure level. The study-based estimate of the proportion of exposed male cases was 73%; for exposed male controls, this proportion was estimated at 51%. The study was restricted to the men, then the proportions were not calculated for the women. A strong association was found with exposure to sulfuric acid (OR=2.90, 95% CI=1.62-5.20), with a dose-response relationship (low exposure: OR=1.91, 95% CI=0.97-3.78; high exposure: OR=4.28, 95% CI=2.13-8.58); this one was stronger for duration of exposure above 10 years (low exposure: OR=2.23, 95% CI=1.07-4.64; high exposure: OR=5.24, 95% CI=2.48-11.10) and after a lag period of 5 years. In the present study, figures from the dose-response relationship and without lag period were chosen for the RRs; for low exposure: OR=1.91, 95% CI=0.97-3.78; for high exposure: OR=4.28, 95% CI=2.13-8.58. (b) Number exposed The numbers of workers exposed to strong inorganic-acid mists containing sulfuric acid, according to CAREX and for the period 1990-1993, are given in Table 11. For this agent, the exposed numbers have been divided between men and women on the assumption that the CAREX exposed numbers were “blue-collar” workers (SOC Major Groups 5, 8 and 9) with low exposure level in the service industries
18

(SIC Major Industry Sector G-Q). It has also been assumed that workers in the SIC Major Industry Sector C-E were only exposed at high exposure level.
Table 11: Numbers of workers exposed to strong inorganic-acid mists containing sulfuric acid according to CAREX in 1990-1993
CAREX Data 1990-1993 Exposure
level Main industry sector Industry
Number exposed
Number in industry
C-E Crude Petroleum and Natural Gas Production 1,429 53,300 L Manufacture of leather and products of leather or of its 760 16,825 H Manufacture of paper and paper products 2,994 119,050 H Manufacture of industrial chemicals 5,186 130,000 H Manufacture of other chemical products 6,200 175,175 H Manufacture of pottery, china and earthenware 14 54,450 L Iron and steel basic industries 2,378 48,425 H Non-ferrous metal basic industries 4,293 79,325 H
Manufacture of fabricated metal products, except machinery and equipment 5,502 292,200 H
Manufacture of machinery except electrical 3,990 692,275 H
Manufacture of electrical machinery, apparatus, appliances and supplies 4,766 473,750 H
Manufacture of transport equipment 3,690 456,900 H G-Q Air transport 1,131 95,700 L
Total 42,333 2,687,375 Main industry sector , % Male A-B Agriculture, hunting and forestry; fishing
High
Low 0 0
C-E Mining/quarrying, electricity/gas/steam, manufacturing industry
High
Low 39,759 1,443
71% 71%
F Construction
High
Low 0 0
G-Q Service industries
High
Low 0
1,131
65%
(c) AF calculation
The estimated total (male & female) attributable fraction for cancer of the larynx associated with occupational exposure to strong inorganic acid mists is 2.13% (95%CI=0.77-4.76), which equates to 16 (95%CI=6-36) attributable deaths and 46 (95%CI=17-102) attributable registrations of laryngeal cancer. The estimated AF for men is 2.29% (95%CI=0.83-5.11) resulting in 14 (95%CI=5-31) attributable deaths and 40 (95%CI= 15-89) attributable registrations; and for women the AF is 1.52% (95% CI= 0.55-3.41) resulting in 2 (95%CI=1-5) attributable deaths and 6 attributable registrations (95%CI=2-12) (Table 12).
19

Table 12: Summary results for occupational exposure to strong inorganic-acid mists containing sulfuric acid
1. Specific scenario or main industry code – (Table A1) 2. Relative risks selected from the best study 3. Numbers exposed, allocated to men/women 4. CAREX adjustment factor to mid-REP (Table A1) 5. Staff turnover (TO, Table A1) 6. Number ever exposed during the REP (Statistical Appendix equation 3) 7. Proportion of the population exposed (Pr(E), Statistical Appendix equation 4) 8. Statistical Appendix equation 1
Data Calculations
Attributable Fraction (Levins8) and Monte Carlo Confidence Interval Attributable Deaths
Attributable Registrations
Risk Estimate Reference
Exposure Main Industry Sector1
RR2 Ne3 Carex adj4
TO5 NeREP6 PrE7 AF LL UL AN LL UL AR LL UL
Men Soskolne et al. (1992) H C-E 4.28 28229 1.4 0.09 136545 0.0070 0.0226 0.0079 0.0507 14 5 31 39 14 89
H All 28229 136545 0.0070 0.0226 0.0079 0.0507 14 5 31 39 14 89
Soskolne et al. (1992) L C-E 1.91 1025 1.4 0.09 4956 0.0003 0.0002 0.0000 0.0007 0 0 0 0 0 1
L G-Q 1.91 735 0.9 0.11 2764 0.0001 0.0001 0.0000 0.0004 0 0 0 0 0 1
L All 1760 7720 0.0004 0.0004 0.0000 0.0011 0 0 1 1 0 2
All All 29989 144265 0.0074 0.0229 0.0083 0.0511 14 5 31 40 15 89
Women Soskolne et al. (1992) H C-E 4.28 11530 1.5 0.14 96999 0.0046 0.0149 0.0052 0.0339 2 1 5 5 2 12
H All 11530 96999 0.0046 0.0149 0.0052 0.0339 2 1 5 5 2 12
Soskolne et al. (1992) L C-E 1.91 418 1.5 0.14 3520 0.0002 0.0002 0.0000 0.0005 0 0 0 0 0 0
L G-Q 1.91 396 0.8 0.15 1895 0.0001 0.0001 0.0000 0.0002 0 0 0 0 0 0
L All 814 5416 0.0003 0.0002 0.0000 0.0007 0 0 0 0 0 0
All All 12344 102415 0.0049 0.0152 0.0055 0.0341 2 1 5 6 2 12
20

3.5 ISOPROPANOL MANUFACTURE, STRONG-ACID PROCESS (a) Risk estimate Only one suitable epidemiological study was identified to obtain a risk estimate: Teta et al. (1992) observed an excess of laryngeal cancer, but it was based on only two cases. (b) Number exposed The number of workers involved in the isopropanol manufacture by strong-acid process could not be identified for GB. (c) AF calculation The AF calculation is therefore omitted.
3.6 RUBBER INDUSTRY (a) Risk estimate Kogevinas et al. (1998) reviewed studies published after 1982, including 7 cohort studies in 6 countries that examined distinct populations of workers in the rubber industry, and 2 case-control studies that reported risks for employment in the rubber industry. Low or moderate excess risks were found in all seven studies reporting results on laryngeal cancer, although 95% CIs were wide. The highest risks were found for workers in Russia (Solionova & Smulevich (1993) and Poland (Szeszenia-Dabrowska et al, 1991). However, estimates were based on few numbers of cases and exposures did not seem to be portable in GB. A recent meta-analysis of the synthetic rubber-producing industry calculated a pooled estimate of 1.19 (95% CI=0.88-1.60) for mortality, with a high level of heterogeneity (p-value=0.01), and 1.39 (95% CI=0.75-2.59) for incidence (Alder et al, 2006). These figures were based on 13 and 3 studies for mortality and incidence, respectively. The goods produced were tyres only for 4 studies, other non- tyre products (manufacture of footwear, general rubber goods, and plastics) for 4 studies, and both for 5 studies. The 13 studies had been carried out in Europe (7, 54%), North America (5, 38%) and Russia (1, 8%), published during the time period 1976-2001. The study size range varied from 1,972 to 36,691 workers. The earliest follow-up period started in 1910 and the latest period ended in 1995. Mortality and cancer morbidity in workers employed in the rubber industry were investigated in UK through two cohorts (Dost et al, 2007, Sorahan et al, 1989, Straughan and Sorahan (2000). Sorahan et al, (1989) followed 36,691 male rubber workers from 13 factories during 1946-85. A weak excess mortality from laryngeal cancer (SMR=1.19, based on 33 observed cases) was found. A prospective cohort of 9,031 workers who began work at 42 rubber factories in the period 1982-1991 (Straughan and Sorahan, 2000) found an excess mortality for males for the period 1983-1998 (SMR=2.13, not significant, based on 1 observed case) from cancer of the larynx. A recent update, from 1983 to 2004 (Dost et al, 2007), showed a SMR of 1.03 (based on 1 observed case). The cohorts by Sorahan et al. (1989) and Straughan & Sorahan (2000) were included in the meta-analysis by Alder et al. (2006). SMRs provided by Straughan & Sorahan (2000) (and therefore Dost et al, 2007) were different from the meta-SMR; the findings should be treated with caution because they are related to a later period of exposure (average follow-up for males: 17.6 years). Both, the meta-SMR and SMR from Sorahan et al. (1989) were similar. Figures from the British cohort study were used to calculate the AF as this study was thought to be representative of workers throughout the UK rubber industry; the meta-analysis by Alder et al. (2006) included studies of the rubber industry from many different countries using several different processes and substances. Sorahan et al. (1989) conducted a mortality study in the British rubber industry during 1946-1985, including 36,691 male rubber workers. The latter were employed in any of the 13 factories in the period 1946-1960, for at least 12 months. Most of subjects were employed in the tyre factories in
21
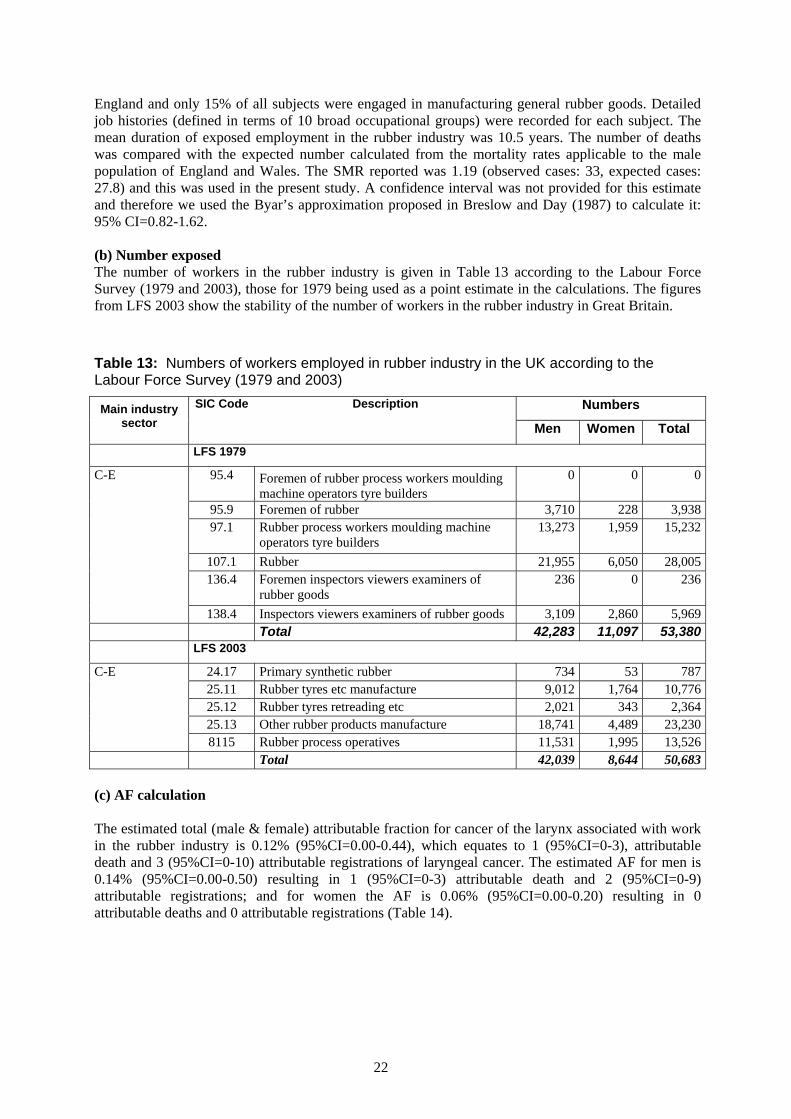
England and only 15% of all subjects were engaged in manufacturing general rubber goods. Detailed job histories (defined in terms of 10 broad occupational groups) were recorded for each subject. The mean duration of exposed employment in the rubber industry was 10.5 years. The number of deaths was compared with the expected number calculated from the mortality rates applicable to the male population of England and Wales. The SMR reported was 1.19 (observed cases: 33, expected cases: 27.8) and this was used in the present study. A confidence interval was not provided for this estimate and therefore we used the Byar’s approximation proposed in Breslow and Day (1987) to calculate it: 95% CI=0.82-1.62. (b) Number exposed The number of workers in the rubber industry is given in Table 13 according to the Labour Force Survey (1979 and 2003), those for 1979 being used as a point estimate in the calculations. The figures from LFS 2003 show the stability of the number of workers in the rubber industry in Great Britain.
Table 13: Numbers of workers employed in rubber industry in the UK according to the Labour Force Survey (1979 and 2003)
Numbers Main industry sector
SIC Code Description
Men Women Total
LFS 1979
C-E 95.4 Foremen of rubber process workers moulding machine operators tyre builders
0 0 0
95.9 Foremen of rubber 3,710 228 3,938 97.1 Rubber process workers moulding machine
operators tyre builders 13,273 1,959 15,232
107.1 Rubber 21,955 6,050 28,005 136.4 Foremen inspectors viewers examiners of
rubber goods 236 0 236
138.4 Inspectors viewers examiners of rubber goods 3,109 2,860 5,969 Total 42,283 11,097 53,380
LFS 2003
C-E 24.17 Primary synthetic rubber 734 53 787 25.11 Rubber tyres etc manufacture 9,012 1,764 10,776 25.12 Rubber tyres retreading etc 2,021 343 2,364 25.13 Other rubber products manufacture 18,741 4,489 23,230 8115 Rubber process operatives 11,531 1,995 13,526 Total 42,039 8,644 50,683 (c) AF calculation The estimated total (male & female) attributable fraction for cancer of the larynx associated with work in the rubber industry is 0.12% (95%CI=0.00-0.44), which equates to 1 (95%CI=0-3), attributable death and 3 (95%CI=0-10) attributable registrations of laryngeal cancer. The estimated AF for men is 0.14% (95%CI=0.00-0.50) resulting in 1 (95%CI=0-3) attributable death and 2 (95%CI=0-9) attributable registrations; and for women the AF is 0.06% (95%CI=0.00-0.20) resulting in 0 attributable deaths and 0 attributable registrations (Table 14).
22
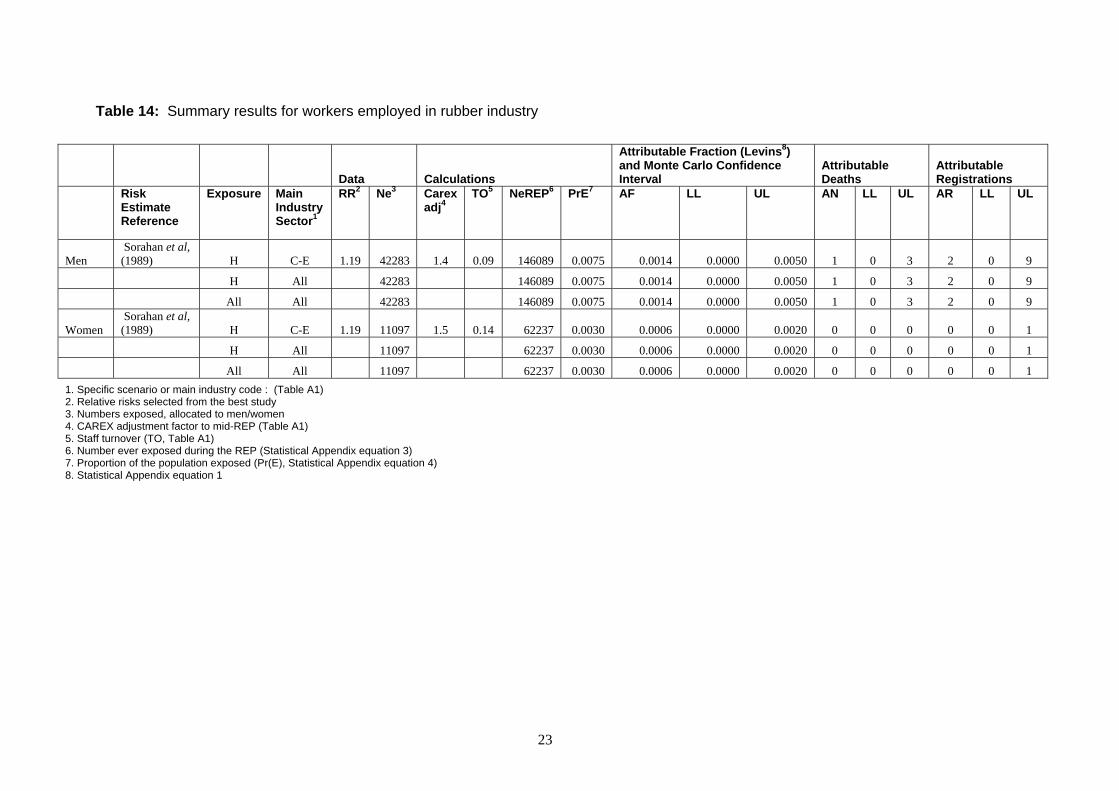
Table 14: Summary results for workers employed in rubber industry
Data Calculations
Attributable Fraction (Levins8) and Monte Carlo Confidence Interval
Attributable Deaths
Attributable Registrations
Risk Estimate Reference
Exposure Main Industry Sector1
RR2 Ne3 Carex adj4
TO5 NeREP6 PrE7 AF LL UL AN LL UL AR LL UL
Men Sorahan et al, (1989) H C-E 1.19 42283 1.4 0.09 146089 0.0075 0.0014 0.0000 0.0050 1 0 3 2 0 9
H All 42283 146089 0.0075 0.0014 0.0000 0.0050 1 0 3 2 0 9
All All 42283 146089 0.0075 0.0014 0.0000 0.0050 1 0 3 2 0 9
Women Sorahan et al, (1989) H C-E 1.19 11097 1.5 0.14 62237 0.0030 0.0006 0.0000 0.0020 0 0 0 0 0 1
H All 11097 62237 0.0030 0.0006 0.0000 0.0020 0 0 0 0 0 1
All All 11097 62237 0.0030 0.0006 0.0000 0.0020 0 0 0 0 0 1 1. Specific scenario or main industry code : (Table A1) 2. Relative risks selected from the best study 3. Numbers exposed, allocated to men/women 4. CAREX adjustment factor to mid-REP (Table A1) 5. Staff turnover (TO, Table A1) 6. Number ever exposed during the REP (Statistical Appendix equation 3) 7. Proportion of the population exposed (Pr(E), Statistical Appendix equation 4) 8. Statistical Appendix equation 1
23
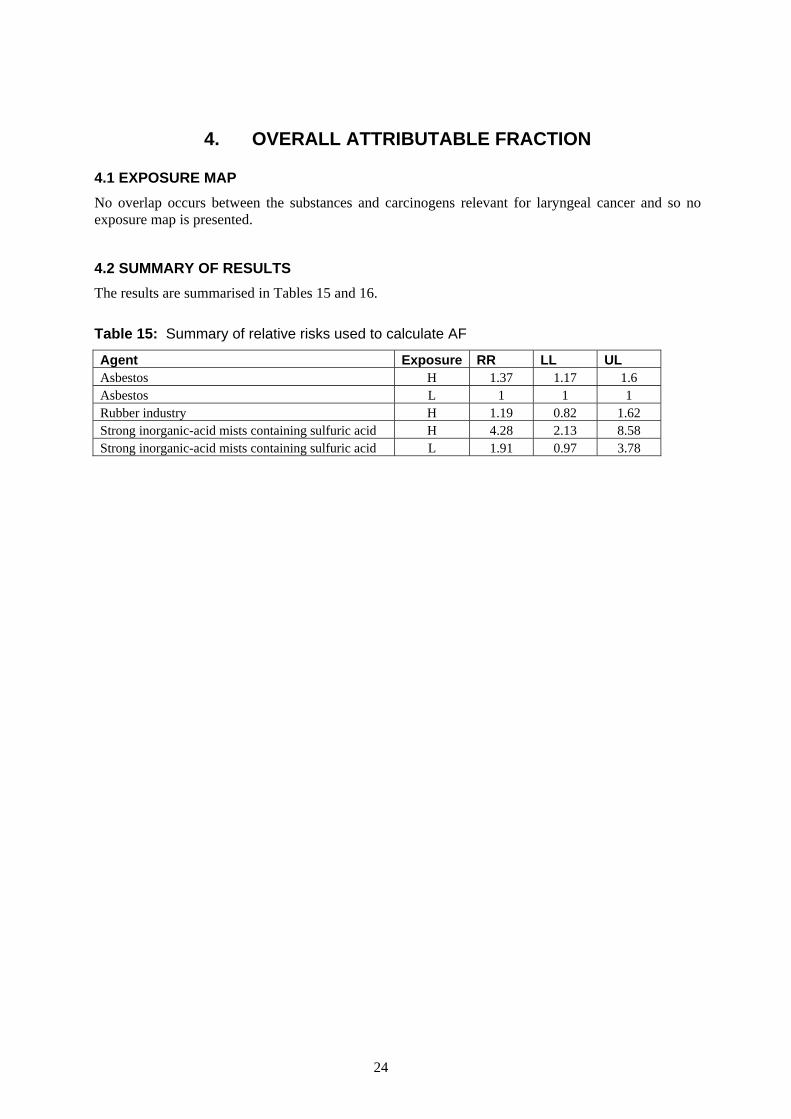
4. OVERALL ATTRIBUTABLE FRACTION
4.1 EXPOSURE MAP No overlap occurs between the substances and carcinogens relevant for laryngeal cancer and so no exposure map is presented.
4.2 SUMMARY OF RESULTS The results are summarised in Tables 15 and 16.
Table 15: Summary of relative risks used to calculate AF
Agent Exposure RR LL UL Asbestos H 1.37 1.17 1.6 Asbestos L 1 1 1 Rubber industry H 1.19 0.82 1.62 Strong inorganic-acid mists containing sulfuric acid H 4.28 2.13 8.58 Strong inorganic-acid mists containing sulfuric acid L 1.91 0.97 3.78
24

Table 16: Results Agent Numbers of
Men Ever Exposed
Numbers of Women
Ever Exposed
Proportion of Men Ever
Exposed
Proportion of Women
Ever Exposed
AF Men MCLL Men
MCUL Men
AF Women
MCLL Women
MCUL Women
Attributable Deaths (Men)
Attributable Deaths
(Women)
Attributable Registrations
(Men)
Attributable Registrations
(Women)
Asbestos 350302 82336 0.0181 0.0039 0.0047 0.0022 0.0076 0.0000 0.0000 0.0000 3 0 8 0
Rubber industry 146089 62237 0.0075 0.0030 0.0014 0.0000 0.0050 0.0006 0.0000 0.0020 1 0 2 0 Strong inorganic-acid mists containing sulphuric acid 144265 102415 0.0074 0.0049 0.0229 0.0083 0.0511 0.0152 0.0055 0.0341 14 2 40 6
Totals* 0.0288 0.0138 0.0569 0.0157 0.0060 0.0348 17 3 50 6
*Totals are the product sums and are not therefore equal to the sums of the separate estimates of attributable fraction, deaths and registrations for each agent. The difference is especially notable where the constituent AFs are large.
25
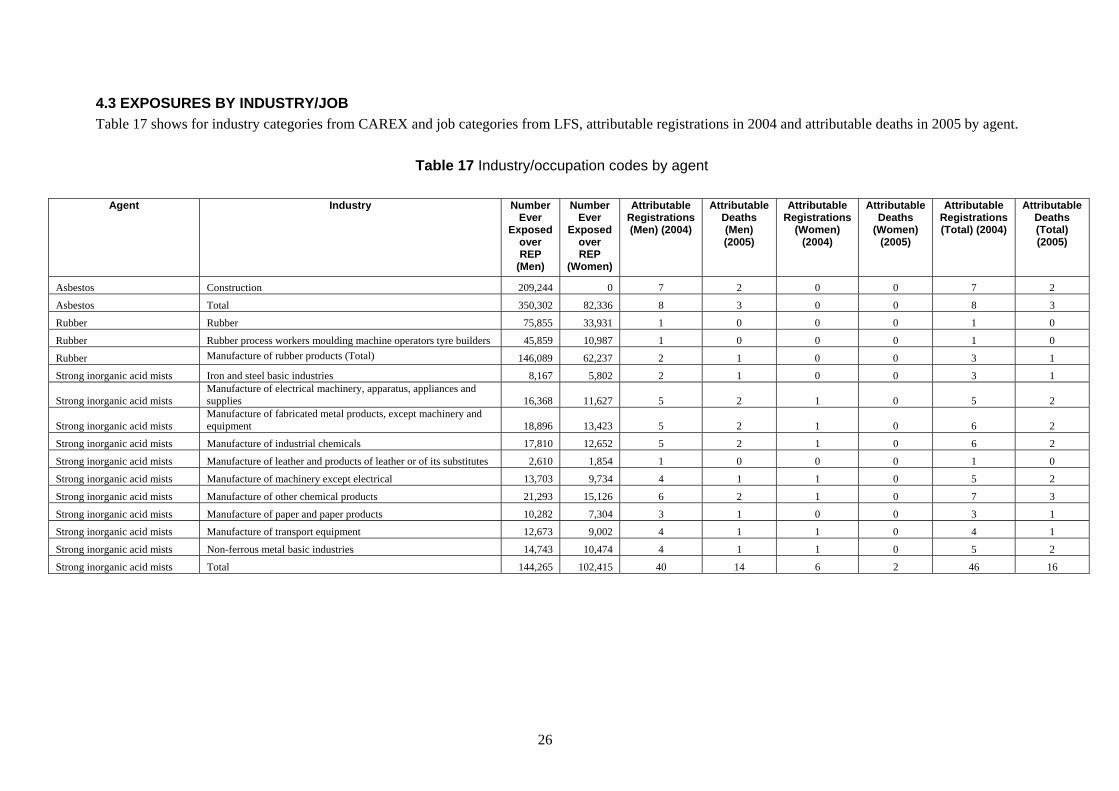
4.3 EXPOSURES BY INDUSTRY/JOB Table 17 shows for industry categories from CAREX and job categories from LFS, attributable registrations in 2004 and attributable deaths in 2005 by agent.
Table 17 Industry/occupation codes by agent
Agent Industry Number
Ever Exposed
over REP
(Men)
Number Ever
Exposed over REP
(Women)
Attributable Registrations (Men) (2004)
Attributable Deaths (Men) (2005)
Attributable Registrations
(Women) (2004)
Attributable Deaths
(Women) (2005)
Attributable Registrations (Total) (2004)
Attributable Deaths (Total) (2005)
Asbestos Construction 209,244 0 7 2 0 0 7 2
Asbestos Total 350,302 82,336 8 3 0 0 8 3
Rubber Rubber 75,855 33,931 1 0 0 0 1 0
Rubber Rubber process workers moulding machine operators tyre builders 45,859 10,987 1 0 0 0 1 0
Rubber Manufacture of rubber products (Total) 146,089 62,237 2 1 0 0 3 1
Strong inorganic acid mists Iron and steel basic industries 8,167 5,802 2 1 0 0 3 1
Strong inorganic acid mists Manufacture of electrical machinery, apparatus, appliances and supplies 16,368 11,627 5 2 1 0 5 2
Strong inorganic acid mists Manufacture of fabricated metal products, except machinery and equipment 18,896 13,423 5 2 1 0 6 2
Strong inorganic acid mists Manufacture of industrial chemicals 17,810 12,652 5 2 1 0 6 2
Strong inorganic acid mists Manufacture of leather and products of leather or of its substitutes 2,610 1,854 1 0 0 0 1 0
Strong inorganic acid mists Manufacture of machinery except electrical 13,703 9,734 4 1 1 0 5 2
Strong inorganic acid mists Manufacture of other chemical products 21,293 15,126 6 2 1 0 7 3
Strong inorganic acid mists Manufacture of paper and paper products 10,282 7,304 3 1 0 0 3 1
Strong inorganic acid mists Manufacture of transport equipment 12,673 9,002 4 1 1 0 4 1
Strong inorganic acid mists Non-ferrous metal basic industries 14,743 10,474 4 1 1 0 5 2
Strong inorganic acid mists Total 144,265 102,415 40 14 6 2 46 16
26

5. BIBLIOGRAPHY
Ahrens W, Jockel K H, Patzak W, Elsner, G (1991) Alcohol, smoking, and occupational factors in cancer of the larynx: a case-control study. American Journal of Industrial Medicine 20(4): 477-493
Alder N, Fenty J, Warren F, Sutton A J, Rushton L, Jones D R., Abrams K R (2006) Meta-analysis of mortality and cancer incidence among workers in the synthetic rubber-producing industry. American Journal of Epidemiology 164(5): 405-420
Altieri A, Bosetti C, Talamini R, Gallus S, Franceschi S, Levi F, Dal Maso L, Negri E, La Vecchia C (2002) Cessation of smoking and drinking and the risk of laryngeal cancer. British Journal of Cancer 87(11): 1227-1229
Altieri A, Garavello W, Bosetti C, Gallus S, La Vecchia C (2005) Alcohol consumption and risk of laryngeal cancer. Oral Oncology 41(10): 956-965
Bagnardi V, Blangiardo M, La Vecchia C, Corrao G (2001) A meta-analysis of alcohol drinking and cancer risk. British Journal of Cancer 85(11): 1700-1705
Bernardinelli L, de Marco R, Tinelli C (1987) Cancer mortality in an Italian rubber factory. British Journal of Industrial Medicine 44 (3): 187-191
Berrino F, Richiardi L, Boffetta P, Esteve J, Belletti I, Raymond L, Troschel L, Pisani P, Zubiri L, Ascunce N, Guberan E, Tuyns A, Terracini B, Merletti F, Milan JEM Working Group. (2003) Occupation and larynx and hypopharynx cancer: a job-exposure matrix approach in an international case-control study in France, Italy, Spain and Switzerland. Cancer Causes & Control : CCC 14(3): 213-223
Blair A, Kazerouni N (1997) Reactive chemicals and cancer. Cancer Causes & Control 8(3): 473-490
Blot WJ, Morris LE, Stroube R, Tagnon I, Fraumeni JF Jr (1980) Lung and laryngeal cancers in relation to shipyard employment in coastal Virginia. Journal of the National Cancer Institute 65(3): 571-575 Bray F, Sankila R, Ferlay J, Parkin DM (2002) Estimates of cancer incidence and mortality in Europe in 1995. European Journal of Cancer (Oxford, England : 1990) 38(1): 99-166 Breslow NE, Day NE (1987) Statistical Methods in Cancer Research, Vol. 2, The Design and Analysis of Cohort Studies (IARC Scientific Publications No. 82), Lyon, IARC Brown LM, Mason TJ, Pickle LW, Stewart PA, Buffler PA, Burau K, Ziegler RG, Fraumeni JF Jr (1988) Occupational risk factors for laryngeal cancer on the Texas Gulf Coast. Cancer Research 48 (7): 1960-1964
Browne K, Gee JB (2000) Asbestos exposure and laryngeal cancer. The Annals of Occupational Hygiene 44(4): 239-250
Calvert GM, Ward E, Schnorr TM, Fine LJ (1998) Cancer risks among workers exposed to metalworking fluids: a systematic review. American Journal of Industrial Medicine 33(3): 282-292 Cancer Research UK (2007) Cancer Research UK, available at: http://info.cancerresearchuk.org/ (accessed February 2008)
Coggon D (1999) Occupational cancer in the United Kingdom. Environmental Health Perspectives 107(Suppl 2): 239-244
27

Coggon D, Harris EC, Brown T, Rice T, Palmer KT (2009) Occupational mortality in England and Wales, 1991-2000. Office of Public Sector Information, London
De Stefani E, Boffetta P, Oreggia F, Ronco A, Kogevinas M, Mendilaharsu M (1998) Occupation and the risk of laryngeal cancer in Uruguay. American Journal of Industrial Medicine 33(6): 537-542
Dietz A, Ramroth H, Urban T, Ahrens W, Becher H (2004) Exposure to cement dust, related occupational groups and laryngeal cancer risk: results of a population based case-control study. International Journal of Cancer.Journal International Du Cancer 108(6): 907-911
Dost A, Straughan J, Sorahan T (2007) A cohort mortality and cancer incidence survey of recent entrants (1982-91) to the UK rubber industry: findings for 1983-2004. Occupational Medicine (Oxford, England) 57(3): 186-190 Drever F (ed.) (1995) Occupational Health Decennial Supplement. Series DS no. 10: The Registrar General's Decennial Supplement for England and Wales. HMSO, London. pp. 373
Easton DF, Peto J, Doll R (1988) Cancers of the respiratory tract in mustard gas workers. British Journal of Industrial Medicine 45(10): 652-659
Edelman DA (1989) Laryngeal cancer and occupational exposure to asbestos. International Archives of Occupational and Environmental Health 61(4): 223-227
Eisen EA, Tolbert PE, Hallock MF, Monson RR, Smith TJ, Woskie SR (1994) Mortality studies of machining fluid exposure in the automobile industry. III: A case-control study of larynx cancer. American Journal of Industrial Medicine 26(2): 185-202
Eisen EA, Tolbert PE, Monson RR, Smith TJ (1992) Mortality studies of machining fluid exposure in the automobile industry I: A standardized mortality ratio analysis. American Journal of Industrial Medicine 22(6): 809-824
Elci OC, Akpinar-Elci M, Blair A, Dosemeci M (2002) Occupational dust exposure and the risk of laryngeal cancer in Turkey. Scandinavian Journal of Work, Environment & Health 28(4) 278-284
Elwood JM, Pearson JC, Skippen DH, Jackson SM (1984) Alcohol, smoking, social and occupational factors in the aetiology of cancer of the oral cavity, pharynx and larynx. International Journal of Cancer 34(5): 603-612
Goodman M, Morgan RW, Ray R, Malloy CD, Zhao K (1999) Cancer in asbestos-exposed occupational cohorts: a meta-analysis. Cancer Causes & Control 10(5): 453-465
Griffiths H, Molony NC (2003) Does asbestos cause laryngeal cancer? Clinical Otolaryngology and Allied Sciences 28(3): 177-182
Gustavsson P, Jakobsson R, Johansson H, Lewin F, Norell S, Rutkvist LE (1998) Occupational exposures and squamous cell carcinoma of the oral cavity, pharynx, larynx, and oesophagus: a case-control study in Sweden. Occupational and Environmental Medicine 55(6): 393-400
IARC (1987) IARC Monographs on the Evaluation of the Carcinogenic Risks of Chemicals to Humans:Overall Evaluations of Carcinogenicity: An Updating of IARC Monographs Volumes 1 to 42. Supplement 7. International Agency for Research on Cancer, Lyon
IARC (1984) IARC Monographs on the Evaluation of the Carcinogenic Risks of Chemicals to Humans: Polynuclear Aromatic Compounds, Part 2: Carbon Blacks, Mineral Oils (Lubricant Base Oils and Derived Products) and Some Nitroarenes. Volume 33 International Agency for Research on
28

Cancer, Lyon
IARC (1982) IARC Monographs on the Evaluation of the Carcinogenic Risks of Chemicals to Humans: Some industrial chemicals and dyestuffs. Volume 29. International Agency for Research on Cancer, Lyon
IARC (2004) IARC Monographs on the Evaluation of the Carcinogenic Risks of Chemicals to Humans: Tobacco Smoke and Involuntary Smoking. Volume 83. International Agency for Research on Cancer, Lyon
IARC (1995) IARC Monographs on the Evaluation of the Carcinogenic Risks of Chemicals to Humans: Wood dust and Formaldehyde. Voulme 62. International Agency for Research on Cancer, Lyon
Imbernon E, Goldberg M, Bonenfant S, Chevalier A, Guenel P, Vatre R, Dehaye J (1995) Occupational respiratory cancer and exposure to asbestos: a case-control study in a cohort of workers in the electricity and gas industry. American Journal of Industrial Medicine 28(3): 339-352
Kogevinas M, Sala M, Boffetta P, Kazerouni N, Kromhout H, Hoar-Zahm S (1998) Cancer risk in the rubber industry: a review of the recent epidemiological evidence. Occupational and Environmental Medicine 55(1): 1-12
Manning KP, Skegg DC, Stell PM, Doll R (1981) Cancer of the larynx and other occupational hazards of mustard gas workers. Clinical Otolaryngology and Allied Sciences 6(3): 165-170
Marchand JL, Luce D, Leclerc A, Goldberg P, Orlowski E, Bugel I, Brugere J (2000) Laryngeal and hypopharyngeal cancer and occupational exposure to asbestos and man-made vitreous fibers: results of a case-control study. American Journal of Industrial Medicine 37(6): 581-589
Muscat JE, Stellman SD, Wynder EL (1995) Insulation, asbestos, smoking habits, and lung cancer cell types. American Journal of Industrial Medicine 27(2): 257-269
Muscat JE, Wynder EL (1992) Tobacco, alcohol, asbestos, and occupational risk factors for laryngeal cancer. Cancer 69(9): 2244-2251
Negri E, Piolatto G, Pira E, Decarli A, Kaldor J, La Vecchia C (1989) Cancer mortality in a northern Italian cohort of rubber workers. British Journal of Industrial Medicine 46(9): 624-628
Nishimoto Y, Yamakido M, Ishioka S, Shigenobu T, Yukutake M (1988) Epidemiologic studies of lung cancer in Japanase mustard gas workers. In: Miller, R. W. (ed.) Unusual Occurences as Clues to Cancer Etiology. Tokyo, Japan, Taylor and Francis, LTD 95-101 Olshan A (2006) Cancer of the larynx. In: Cancer Epidemiology andPrevention, Schottenfeld D, Fraumeni J (eds), 3rd ed, pp 627–637. Oxford University Press: New York
Olsen J, Sabroe S, Lajer M (1984) Welding and cancer of the larynx: a case-control study. European Journal of Cancer & Clinical Oncology 20(5): 639-643
ONS (2007a) Cancer Statistics: Registrations: http://www.statistics.gov.uk/statbase/Product.asp?vlnk=8843
ONS (2007b) Mortality statistics: Cause: http://www.statistics.gov.uk/statbase/Product.asp?vlnk=618
Parkin DM, Bray F, Ferlay J, Pisani P (2005) Global cancer statistics, 2002. CA: A Cancer Journal for Clinician 55(2): 74-108
29
Pelucchi C, Gallus S, Garavello W, Bosetti C, La Vecchia C (2006) Cancer risk associated with alcohol and tobacco use: focus on upper aero-digestive tract and liver. Alcohol Research & Health : The Journal of the National Institute on Alcohol Abuse and Alcoholism 29(3): 193-198
Pollan M, Lopez-Abente G (1995) Wood-related occupations and laryngeal cancer. Cancer Detection and Preventio, 19(3): 250-257
Purdue MP, Jarvholm B, Bergdahl IA, Hayes RB, Baris D (2006) Occupational exposures and head and neck cancers among Swedish construction workers. Scandinavian Journal of Work, Environment & Health 32(4): 270-275
Quinn MD, Wood H, Cooper N, Rowan S (2005) Cancer Atlas of the United Kingdom and Ireland 1991-2000. Series on Medical and Population Subjects No. 68, Office for National Statistics
Rafferty MA, Fenton JE, Jones AS (2001) The history, aetiology and epidemiology of laryngeal carcinoma. Clinical Otolaryngology and Allied Science 26(6): 442-446
Shangina O, Brennan P, Szeszenia-Dabrowska N, Mates D, Fabianova E, Fletcher T, t'Mannetje A, Boffetta P, Zaridze D (2006) Occupational exposure and laryngeal and hypopharyngeal cancer risk in central and eastern Europe. American Journal of Epidemiology 164(4): 367-375
Siemiatycki J, Richardson L, Straif K, Latreille B, Lakhani R, Campbell S, Rousseau MC, Boffetta P (2004) Listing occupational carcinogens. Environmental Health Perspectives 112(15): 1447-1459
Solionova LG, Smulevich VB (1993) Mortality and cancer incidence in a cohort of rubber workers in Moscow. Scandinavian Journal of Work, Environment & Health 19(2): 96-101
Sorahan T, Parkes HG, Veys CA, Waterhouse JA, Straughan JK, Nutt A (1989) Mortality in the British rubber industry 1946-85. British Journal of Industrial Medicine 46(1): 1-10
Soskolne CL, Jhangri GS, Siemiatycki J, Lakhani R, Dewar R., Burch JD, Howe GR, Miller AB (1992) Occupational exposure to sulfuric acid in southern Ontario, Canada, in association with laryngeal cancer. Scandinavian Journal of Work, Environment & Health 18(4): 225-232
Soskolne CL, Zeighami EA, Hanis NM, Kupper LL, Herrmann N, Amsel J, Mausner JS, Stellman JM (1984) Laryngeal cancer and occupational exposure to sulfuric acid. American Journal of Epidemiology 120(3): 358-369
Steenland K, Schnorr T, Beaumont J, Halperin W, Bloom, T (1988) Incidence of laryngeal cancer and exposure to acid mists. British Journal of Industrial Medicine 45(11): 766-776
Straughan JK, Sorahan T (2000) Cohort mortality and cancer incidence survey of recent entrants (1982-91) to the United Kingdom rubber industry: preliminary findings. Occupational and Environmental Medicine 57(8): 574-576
Szeszenia-Dabrowska N, Wilczynska U, Kaczmarek T, Szymczak W (1991) Cancer mortality among male workers in the Polish rubber industry. Polish Journal of Occupational Medicine and Environmental Health 4(2): 149-157
Teta MJ, Perlman GD, Ott MG (1992) Mortality study of ethanol and isopropanol production workers at two facilities. Scandinavian Journal of Work, Environment & Health 18(2): 90-96
Tolbert PE (1997) Oils and cancer. Cancer Causes & Control 8(3): 386-405
Tolbert PE, Eisen EA, Pothier LJ, Monson RR, Hallock MF, Smith TJ (1992) Mortality studies of machining-fluid exposure in the automobile industry. II. Risks associated with specific fluid types.
30

Scandinavian Journal of Work, Environment & Health 18(6): 351-360
Ward EM, Burnett CA, Ruder A, Davis-King K (1997) Industries and cancer. Cancer Causes & Control 8(3): 356-370
Weiland SK, Straif K, Chambless L, Werner B, Mundt KA, Bucher A, Birk T, Keil U (1998) Workplace risk factors for cancer in the German rubber industry: Part 1. Mortality from respiratory cancers. Occupational and Environmental Medicine 55(5): 317-324
Wight R, Paleri V, Arullendran P (2003) Current theories for the development of nonsmoking and nondrinking laryngeal carcinoma. Current Opinion in Otolaryngology & Head and Neck Surgery 11 (2): 73-77.
Wortley P, Vaughan TL, Davis S, Morgan MS, Thomas DB (1992) A case-control study of occupational risk factors for laryngeal cancer. British Journal of Industrial Medicine 49(12): 837-844
Zagraniski RT, Kelsey JL, Walter SD (1986) Occupational risk factors for laryngeal carcinoma: Connecticut, 1975-1980. American Journal of Epidemiology 124 (1): 67-76
31

6. STATISTICAL APPENDIX Formulae used in the estimation of AF Levin’s equation AF = Pr(E)*(RR-1)/{1+Pr(E)*(RR-1)} (1) where RR = relative risk, Pr(E) = proportion of the population exposed A common denominator is used across exposure levels and industries for each exposure Miettinen’s equation AF = Pr(E|D)*(RR-1)/RR (2) where Pr(E|D) = proportion of cases exposed (E = exposed, D = case) Turnover equation to estimate numbers ever employed during the REP
Ne(REP) = ∑ l(adj15)i * n0/(R-15)} =
=
bi
ai
+ ∑ {l(adj15)j *n0 * TO /(age(u)-age(l)+1)} (3) −=
=
))1()((
0
ageuagek
k∑
+=
+=
kdj
kcj
where Ne(REP) = numbers ever employed in the REP n0 = numbers employed in the exposed job/industry at a mid-point in the REP TO = staff turnover per year R = retirement age (65 for men, 60 for women) l(adj15)i = the proportion of survivors to age i of those alive at age 15 (from GB life tables) a to b = age range achieved by the original cohort members by the target year (2004) (e.g. 65 to 100 for the solid tumour REP) c to d = age range achieved by the turnover recruited cohort members by the target year (25 to 64 for the solid tumour REP) age(u) and age(l) = upper and lower recruitment age limits (24 and 15) The derivation and assumptions underlying this formula are described in the methodology technical report, available on the HSE website. The equation can be represented as a single factor acting as a multiplier for n0, calculated by setting n0 to 1 in the above equation, so that the factor varies only with TO see Table A1 below. Equation to estimate the proportion of the population exposed Pr(E) = Ne(REP) / Np(REP) (4) where Np(REP) = numbers ever of working age during the REP from population estimates for the relevant age cohorts in the target year Equation for combining AFs where exposed populations overlap but are independent and risk estimates are assumed to be multiplicative: AFoverall = 1- Πk(1-AFk) for the k exposures in the set (5)
32
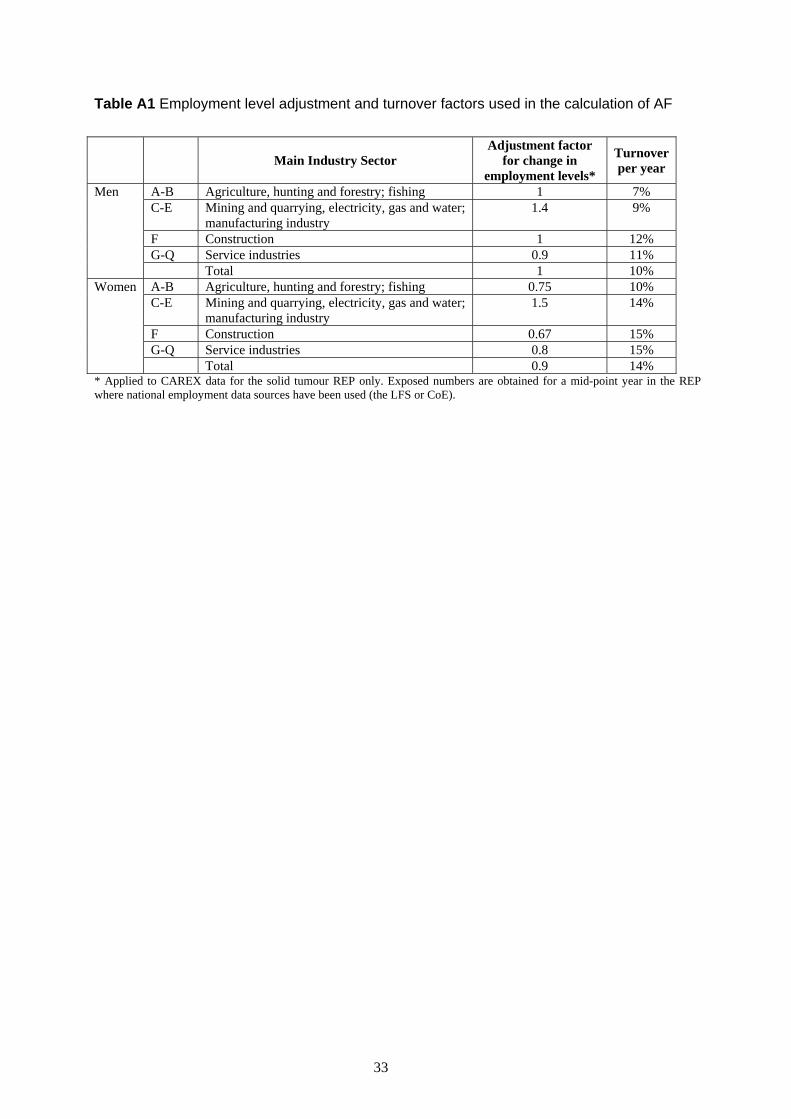
Table A1 Employment level adjustment and turnover factors used in the calculation of AF
Main Industry Sector
Adjustment factor for change in
employment levels*
Turnover per year
A-B Agriculture, hunting and forestry; fishing 1 7% C-E Mining and quarrying, electricity, gas and water;
manufacturing industry 1.4 9%
F Construction 1 12% G-Q Service industries 0.9 11%
Men
Total 1 10% A-B Agriculture, hunting and forestry; fishing 0.75 10% C-E Mining and quarrying, electricity, gas and water;
manufacturing industry 1.5 14%
F Construction 0.67 15% G-Q Service industries 0.8 15%
Women
Total 0.9 14% * Applied to CAREX data for the solid tumour REP only. Exposed numbers are obtained for a mid-point year in the REP where national employment data sources have been used (the LFS or CoE).
33
APPENDIX 1: META-ANALYSIS FOR ASBESTOS We identified 14 case-control studies that provide data on association between risk of laryngeal cancer and exposure to asbestos (or any employment in an occupation or industry where asbestos exposure was known to occur) and that control for tobacco and alcohol consumption: 7 were included in the review by Browne & Gee (2000) and 7 were added after reviewing literature. The details of the design aspects as well as the findings of those studies are summarized in Table 18.
The aim of this meta-analysis was to provide a meta-SIR associated to asbestos exposure that could be used for CAREX data. Five studies were excluded from this analysis for the following reasons: in Ahrens et al. (1991), the asbestos exposure assessment was only based on a self-reported exposure; Berrino et al. (2003) combined cancers of the larynx and the hypopharynx; the 3 other studies (De Stefani et al, 1998, Elci et al, 2002, Shangina et al, 2006) were conducted in countries where the exposure to asbestos does not seem portable in Great Britain. The characteristics of the 9 case-control studies included in the meta-analysis are as follows. Six studies were conducted in Europe and 3 in US. The earliest study (Olsen et al, 1984) was published in 1984 and the most recent (Dietz et al, 2004) in 2004. The earliest year of diagnosis was 1975 (Zagraniski et al, 1986) and the latest was 2000 (Dietz et al, 2004)). The studies involved between 92 cases (Zagraniski et al, 1986) to 326 cases (Olsen et al, 1984). Except for 3 studies, all subjects were male; among these 3 studies, two studies (Dietz et al, 2004), Olsen et al, 1984) gave only results for men. Wortley et al. (1992) present results only in relation to exposure level. However, no dose-response was observed; a pooled estimate of the RRs for the three exposure levels has been calculated for use in our meta-analysis giving an overall RR: meta-SIR=1.22, 95% CI=0.86-1.72; test for heterogeneity: p=0.91. Gustavsson et al. (1998) presented results for high or low exposure to asbestos (versus never exposed); the figure from the high exposure to asbestos was used for our meta-analysis. Among the 9 studies, four studies also gave risk estimates without adjustment for tobacco and alcohol consumption. In Dietz et al. (2004) and Muscat & Wynder (1992), the association between asbestos exposure and laryngeal cancer was weakened by controlling for other covariates; in Brown et al. (1988) and Olsen et al. (1984), the estimates were the same with or without adjustment for tobacco and alcohol consumption. Figure 1 provides the RR or OR estimates associated with reporting “any” exposure to asbestos in 9 case-control studies that compared subjects with any occupational exposure to those with no exposure to asbestos. The meta-analysis, combining 9 studies and using the inverse weighted variance method, found an RR of 1.37 (95% CI= 1.17-1.60) associated with any exposure to asbestos (test for heterogeneity: p=0.94). Four of the case-control studies (Gustavsson et al, 1998), Imbernon et al, 1995), Marchand et al, 2000), Wortley et al, 1992) presented results on the dose-response relationships. The meta-SIR from the combined analysis of the highest category of exposure from these 4 studies was 1.48 (95% CI=1.10-1.97; test for heterogeneity: p = 0.65); for the lowest level of exposure the meta-SIR was 1.16 (95% CI=1.02-1.31; test for heterogeneity: p = 0.99). However, all four studies used different measures of exposure and cut-offs for categorization. It is questionable therefore whether these can be combined. To assess the influence of each of the 9 studies a sensitivity analysis has been carried out by recalculating the meta-SIR and removing each study in turn. The results for the 9 combinations are presented in Figure 2. The association persisted with or without the inclusion of a study: the meta-SIRs vary from 1.33 (without the study 8) to 1.41 (without the study 5). In addition, a high degree of homogeneity is observed (from 0.90 to 0.96). The influence of removal of the five case-control studies without dose-response results has also been assessed. The association between risk of laryngeal cancer and exposure to asbestos is weakened (meta-SIR of the 14 studies =1.28, 95% CI=1.13-1.44) and the homogeneity across studies is smaller (p=0.62).
34

Figure 1: RR and 95% CI for the 9 case-control studies and the meta-SIR
Figure 2: Sensitivity analysis: meta-SIR and 95% CI for all 9 studies (red) and for all combinations of 8 studies (black). The p-value for the test of heterogeneity are given between brackets
35
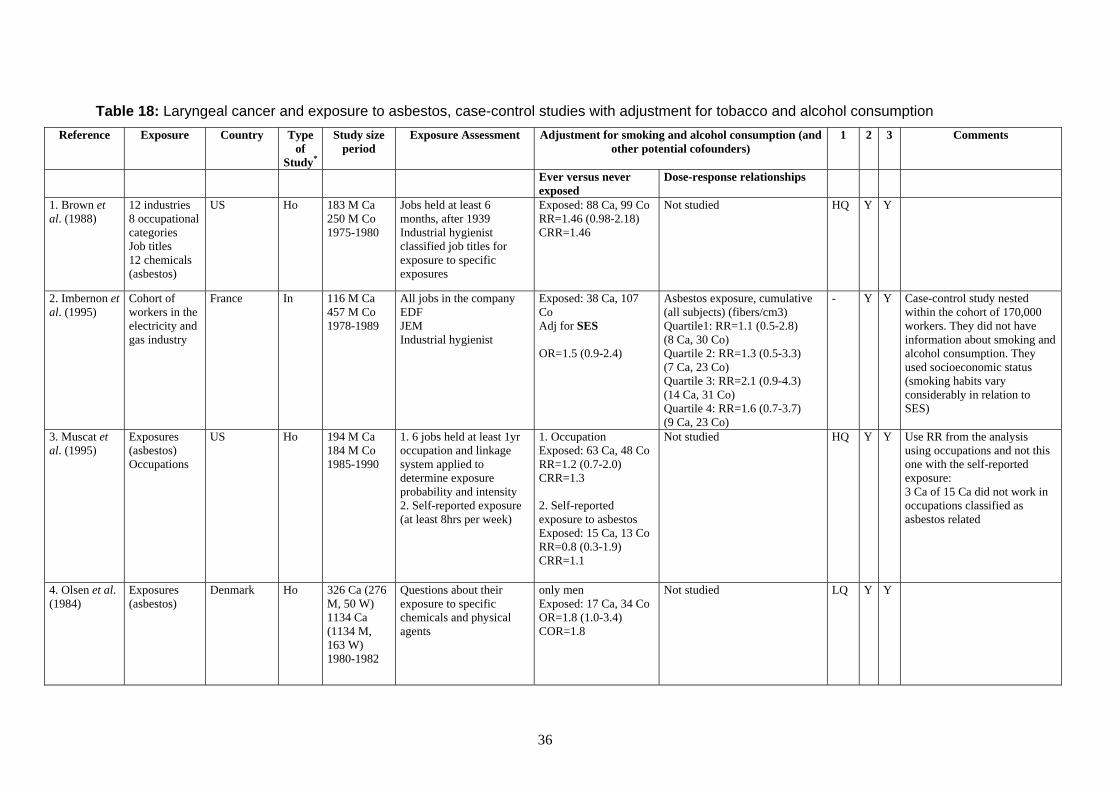
Table 18: Laryngeal cancer and exposure to asbestos, case-control studies with adjustment for tobacco and alcohol consumption Reference Exposure Country Type
of Study*
Study sizeperiod
Exposure Assessment Adjustment for smoking and alcohol consumption (and other potential cofounders)
1 2 3 Comments
Ever versus never exposed
Dose-response relationships
1. Brown et al. (1988)
12 industries 8 occupational categories Job titles 12 chemicals (asbestos)
US Ho 183 M Ca 250 M Co 1975-1980
Jobs held at least 6 months, after 1939 Industrial hygienist classified job titles for exposure to specific exposures
Exposed: 88 Ca, 99 Co RR=1.46 (0.98-2.18) CRR=1.46
Not studied HQ Y Y
2. Imbernon et al. (1995)
Cohort of workers in the electricity and gas industry
France In 116 M Ca 457 M Co 1978-1989
All jobs in the company EDF JEM Industrial hygienist
Exposed: 38 Ca, 107 Co Adj for SES OR=1.5 (0.9-2.4)
Asbestos exposure, cumulative (all subjects) (fibers/cm3) Quartile1: RR=1.1 (0.5-2.8) (8 Ca, 30 Co) Quartile 2: RR=1.3 (0.5-3.3) (7 Ca, 23 Co) Quartile 3: RR=2.1 (0.9-4.3) (14 Ca, 31 Co) Quartile 4: RR=1.6 (0.7-3.7) (9 Ca, 23 Co)
- Y Y Case-control study nested within the cohort of 170,000 workers. They did not have information about smoking and alcohol consumption. They used socioeconomic status (smoking habits vary considerably in relation to SES)
3. Muscat et al. (1995)
Exposures (asbestos) Occupations
US Ho 194 M Ca 184 M Co 1985-1990
1. 6 jobs held at least 1yr occupation and linkage system applied to determine exposure probability and intensity 2. Self-reported exposure (at least 8hrs per week)
1. Occupation Exposed: 63 Ca, 48 Co RR=1.2 (0.7-2.0) CRR=1.3 2. Self-reported exposure to asbestos Exposed: 15 Ca, 13 Co RR=0.8 (0.3-1.9) CRR=1.1
Not studied HQ Y Y Use RR from the analysis using occupations and not this one with the self-reported exposure: 3 Ca of 15 Ca did not work in occupations classified as asbestos related
4. Olsen et al. (1984)
Exposures (asbestos)
Denmark Ho 326 Ca (276 M, 50 W) 1134 Ca (1134 M, 163 W) 1980-1982
Questions about their exposure to specific chemicals and physical agents
only men Exposed: 17 Ca, 34 Co OR=1.8 (1.0-3.4) COR=1.8
Not studied LQ Y Y
36
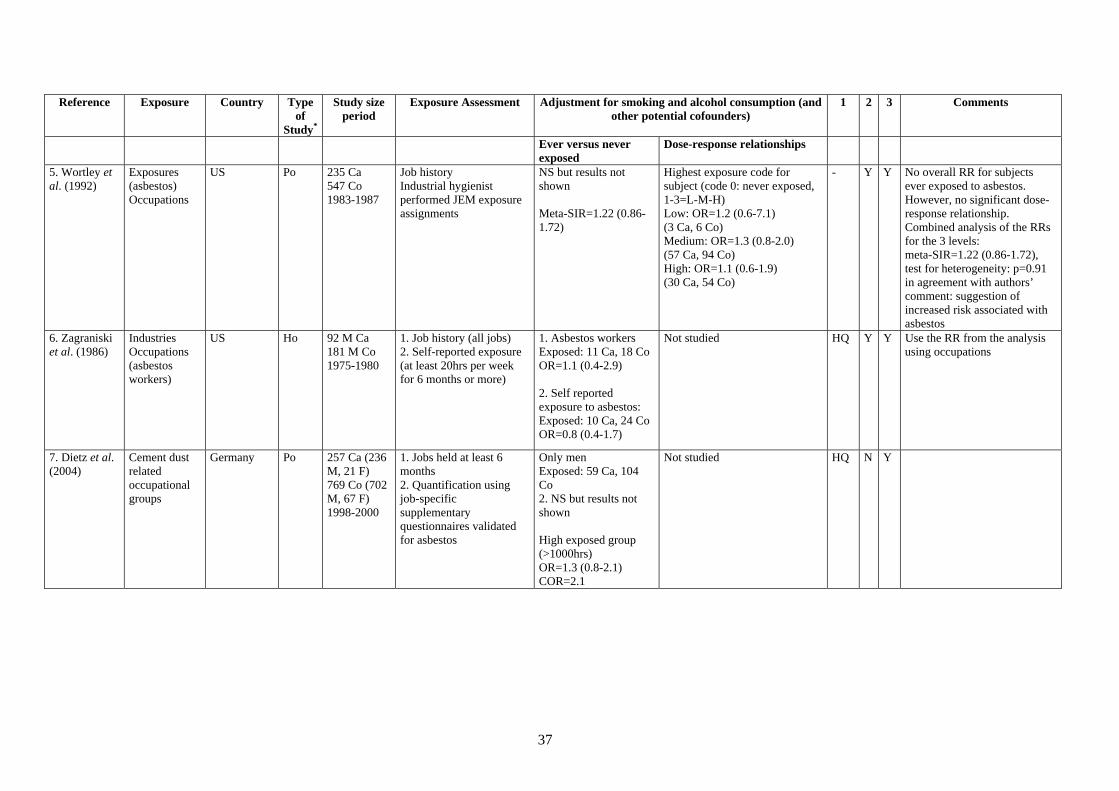
Reference Exposure Country Type of
Study*
Study sizeperiod
Exposure Assessment Adjustment for smoking and alcohol consumption (and other potential cofounders)
1 2 3 Comments
Ever versus never exposed
Dose-response relationships
5. Wortley et al. (1992)
Exposures (asbestos) Occupations
US Po 235 Ca 547 Co 1983-1987
Job history Industrial hygienist performed JEM exposure assignments
NS but results not shown Meta-SIR=1.22 (0.86-1.72)
Highest exposure code for subject (code 0: never exposed, 1-3=L-M-H) Low: OR=1.2 (0.6-7.1) (3 Ca, 6 Co) Medium: OR=1.3 (0.8-2.0) (57 Ca, 94 Co) High: OR=1.1 (0.6-1.9) (30 Ca, 54 Co)
- Y Y No overall RR for subjects ever exposed to asbestos. However, no significant dose-response relationship. Combined analysis of the RRs for the 3 levels: meta-SIR=1.22 (0.86-1.72), test for heterogeneity: p=0.91 in agreement with authors’ comment: suggestion of increased risk associated with asbestos
6. Zagraniski et al. (1986)
Industries Occupations (asbestos workers)
US Ho 92 M Ca 181 M Co 1975-1980
1. Job history (all jobs) 2. Self-reported exposure (at least 20hrs per week for 6 months or more)
1. Asbestos workers Exposed: 11 Ca, 18 Co OR=1.1 (0.4-2.9) 2. Self reported exposure to asbestos: Exposed: 10 Ca, 24 Co OR=0.8 (0.4-1.7)
Not studied HQ Y Y Use the RR from the analysis using occupations
7. Dietz et al. (2004)
Cement dust related occupational groups
Germany Po 257 Ca (236 M, 21 F) 769 Co (702 M, 67 F) 1998-2000
1. Jobs held at least 6 months 2. Quantification using job-specific supplementary questionnaires validated for asbestos
Only men Exposed: 59 Ca, 104 Co 2. NS but results not shown High exposed group (>1000hrs) OR=1.3 (0.8-2.1) COR=2.1
Not studied HQ N Y
37

Reference Exposure Country Type of
Study*
Study sizeperiod
Exposure Assessment Adjustment for smoking and alcohol consumption (and other potential cofounders)
1 2 3 Comments
Ever versus never exposed
Dose-response relationships
8. Gustavsson et al. (1998)
17 specific substances
Sweden Po 157 M Ca 641 M Co 1988-1990
Jobs held at least 1yr Occupational hygienist assigned exposure intensity Probability to 17 specific occupational exposures
1. > median of cumulative dose among exposed Co Exposed: 34 Ca RR high=1.69 (1.05-2.74) 2. < median of cumulative dose among exposed Co Exposed: 28 Ca RR low=1.21 (0.73-2.02)
Cumulative exposure distribution among exposed Co (exposure intensity*prob of exposure *duration of exposure)Quartile1: RR=1.16 (1.02-1.32) (13 Ca, 43 Co) Quartile 2: RR=1.35 (1.04-1.74) (15 Ca, 45 Co) Quartile 3: RR=1.56 (1.06, 2.30) (16 Ca, 44 Co) Quartile 4: RR=1.82 (1.08-3.04) (18 Ca, 45 Co)
- N Y No overall RR for subjects ever exposed to asbestos, only RR for subjects ever exposed to high/low level of asbestos Use the RR for high exposure to asbestos
9. Marchand et al. (2000)
Asbestos Man-made vitreous fibers
France Ho 296 M Ca 295 M Co 1989-1991
1. Job history (all jobs) 2. Job-exposure matrix (JEM): prob of exposure, concentration, frequency
Exposed: 216 Ca, 185 Co OR=1.24 (0.83-1.90)
Cumulative exposure distribution (exposure intensity*prob of exposure*duration of exposure)Low: OR=1.10 (0.66-1.82) (67 Ca, 67 Co) Intermediate: OR=1.20 (0.73-1.99) (72 Ca, 67 Co) High: OR=1.47 (0.87-2.46) (77 Ca, 51 Co)
HQ N Y
10. Ahrens et al. (1991)
21 industries 31 occupations Job titles 19 substances (asbestos)
Germany Ho 85 M Ca 100 M Co 1984-1986
Jobs held at least 6 monthsSelf-reported exposure
Self-reported exposure to asbestos Ca and Co exposed: 36 (19.5%) OR=1.1 (0.5-2.4) COR=1.2
Not studied LQ Y N Not included in the meta-analysis because only self-reported exposure
11. Berrino et al. (2003)
Job titles France Italy Spain Switzerland
Po 315 Ca (215 larynx) 819 Co 1979-1982
All jobs held for at least 1 year after 1944 JEM Industrial hygienists, occupational physicians (probability of exposures to specific agents)
Exposed: 215 Ca, 380 Co OR=1.6 (1.0–2.5)
Not studied - N N Not included in the meta-analysis because combined analysis with 100 Ca of hypopharyngeal cancer (ICD-10 C13)
38

Reference Exposure Country Type of
Study*
Study sizeperiod
Exposure Assessment Adjustment for smoking and alcohol consumption (and other potential cofounders)
1 2 3 Comments
Ever versus never exposed
Dose-response relationships
12. De Stefani et al. (1998)
Uruguay Ho 112 M Ca 352 M Co 1993-1995
1. Jobs held at least 1yr 2. Specific questions concerning use of several substances
Exposed: 23 Ca, 70 Co OR=1.8 (0.9-3.2)
Not studied LQ N N This study was conducted in Uruguay. Exposure might be not portable in GB
13. Elci et al. (2002)
Turkey Ho 940 M Ca 1519 M Co 1979-1980
Job history Industrial hygienist performed JEM exposure assignments
Exposed: 150 Ca OR=1.0 (0.8-1.3)
Not studied HQ N N This study was conducted in Turkey. Exposure might be not portable in GB
14. Shangina et al. (2006)
43 agents Romania, Poland, Russia, Slovakia
Ho 316 M Ca 728 M Co (cancers) 1999-2002
Jobs held at least 1yr - 13 specific jobs, 73 agents - intensity, frequency, confidence IH estimation
Exposed: 26 Ca, 65 Co OR=0.86 (0.51-1.45)
Not studied - N N This study was conducted in East Europe. Results were mainly observed for Poland. Exposure might be not portable in GB
Ca: case, Co: control * Ho: hospital-based study, In: industry-based study, Po: population-based study 1 Exposure assessment method from the book "Asbestos: Selected Cancers", 2006. HQ: high quality, LQ: low quality
2 studies included in the review by Browne & Gee (2000): Y: yes, N: no 3 studies included in the meta-analysis: Y: yes, N: no
39

40

41

Published by the Health and Safety Executive 06/12
The burden of occupational cancer in Great BritainCancer of the larynx
Health and Safety Executive
RR855
www.hse.gov.uk
The aim of this project was to produce an updated estimate of the current burden of cancer for Great Britain resulting from occupational exposure to carcinogenic agents or exposure circumstances. The primary measure of the burden of cancer was the attributable fraction (AF) being the proportion of cases that would not have occurred in the absence of exposure; and the AF was used to estimate the number of attributable deaths and registrations. The study involved obtaining data on the risk of the cancer due to the exposure of interest, taking into account confounding factors and overlapping exposures, as well as the proportion of the target population exposed over the relevant exposure period. Only carcinogenic agents, or exposure circumstances, classified by the International Agency for Research on Cancer (IARC) as definite (Group 1) or probable (Group 2A) human carcinogens were considered. Here, we present estimates for cancer of the larynx that have been derived using incidence data for calendar year 2004, and mortality data for calendar year 2005.
The estimated total (male and female) attributable fractions, deaths and registrations for cancer of the larynx related to occupational exposure is 2.61% (95% Confidence Interval (CI)=0.83-4.32), which equates to 20 (95%CI=5-101) attributable deaths and 56 (95%CI=8-101) attributable registrations.
This report and the work it describes were funded by the Health and Safety Executive (HSE). Its contents, including any opinions and/or conclusions expressed, are those of the authors alone and do not necessarily reflect HSE policy.