rs 122 rs 142 dabur india (dabind) -...
TRANSCRIPT

ICICIdirect.com | Equity Research
1 | P a g e
August 18, 2009 | FMCG
Initiating Coverage
Dabur India (DABIND)
Creating waves in the FMCG space… Dabur India Ltd, (DIL) with its diverse product portfolio, extensive presence in under-penetrated categories and ability to foray into new categories by successfully driving inorganic and organic growth is expected to capitalise on growing FMCG trends. Subsequently, we expect net sales and net profit to grow at a CAGR of 16.9% and 19.5%, respectively from FY09E-FY11E. We are initiating coverage on the company with a PERFORMER rating.
Diversification of product portfolio led by inorganic growth DIL’s product portfolio is present across diverse categories, namely personal care, health care, home care, foods and classical ayurvedic products. It is expected to sustain its sales growth momentum buoyed by a slew of product launches and synergistic inorganic acquisitions (Balsara & Fem Care Pharma Ltd), thereby, enabling it to further supplement its product portfolio.
Renewed focus on international and consumer health businesses On account of the acceleration in growth witnessed in DIL’s international and
consumer health businesses, we foresee revenue contributions from these divisions increase significantly. Subsequently, we expect the international business to contribute 24% to total revenues in FY11E (from 18.5% in FY09), buoyed by expansions into new regions and the consumer health business contributing 8.7% to total revenues in FY11E (from 7.3% in FY09) led by new ayurvedic product launches in its over the counter (OTC) portfolio.
Effectively set to withstand deficient rainfall Although the deficiency in rainfall could affect demand in rural areas, we do not expect DIL to be severely affected, given the non-discretionary nature of its products and its presence across an array of price points. Additionally, since only 17% of the company’s raw material costs are dependent on agri-commodities (sugar and edible oil), we believe the company would be least vulnerable to inflationary pressures. Valuation
At the current market price of Rs 122, DIL is trading at 23.0x its FY10E EPS of Rs 5.3 and 19.1x its FY11E EPS of Rs 6.4. Although, historically DIL has traded at a discount to HUL, given DIL’s high growth rate, foray into new categories via synergistic acquisitions (Balsara and FCPL) and strong earnings visibility, we value the stock at 22.0x its FY11E EPS of Rs 6.4. This is on par with the multiple of HUL. Using the DCF methodology, we have arrived at a fair value of Rs 142, which is 22.0x its FY11E EPS of Rs 6.4. We are initiating coverage on the stock with a PERFORMER rating.
Current Price Rs 122
Target Price Rs 142
Potential upside 16.3%
Time Frame 12 months
PERFORMER
Analysts’ Name
Sanjay Manyal [email protected] Ritika Shewakramani [email protected] Sales & EPS trend
500.0
1500.0
2500.0
3500.0
4500.0
FY07 FY08 FY09 FY10EFY11E
0.0
2.0
4.0
6.0
8.0
Net sales (Rs crore) EPS (Rs)
Stock Metrics
Bloomberg Code DABUR IN
Reuters Code DABU.BO
Face value (Rs) 1
Promoters Holding 70.5
Market Cap (Rs cr) 10958.5
52 week H/L 141.9/60
Sensex 14784
Average volumes 299114 Comparative return metrics
Stock return 3M 6M 12M
Hind. Unilever 9.8 1.9 21.6
ITC 7.5 15.3 6.6
Marico 21.9 37.9 21.1
Dabur 26.0 45.8 35.0 Price Trend
60.0
80.0
100.0
120.0
140.0
160.0
180.0
5-A
pr-0
7
5-Ju
l-07
5-Oc
t-07
5-Ja
n-08
5-A
pr-0
8
5-Ju
l-08
5-Oc
t-08
5-Ja
n-09
5-A
pr-0
9
5-Ju
l-09
Absolute Sell
Target Price
Absolute Buy
Exhibit 1: Key Financials
Year to March 31 FY07 FY08 FY09 FY10E FY11E
Net Profit (Rs crore) 282.1 333.7 390.8 455.3 557.8 Shares in issue (crore) 86.3 86.4 86.5 86.5 86.5 EPS (Rs) 3.3 3.9 4.5 5.3 6.4 Growth (%) 17.9 16.9 13.1 22.0 P/E (x) 36.9 31.2 27.1 23.0 19.1 Price/Book (x) 22.0 17.1 12.9 10.5 8.6 EV/EBITDA (x) 31.0 26.2 22.8 19.1 15.9 EBITDA Margin (%) 15.6 17.1 16.6 17.4 17.8 Net Profit Margin (%) 12.8 14.1 13.9 14.0 14.7 RoNW (%) 57.8 60.8 54.4 50.0 50.1 RoCE (%) 47.0 51.8 46.1 44.5 45.5
Source: Company, ICICIdirect.com Research

ICICIdirect.com | Equity Research
2 | P a g e
Company Background
DIL is one of India’s largest FMCG companies positioned as an ayurvedic and herbal specialist with interests in health care, personal care and food products. The company was founded by Dr SK Burman in 1884 as a small pharmacy in Calcutta (now Kolkata), West Bengal. In 2003, DIL approved the demerger of its pharmaceuticals business from the FMCG business into a separate company as part of plans to provide greater focus to both businesses. With this, DIL now largely comprises the FMCG business, which includes personal care products, healthcare products and ayurvedic specialties, while the pharmaceuticals business includes allopathic, oncology formulations and bulk drugs. As part of its inorganic growth strategy, in FY05 DIL acquired Balsara's hygiene and home products businesses, a leading provider of oral care and household care products in the Indian market. In 2007, the company merged its wholly owned subsidiary, Dabur Foods, into the parent company Dabur India Ltd in order to unlock operational efficiencies and extract synergies.
The company possesses four strategic business units, namely the consumer care division (CCD), the international business division (IBD), the consumer health care division (CHD) and the retail venture (new U) that is currently in the development phase. DIL operates under five flagship brands, each of which has its own distinct brand identity. These are Dabur as the master brand for all natural healthcare products, Vatika for premium personal care, Hajmola for digestives, Real for fruit-based drinks, Chyawanprash for traditional ayurvedic revitalisers and Anmol for affordable personal care products. In FY09, DIL acquired Fem Care Pharma Ltd (FCPL), a leading player in the skin care segment for Rs 203.7 crore in an all-cash deal.
Shareholding pattern (Q1FY10)
Shareholder % holding
Promoters 70.5
Institutional Investors 22.3
Other Investors 6.6
General public 0.48 Promoter & Institutional holding trend (%)
70.7 70.7 70.7 70.5
22.322.522.322.1
0.0
20.0
40.0
60.0
80.0
Q2FY09 Q3FY09 Q4FY09 Q1FY10
Promoters Institutional Investors

ICICIdirect.com | Equity Research
3 | P a g e
Exhibit 2: Dabur business model (FY09)
Source: Company, ICICIdirect.com Research
* Includes international business
**Includes retail business
Dazzl
Sanifresh
Odomos
Dabur Honey
Real & Activ Hommade
Others** (2.8%)
Foods (11.8%)
Culinary
Dabur * Revenues Rs 2834.1 crore
Consumer Health Division (7.5%)
Hair Care (32%)
OTC (57%) Ethical (43%)
Oral Care (18%)
Baby & Skin Care (5%)
Digestives & Candies (7%)
Health Supplements (19%)
Home Care (6%)
Vatika
Dabur Red
Babool
Meswak Hajmola Gulabari
Odonil
Chyawanprash
Consumer Care Division (77.8) %)
Uveda
Promise
Lal Dant Manjan
Juices
Dabur Glucose Dabur Amla
Anmol

ICICIdirect.com | Equity Research
4 | P a g e
Investment Rationale Diverse product portfolio to sustain sales growth momentum DIL is present across a wide spectrum of market segments namely, personal care, healthcare, home care and foods. Buoyed by this diverse product portfolio, a slew of product launches and synergistic inorganic acquisitions, DIL’s revenues have grown at a CAGR of 12.9% from Rs 1371.0 crore in FY03 to Rs 2834.1 crore in FY09. The company reported a 19.1% YoY growth in revenues post the Balsara acquisition. This supplemented its oral care portfolio and enabled it to foray into the home care category. In light of the successful turnaround of Balsara, DIL has demonstrated its ability to integrate acquisitions and complement its product portfolio. Subsequently, post the Fem Care Pharma Ltd (FCPL) acquisition undertaken in FY09, we expect the company to deliver similar results, by successfully integrating its skincare portfolio and gaining significant presence in the skin care market. This will enable sales to grow at a CAGR of 16.9% from FY09-FY11E. Furthermore, we believe any further acquisitions undertaken will enable DIL to diversify further by adding new lines of growth and giving a fillip to revenues accordingly.
Exhibit 3: Sales growth from FY03-FY11E
7.0%
19.1%
15.0%
6.8%
15.4%
-3.1%
13.5%15.7%
13.3%
500
1000
1500
2000
2500
3000
3500
4000
4500
FY03 FY04 FY05 FY06 FY07 FY08 FY09 FY10E FY11E
-5.0%
0.0%
5.0%
10.0%
15.0%
20.0%
25.0%
Sales (Rs crore) Sales growth (Y-o-Y)
Balsara Acquisiton Fem
Acquisition
?????
Source: Company, ICICIdirect.com Research
Altering the revenue mix with a renewed focus The company primarily operates through three strategic business units, namely the consumer care division (CCD), the consumer health division (CHD) and the international business division (IBD).
Exhibit 4: Revenue contribution of DIL’s strategic business units (Rs crore)
1329.7 1518.9 1821.2 2063.2 2254.8 2596.7
152.0 156.4143.8 206.9 261.4 337.2
209.0 290.4383.4 524.3 722.2 930.1
190.0 245.711.629.439.747.919.0 22.3
0%
20%
40%
60%
80%
100%
FY06 FY07 FY08 FY09 FY10E FY11E
CCD CHD IBD Foods Others
Source: Company, ICICIdirect.com Research
Any further inorganic acquisitions would accelerate growth further

ICICIdirect.com | Equity Research
5 | P a g e
The CCD division remains the largest contributor to revenues. However, its contribution to sales was lower in FY09 at 72% on account of higher revenue inflows from the CHD and IBD, which contributed 7.3% and 18.5%, respectively, in FY09 as against 6.0% and 16% in FY08. On account of the acceleration in growth witnessed across international regions, we expect the IBD to contribute 24% of revenues in FY11E buoyed by geographic expansions into new regions such as Uzbekistan, Guinea and Belarus. In addition to this, with planned initiatives aimed at introducing new ayurvedic products in modern, ready to use formats, which would further complement the company’s OTC portfolio, we expect the CHD to contribute 8.7% of revenues in FY11E. Consumer care division to grow by inorganic leaps and organic bounds The CCD, which forms the mainstay of DIL’s business, has grown both organically and inorganically registering a CAGR sales growth of 23% from Rs 1185.5 crore in FY06 to Rs 2207.1 crore in FY09. Exhibit 5: Organic and inorganic growth driving CCD (FY05-FY09)
- Inorganic growth - Organic growth
Source: Company, ICICIdirect.com Research
On acquiring the loss making Balsara Hygiene and Home Products and turning it into a profitable business within six months, DIL gained market share in categories such as oral care and home care where it had a negligible presence. In light of the Balsara turnaround, wherein DIL demonstrated its ability to grow inorganically and complement its product portfolio successfully, we expect the FCPL acquisition (FY09) to deliver similar results. DIL’s acquisition of FCPL for 2.6x its FY09 sales, at a price per share of Rs 800, seems expensive. However, we believe FCPL’s extensive range of products will augur well for the company, which is looking to expand its presence in the skin care segment. We expect FCPL to add around 4% to the topline and 3% to the EPS in FY10E-FY11E.
Exhibit 6: Valuation multiples for FCPL acquisition (FY09) FCPL Acquisition (FY09)
EV (Rs crore) 300EV/EBITDA (x) 18P/E (x) 26
Source: Company, ICICIdirect.com Research
2002-2005
Family Products & Health Care
2005-2006
Acquired Balsara for Rs 143 cr
2007-2008
Integration of Foods Division
2008-2009
Acquired Fem Care 72.3% for Rs 203.7 cr
Oral Care (Babool, Meswak,
Promise)
Home Care (Odonil, Sanifresh, Odopic, Odomos)
Fruit juices (Real & Activ)
Culinary additives (Hommade)
Consumer Products (Oxybleach, Saka (Fem Stratum,Fem, Botanica)
Pharma Products (Aloederm, Restoderm &
Femnicol)
Consumer Care
Division Hair Care
Digestives
Health Supplements
Baby & Skin Care

ICICIdirect.com | Equity Research
6 | P a g e
The acquisitions undertaken will fuel growth inorganically by unlocking synergies and eradicating duplicity in distribution and marketing. Additionally, the ongoing product/variant launches, forays into new and sub-categories and integration of the foods division (a wholly owned subsidiary of the company that was merged with the parent company) with the CCD will boost growth organically. Furthermore, given the vast market size and abysmally low penetration levels prevalent in certain key categories (as given below) in which the CCD operates, we expect CCD revenues to increase to Rs 2254.8 crore in FY10E and to Rs 2596.7 crore in FY11E.
Exhibit 8: FMCG category sizes and penetration levels (FY08-FY09) Category Name Industry Size (Rs crore) Urban Penetration(%) Rural Penetration(%)Health Supplements * Rs 401.4 14 5Digestive Tablets Rs 179.3 NA NABranded Candies Rs 694.1 NA NAPackgaed Fruit Juices Rs 1300.0 30 10Shampoos Rs 2085.0 62 46Hair Oils Rs 3315.0 96 93Air Fresheners Rs 75.4 NA NAToothpaste Rs 2593.2 79 45Toothpowder Rs 530.1 26 33Floor Cleaners Rs 71.0 22 2Fairness Creams Rs 1100.0 20 14Skin Care Rs 2000.0 30 19Mosquito Repellants Rs 667.0 59 18 Source: Company, ICICIdirect.com Research
* Includes Chyawanprash and Glucose
Exhibit 7: Category wise revenue distribution of the CCD (Rs crore)
438.8 501.2 509.9 641.7 676.4 802.4
292.5 334.2364.2 379.6 421.7 493.4
279.2 334.2346.0 387.9 399.1 446.6
133.0 136.7145.7 150.6 151.1 161.0
106.4 106.3109.3 111.4 157.8 187.0236.8 274.4 315.7 371.3
79.8 106.3 117.6109.3 133.0 135.0
0%
20%
40%
60%
80%
100%
FY06 FY07 FY08 FY09 FY10E FY11E
Hair care Oral Care Health Supplement DigestivesBaby Oil & Skin Care Foods Home Care
Source: Company, ICICIdirect.com Research

ICICIdirect.com | Equity Research
7 | P a g e
Hair Care With a CAGR sales growth of 20.6% from FY06 to FY09, DIL’s hair care category remains the largest contributor to CCD with a 31.1% contribution in FY09. The company, which operates in the coconut based, amla based and light hair oil market continued to keep pace with the hair oil market growing at 22.8% in FY09 and 15.8% in Q1FY10 respectively. With the introduction of a Re 1 sachet, Dabur Amla the dominant brand in the heavy amla based hair oils market (industry size- Rs 538.0 crore), grew by 20.4% in FY09 and 14.3% in Q1FY10. Dabur Anmol Sarson Amla also grew by 29.7% in FY09 on the back of consistent promotional efforts to drive its reach in mass markets.
Exhibit 9: Market share of DIL’s amla brands in amla hair oil market & growth of DIL’s brands vis-à-vis amla hair oil industry (%)
75.9 75.4 75.8 75.6 75.9 75.7 76.5
7.4 6.9 7.2 7.4 7.4 7.0 7.25.5 5.3 4.9 4.5 4.7 4.9
11.2 11.8 11.7 12.1 12.2 12.7 11.45.9
30.0
40.0
50.0
60.0
70.0
80.0
90.0
100.0
110.0
FY06
FY07
FY08
Q1FY
09
Q2FY
09
Q3FY
09
Q4FY
09
Valu
e M
arke
t Sha
re (%
)
Dabur's Amla brands * Marico Bajaj Consumer Care Others
0.010.020.030.040.050.060.070.0
FY07
Q1FY
08
Q2FY
08
Q3FY
08
Q4FY
08
Q1FY
09
Q2FY
09
Q3FY
09
Q4FY
09
Grow
th (%
)
Amla hair oil industry Dabur Amla Dabur Anmol S
Source: Company, ICICIdirect.com Research
*Includes Dabur Amla and Dabur Anmol Sarson Amla
Driven by improved distribution effectiveness, DIL’s Anmol coconut oil brand grew by 32.4% in Q4FY09 and 42.7% in Q1FY10. In order to fuel growth, enhance market share and expand the hair oil market DIL, forayed into the light hair oil market (industry size Rs 500 crore) in FY09 by launching two variants such as, Vatika Enriched Almond Oil and Dabur Amla Flower Magic Oil. Exhibit 10: Growth of DIL’s Anmol coconut oil (%) & DIL’s market share vis-à-vis peers in the hair oil market (%)
0.0
10.0
20.0
30.0
40.0
50.0
60.0
FY07
Q1FY
08
Q2FY
08
Q3FY
08
Q4FY
08
Q1FY
09
Q2FY
09
Q3FY
09
Q4FY
09
Grow
th (%
)
Coconut hair oil industry Dabur Anmol coconut oil
FY09
33.0
17.0
6.0
3.0
41.0
Marico Dabur Bajaj Dey's Lab Others
Source: Company, ICICIdirect.com Research
ICICIdirect.com | Equity Research
8 | P a g e
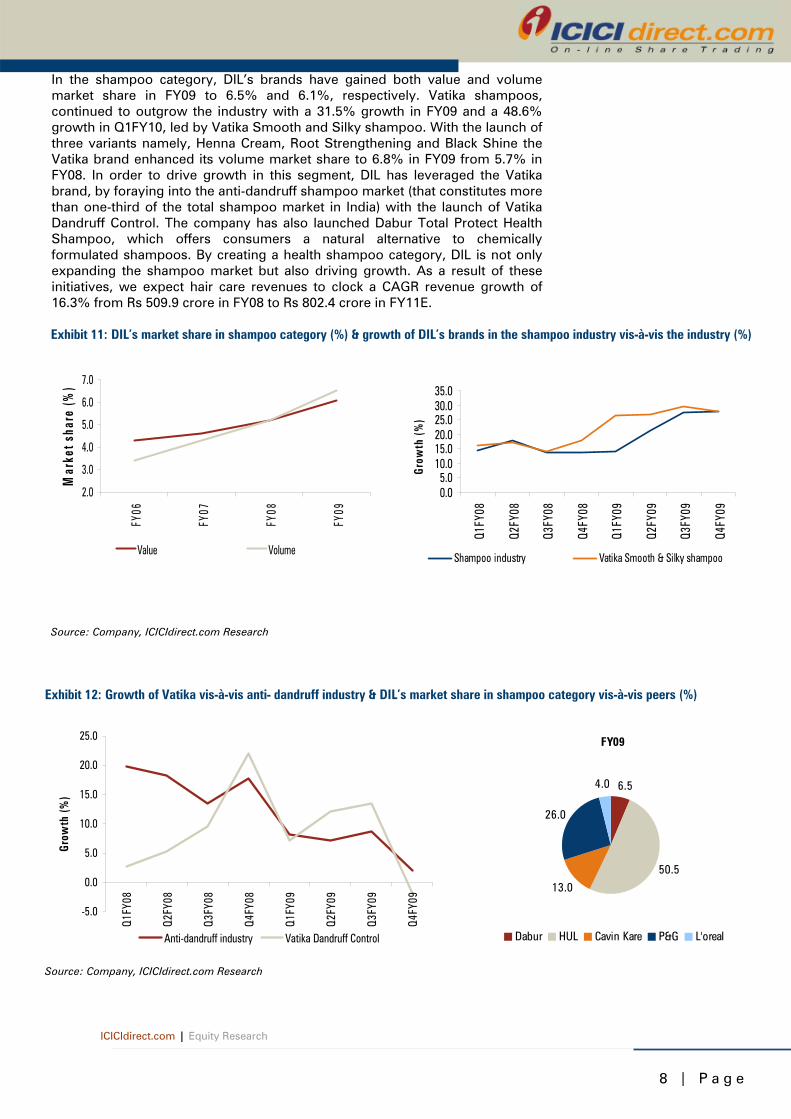
In the shampoo category, DIL’s brands have gained both value and volume market share in FY09 to 6.5% and 6.1%, respectively. Vatika shampoos, continued to outgrow the industry with a 31.5% growth in FY09 and a 48.6% growth in Q1FY10, led by Vatika Smooth and Silky shampoo. With the launch of three variants namely, Henna Cream, Root Strengthening and Black Shine the Vatika brand enhanced its volume market share to 6.8% in FY09 from 5.7% in FY08. In order to drive growth in this segment, DIL has leveraged the Vatika brand, by foraying into the anti-dandruff shampoo market (that constitutes more than one-third of the total shampoo market in India) with the launch of Vatika Dandruff Control. The company has also launched Dabur Total Protect Health Shampoo, which offers consumers a natural alternative to chemically formulated shampoos. By creating a health shampoo category, DIL is not only expanding the shampoo market but also driving growth. As a result of these initiatives, we expect hair care revenues to clock a CAGR revenue growth of 16.3% from Rs 509.9 crore in FY08 to Rs 802.4 crore in FY11E.
Exhibit 11: DIL’s market share in shampoo category (%) & growth of DIL’s brands in the shampoo industry vis-à-vis the industry (%)
2.0
3.0
4.0
5.0
6.0
7.0
FY06
FY07
FY08
FY09
Mar
ket s
hare
(%)
Value Volume
0.05.0
10.015.020.025.030.035.0
Q1FY
08
Q2FY
08
Q3FY
08
Q4FY
08
Q1FY
09
Q2FY
09
Q3FY
09
Q4FY
09
Grow
th (%
)
Shampoo industry Vatika Smooth & Silky shampoo
Source: Company, ICICIdirect.com Research
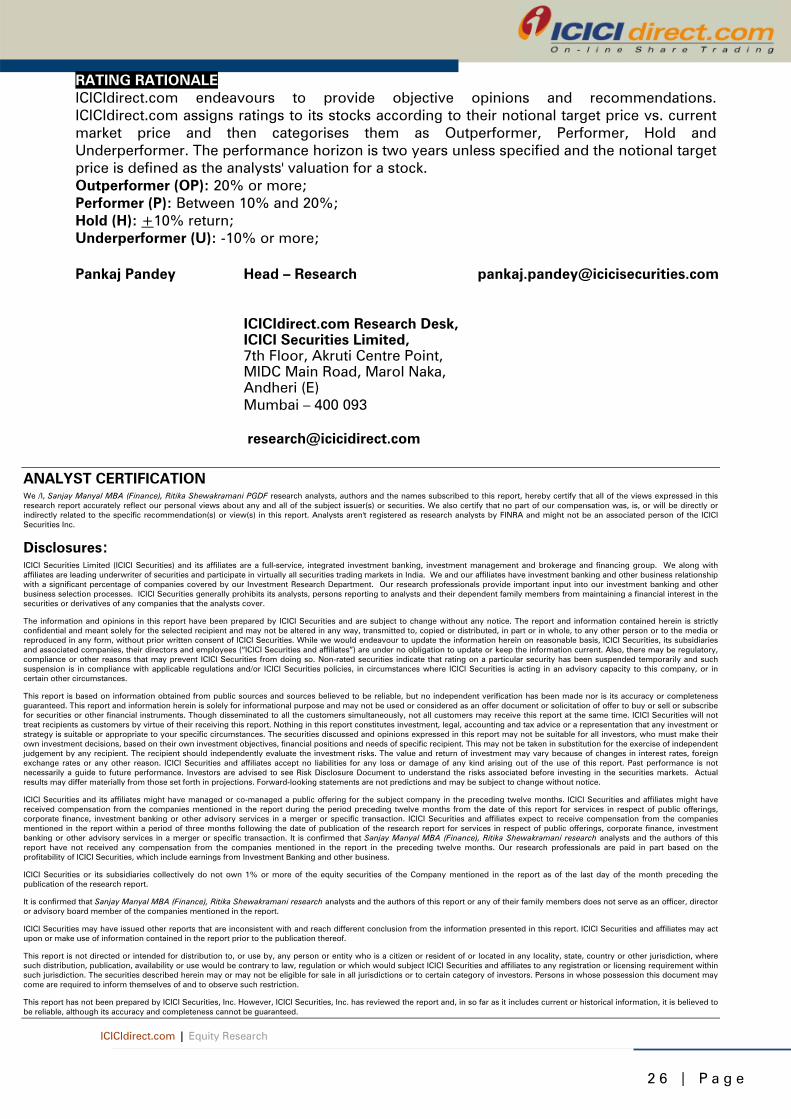
Exhibit 12: Growth of Vatika vis-à-vis anti- dandruff industry & DIL’s market share in shampoo category vis-à-vis peers (%)
-5.0
0.0
5.0
10.0
15.0
20.0
25.0
Q1FY
08
Q2FY
08
Q3FY
08
Q4FY
08
Q1FY
09
Q2FY
09
Q3FY
09
Q4FY
09
Grow
th (%
)
Anti-dandruff industry Vatika Dandruff Control
FY09
6.5
50.5
13.0
26.0
4.0
Dabur HUL Cavin Kare P&G L'oreal
Source: Company, ICICIdirect.com Research

ICICIdirect.com | Equity Research
9 | P a g e
Oral care DIL’s oral care segment is the second largest contributor to CCD with a CAGR sales growth of 9.1% from Rs 292.5 crore in FY06 to Rs 379.6 crore in FY09. DIL’s toothpaste portfolio, which includes Meswak (premium brand), Dabur Red (mid-priced) and Babool (economy), recorded a 11.3% growth in FY09 and 20.3% growth in Q1FY10. After two quarters of sluggish growth, Babool bounced back with a 16.4% and 22.8% growth in FY09 and QFY10, respectively. In addition, the Dabur Red brand continued to grow by 21.4% in FY09 and by 18.4% in Q1FY10.
Exhibit 13: Growth of DIL’s oral care brands against oral care industry (%)
0.010.020.030.040.050.060.070.080.0
FY07
Q1FY
08
Q2FY
08
Q3FY
08
Q4FY
08
Q1FY
09
Q2FY
09
Q3FY
09
Q4FY
09
Valu
e gr
owth
(%)
Toothpaste indusrty Dabur Red Babool Meswak
Source: Company, ICICIdirect.com Research
Although the company’s red toothpowder remained sluggish with a market share of 30.3% overall, DIL increased its market share in the oral care market to 10% in FY09, making it the third largest oral care provider. With low per capita consumption of toothpaste and low penetration levels of oral care, particularly in rural areas, we believe DIL, with the strategic integration of the Balsara brands acquired (Promise, Babool, Meswak) is well positioned to sustain growth in this category.
Exhibit 14: DIL‘s oral care market share growth (%) and market share in oral care market vis-à-vis peers (%)
2.0
7.07.9
9.4 10.0
0
2
4
6
8
10
12
FY05 FY06 FY07 FY08 FY09
Mar
ket s
hare
(%)
Market share post Balsara acqusition FY09
10
49
29.2
3.9 7.9
Dabur Colgate HUL Anchor Others
Source: Company, ICICIdirect.com Research

ICICIdirect.com | Equity Research
1 0 | P a g e
Health supplements This segment primarily constitutes three products. These are Dabur Chyawanprash, a flagship brand in this category, Dabur Glucose, a replenishment supplement and Dabur Honey. Dabur Chyawanprash, which dominates the branded chyawanprash industry, witnessed a rise in market share (volume) from 62.3% in FY08 to 64.1% in FY09. Supported by the launch of a new sugar free variant (Dabur Chyawanprakash), growing health concerns and the recent foray into the malted food drinks category with the launch of Chyawan Junior, Dabur Chyawanprash continues to outgrow the branded chyawanprash industry.
Exhibit 15: Volume market share of Dabur Chyawanprash vis-à-vis peers & growth rate vis-à-vis Chyawanprash industry (%)
60.7 62.7 62.3 61.1 65.1 64.5 64.5
9.3 9.1 10.7 9.5 8.0 8.7 9.412.7 12.7 11.7 14.5 12.4 12.5 11.317.3 15.5 15.3 15.0 14.5 14.3 14.8
0.0
20.0
40.0
60.0
80.0
100.0
120.0
FY06
FY07
FY08
Q1FY
09
Q2FY
09
Q3FY
09
Q4FY
09
Mar
ket s
hare
(%)
Dabur Emami Baidyanath Others
-15.0-10.0
-5.00.05.0
10.015.020.025.0
30.0
FY07
Q1FY
08
Q2FY
08
Q3FY
08
Q4FY
08
Q1FY
09
Q2FY
09
Q3FY
09
Q4FY
09
Grow
th (%
)
Chyawanprash industry growth Dabur Chyawanprash growth
Source: Company, A C Nielsen research, ICICIdirect.com Research
Although, Dabur Glucose has grown steadily, it managed to outpace the growth of the glucose industry only post Q3FY09. It clocked a growth of 34.1% in Q1FY10 on the back of the launch of two new variants (orange and lemon). With a growth of 17.2% in Q1FY10 and the introduction of a sugar free Chyawanprash variant, we believe the health supplement category will continue to sustain its growth, going forward.
Exhibit 16: Growth rate of Dabur Glucose vis-à-vis glucose industry FY07-FY09 (%)
0.05.0
10.015.020.025.030.035.040.0
FY07
Q1FY
08
Q2FY
08
Q3FY
08
Q4FY
08
Q1FY
09
Q2FY
09
Q3FY
09
Q4FY
09
Grow
th (%
)
Glucose industry Dabur Glucose
Source: Company, A C Nielsen research, ICICIdirect.com Research

ICICIdirect.com | Equity Research
1 1 | P a g e
Foods division With sales growing by 15.8% from Rs 236.8 crore FY08 to Rs 274.4 crore FY09, the foods division, which once operated as a wholly owned subsidiary, has been merged back into the parent company and integrated with the CCD. With a 13.3% revenue contribution to the CCD, the foods division primarily consists of fruit beverages under the Real & Activ brands and culinary additives under the Hommade brand. Dabur’s Real and Activ, which registered a 14.9% growth in FY09, dominate the juices market with a market share of around 50%. By aligning its Activ range of juices in the health and wellness category via the “no sugar” campaigns we believe the emergence of health and lifestyle concerns coupled with the launch of new variants (Real Burrst) will enable DIL to capitalise on the growing fruit juice market. Moreover, with plans to expand its range of ready to cook products under the Hommade brand, we expect the high margin foods category to sustain its grown momentum with a 16.3% CAGR revenue growth from FY09-FY11E. This division will hence, enhance its revenue contribution to CCD sales from 13.3% in FY09 to 14.3% in FY11E.
Exhibit 17: Market share of DIL’s Real juice brand vis-à-vis peers in the juices market (%)
0.0
10.0
20.0
30.0
40.0
50.0
60.0
Q1FY08 Q2FY08 Q3FY08 Q4FY08 Q1FY09 Q2FY09 Q3FY09
Mar
ket s
hare
(%)
Real (Dabur) Tropicana Fresh Gold
Leh Berry Others
Source: Company, ICICIdirect.com Research
Digestives and candies With a 7.3% contribution to CCD in FY09, DIL’s digestive portfolio comprises two offerings, namely the Hajmola tablet (tasty digestive) and Hajmola candy (tangy tasting digestive). Led by a host of marketing campaigns promoting Hajmola as a post meal digestive, this category registered an 18% growth rate in FY09. With the introduction of new variants such as Pudina and Nimbu and the rollout of 50 paise sachets, we believe the company will continue to lead the digestives market.
Exhibit 18: Hajmola’s market share in the digestive tablets market (%) and DIL’s market share in the digestives segment (%)
0.010.020.030.040.050.060.070.080.0
FY06 FY07 FY08 Q1FY09 Q2FY09 Q3FY09 Q4FY'09
Mar
kaet
sha
re (%
)
Hajmola Satmola Others
FY09
32.0
19.014.0
13.0
22.0
Dabur Knoll Glaxo Pfizer Others
Source: Company, ICICIdirect.com Research

ICICIdirect.com | Equity Research
1 2 | P a g e
Home Care On acquiring Balsara, DIL acquired a range of home care products comprising air fresheners (Odonil), mosquito repellents (Odomos) and surface cleaners (Odopic, Sani Fresh). This category contributes 5.7% to CCD sales (as on FY09). With the soft launch of Sanifresh Extra power in the toilet cleaner market, the launch of two kitchen cleaner variants under the Dazzl brand and the foray into the air freshener gel category with the Odonil brand, the home care portfolio registered a 9.7% growth in FY09. Aided by initiatives undertaken to expand the Odomos range, including the introduction of a spray format, the brand continues to dominate the market with an 84% market share. Going forward, we believe the rapid rise in urbanisation will fuel consumer need to live in cleaner and safer environments. Hence, this will enable the company to capitalise on the growth potential emanating from this under penetrated category.
Exhibit 19: Value market share of Odonil and Odomos in air fresheners and mosquito repellents market vis-à-vis peers (%)
0.0
20.0
40.0
60.0
80.0
100.0
Q1FY09 Q2FY09 Q3FY09 Q4FY'09
Mar
ket s
hare
(%)
Odonil Others
0.0
20.0
40.0
60.0
80.0
100.0
Q1FY09 Q2FY09 Q3FY09 Q4FY09
Mar
ket s
hare
(%)
Odomos Others
Source: Company, ICICIdirect.com Research
Baby & skin care Dabur Lal Tail, a key product in the baby massage oil segment grew by 20% in FY09 on the back of unabated promotional initiatives. Driven by increasing sales of Gulabari rose water and its extension into the mainstream skin care market with the introduction of new products such as Gulabari Moisturizing Cold Cream and Gulabari Premium Rose Touch Face Freshener spray, the Gulabari brand grew by 40.6% in FY09 to Rs 40.0 crore. In Q3FY09, DIL acquired FCPL a leader in the fairness bleach category with a 60% market share.
Exhibit 20: FCPL segment wise revenue distribution in FY09 (%)
411
17
53
78
Exports Liquid Soap Pharma Bleach Hair removal Others
Source: Company, ICICIdirect.com Research

ICICIdirect.com | Equity Research
1 3 | P a g e
The skin care category (including baby care) contributes only 5.4% to total CCD sales as on FY09. However, with the acquisition of FCPL and the company’s plan to hinge its skin care business vis-à-vis three platforms namely, Gulabari (herbal), Fem (synthetic) and the recently launched ayurvedic platform (Uveda), we expect this segment to contribute 7.2% to CCD sales in FY11E. By leveraging Fem’s distribution network (which consists of 25,000 parlours) for the promotion and cross-selling of upcoming products within its Gulabari and Uveda product range, we believe DIL will become the third largest player in the skin care market.
Exhibit 21: Market size, growth rate and Fem’s market share in key operational categories Category Market Size (Rs crore) Growth rate (%) Fem Market Share (%)
Skin bleach 85 15 60
Hair remover 115 22 7
Liquid hand wash 50 25 18 Source: Company, ICICIdirect.com Research
Dabur to widen its international blueprint DIL’s international business can be bifurcated into two. It consists of focus markets, where the company chiefly operates with its own manufacturing facilities through its subsidiaries. It also constitutes potential markets, where the company provides promotional support to its products by catering to specific geographies.
DIL’s international business spans across key geographies such as South Asia, North & West Africa and the Middle East. With sales growing at a CAGR of 34.4% from Rs 216.0 crore in FY06 to Rs 524.3 in FY09, the international business has emerged as the fastest growing division in the company.
Exhibit 23: IBD’s revenue growth and contribution to total revenues (FY06-FY11E)
209.0 290.4 383.4524.3
722.2930.111
1316
18.522.1
24
0.0
200.0
400.0
600.0
800.0
1000.0
FY06 FY07 FY08 FY09 FY10E FY11E
0
5
10
15
20
25
30
Revenues (Rs crore) Contribution to Total Revenues (%)
Source: Company, ICICIdirect.com Research
Exhibit 22: Dabur’s International (IBD) blueprint
Source: Company, ICICIdirect.com Research
Potential Markets (15-20%)
East & South Africa
United Kingdom Russia & CIS
Focus Markets (75-80%)
Middle East & North & West Africa
South Asia
North America

ICICIdirect.com | Equity Research
1 4 | P a g e
This acceleration in revenues supported by strong volume growth in the hair care and oral care categories has significantly enhanced the contribution of the international business division to consolidated revenues from 11.4% in FY06 to 18.5% in FY09. Although the focus markets continue to contribute a majority of the revenues, we believe the growth emanating from the company’s potential markets led by geographical expansion into new economies such as Uzbekistan, Guinea and Belarus will enhance IBD’s contribution to total revenues from 18.5% in FY09 to 24% in FY11E.
Exhibit 24: Subsidiaries of Dabur’s international business (IBD) and their growth in revenues from FY06-FY09 (Rs crore)
194.8219.9
244.7272.1
38.8
72.1 72.1
14.4 9.2 15.930.4
63.2
112.7
142.8
223.0
77.1
33.413.613.2 20.7
0.0
50.0
100.0
150.0
200.0
250.0
300.0
FY06 FY07 FY08 FY09
Dabur Nepal Pvt. LtdDabur International (UAE)Weikfield International Ltd. (UAE)Asian Consumer Care Pvt.Ltd (Bangladesh)
Source: Company, ICICIdirect.com Research
DIL’s international subsidiaries, which include Gulf Cooperation Council (GCC), Egypt, Nigeria, Nepal and Bangladesh, form the mainstay of the international business division. Led by strong performances in the Vatika hair oil and hair cream franchise, Dabur Egypt, Dabur International and Weikfield International (which cater to the Middle East and North African regions) have registered a CAGR sales growth of 68.3%, 42.5% and 29.2%, respectively, from FY06 to FY09. In addition to this, Asian Consumer Care, Bangladesh and Dabur Nepal Pvt Ltd grew by 56% and 11%, respectively, in FY09 on the back of the new launches and marketing initiatives undertaken.
Asian Consumer Care (Pakistan)
Dabur Egypt Limited
Naturelle LLC (UAE)
Asian Consumer Care (Bangladesh)
African Consumer Care (Nigeria)
Weikfield International (UAE)
Dabur International (UAE)
Dabur Nepal Pvt. Ltd
DIL’s International Subsidiaries

ICICIdirect.com | Equity Research
1 5 | P a g e
Consumer healthcare — the new driving force DIL’s CHD, which comprises a range of healthcare products, can be classified into over the counter products (OTC) and ethicals. While the Indian OTC market is estimated at Rs 750 crore, the Indian ethicals market is estimated at Rs 50 crore. DIL’s OTC portfolio encompasses generics and branded products namely, healthcare products such as Dashmularishta and Ashokarishta, cough syrups (Dabur Honitus), Dabur Active Antacid and Badam Tail. It contributes 57% to total CHD revenues and commands a 10% market share in the OTC health category.
Exhibit 25: A break-up of the consumer health division (CHD) Source: Company, ICICIdirect.com Research
* OTC-Over the counter
Although CHD sales grew only moderately by 5.4% to Rs 155.8 crore in FY08, it registered a 32.7% growth in FY09 on account of new launches and robust growth across categories. While the Honitus franchise grew by 13.6%, led by the launch of the honey mint and mulethi powder variants, Dabur Badam Tail posted sales of Rs 6.0 crore, growing by 20.6% in FY09. With aggressive marketing initiatives and the transfer of key brands mainly, Hingoli, Janam Ghunti, Pudin Hara, Sat Isab Gol and Gripe water from the CCD to the CHD, the company plans to renew its focus on CHD. Hence, we expect the company to enhance the contribution of CHD to total revenues, going forward.
Exhibit 26: CHD sales growth and EBITDA margin (FY06-FY11E)
152.0 156.4 143.8206.9
261.4337.2
26.3
25.2
27.2 27.3
2828.5
0.0
50.0
100.0
150.0
200.0
250.0
300.0
350.0
400.0
FY06 FY07 FY08 FY09 FY10E FY11E
23
24
25
26
27
28
29
Revenues (Rs crore) EBITDA margins (%)
Source: Company, ICICIdirect.com Research
CHD Portfolio
OTC*(57%) Ethicals (43%)
Branded Products Generics Branded ethicals Classicals Tonics

ICICIdirect.com | Equity Research
1 6 | P a g e
Aggressive product/variant launches New products and innovations contribute around 6-7% of the company’s revenues. With the intention of keeping the brand salient in the mind of the consumer and driving topline growth across its strategic business units namely, CCD, CHD and IBD the company continues to leverage its branding and distribution to launch a host of brand extensions/variants across. These include the following:
Exhibit 27: New product and variant launches — CCD Category FY08 FY09
Hair CareVatika Smooth & Silky Shampoo Vatika Enriched Almond Hair OilVatika Black Shine Shampoo Dabur Amla Flower Magic Hair OilVatika Smooth & Silky Conditioner Vatika Dandruff ControlVatika Black Shine Conditioner Dabur Total Protect Health Shampoo
Oral CareBabool Neem
FoodsReal Apple Nectar Real Burrst - mixed fruit, apple, orange & mango Activ Mixed Fruit Vegetable & Carrot
Skin CareGulabari Hydrating Rose Crème & lotion Gulabari Moisturizing Cold Cream & Lotion
Gulabari Premium Rose Face FreshenerHealth Supplments
Chyawan Junior (malted drink) Dabur Glucose Lemon and OrangeChyawanprakash Sugar free
Digestives Hajmola Natkhat Nimbu,Kachcha Aam & Mint Masala Hajmola Pudina and Nimbu
Home CareOdonil Jasmine Mint,Spring Scents Dazzl -Floral,Lemon and PineDazzl Disinfectant & Anti-bacterial Sanifresh Extra Power
Odonil GelsOdomos Naturals
Source: Company, ICICIdirect.com Research
Exhibit 28: New product and variant launches - IBD FY08 FY09
Amla Jasmine Hair Oil Dabur Amla Hair CreamVatika Hammam Zaith-Hair Oil Treatment Vatika Cactus Hair OilDabur Herbal Gel Vatika Oilve Light Hair OilVatika Hair Cream Vatika Naturals Nourish & Protec Styling CreamVatika Olive Hair Oil Vatika Naturals Dandruff Guard Styling Cream Source: Company, ICICIdirect.com Research
Exhibit 29: New product and variant launches- CHD
FY08 FY09Dabur Active Blood purifier Honitus -Mulethi Power & Honey MintBhringaraj Ayurvedic Tail Dabur Super Thanda TailDabur Almond Oil Dabur Active AntacidBadam Tail Source: Company, ICICIdirect.com Research

ICICIdirect.com | Equity Research
1 7 | P a g e
Effective cost pressure measures to protect margins and tackle paucity in monsoons In an inflationary environment, most FMCG companies are compelled to take calibrated price increases in order to protect EBITDA margins and simultaneously, maintain volume growth and market share. As a result of this practice, when inflation reached its peak of 12-13% in September 2009, on the back of a rise in crude based and agri-based commodity prices, several FMCG companies took price hikes to pass on some of the increase in raw material costs to consumers.
Exhibit 30: Crude oil prices (US $ per barrel) and sugar prices (Rs per kg)
0
20
40
60
80
100
120
140
160
Jul-0
7
Sep-
07
Nov
-07
Jan-
08
Mar
-08
May
-08
Jul-0
8
Sep-
08
Nov
-08
Jan-
09
Mar
-09
May
-09
Jul-0
9
12.0
14.0
16.0
18.0
20.0
22.0
24.0
26.0
28.0
30.0
32.0
May
-08
Jul-0
8
Sep-
08
Nov
-08
Jan-
09
Mar
-09
May
-09
Jul-0
9
Source: Company, ICICIdirect.com Research
However, while most FMCG companies raised prices by around 15-20% (average), DIL raised prices by only 5%, thereby enabling the company to maintain margins effectively in an inflationary scenario. We can attribute this to several cost management initiatives undertaken by the company. These involve aggressive planning, forecasting and hedging especially on international exchanges and the dependence of the company’s input basket (crude derivatives, herbs, sugar and edible oils) on commodities.
Exhibit 31: DIL’s input basket inflation vis-à-vis the economy’s inflation (April 2009-December 2009)
-2
0
2
4
6
8
10
12
14
Apr-08 May-08 Jun-08 Jul-08 Aug-08 Sep-08 Oct-08 Nov-08 Dec-08
Economy Inflation DIL's input basket inflation without hedging DIL's input basket inflation after hedging
Average Economy Inflation = 10.1%
Average Inflation of DIL's managed basket = 4%
Source: Company, ICICIdirect.com Research

ICICIdirect.com | Equity Research
1 8 | P a g e
Although, the delay in the onset of monsoons could affect FMCG demand in rural areas, we do not expect the company to be adversely affected on account of the non-discretionary nature of FMCG products. Moreover, we believe the company’s presence across an array of price points will enable it to benefit from any down trading possibilities. The paucity in monsoons and rising EL Nino risks can be compared to the drought situation in 2002-03, wherein lower agricultural GDP growth resulted in lower FMCG Y-o-Y growth. However, in the current period (2008-09), we believe the impact on consumption will be offset by increased government efforts aimed to boost disposable incomes in rural India including higher allocations to the National Rural Employment Guarantee Scheme (NREGS), farm loan waivers and higher minimum support prices (MSPs).
Exhibit 32: Correlation of FMCG growth to Agri GDP growth and GDP growth Agri GDP (%) GDP Y-o-Y (%) FMCG Y-o-Y (%)
FY03 -7.2 3.8 -2.0FY04 10.0 8.5 3.5FY05 0.0 7.5 8.0FY06 5.8 9.5 9.8FY07 4.0 9.7 17.8FY08 4.9 9.0 16.1FY09 1.6 6.7 16.0 Source: Company, ICICIdirect.com Research
Conversely, with the scarcity in monsoons further aggravating the rise in agri-commodity prices such as sugar, edible oil and honey, we believe the company would have to undertake price increases in order to pass on any rise in the cost of these raw materials and ease pressure on margins. However, since sugar and edible oils, (which are mainly affected by drought like situations), constitute only 3.5% and 13.7% of total raw material cost, DIL’s input basket will be less vulnerable to inflationary pressures. Additionally, given the company’s ability to manage cost pressures effectively, we expect the company to effectively combat inflation and protect margins.

ICICIdirect.com | Equity Research
1 9 | P a g e
Risks & Concerns
Delay in retail foray The company, which had planned to establish 350 retail stores of minimum store area of 700 sq ft and maximum area of 6000 sq ft over a period of five years, has trimmed down expansion plans due to severe financial pressures faced by the retail industry. The company has opened nine stores and is fine-tuning the format, location strategy and the rental costs of the stores to reflect the fall in real estate prices. However, the velocity of sales expected has been adversely impacted, thereby pressurising margins. Any significant losses incurred can subsequently impact earnings. Foreign currency risks Since a significant portion of the company’s revenues is earned in foreign currencies, any expansion into new geographies exposes them to additional foreign currency risks associated with such diversification. Deficient monsoons Depending on the severity of the monsoon deficiency, the company (which derives around 50% of its revenues from rural areas) can be significantly impacted on account of a slowdown in rural spending. Inflationary pressures Key raw materials for the company, which include edible oils, sugar and crude, are susceptible to inflationary pressures. This is especially so with the shortfall in monsoons. Subsequently, any significant rise in them can hamper margins.

ICICIdirect.com | Equity Research
2 0 | P a g e
Financials Steady growth in sales
Sales in FY09 grew by 18.3% to Rs 2834.1 crore from Rs 2396.3 crore in FY08. This was on the back of robust volume growth in key categories such as toothpaste, hair care and foods especially in rural India. It was led by rural India along with the resurgence of the international business division. Going forward, we expect net sales to grow at a CAGR of 16.9% over FY09-11E from Rs 2834.1 crore in FY09 to Rs 3875.6 crore in FY11E. This will be led by new product launches and the company’s foray into skincare via the FCPL acquisition. The company is expected to benefit from a better distribution footprint and operational efficiencies. Exhibit 33: Consolidated revenue growth (Rs crore)
1899.62233.7
2396.3
2834.1
3267.9
3875.6
700
1200
1700
2200
2700
3200
3700
4200
FY06 FY07 FY08 FY09 FY10E FY11E
Source: Company, ICICIdirect.com Research
EBITDA margin to improve The EBITDA margin dipped to 16.6% in FY09 from 17.1% in FY08 mainly on account of severe inflation witnessed during the year. This was fuelled by the drastic rise in agri-commodity and crude oil prices. Going forward, however, we expect the EBITDA margin to improve to 17.4% in FY10E and 17.8% in FY11E. This will be on account of higher contributions from high margin businesses such as foods (CCD) and consumer health (CHD), a decline in some key input costs and the consolidation of FCPL’s skin care product portfolio.
Exhibit 34: EBITDA margin (%)
15.415.6
17.1
16.6
17.417.8
14.0
14.5
15.0
15.5
16.0
16.5
17.0
17.5
18.0
FY06 FY07 FY08 FY09 FY10E FY11E
Source: Company, ICICIdirect.com Research

ICICIdirect.com | Equity Research
2 1 | P a g e
Net profit to grow at 19.5% CAGR
The net profit has grown by 17.5% to Rs 390.8 crore in FY09 against Rs 333.8 crore in FY08 on the back of higher EBITDA margin led by higher contributions from fruit juices and skin care segment post the acquisition of FCPL. Going forward, we expect the bottomline to grow at a CAGR of 19.5% over FY09-11E to Rs 557.8 crore in FY11E mainly backed by sustainable EBITDA margin.
Exhibit 35: Net profit growth (Rs crore)
226.6282.2
333.8390.8
455.4
557.8
0.0
100.0
200.0
300.0
400.0
500.0
600.0
FY06 FY07 FY08 FY09 FY10E FY11E
Source: Company, ICICIdirect.com Research
Return ratios remain attractive Despite the company’s foray into retail, return ratios remain at attractive levels. In FY09, DIL’s ROCE and ROE dipped to 46.1% and 54.4%, respectively, due to the acquisition of FCPL. This resulted in funds being deposited in an escrow account for which the corresponding returns were not yet accruing to the company. Although we expect the return ratios to dip in FY10E on the back of retail losses we expect the company to sustain ratios in FY11E, once the FCPL consolidation is complete. Exhibit 36: Return ratios (%)
57.8 60.854.4
50.0 50.1
47.051.8
46.1 44.5 45.5
0.0
10.0
20.0
30.0
40.0
50.0
60.0
70.0
FY07 FY08 FY09 FY10E FY11E
ROE ROCE
Source: Company, ICICIdirect.com Research

ICICIdirect.com | Equity Research
2 2 | P a g e
Valuations Historically, the stock has traded in a range of 15-29x its one-year forward earnings. At the current market price of Rs 122, DIL is trading at 23.0x its FY10E EPS of Rs 5.3 and 19.1x its FY11E EPS of Rs 6.4. Although historically, DIL has traded at a discount to Hindustan Unilever (India’s largest FMCG Company), given DIL’s high growth rate, foray into new categories via synergistic acquisitions (Balsara and FCPL) and strong earnings visibility, we value the stock at 22.0x its FY11E EPS of Rs 6.4. This is on par with the multiple of HUL. With a renewed focus on the rapidly growing international, consumer health businesses and the acquisition of FCPL, we have assigned a fair value of Rs 142 per share.
Exhibit 37: P/E Band
40.0
60.0
80.0
100.0
120.0
140.0
160.0
180.0
Mar
-07
May
-07
Jul-0
7
Sep-
07
Nov
-07
Jan-
08
Mar
-08
May
-08
Jul-0
8
Sep-
08
Nov
-08
Jan-
09
Mar
-09
May
-09
Jul-0
9
Sep-
09
Nov
-09
Jan-
10
30x
25x
20x
15x
Source: Company, ICICIdirect.com Research
Exhibit 38: Peer Comparison (FY11E) Estimates FY11E Marico Dabur HLL Colgate NestleRevenue (Rs crore) 3135.9 3875.6 20397.8 2239.5 5931.8EPS(Rs) 4.6 6.4 12.2 29.4 76.9P/E(x) 19.3 19.1 21.2 20.5 28.6EV / EBITDA(x) 12.8 16.7 17.6 16.5 16.6Market cap / Sales(x) 1.6 2.8 2.7 3.6 3.4 Market Cap(Rs Crore) 5176.5 10958.5 56022.8 8200.0 20990.0EBITDA Margins (%) 11.9 17.8 15.9 20.7 20.6RoE (%) 36.5 48.9 98.6 135.4 128.0CMP (Rs) 89.0 122.0 260.0 603.0 2202.0 Source: Company, ICICIdirect.com Research, Bloomberg
Market cap to sales We compare DIL with its peers on a market cap to sales basis. The stock is trading at 2.8x its FY11E sales, which is at a 22% discount to Colgate’s market cap to sales and 17.6% discount to Nestlé’s market cap to sales. Volume growth from rural India is outpacing growth from that of urban India. Hence, we believe DIL, which derives 50% of its revenues from rural India and aggressively engages in new launches, would be able sustain its growth momentum. Subsequently, we believe DIL should command a market cap to sales multiple of 3.2x, which translates to a fair value of Rs 142 per share.

ICICIdirect.com | Equity Research
2 3 | P a g e
Exhibit 39: Market cap to sales band
0.0
20.0
40.0
60.0
80.0
100.0
120.0
140.0
160.0
180.0
200.0Ap
r-05
Aug-
05
Dec-
05
Apr-0
6
Aug-
06
Dec-
06
Apr-0
7
Aug-
07
Dec-
07
Apr-0
8
Aug-
08
Dec-
08
Apr-0
9
Aug-
09
Dec-
09
3.7x
2.8x
1.9x
1x
4.6x
Source: Company, ICICIdirect.com Research
Using the DCF methodology, we have arrived at a fair value per share of the stock at Rs 146 based on a WACC of 11% and terminal growth of 4%. We are initiating coverage on the stock with a PERFORMER rating.
Exhibit 40: WACC Calculation (%) Beta 0.48Risk free rate 8.0%Market return 15.0%Risk Premium 7.0%Required Rate of Return (Cost of Equity) 11.4%Cost of Debt 10.0%After Tax Cost of Debt 8.6%WACC 11.0% Source: Company, ICICIdirect.com Research
Exhibit 41: Sensitivity to terminal growth & WACC Terminal Growth(%) 3.3 3.5 4.0 4.3 4.6WACC9.0 190.7 197.0 211.4 219.7 229.010.0 160.0 164.2 173.7 179.0 184.811.0 137.5 140.4 146.9 150.6 154.512.0 120.2 122.4 127.1 129.6 132.413.0 106.6 108.2 111.7 113.6 115.6
Source: Company, ICICIdirect.com Research

ICICIdirect.com | Equity Research
2 4 | P a g e
Profit & loss account (Rs Crore) Year End March FY07 FY08 FY09 FY10E FY11E
Revenues 2233.7 2396.3 2834.1 3267.9 3875.6 Raw Material Cost 971.1 1115.4 1376.2 1584.6 1893.0 Staff Cost 166.7 199.3 234.7 259.9 304.2 Administrative & Selling Cost 560.4 476.2 569.7 549.4 644.4 Other Operational Cost 155.2 166.5 158.8 293.4 285.1 Total Expenditure 1853.4 1957.4 2339.4 2687.3 3126.7 EBITDA 343.2 403.7 466.1 563.5 675.3 Growth (%) 17.6 15.5 20.9 19.8 EBITDA margins (%) 15.6 17.1 16.6 17.4 17.8 Other Income 25.9 34.0 46.8 35.0 33.0 Interest 15.4 11.8 23.2 14.3 14.0 Depreciation 34.3 36.4 44.9 45.6 46.6 Profit before tax 319.5 384.4 444.8 523.5 626.8
Tax 37.3 50.7 54.0 83.2 89.9 Net Profit 282.2 333.8 390.8 455.4 557.8 EPS 3.3 3.9 4.5 5.3 6.4 EPS growth (%) 17.9 16.9 16.4 22.5
Balance sheet (Rs crore)
Year End March FY07 FY08 FY09 FY10E FY11E
Equity Capital 86.3 86.4 86.5 86.5 86.5 Reserves & Surplus 393.3 531.2 732.3 914.4 1137.6 Net Worth 479.6 617.6 818.8 1001.0 1224.1 Total Loans 159.9 99.2 227.6 246.7 252.5 Deferred Tax Liability 25.9 27.3 30.5 22.3 26.3 Minority Interest 4.5 4.8 4.6 6.6 7.3 Total Capital employed 669.8 748.8 1081.5 1276.5 1510.2 Gross Block 617.2 729.7 858.5 1008.5 1058.5 Depreciation 238.1 264.4 299.3 345.0 391.5 Net Block 379.2 465.3 559.2 663.5 667.0 Capital Work in Progress 0.0 0.0 0.0 40.0 40.0 Investment 80.7 203.7 347.0 265.0 275.0 Inventories 257.1 302.5 375.5 432.8 506.9 Debtors 142.0 172.3 177.9 270.5 338.0 Cash 60.7 76.6 148.4 68.2 61.6 Loans and Advances 180.7 222.5 249.0 315.6 422.4 Deferred Tax Asset 1.4 24.0 23.5 8.0 6.0 Total Current assets 640.5 773.9 950.8 1087.1 1328.9 Creditors 352.5 452.6 475.8 631.2 633.7 Other Current Liabilities 99.3 279.5 331.9 158.8 173.8 Miscellaneous Expenses 19.8 14.0 8.6 2.8 0.8 Total Current Liabilities 451.8 732.1 807.6 790.0 807.5 Net Current Assets 188.7 41.8 143.2 297.2 521.4 Total capital deployed 669.8 748.8 1081.5 1276.5 1510.2

ICICIdirect.com | Equity Research
2 5 | P a g e
Cash flow (Rs crore)
Year End March FY07 FY08 FY09 FY10E FY11E
Profit before tax 319.5 384.4 444.8 538.5 647.7 Depreciation 34.3 36.4 47.4 45.6 46.6 Other items 16.3 17.7 9.4 29.5 22.7 Change in working capital -63.3 23.9 -94.7 -234.2 -230.9 Direct taxes paid -81.6 -80.4 -84.8 -97.5 -103.8
Net cash from operating Activities (A) 225.2 382.1 322.2 281.9 382.3
Purchase of fixed Assets -51.3 -124.8 -166.4 -190.0 -50.0 Purchase/Sale of investment -27.4 -112.4 -84.6 82.0 -10.0 Interest and dividend received 0.0 0.0 0.0 0.0 0.0 Net cash used in investing activity (B) -78.7 -237.2 -251.1 -108.0 -60.0 Borrowings 39.6 -62.6 -0.1 19.1 5.7 Dividend paid -176.8 -66.5 -129.7 -273.2 -334.7 Other Items 0.2 0.1 0.1 0.0 0.0 Net Cash used from Financing Activity (C ) -137.0 -129.0 0.68 -254.1 -329.0 Net increase/decrease 9.5 15.9 71.9 -80.2 -6.6 Op bal cash & cash equivalents 51.2 60.7 76.6 148.4 68.2 Closing cash/ cash equivalent 60.7 76.5 148.4 68.2 61.6
Ratios
Year End March FY07 FY08 FY09 FY10E FY11E
EBITDA Margins (%) 15.6 17.1 16.6 17.4 17.8 Net Profit Margins (%) 12.8 14.1 13.9 14.0 14.7 RoCE (%) 47.0 51.8 46.1 44.5 45.5 RoE (%) 57.8 60.8 54.4 50.0 50.1 Debt/Equity(x) 0.33 0.16 0.28 0.25 0.21 RM/Sales (%) 29.0 30.8 33.1 39.0 36.5 Employee cost/sales (%) 7.6 8.4 8.4 8.0 8.0 EPS(Rs) 3.3 3.9 4.5 5.3 6.4
CEPS(Rs) 3.7 4.3 5.0 5.8 7.0
P/E(x) 36.9 31.2 27.1 23.0 19.1 P/BV(x) 22.0 17.1 12.9 10.5 8.6 EV/EBITDA(x) 31.0 26.2 22.8 19.1 15.9 DuPont Analysis PAT/PBT 0.9 0.9 0.9 0.8 0.9 PBT/PBIT 1.1 1.0 1.1 1.0 1.0 PBIT/Sales 0.1 0.2 0.2 0.2 0.2 Sales/Assets 3.6 3.2 3.3 3.2 3.6 Assets/Net worth 1.3 1.2 1.0 1.0 0.9
ICICIdirect.com | Equity Research
2 6 | P a g e
RATING RATIONALE ICICIdirect.com endeavours to provide objective opinions and recommendations. ICICIdirect.com assigns ratings to its stocks according to their notional target price vs. current market price and then categorises them as Outperformer, Performer, Hold and Underperformer. The performance horizon is two years unless specified and the notional target price is defined as the analysts' valuation for a stock. Outperformer (OP): 20% or more; Performer (P): Between 10% and 20%; Hold (H): +10% return; Underperformer (U): -10% or more; Pankaj Pandey Head – Research [email protected]
ICICIdirect.com Research Desk, ICICI Securities Limited, 7th Floor, Akruti Centre Point, MIDC Main Road, Marol Naka, Andheri (E) Mumbai – 400 093
ANALYST CERTIFICATION We /I, Sanjay Manyal MBA (Finance), Ritika Shewakramani PGDF research analysts, authors and the names subscribed to this report, hereby certify that all of the views expressed in this research report accurately reflect our personal views about any and all of the subject issuer(s) or securities. We also certify that no part of our compensation was, is, or will be directly or indirectly related to the specific recommendation(s) or view(s) in this report. Analysts aren't registered as research analysts by FINRA and might not be an associated person of the ICICI Securities Inc.
Disclosures: ICICI Securities Limited (ICICI Securities) and its affiliates are a full-service, integrated investment banking, investment management and brokerage and financing group. We along with affiliates are leading underwriter of securities and participate in virtually all securities trading markets in India. We and our affiliates have investment banking and other business relationship with a significant percentage of companies covered by our Investment Research Department. Our research professionals provide important input into our investment banking and other business selection processes. ICICI Securities generally prohibits its analysts, persons reporting to analysts and their dependent family members from maintaining a financial interest in the securities or derivatives of any companies that the analysts cover.
The information and opinions in this report have been prepared by ICICI Securities and are subject to change without any notice. The report and information contained herein is strictly confidential and meant solely for the selected recipient and may not be altered in any way, transmitted to, copied or distributed, in part or in whole, to any other person or to the media or reproduced in any form, without prior written consent of ICICI Securities. While we would endeavour to update the information herein on reasonable basis, ICICI Securities, its subsidiaries and associated companies, their directors and employees (“ICICI Securities and affiliates”) are under no obligation to update or keep the information current. Also, there may be regulatory, compliance or other reasons that may prevent ICICI Securities from doing so. Non-rated securities indicate that rating on a particular security has been suspended temporarily and such suspension is in compliance with applicable regulations and/or ICICI Securities policies, in circumstances where ICICI Securities is acting in an advisory capacity to this company, or in certain other circumstances.
This report is based on information obtained from public sources and sources believed to be reliable, but no independent verification has been made nor is its accuracy or completeness guaranteed. This report and information herein is solely for informational purpose and may not be used or considered as an offer document or solicitation of offer to buy or sell or subscribe for securities or other financial instruments. Though disseminated to all the customers simultaneously, not all customers may receive this report at the same time. ICICI Securities will not treat recipients as customers by virtue of their receiving this report. Nothing in this report constitutes investment, legal, accounting and tax advice or a representation that any investment or strategy is suitable or appropriate to your specific circumstances. The securities discussed and opinions expressed in this report may not be suitable for all investors, who must make their own investment decisions, based on their own investment objectives, financial positions and needs of specific recipient. This may not be taken in substitution for the exercise of independent judgement by any recipient. The recipient should independently evaluate the investment risks. The value and return of investment may vary because of changes in interest rates, foreign exchange rates or any other reason. ICICI Securities and affiliates accept no liabilities for any loss or damage of any kind arising out of the use of this report. Past performance is not necessarily a guide to future performance. Investors are advised to see Risk Disclosure Document to understand the risks associated before investing in the securities markets. Actual results may differ materially from those set forth in projections. Forward-looking statements are not predictions and may be subject to change without notice.
ICICI Securities and its affiliates might have managed or co-managed a public offering for the subject company in the preceding twelve months. ICICI Securities and affiliates might have received compensation from the companies mentioned in the report during the period preceding twelve months from the date of this report for services in respect of public offerings, corporate finance, investment banking or other advisory services in a merger or specific transaction. ICICI Securities and affiliates expect to receive compensation from the companies mentioned in the report within a period of three months following the date of publication of the research report for services in respect of public offerings, corporate finance, investment banking or other advisory services in a merger or specific transaction. It is confirmed that Sanjay Manyal MBA (Finance), Ritika Shewakramani research analysts and the authors of this report have not received any compensation from the companies mentioned in the report in the preceding twelve months. Our research professionals are paid in part based on the profitability of ICICI Securities, which include earnings from Investment Banking and other business.
ICICI Securities or its subsidiaries collectively do not own 1% or more of the equity securities of the Company mentioned in the report as of the last day of the month preceding the publication of the research report.
It is confirmed that Sanjay Manyal MBA (Finance), Ritika Shewakramani research analysts and the authors of this report or any of their family members does not serve as an officer, director or advisory board member of the companies mentioned in the report.
ICICI Securities may have issued other reports that are inconsistent with and reach different conclusion from the information presented in this report. ICICI Securities and affiliates may act upon or make use of information contained in the report prior to the publication thereof.
This report is not directed or intended for distribution to, or use by, any person or entity who is a citizen or resident of or located in any locality, state, country or other jurisdiction, where such distribution, publication, availability or use would be contrary to law, regulation or which would subject ICICI Securities and affiliates to any registration or licensing requirement within such jurisdiction. The securities described herein may or may not be eligible for sale in all jurisdictions or to certain category of investors. Persons in whose possession this document may come are required to inform themselves of and to observe such restriction.
This report has not been prepared by ICICI Securities, Inc. However, ICICI Securities, Inc. has reviewed the report and, in so far as it includes current or historical information, it is believed to be reliable, although its accuracy and completeness cannot be guaranteed.