rs n is ta - virginia tech
TRANSCRIPT

PPPR #!Final Report
February 2021
Source:
Examining Seniors
Adaptation to Mixed Function
Automated Vehicles Analysis
of Naturalistic Driving Data

Disclaimer The contents of this report reflect the views of the authors, who are responsible for the facts and the accuracy of the information presented herein. This document is disseminated in the interest of information exchange. The report is funded, partially or entirely, by a grant from the U.S. Department of Transportation’s University Transportation Centers Program. However, the U.S. Government assumes no liability for the contents or use thereof.

TECHNICAL REPORT DOCUMENTATION PAGE
1. Report No. 03-040
2. Government Accession No.
3. Recipient’s Catalog No.
4. Title and Subtitle Examining Seniors’ Adaptation to Mixed Function Automated Vehicles: Analysis of Naturalistic Driving Data
5. Report Date February 2021
6. Performing Organization Code:
7. Author(s) Dan Liang1 Jonathan F. Antin, Ph.D., CHFP2 Nathan K. Lau, Ph. D1. Kelly E. Stulce2
8. Performing Organization Report No. Project Safe-D 04-103
9. Performing Organization Name and Address: Safe-D National UTC
Industrial and Systems Engineering, Virginia Tech Virginia Tech Transportation Institute 3500 Transportation Research Plaza Blacksburg VA 24060
10. Work Unit No. 11. Contract or Grant No. 69A3551747115/[ Project 04-103
12. Sponsoring Agency Name and Address Office of the Secretary of Transportation (OST) U.S. Department of Transportation (US DOT)
13. Type of Report and Period Final Research Report 14. Sponsoring Agency Code
15. Supplementary Notes This project was funded by the Safety through Disruption (Safe-D) National University Transportation Center, a grant from the U.S. Department of Transportation – Office of the Assistant Secretary for Research and Technology, University Transportation Centers Program. 16. Abstract The study examined whether advanced driver assistance systems (ADAS) can benefit the mobility and driving performance of senior drivers. Two groups of driving data, collected separately from two naturalistic driving projects, were examined. The Second Strategic Highway Research Program and the Examining Seniors’ Adaptation to Mixed Function Automated Vehicles project databases were used to compare measurements of mobility and driving performance. Mobility analyses did not yield significant differences between seniors who drove conventional vehicles and those who drove ADAS-equipped vehicles. As to driving performance, three analyses were conducted to address different research interests. Results indicated that ADAS-equipped vehicles influence seniors’ driving performance both in positive as well as negative ways. Seniors generally displayed better speed management performance while driving the ADAS-equipped vehicles. Using adaptive cruise control (ACC) may help seniors reduce the frequency and level of higher g-force accelerations. However, poorer lateral control performance was observed during trips where ACC was used. The study is the first to investigate the influence of ADAS on the mobility and driving performance of seniors in real-world traffic and road environments.
17. Key Words Senior drivers, Advanced Driver Assistance Systems (ADAS), naturalistic driving study (NDS), mobility, driving performance
18. Distribution Statement No restrictions. This document is available to the public through the Safe-D National UTC website, as well as the following repositories: VTechWorks, The National Transportation Library, The Transportation Library, Volpe National Transportation Systems Center, Federal Highway Administration Research Library, and the National Technical Reports Library.
19. Security Classif. (of this report) Unclassified
20. Security Classif. (of this page) Unclassified
21. No. of Pages 31
22. Price $0

ii
Abstract The study examined whether advanced driver assistance systems (ADAS) can benefit the mobility and driving performance of senior drivers. Two groups of driving data, collected separately from two naturalistic driving projects, were examined. The Second Strategic Highway Research Program 2 and the Examining Seniors’ Adaptation to Mixed Function Automated Vehicles project databases were used to compare measurements in mobility and driving performance. Mobility analyses did not yield significant differences between seniors who drove conventional vehicles and those who drove ADAS-equipped vehicles. As to driving performance, three analyses were conducted to address different research interests. Results indicated that ADAS-equipped vehicles influence seniors’ driving performance both in positive as well as negative ways. Seniors generally displayed better speed management performance while driving the ADAS-equipped vehicles. Using adaptive cruise control (ACC) may help seniors reduce the frequency and level of higher g-force accelerations. However, poorer lateral control performance was observed during trips where ACC was used. The study is the first to investigate the influence of ADAS on the mobility and driving performance of seniors in real-world traffic and road environments.
Acknowledgements The authors gratefully acknowledge Dr. Zac Doerzaph, Director, Safe-D. The authors would like to thank Christine Link-Owens, Anne Deekens, Anne Hall, and Kristen Swedberg for recruitment coordination, and Jessica Rardin and Spencer Annis for technical support. Gratitude is extended to Safe-D UTC for its support of this effort and to the National Surface Transportation Center for Excellence (NSTSCE) for its support. Specifically, Leslie Harwood and Melissa Hulse provided considerable assistance. Further, thanks are extended to Dr. Suzanne Lee, Julie Cook, Andy Petersen, David Tollefson, Shannon Skerrett, Carri Edmiston, Lisa Eichelberger, Julie Rutledge, Miguel Perez, Jeremy Sudweeks, Doug McGraw, Brian Daily, Phil Lambert, Vikki Fitchett, Scott Tidwell, Sharmin Quesenberry, Mikki Huff, and Gail Radford.
This project was funded by the Safety through Disruption (Safe-D) National University Transportation Center, a grant from the U.S. Department of Transportation – Office of the Assistant Secretary for Research and Technology, University Transportation Centers Program, and the National Surface Transportation Safety Center for Excellence (NSTSCE).

iii
Table of Contents
TABLE OF CONTENTS .......................................................................................................III
LIST OF FIGURES ................................................................................................................ V
LIST OF TABLES .................................................................................................................. V
INTRODUCTION ................................................................................................................. 1
Research Objectives .................................................................................................................................................... 2
BACKGROUND ................................................................................................................... 2
Mobility ........................................................................................................................................................................ 2
Longitudinal Control Assistance ................................................................................................................................ 2
Lateral Control Assistance.......................................................................................................................................... 3
METHOD ............................................................................................................................. 3
Method Overview ........................................................................................................................................................ 3
Description of Data ...................................................................................................................................................... 4 Video Views ............................................................................................................................................................. 5 ADAS Status Tracking in SMX ................................................................................................................................ 5 Vehicle Data ............................................................................................................................................................. 6
Analysis ......................................................................................................................................................................... 6 Dependent Measures ................................................................................................................................................. 6
RESULTS .............................................................................................................................. 8
Mobility Analysis ......................................................................................................................................................... 8
Driving Performance Analysis .................................................................................................................................... 9 Comparison of Senior Driving Between SHRP 2_PENN and SMX ........................................................................ 9 Comparison Between Trips in SMX without and with ACC Engaged ................................................................... 11 Comparison of Trips in SHRP 2_PENN Without ACC and SMX Using ACC ...................................................... 13
DISCUSSION ..................................................................................................................... 15

iv
Mobility Analysis ....................................................................................................................................................... 16
Lateral Control Performance ................................................................................................................................... 16
Longitudinal Control Performance .......................................................................................................................... 17
Limitations of the Study ............................................................................................................................................ 18
CONCLUSIONS AND RECOMMENDATIONS ................................................................. 19
ADDITIONAL PRODUCTS ................................................................................................ 20
Education and Workforce Development Products ................................................................................................. 20
Technology Transfer Products ................................................................................................................................. 20
Data Products ............................................................................................................................................................. 20
REFERENCES ..................................................................................................................... 21
DEMOGRAPHIC BREAKDOWN OF PARTICIPANTS IN SMX BY COHORT AND VEHICLE ASSIGNMENT.................................................................................................... 25
ADAS SETTINGS FOR FOUR MANUFACTURERS ........................................................... 26
DEMOGRAPHICS OF STATE COLLEGE, PA, AND BLACKSBURG, VA ........................... 27
SHRP 2 VIDEO VIEW ........................................................................................................ 28
SMX VIDEO VIEWS ........................................................................................................... 29
DATA ACQUISITION SYSTEM (DAS) CHANNELS ......................................................... 30
CHARACTERIZATION OF SMX NATURALISTIC DATA COLLECTION .......................... 31

v
List of Figures Figure 1. Images of video recorded dashboards for the SMX dataset, car manufacturers in clockwise from upper left: AUDI, INFINITI, VOLVO, and MERCEDES. .................................. 5
Figure 2. Boxplot of variance in acceleration magnitudes across lateral events (left) and number of longitudinal acceleration events/km (right) of SHRP 2_PENN and SMX. .............................. 10
Figure 3. Boxplot of number of longitudinal deceleration events/km (left) and variance in acceleration/deceleration magnitudes across longitudinal events (right) of SHRP 2_PENN and SMX. ............................................................................................................................................. 11
Figure 4. Boxplot of number of longitudinal acceleration events/km (left) and max longitudinal acceleration (right) for trips in SMX without and with ACC engaged. ....................................... 13
Figure 5. Boxplot of number of lateral events/km for trips in SHRP 2_PENN without ACC and in SMX with ACC engaged. ............................................................................................................. 15
Figure 6. Boxplot of number of longitudinal acceleration events/km(left) and number of longitudinal deceleration/km (right) for trips in SHRP 2_PENN without acc and in SMX with ACC engaged. ............................................................................................................................... 15
List of Tables Table 1. SHRP 2_PENN and SMX Data Subsets ........................................................................... 4
Table 2. Sample Size for Key Measurements from SHRP 2_PENN and SMX ............................. 4
Table 3. Measurements for Mobility Analysis ............................................................................... 7
Table 4. Descriptive Statistics of Mobility Measurements ............................................................. 8
Table 5. Mobility Analysis Statistical Results. Sample Size of 30 Participants for the SHRP 2_PENN and 18 for SMX Datasets ................................................................................................ 9
Table 6. Descriptive Statistics of Metrics Comparing Driving Performance: SHRP 2_PENN vs SMX .............................................................................................................................................. 10
Table 7. Statistical Comparisons of Driving Performance: SHRP 2_PENN vs. SMX. Sample Size of 30 participants for SHRP 2_PENN and 18 for SMX dataset ................................................... 10
Table 8. Descriptive Statistics of Measurements on SMX Trips between Not Using and Using ACC....................................................................................................................................................... 12
Table 9. Comparison of Trips Between ACC Disengaged and Engaged in SMX. Sample Size of 494 Trips for ACC Disengaged and 34 for Engaged .................................................................... 12

vi
Table 10. Descriptive Statistics for Measures Comparing Driving Performance Between Trips Driven by Conventional Vehicles in SHRP 2_PENN vs. Trips in SMX Using ACC .................. 14
Table 11. Tests Results for Comparison between Trips in SHRP 2_PENN and Trips in SMX. Sample Size of 11,536 Trips for SHRP 2_PENN and 34 for SMX with ACC Engaged ............. 14

1
Introduction Life expectancy in the U.S. is projected to grow from 79.7 years in 2017 to 85.6 in 2060, resulting in both a higher number and proportion of seniors aged 65 and over in the population [1]. The number of seniors (65+) is projected to reach 94.7 million in 2060 and comprise over 23% of the U.S. population [1]. The current number of licensed drivers over 65 is over 42 million, representing 18% of drivers [2], and seniors are expected to comprise an even greater proportion of the total driving population than they do today. This growth raises concerns about potential impacts on traffic safety. Compared to younger drivers, seniors are more vulnerable in a vehicle crash, with 60% to 95% higher death rates per mile. This is in large part due to their higher fragility [3]. In addition, the overall crash involvement rate per 100 million miles starts to increase for drivers in their sixties [4]. This elevated crash rate is partly due to age-related declines or impairments in visual, cognitive, and physical functioning. The medical conditions that are common in seniors, such as cataracts, presbyopia, and arthritis, also influence their performance behind the wheel.
Emerging advanced driver assistance systems (ADAS), like adaptive cruise control (ACC), blind spot alert (BSA), lane keeping assist (LKA), and lane departure warning (LDW) have the potential to assist senior drivers by compensating for their age-related declines [5][6], thus expanding mobility and fostering independence [7][8]. For example, BSA may help to address the difficulty seniors have checking for vehicles in the blind spot due to decreased range of motion in the head and neck. ACC and forward collision warning may help prevent failures in perceiving and responding to hazards in a timely fashion due to declines in attention or cognitive perception. Also, ACC and LKA may help to reduce fatigue during long-distance driving [9]. However, the purported benefits of ADAS for senior drivers still require confirmatory study, as introducing automation could significantly modify driving tasks and drivers’ interaction with the vehicle. The resulting effects can be different from, or even opposite to, the design purpose of the ADAS [10].
The current project has been conducted in two phases. The completed Phase Ⅰ included the collection of participants’ self-reported attitudes toward ADAS and data from a naturalistic driving study (NDS). The NDS data included video and sensor data from 18 seniors aged 70–79, each of whom drove one of four vehicles equipped with ADAS for 6 weeks. This dataset also includes a variety of self-reported data, including pre- and post-exposure questionnaires, a weekly phone interview during the driving period, and focus group responses concerning trust, usage, and acceptance of ADAS conducted after the driving period. Phase Ⅰ analysis results revealed that seniors’ attitudes towards ADAS improved with exposure, and identified that adequate time for orientation and appropriate user documentation to be key factors driving acceptance [11]–[13].
The goal of the current Phase Ⅱ effort was to evaluate how ADAS influence the mobility and driving performance of senior drivers. Though the design intention of ADAS includes supporting or entirely supplanting specific driving tasks to improve safety, these advanced features inherently

2
modify or disrupt the traditional interaction between driver and vehicle. Therefore, the actual effects on driving performance and safety may not reflect the intended purpose [10]. Human factors in automation also make the actual effect difficult to predict; for example, drivers may overly rely on the system [14], resulting in difficulties resuming control when needed [15].
Research Objectives This study has three research objectives:
1. To determine how driving with ADAS-equipped vehicles affects seniors’ mobility. 2. To examine how driving with ADAS-equipped vehicles influences seniors’ driving
performance. 3. To examine how using ADAS influences seniors’ driving performance.
Background Prior research shows the potential benefits of ADAS on maintaining seniors’ mobility and how specific longitudinal and lateral control assistance systems influence driving performance.
Mobility Senior drivers tend to reduce their overall driving exposure [16] and avoid driving in risky conditions (e.g., at night, during rush hour, on high-speed roads, and over long-distance trips [17][18]). Senior drivers were reported to generally travel shorter distances than younger drivers [19]. Such voluntary driving reductions are considered self-regulatory behaviors that seniors adopt to mitigate the risk associated with age-related declines or medical issues, such as declining vision ([18][19]). Although self-regulatory behaviors among senior drivers may be beneficial in avoiding crashes, the continuation of driving is important to their independence and quality of life [20][21]. One alternative for keeping seniors safe without sacrificing mobility is to provide assistive driving technology. Researchers have suggested that ADAS have the potential to improve the safety and mobility of senior drivers by enabling them to drive more safely and with less fatigue [5][22].
Longitudinal Control Assistance Longitudinal control assistance systems regulate speed and maintain following distance from a lead vehicle. Two common longitudinal control assistance systems are ACC and braking assist. Longitudinal control assistance systems aim to improve drivers’ comfort, convenience, and safety. Many studies have examined how those aims might be realized in seniors’ driving using driving simulators or under natural driving conditions. However, the influence of these systems on safety is inconclusive. A simulator study in England observed that participants (including seniors) showed decreased workload and stress when ACC was activated [23]. Another simulator study investigated how ACC impacted driving performance for two groups of participants: “older drivers” over 60 and “younger drivers” aged 60 and under. The study found that using ACC improved seniors’ speed control in simulated free-flow traffic conditions, built-up areas, and low

3
speed limit areas [24]. Braking assist was found to increase stopping distance in scenarios requiring emergency braking [25]. Potentially negative effects have also been reported during ACC usage, such as shorter minimum headways, harder braking [26], braking more often than necessary [27], greater lane position deviation [28], and increased secondary task engagement [29].
Lateral Control Assistance Lateral control assistance systems are designed to assist with lane keeping and lane change maneuvering, thereby preventing unplanned lane drift, reducing run-off-road or other lane-deviation driven events and crashes. LKA, LDW, lane change assist (LCA), and active steering assist (AS) are examples that have been widely implemented in consumer vehicles. Multiple studies have evaluated how lateral control assistance systems influence driving performance and safety. An on-road study found better lane keeping performance while dialing the phone when LDW was on [30]. A naturalistic study investigated 78 participants (including 26 seniors) driving a study vehicle with a road departure warning system (similar to LDW) for over 83,000 miles and showed that, with the system active, participants exhibited fewer lane deviation incidents, less frequent lane excursions, and smaller variation in lane position. Participants drove closer to the center of the lane and used the turn signal more often before changing lanes or making a turn [31]. Another study found more active visual scanning of the environment based on a wider range of eye movements when the LKA was activated in the Honda intelligent driver support system [32].
Method
Method Overview We evaluated how using ADAS influences seniors’ mobility and driving performance by analyzing data from two NDSs: (1) Examining Senior Drivers’ Adaptation to Mixed Function Automated Vehicles (SMX) [13], and (2) the Second Strategic Highway Research Program (SHRP 2) [33], focusing on the senior portion of the sample recruited at State College, Pennsylvania.
SMX recruited 18 naïve users of ADAS (9 females and 9 males) aged 70 to 79 from the Blacksburg, Virginia, area to drive VTTI-provided study vehicles (2015 Infiniti Q50, 2017 Audi Q7, 2016 Volvo XC90, and 2016 Mercedes E350) equipped with ADAS for 6 weeks. Appendix A documents the demographics of the participant sample by cohort and vehicle fleet. Appendix B documents the ADAS capabilities and settings for each model of study vehicle. SMX collected naturalistic driving data on seniors driving ADAS-equipped vehicles to study the influence of ADAS on seniors’ mobility, driving performance, and safety [13].
SHRP 2 was the largest full-scale NDS ever conducted. It focused on the collection of crash-event data [33]. Participants were recruited from six sites across the United States: Buffalo, New York; Tampa, Florida; Seattle, Washington; Durham, North Carolina; Bloomington, Indiana; and State College, Pennsylvania. The six sites only defined the location of recruitment, administrative work, and vehicle installation facilities. The actual driving occurred in the

4
neighboring areas or, in some cases, far away from the sites. More than 3,500 drivers aged 16 to 98 were enrolled in the study for planned periods of 1 to 2 years. Participants drove their personal vehicles, which were typically cars without ADAS.
For the purpose of attaining comparable samples of senior drivers between the two studies, the SHRP 2 sample analyzed in the current study included only those participants aged 70–79 (N = 30, 16 males and 14 females) driving non-ADAS-equipped vehicles in State College (herein denoted as SHRP 2_PENN). The SHRP 2 dataset was drawn exclusively from the State College site, as this was the only one of the six sites that was very similar to the SMX data collection site, Blacksburg, Virginia. Both are college towns in which students, employees, and retirees from the public, land-grant research university represent a majority of the populations. The economic activities also revolve around a university. The demographics of population, age, education, transportation, and economy of the two towns suggest their similarity (Appendix C).
Description of Data SHRP 2 and SMX both collected driving and vehicle data through a data acquisition system (DAS) that included several unobtrusive cameras and other sensors. Table 1 and 2 summarize the datasets of the two studies respectively.
Table 1. SHRP 2_PENN and SMX Data Subsets
SHRP 2 _PENN SMX Participant Subsets N=30 (Male=16, Female=14) N=18 (Male=9, Female=9)
Age Groups Range=70–79, Mean=74.43, SD=3.45 Range=70–79, Mean=74.00, SD=2.85 Recruitment Sites State College, Pennsylvania Blacksburg, Virginia
Total Trips Available for Analysis
43,314 39,542 after removing invalid trips*
2,118 1,983 after removing invalid trips
Study Duration per Participant
Mean=88.57 weeks, SD= 35.32, range=16.99 to 140.14 weeks
6 weeks
Kilometers Traveled 376,292.98 23,026.35 * Invalid trip: the trips with mean speed in km/h = 0 / NA, distance in km = 0 / NA, or start hour = NA.
Table 2. Sample Size for Key Measurements from SHRP 2_PENN and SMX
SHRP 2 _PENN SMX Lateral events
(|g-force of lateral acceleration or deceleration| ≥ 0.3g) 27,543 2,894
Longitudinal acceleration events (g-force of longitudinal deceleration ≥ 0.3g) 5,987 2,265
Longitudinal deceleration events (g-force of longitudinal deceleration ≤ −0.3g) 26,407 982
Trips with ACC being engaged NA 252 Trips with no ACC being engaged 39,542 1,731
Trips over 10 minutes 11,536 645 Trips over 10 minutes with no ACC being engaged 11,536 494
Trips using ACC (ACC engaged over 50% of trip duration) NA 35
Trips over 10 minutes and using ACC NA 34
5
SMX and SHRP 2 provide greatly different sample sizes due to the nature of the two projects. Parametric Welch’s T and non-parametric Mann-Whitney-Wilcoxon tests were conducted to infer significant differences between experimental conditions (i.e., driver groups). The Welch’s T test is generally robust to unequal sample size with fairly moderate inflation of Type 1 error rate [35][36]. For this reason, the alpha error rate was set to .025 for all Welch’s T tests. The Mann-Whitney-Wilcoxon tests appear to be less robust to unequal sample size [37][38]; however, better alternative statistics are not available. Therefore, the alpha error rate was set to .005 for all Mann-Whitney-Wilcoxon tests to manage Type 1 error rate. The impact of unequal sample size on power is not discussed as equivalence testing is not part of our analysis.
Video Views SHRP 2 and SMX both installed cameras in the cabin to record the forward and rear roadways and the driver from different angles (see examples of SHRP 2 camera views in Appendix D and SMX camera views in Appendix E).
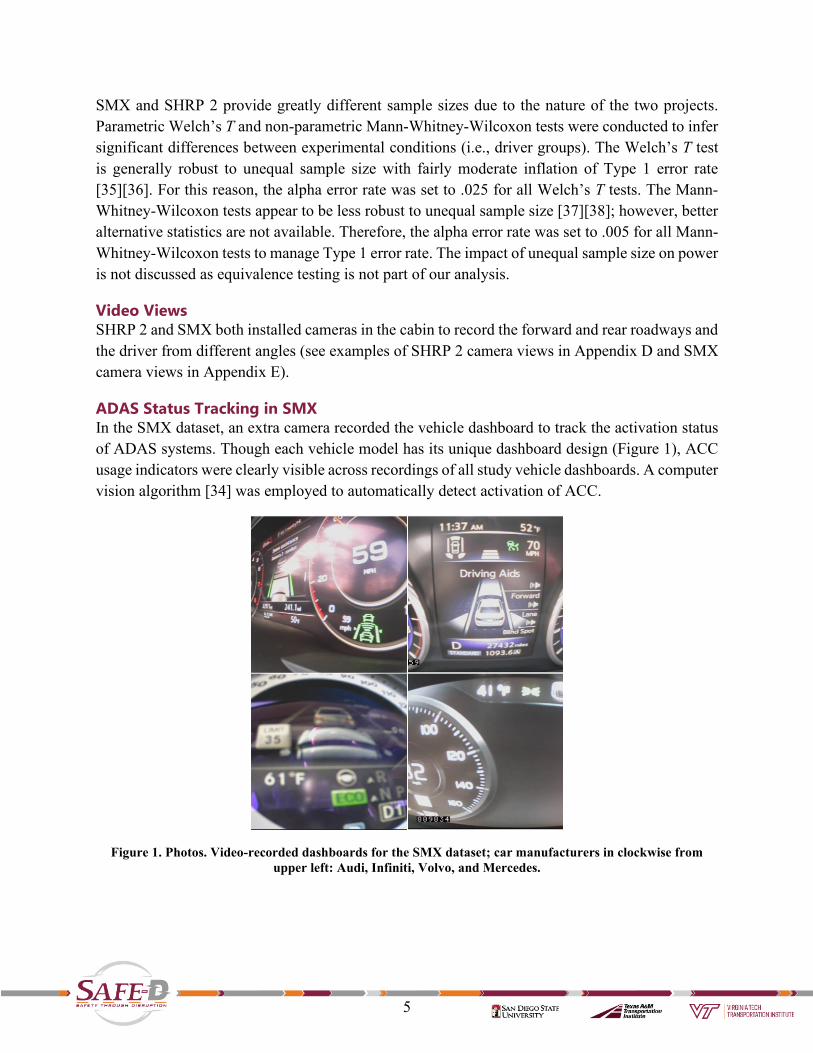
ADAS Status Tracking in SMX In the SMX dataset, an extra camera recorded the vehicle dashboard to track the activation status of ADAS systems. Though each vehicle model has its unique dashboard design (Figure 1), ACC usage indicators were clearly visible across recordings of all study vehicle dashboards. A computer vision algorithm [34] was employed to automatically detect activation of ACC.
Figure 1. Photos. Video-recorded dashboards for the SMX dataset; car manufacturers in clockwise from
upper left: Audi, Infiniti, Volvo, and Mercedes.

6
Vehicle Data The DAS collected various vehicle and trip data from the vehicle network, GPS, and other sensors that provided a robust context for analysis of driving performance (see Appendix F for details on the DAS data channels).
Analysis Mobility was evaluated in terms of (1) overall driving exposure and (2) driving patterns to answer the research question:
1. How does driving with an ADAS-equipped vehicle influence the types of trips driven by seniors (e.g., when they drive, how long they drive)?
Driving performance was assessed through vehicle lateral and longitudinal acceleration or deceleration to answer two research questions:
1. How does driving with an ADAS-equipped vehicle influence seniors’ driving performance? This was addressed by comparing seniors who drove without ADAS in SHRP 2_PENN versus seniors who drove with ADAS-equipped vehicles in SMX (without accounting for usage of each feature).
2. How does using ACC influence seniors’ driving performance by comparing: a. seniors’ driving trips using ACC vs. trips not using ACC, with both groups taken
from the SMX data collection. b. seniors’ driving in trips in which ACC was not available (i.e., taken from the
SHRP 2 dataset) versus trips using ACC taken from the SMX dataset.
Note that trips included in these two comparisons only refer to those over 10 minutes in duration because low-speed, short-distance driving would be less likely to involve ACC. “Using ACC” refers to ACC being engaged for over half the trip duration to eliminate trips where there was not substantial usage of the technology, but still leave us with a sufficient number of trips to analyze; “not using ACC” refers to ACC being disengaged for the entire trip duration or not being available in the vehicle. The SMX dataset contains a total of 196 trips of duration over 10 minutes, and 34 trips out of the 196 (17.35%) were identified as trips “using ACC.” For the other 162 (82.65%) trips, drivers activated ACC accumulatively for less than half the trip time.
Dependent Measures Mobility The mobility analysis employed the number of trips per week and distance driven in kilometers per week for comparing overall driving exposure. The percentage of trips during nighttime, percentage of trips during rush hour traffic, percentage of long-distance trips, and percentage of trips on high-speed roads were used for comparing driving patterns. Trips driving on high-speed roads were defined as trips with mean speeds of 85 km/h and higher. Though the speed limits on U.S. highways range from about 90 to 130 km/h (55–80 mph), the mean speeds of most trips in the two datasets were below this range because all trips contained driving prior to and after

7
driving on the highway. For practical purposes, trips with a mean speed above 85 km/h should contain substantial highway driving; ([39] also adopted 85 km/h as the threshold of defining trips involving highway driving.) Table 3 lists other measures in the mobility analysis.
Table 3. Measurements for Mobility Analysis
Measure of Interest Description Number of trips/week Total number of trips driven divided by total number of weeks
Distance (km) driven/week Total distance in kilometers driven divided by weeks Percentage of trips during nighttime Percentage of trips driven during nighttime (9 p.m.–6 a.m.)
Percentage of trips during rush hour traffic Percentage of all trips driven during rush hours (7 a.m.–9 a.m. or 4 p.m.–7 p.m.)
Percentage of long-distance trips Percentage of trips of 100 km or over Percentage of trips on high-speed roads Percentage of trips traveled at speeds of 85 km/h or higher *
* Used as a proxy for trips of driving on the highway.
Driving Performance The data collected to assess the effects of ADAS on seniors’ driving performance include a series of processed vehicle acceleration and deceleration data. The description and justification for each measurement are discussed in the following paragraphs.
Lateral Control Performance Number of lateral events per kilometer – number of lateral acceleration occurrences of greater than |0.3|g divided by total kilometers. Acceleration in the lateral direction highly correlates with steering wheel input; for example, sudden lateral maneuvering is an indicator that a vehicle is drifting off the lane center. Fewer lateral events indicate better lateral control performance.
Variance in acceleration magnitudes across lateral events – average squared differences from the mean of all acceleration and deceleration of all lateral events in each trip. Large lateral accelerations are correlated with the magnitude to which the vehicle is off-track. Variance in acceleration magnitudes across lateral events indicates correction of lateral position. Smaller values of this measure show that the seniors drive more cautiously or less erratically, thus indicating better lateral control performance.
Maximum lateral acceleration – maximum value of lateral acceleration in a trip. This indicates the magnitude of correction in the lateral position. Larger values indicate poorer performance.
Longitudinal Control Performance Number of longitudinal acceleration events per kilometer – number of longitudinal acceleration occurrences of greater than 0.3g divided by the total kilometers. This measurement highly correlates with the drivers’ throttle behavior. Large longitudinal acceleration indicates rapid or hard acceleration. More such events indicating aggressive, unsafe driving, or at the very least, wasteful and fuel-inefficient driving.
Number of longitudinal deceleration events per kilometer – number of longitudinal deceleration occurrences of lower than −0.3g divided by the total kilometers. This measurement highly

8
correlates with drivers’ braking behavior. Braking more frequently than necessary indicates poorer performance or driving habits.
Variance in acceleration/deceleration magnitudes across longitudinal events – average squared differences from the mean of all longitudinal acceleration or deceleration values of all longitudinal events in each trip. A large magnitude of longitudinal acceleration or deceleration correlates with incidents of hard braking or rapid acceleration; larger variance indicates poorer performance. Variance in longitudinal acceleration events indicates drivers’ speed management, with smaller values of this measure indicating better performance.
Maximum longitudinal acceleration –maximum value of acceleration in the longitudinal direction in a trip. This indicates the magnitude of rapid acceleration, with larger values implying a tendency toward rapid acceleration, thus indicating poorer performance or driving habits.
Maximum longitudinal deceleration – maximum value of deceleration in the longitudinal direction in a trip. This is an indicator of the magnitude of hard braking. Larger values imply the tendency to brake forcefully, thus indicating poorer performance or driving habits.
Results
Mobility Analysis Table 4 and Table 5 present descriptive statistics of the measurements for mobility analysis. The team conducted Welch t-tests to compare the SHRP 2_PENN and SMX participant groups on number of trips/week, distance driven/week, percentage of trips during rush hours, and percentage of trips on high-speed roads. Due to the violation of the normality assumption, Mann-Whitney-Wilcoxon tests were conducted to compare the distribution of percentage of night trips and percentage of long-distance trips of seniors between SHRP 2_PENN and SMX. The tests did not reveal any significant results (Table 6).
Table 4. Descriptive Statistics of Mobility Measurements: SHRP 2_PENN
Measure N Mean SE Mean SD Median Number of trips/week 30 18.9649 1.9529 10.6966 18.7156
Distance driven (km)/week 30 172.3008 19.5701 107.1899 135.1798 Percentage of trips during rush hour 30 34.5847 0.0128 0.0701 35.0726
Percentage of trips at night 30 3.7360 0.0066 0.0362 2.1650 Percentage of long-distance trips 30 1.1296 0.0022 0.0119 0.7847
Percentage of trips on high-speed roads 30 4.1872 0.0091 0.0497 2.5479

9
Table 5. Descriptive Statistics of Mobility Measurements: SMX
Measure N Mean SE Mean SD Median Number of trips/week 18 18.3611 1.7905 7.5963 16.4167
Distance driven (km)/week 18 213.2070 23.3169 98.9253 210.8085 Percentage of trips during rush hour 18 37.0387 0.0214 0.0909 37.5504
Percentage of trips at night 18 2.1196 0.0060 0.0254 1.1971 Percentage of long-distance trips 18 1.8098 0.0056 0.0236 0.9059
Percentage of trips on high-speed roads 18 5.5812 0.0110 0.0467 5.3826
Table 6. Mobility Analysis Statistical Results (Sample Size: 30 for SHRP 2_PENN, 18 for SMX)
Measure Test Statistics Degrees of Freedom P-Value Number of trips/week T = −0.23 44 0.59
Distance driven (km)/week T = 1.34 38 0.09 Percentage of trips during rush hours T = 0.98 29 0.17
Percentage of night trips U = 351.50 - 0.97 Percentage of long-distance trips U = 440.00 - 0.51
Percentage of trips on high-speed roads T = 0.98 37 0.17 Note: T = Welch’s t-test; U = Mann-Whitney-Wilcoxon test
Driving Performance Analysis Comparison of Senior Driving Between SHRP 2_PENN and SMX Table 7 and Table 8 present descriptive statistics of the kinematic measurements for assessing driving performance. The team conducted t-tests to compare the driving performance of seniors in SMX and SHRP 2_PENN in terms of the means of number of lateral events/km, variance in acceleration magnitudes across lateral events, and variance in acceleration/deceleration magnitudes across longitudinal events. Due to severe violation of the normality assumption of the t-test, Mann-Whitney-Wilcoxon tests were conducted to compare seniors between SMX and SHRP 2_PENN in terms of the distribution of number of longitudinal acceleration events/km and number of longitudinal deceleration events/km.
Compared to seniors driving conventional vehicles, seniors who drove ADAS-equipped vehicles showed significant differences in four driving performance behaviors (Table 9):
1. Variance in acceleration magnitudes across lateral events: The Welch’s t-test, T(32.15) = 24.49, p < .001(Figure 2), revealed that seniors in SMX (mean = 0.0105, SD = 0.0034) showed significantly less variance of lateral acceleration events than the seniors in SHRP 2_PENN (mean = 0.0960, SD = 0.0186).
2. Number of longitudinal acceleration events per kilometer: A Mann-Whitney-Wilcoxon test, U = 106, p < .001 (Figure 2), revealed that the number of longitudinal acceleration events per kilometer is larger for SMX seniors (median = 0.0658) than those of SHRP 2_PENN seniors (median = 0.0040).
3. Number of longitudinal deceleration events per kilometer: Seniors in SMX exhibited significantly more longitudinal deceleration events per kilometer (median = 0.0090) than seniors in SHRP 2_PENN did (median = 0.0523), U = 412, p = .002 (Figure 3).

10
4. Variance in acceleration/deceleration magnitudes across longitudinal events: Seniors in SMX had smaller variance of longitudinal acceleration events (mean = 0.0166, SD = 0.0036) compared to seniors in SHRP 2_PENN (mean = 0.0470, SD = 0.0395) (Figure 3), T(29.80) = 4.19, p < .001.
Table 7. Descriptive Statistics of Metrics Comparing Driving Performance: SHRP 2_PENN
Measure N Mean SE Mean SD Median Number of lateral events/km 30 0.0750 0.0131 0.0718 0.0559
Variance in acceleration magnitudes across lateral events 30 0.0960 0.0034 0.0186 0.1010 Number of longitudinal acceleration events/km 30 0.0157 0.0052 0.0283 0.0040 Number of longitudinal deceleration events/km 30 0.0682 0.0114 0.0627 0.0523
Variance in acceleration/deceleration magnitudes across longitudinal events
30 0.0470 0.0072 0.0395 0.0290
Table 8. Descriptive Statistics of Metrics Comparing Driving Performance: SMX
Measure N Mean SE Mean SD Median Number of lateral events/km 18 0.1199 0.0222 0.0941 0.1088
Variance in acceleration magnitudes across lateral events 18 0.0105 0.0008 0.0034 0.0091 Number of longitudinal acceleration events/km 18 0.0864 0.0202 0.0858 0.0658 Number of longitudinal deceleration events/km 18 0.0408 0.0169 0.0718 0.0090
Variance in acceleration/deceleration magnitudes across longitudinal events
18 0.0166 0.0008 0.0036 0.0160
Table 9. Driving Performance: SHRP 2_PENN vs. SMX (Sample Size: 30 for SHRP 2_PENN, 18 for SMX)
Measure Test Statistics Degrees of Freedom P-Value Number of lateral events/km T = −1.74 28.88 0.09
Variance in acceleration magnitudes across lateral events T = 24.49 32.15 <.001 Number of longitudinal acceleration events/km U = 106 - <.001 Number of longitudinal deceleration events/km U = 412 - 0.002
Variance in acceleration/deceleration magnitudes across longitudinal events T = 4.19 29.80 <.001
Note: T = Welch’s t-test; U = Mann-Whitney-Wilcoxon test
Figure 2. Boxplots. Variance in acceleration magnitudes across lateral events (left) and number of
longitudinal acceleration events/km (right) of SHRP 2_PENN and SMX.

11
Figure 3. Boxplots. Number of longitudinal deceleration events/km (left) and variance in
acceleration/deceleration magnitudes across longitudinal events (right) of SHRP 2_PENN and SMX.
Comparison Between Trips in SMX without and with ACC Engaged Table 10 and Table 11 present descriptive statistics comparing driving performance in trips from the SMX dataset with and without ACC engaged. Note that all trips in the comparison have a duration above 10 minutes. Due to the limited number of trips using ACC in SMX, the analysis could not control for road type, traffic density, or other factors. Welch’s T-tests were conducted to compare trips with and without ACC in terms of mean maximum longitudinal acceleration and minimum longitudinal deceleration. Due to violation of assumptions, Mann-Whitney-Wilcoxon tests were conducted to compare the distribution of number of lateral events/km, number of longitudinal acceleration events/km, and number of longitudinal deceleration events/km. The other two measurements, variance in acceleration magnitude across lateral events and variance in acceleration/deceleration magnitude across longitudinal events, are not available for every trip in SHRP 2_PENN and SMX; thus the two measurements were not compared. (Note that the unit of an observation in this analysis is a trip rather than a participant.)
Compared to seniors driving with ACC disengaged, those who drove with ACC engaged showed two significantly different driving performance behaviors (Table 9):
1. Number of longitudinal acceleration events/km: Fewer longitudinal acceleration events per kilometer were observed among the trips using ACC in SMX (median = 0.0000) than not using ACC (median = 0.0718; Figure 4), and the Mann-Whitney-Wilcoxon test revealed that the difference is significant (U = 11,488, p < .001).
2. Max longitudinal acceleration: The t-test revealed that the trips using ACC in SMX had significantly smaller max longitudinal acceleration (mean = 0.3523, SD = 0.0913) than the trips not using ACC (mean = 0.3908, SD = 0.0941), T(37.99) = 2.37, p = .02 (Figure 4).

12
Table 10. Descriptive Statistics of Measurements on SMX Trips Not Using ACC
Measure N Mean SE Mean SD Median Number of lateral events/km 494 0.1688 0.0101 0.2254 0.0900
Max lateral acceleration 494 0.4578 0.0038 0.0851 0.4524
Number of longitudinal acceleration events/km 494 0.1357 0.0088 0.1945 0.0718
Number of longitudinal deceleration events/km 494 0.0353 0.0045 0.0990 0.0000 Max longitudinal acceleration 494 0.3908 0.0042 0.0941 0.3944 Max longitudinal deceleration 494 0.3027 0.0042 0.0923 0.2900
Table 11. Descriptive Statistics of Measurements on SMX Trips Using ACC
Measure N Mean SE Mean SD Median
Number of lateral events/km 34 0.0798 0.0147 0.0859 0.0473
Max lateral acceleration 34 0.4567 0.0135 0.0786 0.4553
Number of longitudinal acceleration events /km 34 0.0342 0.0112 0.0656 0.0000
Number of longitudinal deceleration events/km 34 0.0162 0.0054 0.0312 0.0000
Max longitudinal acceleration 34 0.3523 0.0157 0.0913 0.3494 Max longitudinal deceleration 34 0.3232 0.0148 0.0861 0.2973
Table 12. Comparison of Trips Between ACC Disengaged and Engaged in SMX (Sample Size: 494 for ACC Disengaged and 34 for Engaged).
Measure Test Statistics df P-Value
Number of lateral events/km U = 9,724 - 0.12
Max lateral acceleration T = 0.08 38.52 0.93
Number of longitudinal acceleration events/km U = 11,488 - <0.001
Number of longitudinal deceleration events/km U = 8,013 - 0.56
Max longitudinal acceleration T = 2.37 37.99 0.02 Max longitudinal deceleration T = 1.33 38.41 0.19
Note: T = Welch’s t-test; U = Mann-Whitney-Wilcoxon test

13
Figure 4. Boxplots. Number of longitudinal acceleration events/km (left) and max longitudinal acceleration
(right) for trips in SMX without and with ACC engaged.
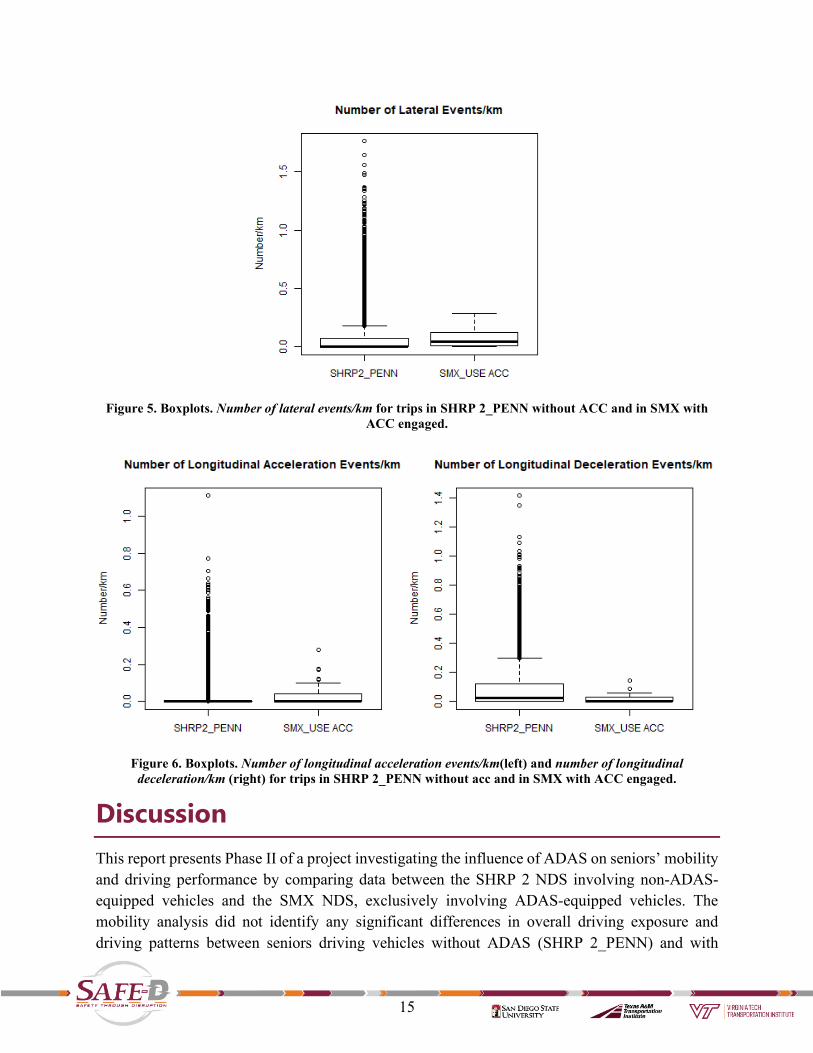
Comparison of Trips in SHRP 2_PENN Without ACC and SMX Using ACC Table 13 and Table 14 present descriptive statistics comparing driving performance in trips over 10 minutes in duration between seniors without ACC in SHRP 2_PENN and seniors with ACC engaged in SMX. This comparison highlights whether the impact of using ACC on longitudinal and lateral control observed in the SMX dataset might be comparable against driving performance in the SHRP 2 dataset. Given the non-normal distribution, Mann-Whitney-Wilcoxon tests were conducted to compare the distributions of number of lateral events/km, number of longitudinal acceleration events/km, and number of longitudinal deceleration events/km. However, max lateral acceleration, max longitudinal acceleration, and max longitudinal deceleration are not included in this comparison due to limited access to the SHRP 2_PENN dataset. Because variance in lateral acceleration events and variance in longitudinal acceleration/deceleration events are not available for every trip, these are not included in the comparisons.
Compared to seniors driving without ACC available from the SHRP 2_PENN dataset, seniors who drove with ACC engaged from the SMX dataset showed three significantly different driving performance behaviors (Table 15):
1. Number of lateral events/km: The Mann-Whitney-Wilcoxon test, U =115,901, p < .001 (Figure 5), revealed that SHRP 2_PENN trips (median = 0.0000) contained fewer lateral events per kilometer than SMX trips with ACC engaged (median=0.0473).
2. Number of longitudinal acceleration events/km: The number of longitudinal acceleration events per kilometer in SHRP 2_PENN trips and SMX trips using ACC are significantly different with the Mann-Whitney-Wilcoxon test (U = 140,712, p < .001) despite having identical medians (0.0000). Vargha and Delaney’s A reports the probability that a value from one group will be stochastically equal to that of the other group. An A value of 0.50

14
indicates that the two groups are stochastically equal. An A value of 1 indicates that the first group shows complete stochastic domination over the other group, and a value of 0 indicates complete stochastic domination by the second group. Given equal medians across the two datasets, we computed Vargha and Delaney’s A1, which was 0.36, to indicate the higher domination of trips with ACC engaged in SMX over trips without ACC in SHRP 2_PENN with respect to longitudinal acceleration events per kilometer (Figure 6).
3. Number of longitudinal deceleration events/km: The Mann-Whitney-Wilcoxon test, U = 257,890, p < .001(Figure 6), revealed that more longitudinal deceleration events per kilometer were observed in SHRP 2_PENN trips (median = 0.0244) than SMX trips with ACC (median = 0.0000).
Table 13. Descriptive Statistics for Measures Comparing Driving Performance: Conventional Vehicles in SHRP 2_PENN
Measure N Mean SE Mean SD Median Number of lateral events/km 11,536 0.0644 0.0014 0.1474 0.0000
Number of longitudinal acceleration events/km 11,536 0.0166 0.0006 0.0622 0.0000 Number of longitudinal deceleration events/km 11,536 0.0824 0.0012 0.1247 0.0244
Table 14. Descriptive Statistics for Measures Comparing Driving Performance: SMX Using ACC
Measure N Mean SE Mean SD Median Number of lateral events/km 34 0.0798 0.0147 0.0859 0.0473
Number of longitudinal acceleration events/km 34 0.0342 0.0112 0.0656 0.0000 Number of longitudinal deceleration events/km 34 0.0162 0.0054 0.0312 0.0000
Table 15. Tests Results for Comparison between Trips in SHRP 2_PENN and Trips in SMX (Sample Size: 11,536 Trips for SHRP 2_PENN and 34 for SMX with ACC Engaged).
Measure Test Statistics P-Value Number of lateral events/km U =115,901 <.001
Number of longitudinal acceleration events/km U =140,712 <.001 Number of longitudinal deceleration events/km U =257,890 <.001
Note: U =Mann-Whitney-Wilcoxon Test
15
Figure 5. Boxplots. Number of lateral events/km for trips in SHRP 2_PENN without ACC and in SMX with ACC engaged.
Figure 6. Boxplots. Number of longitudinal acceleration events/km(left) and number of longitudinal
deceleration/km (right) for trips in SHRP 2_PENN without acc and in SMX with ACC engaged.
Discussion This report presents Phase II of a project investigating the influence of ADAS on seniors’ mobility and driving performance by comparing data between the SHRP 2 NDS involving non-ADAS-equipped vehicles and the SMX NDS, exclusively involving ADAS-equipped vehicles. The mobility analysis did not identify any significant differences in overall driving exposure and driving patterns between seniors driving vehicles without ADAS (SHRP 2_PENN) and with

16
ADAS (SMX). However, some significant differences in lateral and longitudinal acceleration suggest that ADAS may exert a complex influence on the driving performance of seniors.
Mobility Analysis Between seniors in SHRP 2_PENN and seniors in SMX, the statistical analyses did not reveal any significant difference in overall driving exposure and driving patterns in the proportion of driving at night, in rush hour, over long distances, and on high-speed roads. There are several explanations for this finding. First, the mobility of seniors in both groups may be a non-issue, as the participants in both studies may have been relatively healthy, without any need to moderate or improve their driving exposure and pattern in any way (i.e., seniors concerned with driving would unlikely volunteer for either study.) Second, the senior participants may require more time to adapt to the new technology, so the influence of ADAS on SMX participants to alter their driving habits would be limited due to the short 6-week study period. Third, there could be unknown and thus uncontrolled factors between the two datasets that may mask the influence of ADAS on the senior drivers. Though not revealing significant results, this study is the first to investigate the influence of ADAS on seniors’ self-regulation of driving using objective naturalistic driving data.
Lateral Control Performance Seniors who drove ADAS-equipped vehicles (SMX) had smaller variance in acceleration magnitudes across lateral events than seniors who drove conventional vehicles without ADAS (SHRP 2_PENN). Smaller variance indicates fewer large-magnitude corrections, thus suggesting more stability and better lateral control performance for seniors driving the ADAS-equipped vehicles. In an NDS investigating driving performance with a road departure crash warning (which is similar to LDW in the SMX study), participants (including seniors) also exhibited better lateral control of the vehicle, including reduced instances of lane deviation and decreased range of lane positions [31]. The finding observed in our analysis must be interpreted with caution as better lateral control performance is only associated with vehicles equipped with ADAS and not associated with a specific ADAS feature (or a combination of features).
In our focused examination of the influence of ACC on driving performance, there were more lateral events per kilometer for SMX trips when ACC was engaged than when it was disengaged. For this analysis we only sampled trips that were longer than 10 minutes in duration, and ACC was considered to be engaged when it was on for more than 50% of the trip duration. Thus, this finding indicates that ACC might in some way hinder lateral control performance. A note of caution for this finding is that the analysis did not control for other ADAS possibly being engaged during the SMX trips. One explanation for the decline in lateral control performance is over-reliance on ACC, which entices drivers to attend to secondary tasks rather than to the road, affecting their diligence in maintaining lane position [23]. A test-track study found that ACC induced behavioral adaptation that included higher engagement in secondary tasks and resulted in longer hazard detection time and increased lane position variability [28]. Another explanation is that motor control behaviors for longitudinal and lateral control in driving might be highly

17
connected, such that alleviating attention on one aspect of a motor control task might implicitly hinder attention on another aspect. Thus, drivers might need substantial adaptation time to optimize attention and motor control for partial automation as past experience commonly involved synchronous lateral and longitudinal control.
The two findings on lateral control performance indicate that the influence of ADAS on senior drivers could be complex and challenging to delineate. On one hand, the high-level analysis of SMX seniors driving ADAS-equipped vehicles revealed better lateral control than SHRP 2_PENN participants aged 70–79 driving vehicles without any ADAS. On the other hand, usage-based analysis revealed that driving with ACC engaged resulted in poorer lateral vehicle control than driving with ACC disengaged. A number of factors may have contributed to such results. As mentioned, the lateral control performance gain cannot be fully attributed to the ADAS in the comparison between the SHRP 2_PENN and SMX data, as the two datasets differ beyond just the use of ADAS; other disparate factors include traffic environment and car models. Further, other ADAS, particularly LKA and LDW, have been shown to affect lateral vehicle control [30] [31], but could not be controlled in our analysis. Given research findings in the literature and this study, new vehicle models equipped with ADAS may improve lateral control. However, appropriate use of ADAS remains a fundamental requirement, as engaging ACC may result in a decrement in attention to the primary driving task. Such negative behavioral adaptation after introducing ACC has been explained by “risk homeostasis” theory, which claims that drivers have a mentally preset level of risk and a tendency toward assuming other risky behaviors that offset the expected reduction in risk afforded by the introduction of safety measures [40][41]. Further research is necessary to fully understand the effect of ADAS on lateral control.
Longitudinal Control Performance Seniors who drove ADAS-equipped vehicles in the SMX study exhibited smaller variance in acceleration/deceleration magnitude across longitudinal events than those who drove vehicles without ADAS in the SHRP 2_PENN study. Thus, vehicles equipped with ADAS may help seniors better manage their speed. Interestingly, seniors who drove ADAS-equipped vehicles in the SMX study experienced more longitudinal acceleration events and fewer longitudinal deceleration events than those who drove without ADAS in the SHRP 2_PENN study. One benefit of the ADAS-equipped vehicles with regard to speed management is presumably reducing hard braking, which can help with headway management. These findings are consistent with driving simulator studies, which also found improved speed control with less likelihood of exceeding the speed limit [24]. However, ADAS-equipped vehicles might not assist seniors with smooth acceleration. For example, ACC might not reduce the number of high-magnitude acceleration and deceleration events when following a lead vehicle. These findings should be interpreted with caution because confounding factors, such as road and traffic environment, as well as other familiarity with car dynamics, cannot be fully controlled in our analysis.

18
The examination into ACC usage generally indicates a positive influence on longitudinal vehicle control. In the SMX dataset, trips using ACC contained fewer and lower magnitude longitudinal acceleration events than those with ACC disengaged. The trips in our ACC examination had a duration over 10 minutes and thus likely involved driving on high-speed roads. In fact, the mean speed for the comparison of trips using ACC was 76.20 km/h (SD = 80.40). The results thus indicate that ACC may reduce the frequency of rapid acceleration events. In addition, fewer longitudinal deceleration events were found in trips using ACC in SMX than trips in SHRP 2 without ADAS. Thus, the results generally indicate that ACC could help seniors in speed management, reducing longitudinal acceleration and deceleration events. Compared to city or community roads, highways present simpler road conditions, with a higher frequency of straight road sections, generally less traffic, almost no traffic lights, and are generally better maintained. For these reasons, fewer speed adjustments are usually needed while driving on highways. Thus, the reduced number of acceleration or deceleration events in SMX trips when ACC was engaged cannot be fully attributed to the benefits of ACC.
The indication of improved longitudinal control with ACC may seem to be weakened by the statistical result that trips using ACC in the SMX dataset contained more longitudinal acceleration events than trips without any ADAS in the SHRP 2 dataset. This latter result should not hold the same weight, considering that additional confounding factors (e.g., road environment and traffic) that influence speed adjustment may be introduced when comparing trips collected from two locations. A deeper investigation into the two datasets and additional research are warranted to study differences in acceleration management between conventional vehicles and ACC-engaged driving. The benefit of ACC in reducing frequent and rapid acceleration may be due to the smooth acceleration of the ACC in maintaining the preset speed or headway that reduces unnecessary driver acceleration and deceleration. A detailed kinematic analysis to confirm this explanation is beyond the scope of this research. However, considering that seniors are not typically identified as risky drivers with the habit of aggressive acceleration, the identified benefit of ACC with regard to acceleration may have limited practical significance.
In the light of all the evidence, vehicles equipped with ADAS have more positive than negative influences on seniors’ performance given better lateral stability and speed management in the overall comparison to driving vehicles without any ADAS. As for ACC specifically, SMX seniors exhibited less rapid acceleration in the trips with ACC engaged than disengaged. However, there was a weak indication that ACC could negatively influence lateral controls; thus, the research and design of ACC concerning performance on lateral controls deserve attention.
Limitations of the Study The major limitation of the study is that researchers lack the control of extraneous factors that may compromise the validity of the analysis. This is owing to the nature of naturalistic driving research, in which participants drive as they normally would. In this research, the extraneous factors that might greatly influence dependent measures of driving performance include road and traffic

19
environment (e.g., traffic volume, curviness of the roadway, road surface condition), weather (e.g., wind, rain, or fog) and traffic laws at the data collection site. When participants drive in the natural road environment, those factors could greatly influence steering input, acceleration, or deceleration, which are dependent metrics for indicating driving performance in our study. Though we have tried to control those factors by using the data from the most demographically and geographically similar SHRP 2 collection site, State College, Pennsylvania, the influence of those extraneous factors may not be entirely ignored.
In addition to the road and traffic factors commonly seen in analysis of naturalistic driving data, learning and adaptation to novel ADAS systems or an unfamiliar study vehicle are other confounding factors. SMX participants drove a new and unfamiliar car, whereas SHRP 2 participants drove their own cars. It is an unknown whether SMX participants had reached their stable behaviors of driving with ADAS, while it is fairly certain that SHRP 2 participants were driving in a stable, normal fashion. The steering and speed management of the seniors in the SMX study could change beyond the 6-week driving period with additional exposure to ACC and LKA. Differing vehicle year-make-model combinations present another confounding factor. The study vehicles in SMX were relatively new and expensive models [13], which could potentially provide more powerful acceleration and better braking than vehicles in the SHRP 2 study. Therefore, controlling for more of the possibly confounding factors in future research will be useful.
The senior participants in SMX seem to be generally healthy and active, considering that they actively participated in the driving study, thus they may not necessarily be representative of the whole senior driving population. As with many studies, there was unavoidable self-selection bias given the recruitment constraints. In particular, participants may not have any issues with mobility; thus introducing ADAS would not result in any discernible increase in driving exposure.
Conclusions and Recommendations This study revealed the influence of ADAS on seniors’ driving performance to be complex. Using ACC may help seniors reduce the frequency of acceleration and avoid the tendency to rapidly accelerate. However, the use of ACC resulted in more lateral events, so we recommend that a longitudinal control system (ACC) be coupled with lateral control assistance such as LKA.
While this study did not yield any significant findings on the influence of ADAS on the mobility of senior drivers, future naturalistic studies should address this topic, with strategic sampling for self-regulatory behaviors, extending the study period to allow time for adaptation, and employing within-subject design to control for confounding factors.

20
Additional Products The Education and Workforce Development (EWD) and Technology Transfer (T2) products created as part of this project can be downloaded from the project page on the Safe-D website. The final project dataset is located on the Safe-D Collection of the VTTI Dataverse.
Education and Workforce Development Products This project provided case study teaching materials for an introductory graduate class, ISE 5604-Human Information Processing, and an undergraduate class, ISE 3614-Introduction to Human Factors Engineering. In both courses, the Safe-D-supported studies illustrate, using the example of driving, that exposure to ADAS can help seniors better accept and use such technologies, but their impact on mobility and safety for this population of users is still not fully known. This lesson from the study is particularly important for future generation engineers who need to develop more inclusive designs, particularly in support of aging populations, both in workplaces as well as personal settings.
Technology Transfer Products The research team published a journal article explicating analytic approaches of examining post-exposure focus group session (Liang, Lau, Baker, and Antin, 2020). These moderated discussions explored participants’ opinions regarding trust and safety associated with the ADAS.
In addition, the study team seized numerous opportunities to share study results with industry stakeholders and the public, including presentations by the principal investigator, Dr. Jon Antin, at the Eighth International Symposium on Naturalistic Driving Research, on August 13-14, 2019. In Melbourne, Australia, before the Oversight Committee for Use and Oversight of SHRP 2 Safety Data in December 2019, and at Warm Hearth Village in Blacksburg, Virginia. Dan Liang, the graduate student member of the study team, presented at the Future Active Safety Technology toward Zero Accidents (FAST-zero-‘19) conference on September 11, 2019 in Blacksburg, VA, and participated in a poster session with Diana Furchtgott-Roth, Deputy Assistant Secretary for Research and Technology OST-R September 11, 2019 in Blacksburg, Virginia, Ms. Liang, Dr. Antin, and her faculty adviser, Dr. Nathan Lau, published in the proceedings of the FAST – zero- ’19 conference.
Data Products The data collected as part of the field study are available via the Safe-D collection on the VTTI Dataverse at doi:10.15787/VTT1/CX4JLN. This study collected data from a sample of 18 senior drivers aged 70-77. The table below characterizes naturalistic driving data collected under the auspices of this research effort.

21
References [1] Medina, L., S. Sabo, and J. Vespa. Living Longer: Historical and Projected Life Expectancy in the United States, 1960 to 2060. Report Number P25-1145. U.S. Census, 2020.
[2] Highway Statistics 2016. www.fhwa.dot.gov/policyinformation/statistics/2016/. Accessed May 5, 2020.
[3] Kent, R., M. Trowbridge, F. J. Lopez-Valdes, R. H. Ordoyo, and M. Segui-Gomez. How Many People Are Injured and Killed as a Result of Aging? Frailty, Fragility, and the Elderly Risk-exposure Tradeoff Assessed via a Risk Saturation Model. In Annals of Advances in Automotive Medicine/Annual Scientific Conference, Vol. 53, 2009, pp. 41.
[4] Tefft, B. Rates of Motor Vehicle Crashes, Injuries and Deaths in Relation to Driver Age, United States, 2014-2015. AAA Foundation for Traffic Safety, 2017.
[5] Caird, J. In-vehicle Intelligent Transportation Systems. Transportation in an Aging Society, 2004, pp. 236.
[6] Davidse, R. J., M. P. Hagenzieker, P. C. van Wolffelaar, and W. H. Brouwer. Effects of In-car Support on Mental Workload and Driving Performance of Older Drivers. Human Factors, Vol. 51, No. 4, 2009, pp. 463–476.
[7] Koppel, S., J. L. Charlton, and B. Fildes. Distraction and the Older Driver. 2009.
[8] Koppel, S. N., and J. L. Charlton. Behavioural Adaptation and Older Drivers. CRC Press Boca Raton, 2013.
[9] Young, K. L., S. Koppel, and J. L. Charlton. Toward Best Practice in Human Machine Interface Design for Older Drivers: A Review of Current Design Guidelines. Accident Analysis Prevention, Vol. 106, 2017, pp. 460–467.
[10] Evans, L. Traffic Safety. Science Serving Society, 2004.
[11] Liang D., J. F. Antin, and N. Lau. Examining Senior Drivers’ Adaptation to Advanced Driver Assistance Systems. Proceedings of the 5th International Symposium on Future Active Safety Technology toward Zero Accidents (FAST-zero ’19), Blacksburg, VA, 2019.
[12] Liang, D., N. Lau, S. Baker, and J. F. Antin. Examining Senior Drivers’ Attitudes Towards Advanced Driver Assistance Systems after Naturalistic Exposure. Innovation in Aging, Vol. 4, No. 3, 2020, igaa017.

22
[13] Liang, D., J. F. Antin, N. Lau, K. E. Stulce, S. A. Baker, and B. Wotring. Examining Senior Drivers Adaptation to Mixed Level Automated Vehicles: A Naturalistic Study. Virginia Tech Transportation Institute, 2019.
[14] Parasuraman, R., and V. Riley. Humans and Automation: Use, Misuse, Disuse, Abuse Human Factors, Vol. 39, No. 2, 1997, pp. 230–253.
[15] Kaber, D. B., and M. R. Endsley. The Effects of Level of Automation and Adaptive Automation on Human Performance, Situation Awareness and Workload in a Dynamic Control Task. Theor. Issues Ergon. Sci., Vol. 5, 2004, No. 2, pp. 113–153.
[16] Molnar, L. J., and D. W. Eby. The Relationship Between Self-regulation and Driving-related Abilities in Older Drivers: An Exploratory Study. Traffic Injury Prevention, Vol. 9, 2008, No. 4, pp. 314–319.
[17] Benekohal, R. R. F., R. M. Michaels, E. Shim, and P. T. V Resende. Effects of Aging on Older Drivers’ Travel Characteristics. Transportation Research Record, 1994, No. 1438, pp. 91-98.
[18] Charlton, J. L., Oxley, J., Fildes, B., Oxley, P., Newstead, S., Koppel, S., & O’Hare, M. Characteristics of Older Drivers who Adopt Self-regulatory Driving Behaviour. Transportation Research Part F: Traffic Psychology and Behaviour, Vol. 9, 2006, No. 5, pp. 363–373.
[19] Land Transport Safety Authority. Travel Survey Report: Increasing Our Understanding of New Zealanders’ Travel Behaviour, 1997/1998. Land Transport Safety Authority, 2000.
[20] Charlton, J. L., S., M. Koppel, D. O'Hare, G. Andrea, G., B. Smith, B. Khodr, ... & B. Fildes. Influence of Chronic Illness on Crash Involvement of Motor Vehicle Drivers. Monash University Accident Research Centre Reports, (213), 482, 2004.
[21] Satariano, W. A., K. E. MacLeod, T. E. Cohn, and D. R. Ragland. Problems with Vision Associated with Limitations or Avoidance of Driving in Older Populations. The Journals of Gerontology Series B: Psychological Sciences and Social Sciences, Vol. 59, 2004, No. 5, pp. S281–S286.
[22] Perel, M. Helping Older Drivers Benefit from In-vehicle Technologies. In Proceedings of the 16th International Technical Conference on the Enhanced Safety of Vehicles, 1998, pp. 438–444.
[23] Stanton, N. A., and M. S. Young. Driver Behaviour with Adaptive Cruise Control. Ergonomics, Vol. 48, 2005, No. 10, pp. 1294–1313.
[24] Guo, W., P. T. Blythe, S. Edwards, K. Pavkova, and D. Brennan. Effect of Intelligent Speed Adaptation Technology on Older Drivers’ Driving Performance. IET Intelligent Transport Systems, Vol. 9, 2015, No. 3, pp. 343–350.

23
[25] Haberstroh, M., M. Klingender, R. Ramakers, and K. Henning. Criteria for Age Based Design of Active Vehicle Safety Systems. Automation, Communication and Cybernetics in Science and Engineering 2009/2010, Springer, 2011, pp. 495–506.
[26] Hoedemaker, M., and M. Kopf. Visual Sampling Behaviour when Driving with Adaptive Cruise Control. In Proceedings of the Ninth International Conference on Vision in Vehicles. Australia, 2001, pp. 19–22.
[27] Sayer, J. R., P. S. Fancher, Z. Bareket, and G. E. Johnson. Automatic Target Acquisition Autonomous Intelligent Cruise Control (AICC): Driver Comfort, Acceptance, and Performance in Highway Traffic. SAE Technical Paper, 1995.
[28] Rudin-Brown, C. M., and H. A. Parker. Behavioural Adaptation to Adaptive Cruise Control (ACC): Implications for Preventive Strategies. Transportation Research Part F: Traffic Psychology Behavior, Vol. 7, 2004, No. 2, pp. 59–76.
[29] Stanton, N. A., M. Young, and B. McCaulder. Drive-by-wire: The Case of Driver Workload and Reclaiming Control with Adaptive Cruise Control. Safety Science, Vol. 27, 1997, No. 2–3, pp. 149–159.
[30] Blaschke, C., F. Breyer, B. Färber, J. Freyer, and R. Limbacher. Driver Distraction Based Lane-keeping Assistance. Transportation Research Part F: Traffic Psychology Behavior, Vol. 12, 2009, No. 4, pp. 288–299.
[31] LeBlanc, D. Road Departure Crash Warning System Field Operational Test: Methodology and Results. Volume 1: Technical Report, 2006.
[32] Ishida., S and J. E. Gayko. Development, Evaluation and Introduction of a Lane Keeping Assistance System. Intelligent Vehicles Symposium, 2004 IEEE, 2004, pp. 943–944.
[33] Antin, J. F., S. Lee, M. A. Perez, T. A. Dingus, J. M. Hankey, and A. Brach. Second Strategic Highway Research Program Naturalistic Driving Study Methods. Safety Science, Vol. 119, 2019, pp. 2–10.
[34] Redmon, J., S. Divvala, R. Girshick, and A. Farhadi. You Only Look Once: Unified, Real-Time Object Detection. In Proceedings of the IEEE Conference on Computer Vision and Pattern Recognition, 2016, pp. 779–788.
[35] Ahad, N. A., & S. S. S. Yahaya. Sensitivity Analysis of Welch’s T-test. In AIP Conference Proceedings, Vol. 1605, 2014, No. 1, pp. 888–893. American Institute of Physics.
[36] Gibbons, J. D., & S. Chakraborti. Comparisons of the Mann-Whitney, Student’s T, and alternate T tests for Means of Normal Distributions. The Journal of Experimental Education, Vol, 59, 1991, No. 3, pp. 258–267.

24
[37] Shieh, G., S. L. Jan, & R. H. Randles. On Power and Sample Size Determinations for the Wilcoxon–Mann–Whitney Test. Journal of Nonparametric Statistics, Vol. 18, 2006, No. 1, pp. 33–43.
[38] Fagerland, M. W., & L. Sandvik. The Wilcoxon–Mann–Whitney Test Under Scrutiny. Statistics in Medicine, Vol. 28, 2009, No. 10, pp. 1487–1497.
[39] Molnar, L. J., J. L. Charlton, D. W. Eby, S. E. Bogard, J. Langford, S. Koppel, ... & M. Man-Son-Hing. Self-regulation of Driving by Older Adults: Comparison of Self-report and Objective Driving Data. Transportation Research Part F: Traffic Psychology and Behaviour, Vol. 20, 2013, 29–38.
[40] Wilde, G. J. S. The Theory of Risk Homeostasis: Implications for Safety and Health. Risk Analysis, Vol. 2, 1982, No. 4, pp. 209–225.
[41] Wilde, G. J. S. Notes on the Interpretation of Traffic Accident Data and of Risk Homeostasis Theory: A Reply to L. Evans. Risk Analysis, Vol. 6, 1986, No. 1, pp. 95–101.
[42] U. S. Bureau Census. U.S. Census Bureau QuickFacts: State College Borough, Pennsylvania. www.census.gov/quickfacts/statecollegeboroughpennsylvania. Accessed May, 5, 2020.
[43] U. S. Bureau Census. U.S. Census Bureau QuickFacts Blacksburg Town, Virginia. www.census.gov/quickfacts/blacksburgtownvirginia. Accessed May, 5, 2020.
[44] Campbell, K. L. The SHRP 2 Naturalistic Driving Study: Addressing Driver Performance and Behavior in Traffic Safety. Tr News, 2012, No. 282.

25
Appendix A
Demographic Breakdown of Participants in SMX by Cohort and Vehicle Assignment
Cohort 1 Cohort 2 Cohort 3
Year/Make/Model M F M F M F Total
2015 Infiniti Q50 0 1 2 0 1 1 5
2016 Volvo XC90 0 1 0 2 1 0 4
2016 Mercedes E350 1 1 1 0 1 1 5
2017 Audi Q7 1 1 0 1 1 0 4
Total 2 4 3 3 4 2 18
Age Distribution
Mean = 73
Range: 70–76
Mean = 72
Range: 71–77
Mean = 75
Range: 71–79
Mean = 74
Range: 70–79

26
Appendix B
ADAS Settings for Four Manufacturers Manufacturer BSA LA ACC LKA
Audi On Automatically, can adjust brightness
Have to activate (40+mph), steering, visual, and vibration
On automatically if enable cruise
control, cannot turn off, also have
automatic low-speed ACC
Have to activate (40+mph), steering,
visual, vibration
Infinity On Automatically, can adjust brightness
On automatically, chimes and visual
On automatically if tap cruise control
button, normal cruise if hold
Have to activate-chime, visual and steering input-can be set to high/low
intervention Mercedes On
Automatically On automatically (37+mph), visual
and vibration
On automatically if enable cruise
control, also have automatic low-
speed ACC
On automatically if cruise control is on (37+ mph) –visual,
vibration and steering (and
directional braking) Volvo On
Automatically On automatically
(30+mph) On automatically if
enable cruise control- can disable
On automatically (30+mph) – visual

27
Appendix C
Demographics of State College, PA, and Blacksburg, VA
Table 16. Demographics of State College, PA, and Blacksburg, VA [42] [43]
State College, PA
Blacksburg, VA
Population 42,352 44,678 Percentage of persons 65 years and over 5.5% 5.5%
Number of households 12,523 13,436 Bachelor’s degree or higher, percentage of persons age 25 years and
over 70.4% 70.9%
Mean travel time to work (minutes), workers age 16 years+ 15.4 14.6 Top employer Pennsylvania
State University Virginia Tech

28
Appendix D
SHRP 2 Video View
Figure 7. Screen capture. SHRP 2 camera views: forward view (upper left), the driver’s face (upper right),
downward view of drivers’ hands on the steering wheel (lower left), and rear view (lower right).

29
Appendix E
SMX Video Views
Figure 8. Screen capture. SMX camera views: forward view (upper left), the driver’s face (upper right),
downward view of the instrument panel and the drivers’ hands on the steering wheel (lower left), foot on the brake (middle right), and rear view (lower right).

30
Appendix F
Data Acquisition System (DAS) Channels Table 17. DAS Channels (Adapted from [44])
Data Acquisition System (DAS) Channels • Multiple videos • Machine vision
- Eye forward monitor - Lane tracker
• Accelerometer data (3 axis) • Rate sensors (3 axis) • GPS: latitude, longitude,
elevation, time, velocity • Forward radar
- X and Y positions - X and Y velocities
• Cell Phone - Automatic collision
notification, health checks, location notification
- Health checks, remote upgrades
• Illuminance sensor • Infrared illumination • Passive alcohol sensor • Incident push button-audio
(only on incident push button) • Turn signals
• Vehicle network data - Accelerator - Brake pedal activation - Automatic braking system - Gear position - Steering wheel angle - Speed Horn - Seat belt information - Airbag deployment - Many more variables

31
Appendix G
Characterization of SMX Naturalistic Data Collection
This study collected data from a sample of 18 senior drivers aged 70-77. The table below characterizes naturalistic driving data collected under the auspices of this research effort.
Summary of Data Collected
Item Count
Participants 18
Trips in Dataset 2,124
KM in Dataset 23,027.85
Night Trips (occurring between 9:00 PM and 6:00 AM) 43
Rush Hour Trips (occurring between 7:00 AM and 9:00 AM or 4:00 PM and 7:00 PM) 746
Long Distance Trips (≥100KM) 33
High Speed Trips (mean speed ≥ 85 kn/hr) 110