rsc article template (version 3.2) · web viewred blood cells squeeze through micro-capillaries as...
TRANSCRIPT
Lab on a Chip
Cite this: DOI: 10.1039/c0xx00000xwww.rsc.org/xxxxxx
Dynamic Article Links ►
FULL PAPERSqueezing red blood cells on an optical waveguide to monitor cell deformability during blood storage
Balpreet Singh Ahluwalia1 *, Peter McCourt2, Ana Oteiza2, James S. Wilkinson3, Thomas R. Huser4 and Olav Gaute Hellesø1Received (in XXX, XXX) Xth XXXXXXXXX 20XX, Accepted Xth XXXXXXXXX 20XXDOI: 10.1039/b000000x
Red blood cells squeeze through micro-capillaries as part of blood circulation in the body. The deformability of red blood cells is thus critical for blood circulation. In this work, we report a method to optically squeeze red blood cells using the evanescent field present on top of a planar waveguide chip. The optical forces from a narrow waveguide are used to squeeze red blood cells to a size comparable to the waveguide width. Optical forces and pressure distributions on the cells are numerically computed to explain the squeezing process. The proposed technique is used to quantify the loss of blood deformability that occurs during blood storage lesion. Squeezing red blood cells using waveguides is a sensitive technique and works simultaneously on several cells, making the method suitable for monitoring stored blood.
IntroductionTheir flexible membrane and large ratio of surface area to volume make it easy for red blood cells (RBCs) to change shape. RBCs typically have a biconcave profile, like a disk-shaped donut, with a diameter of 7-8 µm, a thickness of 0.8-1 µm at the center and 2-2.5 µm at the periphery. During their life span of 120 days, RBCs have to squeeze through tiny micro-capillaries in the blood circulatory system (<3 µm diameter) and through sieves in the spleen (1 µm openings)1, 2. Recent clinical studies link a loss in blood deformability with several diseases such as diabetes, obesity, sickle cell anaemia, cardiovascular diseases, malaria, hypertension and side-effects of heavy smoking 3, 4.
The loss of blood cell deformability is also associated with blood storage lesion 5, 6. Blood storage lesion refers to the collective bio-chemical, functional and structural changes occurring in the blood during storage. The functional and biochemical changes include decreased 2,3-diphosphoglycerate levels, ATP depletion, reduction in the concentrations of nitric oxide and adenosine triphosphate. The structural changes include progressive loss of deformability, increased adhesiveness and aggregability7. The health of stored blood has been debated because clinical studies show adverse effects associated with the transfusion of older stored blood (storage > 2 weeks) 8-10, while blood is typically stored for up to six weeks in blood banks. Clinical studies have recently reported increased post-surgical complications such as multiple organ failure in patients transfused with old stored blood as compared to fresh blood (storage time < 2 weeks)8. Some chemical changes in stored blood can occur within the first few hours of storage, e.g., a decrease in pH and increases in potassium and lactate. Morphological changes are significantly slower to observe and take weeks to develop. The storage of blood is essential for blood transfusion during modern medical surgery. It is thus important to develop sensitive diagnostic tools to identify minute changes in
the biochemical and structural properties of stored blood, affecting its ability to hold and transport oxygen, and to deform during circulation in micro-capillaries.
In vitro, the elasticity and deformability of RBCs are studied using physical pressure (non-optical techniques) from micropipette aspiration, micro-pores and micro-fabricated channels11-14. Non-contact methods, such as optical tweezers are also used to trap red blood cells15-22. Optical tweezers typically characterize a single cell at a time and use a strongly focused laser beam. The intensity gradient generated by the focused beam traps a cell in the vicinity of the focus. By using multiple beams or by trapping beads attached to a cell, the red blood cell can be stretched to monitor its elasticity17-18. The force imparted on the blood cells for deformation studies using optical tweezers is typically 50-400 pN17, 18.
The evanescent field of an optical waveguide can trap and propel red blood cells along the waveguide23-25. The cells are trapped on the surface of the waveguide and several cells can be trapped simultaneously at various positions along the waveguide. The optical force imparted by the evanescent field in waveguide trapping is typically an order of magnitude lower than the optical forces used in optical tweezers (<10pN). In this work, we demonstrate that the intensity gradient at the edge of narrow waveguides can be used to deform and squeeze cells. The technique is demonstrated to be a sensitive tool for detecting loss of blood deformability during blood storage lesion. The novel phenomenon of waveguide cell squeezing is explained using comprehensive numerical simulations on a computer cluster.
Experimental methodsWaveguide Optical waveguides were made of tantalum pentoxide (Ta2O5) on
This journal is © The Royal Society of Chemistry [year] [journal], [year], [vol], 00–00 | 1
5
10
15
20
25
30
35
40
45
50
55
60
65
70
75
80
CREATED USING THE RSC ARTICLE TEMPLATE (VER. 3.0) - SEE WWW.RSC.ORG/ELECTRONICFILES FOR DETAILS
ARTICLE TYPE www.rsc.org/xxxxxx | XXXXXXXX
oxidised silicon substrates. The refractive index of Ta2O5 is 2.15 (at 1070 nm wavelength), which gives high refractive index contrast (Δn) of 0.7 relative to the silica-cladding underneath (n = 1.45). The thickness of the optical waveguides was around 180 nm. The relatively high refractive index combined with thin and narrow waveguide dimensions provide high surface intensity in the evanescent field. Straight and tapered waveguides were fabricated. Further information about waveguide fabrications is provided in the supplementary information.
Experimental apparatusA 5W Ytterbium fiber laser at 1070 nm wavelength was used for the experiment, with power incident on the waveguide end adjusted down to maximum 700 mW. Laser light was coupled into the waveguides using a long working distance infrared-coated objective lens (Nachet 100X, N.A. 0.8). The coupling objective lens was held on a piezoelectric translation stage to optimize the coupling efficiency. The cells were kept in thin chambers made of polydimethylsiloxane (PDMS) and covered with a coverslip. The cells were observed with an upright microscope equipped with a long working distance objective lens (Olympus 50X N.A. 0.5 and 20X N.A. 0.4) and a CCD camera (Lumenera Infinity2). The experimental set-up is shown in the supplementary information.
Cell preparation Fresh blood samples were collected in standard blood bags as used in blood banks. The blood bag contains a saline solution including adenine, glucose, mannitol and is commonly referred to as SAGMAN. To isolate red blood cells, the blood sample was mixed with phosphate buffered saline (PBS) and centrifuged at 600 g for 10 minutes. This accumulates RBC pellets at the bottom of the test tube. Supernatant solution containing white blood cells and plasma was carefully removed from the top. This process was repeated three times in PBS to remove most of the platelets and white blood cells. The red blood cells were then stored in SAGMAN medium at 4°C. The sample was divided into several tubes, which were opened only on specified days for monitoring deformability. For waveguide trapping, the blood sample was diluted and submerged into isotonic sucrose medium (0.25 M)24 and the experiment was completed within 3 hours. The replacement of phosphate buffer solution (PBS) with isotonic sucrose medium avoided cell sticking to the waveguide surface.
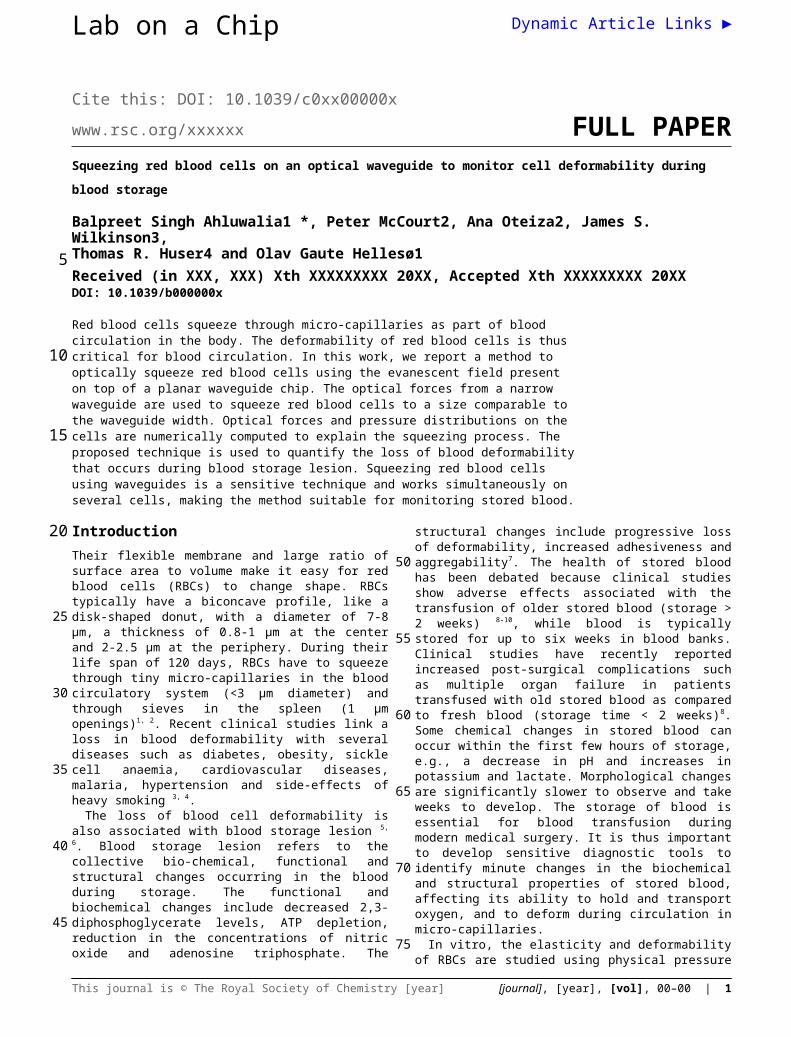
Squeezing red blood cells with optical waveguidesWhen a cell is positioned in the vicinity of an optical waveguide as depicted in Fig. 1, the cell interacts with the evanescent field of the waveguide. The optical forces experienced by the cell can be classified as a scattering force along the waveguide (Fz, along z in Fig. 1a), vertical gradient force (Fx in Fig. 1a and 1b), and lateral gradient force (Fy in Fig. 1b). For the axes defined in Fig. 1, Fx is negative, Fz is positive and the sign of Fy depends on the position of the cell along the y-axis. As the refractive index of the cell is close to that of the surrounding aqueous medium, the scattering force Fz is weak and the forward push is thus small. The vertical gradient force Fx attracts the cell down towards the waveguide, while the lateral gradient force Fy holds the cell laterally in position on top of the waveguide. The extent of the evanescent
field is typically 150 nm, which is also the extent of the vertical gradient force. The extent of the lateral gradient force is dictated by the width of the waveguide. The additional experimental details are described in the supplementary information (supplementary Fig. 1, 2).
Figure 1. Outline of red blood cell (diameter 7 μm) sitting on top of an optical waveguide (width 1.3 μm). a) 3D-view of a bi-concave blood cell and b) profile through the center of the cell. The direction of torque is given by the arrow in a) for rotation about the z-axis. The y-axis is defined with y = 0 in the middle of the waveguide, but shown with an offset here for clarity. The white cross in b) shows the point of contact of the cell with the waveguide.
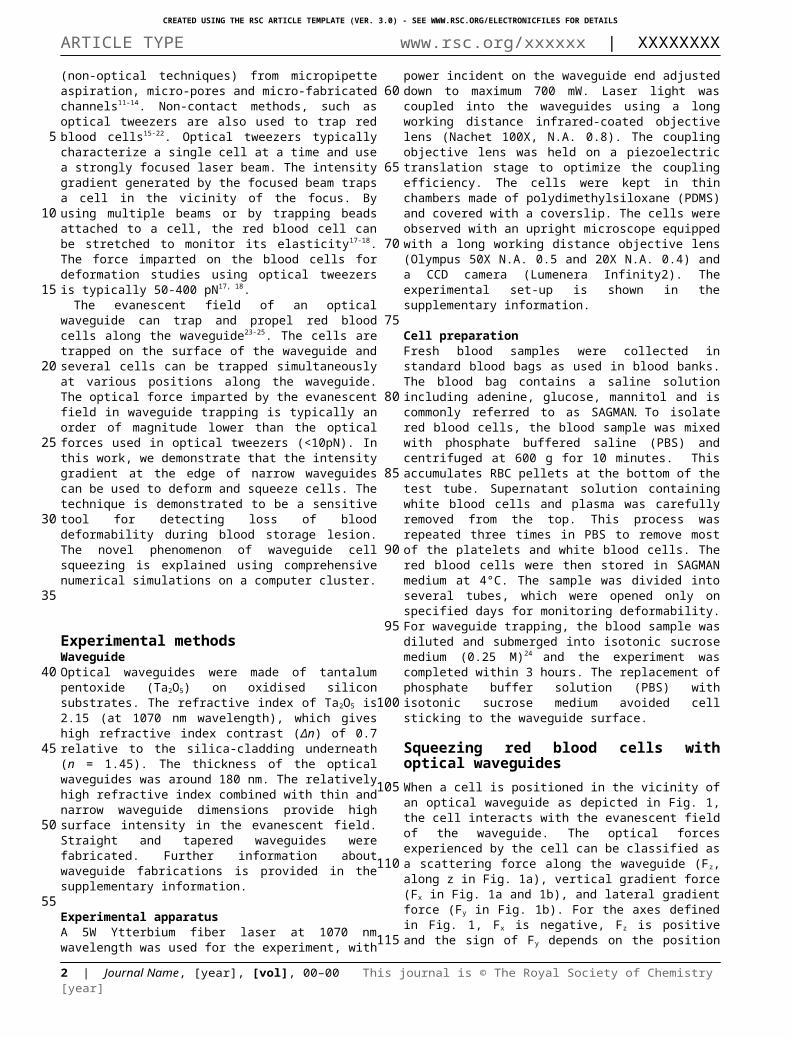
The lateral gradient force of a narrow waveguide (1.3 μm wide) is used to deform a red blood cell as shown in Fig. 2 (movie 1) and supplementary Fig. 3. When the laser is switched on, the rim (i.e. thickest part) of the cell is attracted to the waveguide and is held in place there (Fig. 2a). Subsequently, the part of the cell not on the waveguide is pulled in across the waveguide (Fig. 2b-f). The result (Fig. 2f) is a cell squeezed down to a significantly smaller width (from 7 μm to 4.8 μm). The rim (bulge) of the cell on the waveguide becomes darker, which could be due to increased thickness and accumulation of hemoglobin in the part that interacts with the evanescent field of the waveguide. As the volume of the cell remains constant, a reduction in the observed area must be accompanied by an expansion upwards, either by rotation or by the cell becoming thicker. The central part of the cell (donut) remains comparatively transparent (thin) during the initial phase of cell squeezing, as noticed in Fig. 2(a-e) and Supplementary Fig. 3(b-e). As the central part of the cell is visible and the entire cell remains in focus until the laser is switched off, the cell must remain in the yz-plane. Note that the part of the rim that is on the waveguide is straight (see supplementary Fig. 3-4 and supplementary movie 1). This straightening effect is also predicted by the simulation results discussed below. Figure 2f) also shows that cells can squeeze differently even if they are next to each other. When the laser is switched off, the cell regains its original donut shape (Fig. 2h).
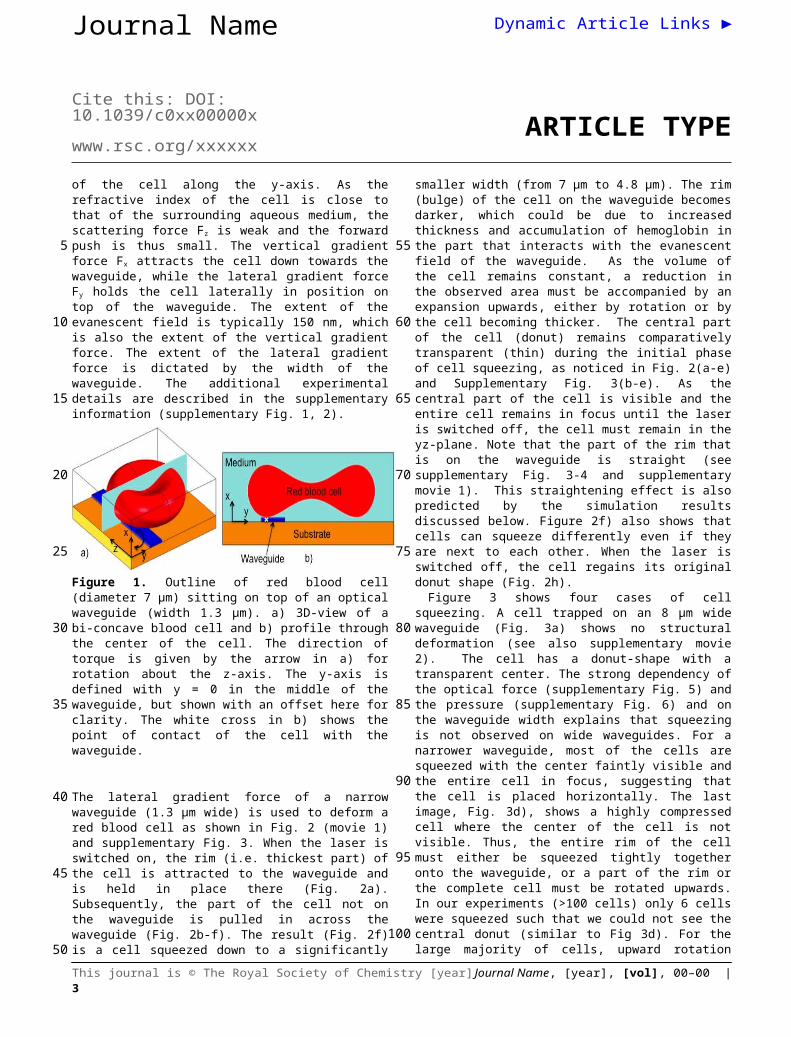
Figure 3 shows four cases of cell squeezing. A cell trapped on an 8 μm wide waveguide (Fig. 3a) shows no structural deformation (see also supplementary movie 2). The cell has a donut-shape with a transparent center. The strong dependency of the optical force (supplementary Fig. 5) and the pressure (supplementary Fig. 6) and on the waveguide width explains that squeezing is not observed on wide waveguides. For a narrower waveguide, most of the cells are squeezed with the center faintly
2 | Journal Name, [year], [vol], 00–00 This journal is © The Royal Society of Chemistry [year]
5
10
15
20
25
30
35
40
45
50
55
60
65
70
75
80
85
90
95
100
105
110
115
Journal Name
Cite this: DOI: 10.1039/c0xx00000xwww.rsc.org/xxxxxx
Dynamic Article Links ►
ARTICLE TYPEvisible and the entire cell in focus, suggesting that the cell is placed horizontally. The last image, Fig. 3d), shows a highly compressed cell where the center of the cell is not visible. Thus, the entire rim of the cell must either be squeezed tightly together onto the waveguide, or a part of the rim or the complete cell must be rotated upwards. In our experiments (>100 cells) only 6 cells were squeezed such that we could not see the central donut (similar to Fig 3d). For the large majority of cells, upward rotation around the edge can be ruled out. In conventional laser beam trap RBC is flipped (rotated) on its edge, and flipping time is typically 300-500 ms 15. While, in waveguide deformation cell squeezing takes 20-40 seconds. Fig. 3 suggest that cells in close proximity could squeeze differently depending on cell shape, size age and deformability index (see section below).
Figure 2. Optical trapping and squeezing of a red blood cell on a 1.3 μm wide and 180 nm thick waveguide. The laser beam was on in images a-f, and switched off from g-h. See also associated media file (Associated Movie 1).
Figure 3. Squeezing of red blood cells on waveguides with different widths of a) 8 μm, b) 2 μm, and c-d) 1.3 μm.
Waveguide cell squeezing is a slow phenomenon, which can take 2-30 seconds depending on waveguide width, guided power and cell age. The reverse process of a cell regaining its shape after the laser is switched off, is usually faster than the squeezing
phenomenon. The intermediate steps of cell deformation vary from cell to cell and are also dependent on waveguide width. As it is propelled along a waveguide, a cell can re-adjust and change its deformed shape (see supplementary movie 3).
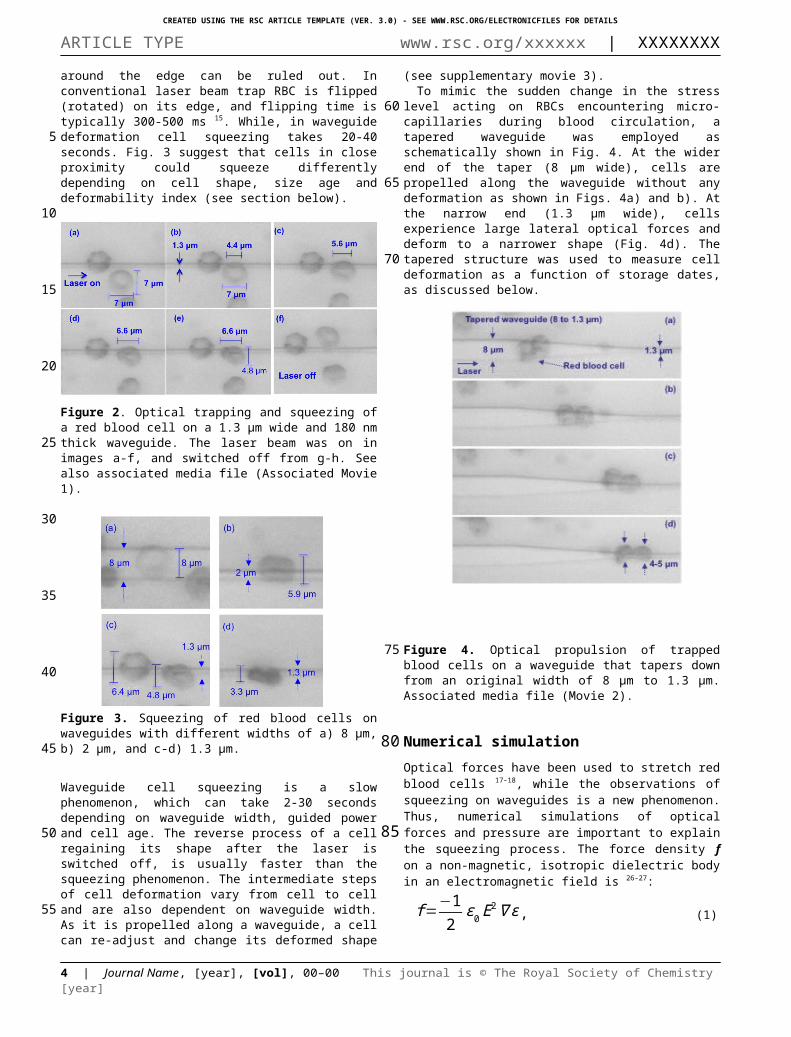
To mimic the sudden change in the stress level acting on RBCs encountering micro-capillaries during blood circulation, a tapered waveguide was employed as schematically shown in Fig. 4. At the wider end of the taper (8 µm wide), cells are propelled along the waveguide without any deformation as shown in Figs. 4a) and b). At the narrow end (1.3 µm wide), cells experience large lateral optical forces and deform to a narrower shape (Fig. 4d). The tapered structure was used to measure cell deformation as a function of storage dates, as discussed below.
Figure 4. Optical propulsion of trapped blood cells on a waveguide that tapers down from an original width of 8 μm to 1.3 μm. Associated media file (Movie 2).
Numerical simulation Optical forces have been used to stretch red blood cells 17-18, while the observations of squeezing on waveguides is a new phenomenon. Thus, numerical simulations of optical forces and pressure are important to explain the squeezing process. The force density f on a non-magnetic, isotropic dielectric body in an electromagnetic field is 26-27:
f =−12
ϵ 0 E2∇ϵ , (1)
with 0 denoting the electric permittivity of vacuum, E the electric field and ε the permittivity gradient. As the permittivity gradient is positive and perpendicular to the surface when moving from an aqueous medium to a cell with higher refractive index than water, the force density is negative and perpendicular to the
This journal is © The Royal Society of Chemistry [year] Journal Name, [year], [vol], 00–00 | 3
5
10
15
20
25
30
35
40
45
50
55
60
65
70
75
80
CREATED USING THE RSC ARTICLE TEMPLATE (VER. 3.0) - SEE WWW.RSC.ORG/ELECTRONICFILES FOR DETAILS
ARTICLE TYPE www.rsc.org/xxxxxx | XXXXXXXX
surface of the cell. It thus points outward at all points on the cell that are within the evanescent field of the waveguide. At first glance, this appears to contradict the observed squeezing of the cell and a numerical model is necessary to find the cause of squeezing.
The finite element method was used to compute the optical forces and the optical pressure that a cell experiences during waveguide trapping. A biconcave shape with a diameter of 7 μm was used for the red blood cell. The waveguide width and thickness were 1.3 μm and 180 nm, respectively. The guided power was 15 mW, corresponding to experimental values. Further details can be found in the supplementary information.
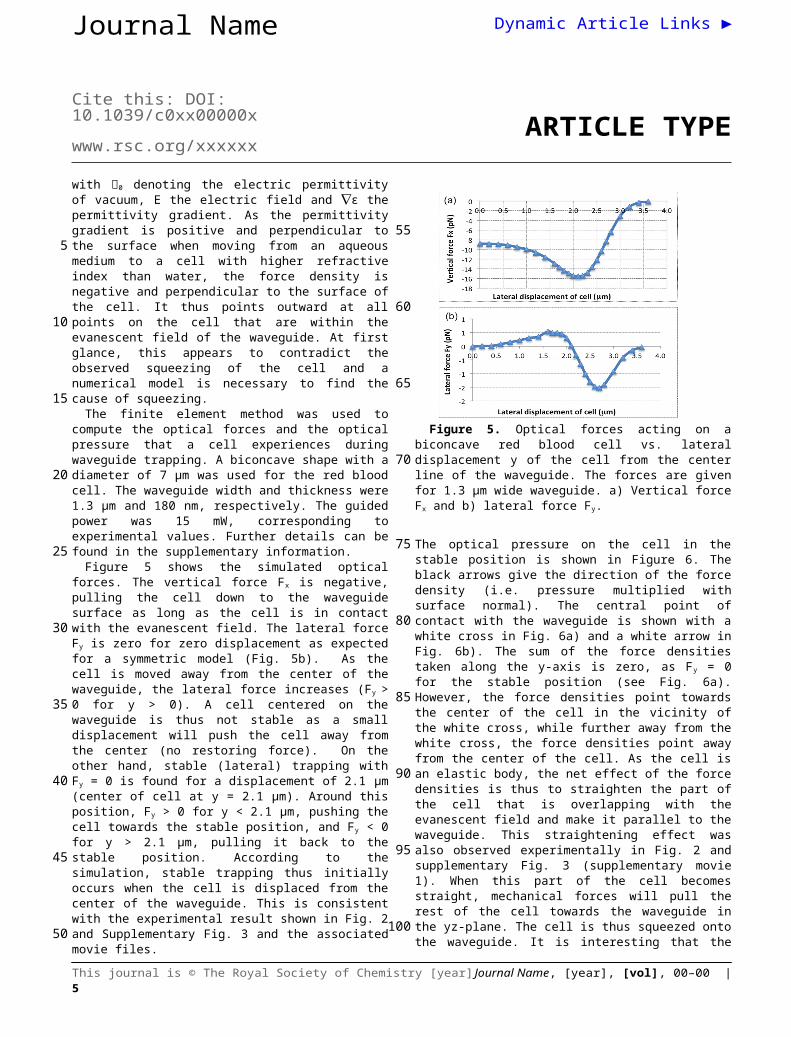
Figure 5 shows the simulated optical forces. The vertical force Fx is negative, pulling the cell down to the waveguide surface as long as the cell is in contact with the evanescent field. The lateral force Fy is zero for zero displacement as expected for a symmetric model (Fig. 5b). As the cell is moved away from the center of the waveguide, the lateral force increases (Fy > 0 for y > 0). A cell centered on the waveguide is thus not stable as a small displacement will push the cell away from the center (no restoring force). On the other hand, stable (lateral) trapping with Fy = 0 is found for a displacement of 2.1 μm (center of cell at y = 2.1 μm). Around this position, Fy > 0 for y < 2.1 μm, pushing the cell towards the stable position, and Fy < 0 for y > 2.1 μm, pulling it back to the stable position. According to the simulation, stable trapping thus initially occurs when the cell is displaced from the center of the waveguide. This is consistent with the experimental result shown in Fig. 2 and Supplementary Fig. 3 and the associated movie files.
Figure 5. Optical forces acting on a biconcave red blood cell vs. lateral displacement y of the cell from the center line of the waveguide. The forces are given for 1.3 μm wide waveguide. a) Vertical force Fx and b) lateral force Fy.
The optical pressure on the cell in the stable position is shown in Figure 6. The black arrows give the direction of the force density (i.e. pressure multiplied with surface normal). The central point of contact with the waveguide is shown with a white cross in Fig. 6a) and a white arrow in Fig. 6b). The sum of the force densities taken along the y-axis is zero, as Fy = 0 for the stable position (see Fig. 6a). However, the force densities point towards the center of the cell in the vicinity of the white cross, while further
away from the white cross, the force densities point away from the center of the cell. As the cell is an elastic body, the net effect of the force densities is thus to straighten the part of the cell that is overlapping with the evanescent field and make it parallel to the waveguide. This straightening effect was also observed experimentally in Fig. 2 and supplementary Fig. 3 (supplementary movie 1). When this part of the cell becomes straight, mechanical forces will pull the rest of the cell towards the waveguide in the yz-plane. The cell is thus squeezed onto the waveguide. It is interesting that the evanescent field, which stretches about 150 nm from the surface, induces localized optical pressure sufficient to squeeze the entire red blood cell (7 μm wide and 2 μm thick), see supplementary Figure 7. The elastic membrane of the cell plays a crucial role in spreading the localized optical pressure over the entire cell 17.
Figure 6. Optical pressure distribution on a cell trapped at y=2.1 μm (stable position, i.e. Fy=0) on a waveguide of width 1.3 μm. Black arrows show force density (relative scale 7.5 and 1 for a) and b), respectively). a) Cell seen from below, through the substrate and the waveguide (yz-plane). Pressure is shown in Pa for 15 mW of guided power. b) Slice through the center of the cell and the waveguide. A white circle in a) shows the bottom of the cell. The central point of contact is shown with a white cross in a) and a white arrow in b).
Figure 7 shows the pressure distribution on the cell as it is moved relative to the waveguide (along the y-axis). Figure 6(a) corresponds to Figure 7(c). For zero offset and thus a symmetric model, the force is entirely along the waveguide, pushing the cell forward (see Fz in supplementary Fig 5). As the offset increases, Figure 7(b-c), the forces act to straighten the part of the cell that is on the waveguide. For large offsets, Fig. 7d), the forces mainly act to pull the cell back onto the waveguide. More simulation results are given and discussed in the supplementary information (see supplementary Fig 5-9).
4 | Journal Name, [year], [vol], 00–00 This journal is © The Royal Society of Chemistry [year]
5
10
15
20
25
30
35
40
45
50
55
60
65
70
75
80
85
90
95
100
105
110
115
Journal Name
Cite this: DOI: 10.1039/c0xx00000xwww.rsc.org/xxxxxx
Dynamic Article Links ►
ARTICLE TYPEFigure 7. Pressure distribution and direction of force density as the cell is moved sideways relative to the waveguide (along the y axis). The waveguide is 1.3 μm wide. The cell is seen from below through the waveguide and the substrate. The offsets are: a) Zero, b) 1.6 μm, c) 2.1 μm (stable position) and d) 3.0 μm. e) and f) are zoomed in on the contact areas of c) and d), respectively. A white circle shows the bottom of the cell, the white cross shows the central point of contact (similar to arrow shown in Fig. 6b) and dotted white line is the axis of rotation for which torque is calculated in Fig. 8.
The largest force component is along the x-axis (pointing downwards), as shown in Figure 5 and 6b). The cell is thus pressed down and the bottom of the cell will become flat. The forces acting on the cell also give rise to a torque. The simulation shows that a cell experiences a positive torque (see direction in Fig. 1a) at stable trapping location (see supplementary Fig. 9). Thus, the simulation predicts that the cell will be pressed down towards the substrate due to the positive torque and therefore ruling out flipping or rotation of the cell.
Waveguide cell squeezing as a storage lesion markerTo demonstrate the capabilities of the proposed technique, we monitored the deformability of fresh and stored RBC. A healthy RBC under no stress has, as noted previously, a biconcave shape. When an RBC is trapped on a narrow waveguide, the cell is squeezed and its surface area is reduced. By measuring the surface area of cells before and during squeezing, the deformability of blood cells can be obtained (see supplementary information). We define a deformability index (DI) as:
The DI of RBCs was measured on fresh and stored cells (up to thirty days). The measurement was done on cells (> 100) from blood samples from different donors. The experiments were done on similar waveguides and the DI was measured on the narrow section of a tapered waveguide (1.3 μm wide). The input power to the waveguide was kept constant at 500 mW, giving a guided power of approximately 15 mW. The deformability index shifts when the input power is changed, as highlighted in supplementary Figure 10. The experimental procedures are further described in the methods section.
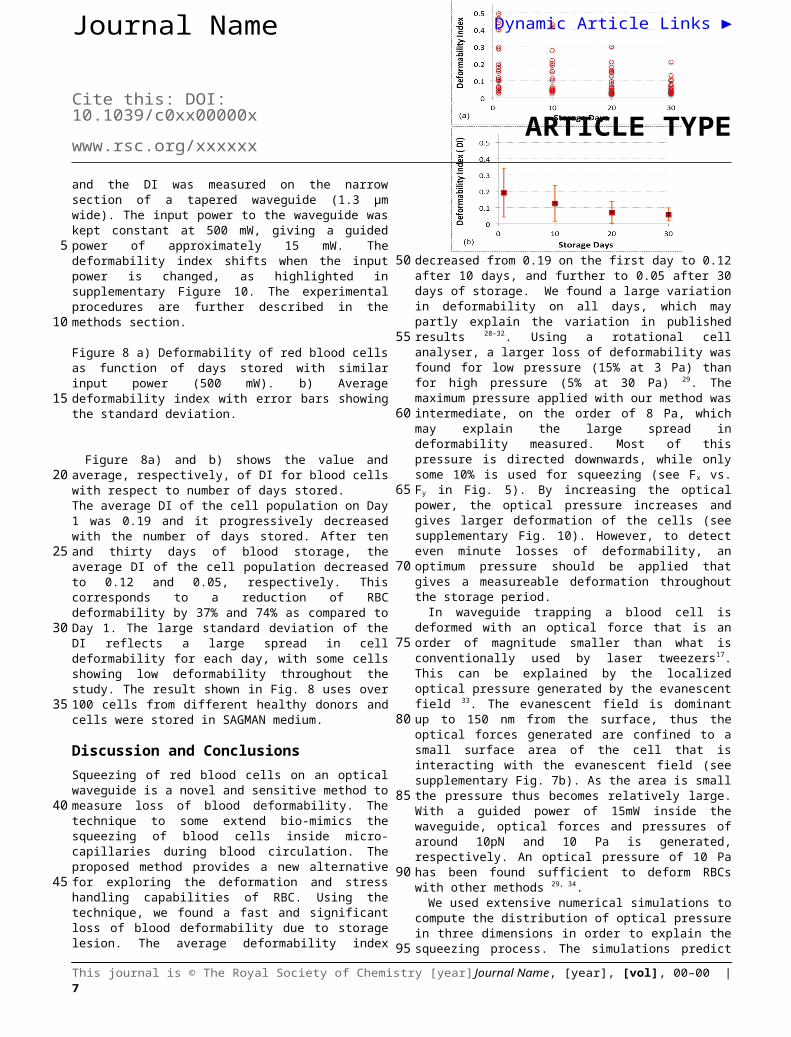
Figure 8 a) Deformability of red blood cells as function of days stored with similar input power (500 mW). b) Average deformability index with error bars showing the standard deviation.
Figure 8a) and b) shows the value and average, respectively, of DI for blood cells with respect to number of days stored. The average DI of the cell population on Day 1 was 0.19 and it progressively decreased with the number of days stored. After ten and thirty days of blood storage, the average DI of the cell population decreased to 0.12 and 0.05, respectively. This corresponds to a reduction of RBC deformability by 37% and 74% as compared to Day 1. The large standard deviation of the DI reflects a large spread in cell deformability for each day, with some cells showing low deformability throughout the study. The result shown in Fig. 8 uses over 100 cells from different healthy donors and cells were stored in SAGMAN medium.
Discussion and ConclusionsSqueezing of red blood cells on an optical waveguide is a novel and sensitive method to measure loss of blood deformability. The technique to some extend bio-mimics the squeezing of blood cells inside micro-capillaries during blood circulation. The proposed method provides a new alternative for exploring the deformation and stress handling capabilities of RBC. Using the technique, we found a fast and significant loss of blood deformability due to storage lesion. The average deformability index decreased from 0.19 on the first day to 0.12 after 10 days, and further to 0.05 after 30 days of storage. We found a large variation in deformability on all days, which may partly explain the variation in published results 28-32. Using a rotational cell analyser, a larger loss of deformability was found for low pressure (15% at 3 Pa) than for high pressure (5% at 30 Pa) 29. The maximum pressure applied with our method was intermediate, on the order of 8 Pa, which may explain the large spread in deformability measured. Most of this pressure is directed downwards, while only some 10% is used for squeezing (see Fx vs. Fy in Fig. 5). By increasing the optical power, the optical pressure increases and gives larger deformation of the cells (see supplementary Fig. 10). However, to detect even minute losses of deformability, an optimum pressure should be applied that gives a measureable deformation throughout the storage period.
In waveguide trapping a blood cell is deformed with an optical force that is an order of magnitude smaller than what is conventionally used by laser tweezers17. This can be explained by the localized optical pressure generated by the evanescent field 33.
This journal is © The Royal Society of Chemistry [year] Journal Name, [year], [vol], 00–00 | 5
5
10
15
20
25
30
35
40
45
50
55
60
65
70
75
80
85
90

CREATED USING THE RSC ARTICLE TEMPLATE (VER. 3.0) - SEE WWW.RSC.ORG/ELECTRONICFILES FOR DETAILS
ARTICLE TYPE www.rsc.org/xxxxxx | XXXXXXXX
The evanescent field is dominant up to 150 nm from the surface, thus the optical forces generated are confined to a small surface area of the cell that is interacting with the evanescent field (see supplementary Fig. 7b). As the area is small the pressure thus becomes relatively large. With a guided power of 15mW inside the waveguide, optical forces and pressures of around 10pN and 10 Pa is generated, respectively. An optical pressure of 10 Pa has been found sufficient to deform RBCs with other methods 29, 34.
We used extensive numerical simulations to compute the distribution of optical pressure in three dimensions in order to explain the squeezing process. The simulations predict off-center trapping of the biconcave blood cells, followed by a straightening process, in correspondence with the experimental observations. The simulations show that a positive torque is experienced by the cell (i.e. the cell is pressed onto the substrate) for the stable trapping location. Our simulations are on a perfect, un-deformed single RBC. As squeezing proceeds, the distribution of forces and the torque will change. Moreover, if cells are touching each other it might effect the force distribution. Experimentally, the center of the cell was in most cases visible with the entire rim in focus. The majority of cells (low DI <0.3) are thus believed to be in the plane of observation, i.e. horizontal. For a few cells (6%) on days 1 and 10 (4 and 2 cells, respectively, Fig. 8a), the center was not visible (see Fig. 3d) and such cells gave large DI (>0.4). It is possible that these cells have rotated around the z-axis, although the cell deformation process starts in the same way as for the other cases. Rotation would change the observed area and thus the value of DI. However, as rotation is not confirmed and the number of cells concerned is small, we have included all the experimental results in Fig. 8.
The experiments in this work were performed at room temperature. A decrease in temperature increases the rigidity of the RBC membrane 35, the viscosity of the cell membrane and the viscosity of the internal cytosol of blood cells. The accumulative effect of a decrease in the temperature is less deformable cells. We thus anticipate that higher values of the deformability index will be obtained if cell squeezing experiments are performed at 37°C (in-vivo temperature).
The loss of blood deformability during storage is due to the cumulative alterations of structural and biochemical changes that stored blood undergoes. The oxidation in the stored blood causes an alteration in the lipid molecules and proteins present at the cell membrane 31. This consequently alters the linkage between the membrane and the cytoskeleton influencing the deformability of blood cells 36. The depletion of adenosine triphosphate and 2-3 diphosphoglycerate during blood storage is also associated with the loss of blood deformability 29. The storage also modifies the viscoelasticity properties of the cell membrane and the internal cytosol. Stored blood undergoes structural changes and loss in surface area to volume ratio that will effect the shape and the curvature of the blood cell. A change in the curvature of a blood cell, size and shape will influence the lateral stable trapping location of a cell (see Fig. 5) and consequently will influence the squeezing behaviour. Moreover, any change in refractive index of RBC will also influence the result in waveguide deformation. The scope of the manuscript was to study the cumulative effect of blood storage on loss of deformability.
The loss of blood deformability during storage may have
important consequences on blood transfusion. A few hours after a blood transfusion, the patient's body removes a relatively large percentage of transfused blood (up to 30%) 32. A possible cause of removal is loss of blood cell deformability and the subsequent removal of non-elastic blood cells by the spleen 1-2. It was also reported that the major change in RBC deformability might occur during processing of the blood by a blood bank 31. The on-going debate on the health of stored blood and the adverse effects of blood transfusion 5-10, 28-32 might lead to further scrutiny of the mechanical and structural properties of stored blood before transfusion. This can be accomplished by the proposed technique of waveguide cell squeezing. As the distribution in deformability is large, a large number of cells (>100) must be characterized to yield statistically viable data. To determine the loss of blood deformability, the area of cell before and after waveguide trapping should be determined. Each experiment (deformation and relaxation) takes around 20-40 seconds and the throughput depends on the number of cells examined during each experiment. As cells can be deformed along the entire length of several straight and narrow waveguide in parallel, the ultimate limiting factor is the field-of-view and the optical resolution of the objective lens. In this work, a tapered waveguide was used, limiting the length where cells could be deformed, and maximum 10 cells were observed simultaneously, giving a throughput of 0.25 cells/s. The measurements were done with a 50X objective with a 300 μm field-of-view, which gave good resolution for the measurements. As the diameter of the cells is around 7 μm, it can be foreseen to have 10 waveguides in parallel and observe 20 cells along each waveguide, thus observing 200 cells simultaneously. With an observation period of 20 seconds, the throughput of a future commercial system can be estimated to 10 cells/s. By using an objective with lower magnification and larger field-of-view, e.g. 20X as in supplementary movie 5, a larger number of cells can be analyzed simultaneously and the throughput can thus be significantly increased.
The challenges associated with waveguide trapping are cell adhesion, insertion loss, and non-specificity. In present work cell adhesion is avoided by immersing cells in an isotonic sucrose medium 24. Functionalization of waveguide surface such as with PEG-PLL (Poly(ethylene glycol)- poly(L-Lysine) can be explored to avoid cell adhesion. In waveguide trapping, only a fraction of the input power is present in the evanescent field that is used for trapping application. The advantages of this technique is that it can be automated and integrated with microfluidics and with other measurement techniques to characterize red blood cells, such as measurement of refractive index 37 and absorption spectroscopy 38.
AcknowledgementsAnanth Z. Subramanian for his contribution on waveguide fabrication, Wenche Bakkelund for cell preparation, Pål Løvhaugen, Per Jakobsen and Iver Brevik for advice on simulations. BSA and OGH acknowledge funding from The Research Council of Norway.
Notes and references
6 | Journal Name, [year], [vol], 00–00 This journal is © The Royal Society of Chemistry [year]
5
10
15
20
25
30
35
40
45
50
55
60
65
70
75
80
85
90
95
100
105
110
Journal Name
Cite this: DOI: 10.1039/c0xx00000xwww.rsc.org/xxxxxx
Dynamic Article Links ►
ARTICLE TYPE1Department of Physics and Technology, University of Tromsø, N-9037 Tromsø, Norway2Department of Medical Biology, University of Tromsø, N-9037 Tromsø, Norway3Optoelectronics Research Center, University of Southampton, SO17 1BJ, UK 4Department of Physics, University of Bielefeld, Bielefeld, Germany*[email protected]
† Electronic Supplementary Information (ESI) available: Details of numerical simulations, materials and methods, and seven supplementary video files with description. See DOI: 10.1039/b000000x/
REFERENCES1. L.T. Chen, & L. Weiss, Blood, 1973, 41, 529-537.2. G. Deplaine, et al., Blood, 2011, 117, E88-E95.3. K. Tsukada, E. Sekizuka, C. Oshio, & H. Minamitani,
Microvasc. Res., 2011, 61, 231-239.4. M. Wiewiora, K. Sosada, M. Wylezol, L. Slowinska, & W.
Zurawinski, Obes. Surg., 2007, 17, 365-371.5. Huruta, R. R., et al. Mechanical properties of stored red blood
cells using optical tweezers. Blood, 1998, 92, 2975-2977.6. T. L. Berezina, S. B. Zaets, C. Morgan, C. R. Spillert, M.
Kamiyama, Z. Spolarics, E. A. Deitch, G. W. Machiedo, J. Surg. Res., 2002, 102, 6-12 .
7. Lelubre C., Piagnerelli M., & Vincent J. L., Acta. Clin. Belg., 2010, 65, 456-456.
8. C. G. Koch, L. Li, D. I. Sessler, P. Figueroa, G. A. Hoeltge, T. Mihaljevic, and E. H. Blackstone, New Engl. J. Med., 2008, 358, 1229-1239.
9. C. Lelubre, M. Piagnerelli, and J. L. Vincent, Transfus., 2009, 49, 1384-1394.
10. G . Edgren, M. Kamper-Jørgensen, S. Eloranta, K. Rostgaard B. Custer, H.Ullum, E. L. Murphy, M. P. Busch, M. Reilly, M. Melbye, H. Hjalgrim H and O. Nyrén, Transfus., 2010, 50, 1185-1195.
11. E. Evans, Biophys. J., 1983, 43, 27-30.12. E. Ogura, P. J. Abatti,and T. Moriizumi, IEEE Trans. Biomed.
Eng., 1991, 38, 721-726. 13. J. L. McWhirter, H. Noguchi, and G. Gompper, P. Natl. Acad.
Sci. U.S.A., 2009, 106, 6039-6043.14. D. J. Quinn, I. Pivkin, S.Y. Wong, K. H. Chiam, M. Dao, G.
E. Karniadakis, S. Suresh, Ann. Biomed. Eng., 2011, 39, 1041-1050.
15. Samarendra K. Mohantya, Khyati S. Mohanty b and Pradeep K. Guptaa, Opt. Exp., 2005, 13, 4745.
16. S. C. Grover, R. C. Gauthier, and A. G. Skirtach, Opt. Exp., 2000, 7, 533-539.
17. M. Dao, C. T. Lim, S. Suresh, J. Mech. Phys. Solids., 2003, 51, 2259-2280.
18. H. Zhang and K. K. Liu, J. R. Soc. Interface, 2008, 5, 671-690.19. J. Guck, R. Ananthakrishnan, H. Mahmood, T. J. Moon, C. C.
Cunningham, and J. Käs, Biophys. J., 2001, 81, 767–84.20. J. M. A. Mauritz, A. Esposito, T. Tiffert, J. N. Skepper, A.
Warley, Y.-Z. Yoon, P. Cicuta, V. L. Lew, J. R. Guck, and C. F. Kaminski, Med. Biol. Eng. Comput., 2010, 48, 1055–63.
21. N. Bellini, K. C. Vishnubhatla, F. Bragheri, L. Ferrara, P. Minzioni, R. Ramponi, I. Cristiani, and R. Osellame, Opt. Exp., 2010, 18, 4679–88.
22. S. Unterkofler, M. K. Garbos, T. G. Euser, and P. St J Russell, J. Biophoton. 2013, 6, 743–52.
23. S. Gaugiran, S. Gétin, J. Fedeli, G. Colas, A. Fuchs, F. Chatelain, and J. Dérouard Opt Exp., 2005, 13, 6956-6963.
24. B. S. Ahluwalia, P. McCourt, T. Huser, & O.G. Helleso. Opt. Exp., 2010, 18, 21053-21061.
25. O. G. Helleso, P. Lovhaugen, A.Z. Subramanian, J. S. Wilkinson & B. S. Ahluwalia, Lab Chip, 2012, 12, 3436-3440.
26. I. Brevik, Phys. Rep., 1979, 52, 133-201.27. I. Brevik, and R. Kluge, J. Opt. Soc. Am. B, 1999, 16, 976-
985.28. E. Farges, R. Grebe and M. Baumann, Clin. Hemorheol.
Micro., 2002, 27, 1-11.29. E. Bennett-Guerrero, T. H. Veldman, A. Doctor, M. J. Telen,
T. L. Ortel, T. S Reid, M. A. Mulherin, H. Zhu, R. D. Buck, R. M. Califf, and T. J. McMahon, P. Natl. Acad. Sci. U.S.A., 2007, 104, 17063-17068.
30. A. Fontes, M. L. B. Castro, M. M. Brandão, H. P. Fernandes, A. A. Thomaz, R. R. Huruta, L. Y. Pozzo, L. C. Barbosa, F. F. Costa, S. T. O. Saad & C. L. Cesar, J. Opt., 2011, 13, 044012.
31. J. C. A. Cluitmans, M. R. Hardeman, S. Dinkla, R. Brock and G. J. C. G. M. Bosman, Blood Transfus., 2012, 10, S12-S18.
32. M. Luten, B. Roerdinkholder-Stoelwinder, N. P. Schaap, W. J. de Grip, H. J. Bos, G. J. Bosman Transfus., 2008, 48, 1478-1485.
33. M. Gu, S. Kuriakose, X. Gan, Opt. Exp., 2007, 15, 1369-1375.34. M. R. Hardeman, G. A. Besselink, I. Ebbing, D. de Korte, C.
Ince, A. J. Verhoeven, Transfus., 2003, 43, 1533-1537.35. T. Lecklin, S. Egginton, G. B. Nash, Pflugers Arch., 1996,
432, 753-759.36. G. M. D'Amici, S. Rinalducci, L. Zolla, J. Proteome Res.,
2007, 6, 3242-3255.37. Y. K. Park, D. S. Monica, G. Popescu, G. Lykotrafitis, W.
Choi, M. S. Feld, S. Suresh, P. Natl. Acad. Sci. U.S.A., 2008, 105, 13730-13735.
38. M. Wojdyla, S. Raj, and D. Petrov, J Biomed. Opt., 2012, 17, 97006-1.
This journal is © The Royal Society of Chemistry [year] Journal Name, [year], [vol], 00–00 | 7
5
10
15
20
25
30
35
40
45
50
55
60
65
70
75
80
85
90
95
100