rsc: mining and modeling temporal activity in social media
TRANSCRIPT
RSC: Mining and Modeling Temporal
Activity in Social Media
Alceu F. Costa* Yuto Yamaguchi Agma J. M. Traina
Caetano Traina Jr. Christos Faloutsos
1
Universidade
de São Paulo
KDD 2015 – Sydney, Australia
Introduction
2
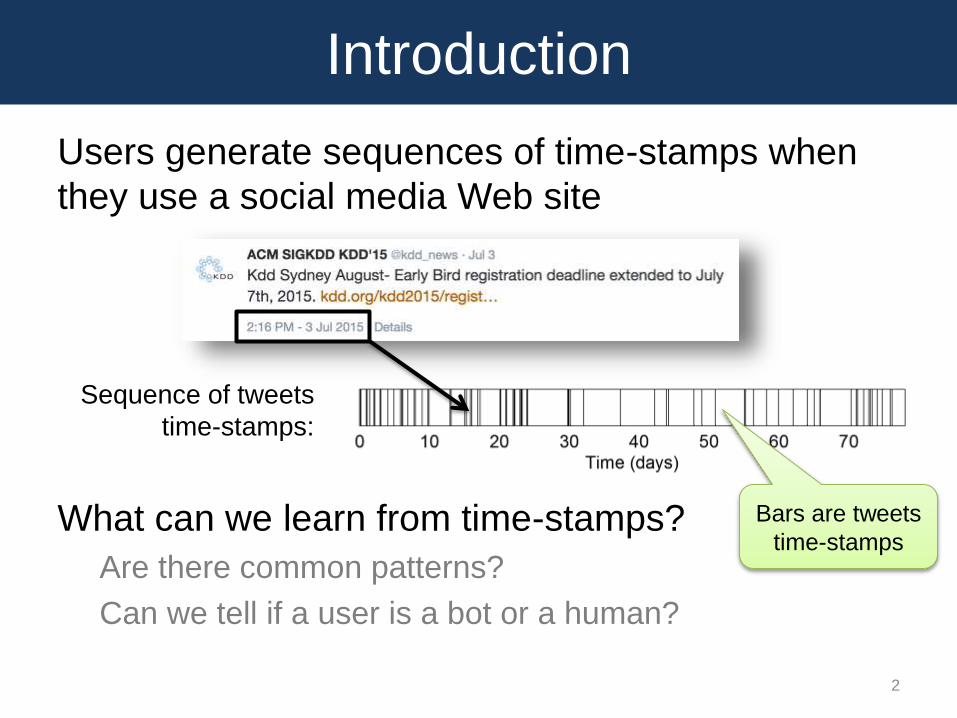
Users generate sequences of time-stamps when
they use a social media Web site
What can we learn from time-stamps?
Are there common patterns?
Can we tell if a user is a bot or a human?
Sequence of tweets
time-stamps:
Bars are tweets
time-stamps
Outline
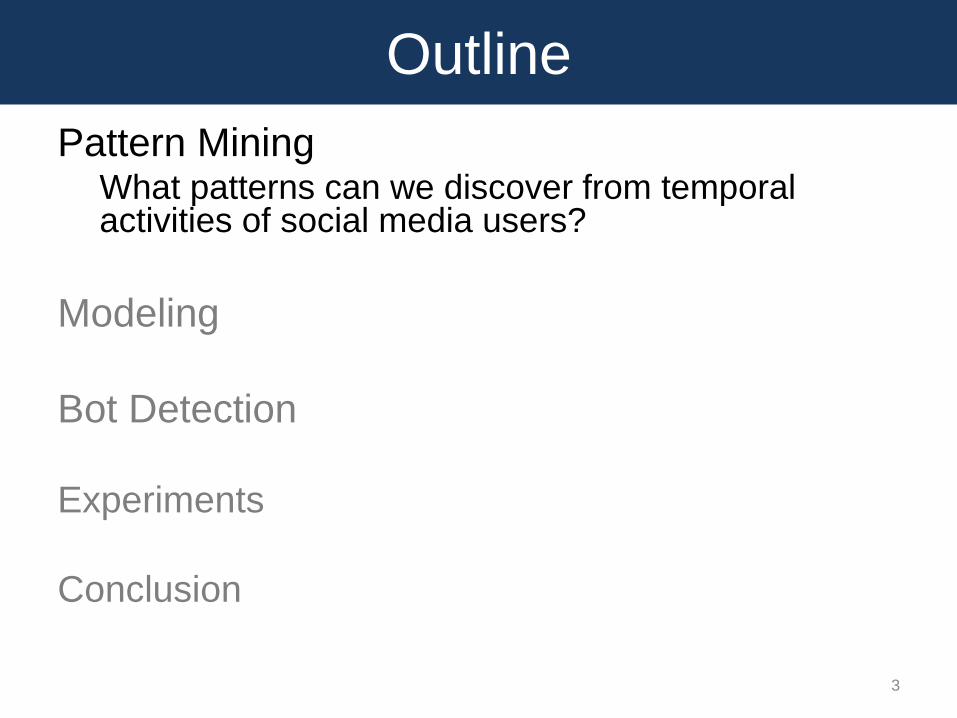
Pattern MiningWhat patterns can we discover from temporal activities of social media users?
Modeling
Bot Detection
Experiments
Conclusion
3
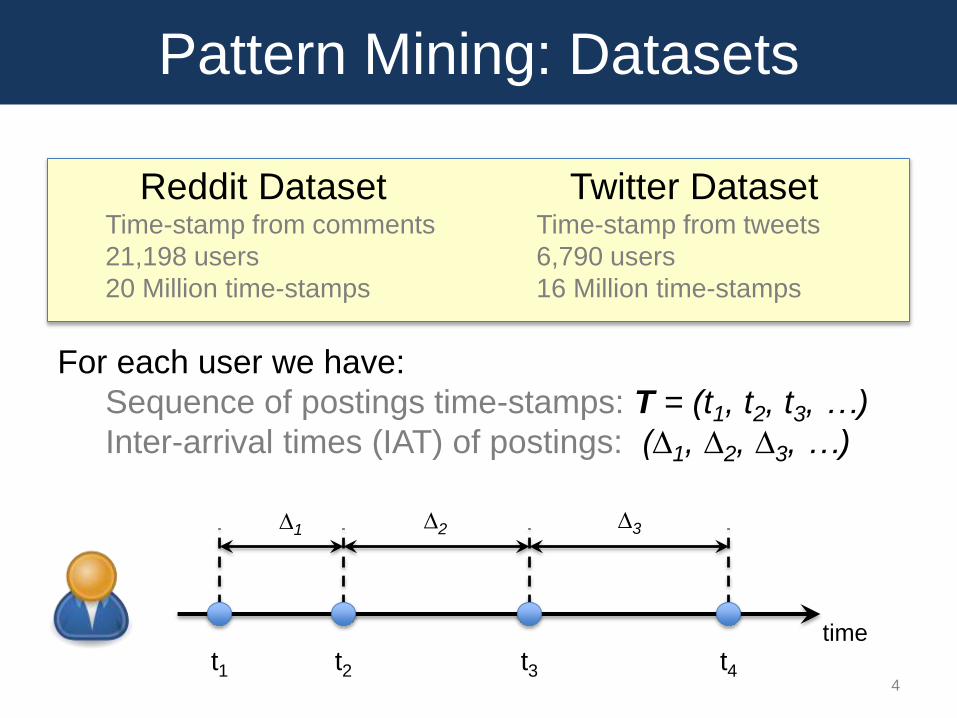
Reddit DatasetTime-stamp from comments
21,198 users
20 Million time-stamps
Twitter DatasetTime-stamp from tweets
6,790 users
16 Million time-stamps
Pattern Mining: Datasets
For each user we have:
Sequence of postings time-stamps: T = (t1, t2, t3, …)
Inter-arrival times (IAT) of postings: (∆1, ∆2, ∆3, …)
4
t1 t2 t3 t4
∆1 ∆2 ∆3
time
Pattern Mining
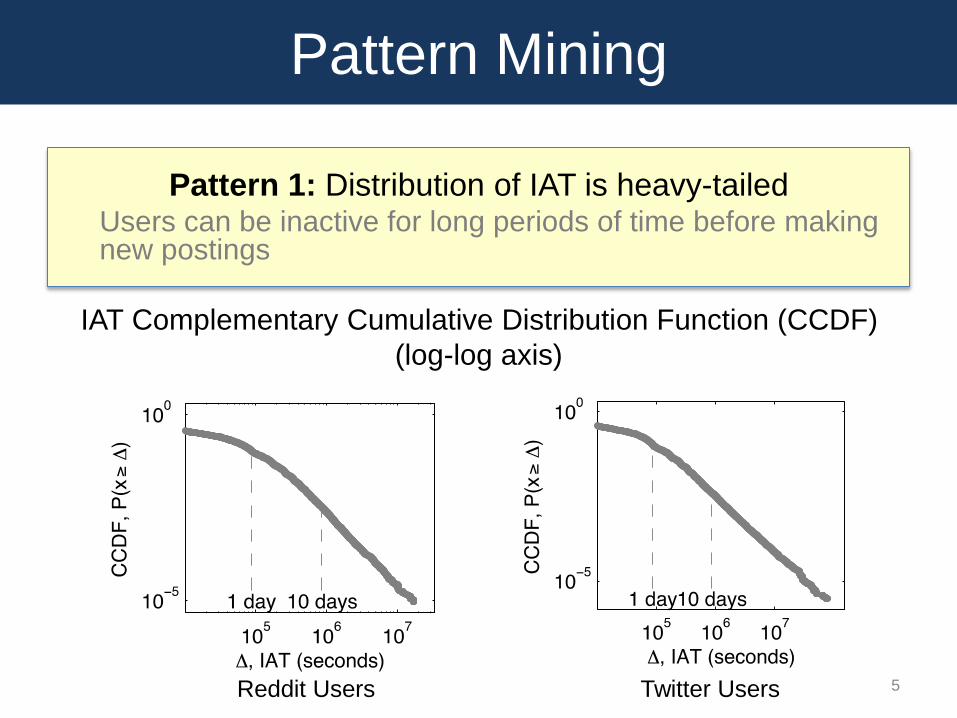
Pattern 1: Distribution of IAT is heavy-tailedUsers can be inactive for long periods of time before making new postings
IAT Complementary Cumulative Distribution Function (CCDF)
(log-log axis)
5Reddit Users Twitter Users
Pattern Mining
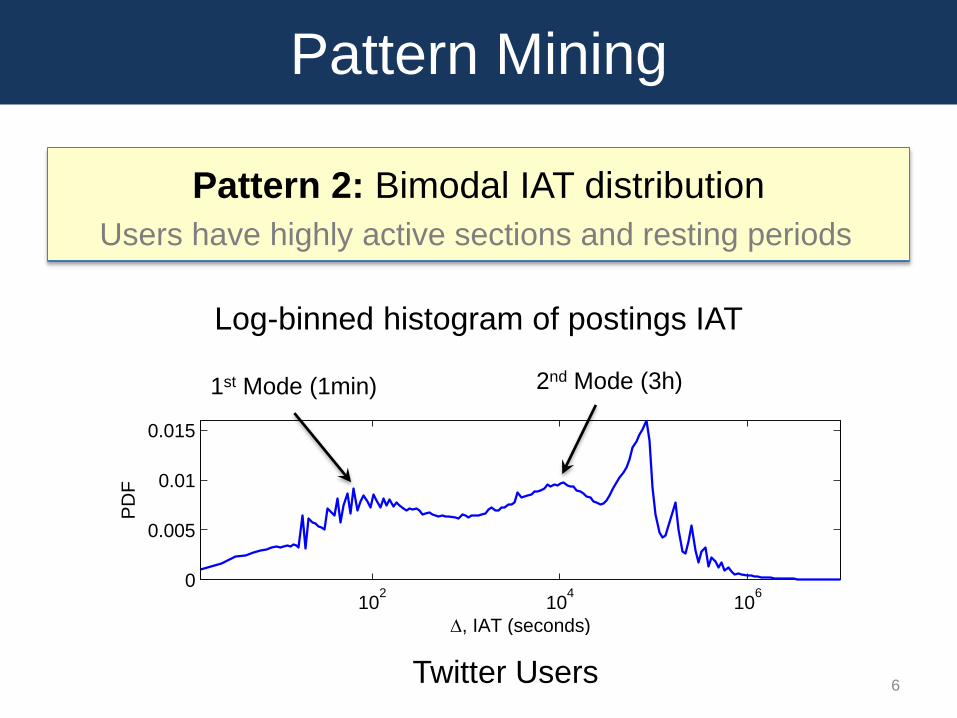
Pattern 2: Bimodal IAT distribution
Users have highly active sections and resting periods
Log-binned histogram of postings IAT
6Twitter Users
102
104
106
0
0.005
0.01
0.015
D, IAT (seconds)
PD
F
1st Mode (1min) 2nd Mode (3h)
102
104
106
0
0.005
0.01
D, IAT (seconds)
PD
F
Pattern Mining
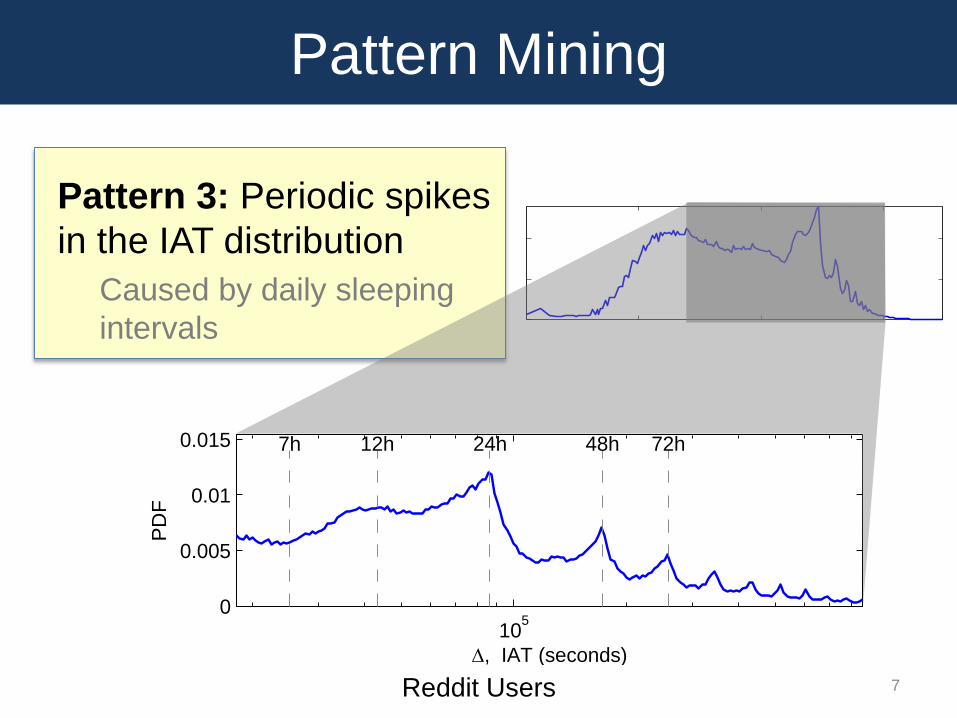
Pattern 3: Periodic spikes
in the IAT distribution
Caused by daily sleeping
intervals
7
105
0
0.005
0.01
0.015
D, IAT (seconds)
PD
F
7h 12h 24h 48h 72h
Reddit Users
Pattern Mining
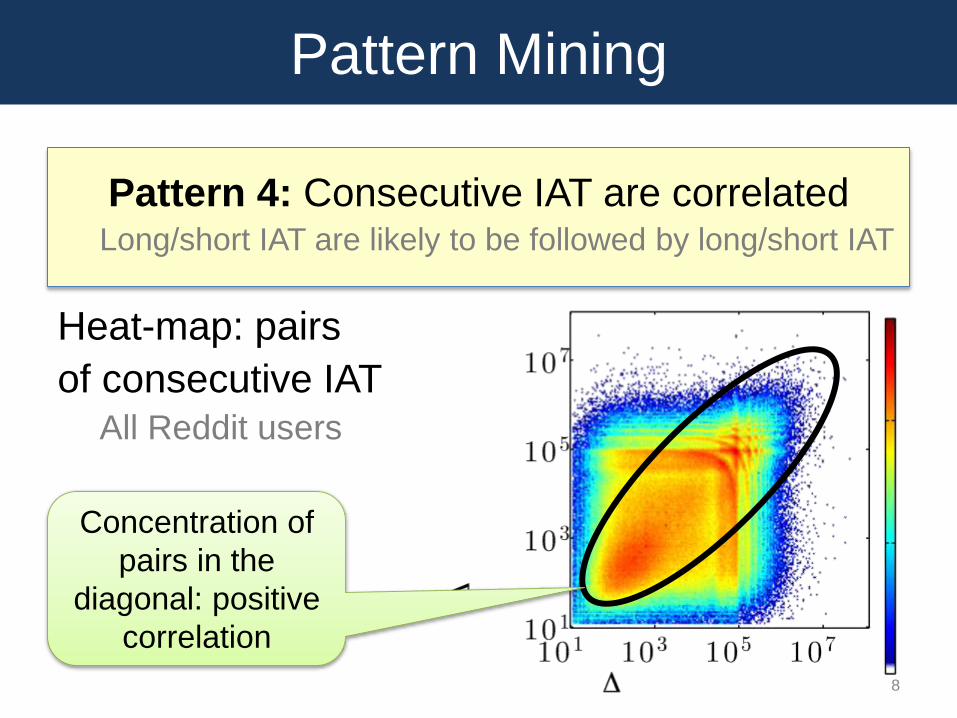
Pattern 4: Consecutive IAT are correlatedLong/short IAT are likely to be followed by long/short IAT
Heat-map: pairs
of consecutive IAT
All Reddit users
8
Concentration of
pairs in the
diagonal: positive
correlation
Outline
Pattern Mining
Modeling
Can we model the patterns?
Bot Detection
Experiments
Conclusion
9
RSC Model
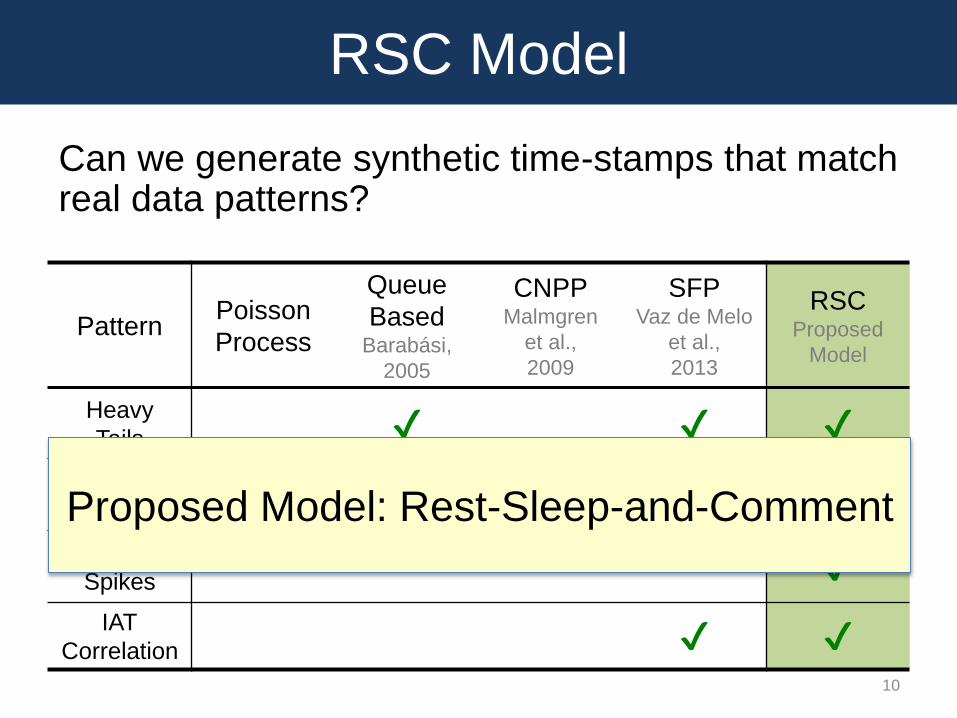
Can we generate synthetic time-stamps that match real data patterns?
10
PatternPoisson
Process
Queue
BasedBarabási,
2005
CNPPMalmgren
et al.,
2009
SFPVaz de Melo
et al.,
2013
RSCProposed
Model
Heavy
Tails ✔ ✔ ✔
Bimodal
Distribution ✔ ✔
Periodic
Spikes ✔
IAT
Correlation ✔ ✔
Proposed Model: Rest-Sleep-and-Comment
RSC Model
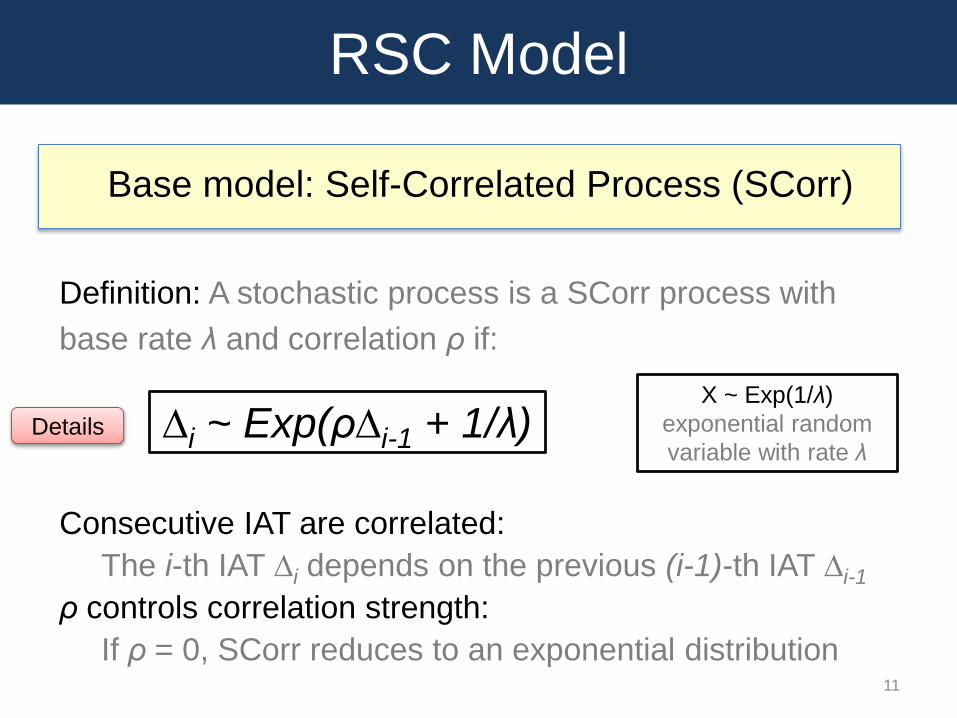
Base model: Self-Correlated Process (SCorr)
Definition: A stochastic process is a SCorr process with
base rate λ and correlation ρ if:
Consecutive IAT are correlated:
The i-th IAT ∆i depends on the previous (i-1)-th IAT ∆i-1
ρ controls correlation strength:
If ρ = 0, SCorr reduces to an exponential distribution11
X ~ Exp(1/λ)
exponential random
variable with rate λ∆i ~ Exp(ρ∆i-1 + 1/λ)Details
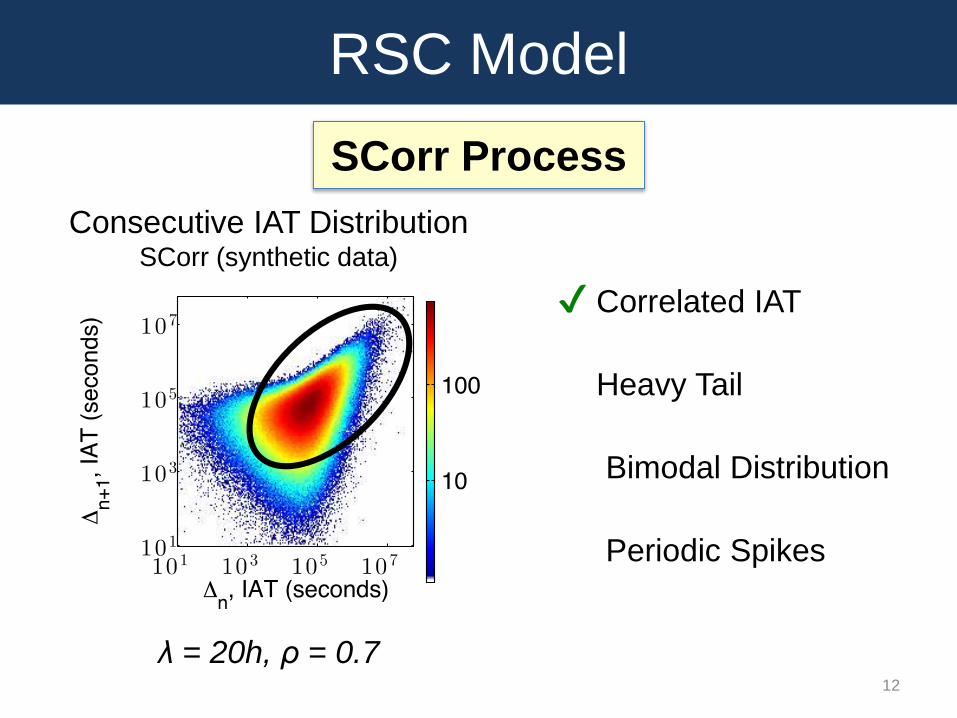
SCorr Process
RSC Model
12
✔ Correlated IAT
✔ Heavy Tail
✗ Bimodal Distribution
✗ Periodic Spikes
Consecutive IAT DistributionSCorr (synthetic data)
λ = 20h, ρ = 0.7
RSC Model
13
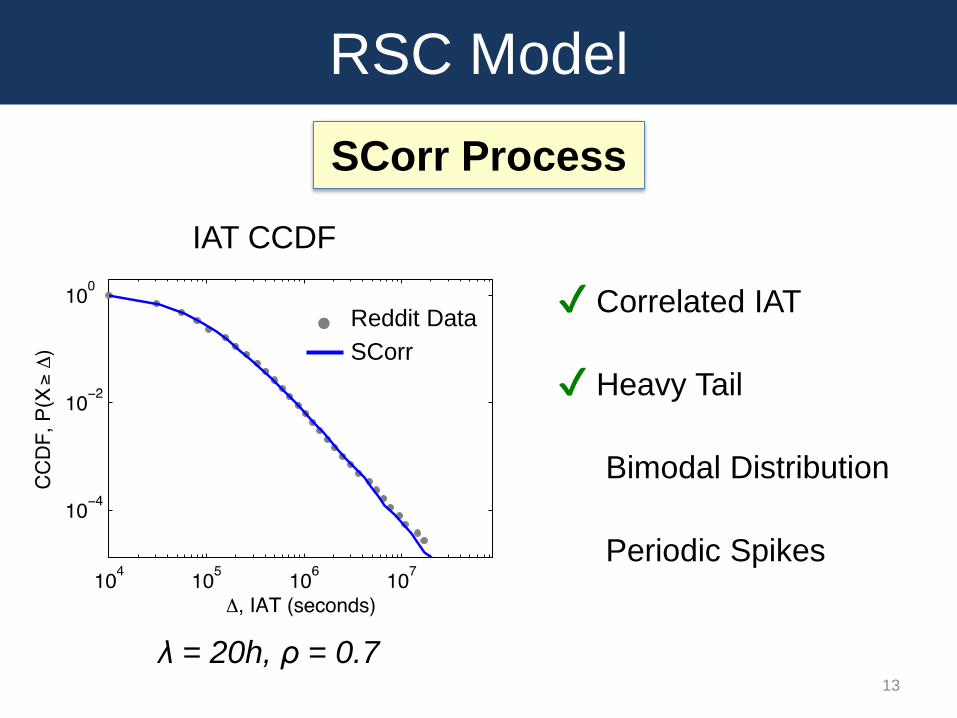
λ = 20h, ρ = 0.7
✔ Correlated IAT
✔ Heavy Tail
✗ Bimodal Distribution
✗ Periodic Spikes
IAT CCDF
Reddit Data
SCorr
SCorr Process
RSC Model
14
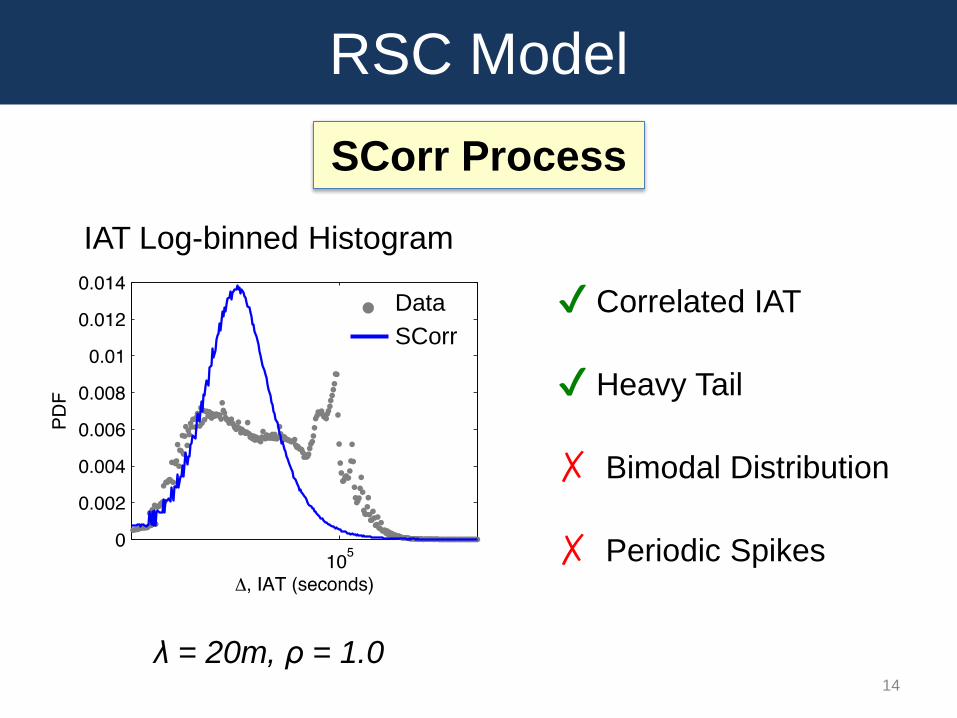
λ = 20m, ρ = 1.0
✔ Correlated IAT
✔ Heavy Tail
✗ Bimodal Distribution
✗ Periodic Spikes
IAT Log-binned Histogram
Data
SCorr
SCorr Process
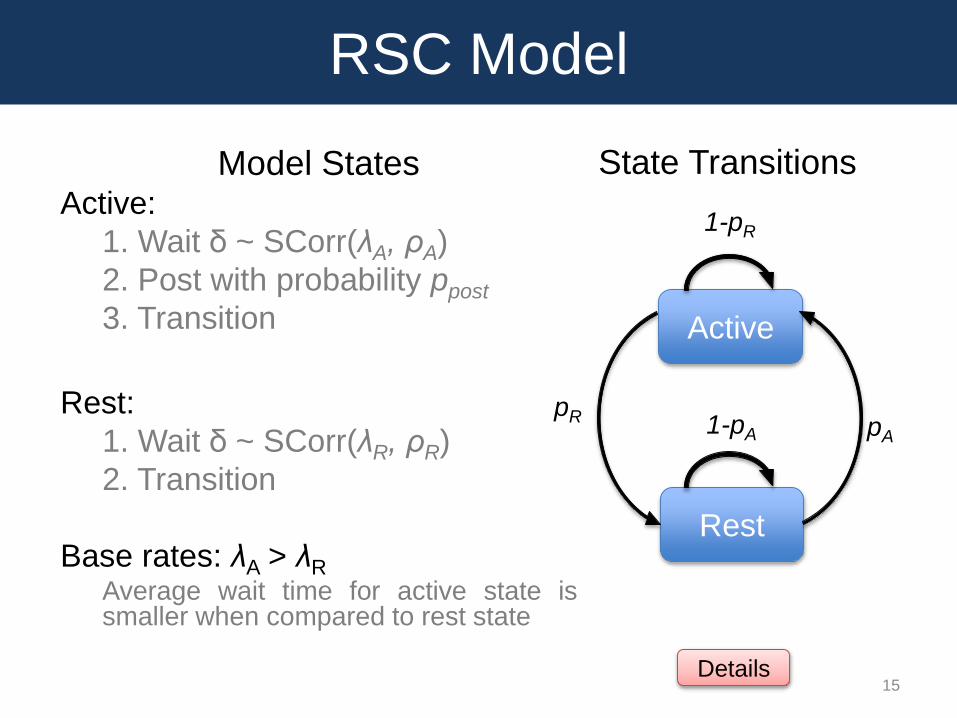
RSC Model
Model StatesActive:
1. Wait δ ~ SCorr(λA, ρA)
2. Post with probability ppost
3. Transition
Rest:
1. Wait δ ~ SCorr(λR, ρR)
2. Transition
Base rates: λA > λR
Average wait time for active state issmaller when compared to rest state
State Transitions
15
Active
Rest
1-pR
pR 1-pA pA
Details
RSC Model
16
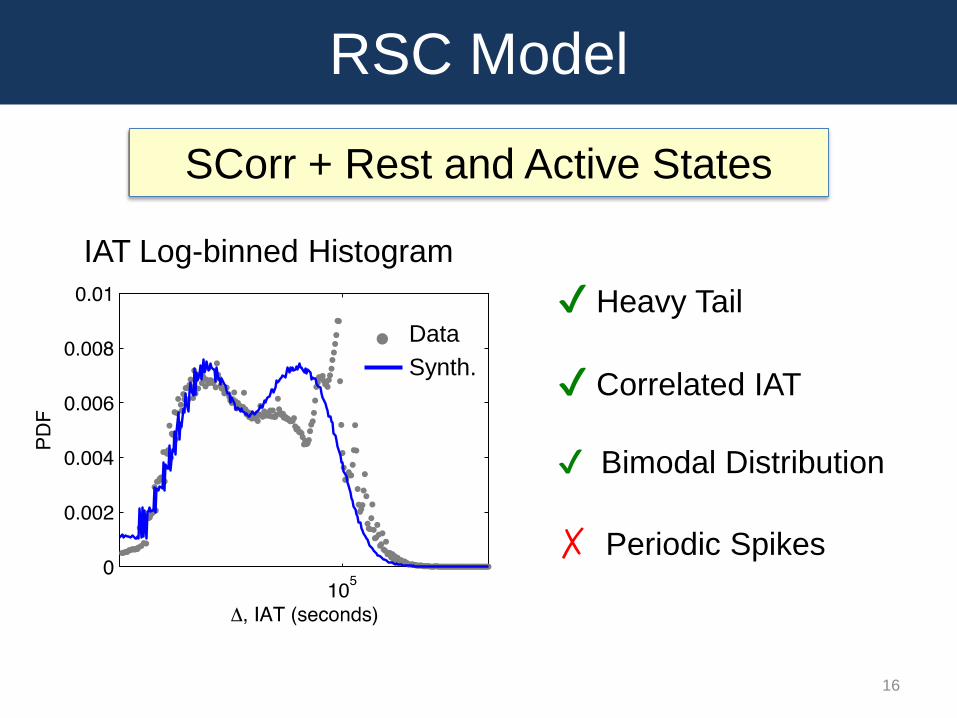
✔ Heavy Tail
✔ Correlated IAT
✔ Bimodal Distribution
✗ Periodic Spikes
IAT Log-binned Histogram
Data
Synth.
SCorr + Rest and Active States
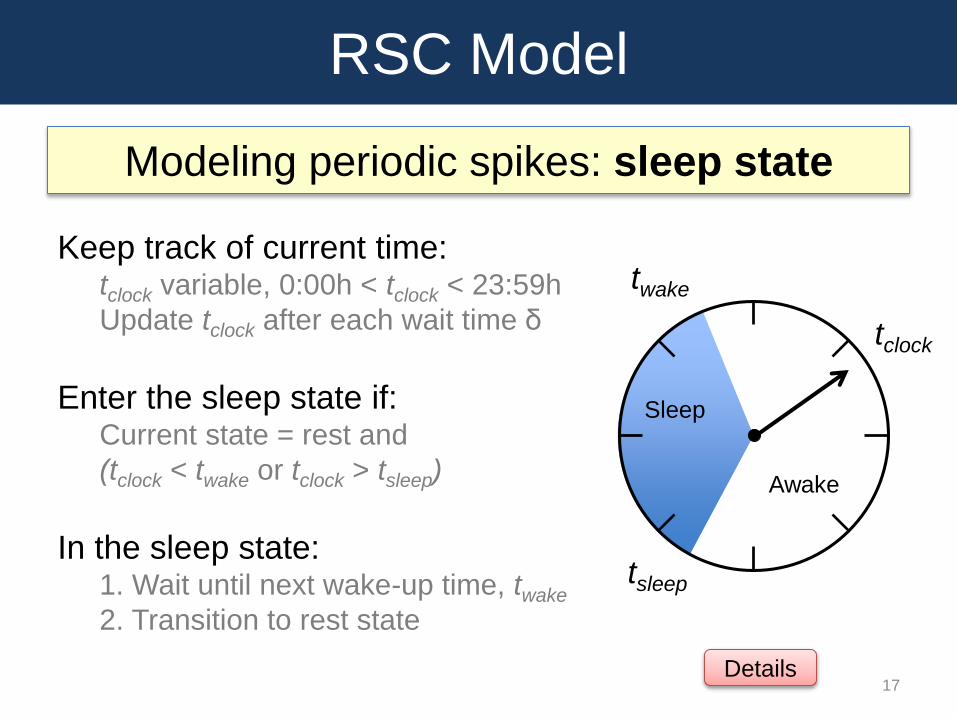
RSC Model
Keep track of current time:tclock variable, 0:00h < tclock < 23:59h
Update tclock after each wait time δ
Enter the sleep state if:Current state = rest and
(tclock < twake or tclock > tsleep)
In the sleep state:1. Wait until next wake-up time, twake
2. Transition to rest state
17
tsleep
twake
tclock
Sleep
Awake
Modeling periodic spikes: sleep state
Details
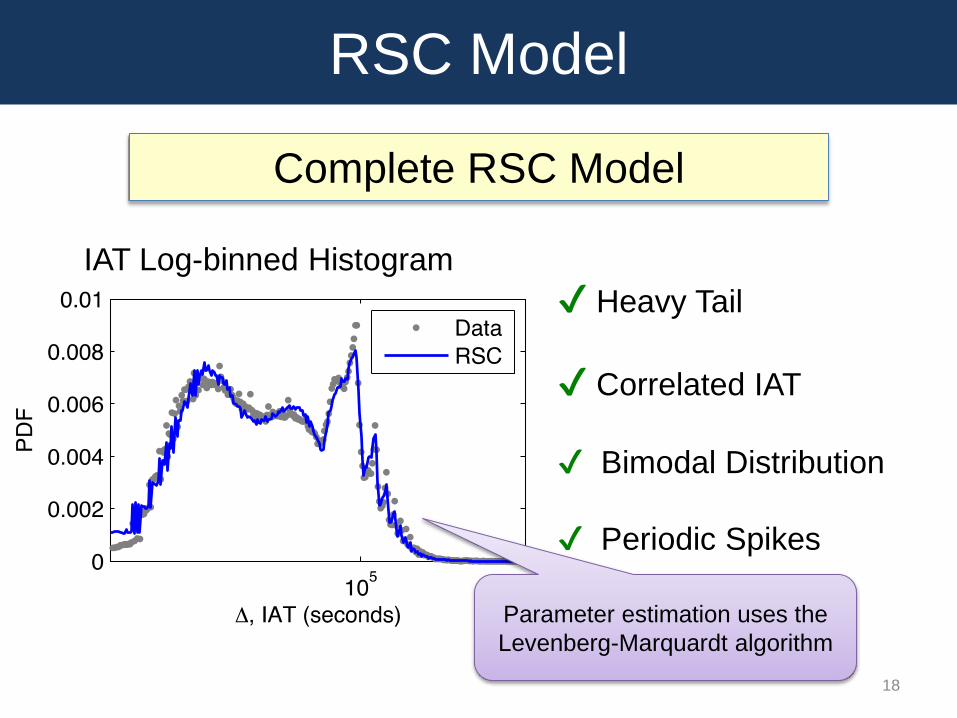
RSC Model
18
✔ Heavy Tail
✔ Correlated IAT
✔ Bimodal Distribution
✔ Periodic Spikes
Parameter estimation uses the
Levenberg-Marquardt algorithm
IAT Log-binned Histogram
Complete RSC Model
Outline
Pattern Mining
Modeling
Bot DetectionCan we spot automated behavior based only on time-stamp data?
Experiments
Conclusion
19
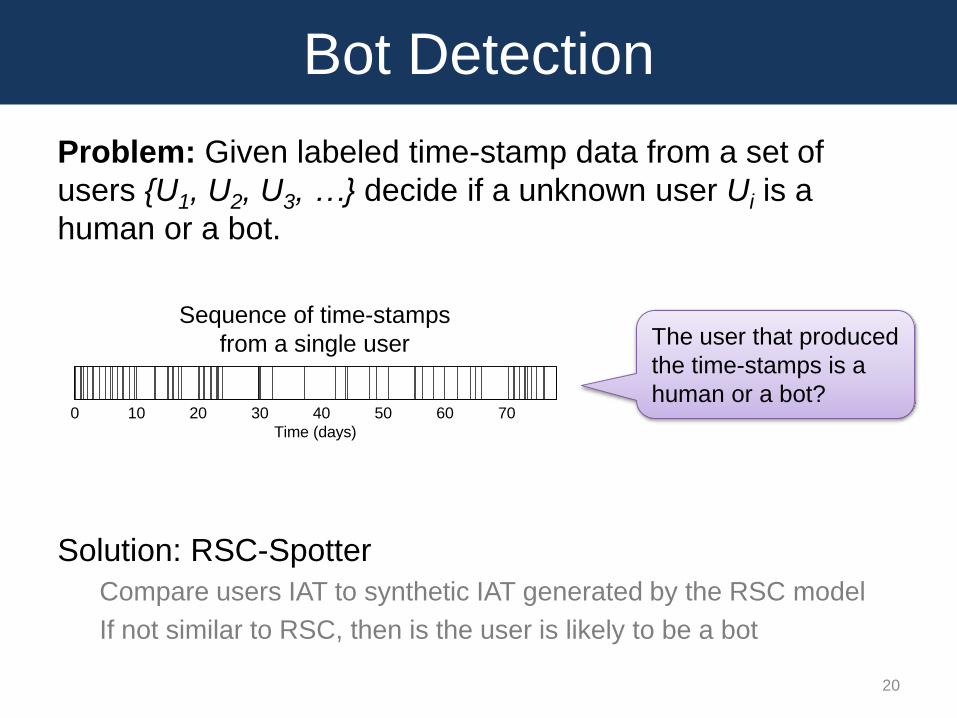
Bot Detection
Problem: Given labeled time-stamp data from a set of
users {U1, U2, U3, …} decide if a unknown user Ui is a
human or a bot.
Solution: RSC-Spotter
Compare users IAT to synthetic IAT generated by the RSC model
If not similar to RSC, then is the user is likely to be a bot
20
0 10 20 30 40 50 60 70
Time (days)
Sequence of time-stamps
from a single user The user that produced
the time-stamps is a
human or a bot?
RSC-Spotter
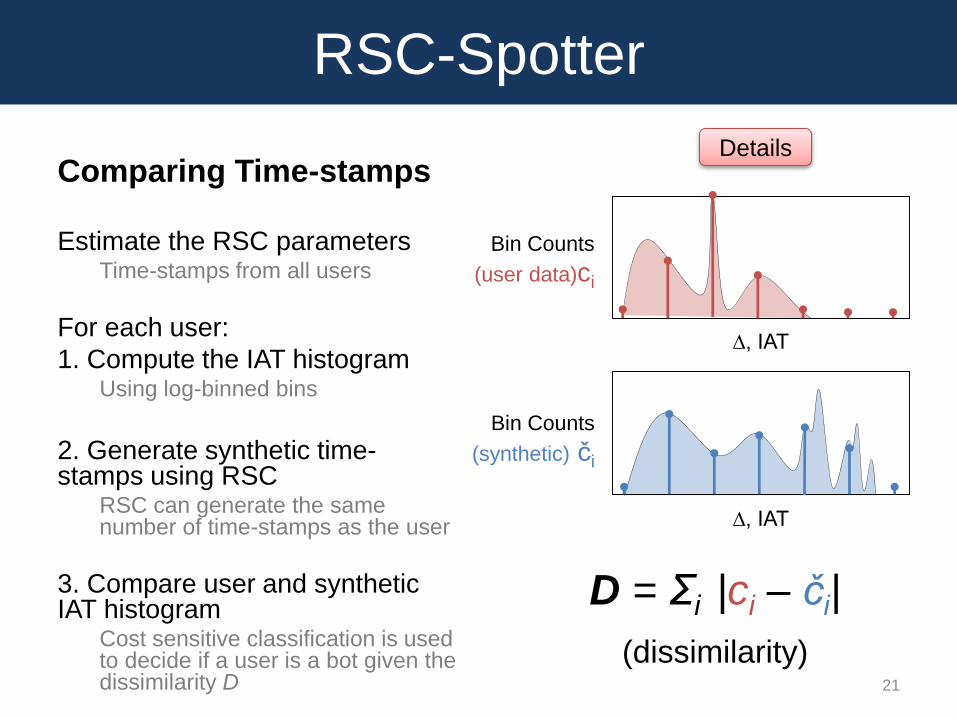
Comparing Time-stamps
Estimate the RSC parametersTime-stamps from all users
For each user:
1. Compute the IAT histogram Using log-binned bins
2. Generate synthetic time-stamps using RSC
RSC can generate the same number of time-stamps as the user
3. Compare user and synthetic IAT histogram
Cost sensitive classification is used to decide if a user is a bot given the dissimilarity D 21
∆, IAT
Bin Counts
(user data)ci
∆, IAT
Bin Counts
(synthetic) či
D = Σi |ci – či|
(dissimilarity)
Details
Outline
Pattern Mining
Modeling
Bot Detection
ExperimentsCan RSC match real data?
How well can RSC-Spotter detect bots?
Conclusion
22
Reddit Users
Users
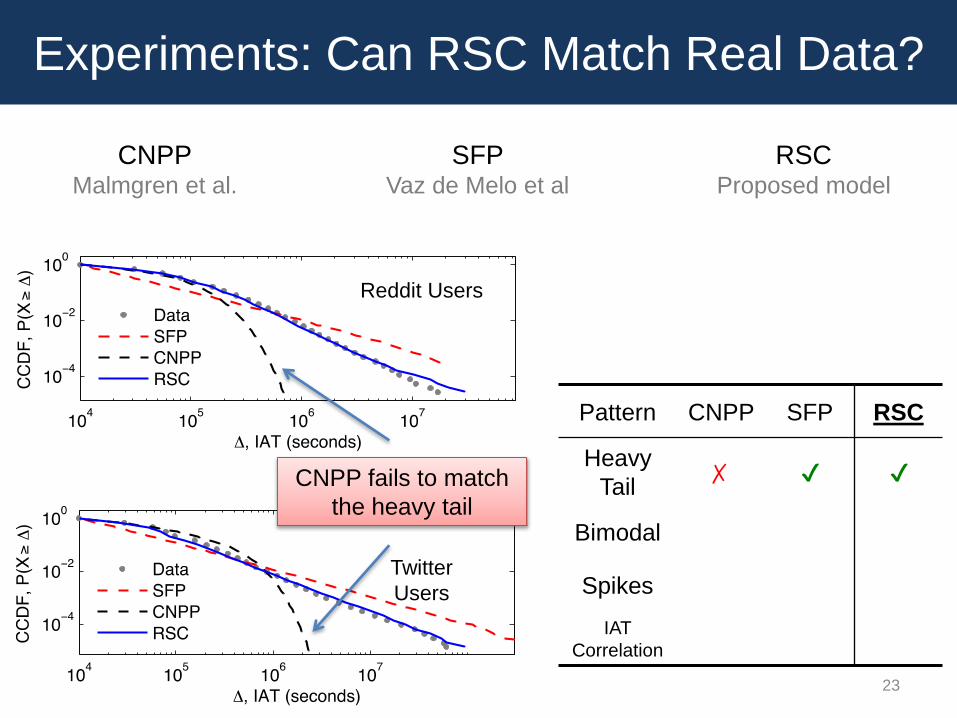
Experiments: Can RSC Match Real Data?
23
Pattern CNPP SFP RSC
Heavy
Tail
Bimodal
Spikes
IAT
Correlation
RSCProposed model
CNPPMalmgren et al.
SFPVaz de Melo et al
CNPP fails to match
the heavy tail
✗ ✔ ✔
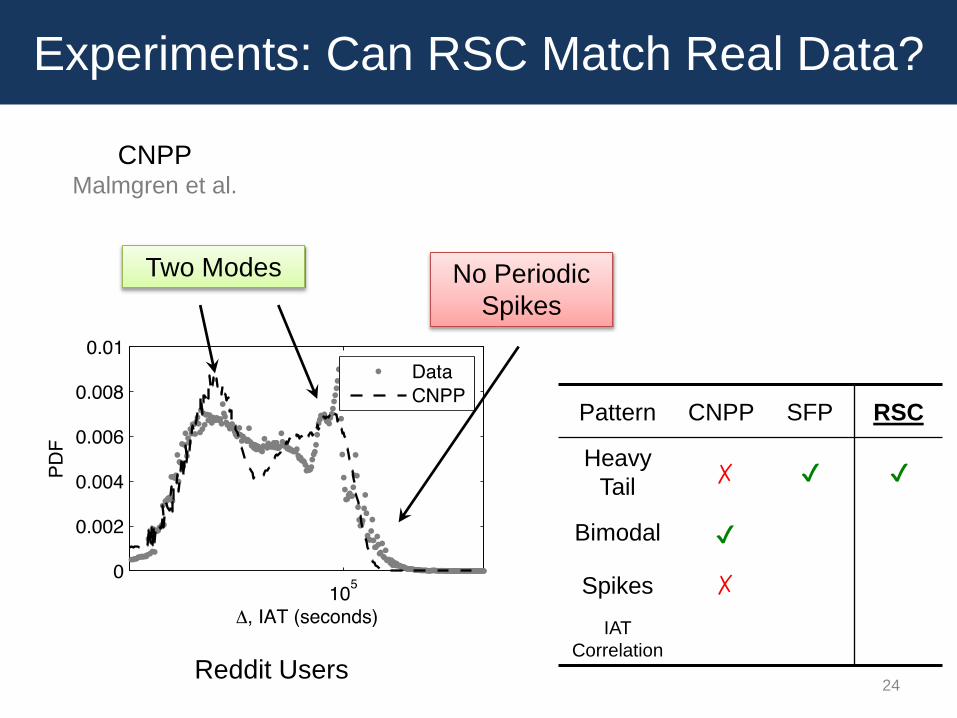
Experiments: Can RSC Match Real Data?
24
Pattern CNPP SFP RSC
Heavy
Tail
Bimodal
Spikes
IAT
Correlation
✗ ✔
✗
✔
✔
Two Modes No Periodic
Spikes
Reddit Users
CNPPMalmgren et al.
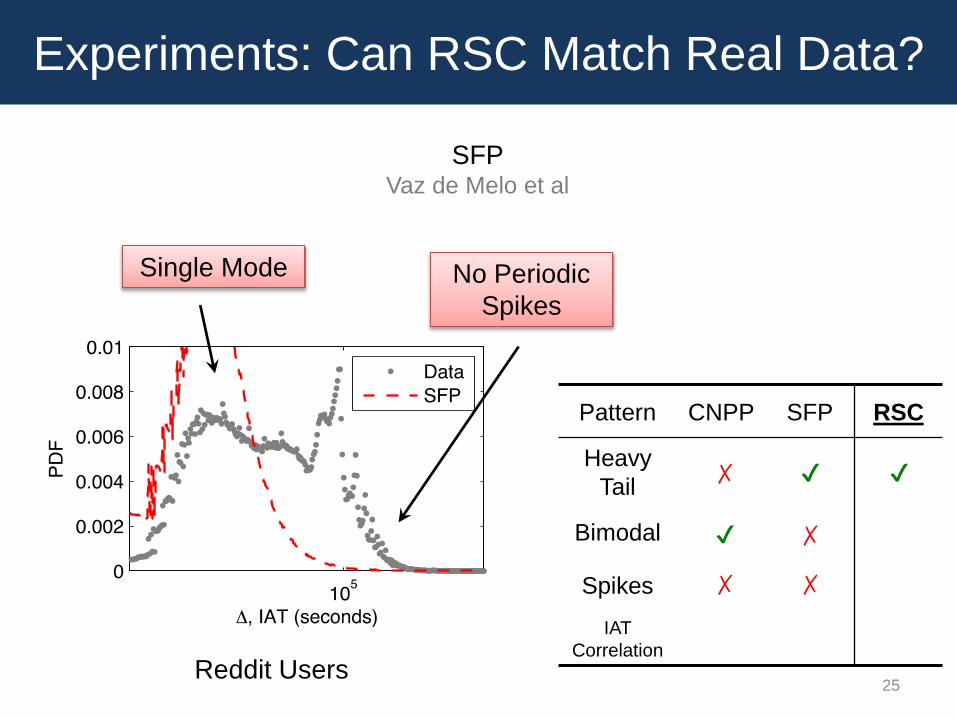
Experiments: Can RSC Match Real Data?
25
Pattern CNPP SFP RSC
Heavy
Tail
Bimodal
Spikes
IAT
Correlation
✗ ✔
✗
✗
✗
✔
✔
Reddit Users
Single Mode No Periodic
Spikes
SFPVaz de Melo et al
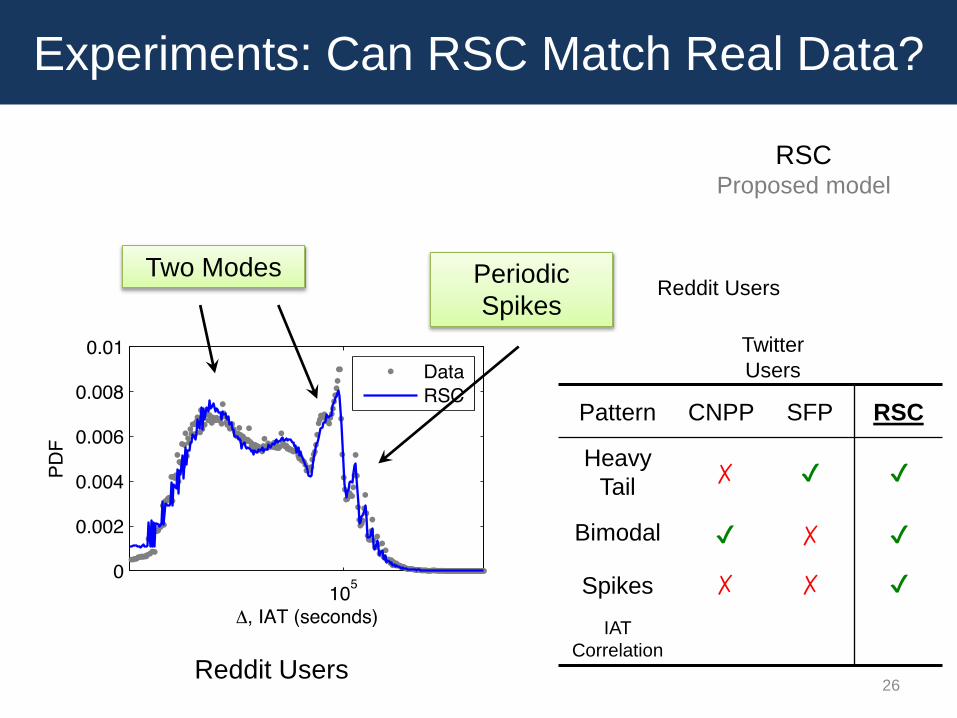
Experiments: Can RSC Match Real Data?
26
Pattern CNPP SFP RSC
Heavy
Tail
Bimodal
Spikes
IAT
Correlation
✗ ✔
✗
✗
✗
✔
✔
✔
✔
Reddit Users
Users
Two Modes Periodic
Spikes
Reddit Users
RSCProposed model
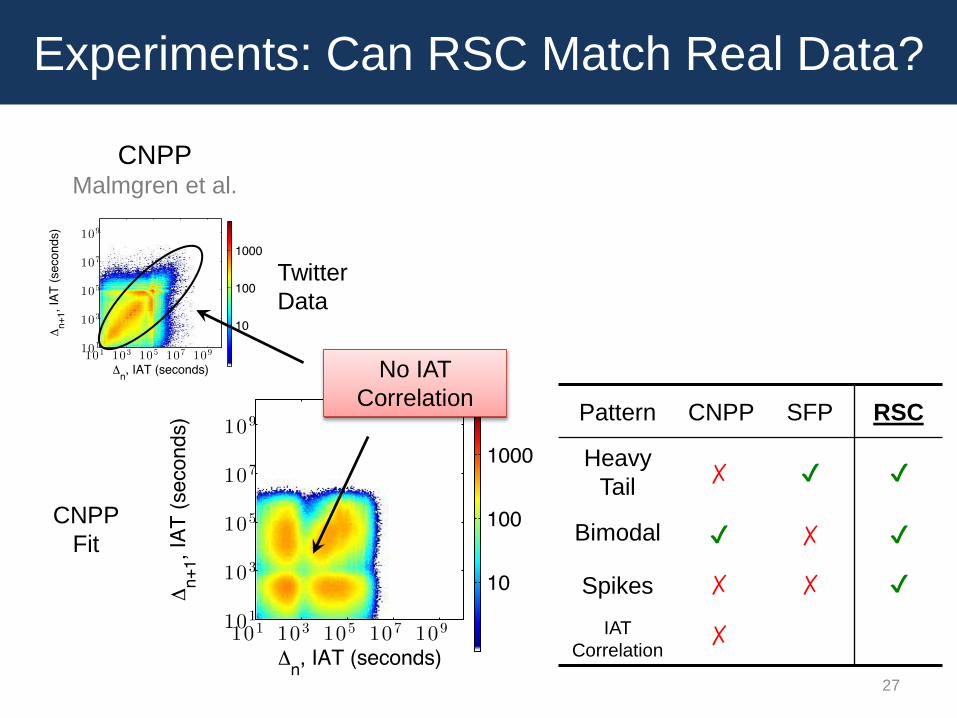
Experiments: Can RSC Match Real Data?
27
Pattern CNPP SFP RSC
Heavy
Tail
Bimodal
Spikes
IAT
Correlation
✗ ✔
✗
✗
✗
✗
✔
✔
✔
✔
Data
CNPP
Fit
No IAT
Correlation
CNPPMalmgren et al.
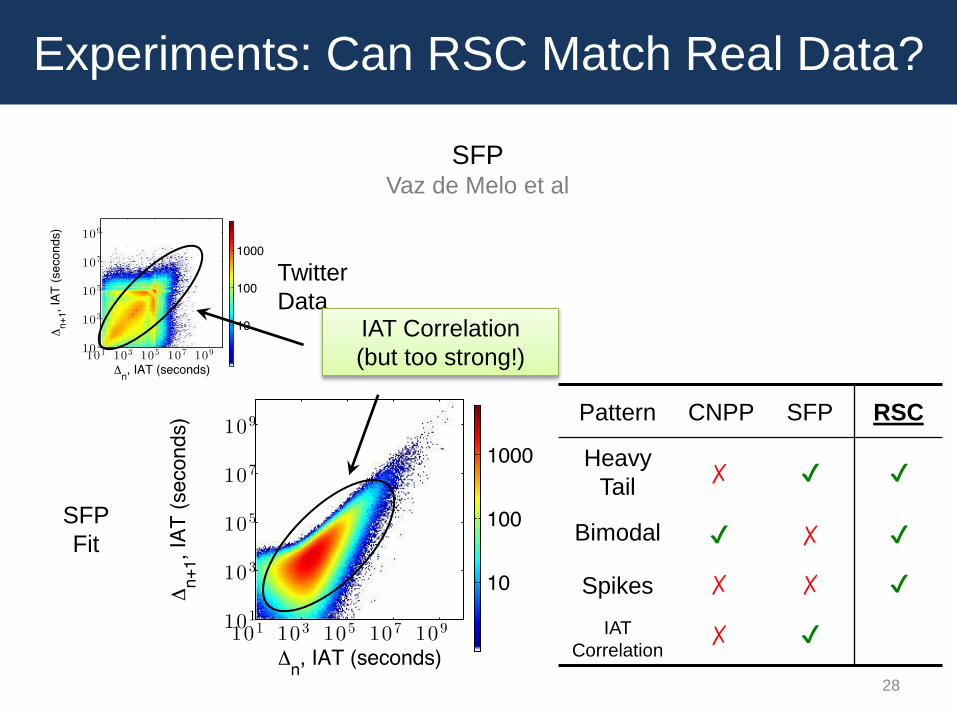
Experiments: Can RSC Match Real Data?
28
Pattern CNPP SFP RSC
Heavy
Tail
Bimodal
Spikes
IAT
Correlation
✗ ✔
✗
✗
✗
✗
✔
✔
✔
✔
✔
Data
SFP
Fit
IAT Correlation
(but too strong!)
SFPVaz de Melo et al
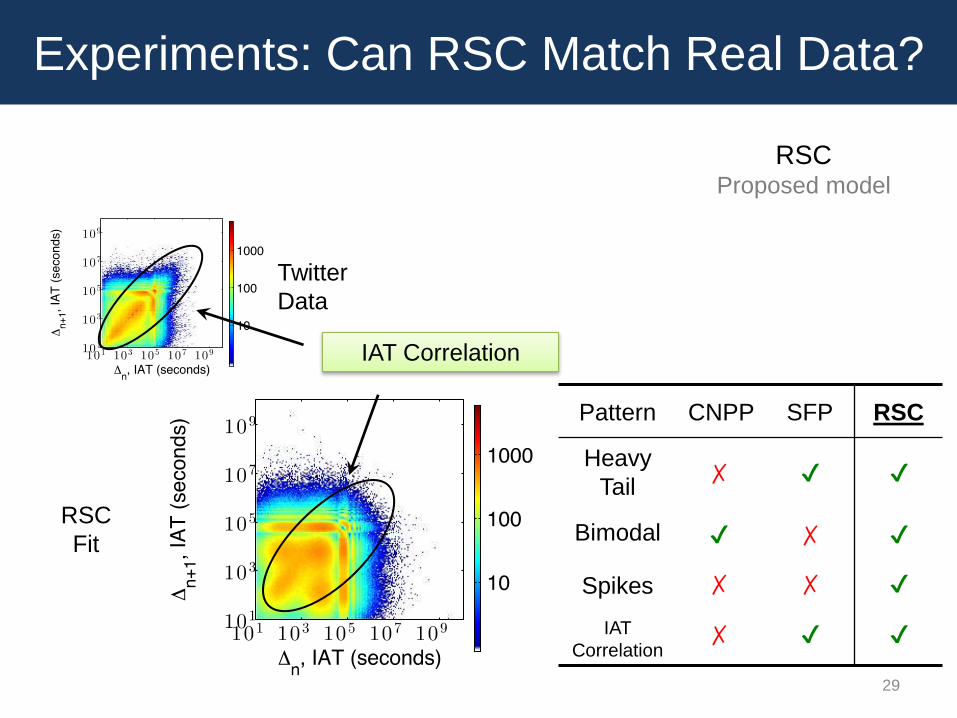
Experiments: Can RSC Match Real Data?
29
Pattern CNPP SFP RSC
Heavy
Tail
Bimodal
Spikes
IAT
Correlation
✗ ✔
✗
✗
✗
✗
✔
✔
✔
✔
✔
✔
Data
RSC
Fit
IAT Correlation
RSCProposed model
Outline
Pattern Mining
Modeling
Bot Detection
ExperimentsCan RSC Match Real Data?
How well can RSC-Spotter detect bots?
Conclusion
30
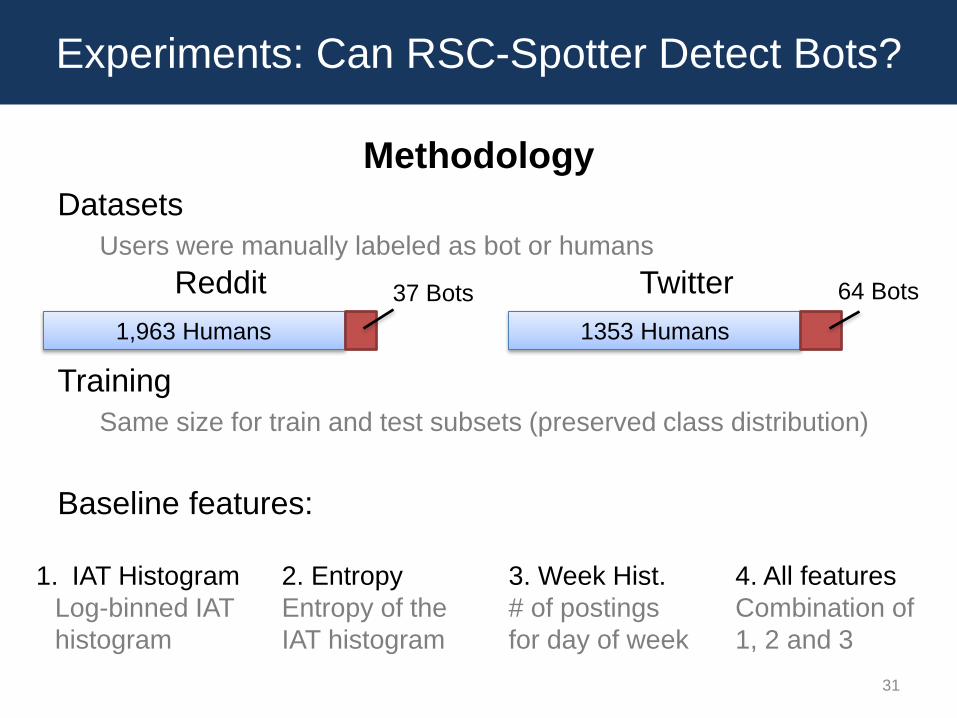
Experiments: Can RSC-Spotter Detect Bots?
Methodology
Datasets
Users were manually labeled as bot or humans
Training
Same size for train and test subsets (preserved class distribution)
Baseline features:
31
1,963 Humans
37 BotsReddit
1353 Humans
64 BotsTwitter
1. IAT Histogram
Log-binned IAT
histogram
2. Entropy
Entropy of the
IAT histogram
3. Week Hist.
# of postings
for day of week
4. All features
Combination of
1, 2 and 3
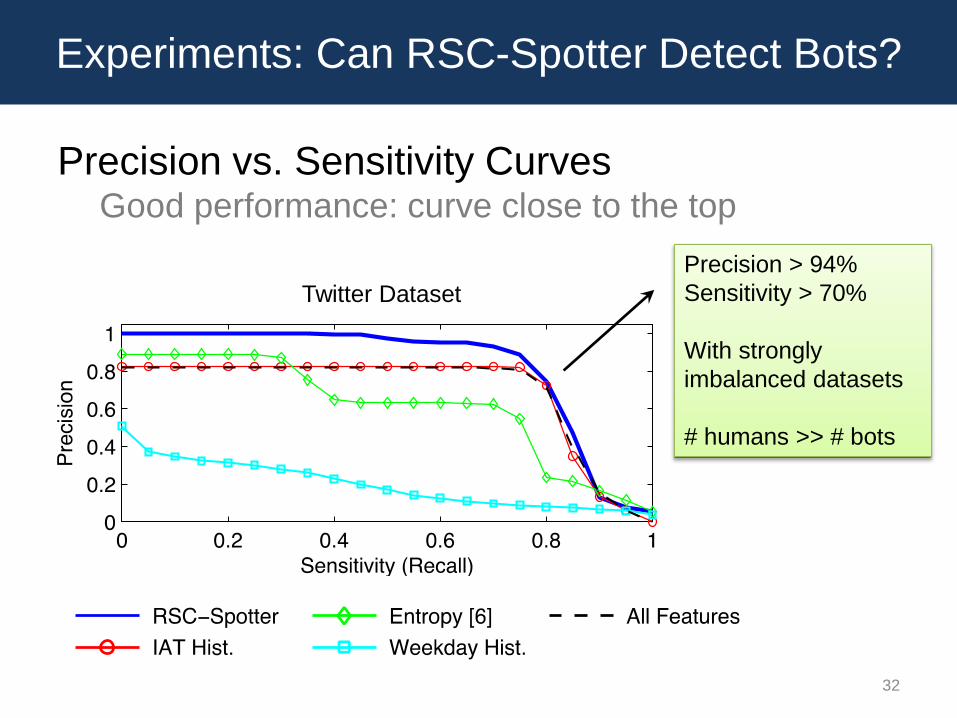
Experiments: Can RSC-Spotter Detect Bots?
Precision vs. Sensitivity CurvesGood performance: curve close to the top
32
Precision > 94%
Sensitivity > 70%
With strongly
imbalanced datasets
# humans >> # bots
Twitter Dataset
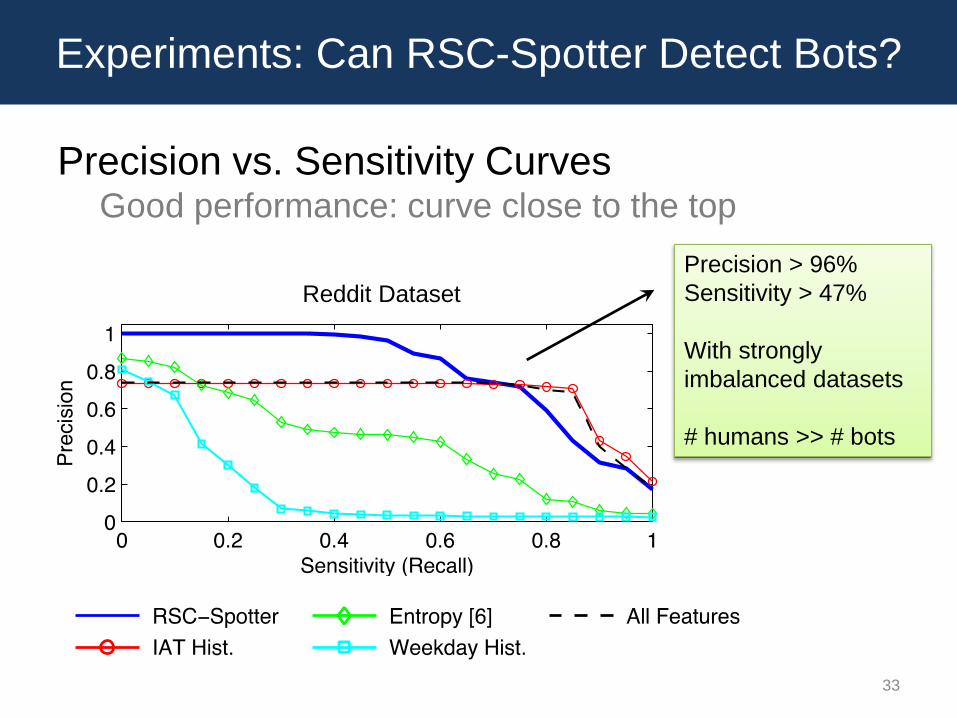
Experiments: Can RSC-Spotter Detect Bots?
Precision vs. Sensitivity CurvesGood performance: curve close to the top
33
Precision > 96%
Sensitivity > 47%
With strongly
imbalanced datasets
# humans >> # bots
Reddit Dataset
Outline
Pattern Mining
Modeling
Bot Detection
Experiments
Conclusion
34
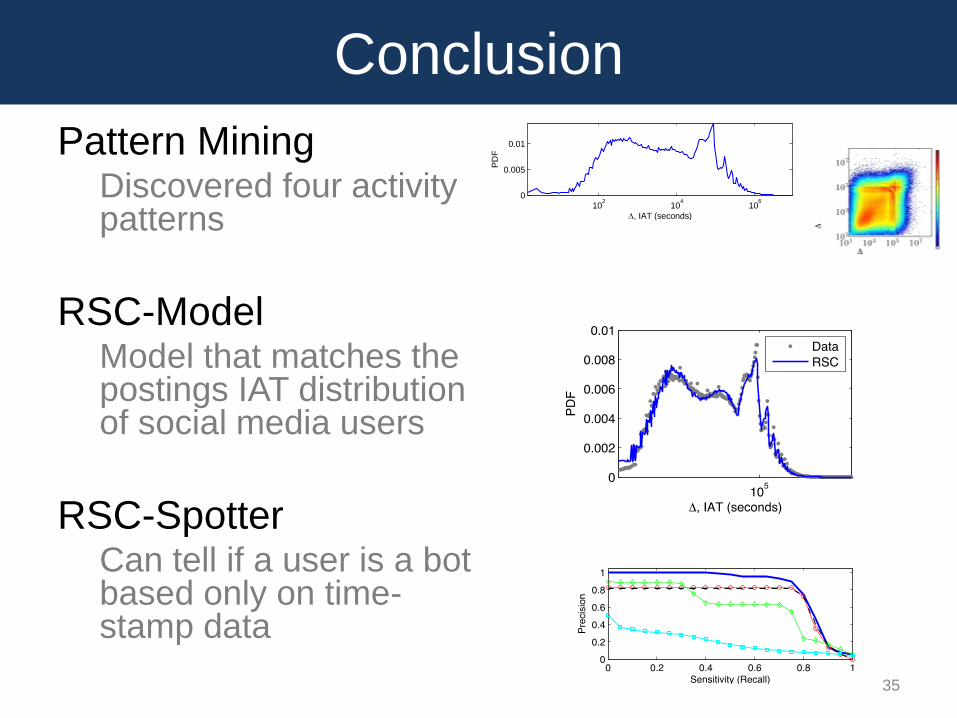
Conclusion
Pattern MiningDiscovered four activity patterns
RSC-ModelModel that matches the postings IAT distribution of social media users
RSC-SpotterCan tell if a user is a bot based only on time-stamp data
35
102
104
106
0
0.005
0.01
D, IAT (seconds)
PD
F
Thank you!
Alceu F. Costa* Yuto Yamaguchi Agma J. M. Traina
Caetano Traina Jr. Christos Faloutsos
36
Universidade
de São Paulo
Datasets and Code: https://github.com/alceufc/rsc_model

Extra Slides
37
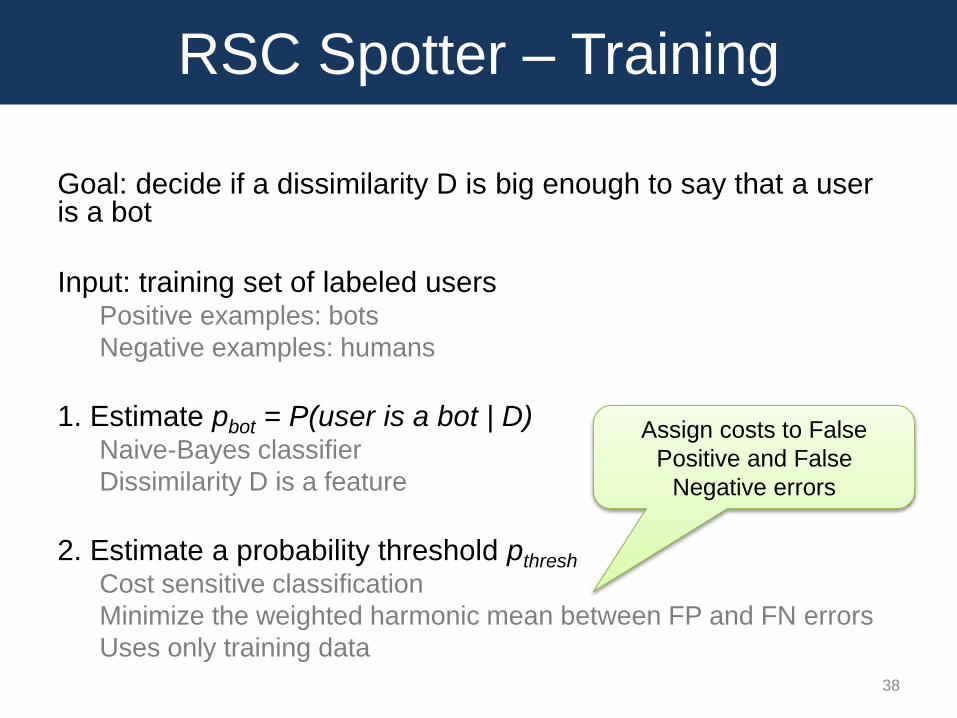
RSC Spotter – Training
Goal: decide if a dissimilarity D is big enough to say that a user is a bot
Input: training set of labeled usersPositive examples: bots
Negative examples: humans
1. Estimate pbot = P(user is a bot | D)Naive-Bayes classifier
Dissimilarity D is a feature
2. Estimate a probability threshold pthresh
Cost sensitive classification
Minimize the weighted harmonic mean between FP and FN errors
Uses only training data
38
Assign costs to False
Positive and False
Negative errors
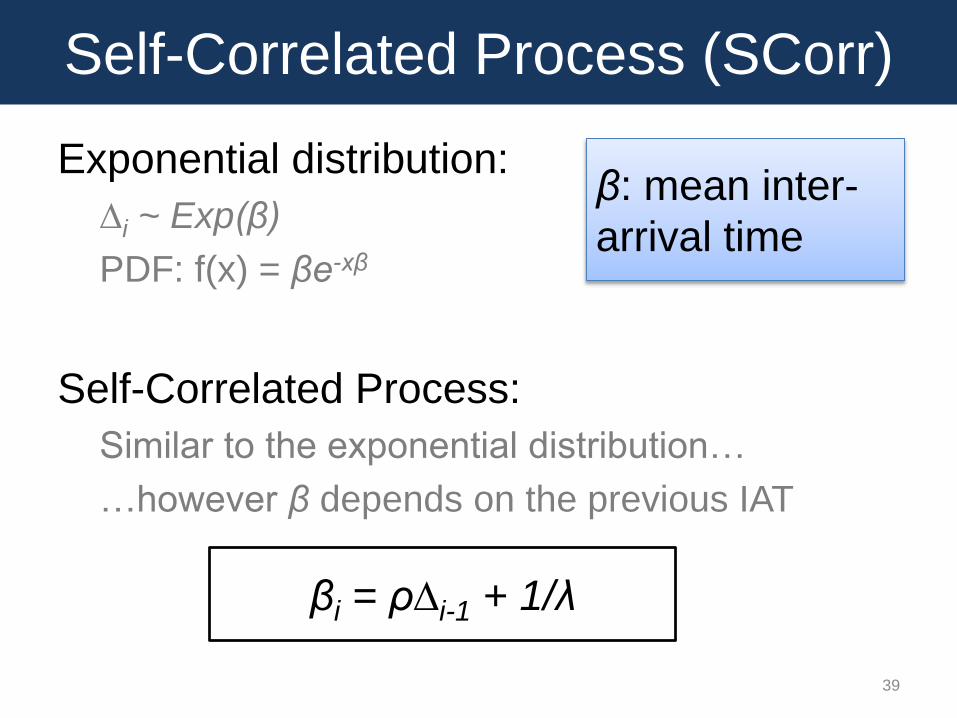
Self-Correlated Process (SCorr)
Exponential distribution:
∆i ~ Exp(β)
PDF: f(x) = βe-xβ
Self-Correlated Process:
Similar to the exponential distribution…
…however β depends on the previous IAT
39
β: mean inter-
arrival time
βi = ρ∆i-1 + 1/λ
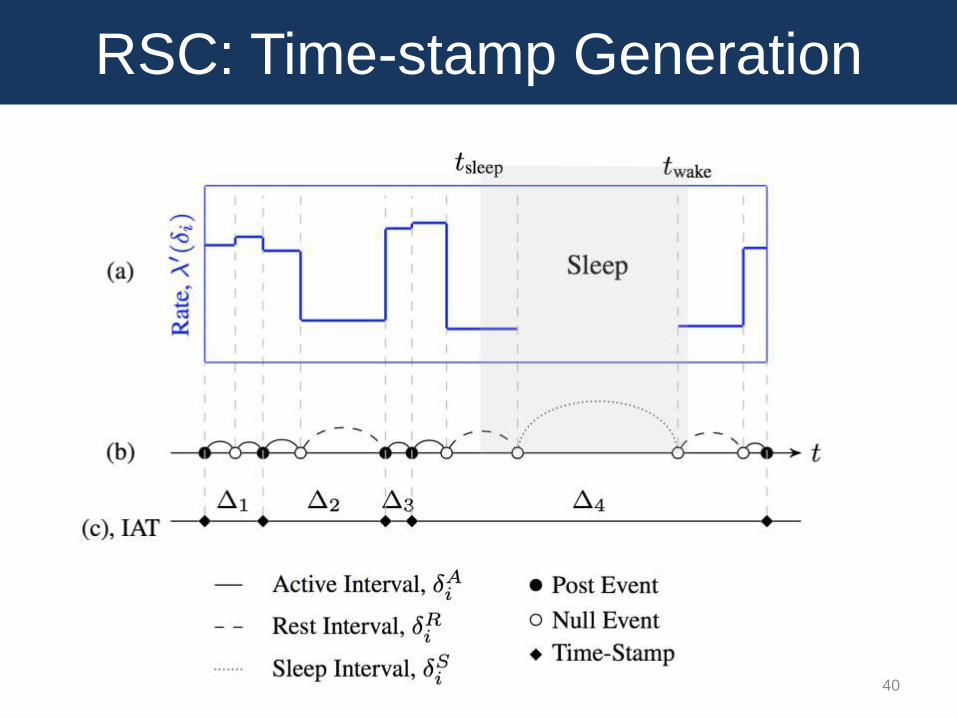
RSC: Time-stamp Generation
40
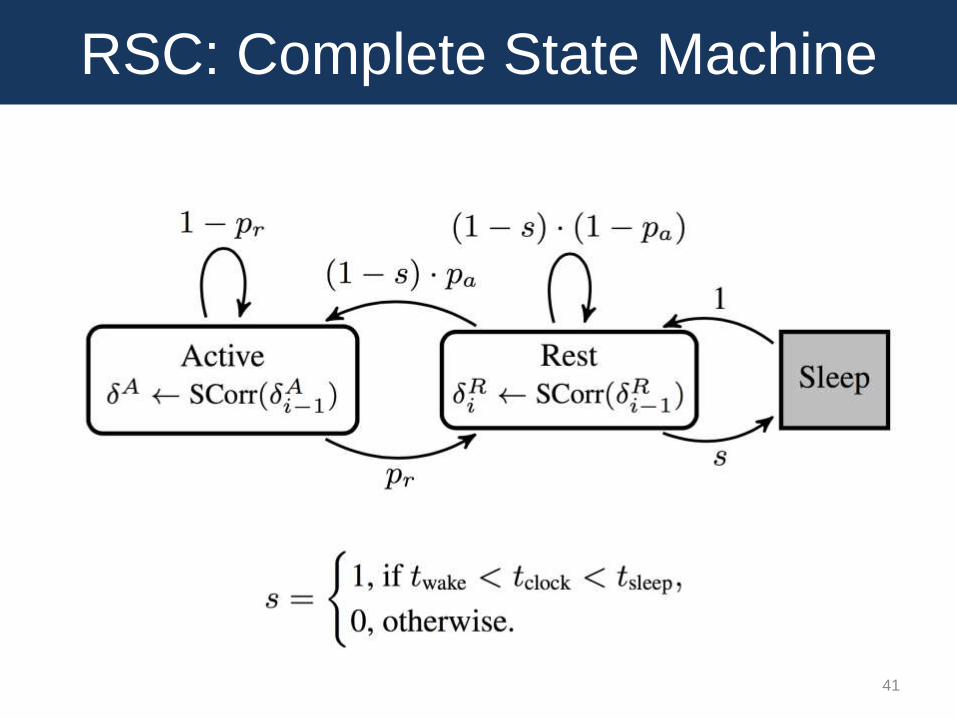
RSC: Complete State Machine
41