rsg results 070809
TRANSCRIPT

Econometric Analysis of RSG at Econometric Analysis of RSG at the Midwest ISOthe Midwest ISO
Presentation to MISO RSG TFPresentation to MISO RSG TFCarmel, INCarmel, IN
July 8, 2009July 8, 2009
July 8, 2009July 8, 2009GreeningGreening
Brief Description of ProblemBrief Description of Problem FERC has determined that RSG should be FERC has determined that RSG should be
distributed on a cost causality basis. However, this distributed on a cost causality basis. However, this has not proven to be an easy task over the last four has not proven to be an easy task over the last four years.years.
Various analyses have indicated potential causes of Various analyses have indicated potential causes of RSG, but not provided a marginal contribution for RSG, but not provided a marginal contribution for each. Further, previous analyses have failed to each. Further, previous analyses have failed to include multiple sources in a single, statistically include multiple sources in a single, statistically valid model.valid model.
This analysis presents the results of a statistical This analysis presents the results of a statistical analysis including all of hypothesized causes of RSG analysis including all of hypothesized causes of RSG where data was available in a single framework. where data was available in a single framework. From this work we are able to quantify the marginal From this work we are able to quantify the marginal contribution of these factors to hourly RSG MWP.contribution of these factors to hourly RSG MWP.
July 8, 2009July 8, 2009GreeningGreening
Summary of ResultsSummary of Results A statistically significant model can be A statistically significant model can be
developed between RSG MWP and many developed between RSG MWP and many of the factors believed to be contributing of the factors believed to be contributing to this charge. to this charge.
This framework can be used to:This framework can be used to: Focus efforts on tariff re-designFocus efforts on tariff re-design Construct a tariff that is cost-causality based, Construct a tariff that is cost-causality based,
provides provides ex anteex ante pricing, and is equitable, pricing, and is equitable, flexible, and transparent.flexible, and transparent.
Serve as the basis of a RSG metric Serve as the basis of a RSG metric development process.development process.
July 8, 2009July 8, 2009GreeningGreening
Summary of ResultsSummary of Results(Continued)(Continued)
These results indicate that levels of RSG These results indicate that levels of RSG contributed by various factors vary substantially.contributed by various factors vary substantially. Load contributes approximately 23% of RSG MWP over the whole Load contributes approximately 23% of RSG MWP over the whole
period.period. Generators contribute approximately 39% to RSG MWP over the whole Generators contribute approximately 39% to RSG MWP over the whole
period.period. Changes in NSI contribute approximately 30% to RSG MWP over the Changes in NSI contribute approximately 30% to RSG MWP over the
entire period.entire period. Virtual supply contributes approximately 1.3%.Virtual supply contributes approximately 1.3%. Factors outside MPs control contribute the remainder.Factors outside MPs control contribute the remainder.
Further, these results raise any number of Further, these results raise any number of questions concerning the cost causality basis, questions concerning the cost causality basis, equity, and effectiveness of the RSG Re-design equity, and effectiveness of the RSG Re-design and similar allocation schemes or proposed and similar allocation schemes or proposed solutions.solutions.
July 8, 2009July 8, 2009GreeningGreening
Data SourcesData Sources
All data were extracted from publicly available All data were extracted from publicly available reports on the MISO website.reports on the MISO website.
Several variables that might explain RSG MWP Several variables that might explain RSG MWP were not available. Inclusion of these variables were not available. Inclusion of these variables would refine the results.would refine the results. Only the number of binding constraints were Only the number of binding constraints were
available, and not the MWs dispatched to address available, and not the MWs dispatched to address a constraint.a constraint.
Intra-hour changes in RT load, Econmax, and Intra-hour changes in RT load, Econmax, and NSI.NSI.
Headroom, and therefore a proxy was defined.Headroom, and therefore a proxy was defined.
July 8, 2009July 8, 2009GreeningGreening
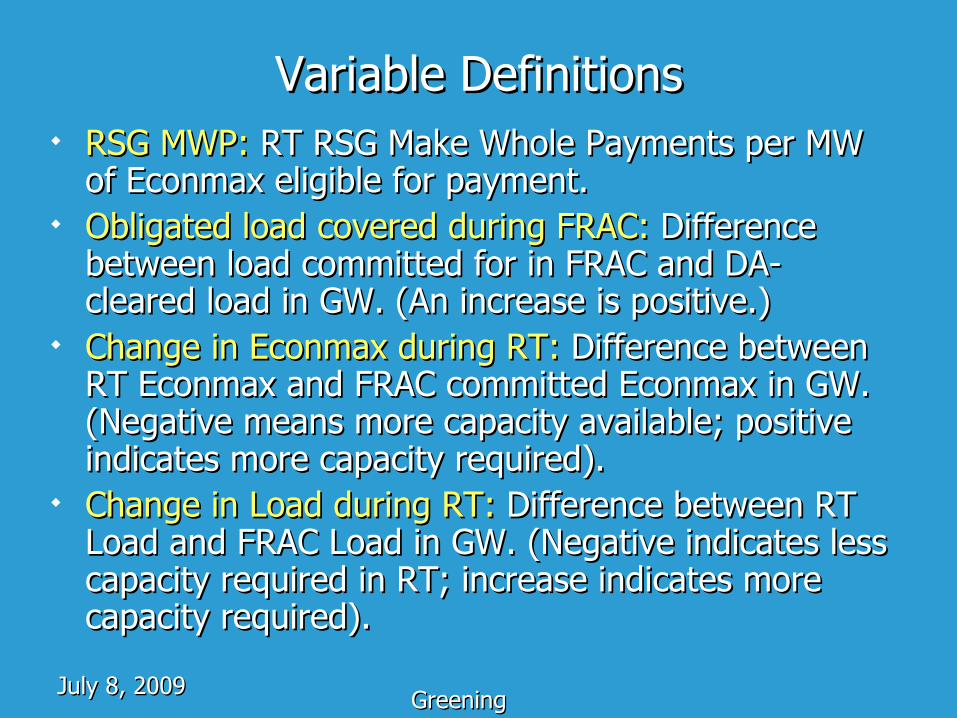
Variable DefinitionsVariable Definitions RSG MWP: RSG MWP: RT RSG Make Whole Payments per MW RT RSG Make Whole Payments per MW
of Econmax eligible for payment.of Econmax eligible for payment. Obligated load covered during FRAC:Obligated load covered during FRAC: Difference Difference
between load committed for in FRAC and DA- between load committed for in FRAC and DA- cleared load in GW. (An increase is positive.)cleared load in GW. (An increase is positive.)
Change in Econmax during RT:Change in Econmax during RT: Difference between Difference between RT Econmax and FRAC committed Econmax in GW. RT Econmax and FRAC committed Econmax in GW. (Negative means more capacity available; positive (Negative means more capacity available; positive indicates more capacity required). indicates more capacity required).
Change in Load during RT: Change in Load during RT: Difference between RT Difference between RT Load and FRAC Load in GW. (Negative indicates less Load and FRAC Load in GW. (Negative indicates less capacity required in RT; increase indicates more capacity required in RT; increase indicates more capacity required).capacity required).
July 8, 2009July 8, 2009GreeningGreening
Variable DefinitionsVariable Definitions(Continued)(Continued)
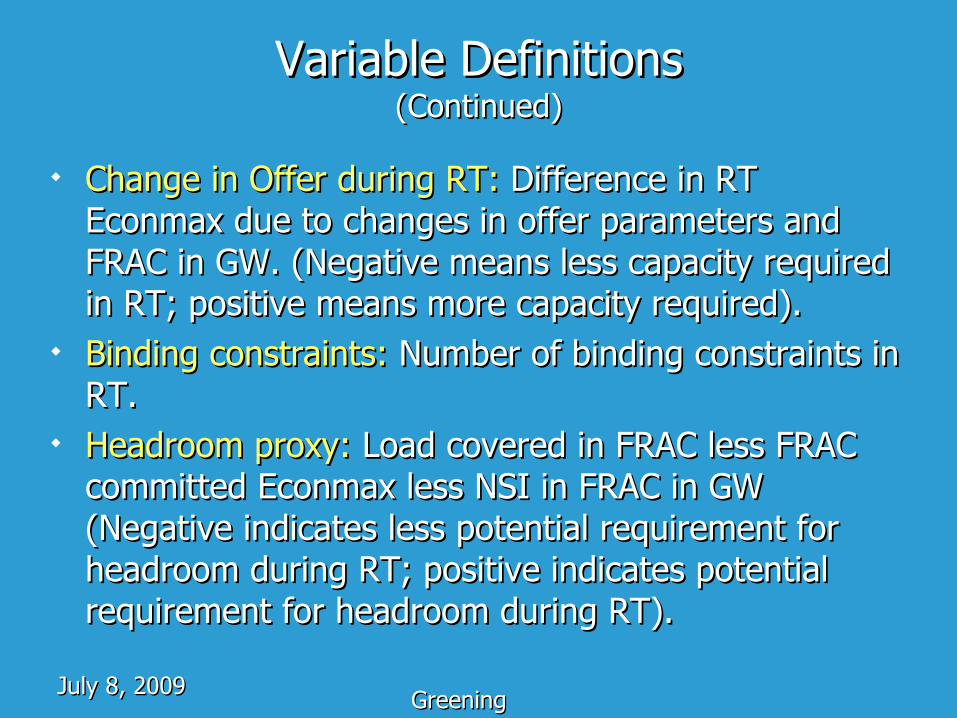
Change in Offer during RT:Change in Offer during RT: Difference in RT Difference in RT Econmax due to changes in offer parameters and Econmax due to changes in offer parameters and FRAC in GW. (Negative means less capacity required FRAC in GW. (Negative means less capacity required in RT; positive means more capacity required).in RT; positive means more capacity required).
Binding constraints:Binding constraints: Number of binding constraints in Number of binding constraints in RT.RT.
Headroom proxy:Headroom proxy: Load covered in FRAC less FRAC Load covered in FRAC less FRAC committed Econmax less NSI in FRAC in GW committed Econmax less NSI in FRAC in GW (Negative indicates less potential requirement for (Negative indicates less potential requirement for headroom during RT; positive indicates potential headroom during RT; positive indicates potential requirement for headroom during RT). requirement for headroom during RT).
July 8, 2009July 8, 2009GreeningGreening
Variable DefinitionsVariable Definitions(Continued)(Continued)
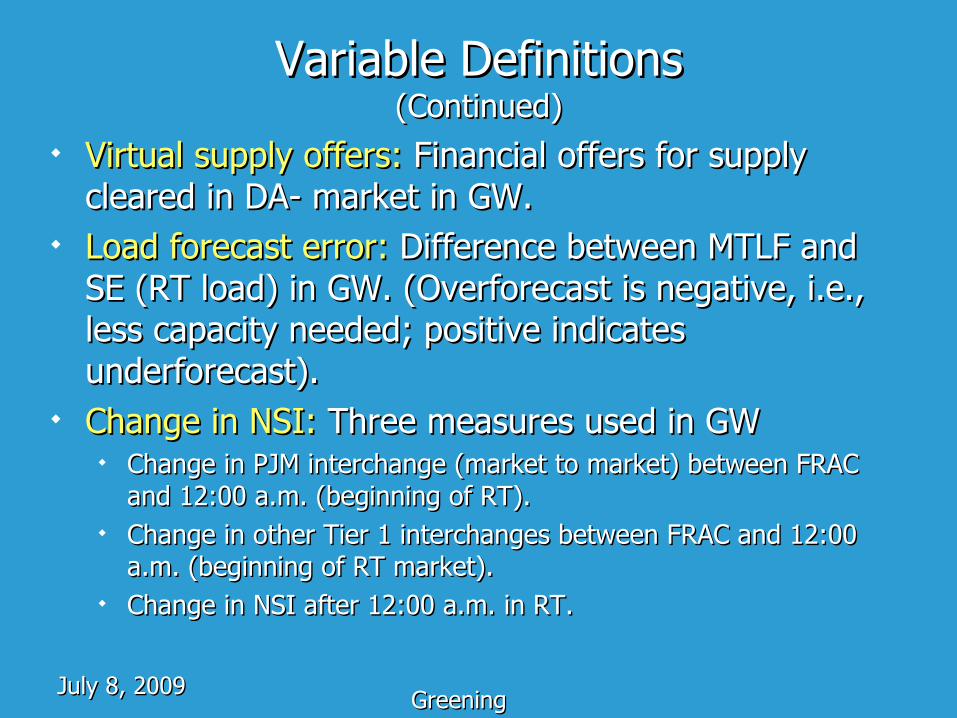
Virtual supply offers:Virtual supply offers: Financial offers for supply Financial offers for supply cleared in DA- market in GW.cleared in DA- market in GW.
Load forecast error:Load forecast error: Difference between MTLF and Difference between MTLF and SE (RT load) in GW. (Overforecast is negative, i.e., SE (RT load) in GW. (Overforecast is negative, i.e., less capacity needed; positive indicates less capacity needed; positive indicates underforecast).underforecast).
Change in NSI:Change in NSI: Three measures used in GW Three measures used in GW Change in PJM interchange (market to market) between FRAC Change in PJM interchange (market to market) between FRAC
and 12:00 a.m. (beginning of RT).and 12:00 a.m. (beginning of RT). Change in other Tier 1 interchanges between FRAC and 12:00 Change in other Tier 1 interchanges between FRAC and 12:00
a.m. (beginning of RT market).a.m. (beginning of RT market). Change in NSI after 12:00 a.m. in RT.Change in NSI after 12:00 a.m. in RT.
July 8, 2009July 8, 2009GreeningGreening
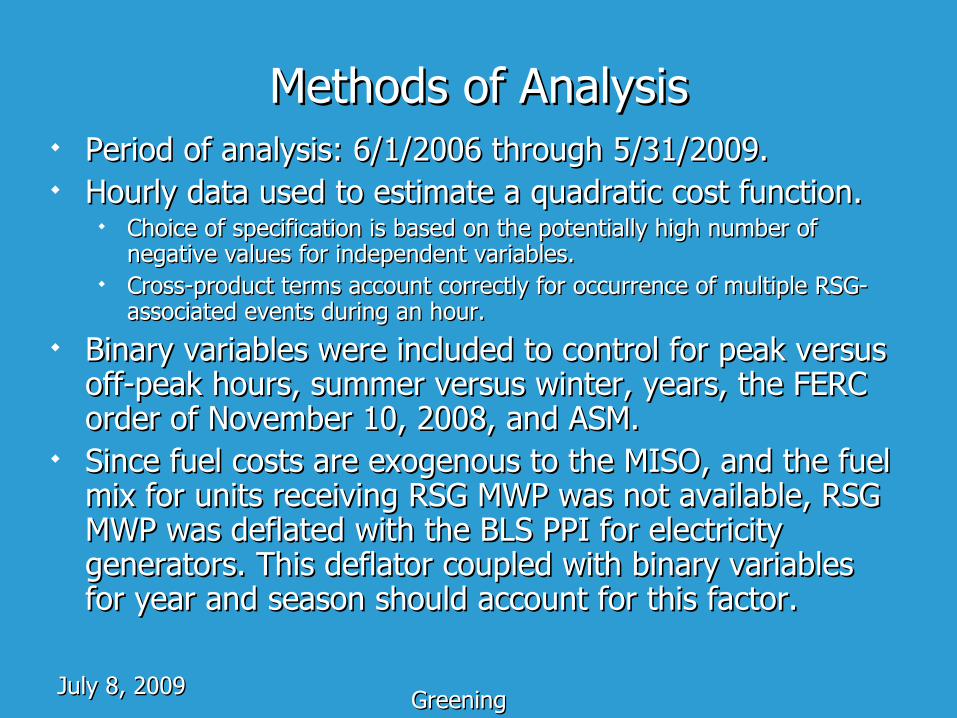
Methods of AnalysisMethods of Analysis Period of analysis: 6/1/2006 through 5/31/2009.Period of analysis: 6/1/2006 through 5/31/2009. Hourly data used to estimate a quadratic cost function.Hourly data used to estimate a quadratic cost function.
Choice of specification is based on the potentially high number of Choice of specification is based on the potentially high number of negative values for independent variables.negative values for independent variables.
Cross-product terms account correctly for occurrence of multiple RSG-Cross-product terms account correctly for occurrence of multiple RSG-associated events during an hour. associated events during an hour.
Binary variables were included to control for peak versus Binary variables were included to control for peak versus off-peak hours, summer versus winter, years, the FERC off-peak hours, summer versus winter, years, the FERC order of November 10, 2008, and ASM.order of November 10, 2008, and ASM.
Since fuel costs are exogenous to the MISO, and the fuel Since fuel costs are exogenous to the MISO, and the fuel mix for units receiving RSG MWP was not available, RSG mix for units receiving RSG MWP was not available, RSG MWP was deflated with the BLS PPI for electricity MWP was deflated with the BLS PPI for electricity generators. This deflator coupled with binary variables generators. This deflator coupled with binary variables for year and season should account for this factor.for year and season should account for this factor.
July 8, 2009July 8, 2009GreeningGreening
Methods of AnalysisMethods of Analysis(Continued)(Continued)
Model estimated using a Tobit (dependent Model estimated using a Tobit (dependent variable left censored at zero and variable left censored at zero and assuming a gaussian distribution) assuming a gaussian distribution) implemented with maximum likelihood.implemented with maximum likelihood. Test statistics indicate that the overall model is Test statistics indicate that the overall model is
extremely significant. extremely significant. Over 80 percent of the coefficients have Over 80 percent of the coefficients have
significance levels of 90% or greater.significance levels of 90% or greater. Robust standard errors were obtained with Robust standard errors were obtained with
a White’s estimator.a White’s estimator.
July 8, 2009July 8, 2009GreeningGreening
Marginal Contribution to RSGMarginal Contribution to RSG Impacts on RSG MWP were estimated by evaluating the Impacts on RSG MWP were estimated by evaluating the
first partial derivative with respect to each continuous first partial derivative with respect to each continuous variable. This provides the change in RSG MWP with variable. This provides the change in RSG MWP with respect to a change in the specified continuous variable, respect to a change in the specified continuous variable, i.e., the marginal contribution to RSG MWP.i.e., the marginal contribution to RSG MWP.
Three cases were evaluated at variable means.Three cases were evaluated at variable means. The whole periodThe whole period The period before ASM startedThe period before ASM started The period after ASMThe period after ASM
In addition to the expected value, upper and lower In addition to the expected value, upper and lower bounds were defined using the 90% jointly determined bounds were defined using the 90% jointly determined confidence intervals of the model coefficients and the confidence intervals of the model coefficients and the 90% confidence interval of the explanatory variables. 90% confidence interval of the explanatory variables. These ranges are not symmetric due to the non-linearity These ranges are not symmetric due to the non-linearity of the underlying processes.of the underlying processes.
July 8, 2009July 8, 2009GreeningGreening
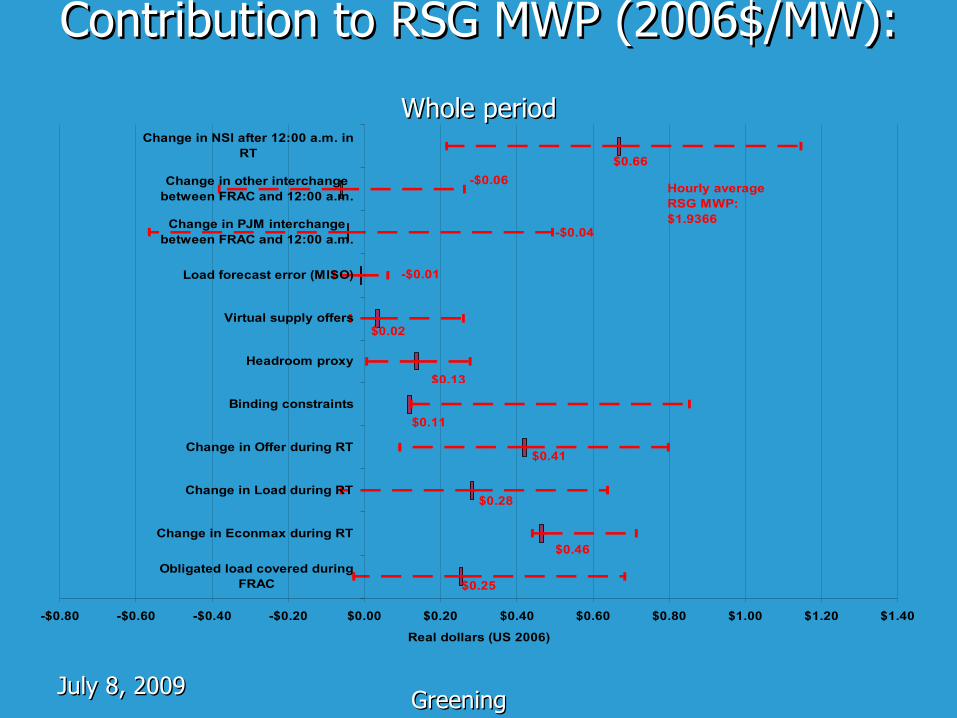
Contribution to RSG MWP (2006$/MW):Contribution to RSG MWP (2006$/MW):
Whole periodWhole period
-$0.80 -$0.60 -$0.40 -$0.20 $0.00 $0.20 $0.40 $0.60 $0.80 $1.00 $1.20 $1.40
Obligated load covered duringFRAC
Change in Econmax during RT
Change in Load during RT
Change in Offer during RT
Binding constraints
Headroom proxy
Virtual supply offers
Load forecast error (MISO)
Change in PJM interchangebetween FRAC and 12:00 a.m.
Change in other interchangebetween FRAC and 12:00 a.m.
Change in NSI after 12:00 a.m. inRT
Real dollars (US 2006)
$0.66
-$0.06
-$0.04
-$0.01
$0.02
$0.13
$0.11
$0.41
$0.28
$0.46
$0.25
Hourly average RSG MWP: $1.9366
July 8, 2009July 8, 2009GreeningGreening
Comments on Whole Period CaseComments on Whole Period Case Not all factors contribute equally to hourly Not all factors contribute equally to hourly
RSG MWP. RSG MWP. Virtual supply offers appear to contribute on Virtual supply offers appear to contribute on
average only 1.3% which is much lower than average only 1.3% which is much lower than previous estimates from incomplete models.previous estimates from incomplete models.
Positive and negative deviations in RT NSI Positive and negative deviations in RT NSI accounts for 30%.accounts for 30%.
Generators account for 39% while load Generators account for 39% while load accounts for 23%.accounts for 23%.
Factors outside MPs’ control account for the Factors outside MPs’ control account for the remainder.remainder.
July 8, 2009July 8, 2009GreeningGreening
Comparison of Variable MeansComparison of Variable Means In comparing the results of the cases of before In comparing the results of the cases of before
ASM and after ASM with the whole period case, ASM and after ASM with the whole period case, a comparison of the means of variables is a comparison of the means of variables is helpful.helpful.
Notable points include:Notable points include: RSG MWP increased by 5% after ASM.RSG MWP increased by 5% after ASM. Virtual supplies decreased by approximately 50%.Virtual supplies decreased by approximately 50%. The load forecast reversed from an overforecast to a The load forecast reversed from an overforecast to a
substantial underforecast.substantial underforecast. Many of these changes could be attributable to Many of these changes could be attributable to
weather.weather.
July 8, 2009July 8, 2009GreeningGreening
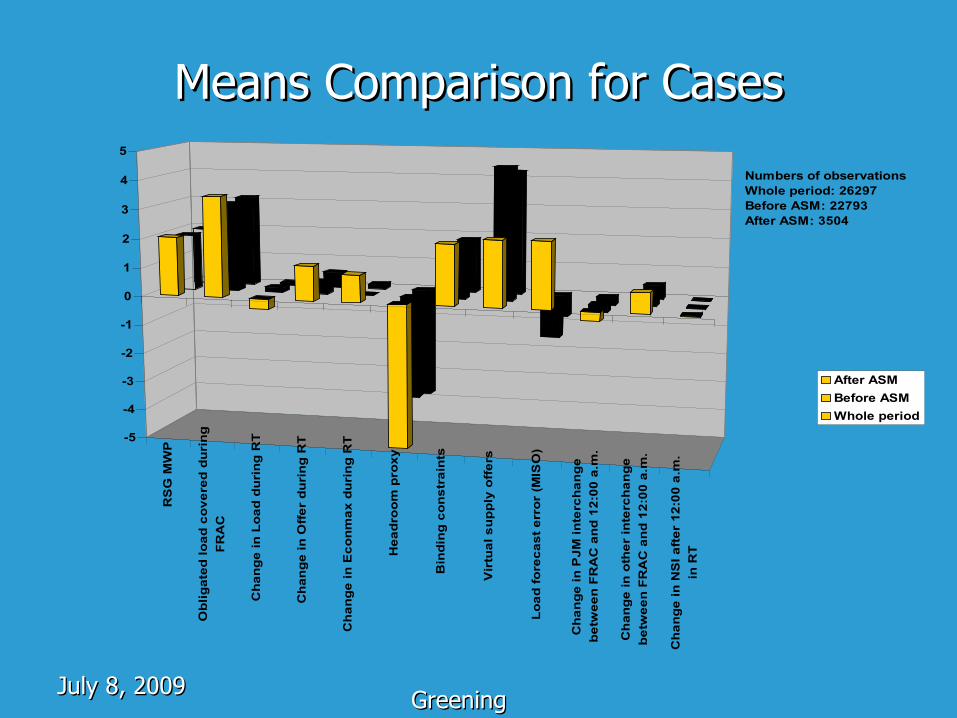
Means Comparison for CasesMeans Comparison for Cases
RS
G M
WP
Ob
lig
ate
d l
oa
d c
ov
ere
d d
uri
ng
FR
AC
Ch
an
ge
in
Lo
ad
du
rin
g R
T
Ch
an
ge
in
Off
er
du
rin
g R
T
Ch
an
ge
in
Ec
on
ma
x d
uri
ng
RT
He
ad
roo
m p
rox
y
Bin
din
g c
on
str
ain
ts
Vir
tua
l s
up
ply
off
ers
Lo
ad
fo
rec
as
t e
rro
r (M
ISO
)
Ch
an
ge
in
PJ
M i
nte
rch
an
ge
be
twe
en
FR
AC
an
d 1
2:0
0 a
.m.
Ch
an
ge
in
oth
er
inte
rch
an
ge
be
twe
en
FR
AC
an
d 1
2:0
0 a
.m.
Ch
an
ge
in
NS
I a
fte
r 1
2:0
0 a
.m.
in R
T
-5
-4
-3
-2
-1
0
1
2
3
4
5
After ASM
Before ASM
Whole period
Numbers of observationsWhole period: 26297Before ASM: 22793After ASM: 3504
July 8, 2009July 8, 2009GreeningGreening
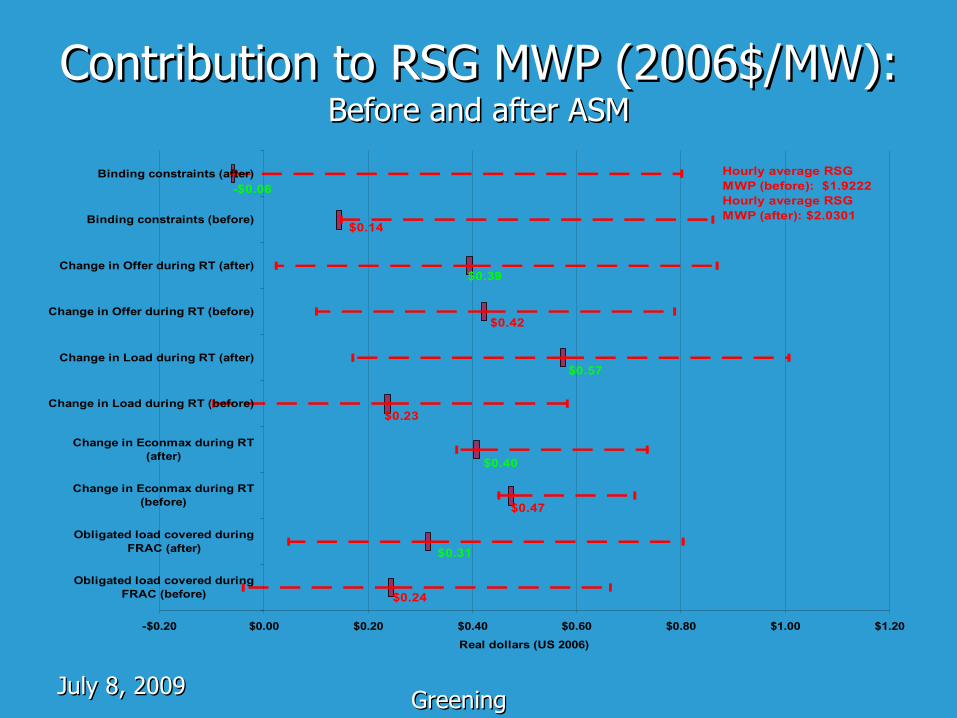
Contribution to RSG MWP (2006$/MW):Contribution to RSG MWP (2006$/MW): Before and after ASMBefore and after ASM
-$0.20 $0.00 $0.20 $0.40 $0.60 $0.80 $1.00 $1.20
Obligated load covered duringFRAC (before)
Obligated load covered duringFRAC (after)
Change in Econmax during RT(before)
Change in Econmax during RT(after)
Change in Load during RT (before)
Change in Load during RT (after)
Change in Offer during RT (before)
Change in Offer during RT (after)
Binding constraints (before)
Binding constraints (after)
Real dollars (US 2006)
-$0.06
$0.39
$0.57
$0.40
$0.31
$0.14
$0.23
$0.47
$0.24
Hourly average RSG MWP (before): $1.9222Hourly average RSG MWP (after): $2.0301
$0.42
July 8, 2009July 8, 2009GreeningGreening
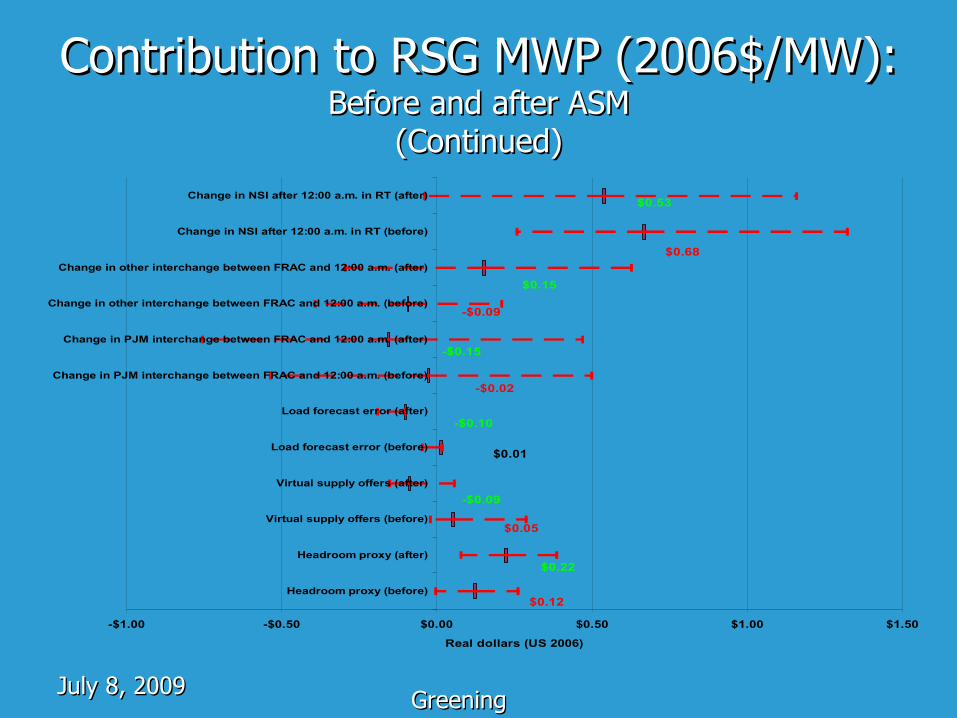
Contribution to RSG MWP (2006$/MW):Contribution to RSG MWP (2006$/MW): Before and after ASMBefore and after ASM
(Continued)(Continued)
-$1.00 -$0.50 $0.00 $0.50 $1.00 $1.50
Headroom proxy (before)
Headroom proxy (after)
Virtual supply offers (before)
Virtual supply offers (after)
Load forecast error (before)
Load forecast error (after)
Change in PJM interchange between FRAC and 12:00 a.m. (before)
Change in PJM interchange between FRAC and 12:00 a.m. (after)
Change in other interchange between FRAC and 12:00 a.m. (before)
Change in other interchange between FRAC and 12:00 a.m. (after)
Change in NSI after 12:00 a.m. in RT (before)
Change in NSI after 12:00 a.m. in RT (after)
Real dollars (US 2006)
$0.53
$0.15
-$0.15
-$0.10
-$0.09
$0.22
$0.68
-$0.09
-$0.02
$0.01
$0.05
$0.12
July 8, 2009July 8, 2009GreeningGreening
Comments on ASM CasesComments on ASM Cases After ASM (and the November FERC order), our After ASM (and the November FERC order), our
analysis indicates a number of changes.analysis indicates a number of changes. Virtual supply offers declined roughly by half and the marginal Virtual supply offers declined roughly by half and the marginal
contribution to RSG MWP dropped to -$0.10.contribution to RSG MWP dropped to -$0.10. The contribution by changes in Load during RT doubled.The contribution by changes in Load during RT doubled. Comparison of other variables indicates a shift of RSG Comparison of other variables indicates a shift of RSG
contribution from generators to load.contribution from generators to load. Caveat: After ASM, this analysis only includes 3504 Caveat: After ASM, this analysis only includes 3504
hours in comparison to 22793 hours before. As a hours in comparison to 22793 hours before. As a result, care should be taken in interpreting the result, care should be taken in interpreting the results. A longer time span after ASM is really results. A longer time span after ASM is really needed prior to making definitive statements needed prior to making definitive statements concerning the impacts of the new tariff.concerning the impacts of the new tariff.

July 8, 2009July 8, 2009GreeningGreening
ConclusionsConclusions This work demonstrates that the marginal contribution This work demonstrates that the marginal contribution
of various assumed causal factors to the incurrence of of various assumed causal factors to the incurrence of RSG in the MISO can be estimated.RSG in the MISO can be estimated.
Direct contributions between assumed causes of RSG Direct contributions between assumed causes of RSG can be quantified. This is superior evidence to the use can be quantified. This is superior evidence to the use of correlation coefficients.of correlation coefficients.
Not all factors contribute equally to RSG MWP. Not all factors contribute equally to RSG MWP. Load contributes approximately 23% of RSG MWP over the Load contributes approximately 23% of RSG MWP over the
whole period.whole period. Generators contribute approximately 39% to RSG MWP over Generators contribute approximately 39% to RSG MWP over
the whole period.the whole period. Changes in NSI contribute approximately 30% to RSG MWP Changes in NSI contribute approximately 30% to RSG MWP
over the entire period.over the entire period. Virtual supply contributes approximately 1.3%.Virtual supply contributes approximately 1.3%. Factors outside MPs control contribute the remainder.Factors outside MPs control contribute the remainder.
July 8, 2009July 8, 2009GreeningGreening
ConclusionsConclusions(Continued)(Continued)
This approach provides for the identification of This approach provides for the identification of distortionary tariffs and regulatory responses.distortionary tariffs and regulatory responses.
Use of this type of method in tariff design Use of this type of method in tariff design incorporates cost causality, incorporates cost causality, ex anteex ante pricing, pricing, flexibility, equity, and transparency.flexibility, equity, and transparency.
The approach could also provide a means of The approach could also provide a means of developing metrics that gauge the effects of developing metrics that gauge the effects of changes in market behaviors.changes in market behaviors.
Caveat: Inclusion of more factors, and better Caveat: Inclusion of more factors, and better definition of others at the nodal level would definition of others at the nodal level would provide more conclusive results.provide more conclusive results.

July 8, 2009July 8, 2009GreeningGreening
““And just because the rooster crows. . .”And just because the rooster crows. . .”
Questions on this analysis should be Questions on this analysis should be directed to:directed to:
Lorna Greening Lorna Greening (505-695-9224 or [email protected])(505-695-9224 or [email protected])