rsview machine edition user's guide - karen rempel · iv rsview machine edition user’s guide...
TRANSCRIPT

User’s Guide

Contacting RockwellSoftware
Technical Support Telephone—440-646-5800
Technical Support Fax—440-646-5801
World Wide Web— http://www.software.rockwell.com orhttp://support.rockwellautomation.com
Copyright Notice �2001 Rockwell Software Inc., a Rockwell Automation company. All rights reserved.Printed in the United States of America.
Portions copyrighted by the Allen-Bradley Company, LLC, a Rockwell Automation company.
This manual and any accompanying Rockwell Software products are copyrighted by RockwellSoftware Inc. Any reproduction and/or distribution without prior written consent fromRockwell Software Inc. is strictly prohibited. Please refer to the license agreement for details.
Trademark Notices The Rockwell Software logo, RSLinx, RSLogix 5, RSLogix 500, RSTools, RSView, RSView MEStation, RSView Studio, A.I. Series, Advanced Interface (A.I.) Series, ControlView, Object SmartPath, RAC6182, and WINtelligent LOGIC 5 are trademarks of Rockwell Software Inc., aRockwell Automation company.
PLC-5 is a registered trademark, and ControlNet, Data Highway Plus, DH+, MicroLogix,PLC-5/20E, PLC-5/40E, PLC-5/80E, SLC, SLC 5/01, SLC 5/02, SLC 5/03, SLC 5/04, SLC5/05, and SoftLogix are trademarks of the Allen-Bradley Company, LLC, a RockwellAutomation company.
Adobe and Acrobat are registered trademarks of Adobe Systems Incorporated. TrueType is atrademark of Apple Computer, Inc. AutoCAD is a registered trademark of Autodesk, Inc.Ethernet is a registered trademark of Digital Equipment Corporation, Intel Corporation, andXerox Corporation. Modicon is a registered trademark of Groupe Schneider. Zip is a trademarkof Iomega Corporation. ActiveX, Microsoft, MS-DOS, OpenType, Visual Basic, Windows, andWindows NT are registered trademarks of Microsoft Corporation in the United States and/orother countries. OPC is a trademark of the OPC Foundation.
All other trademarks are the property of their respective holders and are hereby acknowledged.
Warranty This Rockwell Software product is warranted in accord with the product license. The product’sperformance will be affected by system configuration, the application being performed, operatorcontrol and other related factors. The product’s implementation may vary among users.
This manual is as up-to-date as possible at the time of printing; however, the accompanyingsoftware may have changed since that time. Rockwell Software reserves the right to change anyinformation contained in this manual or the software at any time without prior notice.
The instructions in this manual do not claim to cover all the details of variations in theequipment, procedure, or process described, nor to provide directions for meeting every possiblecontingency during installation, operation, or maintenance.
Doc ID ViewME-UM001A-EN-EDecember 2001

Contents � i
Contents
Preface
About the documentation P-1. . . . . . . . . . . . . . . . . . . . . . . . . . . . . . . . . . .
Finding the information you need P-1. . . . . . . . . . . . . . . . . . . . . . . . . . . .Try the User’s Guide and Help first P-1. . . . . . . . . . . . . . . . . . . . . . .Information on the Internet P-2. . . . . . . . . . . . . . . . . . . . . . . . . . . . . .Contacting Rockwell Software Technical Support P-4. . . . . . . . . . . .
Chapter 1Introducing RSView Machine Edition
The parts of RSView Machine Edition 1-1. . . . . . . . . . . . . . . . . . . . . . . .Additional software 1-1. . . . . . . . . . . . . . . . . . . . . . . . . . . . . . . . . . . . .The RSView Machine Edition tools 1-2. . . . . . . . . . . . . . . . . . . . . . . .
Chapter 2Exploring RSView Studio
Opening and closing RSView Studio 2-1. . . . . . . . . . . . . . . . . . . . . . . . . .Opening RSView Studio 2-1. . . . . . . . . . . . . . . . . . . . . . . . . . . . . . . . .Closing RSView Studio 2-1. . . . . . . . . . . . . . . . . . . . . . . . . . . . . . . . . .
Opening sample projects 2-2. . . . . . . . . . . . . . . . . . . . . . . . . . . . . . . . . . .
Exploring the RSView Studio main window 2-3. . . . . . . . . . . . . . . . . . .The menu bar 2-3. . . . . . . . . . . . . . . . . . . . . . . . . . . . . . . . . . . . . . . . . .The toolbar 2-3. . . . . . . . . . . . . . . . . . . . . . . . . . . . . . . . . . . . . . . . . . . .The Project Explorer 2-4. . . . . . . . . . . . . . . . . . . . . . . . . . . . . . . . . . . .The activity bar 2-4. . . . . . . . . . . . . . . . . . . . . . . . . . . . . . . . . . . . . . . .The status bar 2-4. . . . . . . . . . . . . . . . . . . . . . . . . . . . . . . . . . . . . . . . . .Workbook tabs 2-4. . . . . . . . . . . . . . . . . . . . . . . . . . . . . . . . . . . . . . . . .Showing and hiding items in the main window 2-5. . . . . . . . . . . . . .
Using the Project Explorer 2-6. . . . . . . . . . . . . . . . . . . . . . . . . . . . . . . . . .Viewing the Project Explorer 2-7. . . . . . . . . . . . . . . . . . . . . . . . . . . . .Moving the Project Explorer 2-7. . . . . . . . . . . . . . . . . . . . . . . . . . . . .

ii � RSView Machine Edition User’s Guide
Working with editors 2-7. . . . . . . . . . . . . . . . . . . . . . . . . . . . . . . . . . . . . .Locating editors 2-8. . . . . . . . . . . . . . . . . . . . . . . . . . . . . . . . . . . . . . . .Viewing an editor’s components 2-8. . . . . . . . . . . . . . . . . . . . . . . . . .Opening editors 2-8. . . . . . . . . . . . . . . . . . . . . . . . . . . . . . . . . . . . . . . .Closing editors 2-9. . . . . . . . . . . . . . . . . . . . . . . . . . . . . . . . . . . . . . . . .
Entering information in spreadsheets 2-9. . . . . . . . . . . . . . . . . . . . . . . . .
Working with components 2-10. . . . . . . . . . . . . . . . . . . . . . . . . . . . . . . . . .Creating components 2-11. . . . . . . . . . . . . . . . . . . . . . . . . . . . . . . . . . .Opening components 2-11. . . . . . . . . . . . . . . . . . . . . . . . . . . . . . . . . . .Saving components 2-11. . . . . . . . . . . . . . . . . . . . . . . . . . . . . . . . . . . . .Closing components 2-11. . . . . . . . . . . . . . . . . . . . . . . . . . . . . . . . . . . .Adding components into a project 2-12. . . . . . . . . . . . . . . . . . . . . . . . .Deleting components 2-13. . . . . . . . . . . . . . . . . . . . . . . . . . . . . . . . . . . .Removing components 2-13. . . . . . . . . . . . . . . . . . . . . . . . . . . . . . . . . .Renaming components 2-13. . . . . . . . . . . . . . . . . . . . . . . . . . . . . . . . . .Duplicating components 2-14. . . . . . . . . . . . . . . . . . . . . . . . . . . . . . . . .
Printing 2-14. . . . . . . . . . . . . . . . . . . . . . . . . . . . . . . . . . . . . . . . . . . . . . . . . .Selecting a printer 2-14. . . . . . . . . . . . . . . . . . . . . . . . . . . . . . . . . . . . . .Printing at runtime 2-15. . . . . . . . . . . . . . . . . . . . . . . . . . . . . . . . . . . . .
Chapter 3Planning projects
Understanding the process 3-1. . . . . . . . . . . . . . . . . . . . . . . . . . . . . . . . . .
Collecting data 3-2. . . . . . . . . . . . . . . . . . . . . . . . . . . . . . . . . . . . . . . . . . . .
Designing a tag database 3-2. . . . . . . . . . . . . . . . . . . . . . . . . . . . . . . . . . . .Collecting information 3-2. . . . . . . . . . . . . . . . . . . . . . . . . . . . . . . . . .Organizing tags 3-3. . . . . . . . . . . . . . . . . . . . . . . . . . . . . . . . . . . . . . . .
Planning graphic displays 3-3. . . . . . . . . . . . . . . . . . . . . . . . . . . . . . . . . . .Developing a hierarchy of displays 3-3. . . . . . . . . . . . . . . . . . . . . . . .Creating a template to ensure consistency 3-4. . . . . . . . . . . . . . . . . .
Planning alarms 3-5. . . . . . . . . . . . . . . . . . . . . . . . . . . . . . . . . . . . . . . . . . .
Providing information for the operator 3-5. . . . . . . . . . . . . . . . . . . . . . . .Local and information messages 3-5. . . . . . . . . . . . . . . . . . . . . . . . . . .Activity logging 3-6. . . . . . . . . . . . . . . . . . . . . . . . . . . . . . . . . . . . . . . .
Using trends 3-6. . . . . . . . . . . . . . . . . . . . . . . . . . . . . . . . . . . . . . . . . . . . . .
Designing a secure system 3-6. . . . . . . . . . . . . . . . . . . . . . . . . . . . . . . . . .

Contents � iii
Chapter 4Working with projects
What is a project? 4-1. . . . . . . . . . . . . . . . . . . . . . . . . . . . . . . . . . . . . . . . .Project files 4-2. . . . . . . . . . . . . . . . . . . . . . . . . . . . . . . . . . . . . . . . . . . .Component file locations 4-2. . . . . . . . . . . . . . . . . . . . . . . . . . . . . . . .External folders 4-3. . . . . . . . . . . . . . . . . . . . . . . . . . . . . . . . . . . . . . . .Default log file locations for RAC6182 projects 4-3. . . . . . . . . . . . .Naming files 4-4. . . . . . . . . . . . . . . . . . . . . . . . . . . . . . . . . . . . . . . . . . .
Creating, opening, and closing projects 4-4. . . . . . . . . . . . . . . . . . . . . . .Creating projects 4-4. . . . . . . . . . . . . . . . . . . . . . . . . . . . . . . . . . . . . . .Opening projects 4-5. . . . . . . . . . . . . . . . . . . . . . . . . . . . . . . . . . . . . . .Opening multiple projects 4-6. . . . . . . . . . . . . . . . . . . . . . . . . . . . . . .Closing projects 4-6. . . . . . . . . . . . . . . . . . . . . . . . . . . . . . . . . . . . . . . .
Copying, deleting, backing up, renaming, and restoring projects 4-7. .
About project settings 4-7. . . . . . . . . . . . . . . . . . . . . . . . . . . . . . . . . . . . . .Project window size and runtime screen resolution 4-7. . . . . . . . . . .Title bar 4-10. . . . . . . . . . . . . . . . . . . . . . . . . . . . . . . . . . . . . . . . . . . . . . .
Specifying project settings 4-12. . . . . . . . . . . . . . . . . . . . . . . . . . . . . . . . . .
Viewing project properties 4-14. . . . . . . . . . . . . . . . . . . . . . . . . . . . . . . . . .
Chapter 5Setting up direct driver communications
When to use direct driver communications 5-1. . . . . . . . . . . . . . . . . . . .
Overview of direct driver communications at runtime 5-1. . . . . . . . . . .Communication channel 5-2. . . . . . . . . . . . . . . . . . . . . . . . . . . . . . . . .Communication device 5-2. . . . . . . . . . . . . . . . . . . . . . . . . . . . . . . . . .Communication driver 5-3. . . . . . . . . . . . . . . . . . . . . . . . . . . . . . . . . .Using SoftLogix 5 controllers 5-3. . . . . . . . . . . . . . . . . . . . . . . . . . . . .Drivers on the development system versus driverson the RAC6182 5-4. . . . . . . . . . . . . . . . . . . . . . . . . . . . . . . . . . . . . . .Node (control device) 5-4. . . . . . . . . . . . . . . . . . . . . . . . . . . . . . . . . . .
Setting up direct driver communication to programmable controllers 5-9Summary of steps 5-9. . . . . . . . . . . . . . . . . . . . . . . . . . . . . . . . . . . . . . .
Configuring channels 5-11. . . . . . . . . . . . . . . . . . . . . . . . . . . . . . . . . . . . . .Changing the channel configuration 5-13. . . . . . . . . . . . . . . . . . . . . . .Editing channels at runtime 5-13. . . . . . . . . . . . . . . . . . . . . . . . . . . . . .

iv � RSView Machine Edition User’s Guide
Using the Nodes editor 5-13. . . . . . . . . . . . . . . . . . . . . . . . . . . . . . . . . . . . .Using the View menu 5-14. . . . . . . . . . . . . . . . . . . . . . . . . . . . . . . . . . .Using the Accept and Discard buttons 5-14. . . . . . . . . . . . . . . . . . . . .Using the tools 5-15. . . . . . . . . . . . . . . . . . . . . . . . . . . . . . . . . . . . . . . . .
Creating direct driver nodes 5-15. . . . . . . . . . . . . . . . . . . . . . . . . . . . . . . . .Editing nodes at runtime 5-17. . . . . . . . . . . . . . . . . . . . . . . . . . . . . . . . .
Configuring scan classes 5-17. . . . . . . . . . . . . . . . . . . . . . . . . . . . . . . . . . . .Scan classes 5-17. . . . . . . . . . . . . . . . . . . . . . . . . . . . . . . . . . . . . . . . . . . .Guidelines for configuring scan classes 5-18. . . . . . . . . . . . . . . . . . . . .
Monitoring communications 5-19. . . . . . . . . . . . . . . . . . . . . . . . . . . . . . . .
Chapter 6Setting up OPC communications
When to use OPC communications 6-1. . . . . . . . . . . . . . . . . . . . . . . . . .OPC for Windows 2000 projects 6-1. . . . . . . . . . . . . . . . . . . . . . . . . .OPC for RAC6182 projects 6-2. . . . . . . . . . . . . . . . . . . . . . . . . . . . . .
Summary of steps 6-9. . . . . . . . . . . . . . . . . . . . . . . . . . . . . . . . . . . . . . . . . .
Creating OPC nodes 6-10. . . . . . . . . . . . . . . . . . . . . . . . . . . . . . . . . . . . . . .Editing nodes at runtime 6-13. . . . . . . . . . . . . . . . . . . . . . . . . . . . . . . . .
Scanning for new tag values 6-13. . . . . . . . . . . . . . . . . . . . . . . . . . . . . . . . .
Monitoring communications 6-14. . . . . . . . . . . . . . . . . . . . . . . . . . . . . . . .
Chapter 7Creating tags
Tags and the tag database 7-1. . . . . . . . . . . . . . . . . . . . . . . . . . . . . . . . . . .The data source 7-2. . . . . . . . . . . . . . . . . . . . . . . . . . . . . . . . . . . . . . . .
Tag types 7-2. . . . . . . . . . . . . . . . . . . . . . . . . . . . . . . . . . . . . . . . . . . . . . . . .Analog tags that use floating point values 7-3. . . . . . . . . . . . . . . . . . .How values are rounded 7-3. . . . . . . . . . . . . . . . . . . . . . . . . . . . . . . . .
Data sources 7-3. . . . . . . . . . . . . . . . . . . . . . . . . . . . . . . . . . . . . . . . . . . . . .Device 7-4. . . . . . . . . . . . . . . . . . . . . . . . . . . . . . . . . . . . . . . . . . . . . . . .Memory 7-4. . . . . . . . . . . . . . . . . . . . . . . . . . . . . . . . . . . . . . . . . . . . . .
Organizing tags 7-4. . . . . . . . . . . . . . . . . . . . . . . . . . . . . . . . . . . . . . . . . . .Naming tags 7-4. . . . . . . . . . . . . . . . . . . . . . . . . . . . . . . . . . . . . . . . . . .Using folders to group tags 7-5. . . . . . . . . . . . . . . . . . . . . . . . . . . . . . .

Contents � v
Using the Tag Database editor 7-5. . . . . . . . . . . . . . . . . . . . . . . . . . . . . . .Using the View menu 7-6. . . . . . . . . . . . . . . . . . . . . . . . . . . . . . . . . . .Using the Accept and Discard buttons 7-6. . . . . . . . . . . . . . . . . . . . .Using the tools 7-6. . . . . . . . . . . . . . . . . . . . . . . . . . . . . . . . . . . . . . . . .Updating the contents of the Tag Database editor 7-7. . . . . . . . . . . .Viewing tag statistics 7-7. . . . . . . . . . . . . . . . . . . . . . . . . . . . . . . . . . . .
Searching for tags 7-8. . . . . . . . . . . . . . . . . . . . . . . . . . . . . . . . . . . . . . . . . .
Using folders 7-8. . . . . . . . . . . . . . . . . . . . . . . . . . . . . . . . . . . . . . . . . . . . .Resizing the hierarchy box 7-9. . . . . . . . . . . . . . . . . . . . . . . . . . . . . . .Creating folders 7-9. . . . . . . . . . . . . . . . . . . . . . . . . . . . . . . . . . . . . . . .Opening folders 7-10. . . . . . . . . . . . . . . . . . . . . . . . . . . . . . . . . . . . . . . .Creating tags in a folder 7-10. . . . . . . . . . . . . . . . . . . . . . . . . . . . . . . . .Nesting folders 7-11. . . . . . . . . . . . . . . . . . . . . . . . . . . . . . . . . . . . . . . . .Duplicating folders 7-11. . . . . . . . . . . . . . . . . . . . . . . . . . . . . . . . . . . . .Deleting folders 7-12. . . . . . . . . . . . . . . . . . . . . . . . . . . . . . . . . . . . . . . .
Working with tags 7-12. . . . . . . . . . . . . . . . . . . . . . . . . . . . . . . . . . . . . . . . .Moving through the spreadsheet 7-12. . . . . . . . . . . . . . . . . . . . . . . . . .Resizing columns and rows 7-13. . . . . . . . . . . . . . . . . . . . . . . . . . . . . .Creating tags 7-13. . . . . . . . . . . . . . . . . . . . . . . . . . . . . . . . . . . . . . . . . . .Duplicating tags 7-13. . . . . . . . . . . . . . . . . . . . . . . . . . . . . . . . . . . . . . . .Editing tags 7-14. . . . . . . . . . . . . . . . . . . . . . . . . . . . . . . . . . . . . . . . . . . .Deleting tags 7-14. . . . . . . . . . . . . . . . . . . . . . . . . . . . . . . . . . . . . . . . . . .
Configuring tag types 7-14. . . . . . . . . . . . . . . . . . . . . . . . . . . . . . . . . . . . . .Configuring analog tags 7-14. . . . . . . . . . . . . . . . . . . . . . . . . . . . . . . . .Configuring digital tags 7-17. . . . . . . . . . . . . . . . . . . . . . . . . . . . . . . . . .Configuring string tags 7-18. . . . . . . . . . . . . . . . . . . . . . . . . . . . . . . . . .Configuring block tags 7-19. . . . . . . . . . . . . . . . . . . . . . . . . . . . . . . . . .
Specifying a data source 7-20. . . . . . . . . . . . . . . . . . . . . . . . . . . . . . . . . . . .
Other methods for creating tags 7-23. . . . . . . . . . . . . . . . . . . . . . . . . . . . .Creating tags in a third-party application 7-23. . . . . . . . . . . . . . . . . . .Creating tags as needed in other RSView editors 7-23. . . . . . . . . . . . .Creating tags as needed in the Data Log Models editor 7-24. . . . . . .Using the Tags dialog box 7-25. . . . . . . . . . . . . . . . . . . . . . . . . . . . . . . .Importing tags from a PLC database 7-26. . . . . . . . . . . . . . . . . . . . . . .Using the Tag Import and Export Wizard 7-28. . . . . . . . . . . . . . . . . . .
Using tags and expressions in your project 7-28. . . . . . . . . . . . . . . . . . . . .Assigning tags to graphic objects 7-29. . . . . . . . . . . . . . . . . . . . . . . . . .Using expressions to manipulate tag values 7-30. . . . . . . . . . . . . . . . .Substituting tag names used in graphic objects 7-31. . . . . . . . . . . . . . .
vi � RSView Machine Edition User’s Guide
Logging tag values 7-31. . . . . . . . . . . . . . . . . . . . . . . . . . . . . . . . . . . . . . . . .
Using macros to assign values to tags 7-32. . . . . . . . . . . . . . . . . . . . . . . . .When to use macros 7-33. . . . . . . . . . . . . . . . . . . . . . . . . . . . . . . . . . . . .Running macros when tags or expressions change value 7-34. . . . . . .Creating macros 7-35. . . . . . . . . . . . . . . . . . . . . . . . . . . . . . . . . . . . . . . .What to do next 7-36. . . . . . . . . . . . . . . . . . . . . . . . . . . . . . . . . . . . . . . .
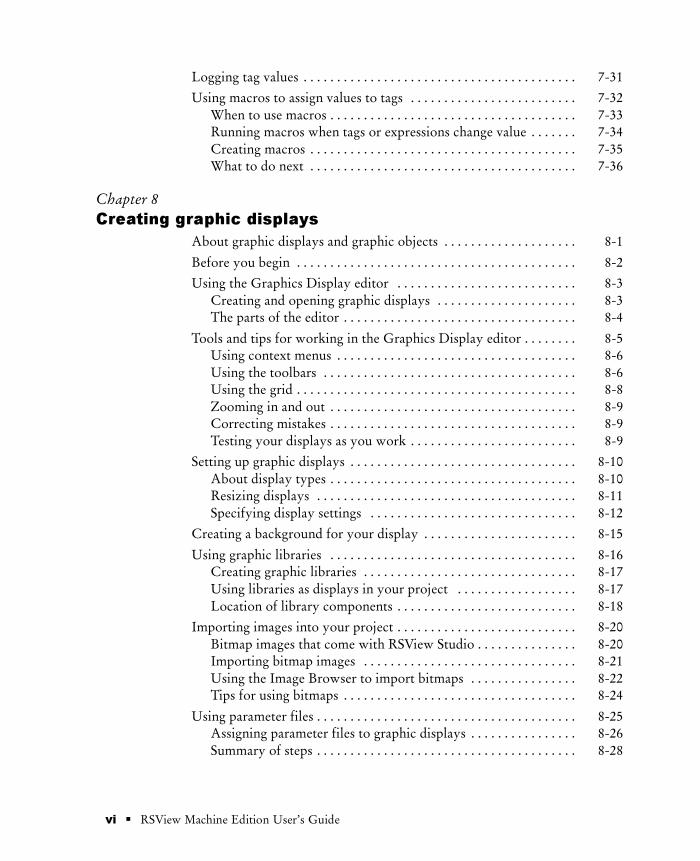
Chapter 8Creating graphic displays
About graphic displays and graphic objects 8-1. . . . . . . . . . . . . . . . . . . .
Before you begin 8-2. . . . . . . . . . . . . . . . . . . . . . . . . . . . . . . . . . . . . . . . . .
Using the Graphics Display editor 8-3. . . . . . . . . . . . . . . . . . . . . . . . . . .Creating and opening graphic displays 8-3. . . . . . . . . . . . . . . . . . . . .The parts of the editor 8-4. . . . . . . . . . . . . . . . . . . . . . . . . . . . . . . . . . .
Tools and tips for working in the Graphics Display editor 8-5. . . . . . . .Using context menus 8-6. . . . . . . . . . . . . . . . . . . . . . . . . . . . . . . . . . . .Using the toolbars 8-6. . . . . . . . . . . . . . . . . . . . . . . . . . . . . . . . . . . . . .Using the grid 8-8. . . . . . . . . . . . . . . . . . . . . . . . . . . . . . . . . . . . . . . . . .Zooming in and out 8-9. . . . . . . . . . . . . . . . . . . . . . . . . . . . . . . . . . . . .Correcting mistakes 8-9. . . . . . . . . . . . . . . . . . . . . . . . . . . . . . . . . . . . .Testing your displays as you work 8-9. . . . . . . . . . . . . . . . . . . . . . . . .
Setting up graphic displays 8-10. . . . . . . . . . . . . . . . . . . . . . . . . . . . . . . . . .About display types 8-10. . . . . . . . . . . . . . . . . . . . . . . . . . . . . . . . . . . . .Resizing displays 8-11. . . . . . . . . . . . . . . . . . . . . . . . . . . . . . . . . . . . . . .Specifying display settings 8-12. . . . . . . . . . . . . . . . . . . . . . . . . . . . . . .
Creating a background for your display 8-15. . . . . . . . . . . . . . . . . . . . . . .
Using graphic libraries 8-16. . . . . . . . . . . . . . . . . . . . . . . . . . . . . . . . . . . . .Creating graphic libraries 8-17. . . . . . . . . . . . . . . . . . . . . . . . . . . . . . . .Using libraries as displays in your project 8-17. . . . . . . . . . . . . . . . . .Location of library components 8-18. . . . . . . . . . . . . . . . . . . . . . . . . . .
Importing images into your project 8-20. . . . . . . . . . . . . . . . . . . . . . . . . . .Bitmap images that come with RSView Studio 8-20. . . . . . . . . . . . . . .Importing bitmap images 8-21. . . . . . . . . . . . . . . . . . . . . . . . . . . . . . . .Using the Image Browser to import bitmaps 8-22. . . . . . . . . . . . . . . .Tips for using bitmaps 8-24. . . . . . . . . . . . . . . . . . . . . . . . . . . . . . . . . . .
Using parameter files 8-25. . . . . . . . . . . . . . . . . . . . . . . . . . . . . . . . . . . . . . .Assigning parameter files to graphic displays 8-26. . . . . . . . . . . . . . . .Summary of steps 8-28. . . . . . . . . . . . . . . . . . . . . . . . . . . . . . . . . . . . . . .

Contents � vii
Using the Parameters editor 8-28. . . . . . . . . . . . . . . . . . . . . . . . . . . . . .Creating parameter files 8-29. . . . . . . . . . . . . . . . . . . . . . . . . . . . . . . . .
Using local messages 8-29. . . . . . . . . . . . . . . . . . . . . . . . . . . . . . . . . . . . . . .When to use local messages 8-29. . . . . . . . . . . . . . . . . . . . . . . . . . . . . .Preparing to set up local messages 8-30. . . . . . . . . . . . . . . . . . . . . . . . .How local messages work 8-30. . . . . . . . . . . . . . . . . . . . . . . . . . . . . . . .Local messages and trigger values 8-32. . . . . . . . . . . . . . . . . . . . . . . . .Summary of steps 8-32. . . . . . . . . . . . . . . . . . . . . . . . . . . . . . . . . . . . . . .Using the Local Messages editor 8-33. . . . . . . . . . . . . . . . . . . . . . . . . .Creating local messages 8-33. . . . . . . . . . . . . . . . . . . . . . . . . . . . . . . . . .Creating messages in a spreadsheet application 8-34. . . . . . . . . . . . . .How the Local Message display graphic object works 8-35. . . . . . . .
Printing displays 8-35. . . . . . . . . . . . . . . . . . . . . . . . . . . . . . . . . . . . . . . . . .Printing displays at runtime 8-36. . . . . . . . . . . . . . . . . . . . . . . . . . . . . .
Chapter 9Creating and working with graphic objects
Types of graphic objects 9-1. . . . . . . . . . . . . . . . . . . . . . . . . . . . . . . . . . . .About controls 9-2. . . . . . . . . . . . . . . . . . . . . . . . . . . . . . . . . . . . . . . . .
Illustrating your displays 9-3. . . . . . . . . . . . . . . . . . . . . . . . . . . . . . . . . . .
Controlling the project 9-3. . . . . . . . . . . . . . . . . . . . . . . . . . . . . . . . . . . . .
Starting and controlling processes 9-4. . . . . . . . . . . . . . . . . . . . . . . . . . . .
Displaying processes and values graphically 9-5. . . . . . . . . . . . . . . . . . . .
Working with lists and trends 9-6. . . . . . . . . . . . . . . . . . . . . . . . . . . . . . . .
Entering and displaying numeric and string values 9-7. . . . . . . . . . . . . .
Displaying alarms and messages 9-7. . . . . . . . . . . . . . . . . . . . . . . . . . . . .
Selecting tools for creating graphic objects 9-8. . . . . . . . . . . . . . . . . . . . .
Before you begin creating objects 9-9. . . . . . . . . . . . . . . . . . . . . . . . . . . .
Creating graphic objects 9-9. . . . . . . . . . . . . . . . . . . . . . . . . . . . . . . . . . . .
Creating drawing objects 9-10. . . . . . . . . . . . . . . . . . . . . . . . . . . . . . . . . . .Creating text 9-10. . . . . . . . . . . . . . . . . . . . . . . . . . . . . . . . . . . . . . . . . . .Creating images 9-11. . . . . . . . . . . . . . . . . . . . . . . . . . . . . . . . . . . . . . . .Creating panels 9-12. . . . . . . . . . . . . . . . . . . . . . . . . . . . . . . . . . . . . . . . .Creating arcs and wedges 9-12. . . . . . . . . . . . . . . . . . . . . . . . . . . . . . . .Creating ellipses and circles 9-13. . . . . . . . . . . . . . . . . . . . . . . . . . . . . .Creating freehand shapes 9-14. . . . . . . . . . . . . . . . . . . . . . . . . . . . . . . .Creating lines 9-14. . . . . . . . . . . . . . . . . . . . . . . . . . . . . . . . . . . . . . . . . .
viii � RSView Machine Edition User’s Guide
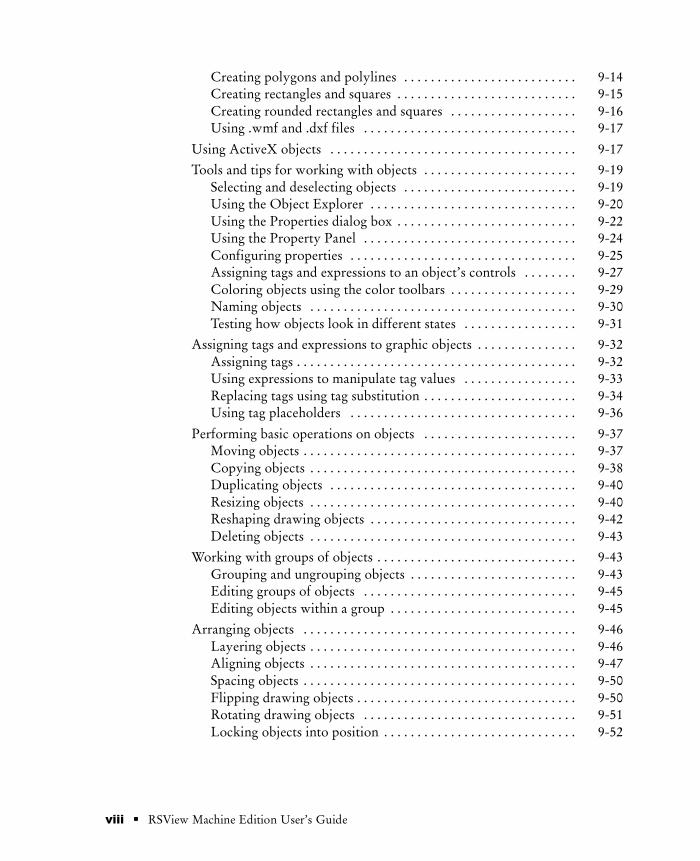
Creating polygons and polylines 9-14. . . . . . . . . . . . . . . . . . . . . . . . . .Creating rectangles and squares 9-15. . . . . . . . . . . . . . . . . . . . . . . . . . .Creating rounded rectangles and squares 9-16. . . . . . . . . . . . . . . . . . .Using .wmf and .dxf files 9-17. . . . . . . . . . . . . . . . . . . . . . . . . . . . . . . .
Using ActiveX objects 9-17. . . . . . . . . . . . . . . . . . . . . . . . . . . . . . . . . . . . .
Tools and tips for working with objects 9-19. . . . . . . . . . . . . . . . . . . . . . .Selecting and deselecting objects 9-19. . . . . . . . . . . . . . . . . . . . . . . . . .Using the Object Explorer 9-20. . . . . . . . . . . . . . . . . . . . . . . . . . . . . . .Using the Properties dialog box 9-22. . . . . . . . . . . . . . . . . . . . . . . . . . .Using the Property Panel 9-24. . . . . . . . . . . . . . . . . . . . . . . . . . . . . . . .Configuring properties 9-25. . . . . . . . . . . . . . . . . . . . . . . . . . . . . . . . . .Assigning tags and expressions to an object’s controls 9-27. . . . . . . .Coloring objects using the color toolbars 9-29. . . . . . . . . . . . . . . . . . .Naming objects 9-30. . . . . . . . . . . . . . . . . . . . . . . . . . . . . . . . . . . . . . . .Testing how objects look in different states 9-31. . . . . . . . . . . . . . . . .
Assigning tags and expressions to graphic objects 9-32. . . . . . . . . . . . . . .Assigning tags 9-32. . . . . . . . . . . . . . . . . . . . . . . . . . . . . . . . . . . . . . . . . .Using expressions to manipulate tag values 9-33. . . . . . . . . . . . . . . . .Replacing tags using tag substitution 9-34. . . . . . . . . . . . . . . . . . . . . . .Using tag placeholders 9-36. . . . . . . . . . . . . . . . . . . . . . . . . . . . . . . . . .
Performing basic operations on objects 9-37. . . . . . . . . . . . . . . . . . . . . . .Moving objects 9-37. . . . . . . . . . . . . . . . . . . . . . . . . . . . . . . . . . . . . . . . .Copying objects 9-38. . . . . . . . . . . . . . . . . . . . . . . . . . . . . . . . . . . . . . . .Duplicating objects 9-40. . . . . . . . . . . . . . . . . . . . . . . . . . . . . . . . . . . . .Resizing objects 9-40. . . . . . . . . . . . . . . . . . . . . . . . . . . . . . . . . . . . . . . .Reshaping drawing objects 9-42. . . . . . . . . . . . . . . . . . . . . . . . . . . . . . .Deleting objects 9-43. . . . . . . . . . . . . . . . . . . . . . . . . . . . . . . . . . . . . . . .
Working with groups of objects 9-43. . . . . . . . . . . . . . . . . . . . . . . . . . . . . .Grouping and ungrouping objects 9-43. . . . . . . . . . . . . . . . . . . . . . . . .Editing groups of objects 9-45. . . . . . . . . . . . . . . . . . . . . . . . . . . . . . . .Editing objects within a group 9-45. . . . . . . . . . . . . . . . . . . . . . . . . . . .
Arranging objects 9-46. . . . . . . . . . . . . . . . . . . . . . . . . . . . . . . . . . . . . . . . .Layering objects 9-46. . . . . . . . . . . . . . . . . . . . . . . . . . . . . . . . . . . . . . . .Aligning objects 9-47. . . . . . . . . . . . . . . . . . . . . . . . . . . . . . . . . . . . . . . .Spacing objects 9-50. . . . . . . . . . . . . . . . . . . . . . . . . . . . . . . . . . . . . . . . .Flipping drawing objects 9-50. . . . . . . . . . . . . . . . . . . . . . . . . . . . . . . . .Rotating drawing objects 9-51. . . . . . . . . . . . . . . . . . . . . . . . . . . . . . . .Locking objects into position 9-52. . . . . . . . . . . . . . . . . . . . . . . . . . . . .
Contents � ix
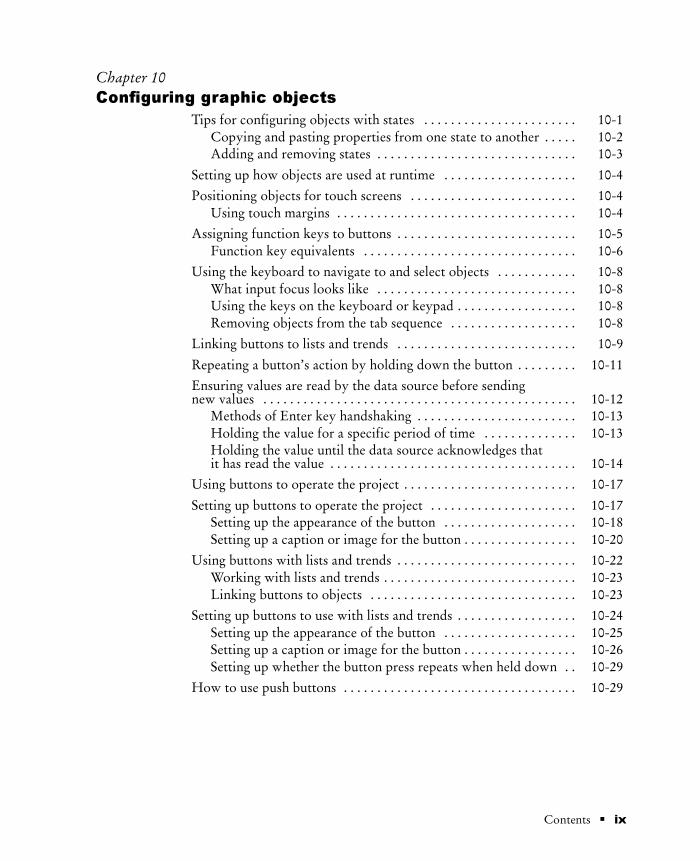
Chapter 10Configuring graphic objects
Tips for configuring objects with states 10-1. . . . . . . . . . . . . . . . . . . . . . .Copying and pasting properties from one state to another 10-2. . . . .Adding and removing states 10-3. . . . . . . . . . . . . . . . . . . . . . . . . . . . . .
Setting up how objects are used at runtime 10-4. . . . . . . . . . . . . . . . . . . .
Positioning objects for touch screens 10-4. . . . . . . . . . . . . . . . . . . . . . . . .Using touch margins 10-4. . . . . . . . . . . . . . . . . . . . . . . . . . . . . . . . . . . .
Assigning function keys to buttons 10-5. . . . . . . . . . . . . . . . . . . . . . . . . . .Function key equivalents 10-6. . . . . . . . . . . . . . . . . . . . . . . . . . . . . . . .
Using the keyboard to navigate to and select objects 10-8. . . . . . . . . . . .What input focus looks like 10-8. . . . . . . . . . . . . . . . . . . . . . . . . . . . . .Using the keys on the keyboard or keypad 10-8. . . . . . . . . . . . . . . . . .Removing objects from the tab sequence 10-8. . . . . . . . . . . . . . . . . . .
Linking buttons to lists and trends 10-9. . . . . . . . . . . . . . . . . . . . . . . . . . .
Repeating a button’s action by holding down the button 10-11. . . . . . . . .
Ensuring values are read by the data source before sendingnew values 10-12. . . . . . . . . . . . . . . . . . . . . . . . . . . . . . . . . . . . . . . . . . . . . . .
Methods of Enter key handshaking 10-13. . . . . . . . . . . . . . . . . . . . . . . .Holding the value for a specific period of time 10-13. . . . . . . . . . . . . .Holding the value until the data source acknowledges thatit has read the value 10-14. . . . . . . . . . . . . . . . . . . . . . . . . . . . . . . . . . . . .
Using buttons to operate the project 10-17. . . . . . . . . . . . . . . . . . . . . . . . . .
Setting up buttons to operate the project 10-17. . . . . . . . . . . . . . . . . . . . . .Setting up the appearance of the button 10-18. . . . . . . . . . . . . . . . . . . .Setting up a caption or image for the button 10-20. . . . . . . . . . . . . . . . .
Using buttons with lists and trends 10-22. . . . . . . . . . . . . . . . . . . . . . . . . . .Working with lists and trends 10-23. . . . . . . . . . . . . . . . . . . . . . . . . . . . .Linking buttons to objects 10-23. . . . . . . . . . . . . . . . . . . . . . . . . . . . . . .
Setting up buttons to use with lists and trends 10-24. . . . . . . . . . . . . . . . . .Setting up the appearance of the button 10-25. . . . . . . . . . . . . . . . . . . .Setting up a caption or image for the button 10-26. . . . . . . . . . . . . . . . .Setting up whether the button press repeats when held down 10-29. .
How to use push buttons 10-29. . . . . . . . . . . . . . . . . . . . . . . . . . . . . . . . . . .

x � RSView Machine Edition User’s Guide
Setting up Momentary Push buttons 10-30. . . . . . . . . . . . . . . . . . . . . . . . . .Setting up the appearance and action of the Momentary Pushbutton 10-31. . . . . . . . . . . . . . . . . . . . . . . . . . . . . . . . . . . . . . . . . . . . . . . .Setting up what the Momentary Push button does whenit is pressed and released 10-33. . . . . . . . . . . . . . . . . . . . . . . . . . . . . . . . .Connecting the Momentary Push button to data 10-37. . . . . . . . . . . . .
Setting up Maintained Push buttons 10-37. . . . . . . . . . . . . . . . . . . . . . . . . .Setting up the appearance of the Maintained Push buttonand how it changes state 10-38. . . . . . . . . . . . . . . . . . . . . . . . . . . . . . . . .Setting up what the Maintained Push button does whenit is pressed and released 10-40. . . . . . . . . . . . . . . . . . . . . . . . . . . . . . . . .Connecting the Maintained Push button to data 10-43. . . . . . . . . . . . .
Setting up Latched Push buttons 10-43. . . . . . . . . . . . . . . . . . . . . . . . . . . . .Setting up the appearance of the Latched Push button andhow to unlatch it 10-44. . . . . . . . . . . . . . . . . . . . . . . . . . . . . . . . . . . . . . .Setting up what the Latched Push button does whenit is latched and unlatched 10-46. . . . . . . . . . . . . . . . . . . . . . . . . . . . . . . .Connecting the Latched Push button to data 10-49. . . . . . . . . . . . . . . .
Setting up Multistate Push buttons 10-49. . . . . . . . . . . . . . . . . . . . . . . . . . .Setting up the appearance of the Multistate Push buttonand how it changes state 10-50. . . . . . . . . . . . . . . . . . . . . . . . . . . . . . . . .Setting up what the Multistate Push button does whenit is pressed and released 10-52. . . . . . . . . . . . . . . . . . . . . . . . . . . . . . . . .Setting up whether the Multistate Push button pressrepeats when held down 10-55. . . . . . . . . . . . . . . . . . . . . . . . . . . . . . . . .Connecting the Multistate Push button to data 10-56. . . . . . . . . . . . . .
Setting up Interlocked Push buttons 10-57. . . . . . . . . . . . . . . . . . . . . . . . . .Setting up the Interlocked Push button’s appearance and value 10-58.Setting up the appearance of the Interlocked Push buttonwhen it is pressed and released 10-59. . . . . . . . . . . . . . . . . . . . . . . . . . . .Connecting the Interlocked Push button to data 10-62. . . . . . . . . . . . .
Setting up Ramp buttons 10-62. . . . . . . . . . . . . . . . . . . . . . . . . . . . . . . . . . .Setting up the appearance of the Ramp button and how it works 10-63Setting up a caption and image for the Ramp button 10-65. . . . . . . . . .Setting up whether the Ramp button press repeatswhen held down 10-68. . . . . . . . . . . . . . . . . . . . . . . . . . . . . . . . . . . . . . . .Connecting the Ramp button to data 10-68. . . . . . . . . . . . . . . . . . . . . .
How to use Numeric displays 10-68. . . . . . . . . . . . . . . . . . . . . . . . . . . . . . .How values are displayed 10-69. . . . . . . . . . . . . . . . . . . . . . . . . . . . . . . .Problems with displaying values 10-69. . . . . . . . . . . . . . . . . . . . . . . . . .
Setting up Numeric displays 10-69. . . . . . . . . . . . . . . . . . . . . . . . . . . . . . . . .

Contents � xi
Setting up the appearance of the Numeric display 10-70. . . . . . . . . . . .Connecting the Numeric display to data 10-72. . . . . . . . . . . . . . . . . . .
Setting up Numeric Input Enable buttons 10-73. . . . . . . . . . . . . . . . . . . . .Setting up the appearance and action of the Numeric InputEnable button 10-74. . . . . . . . . . . . . . . . . . . . . . . . . . . . . . . . . . . . . . . . . .Setting up a caption or image for the Numeric InputEnable button 10-76. . . . . . . . . . . . . . . . . . . . . . . . . . . . . . . . . . . . . . . . . .Setting up the how the Numeric Input Enable button’spop-up works with an Enter key 10-78. . . . . . . . . . . . . . . . . . . . . . . . . .Connecting the Numeric Input Enable button to data 10-79. . . . . . . .
How to use String displays 10-80. . . . . . . . . . . . . . . . . . . . . . . . . . . . . . . . . .How values are displayed 10-80. . . . . . . . . . . . . . . . . . . . . . . . . . . . . . . .
Setting up String displays 10-80. . . . . . . . . . . . . . . . . . . . . . . . . . . . . . . . . . .Setting up the appearance of the String display 10-81. . . . . . . . . . . . . .Connecting the String display to data 10-83. . . . . . . . . . . . . . . . . . . . . .
Setting up String Input Enable buttons 10-83. . . . . . . . . . . . . . . . . . . . . . . .Setting up the appearance and action of the String InputEnable button 10-84. . . . . . . . . . . . . . . . . . . . . . . . . . . . . . . . . . . . . . . . . .Setting up a caption or image for the String Input Enable button 10-86Setting up the how the String Input Enable button’spop-up works with an Enter key 10-89. . . . . . . . . . . . . . . . . . . . . . . . . .Connecting the String Input Enable button to data 10-90. . . . . . . . . . .
Setting up Goto Display buttons 10-90. . . . . . . . . . . . . . . . . . . . . . . . . . . . .Setting up the appearance of the Goto Display button 10-92. . . . . . . .Setting up a caption or image for the Goto Display button 10-94. . . .
Setting up Display List selectors 10-96. . . . . . . . . . . . . . . . . . . . . . . . . . . . .Setting up the appearance of the Display List selector 10-97. . . . . . . .Setting up which displays appear in the Display List selector 10-99. .
How to use indicators 10-100. . . . . . . . . . . . . . . . . . . . . . . . . . . . . . . . . . . . . .
Setting up Multistate indicators 10-101. . . . . . . . . . . . . . . . . . . . . . . . . . . . . .Setting up the appearance of the Multistate indicatorand its number of states 10-102. . . . . . . . . . . . . . . . . . . . . . . . . . . . . . . . . .Setting up how the Multistate indicator’s appearancechanges to match its value 10-102. . . . . . . . . . . . . . . . . . . . . . . . . . . . . . . .Connecting the Multistate indicator to data 10-106. . . . . . . . . . . . . . . . .

xii � RSView Machine Edition User’s Guide
Setting up Symbols 10-106. . . . . . . . . . . . . . . . . . . . . . . . . . . . . . . . . . . . . . . .Setting up the appearance of the Symbol and its numberof states 10-107. . . . . . . . . . . . . . . . . . . . . . . . . . . . . . . . . . . . . . . . . . . . . . .Setting up how the Symbol changes appearance whenits value changes 10-108. . . . . . . . . . . . . . . . . . . . . . . . . . . . . . . . . . . . . . . .Connecting the Symbol to data 10-110. . . . . . . . . . . . . . . . . . . . . . . . . . .
Setting up List indicators 10-110. . . . . . . . . . . . . . . . . . . . . . . . . . . . . . . . . . .Setting up the appearance of the List indicator and itsnumber of states 10-111. . . . . . . . . . . . . . . . . . . . . . . . . . . . . . . . . . . . . . . .Setting up how the List indicator’s appearance changeswhen its value changes 10-113. . . . . . . . . . . . . . . . . . . . . . . . . . . . . . . . . .Connecting the List indicator to data 10-114. . . . . . . . . . . . . . . . . . . . . .
How to use bar graphs, gauges, and scales 10-115. . . . . . . . . . . . . . . . . . . . .Bar graphs make it easy to compare values 10-115. . . . . . . . . . . . . . . . . .Thresholds change a bar graph’s fill color 10-115. . . . . . . . . . . . . . . . . . .Use bar graphs with scales to show limits 10-116. . . . . . . . . . . . . . . . . . .Gauges make it easy to see limits 10-116. . . . . . . . . . . . . . . . . . . . . . . . . .Thresholds change a gauge’s fill color 10-116. . . . . . . . . . . . . . . . . . . . . .
Setting up bar graphs 10-117. . . . . . . . . . . . . . . . . . . . . . . . . . . . . . . . . . . . . . .Setting up the appearance of the bar graph 10-118. . . . . . . . . . . . . . . . . .Connecting the bar graph to data 10-119. . . . . . . . . . . . . . . . . . . . . . . . . .
Setting up gauges 10-120. . . . . . . . . . . . . . . . . . . . . . . . . . . . . . . . . . . . . . . . . .Setting up the appearance of the gauge 10-120. . . . . . . . . . . . . . . . . . . . .Setting up how the gauge works 10-121. . . . . . . . . . . . . . . . . . . . . . . . . . .Connecting the gauge to data 10-123. . . . . . . . . . . . . . . . . . . . . . . . . . . . .
Setting up scales 10-124. . . . . . . . . . . . . . . . . . . . . . . . . . . . . . . . . . . . . . . . . . .Setting up the appearance of the scale 10-125. . . . . . . . . . . . . . . . . . . . . .
How to use Control List selectors 10-126. . . . . . . . . . . . . . . . . . . . . . . . . . . .How Enter key handshaking works 10-127. . . . . . . . . . . . . . . . . . . . . . .
Setting up Control List selectors 10-127. . . . . . . . . . . . . . . . . . . . . . . . . . . . .Setting up the appearance of the Control List selector 10-128. . . . . . . . . .Setting up the Control List selector’s state values and captions 10-130.Setting up the Control List selector to work with an Enter key 10-132.Connecting the Control List selector to data 10-133. . . . . . . . . . . . . . . .
Setting up Local Message displays 10-133. . . . . . . . . . . . . . . . . . . . . . . . . . . .Setting up the appearance of the Local Message display 10-134. . . . . . .Connecting the Local Message display to data 10-136. . . . . . . . . . . . . . .
Contents � xiii
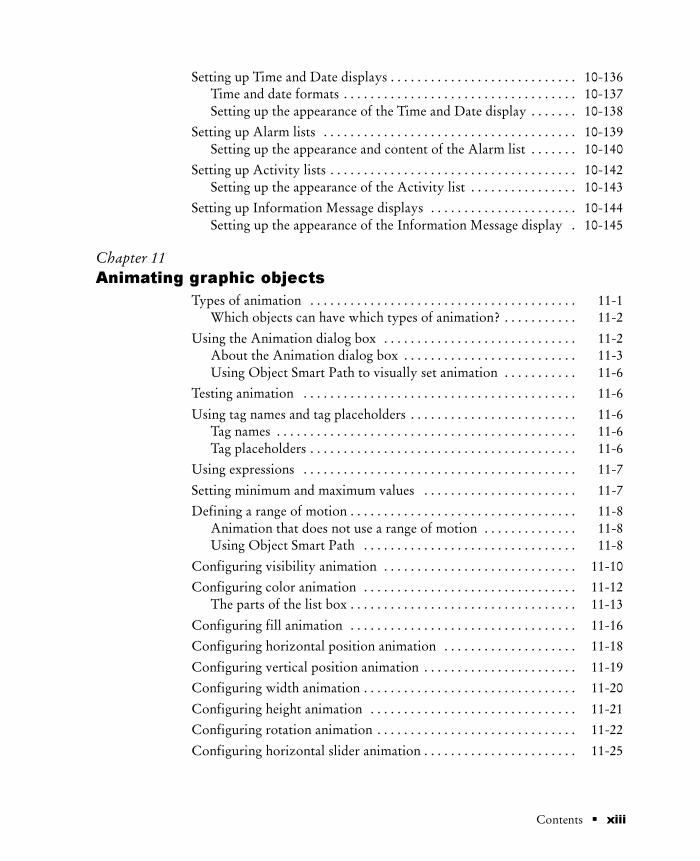
Setting up Time and Date displays 10-136. . . . . . . . . . . . . . . . . . . . . . . . . . . .Time and date formats 10-137. . . . . . . . . . . . . . . . . . . . . . . . . . . . . . . . . . .Setting up the appearance of the Time and Date display 10-138. . . . . . .
Setting up Alarm lists 10-139. . . . . . . . . . . . . . . . . . . . . . . . . . . . . . . . . . . . . .Setting up the appearance and content of the Alarm list 10-140. . . . . . .
Setting up Activity lists 10-142. . . . . . . . . . . . . . . . . . . . . . . . . . . . . . . . . . . . .Setting up the appearance of the Activity list 10-143. . . . . . . . . . . . . . . .
Setting up Information Message displays 10-144. . . . . . . . . . . . . . . . . . . . . .Setting up the appearance of the Information Message display 10-145.
Chapter 11Animating graphic objects
Types of animation 11-1. . . . . . . . . . . . . . . . . . . . . . . . . . . . . . . . . . . . . . . .Which objects can have which types of animation? 11-2. . . . . . . . . . .
Using the Animation dialog box 11-2. . . . . . . . . . . . . . . . . . . . . . . . . . . . .About the Animation dialog box 11-3. . . . . . . . . . . . . . . . . . . . . . . . . .Using Object Smart Path to visually set animation 11-6. . . . . . . . . . .
Testing animation 11-6. . . . . . . . . . . . . . . . . . . . . . . . . . . . . . . . . . . . . . . . .
Using tag names and tag placeholders 11-6. . . . . . . . . . . . . . . . . . . . . . . . .Tag names 11-6. . . . . . . . . . . . . . . . . . . . . . . . . . . . . . . . . . . . . . . . . . . . .Tag placeholders 11-6. . . . . . . . . . . . . . . . . . . . . . . . . . . . . . . . . . . . . . . .
Using expressions 11-7. . . . . . . . . . . . . . . . . . . . . . . . . . . . . . . . . . . . . . . . .
Setting minimum and maximum values 11-7. . . . . . . . . . . . . . . . . . . . . . .
Defining a range of motion 11-8. . . . . . . . . . . . . . . . . . . . . . . . . . . . . . . . . .Animation that does not use a range of motion 11-8. . . . . . . . . . . . . .Using Object Smart Path 11-8. . . . . . . . . . . . . . . . . . . . . . . . . . . . . . . .
Configuring visibility animation 11-10. . . . . . . . . . . . . . . . . . . . . . . . . . . . .
Configuring color animation 11-12. . . . . . . . . . . . . . . . . . . . . . . . . . . . . . . .The parts of the list box 11-13. . . . . . . . . . . . . . . . . . . . . . . . . . . . . . . . . .
Configuring fill animation 11-16. . . . . . . . . . . . . . . . . . . . . . . . . . . . . . . . . .
Configuring horizontal position animation 11-18. . . . . . . . . . . . . . . . . . . .
Configuring vertical position animation 11-19. . . . . . . . . . . . . . . . . . . . . . .
Configuring width animation 11-20. . . . . . . . . . . . . . . . . . . . . . . . . . . . . . . .
Configuring height animation 11-21. . . . . . . . . . . . . . . . . . . . . . . . . . . . . . .
Configuring rotation animation 11-22. . . . . . . . . . . . . . . . . . . . . . . . . . . . . .
Configuring horizontal slider animation 11-25. . . . . . . . . . . . . . . . . . . . . . .

xiv � RSView Machine Edition User’s Guide
Configuring vertical slider animation 11-26. . . . . . . . . . . . . . . . . . . . . . . . .
Applying animation to groups 11-27. . . . . . . . . . . . . . . . . . . . . . . . . . . . . . .
Checking the animation on objects 11-28. . . . . . . . . . . . . . . . . . . . . . . . . . .
Changing the animation on objects 11-29. . . . . . . . . . . . . . . . . . . . . . . . . . .
Copying or duplicating objects with animation 11-29. . . . . . . . . . . . . . . . .
Copying animation without copying objects 11-29. . . . . . . . . . . . . . . . . . .
Chapter 12Creating expressions
About expressions 12-1. . . . . . . . . . . . . . . . . . . . . . . . . . . . . . . . . . . . . . . . .Expressions that result in floating point values 12-1. . . . . . . . . . . . . .Expression components 12-2. . . . . . . . . . . . . . . . . . . . . . . . . . . . . . . . . .
Where you can use expressions 12-2. . . . . . . . . . . . . . . . . . . . . . . . . . . . . .
Using the Expression editor 12-3. . . . . . . . . . . . . . . . . . . . . . . . . . . . . . . . .Using the Expression editor versus typing expressions directly 12-3.About the Expression editor 12-4. . . . . . . . . . . . . . . . . . . . . . . . . . . . . .Expression box 12-4. . . . . . . . . . . . . . . . . . . . . . . . . . . . . . . . . . . . . . . . .Expression buttons 12-4. . . . . . . . . . . . . . . . . . . . . . . . . . . . . . . . . . . . .Validation area 12-5. . . . . . . . . . . . . . . . . . . . . . . . . . . . . . . . . . . . . . . . .Cursor position 12-5. . . . . . . . . . . . . . . . . . . . . . . . . . . . . . . . . . . . . . . .
Creating expressions 12-5. . . . . . . . . . . . . . . . . . . . . . . . . . . . . . . . . . . . . . .
Cutting, copying, and pasting expressions 12-6. . . . . . . . . . . . . . . . . . . . .
Formatting expressions 12-6. . . . . . . . . . . . . . . . . . . . . . . . . . . . . . . . . . . . .
Using tag names and tag placeholders 12-7. . . . . . . . . . . . . . . . . . . . . . . . .Using tag placeholders instead of tag names 12-7. . . . . . . . . . . . . . . . .
Constants 12-8. . . . . . . . . . . . . . . . . . . . . . . . . . . . . . . . . . . . . . . . . . . . . . . .
Arithmetic operators 12-8. . . . . . . . . . . . . . . . . . . . . . . . . . . . . . . . . . . . . . .String operands 12-9. . . . . . . . . . . . . . . . . . . . . . . . . . . . . . . . . . . . . . . . .
Relational operators 12-9. . . . . . . . . . . . . . . . . . . . . . . . . . . . . . . . . . . . . . .How string operands are evaluated 12-10. . . . . . . . . . . . . . . . . . . . . . . .
Logical operators 12-10. . . . . . . . . . . . . . . . . . . . . . . . . . . . . . . . . . . . . . . . . .
Bitwise operators 12-11. . . . . . . . . . . . . . . . . . . . . . . . . . . . . . . . . . . . . . . . . .Using the left shift operator 12-13. . . . . . . . . . . . . . . . . . . . . . . . . . . . . .
Evaluation order of operators 12-13. . . . . . . . . . . . . . . . . . . . . . . . . . . . . . .
Mathematical functions 12-16. . . . . . . . . . . . . . . . . . . . . . . . . . . . . . . . . . . . .
Security functions 12-17. . . . . . . . . . . . . . . . . . . . . . . . . . . . . . . . . . . . . . . . .

Contents � xv
If-then-else 12-17. . . . . . . . . . . . . . . . . . . . . . . . . . . . . . . . . . . . . . . . . . . . . . .Nested if-then-else 12-19. . . . . . . . . . . . . . . . . . . . . . . . . . . . . . . . . . . . . .
Using write expressions 12-20. . . . . . . . . . . . . . . . . . . . . . . . . . . . . . . . . . . .
Chapter 13Setting up alarms
About alarms 13-1. . . . . . . . . . . . . . . . . . . . . . . . . . . . . . . . . . . . . . . . . . . . .
Preparing to set up alarms 13-1. . . . . . . . . . . . . . . . . . . . . . . . . . . . . . . . . .The data source 13-2. . . . . . . . . . . . . . . . . . . . . . . . . . . . . . . . . . . . . . . .Tags and expressions 13-2. . . . . . . . . . . . . . . . . . . . . . . . . . . . . . . . . . . .Identifying alarm conditions 13-2. . . . . . . . . . . . . . . . . . . . . . . . . . . . . .
How alarms work 13-2. . . . . . . . . . . . . . . . . . . . . . . . . . . . . . . . . . . . . . . . .Alarm triggers and trigger values 13-2. . . . . . . . . . . . . . . . . . . . . . . . . .Alarm notification methods 13-3. . . . . . . . . . . . . . . . . . . . . . . . . . . . . .Displaying alarm information 13-3. . . . . . . . . . . . . . . . . . . . . . . . . . . .Responding to alarms 13-4. . . . . . . . . . . . . . . . . . . . . . . . . . . . . . . . . . .The alarm log file 13-5. . . . . . . . . . . . . . . . . . . . . . . . . . . . . . . . . . . . . . .The Alarm list 13-5. . . . . . . . . . . . . . . . . . . . . . . . . . . . . . . . . . . . . . . . .
Alarm trigger data types 13-6. . . . . . . . . . . . . . . . . . . . . . . . . . . . . . . . . . . .The Value trigger type 13-6. . . . . . . . . . . . . . . . . . . . . . . . . . . . . . . . . . .The Bit trigger type 13-7. . . . . . . . . . . . . . . . . . . . . . . . . . . . . . . . . . . . .The Least Significant Bit (LSBit) trigger type 13-9. . . . . . . . . . . . . . . .
Optional alarm controls 13-10. . . . . . . . . . . . . . . . . . . . . . . . . . . . . . . . . . . .Controls that work with a specific alarm trigger 13-11. . . . . . . . . . . . .How the Handshake control works 13-11. . . . . . . . . . . . . . . . . . . . . . . .How the Ack control works 13-11. . . . . . . . . . . . . . . . . . . . . . . . . . . . . .How the Remote Ack control works 13-12. . . . . . . . . . . . . . . . . . . . . .How the Remote Ack Handshake control works 13-13. . . . . . . . . . . .Controls that apply to all alarms 13-14. . . . . . . . . . . . . . . . . . . . . . . . . .How the Silence control works 13-14. . . . . . . . . . . . . . . . . . . . . . . . . . .How the Remote Silence control works 13-14. . . . . . . . . . . . . . . . . . . .How the Remote Ack All control works 13-14. . . . . . . . . . . . . . . . . . .
Summary of steps 13-15. . . . . . . . . . . . . . . . . . . . . . . . . . . . . . . . . . . . . . . . . .
Using the Alarm Setup editor 13-15. . . . . . . . . . . . . . . . . . . . . . . . . . . . . . . .
Creating alarm triggers 13-16. . . . . . . . . . . . . . . . . . . . . . . . . . . . . . . . . . . . .

xvi � RSView Machine Edition User’s Guide
Creating alarm messages 13-18. . . . . . . . . . . . . . . . . . . . . . . . . . . . . . . . . . . .Deleting messages 13-19. . . . . . . . . . . . . . . . . . . . . . . . . . . . . . . . . . . . . .Copying messages 13-19. . . . . . . . . . . . . . . . . . . . . . . . . . . . . . . . . . . . . .Creating messages in a spreadsheet application 13-20. . . . . . . . . . . . . .
Specifying how alarms are displayed, stored, and silenced 13-21. . . . . . . .What to do next 13-23. . . . . . . . . . . . . . . . . . . . . . . . . . . . . . . . . . . . . . . .
The [ALARM] display 13-23. . . . . . . . . . . . . . . . . . . . . . . . . . . . . . . . . . . . .
The [HISTORY] library 13-24. . . . . . . . . . . . . . . . . . . . . . . . . . . . . . . . . . . .
Creating your own alarm display 13-26. . . . . . . . . . . . . . . . . . . . . . . . . . . .
Opening and closing the alarm display 13-26. . . . . . . . . . . . . . . . . . . . . . . .Opening the display 13-26. . . . . . . . . . . . . . . . . . . . . . . . . . . . . . . . . . . . .Closing the display 13-26. . . . . . . . . . . . . . . . . . . . . . . . . . . . . . . . . . . . .
How the Alarm list works 13-27. . . . . . . . . . . . . . . . . . . . . . . . . . . . . . . . . .What is displayed 13-27. . . . . . . . . . . . . . . . . . . . . . . . . . . . . . . . . . . . . . .How the list scrolls 13-27. . . . . . . . . . . . . . . . . . . . . . . . . . . . . . . . . . . . .Using buttons with the Alarm list 13-28. . . . . . . . . . . . . . . . . . . . . . . . .
Using alarm buttons to acknowledge, silence, and delete alarms 13-29. . .Acknowledging the selected alarm 13-29. . . . . . . . . . . . . . . . . . . . . . . . .Acknowledging all alarms 13-30. . . . . . . . . . . . . . . . . . . . . . . . . . . . . . . .Silencing alarms 13-30. . . . . . . . . . . . . . . . . . . . . . . . . . . . . . . . . . . . . . . .Deleting messages 13-30. . . . . . . . . . . . . . . . . . . . . . . . . . . . . . . . . . . . . .
Chapter 14Creating information messages
About information messages 14-1. . . . . . . . . . . . . . . . . . . . . . . . . . . . . . . .When to use information messages 14-1. . . . . . . . . . . . . . . . . . . . . . . .
Preparing to set up information messages 14-1. . . . . . . . . . . . . . . . . . . . . .The data source 14-2. . . . . . . . . . . . . . . . . . . . . . . . . . . . . . . . . . . . . . . .Identifying the tags and values to monitor 14-2. . . . . . . . . . . . . . . . . .
How information messages work 14-2. . . . . . . . . . . . . . . . . . . . . . . . . . . .Information messages and trigger values 14-3. . . . . . . . . . . . . . . . . . . .The information message display 14-4. . . . . . . . . . . . . . . . . . . . . . . . . .
Summary of steps 14-4. . . . . . . . . . . . . . . . . . . . . . . . . . . . . . . . . . . . . . . . . .
Using the Information Messages editor 14-5. . . . . . . . . . . . . . . . . . . . . . .
Contents � xvii
Creating information messages 14-5. . . . . . . . . . . . . . . . . . . . . . . . . . . . . .Deleting messages 14-6. . . . . . . . . . . . . . . . . . . . . . . . . . . . . . . . . . . . . .Copying messages 14-6. . . . . . . . . . . . . . . . . . . . . . . . . . . . . . . . . . . . . .Creating messages in a spreadsheet application 14-6. . . . . . . . . . . . . .
Setting up how information messages are displayed 14-8. . . . . . . . . . . . .What to do next 14-9. . . . . . . . . . . . . . . . . . . . . . . . . . . . . . . . . . . . . . . .
The [INFORMATION] display 14-10. . . . . . . . . . . . . . . . . . . . . . . . . . . . .
Creating your own information message display 14-11. . . . . . . . . . . . . . . .
Opening and closing the information message display 14-11. . . . . . . . . . .Opening the display 14-11. . . . . . . . . . . . . . . . . . . . . . . . . . . . . . . . . . . . .Closing the display 14-11. . . . . . . . . . . . . . . . . . . . . . . . . . . . . . . . . . . . .
How the Information Message display graphic object works 14-12. . . . .What is displayed 14-12. . . . . . . . . . . . . . . . . . . . . . . . . . . . . . . . . . . . . . .
Changing the message file used at runtime 14-12. . . . . . . . . . . . . . . . . . . . .
Chapter 15Setting up activity logging
About activity logging 15-1. . . . . . . . . . . . . . . . . . . . . . . . . . . . . . . . . . . . .Message severity 15-1. . . . . . . . . . . . . . . . . . . . . . . . . . . . . . . . . . . . . . . .Which activities can be logged? 15-2. . . . . . . . . . . . . . . . . . . . . . . . . . .
Displaying activity messages during project development 15-2. . . . . . . .
Displaying activity messages at runtime 15-3. . . . . . . . . . . . . . . . . . . . . . .The activity message display 15-4. . . . . . . . . . . . . . . . . . . . . . . . . . . . . .
Summary of steps 15-4. . . . . . . . . . . . . . . . . . . . . . . . . . . . . . . . . . . . . . . . . .
Using the Activity Log Setup editor 15-5. . . . . . . . . . . . . . . . . . . . . . . . . .What to do next 15-6. . . . . . . . . . . . . . . . . . . . . . . . . . . . . . . . . . . . . . . .
The [ACTIVITY] display 15-7. . . . . . . . . . . . . . . . . . . . . . . . . . . . . . . . . . .
Creating your own activity display 15-7. . . . . . . . . . . . . . . . . . . . . . . . . . .
Opening and closing the activity display 15-8. . . . . . . . . . . . . . . . . . . . . .Opening the display 15-8. . . . . . . . . . . . . . . . . . . . . . . . . . . . . . . . . . . . .Closing the display 15-8. . . . . . . . . . . . . . . . . . . . . . . . . . . . . . . . . . . . .
How the Activity list works 15-8. . . . . . . . . . . . . . . . . . . . . . . . . . . . . . . . .What is displayed 15-8. . . . . . . . . . . . . . . . . . . . . . . . . . . . . . . . . . . . . . .Using buttons with the Activity list 15-9. . . . . . . . . . . . . . . . . . . . . . .

xviii � RSView Machine Edition User’s Guide
Chapter 16Setting up data logging
Data logging and the trend graphic object 16-1. . . . . . . . . . . . . . . . . . . . .
What is a data log model? 16-1. . . . . . . . . . . . . . . . . . . . . . . . . . . . . . . . . . .Tags in the data log model 16-2. . . . . . . . . . . . . . . . . . . . . . . . . . . . . . . .Data log files 16-2. . . . . . . . . . . . . . . . . . . . . . . . . . . . . . . . . . . . . . . . . . .
Data logging methods 16-2. . . . . . . . . . . . . . . . . . . . . . . . . . . . . . . . . . . . . .Logging periodically 16-3. . . . . . . . . . . . . . . . . . . . . . . . . . . . . . . . . . . .Logging on change 16-3. . . . . . . . . . . . . . . . . . . . . . . . . . . . . . . . . . . . . .
Data storage locations 16-3. . . . . . . . . . . . . . . . . . . . . . . . . . . . . . . . . . . . . .Logging to a network location 16-3. . . . . . . . . . . . . . . . . . . . . . . . . . . .
Summary of steps 16-4. . . . . . . . . . . . . . . . . . . . . . . . . . . . . . . . . . . . . . . . . .
Using the Data Log Models editor 16-4. . . . . . . . . . . . . . . . . . . . . . . . . . .
Creating data log models 16-5. . . . . . . . . . . . . . . . . . . . . . . . . . . . . . . . . . .
Configuring data log models 16-6. . . . . . . . . . . . . . . . . . . . . . . . . . . . . . . .Specifying how much data to store 16-6. . . . . . . . . . . . . . . . . . . . . . . .Specifying where to store the data 16-7. . . . . . . . . . . . . . . . . . . . . . . . .Specifying when to log data 16-8. . . . . . . . . . . . . . . . . . . . . . . . . . . . . .Specifying the tags to log data for 16-9. . . . . . . . . . . . . . . . . . . . . . . . .What to do next 16-10. . . . . . . . . . . . . . . . . . . . . . . . . . . . . . . . . . . . . . . .
Changing the data log model used at runtime 16-10. . . . . . . . . . . . . . . . . .
Problems with data logging 16-11. . . . . . . . . . . . . . . . . . . . . . . . . . . . . . . . .
Chapter 17Configuring trends
About trends 17-1. . . . . . . . . . . . . . . . . . . . . . . . . . . . . . . . . . . . . . . . . . . . .Current versus historical data 17-2. . . . . . . . . . . . . . . . . . . . . . . . . . . . .Time, date, and number formats 17-2. . . . . . . . . . . . . . . . . . . . . . . . . . .
The parts of a trend 17-3. . . . . . . . . . . . . . . . . . . . . . . . . . . . . . . . . . . . . . . .Trend border 17-3. . . . . . . . . . . . . . . . . . . . . . . . . . . . . . . . . . . . . . . . . . .Trend window 17-4. . . . . . . . . . . . . . . . . . . . . . . . . . . . . . . . . . . . . . . . .Chart 17-4. . . . . . . . . . . . . . . . . . . . . . . . . . . . . . . . . . . . . . . . . . . . . . . . .Y-axis 17-4. . . . . . . . . . . . . . . . . . . . . . . . . . . . . . . . . . . . . . . . . . . . . . . .Vertical axis labels 17-4. . . . . . . . . . . . . . . . . . . . . . . . . . . . . . . . . . . . . .X-axis 17-4. . . . . . . . . . . . . . . . . . . . . . . . . . . . . . . . . . . . . . . . . . . . . . . .Horizontal axis labels 17-5. . . . . . . . . . . . . . . . . . . . . . . . . . . . . . . . . . .Pens 17-5. . . . . . . . . . . . . . . . . . . . . . . . . . . . . . . . . . . . . . . . . . . . . . . . . .

Contents � xix
Pen icons 17-5. . . . . . . . . . . . . . . . . . . . . . . . . . . . . . . . . . . . . . . . . . . . . .Pen markers 17-5. . . . . . . . . . . . . . . . . . . . . . . . . . . . . . . . . . . . . . . . . . .
Chart types 17-5. . . . . . . . . . . . . . . . . . . . . . . . . . . . . . . . . . . . . . . . . . . . . . .Standard vs. XY Plots 17-5. . . . . . . . . . . . . . . . . . . . . . . . . . . . . . . . . . .Isolated graphing 17-6. . . . . . . . . . . . . . . . . . . . . . . . . . . . . . . . . . . . . . .Plotting a value across the full width of the chart 17-7. . . . . . . . . . . .
Choosing colors, fonts, lines, and markers 17-8. . . . . . . . . . . . . . . . . . . . .The trend border color 17-8. . . . . . . . . . . . . . . . . . . . . . . . . . . . . . . . . .The trend window color 17-9. . . . . . . . . . . . . . . . . . . . . . . . . . . . . . . . .
Testing the trend 17-9. . . . . . . . . . . . . . . . . . . . . . . . . . . . . . . . . . . . . . . . . .
Summary of steps 17-9. . . . . . . . . . . . . . . . . . . . . . . . . . . . . . . . . . . . . . . . . .
Creating trend objects 17-10. . . . . . . . . . . . . . . . . . . . . . . . . . . . . . . . . . . . . .
Configuring trends 17-10. . . . . . . . . . . . . . . . . . . . . . . . . . . . . . . . . . . . . . . .Specifying chart style and update mode 17-11. . . . . . . . . . . . . . . . . . . .Setting up how the trend works at runtime 17-12. . . . . . . . . . . . . . . . . .Setting up the horizontal axis 17-15. . . . . . . . . . . . . . . . . . . . . . . . . . . . .Setting up the vertical axis 17-17. . . . . . . . . . . . . . . . . . . . . . . . . . . . . . .Specifying the tags and expressions to plot data for 17-20. . . . . . . . . . .Configuring pens 17-21. . . . . . . . . . . . . . . . . . . . . . . . . . . . . . . . . . . . . . .
What to do next 17-23. . . . . . . . . . . . . . . . . . . . . . . . . . . . . . . . . . . . . . . . . . .
Using the Trends graphic library 17-23. . . . . . . . . . . . . . . . . . . . . . . . . . . . .
Using buttons to control the trend at runtime 17-24. . . . . . . . . . . . . . . . . .
Printing trend data 17-26. . . . . . . . . . . . . . . . . . . . . . . . . . . . . . . . . . . . . . . . .Improving clarity of the trend printout 17-26. . . . . . . . . . . . . . . . . . . . .
Runtime errors for the trend 17-27. . . . . . . . . . . . . . . . . . . . . . . . . . . . . . . .
Chapter 18Setting up security
About security 18-1. . . . . . . . . . . . . . . . . . . . . . . . . . . . . . . . . . . . . . . . . . . .
How user accounts and security codes work 18-2. . . . . . . . . . . . . . . . . . .
Summary of steps 18-4. . . . . . . . . . . . . . . . . . . . . . . . . . . . . . . . . . . . . . . . . .
Assigning security to graphic displays 18-4. . . . . . . . . . . . . . . . . . . . . . . .
Using the User Accounts editor 18-5. . . . . . . . . . . . . . . . . . . . . . . . . . . . . .Using the View menu 18-6. . . . . . . . . . . . . . . . . . . . . . . . . . . . . . . . . . .Using the Accept and Discard buttons 18-6. . . . . . . . . . . . . . . . . . . . .Using the tools 18-7. . . . . . . . . . . . . . . . . . . . . . . . . . . . . . . . . . . . . . . . .The DEFAULT user 18-8. . . . . . . . . . . . . . . . . . . . . . . . . . . . . . . . . . . .

xx � RSView Machine Edition User’s Guide
Setting up user accounts 18-8. . . . . . . . . . . . . . . . . . . . . . . . . . . . . . . . . . . .Deleting user accounts 18-9. . . . . . . . . . . . . . . . . . . . . . . . . . . . . . . . . .Changing passwords 18-9. . . . . . . . . . . . . . . . . . . . . . . . . . . . . . . . . . . .
Providing a way for users to log in and log out 18-9. . . . . . . . . . . . . . . . .Logging in 18-9. . . . . . . . . . . . . . . . . . . . . . . . . . . . . . . . . . . . . . . . . . . . .Logging out 18-10. . . . . . . . . . . . . . . . . . . . . . . . . . . . . . . . . . . . . . . . . . .
Preventing unauthorized users from stopping the project 18-10. . . . . . . .
Summary of security features in a sample startup display 18-11. . . . . . . . .
Chapter 19Setting up display navigation and controllingprojects at runtime
About display navigation 19-1. . . . . . . . . . . . . . . . . . . . . . . . . . . . . . . . . . .
About global connections 19-2. . . . . . . . . . . . . . . . . . . . . . . . . . . . . . . . . . .
Developing a hierarchy of displays 19-2. . . . . . . . . . . . . . . . . . . . . . . . . . .
Testing display navigation 19-3. . . . . . . . . . . . . . . . . . . . . . . . . . . . . . . . . . .
Using graphic objects to navigate 19-4. . . . . . . . . . . . . . . . . . . . . . . . . . . .Display type 19-4. . . . . . . . . . . . . . . . . . . . . . . . . . . . . . . . . . . . . . . . . . .Goto Display buttons 19-4. . . . . . . . . . . . . . . . . . . . . . . . . . . . . . . . . . .Return to Display buttons 19-5. . . . . . . . . . . . . . . . . . . . . . . . . . . . . . .Close Display buttons 19-6. . . . . . . . . . . . . . . . . . . . . . . . . . . . . . . . . . .Display List selectors 19-6. . . . . . . . . . . . . . . . . . . . . . . . . . . . . . . . . . .Shutdown button 19-7. . . . . . . . . . . . . . . . . . . . . . . . . . . . . . . . . . . . . . .
Controlling display changes remotely 19-7. . . . . . . . . . . . . . . . . . . . . . . . .Remote display changes and security 19-8. . . . . . . . . . . . . . . . . . . . . .
Configuring remote display changes 19-9. . . . . . . . . . . . . . . . . . . . . . . . . .
About global connections 19-9. . . . . . . . . . . . . . . . . . . . . . . . . . . . . . . . . . .Changing displays 19-10. . . . . . . . . . . . . . . . . . . . . . . . . . . . . . . . . . . . . .Printing displays 19-10. . . . . . . . . . . . . . . . . . . . . . . . . . . . . . . . . . . . . . .Updating the date and time 19-11. . . . . . . . . . . . . . . . . . . . . . . . . . . . . . .Running macros 19-12. . . . . . . . . . . . . . . . . . . . . . . . . . . . . . . . . . . . . . . .
Setting up global connections 19-13. . . . . . . . . . . . . . . . . . . . . . . . . . . . . . . .

Contents � xxi
Chapter 20Specifying startup settings, testing projects,and creating runtime projects
Specifying startup settings 20-1. . . . . . . . . . . . . . . . . . . . . . . . . . . . . . . . . .
Testing your project 20-3. . . . . . . . . . . . . . . . . . . . . . . . . . . . . . . . . . . . . . .
Creating runtime project files 20-4. . . . . . . . . . . . . . . . . . . . . . . . . . . . . . .
Chapter 21Preparing to run projects on a RAC6182
Summary of steps 21-1. . . . . . . . . . . . . . . . . . . . . . . . . . . . . . . . . . . . . . . . . .
Specifying time, date, and number formats 21-3. . . . . . . . . . . . . . . . . . . . .
Starting RSView ME Station 21-4. . . . . . . . . . . . . . . . . . . . . . . . . . . . . . . .
Specifying the driver to use for the transfer on the RAC6182 21-5. . . . .
Configuring an RSLinx driver for the transfer on thedevelopment computer 21-5. . . . . . . . . . . . . . . . . . . . . . . . . . . . . . . . . . . . .
Transferring projects to the RAC6182 21-6. . . . . . . . . . . . . . . . . . . . . . . .About the download 21-6. . . . . . . . . . . . . . . . . . . . . . . . . . . . . . . . . . . .
Configuring direct drivers on the RAC6182 21-8. . . . . . . . . . . . . . . . . . .Configuring the AB_DF1-1 driver 21-9. . . . . . . . . . . . . . . . . . . . . . . .Configuring the AB_KT-1 driver 21-11. . . . . . . . . . . . . . . . . . . . . . . . .
Specifying print options on the RAC6182 21-12. . . . . . . . . . . . . . . . . . . . .
Opening and running projects on the RAC6182 21-12. . . . . . . . . . . . . . . .
Other methods for starting RSView ME Station 21-13. . . . . . . . . . . . . . . .Using startup parameters 21-14. . . . . . . . . . . . . . . . . . . . . . . . . . . . . . . .Starting RSView ME Station when Windows starts 21-15. . . . . . . . . . .
Chapter 22Preparing to run projects in Windows 2000
Summary of steps 22-1. . . . . . . . . . . . . . . . . . . . . . . . . . . . . . . . . . . . . . . . . .
Specifying time, date, and number formats 22-3. . . . . . . . . . . . . . . . . . . . .
Using the DeskLock tool 22-4. . . . . . . . . . . . . . . . . . . . . . . . . . . . . . . . . . .
Moving the project to the runtime computer 22-4. . . . . . . . . . . . . . . . . . .
Starting RSView ME Station 22-4. . . . . . . . . . . . . . . . . . . . . . . . . . . . . . . .
Configuring direct drivers in Windows 2000 22-5. . . . . . . . . . . . . . . . . . .

xxii � RSView Machine Edition User’s Guide
Specifying the printers to use at runtime 22-6. . . . . . . . . . . . . . . . . . . . . . .Printing alarm and activity messages 22-6. . . . . . . . . . . . . . . . . . . . . . .Printing graphic displays 22-6. . . . . . . . . . . . . . . . . . . . . . . . . . . . . . . . .
Opening and running projects in Windows 2000 22-8. . . . . . . . . . . . . . . .
Other methods for starting RSView ME Station 22-8. . . . . . . . . . . . . . . .Using startup parameters 22-9. . . . . . . . . . . . . . . . . . . . . . . . . . . . . . . .Starting RSView ME Station when Windows starts 22-10. . . . . . . . . . .
Chapter 23Starting, stopping, and configuring projects at runtime
Using the RSView ME Station dialog box 23-1. . . . . . . . . . . . . . . . . . . . .
Storing temporary files on an external card (RAC6182 projects only) 23-2
Selecting the project to configure or run 23-2. . . . . . . . . . . . . . . . . . . . . . .
Editing channels on the runtime computer 23-3. . . . . . . . . . . . . . . . . . . . .
Editing nodes on the runtime computer 23-4. . . . . . . . . . . . . . . . . . . . . . .
Deleting log files on the runtime computer 23-5. . . . . . . . . . . . . . . . . . . .Running a newer version of the project 23-5. . . . . . . . . . . . . . . . . . . . .Deleting log files at project startup 23-5. . . . . . . . . . . . . . . . . . . . . . . .
Running projects 23-6. . . . . . . . . . . . . . . . . . . . . . . . . . . . . . . . . . . . . . . . . .
Stopping projects 23-6. . . . . . . . . . . . . . . . . . . . . . . . . . . . . . . . . . . . . . . . . .What happens when the project stops 23-6. . . . . . . . . . . . . . . . . . . . . .
Chapter 24Running your project
Logging in to a Windows domain 24-1. . . . . . . . . . . . . . . . . . . . . . . . . . . .
Logging in to the project 24-1. . . . . . . . . . . . . . . . . . . . . . . . . . . . . . . . . . .What happens when a user logs in 24-3. . . . . . . . . . . . . . . . . . . . . . . . .Problems with logging in 24-3. . . . . . . . . . . . . . . . . . . . . . . . . . . . . . . .
Logging out 24-3. . . . . . . . . . . . . . . . . . . . . . . . . . . . . . . . . . . . . . . . . . . . . .
Entering numeric values 24-3. . . . . . . . . . . . . . . . . . . . . . . . . . . . . . . . . . . .Using the numeric pop-up keypad 24-4. . . . . . . . . . . . . . . . . . . . . . . . .Using the numeric pop-up scratchpad 24-4. . . . . . . . . . . . . . . . . . . . . .Using buttons and keys with the numeric pop-ups 24-5. . . . . . . . . . .How values are calculated 24-5. . . . . . . . . . . . . . . . . . . . . . . . . . . . . . . .Problems with the numeric pop-ups 24-6. . . . . . . . . . . . . . . . . . . . . . .

Contents � xxiii
Entering string values 24-7. . . . . . . . . . . . . . . . . . . . . . . . . . . . . . . . . . . . . .Using the string pop-up keyboard 24-7. . . . . . . . . . . . . . . . . . . . . . . . .Using the string pop-up scratchpad 24-7. . . . . . . . . . . . . . . . . . . . . . . .Using buttons and keys with the string pop-ups 24-8. . . . . . . . . . . . .What is written to the Value control 24-9. . . . . . . . . . . . . . . . . . . . . . .Problems with the string pop-ups 24-10. . . . . . . . . . . . . . . . . . . . . . . . .
Changing tag values 24-10. . . . . . . . . . . . . . . . . . . . . . . . . . . . . . . . . . . . . . . .
Viewing tag data 24-12. . . . . . . . . . . . . . . . . . . . . . . . . . . . . . . . . . . . . . . . . .
Viewing alarms and messages 24-14. . . . . . . . . . . . . . . . . . . . . . . . . . . . . . . .
Viewing information about runtime communication errors 24-15. . . . . . .The communication error banner 24-15. . . . . . . . . . . . . . . . . . . . . . . . .Direct driver communication error messages 24-16. . . . . . . . . . . . . . . .OPC communication error messages 24-16. . . . . . . . . . . . . . . . . . . . . .Displaying communication errors in the Activity list 24-16. . . . . . . . .Displaying communication information using system tags 24-16. . . . .
Appendix ASystem tags
Communications A-1. . . . . . . . . . . . . . . . . . . . . . . . . . . . . . . . . . . . . . . . . .
Graphics A-2. . . . . . . . . . . . . . . . . . . . . . . . . . . . . . . . . . . . . . . . . . . . . . . . .
Time A-3. . . . . . . . . . . . . . . . . . . . . . . . . . . . . . . . . . . . . . . . . . . . . . . . . . . .
User A-4. . . . . . . . . . . . . . . . . . . . . . . . . . . . . . . . . . . . . . . . . . . . . . . . . . . . .
Appendix BAddressing syntax for Allen-Bradleyprogrammable controllers
PLC addressing syntax B-1. . . . . . . . . . . . . . . . . . . . . . . . . . . . . . . . . . . . .
SLC addressing syntax B-7. . . . . . . . . . . . . . . . . . . . . . . . . . . . . . . . . . . . .
SoftLogix 5 addressing syntax B-19. . . . . . . . . . . . . . . . . . . . . . . . . . . . . . .
Mnemonic tables B-22. . . . . . . . . . . . . . . . . . . . . . . . . . . . . . . . . . . . . . . . . .

xxiv � RSView Machine Edition User’s Guide
Appendix CStation addressing for nodes connecting toAllen-Bradley devices
Local station addressing C-1. . . . . . . . . . . . . . . . . . . . . . . . . . . . . . . . . . . .Host name C-1. . . . . . . . . . . . . . . . . . . . . . . . . . . . . . . . . . . . . . . . . . . .
Index
� P-1Preface
Preface
Thank you for choosing RSView Machine Edition. RSView� is anintegrated package for developing and running automation projects.
Designed for use with Microsoft� Windows� 2000 and onRAC6182� computers running Microsoft Windows CE 3.0,RSView gives you all the tools you need to create effectivemachine-level monitoring and control projects.
About the documentation
The RSView Machine Edition documentation set includes:
Release Notes: Information to read before you begin installing orworking with the software.
RSView Machine Edition Installation Guide: A guide to installingand activating the various components of RSView.
RSView Machine Edition User’s Guide: Comprehensiveinformation about RSView, procedures for creating and running anautomation project, and reference information.
Help: Online procedures and reference information.
Finding the information you need
You have many options for finding information about how to useRSView, or how to solve problems with RSView.
Try the User’s Guide and Help first
The User’s Guide and Help provide comprehensive informationabout typical uses of RSView. Chances are, your question isanswered in the documentation.
P

Preface
P-2 � RSView Machine Edition User’s Guide
To find the answer, use the table of contents and the index in theUser’s Guide and Help.
You can also perform a full-text search on both the Help and the.pdf version of the User’s Guide. For information about usingHelp, see Chapter 5, “Getting the information you need,” in theRSView Machine Edition Installation Guide.
Information on the Internet
If you can’t find the answer to your question or problem in theUser’s Guide or Help, you can also find information on the WorldWide Web.
The RSView Forum
http://www.rsviewforum.com
The RSView Forum is a web site for users like you. The RSViewForum offers:
patches and updates that provide the latest fixes for problems inRSView
an RSView frequently-asked questions (FAQ) list, forinformation about how to solve the problems our technicalsupport teams encounter most often
discussion groups, for exchanging tips and questions with otherRSView users

� P-3Preface
design resources, to help you put together graphic displays, andready-made ActiveX� objects you can use in your own RSViewprojects
information about what’s new, including productannouncements, new articles, and information provided byRockwell Software
The Rockwell Software Support Library
http://www5.software.rockwell.com/kbmenu/knowbasehome.htm
The Rockwell Software Support Library is a comprehensivesearchable database of support information for all RockwellSoftware products.
You can also access the Support Library from within RSViewStudio. To do so, you must have a web browser installed on yourcomputer, and you must have an active Internet connection.

Preface
P-4 � RSView Machine Edition User’s Guide
To access support pages from RSView Studio:
� On the Help menu, select Rockwell Software on the Web, andthen click the name of the web page you want to view.
Contacting Rockwell Software TechnicalSupport
If you can’t find the answer to your question using any of theresources suggested above, contact Rockwell Software TechnicalSupport at:
Telephone: 440-646-5800
Fax: 440-646-5801
World Wide Web: http://www.software.rockwell.com orhttp://support.rockwellautomation.com
Support staff are available Monday to Friday from 8 AM to 5 PM
Eastern Standard Time, except on statutory holidays.
When you call
When you call, you should be at your computer and ready to give:
the product serial number
You’ll find this number on the Activation disk label and in theAbout dialog box that you access from the Help menu inRSView.
the product version number
the type of hardware you are using
the exact wording of any messages that appeared on your screen
a description of what happened and what you were doing whenthe problem occurred
a description of how you tried to solve the problem
� 1-1Introducing RSView Machine Edition
Introducing RSViewMachine Edition
RSView Machine Edition is software for developing and runninghuman-machine interface (HMI) projects. RSView Machine Editionis designed for monitoring and controlling automated processes andmachines.
For information about installing RSView Machine Edition, see theRSView Machine Edition Installation Guide.
The parts of RSView Machine Edition
RSView Machine Edition includes two products:
RSView Studio� is configuration software for developingmachine-level HMI projects. This software runs on the Windows2000 operating system.
RSView ME Station� is a stand-alone runtime environment formachine-level HMI projects. Use RSView ME Station to run theprojects you develop in RSView Studio.
You can run machine-level projects on RAC6182 computers withthe Windows CE 3.0 operating system, and on computers that usethe Windows 2000 operating system.
Additional software
The RSView Machine Edition CD also includes two additionalsoftware products:
RSLinx� for RSView Enterprise Series is software that providescommunications to a wide range of direct drivers. RSLinx is anOPC�-compliant data server.
Adobe� Acrobat� Reader 5.0 is software for reading the onlineRSView Machine Edition User’s Guide. If desired, you can also usethe software to print the User’s Guide.
1Chapter

Preface
1-2 � RSView Machine Edition User’s Guide
The RSView Machine Edition tools
These tools are installed with RSView Studio:
Project Transport Wizard is software for renaming, copying,deleting, backing up, and restoring projects.
Tag Import and Export Wizard is software for importing orexporting the RSView tag database.
Transfer Utility is software for moving a runtime machine-levelproject from the development computer to the RAC6182terminal.
This tool is installed with RSView ME Station:
DeskLock is software that prevents Windows 2000 users fromexiting the RSView program at runtime. You cannot useDeskLock if you are running your project on a RAC6182.

� 2-1Exploring RSView Studio
Exploring RSViewStudioThis chapter describes:
opening and closing RSView Studio
opening sample projects
exploring the RSView Studio main window
using the Project Explorer
working with editors
entering information in spreadsheets
working with components
printing information in editors and components
Opening and closing RSView Studio
Opening RSView Studio
To open RSView Studio:
� On the Windows Start menu, select Programs, and then clickRSView Studio.
RSView comes with several sample projects. We suggest you openthe Malthouse sample project now to use while you try out theinstructions in the remainder of this chapter. See the instructions onpage 2-2.
Closing RSView Studio
To close RSView Studio:
� On the File menu, click Exit.
If there are any unsaved changes in open editors, RSView Studioasks you whether to save the changes before closing theprogram.
2Chapter

Preface
2-2 � RSView Machine Edition User’s Guide
Opening sample projects
The sample projects are designed for two screen resolutions: 640 x480 and 800 x 600. Select the project that matches the screenresolution of your runtime monitor.
To open the Malthouse sample project:
1. Open RSView Studio.
2. Click the Existing tab.
3. Click Malthouse_640x480 or Malthouse_800x600.
4. Click Open.
RSView Studio displays the sample project in the ProjectExplorer.

� 2-3Exploring RSView Studio
Exploring the RSView Studio main window
Title bar
Project Explorer
Menu bar
Toolbar
Activity bar
Status bar
Work area
The menu bar
The menu bar contains the menu items for the active window. Eacheditor has its own set of menus.
The toolbar
The toolbar contains buttons for commonly used menu items soyou can quickly access the items without opening the menu. Whenyou point to a button on the toolbar, the button name is displayedin a tooltip and in the status bar.
Tooltip
All editors use the Standard toolbar. The Graphics Display,Graphics Library, User Accounts, Nodes, and Tag Database editorshave additional toolbars.

Preface
2-4 � RSView Machine Edition User’s Guide
The Project Explorer
The Project Explorer contains the editors for creating and editingyour project. For more information about the Project Explorer, seepage 2-6.
The activity bar
The activity bar shows messages about system activities when youtest your graphic displays. You can specify the types of messages todisplay in the activity bar, move the bar, resize it, and clear themessages in it.
For information about moving and resizing the activity bar, seepage 8-6. For information about testing graphic displays, seepage 8-9.
Messages in the activity bar
The types of messages that appear in the activity bar depend onhow you set up activity logging on the development system. Forinformation about specifying the types of activities to display, seepage 15-2.
Activity messages are preceded by a white, yellow, or red icon.White indicates information, yellow indicates a warning, and redindicates an error.
To clear the selected message in the activity bar, click Clear. Toclear all the messages in the activity bar, click Clear All.
The status bar
The status bar displays information about the active window orabout the selected tool or menu item. The information that isdisplayed depends on where the mouse pointer is. For example,when you select a graphic object in the Graphics Display editor, thestatus bar displays information about the selected object.
Workbook tabs
If you select Workbook Mode on the View menu, the work areadisplays tabs at the bottom for each open editor or component.Workbook Mode allows you to bring forward an open item morequickly than by using the Window menu.

� 2-5Exploring RSView Studio
Workbook tabs
Showing and hiding items in the mainwindow
You can display or hide all the items in the main window (exceptthe menu bar) by clicking the items on the View menu.
The status bar, Project Explorer,
activity bar, and Standard toolbar
are visible. Workbook Mode is
turned off.

Preface
2-6 � RSView Machine Edition User’s Guide
To hide or display the Project Explorer:
� On the View menu, click Explorer Window, or click theExplorer Window tool on the toolbar.
Using the Project Explorer
The Project Explorer is the main tool for working with RSViewStudio. It lists the editors you use to develop your project, as wellas the components, such as graphic displays, you’ve created. Whenyou create or open a project, the project name appears in the titlebar of the Project Explorer.
Click the - symbol to close
a folder.
Components are listed
below the editor’s icon.
Click the + symbol to
see the list of
components for an editor.
You can resize the Project Explorer by dragging its edges.
Explorer Window tool

� 2-7Exploring RSView Studio
Viewing the Project Explorer
You can view the Project Explorer in a number of ways:
As a docked window. When docked, the explorer is always ontop of other windows that it overlaps. You can dock theexplorer to any edge of the main window.
As a floating window. When floating, the explorer is always ontop of other windows that it overlaps, but you can move it todifferent locations in the middle of the main window.
As a “child” window. When the explorer is in child mode, youcan minimize the explorer or position other windows in front ofit. This mode is particularly useful when you are working inmultiple editors or working with the Help open.
To put the explorer in child mode, right-click the ProjectExplorer title bar, and then click MDI Child.
Moving the Project Explorer
You can move the Project Explorer in a number of ways:
Click the title bar and drag.
Double-click the title bar to float the explorer in the middle ofthe main window, then drag it to a new position.
Right-click the title bar, then select a new docking location,floating, or child mode.
Working with editors
When developing a project, you will use many different editors, butthey have many similar features and often require similarinformation. Knowing how to use these features saves time.
For information on working with particular editors, see thechapters later in this guide.

Preface
2-8 � RSView Machine Edition User’s Guide
Locating editors
The editors are grouped in folders in the Project Explorer (see theillustration on page 2-6). Each editor is displayed with an icon tothe left of the editor name.
To open a folder in the Project Explorer:
� Click the + symbol to the left of the folder icon, or double-clickthe folder name.
Viewing an editor’s components
With some editors you enter information in a single window or atabbed dialog box. Other editors allow you to create multiplecomponents, such as graphic displays or message files. Eachcomponent is stored in a separate file, with its own name.
You can create components in these editors:
Graphics Display
Graphics Library
Parameters
Local Messages
Information Messages
Data Log Models
Macros
The Project Explorer lists the components you create under theicon for the editor you used to create the component.
You can use the Images editor to copy bitmap images into yourproject (but not to create new images). Each image you copy islisted as a component under the editor.
To view a list of components for an editor:
� Click the + symbol to the left of the editor icon, or double-clickthe editor name.
Opening editors
To open an editor:
� Right-click the editor, and then click Open or New.
If there are no components in the editor, you can double-clickthe editor to open it.

� 2-9Exploring RSView Studio
Closing editors
To close an editor:
� Click the close button on the editor’s title bar, or on the Filemenu click Close.Some editors have an OK or Close button that you can click toclose the editor.
Entering information in spreadsheetsSome editors contain spreadsheets for entering information. Youcan enter information in the white columns. Gray columns displayinformation; you cannot enter information in them.
Enter information in
this column.
This column is for display
purposes only.
These editors contain spreadsheets:
Nodes*Tag Database*
User Accounts
Global ConnectionsLocal Messages
Alarm SetupInformation Setup
Information MessagesMacros
* You cannot make changes in the spreadsheets in the Nodes andTag Database editors. In these editors, you must use the Formsection of the editor to create and edit components.
Preface
2-10 � RSView Machine Edition User’s Guide
In the Graphics Display editor, many of the properties dialog boxesfor configuring graphic objects contain spreadsheets for assigningtags or expressions to the objects.
To enter information in a cell in a spreadsheet:
� Click the cell, and then type the information. If the cell alreadycontains text, the new information is added after the currenttext.
In the Property Panel, double-click the cell and then type theinformation. If the cell already contains text, double-clickinghighlights the text and typing replaces the highlighted text.
To move to the next cell in the row:
� Press Tab or Enter.
The method to use depends on which editor you’re working in.
To move to the first cell in the next row:
� Press Enter or Down Arrow.
The method to use depends on which editor you’re working in.
To delete a cell’s contents:
� Click the cell, and then press Delete or Backspace. PressingBackspace removes the characters one by one.
The method to use depends on which editor you’re working in.
Working with components
This section describes how to perform basic operations that arecommon to all components.
For information on working with components in particular editors,see the chapters later in this guide.
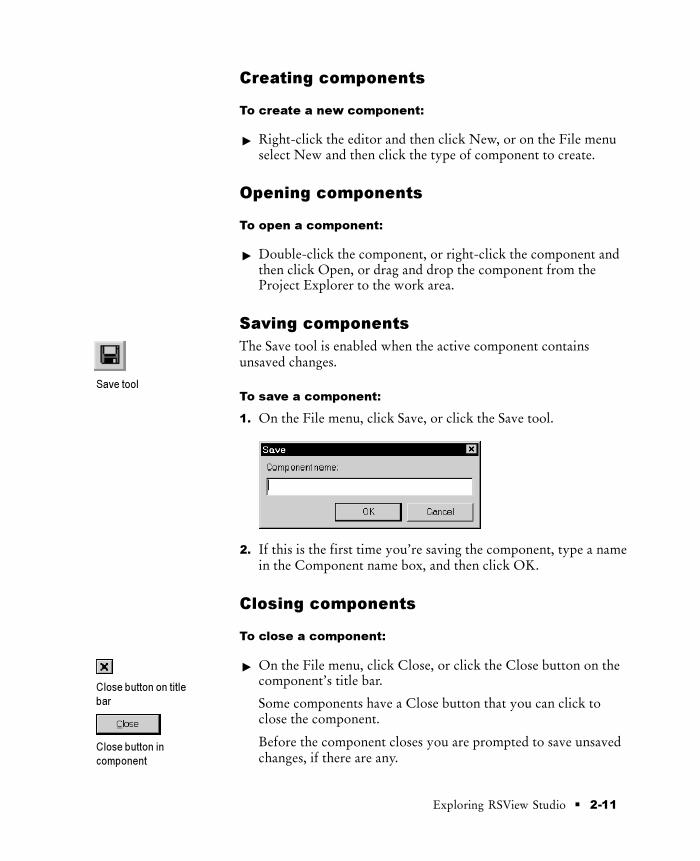
� 2-11Exploring RSView Studio
Creating components
To create a new component:
� Right-click the editor and then click New, or on the File menuselect New and then click the type of component to create.
Opening components
To open a component:
� Double-click the component, or right-click the component andthen click Open, or drag and drop the component from theProject Explorer to the work area.
Saving components
The Save tool is enabled when the active component containsunsaved changes.
To save a component:
1. On the File menu, click Save, or click the Save tool.
2. If this is the first time you’re saving the component, type a namein the Component name box, and then click OK.
Closing components
To close a component:
� On the File menu, click Close, or click the Close button on thecomponent’s title bar.
Some components have a Close button that you can click toclose the component.
Before the component closes you are prompted to save unsavedchanges, if there are any.
Save tool
Close button on title
bar
Close button in
component

Preface
2-12 � RSView Machine Edition User’s Guide
Adding components into a project
You can use the same components in more than one project byadding components into a project.
For example, if you want to use the same graphic display inProject A and Project B, create the display in Project A, then addthe graphic display component from Project A to Project B.
When you add the component into Project B, changes you make tothe component in Project B are not reflected in the component inProject A.
To add a component from Project A into Project B:
1. In Project B, right-click the type of editor that was used tocreate the desired component. For example, to add a graphicdisplay component, right-click the Displays icon in theGraphics folder.
2. Click Add Component Into Project.
3. In the dialog box, navigate to the component to add (inProject A’s folder), and then click the component’s file name.
Click and Shift-click to select a group of components, orCtrl-click to select multiple individual components.
For information about project folders and files, see Chapter 4.
4. Click Open. The components are listed under the editor in theProject Explorer in Project B.
If you later modify the component in Project A, you can add thecomponent into Project B again using the same steps as describedabove.

� 2-13Exploring RSView Studio
Using Add Component Into Project with graphic displays
and graphic libraries
The Add Component Into Project menu command is also usefulfor:
adding graphic displays to your project’s Libraries folder
using libraries as graphic displays in your project
For information about graphic libraries, see page 8-16.
Deleting components
Deleting a component deletes it from the Project Explorer and fromthe hard disk.
To delete a component:
� Right-click the component, and then click Delete.
Removing components
You can remove a component from the Project Explorer but leave iton the hard disk, in case you want to use the component in anotherproject.
To remove a component:
� Right-click the component, and then click Remove.
Renaming components
To rename a component:
1. Right-click the component, and then click Rename.
2. In the To box, type the new name.
3. Click OK.

Preface
2-14 � RSView Machine Edition User’s Guide
Duplicating components
The Duplicate option is useful for creating multiple similarcomponents. For example, you could create a graphic display to useas a template, then duplicate the display each time you want to usethe template.
To duplicate a component:
1. Right-click the component, and then click Duplicate.
2. In the Component name box, type a name for the duplicatecomponent.
3. Click OK.
Printing
Each editor has a Print item on its File menu.
To print an editor or component’s contents:
1. Open the editor or component.
2. On the File menu, click Print.
3. Click OK.
Selecting a printer
You must install a printer before you can select it. For informationon installing a printer, see your Windows documentation.
IMPORTANT The Print Setup menu item in RSView Studio applies toyour development computer only.
To print at runtime, set up a printer on the computeryou’ll be using to run your project. For informationabout printing at runtime, see page 2-15.

� 2-15Exploring RSView Studio
To select a printer:
1. On the File menu in any editor or component, click Print Setup.
2. If you don’t want to use the default printer, specify anotherprinter.
3. Choose the appropriate paper and orientation options.
4. Click OK.
Selecting printer setup options
For detailed information about printer options, refer to yourWindows documentation.
Selecting a network printer
RSView Studio can print to a network printer. For detailedinformation about setting up network printers, refer to yourWindows documentation.
Printing at runtime
You can print graphic displays at runtime using the Display Printbutton object or using a remote display print. You can also sendactivity and alarm messages to a printer at runtime.
For information about See
Display Print buttons Page 8-35
Printing graphic displays Chapter 8
Printing displays remotely Chapter 19

Preface
2-16 � RSView Machine Edition User’s Guide
For information about See
Printing alarm messages Chapter 13
Printing activity messages Chapter 15
Specifying the printers to use atruntime
Chapter 23

� 3-1Planning projects
Planning projects
A well-designed project requires planning. To help you plan, thischapter describes:
understanding the machines and processes you’re automating
collecting data
designing a tag database
planning graphic displays and navigating between them
planning alarms
providing information for the operator
using trends
designing a secure system
RSView comes with several sample projects that can give youguidance when planning your project. For instructions on openingthe sample projects, see page 2-2.
Understanding the process
Gather information from a variety of sources so you have acomplete and detailed understanding of the machines and processesyou’re automating.
To gather information:
Talk to machine operators and other experts who are going touse the system. Find out what information they need tooptimize machine operations and processes.
Talk to management and MIS (Management InformationSystems) staff to find out what information they need to supportplanning decisions.
Break up each section of the process into its constituent parts.
Determine what type of communications you’ll be using—OPCor direct driver.
3Chapter

Preface
3-2 � RSView Machine Edition User’s Guide
Determine which process variables need to be accessed andidentify their locations in the programmable controllers.
For information about setting up direct driver communications, seeChapter 5. For information about setting up OPC communications,see Chapter 6.
Collecting data
When planning data collection, design your system so only essentialdata is collected. Limiting data collection is important becausecollection activities require substantial processing power andgenerate a lot of traffic on the communication channel or network.
Keep data collection requirements in mind when designing thelayout of the programmable controller data tables and the tagdatabase. Ideally, tag addresses should reference contiguous blocksof programmable controller data tables to reduce highway trafficand optimize system response. If you’re going to use data from anOPC server, read the server documentation to find out how tooptimize traffic.
Designing a tag database
Take the time to plan your tag database. A good design helps reducethe time required for maintenance and can improve programmablecontroller-to-RSView response time.
For information about creating a tag database, see Chapter 7.
Collecting information
Before you begin creating the database, collect:
flowcharts of your processes (or process and instrumentdiagrams)
a list of programmable controller data table or register addressesyour project will be accessing
machinery systems documentation
alarm requirements (for more detail, see “Planning alarms,” laterin this chapter)

� 3-3Planning projects
Organizing tags
Before creating tags:
Develop naming conventions for tags, choosing names that arefamiliar and logical to everyone. This makes troubleshootingeasier.
Group related tags.
Group tags in the way that makes most sense for your project.For example, group all similar devices or group related areas ofthe plant floor.
When creating tags, place related tags into folders. For greaterorganization, nest folders.
Planning graphic displays
When planning displays, determine the best way for users tonavigate through your displays and develop a template to establisha common look and feel for your displays.
Also consider factors about the runtime terminal that affect howthe project is displayed and used, such as:
screen size
whether the operator will be using a keyboard, touch screen,mouse, or combination of navigation and data entry methods
For information about creating graphic displays, see Chapter 8.
Developing a hierarchy of displays
A hierarchy of displays is a series of graphic displays that provideprogressively more detail as users move through them. Design yourdisplay hierarchy to meet the needs of the various users, includingmanagers, supervisors, and operators.
Well-organized graphic displays present information clearly andconsistently and guide users through the system. Before designingindividual graphic displays, plan an overall display hierarchy andplan how users will navigate through the hierarchy.
For information about navigation methods and developing ahierarchy of displays, see Chapter 19.

Preface
3-4 � RSView Machine Edition User’s Guide
Creating a template to ensure consistency
It is possible to keep a consistent appearance among all the displaysin a project by presenting the same pieces of information in thesame place on each graphic display. To ensure uniformity, develop adisplay with common elements that acts as a template. Each timeyou develop a new display, start with a duplicate of the template.
For example, the template could contain:
company logo
title
date and time
navigational buttons
The template does not use a special file format like a MicrosoftWord template does, but is simply a graphic display that youduplicate for each new display.
When designing displays, applying good visual design principleshelps users and increases their efficiency. Remember theseimportant design principles:
Consistency
Be consistent with your use of symbols and color.
Be consistent with button labels and button placement.
When you design several displays, place the same kinds ofbuttons in the same positions. For example, if you have a Startbutton in a certain position in one display, don’t put a Stopbutton in the same position in the next display.
Clarity
Use symbols that are easily recognizable. For example, use theconventional ISA symbols for tanks and valves.
Don’t overload the screen with information.
Use standard, clear terminology, and avoid abbreviations oracronyms that the user might not understand.
Use colors with recognizable meanings. For example, in NorthAmerica the colors red and green usually mean stop and start.Keep color meanings consistent by assigning red only to Stopbuttons, and green only to Start buttons.

� 3-5Planning projects
Some people are color blind to red and green so don’t rely oncolor alone to establish meaning.
Use high contrast color combinations, such as yellow on blue.
Usability
If you’re designing for a touch screen, don’t place importantbuttons where they’ll be blocked by an On Top display. Theuser can’t press a covered button. Also, ensure the button islarge enough for users to touch easily.
Ensure there is always a clear way to move between displays.
Planning alarms
Before setting up alarms, plan:
what conditions will trigger alarms
how operators will be notified of alarms
what information you want alarm messages to contain
how operators will respond to alarms
For information about setting up alarms, see Chapter 13.
Providing information for the operator
In addition to notifying the operator of alarm conditions, you canprovide information and instructions about plant processes, andinform the operator about system activities.
Before setting up information notification, plan:
what system activity the operator needs to be informed about
what conditions will trigger information messages
what information you want the messages to contain
Local and information messages
Use local messages to give the operator information in a specificgraphic display while the display is open. Use information messagesto give the operator information no matter which display is open.
For information about setting up local messages, see page 8-29. Forinformation about setting up information messages, see Chapter 14.

Preface
3-6 � RSView Machine Edition User’s Guide
Activity logging
Set up activity logging to notify the operator of system activity suchas tag reads and writes, communication problems, macros, orproblems opening displays.
For information about setting up activity logging, see Chapter 15.
Using trends
When planning trends, consider how they will be used. Forexample, will the trend be used to:
analyze process trends?
monitor production efficiency?
archive process variables to ensure compliance with governmentregulations?
Based on such considerations, you can determine:
which tags need to be plotted on the same trend
which tags need to be logged by using a data log model
For information about setting up data logging, see Chapter 16. Forinformation about creating trend graphic objects, see Chapter 17.
Designing a secure system
When deciding on your security requirements, consider whether to:
restrict access to every graphic display to prevent accidentalchanges
restrict access to certain graphic displays
have everyone log on
use the DeskLock tool to prevent users from switching toanother application at runtime (Windows 2000 runtime projectsonly)
Based on these considerations, you can set up security forindividual users or groups of users. For example, you might want toset up groups of users, such as a manager group and an operatorgroup.
For more information about setting up security, see Chapter 18.
� 4-1Working with projects
Working with projects
This chapter describes:
project files
creating, opening, and closing projects
copying, deleting, backing up, renaming, and restoring projects
specifying project settings
viewing project properties
What is a project?
A project is the software application you create in RSView Studio tomonitor and control your plant processes.
During project development, the project consists of a folder on yourhard disk that contains the main project file (with the extension.med) and a set of folders containing additional project files. Theproject folder is located in this directory:
C:\Documents and Settings\All Users\Documents\RSViewEnterprise\ME\HMI projects
The .med file contains general project information such as a list ofproject components and the project’s directory location and versionnumbers. You open this file to work on the project in RSViewStudio.
When you create a project, some of the folders are empty until youstart setting up your project. When you finish developing theproject, RSView uses the information in the project’s folders andfiles to create the runtime project.
The runtime project consists of a file with the extension .mer. Forinformation about creating the runtime project, see Chapter 20.
4Chapter

Preface
4-2 � RSView Machine Edition User’s Guide
Project files
The following table lists the project folders and the types of filesthey contain.
This folder Contains File
extensions
Project name Main project file and the foldersdescribed below
.med
Accounts User account file .act
ActivityLog Activity log setup file .alg
cache\RDMDATA Internal communication files .ctl, .dat, .idx
CommStatus Internal communication file(created when you test run theproject)
.stg
comprf Internal information onchannels, nodes, and scan classes
.csv, .ctl
DLG Data log models (componentfiles)
.mdf
Gfx Graphic display component files .gfx
GlobalConn Global connections file .gcn
Images Image files .bmp
Information Information setup fileInformation messagecomponent files
.ifo
.ifm
Local Local message component files .loc
M_Alarms Alarm setup file .mal
Macros Macro component files .mcr
PAR Parameter component files .par
Project Settings Project setting file .pts
Startup Startup settings file .stp
TAG Tag database files
Tag cache file
.crc, .ctl, .dat,
.db
.cac
Component file locations
Component files are located in folders in the project folder, asdescribed in the previous table. For example, graphic displaycomponent files (with the extension .gfx) are stored in the Gfxfolder.

� 4-3Working with projects
External folders
The following table lists RSView folders that are external to theproject folder, and the types of files they contain.
The folders are located in this directory:
C:\Documents and Settings\All Users\Documents\RSViewEnterprise
This folder Contains File
extensions
Images Image files for use ongraphic objects
.bmp
ME\Libraries Graphic librarycomponent files andimage files used in thelibrary displays
.gfx
.bmp
ME\Logs\Runtime ProjectName\Dlg\Data Log ModelName
Data log files forprojects that have runon the developmentcomputer
.log, .tag
ME\Logs\Runtime ProjectName\M_Alarms
Alarm log file forprojects that have runon the developmentcomputer
.alm
ME\Runtime Runtime project files .mer
ME\HMI projects Sample project folders,including all files andfolders needed for thesample
If desired, you can specify a different directory in which to storegraphic library component files. For more information, seepage 8-18.
Default log file locations for RAC6182projects
On the RAC6182, alarm and data log folders are located by defaultin this directory:
\Storage Card\Rockwell Software\RSViewME\Logs\
Data log file locations
You can also store data log files in a different location on the runtimecomputer, on a networked computer, or on a PCMCIA card. Formore information, see Chapter 16.

Preface
4-4 � RSView Machine Edition User’s Guide
Naming files
File names, including the path, can be up to 200 characters long (filenames can contain spaces). For example, the following path and filename contains 114 characters:
C:\Documents and Settings\All Users\Documents\RSViewEnterprise\ME\HMI projects\Malthouse_640x480\Gfx\Steeping.gfx
Creating, opening, and closing projects
Creating projects
You can create a new project when you open RSView Studio, oronce RSView Studio is already open.
To create a new project when you open RSView Studio:
1. Open RSView Studio.
2. In the New tab, in the Project name box, type a name for yourproject.
If desired, type a description of the project. If you don’t type adescription now, you can add one later, as described onpage 4-14.
3. Click Create.
RSView Studio creates the project’s folders and files, and thendisplays the new project in the Project Explorer.

� 4-5Working with projects
The project is created in the ME\HMI projects directory, in a folderwith the same name as the project name.
This is the path to the ME\HMI projects directory:
C:\Documents and Settings\All Users\Documents\RSViewEnterprise\ME\HMI projects
IMPORTANTOnce you create the project, specify the projectsettings. These settings determine the generalappearance of your runtime project, and affect howyour graphic displays look. For more information, seepage 4-7.
To create a new project when RSView Studio is already
open:
1. On the File menu, click New Project, or click the New Projecttool.
If a project is already open, RSView Studio asks you whether toclose the project that is currently open. Click Yes.
2. Follow steps 2 and 3 in the previous procedure.
Opening projects
You can open a project when you open RSView Studio, or onceRSView Studio is already open.
For information about opening a sample project, see page 2-2.
To open an existing project when you open RSView Studio:
1. Open RSView Studio.
New Project tool

Preface
4-6 � RSView Machine Edition User’s Guide
2. Click the Existing tab, and then click the project to open.
If the project you want to open is not displayed in the list, clickBrowse, navigate to the folder containing the project’s .med file,and then click the file name.
3. Click Open.
RSView Studio displays the project in the Project Explorer.
To open an existing project when RSView Studio is already
open:
1. On the File menu, click Open Project, or click the Open Projecttool.
If a project is already open, RSView Studio asks you whether toclose the project that is currently open. Click Yes.
2. Follow steps 2 and 3 in the previous procedure.
To open a project you used recently:
� On the File menu, select Recent Projects, and then click the nameof the project to open.
If a project is already open, RSView Studio asks you whether toclose the project that is currently open. Click Yes.
Opening multiple projects
To open two projects at the same time, for example to copy imagesand graphic objects between projects, open two instances of RSViewStudio.
Closing projects
To close a project:
� On the File menu, click Close Project.
If there are any unsaved changes in open editors, RSView Studioasks you whether to save the changes before closing the project.
To close a project and close RSView Studio at the same
time:
� Click the Close button at the right end of the RSView Studio titlebar.
If there are any unsaved changes in open editors, RSView Studioasks you whether to save the changes before closing.
Open Project tool
Close button

� 4-7Working with projects
Copying, deleting, backing up, renaming, andrestoring projects
Use the Project Transport Wizard tool to:
copy projects
delete projects
create a compressed backup copy of the project, with the fileextension .mea
rename projects
restore a project from the backup file
To start the wizard, do one of the following:
In RSView Studio, on the Tools menu click Project TransportWizard.
On the Windows Start menu, select Programs, RockwellSoftware, RSView Enterprise, Tools, and then click ME ProjectTransport Wizard.
For details about using the wizard, see the wizard’s Help.
About project settingsProject settings determine the general appearance of your runtimeproject, such as the size of the project window and whether a titlebar appears in the project window.
Since project settings affect how your graphic displays look, specifythe settings before creating graphic displays.
Project window size and runtime screenresolution
This section describes the difference between project window sizeand runtime screen resolution, and describes how these two settingscan affect the behavior of your project at runtime.
The project window size is the amount of room your projectoccupies on the runtime terminal or computer screen, in pixels. Theruntime screen resolution is the actual size of the runtime terminalor computer screen, in pixels. Therefore, the project window sizemust be less than or equal to the runtime screen resolution.

Preface
4-8 � RSView Machine Edition User’s Guide
Project window size
(640 x 480 pixels)
Screen resolution
(1024 x 768 pixels)
Usually, a project is designed to completely fill the runtime terminalor computer screen. If you want your project to do this, set theproject window size to the resolution of the screen in pixels. Forinformation on setting the project window size, see page 4-12.
Specify the screen resolution in the Display Properties dialog box inthe Windows Control Panel of your runtime computer.
Changing the project window size after creating graphic
displays
The project window size is used for all graphic displays of theReplace type. If you decrease the window size after you havedesigned any graphic displays, Replace displays are resized, but anyobjects in the displays remain the same size and in the same positionas before. On Top displays are not resized.
For more information about Replace and On Top displays, seepage 8-10.

� 4-9Working with projects
How the runtime screen resolution affects the pop-up
windows
RSView comes with a pop-up Login window, as well as numeric andstring pop-ups for runtime data entry. You cannot control the size orposition of these pop-up windows. If you plan to use the Loginwindow or numeric or string pop-ups at runtime, the runtime screenresolution must be at least as big as the minimum size for thepop-ups that you want to use.
Pop-up Minimum width
in pixels
Minimum height
in pixels
Login window 280 84
Numeric pop-up keypad 124 240
Numeric pop-up scratchpad 124 68
String pop-up keyboard 236 208
String pop-up scratchpad 236 64
RSView automatically sizes the pop-ups based on the runtime screenresolution. If the runtime screen resolution is smaller than theminimum pop-up size, the pop-up cannot open at runtime.
RSView sizes the
pop-up to occupy the
center of the screen

Preface
4-10 � RSView Machine Edition User’s Guide
How the project window size affects the default message
displays
Your project comes with preconfigured, default graphic displays foractivity, alarm, and information messages. If the project window sizeis smaller than the default displays, the edges of the displays are cutoff at runtime.
The right edge of the
[ALARM] display is
cut off.
These are the sizes of the default displays:
Graphic display Width in pixels Height in pixels
[ACTIVITY] 640 160
[ALARM] 640 215
[INFORMATION] 640 80
If your project window size is smaller than the default messagedisplay sizes, you can resize the displays, or use your own displaysinstead.
Title bar
If you select this option, a title bar is used for all Replace graphicdisplays. For information about graphic display types, see page 8-10.
If desired, you can also use a Control box, Minimize button, andClose button on the title bar. The Close button appears only if youselect the Control box in the Project Settings editor.

� 4-11Working with projects
Title Graphic display name Minimize button
Control box Close button
If you plan to set up security for your project and want to preventunauthorized users from stopping the project, do not use a title bar.
For information about setting up security, see Chapter 18.
Title bar for On Top displays
For On Top displays, you can specify a different name to use in thetitle bar. Use the Display Settings dialog box to specify the name (fordetails, see page 8-10).
The title you specify in
the Project Settings
editor applies to all
Replace displays.
You can specify a
different title for each
On Top display (using
the Display Settings
dialog box in the
Graphics Display
editor).

Preface
4-12 � RSView Machine Edition User’s Guide
Specifying project settings
To specify project settings:
1. Open the Project Settings editor.
2. In the General tab, specify these settings:
Project window size
Select a standard window size, or to use a different size, selectCustom size.
Width
If you select Custom size, type the width of the window inpixels.
Height
If you select Custom size, type the height of the window inpixels.

� 4-13Working with projects
3. Click the Runtime tab, and then specify these settings:
Title bar
Select this check box to display the name of the project (or othertitle) in a title bar at the top of the window. Type the title in thebox below the check box.
If you select this option, the window border is automaticallydisplayed with the title bar.
Border
Select this check box to display a border around the projectwindow. If you select Title bar, this option is selectedautomatically.
Control box
Select this check box to display a Control box at the left end ofthe title bar. The user can click the Control box to display theControl menu, which contains options for displaying, moving,sizing, and closing the window.
If you select this option, a Close button appears at the right endof the title bar.
This option is available only if you select Title bar.
Minimize button
Select this check box to display a Minimize button at the rightend of the title bar. The Minimize button reduces the window toan icon.
Control menu
Preface
4-14 � RSView Machine Edition User’s Guide
This option is available only if you select Title bar and Controlbox.
Project window position
Type the number of pixels from the top left corner of the screento position the window. If the project window occupies thewhole screen, accept the default values of 0.
4. Click OK to save the settings and close the editor.
Viewing project properties
You can use the Project Explorer to view this information aboutyour project:
Project name
Project description, if any
Location of the project file
Number of graphic displays in the project
Maximum number of displays you’re licensed to use
To view project properties:
1. In the Project Explorer, right-click the project name (at the topof the Explorer tree), and then click Properties.

� 4-15Working with projects
2. If desired, enter or modify the description for the project.


� 5-1Setting up direct driver communications
Setting up direct drivercommunicationsThis chapter describes:
when to use direct driver communications
how the communication channel, network, device, driver, andnodes work together
steps for setting up direct driver communications
configuring channels
creating direct driver nodes
configuring scan classes
monitoring communications
When to use direct driver communicationsUse direct drivers to communicate with Allen-Bradley controllersover these network types:
DH+�
DH-485
TCP/IP (Ethernet�)
ControlNet�
Use OPC (OLE for Process Control) to connect to third-partydevices or servers. For details, see Chapter 6.
Overview of direct driver communications atruntime
Communication through direct drivers involves:
channels
communication devices
communication driver software
nodes (control devices)
5Chapter
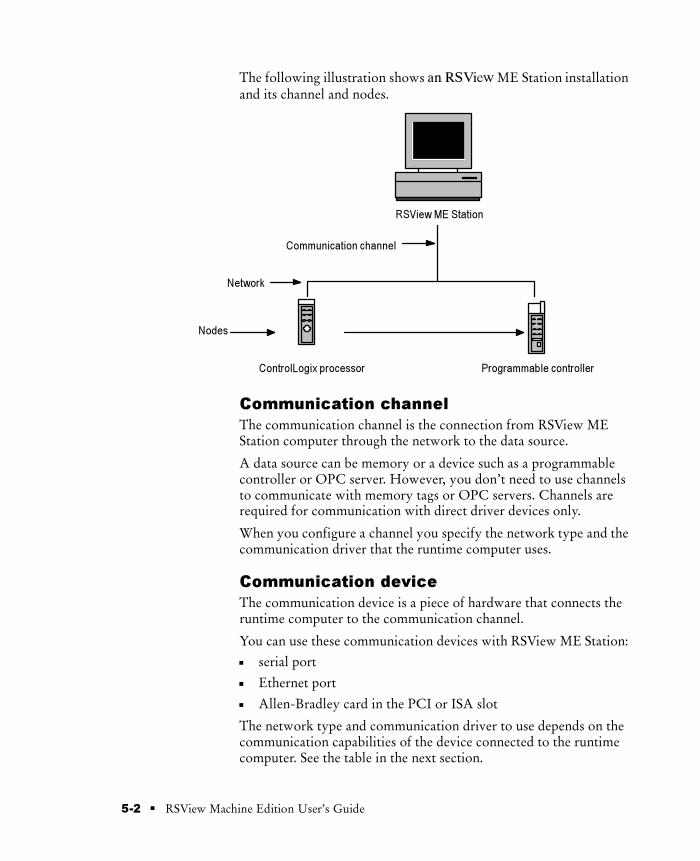
Preface
5-2 � RSView Machine Edition User’s Guide
The following illustration shows an RSView ME Station installationand its channel and nodes.
RSView ME Station
Communication channel
Nodes
Programmable controller
Network
ControlLogix processor
Communication channel
The communication channel is the connection from RSView MEStation computer through the network to the data source.
A data source can be memory or a device such as a programmablecontroller or OPC server. However, you don’t need to use channelsto communicate with memory tags or OPC servers. Channels arerequired for communication with direct driver devices only.
When you configure a channel you specify the network type and thecommunication driver that the runtime computer uses.
Communication device
The communication device is a piece of hardware that connects theruntime computer to the communication channel.
You can use these communication devices with RSView ME Station:
serial port
Ethernet port
Allen-Bradley card in the PCI or ISA slot
The network type and communication driver to use depends on thecommunication capabilities of the device connected to the runtimecomputer. See the table in the next section.

� 5-3Setting up direct driver communications
For installation information, see the documentation that comes withthe communication device you’re using.
Communication driver
The communication driver is the software that permits the runtimecomputer to communicate with the communication device.
Windows 2000
For projects that will run on the Windows 2000 operating system,see RSLinx for a list of available driver types and devices.
RAC6182
For projects that will run on the RAC6182, you can use thesecommunication drivers:
Use this
driver
For this network
typeUsing this device
AB_DF1-1 DH+ RS-232 serial port connected toa KF2 box, or connecteddirectly to a DF1 serial port ona device
AB_ETH-1 TCP/IP: 10Base-T or100Base-TX Ethernet
RJ45 connector (Ethernet port),communicating with a PLC-5
AB_KT-1 DH+ or DH-485 A-B 1784-PKTX card in thePCI slot
Using SoftLogix 5 controllers
You can use SoftLogix� 5 controllers with Windows 2000 projectsonly.
To communicate with a SoftLogix 5 controller using RSLinx andRSView, configure a TCP/IP channel and use one of these drivers:
SOFT5 driver
AB_ETH driver.
Configuring the SOFT5 driver
For the SOFT5 driver, when configuring the SoftLogix 5 driver inRSLinx, enter the IP address or UNC name of the SoftLogix 5controller in the Station Mapping tab.

Preface
5-4 � RSView Machine Edition User’s Guide
If the SoftLogix 5 controller is not running on the same computer asRSLinx, the Windows 2000 user account that is running RSLinxmust be a member of the SoftLogix Administrators group on theSoftLogix 5 computer.
Configuring the AB_ETH driver
For the AB_ETH driver, when configuring the Ethernet driver inRSLinx, enter the IP address of the SoftLogix 5 controller in theStation Mapping tab. You must also enable the WinSock TCP/IPdriver in SoftLogix 5.
Drivers on the development system versusdrivers on the RAC6182
The Transfer Utility that you use to download the project to theruntime computer uses an RSLinx driver on the developmentsystem. This driver is used for the transfer only.
Therefore, you must configure an RSLinx driver on the developmentcomputer when you download the project to the runtime computer,then configure a driver on the RAC6182 before starting the project.
If you will be using an Ethernet network to communicate atruntime, you don’t need to configure the communication driver onthe RAC6182. If you will be using a DH+ or DH-485 network, youmust enable the appropriate communication driver and ensure that itis configured correctly before you begin running your project.
For information about configuring an RSLinx driver for thedownload, see Chapter 21. For information about configuring adriver on the RAC6182, see Chapter 23.
Node (control device)
The node is a data source attached to a network. When your projectis running, RSView must periodically update tag values in the valuetable. This is done by scanning the nodes.
When you configure a node you specify the channel the node is on,its station address, and the type of node (for example, PLC-5�).
Example: Configuring communications with a PLC-5
This example shows how to set up communications via Ethernet to aPLC-5.

� 5-5Setting up direct driver communications
RSView
ME StationPLC-5
Ethernet
Adding an RSLinx device driver
Use RSLinx to configure the Ethernet driver AB_ETH-1:
1. In RSLinx, on the Communications menu, click ConfigureDrivers.
2. In the Available Driver Types box, select Ethernet devices, andthen click Add New.
3. In the Add New RSLinx Driver dialog box, accept AB_ETH-1by clicking OK.

Preface
5-6 � RSView Machine Edition User’s Guide
4. In the Host Name column, type the IP address of the PLC-5,and then click OK.
5. Click Close to close the Configure Drivers dialog box.
6. Close RSLinx.
Setting up a channel in RSView Studio
Use the Channels editor to set up a TCP/IP channel.

� 5-7Setting up direct driver communications
1. In the Channels editor, select a channel, and then select theTCP/IP network type.
2. In the Communication Driver box, select the Ethernet devicedriver, AB_ETH-1, and then click OK.
Creating a node
Use the Nodes editor to set up a direct driver node to connect to thePLC-5:
1. In the Nodes editor, create a direct driver node calledController1.

Preface
5-8 � RSView Machine Edition User’s Guide
Click the PLC-5 to select it.
2. Select the TCP/IP channel you created, and then click theBrowse button beside the Station box.
3. In the RSWho dialog box, browse the AB_ETH-1 driver to thePLC-5.
4. Click the IP address for the PLC-5 (in either pane), and thenclick OK.
5. In the Type box, select PLC-5, and then click Accept.
Creating a tag
Use the Tag Database editor to create a tag that uses the node youjust created:
1. In the Tag Database editor, create a digital tag namedPump1_start.
Browse button

� 5-9Setting up direct driver communications
2. Select Device as the data source, click the Browse button next tothe Node Name box, and then select the Controller1 node.
3. In the Address box, type the address in the PLC-5: B3:0/0.
4. Click Accept to save the tag.
If desired, you could create additional tags to connect with otheraddresses in the PLC-5.
Setting up direct driver communication toprogrammable controllers
The instructions below summarize the steps for setting up directdriver communication with programmable controllers.
You can set up communications in RSView even if you do not havecommunication drivers and communication hardware installed.
Summary of steps
1. Start RSView Studio and create or open a project.
2. In the Channels editor, select a channel and assign theappropriate network type to it.
Browse button

Preface
5-10 � RSView Machine Edition User’s Guide
In the Communication Driver box, assign a driver to the channel.If you do not have drivers loaded on the development computer,select None Loaded.
For details, see page 5-11.
3. In the Nodes editor, create nodes for each programmablecontroller you wish to communicate with.
For details, see page 5-15.
4. If you want to change the default rate at which tags are scanned,open the Scan Classes editor and edit the scan classes.
For details, see page 5-17.
5. In the Tag Database editor, create tags. For each tag, select Deviceas the data source and assign the nodes and scan classes that youhave defined.
For details, see Chapter 7.
6. Set up communication monitoring.
For details, see page 5-19.
7. Develop the other features of your project.
For details, see the chapters in this book relating to the featuresyou plan to use.
8. Create the runtime project.
For details, see Chapter 20.
9. Transfer the runtime project to the runtime computer.
For information about transferring projects to the RAC6182, seeChapter 21. For information about transferring Windows 2000projects, see Chapter 22.
10. Configure the communication driver in RSView ME Station.
For details, see Chapter 23.

� 5-11Setting up direct driver communications
Configuring channels
To configure a channel:
1. Open the Channels editor.
2. Select a channel, and then fill in this information:
Network Type
If you don’t want to use the channel, or want to clear a channelconfiguration, select Unassigned.
Otherwise, using the table as a guide, select a network type.
You can use direct drivers to communicate with ControlLogixprocessors if you map the ControlLogix addresses to theequivalent PLC-5 addresses. For information about PLC-5addressing syntax, see Appendix B.
To communicate with ControlLogix processors using their nativeaddressing, use an RSLinx OPC server. For more information,see page 6-4.
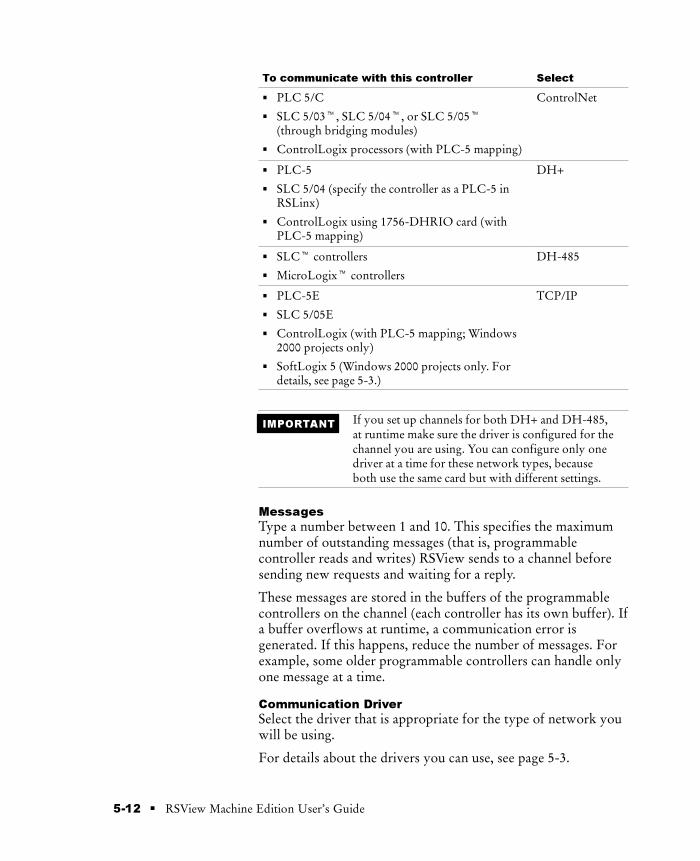
Preface
5-12 � RSView Machine Edition User’s Guide
To communicate with this controller Select
� PLC 5/C
� SLC 5/03�, SLC 5/04�, or SLC 5/05�(through bridging modules)
� ControlLogix processors (with PLC-5 mapping)
ControlNet
� PLC-5
� SLC 5/04 (specify the controller as a PLC-5 inRSLinx)
� ControlLogix using 1756-DHRIO card (withPLC-5 mapping)
DH+
� SLC� controllers
� MicroLogix� controllers
DH-485
� PLC-5E
� SLC 5/05E
� ControlLogix (with PLC-5 mapping; Windows2000 projects only)
� SoftLogix 5 (Windows 2000 projects only. Fordetails, see page 5-3.)
TCP/IP
IMPORTANT If you set up channels for both DH+ and DH-485,at runtime make sure the driver is configured for thechannel you are using. You can configure only onedriver at a time for these network types, becauseboth use the same card but with different settings.
Messages
Type a number between 1 and 10. This specifies the maximumnumber of outstanding messages (that is, programmablecontroller reads and writes) RSView sends to a channel beforesending new requests and waiting for a reply.
These messages are stored in the buffers of the programmablecontrollers on the channel (each controller has its own buffer). Ifa buffer overflows at runtime, a communication error isgenerated. If this happens, reduce the number of messages. Forexample, some older programmable controllers can handle onlyone message at a time.
Communication Driver
Select the driver that is appropriate for the type of network youwill be using.
For details about the drivers you can use, see page 5-3.

� 5-13Setting up direct driver communications
To configure communications without the appropriate hardwareor software installed, select None Loaded as the driver, and thenassign a driver to the channel when you start the project atruntime.
Or, you can add the driver in RSLinx even though the hardwareis not installed (just disregard the error messages in RSLinx). Thiswill allow you to select the correct driver when you set up yourchannel.
3. When you finish configuring channels, click OK.
Changing the channel configuration
To change the channel configuration once nodes have beenassigned—for example, to move a project from a computer usingDH+ to a computer using TCP/IP—create a new channel of thecorrect type. Re-assign the channel number for each node, and thendelete the original channel.
Editing channels at runtime
You can change a channel’s configuration on the runtime computer.For example, if you set up a channel without specifying acommunication driver, you can specify the driver at runtime. Formore information, see page 23-3.
Using the Nodes editor
A node allows you to assign a logical name and address to each datasource you want to communicate with. Each data source is thenreferred to throughout RSView by the node name.
Use the Nodes editor to set up nodes for each data source theproject will communicate with at runtime.

Preface
5-14 � RSView Machine Edition User’s Guide
Spreadsheet area
Form area
Use the scroll bar or drag
the border of the editor to
see more columns.
The information you enter in the form area is displayed in thespreadsheet area.
Using the View menu
Use the items on the View menu to control the appearance of theNodes editor.
To do this On the View menu, click this
Show or hide the spreadsheet area Spreadsheet
Show or hide the form area Form
Change the font used in thespreadsheet area
Spreadsheet Font. In the Fontdialog box, specify the font, style,and size to use.
Restore the default font Restore Default Settings
Using the Accept and Discard buttons
When you enter information, the Prev and Next buttons change toAccept and Discard buttons. Click Accept to save node information.Click Discard to cancel changes to a node.

� 5-15Setting up direct driver communications
Using the tools
The Nodes editor has these tools for working in the editor:
Use this tool To do this
Delete Delete the selected node.
Duplicate Create a duplicate of the selectednode, with all the same settings,except that the name is blank.
Insert Row Insert a blank row above theselected row.
Creating direct driver nodes
Before you can create a node, you must set up communicationchannels. For details, see page 5-11.
To create a node:
1. Open the Nodes editor.
2. If the editor already contains node definitions, click the last(blank) row in the spreadsheet, or click Next to scroll to a blankrow.
3. Fill in this information for each node:
Data Source
Select Direct Driver.
For details about the OPC Server data source, see Chapter 6.
Name
Type a name up to 40 characters long. This name represents thedevice on the network. When you create a device tag, you mustassign a node to the tag, and this name identifies the node.
The name can have upper and lower case letters, numbers,dashes, and underscores. Spaces are not permitted.
Enabled
Normally nodes are enabled, allowing data collection. However,during setup or troubleshooting you might want to disable anode to prevent communication timeouts or invalid data. When anode is disabled, tag values can still be read and written, but thevalues are read from and written to the value table in memoryinstead of the data source.

Preface
5-16 � RSView Machine Edition User’s Guide
To disable nodes, clear the Enabled check box.
Channel
Select the channel number on which this node resides. If thechannel isn’t configured yet, it is designated Unassigned in thelist. Configure the channel in the Channels editor.
Station
For TCP/IP networks, type the IP address.
For programmable controllers on other network types, type thephysical station address of the programmable controller on thecommunication channel. The address depends on the channel thisnode is attached to, and the type of network it is.
Refer to your programmable controller’s documentation fordetails about addressing syntax, or see the help file or manual forthe installed drivers. For information about station addressingsyntax for nodes connecting to Allen-Bradley devices, seeAppendix C.
If RSLinx 2.0 or later is installed on your computer, click theBrowse button to open the RSWho dialog box, which displays allactive stations for the selected channel. (Expand the nodes in thetree to see the active devices.) When you select a station from theRSWho window, the Station and Type boxes are filled inautomatically. Verify the entry in the Type box.
The addresses assigned in RSWho are relative to the developmentcomputer RSWho is running on, not the runtime computer. Ifboth computers are not on the same physical network, you mayhave to update your node addresses at runtime.
For the SOFT5 driver, enter the UNC name of the SoftLogix 5controller without the backslashes. For example, if the UNCcomputer name is \\ORION, type ORION. The computer namemust be 8 characters or less.
For SoftLogix 5 controllers using the AB_ETH driver, enter thecontroller’s IP address.
Type
Select the type of programmable controller you are using.
For this device type Select
PLC-5/10, PLC-5/12, PLC-5/15, PLC-5/25 PLC-5
PLC-5/11, PLC-5/20�, PLC-5/20C,PLC-5/30, PLC-5/40�, PLC-5/40C,PLC-5/60, PLC-5/80�
PLC-5 (Enhanced)
Browse button
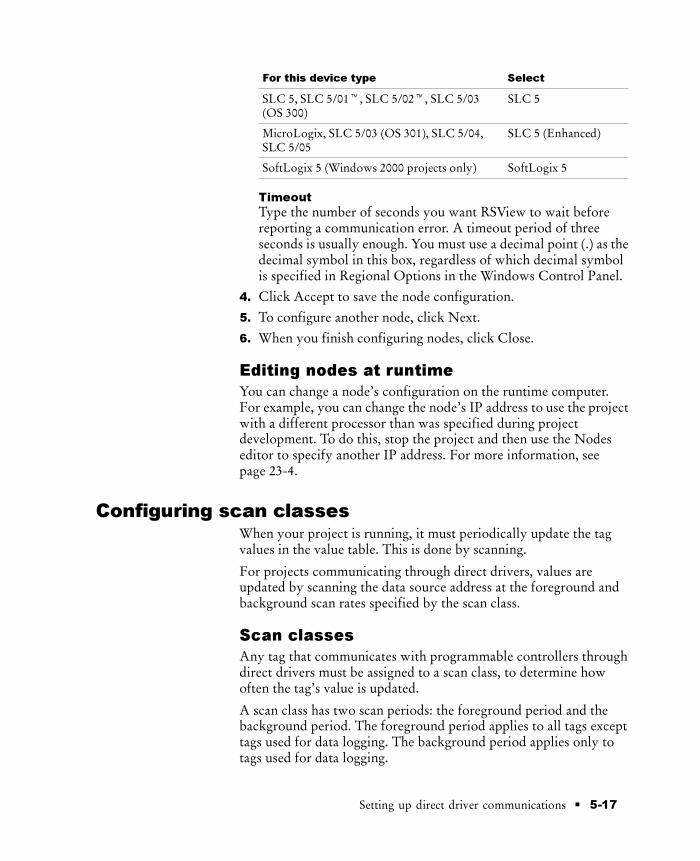
� 5-17Setting up direct driver communications
For this device type Select
SLC 5, SLC 5/01�, SLC 5/02�, SLC 5/03(OS 300)
SLC 5
MicroLogix, SLC 5/03 (OS 301), SLC 5/04,SLC 5/05
SLC 5 (Enhanced)
SoftLogix 5 (Windows 2000 projects only) SoftLogix 5
Timeout
Type the number of seconds you want RSView to wait beforereporting a communication error. A timeout period of threeseconds is usually enough. You must use a decimal point (.) as thedecimal symbol in this box, regardless of which decimal symbolis specified in Regional Options in the Windows Control Panel.
4. Click Accept to save the node configuration.
5. To configure another node, click Next.
6. When you finish configuring nodes, click Close.
Editing nodes at runtime
You can change a node’s configuration on the runtime computer.For example, you can change the node’s IP address to use the projectwith a different processor than was specified during projectdevelopment. To do this, stop the project and then use the Nodeseditor to specify another IP address. For more information, seepage 23-4.
Configuring scan classesWhen your project is running, it must periodically update the tagvalues in the value table. This is done by scanning.
For projects communicating through direct drivers, values areupdated by scanning the data source address at the foreground andbackground scan rates specified by the scan class.
Scan classes
Any tag that communicates with programmable controllers throughdirect drivers must be assigned to a scan class, to determine howoften the tag’s value is updated.
A scan class has two scan periods: the foreground period and thebackground period. The foreground period applies to all tags excepttags used for data logging. The background period applies only totags used for data logging.

Preface
5-18 � RSView Machine Edition User’s Guide
Guidelines for configuring scan classes
A scan period of zero means scan as quickly as possible.However, using zero is not recommended because this setting canresult in so much traffic that overall system communicationslows down.
RSView also scans as quickly as possible if scan rates areconfigured to be faster than it can handle. For example, if youconfigure 1,000 tags at 0.1 seconds, no errors are generated andthe tags are scanned as quickly as possible. There is no guaranteethat the specified scan rate will be met.
Set the scan period to match the expected rate of change for thetag’s data. For example, if you scan every five seconds for achange of state that occurs once an hour, the system is needlesslyburdened. Conversely, if you scan too slowly, the system cannotmonitor value changes that might occur between scans.

� 5-19Setting up direct driver communications
To configure a scan class:
1. Open the Scan Classes editor.
2. Select a scan class and type a foreground and background periodin seconds.
Assign a background period only if the scan class will be assignedto tags used for data logging.
You can use fractional seconds. For example, if you type .6 theaddress is scanned every six tenths of a second.
3. To save the configuration for a scan class without closing theeditor, select another scan class.
4. When you finish configuring scan classes, click OK.
Monitoring communicationsUse any or all of these methods to monitor direct drivercommunications:
Activity logging—In the Activity Log Setup editor, ensure thatthe errors, warnings, and information settings are enabled and areset up to log to the Activity list or printer. At runtime, messagesabout communications are sent to the specified destination.
For more information about activity logging, see Chapter 15.
Communication status—If communication status is on, whencommunication errors occur, a communication error banneropens to inform the operator about the error. By default,communication status is turned on.

Preface
5-20 � RSView Machine Edition User’s Guide
For more information about the communication error banner,see page 24-15.
To check the communication status setting, open the Startupeditor. Communication status is on when the Communicationstatus check box is checked.
For more information about the Startup editor, see Chapter 20.
System tags—System tags are preconfigured tags created byRSView. The system\Com tags provide information aboutcommunication status. You can display these tags as needed inyour project’s graphic displays.
For a complete list of system tags, see Appendix A.

� 6-1Setting up OPC communications
Setting up OPCcommunications
This chapter describes:
when to use OPC communications
steps for setting up OPC communications
creating OPC nodes
scanning for new tag values
monitoring communications
When to use OPC communications
OPC (OLE for Process Control) connections allow you tocommunicate with a wide range of local and remote devices throughvendor-specific OPC servers and devices, with RSView ME Stationas the OPC client.
RSView supports the OPC 2.0 specification.
If you will be connecting to communication devices using directdrivers, see Chapter 5.
OPC for Windows 2000 projects
If your project will run in Windows 2000, the OPC server can belocal or remote.
You can use these types of OPC servers with Windows 2000projects:
communication devices, using RSLinx as an OPC server
third-party communication devices, using vendor-specific OPCservers (such as Siemens or Modicon�)
a third-party application with OPC server support, either on thesame computer or on a network
6Chapter

Preface
6-2 � RSView Machine Edition User’s Guide
For example, you can communicate with a DeviceNet device usingRSLinx as an OPC server. Configure RSLinx to communicate withthe device, and set up an OPC node in RSView to communicate withRSLinx.
OPC for RAC6182 projects
If your project will run on a RAC6182, the project can communicatewith:
third-party applications with OPC server support
the built-in RSLinx OPC server that supports ControlLogix
third-party communication devices, using vendor-specific OPCservers
The OPC server must be local (that is, on the RAC6182), in theform of a .dll file.
Setting up the OPC server
If RSLinx is the OPC server, you must configure the OPC node onthe development computer, specifying the IP address of thecontroller that will be used at runtime. When you create the node,the development computer must be online with the controller (thatis, have live communications via RSLinx to the controller that willbe used at runtime).
Example: Configuring an OPC node
The following example shows how to create a node to connect to alocal OPC server using RSLinx.
Server Name: RSLinx OPC Server. Because the server is RSLinx,you don’t need to specify a vendor or versionnumber.

� 6-3Setting up OPC communications
This is how the node looks in the Nodes editor:
Columns that
do not apply to
OPC nodes
are left blank.
Once you have created the node, assign it to a tag in the TagDatabase editor. The address tells RSView where to get the data.
Address: TransportBlower.StatusThe ControlLogix controller called Filterstationhas been previously set up as an OPC topic inRSLinx; TransportBlower.Status is the address inthe controller.
This is how the tag looks in the Tag Database editor:

Preface
6-4 � RSView Machine Edition User’s Guide
Example: Configuring an OPC node to connect with aControlLogix processor
This example shows how to create an OPC node in RSView Studioto connect to a ControlLogix processor.
The development computer must be connected to the same networkas the ControlLogix processor.
Adding an Ethernet communication driver and topic
Use RSLinx to configure the Ethernet driver AB_ETH-1:
1. In RSLinx, on the Communications menu, click ConfigureDrivers.
2. In the Available Driver Types box, select Ethernet devices, andthen click Add New.
3. In the Add New RSLinx Driver dialog box, click OK to acceptthe name AB_ETH-1.
If this driver has already been used, RSLinx assigns the nextavailable number, for example, AB_ETH-2.

� 6-5Setting up OPC communications
4. In the Host Name column, type the IP address of the1756-ENET module connected to the ControlLogix processor,and then click OK.
5. Click Close.
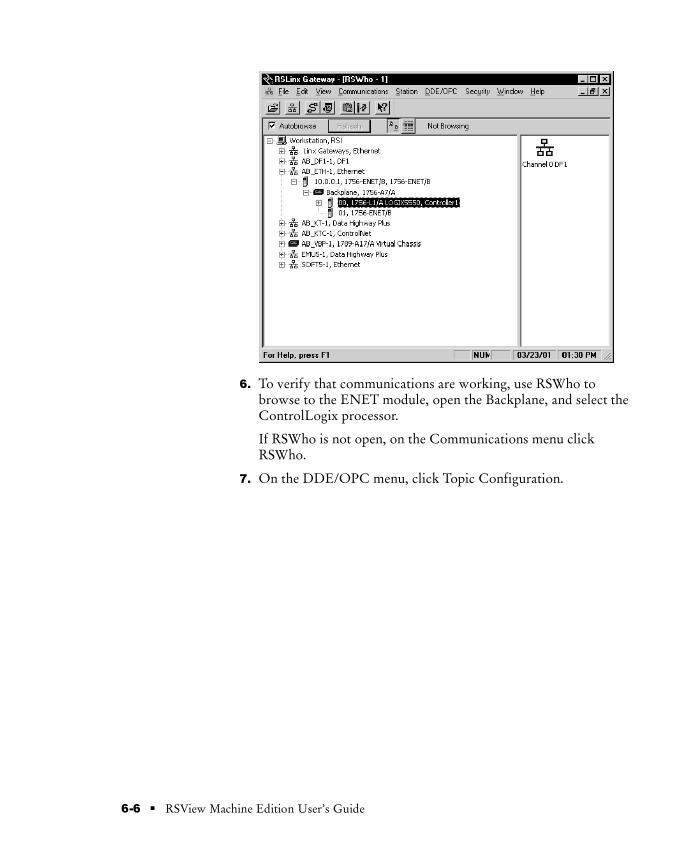
Preface
6-6 � RSView Machine Edition User’s Guide
6. To verify that communications are working, use RSWho tobrowse to the ENET module, open the Backplane, and select theControlLogix processor.
If RSWho is not open, on the Communications menu clickRSWho.
7. On the DDE/OPC menu, click Topic Configuration.

� 6-7Setting up OPC communications
8. Click the ControlLogix processor in the tree in the right pane,and then click New.
9. In the Topic List, type the topic name CLGX5550.
10. Click the Data Collection tab.
11. Make sure the Polled Messages check box is selected, clear theUnsolicited Messages check box, and then click Done.
12. In the confirmation dialog box, click Yes.

Preface
6-8 � RSView Machine Edition User’s Guide
Creating a node in RSView Studio
Use the Nodes editor to set up an OPC node to connect to theControlLogix processor:
1. In the Nodes editor, in the Name box type Clgx.
2. Click the Browse button next to the Server Name box, and thenselect RSLinx OPC Server.
3. Click Close.
Creating a tag
Use the Tag Database editor to create a tag to connect to the topic inthe ControlLogix processor:
1. In the Tag Database editor, create an analog tag named ClgxTag1.
2. Click the Browse button next to the Node Name box, and thenselect the Clgx node.
3. Click the Browse button next to the Address box.
Browse button

� 6-9Setting up OPC communications
4. In the OPC Address Browser box, browse to the item to connectthe tag to, click the item to select it, and then click OK.
If desired, you could create additional tags to connect with otheritems in the ControlLogix processor.
Summary of steps
The instructions below summarize the steps for setting up RSViewas an OPC client.
1. Start RSView Studio and create or open a project.
2. In the Nodes editor, create nodes for each OPC server or topicyou wish to communicate with. Select the OPC Server datasource.
3. In the Tag Database editor, create tags. For each tag, select Deviceas the data source and assign the OPC nodes that you havecreated.
For details, see Chapter 7.

Preface
6-10 � RSView Machine Edition User’s Guide
Creating OPC nodes
An OPC node allows you to assign a name, server name, and updaterate to each OPC server you want to communicate with. The OPCnode name can then be used throughout RSView.
For general information about using the Nodes editor, see page 5-13.
To create an OPC node:
1. Open the Nodes editor.
2. If the editor already contains node definitions, click the last(blank) row in the spreadsheet, or click Next to scroll to a blankrow.
3. Fill in this information for each node:
Data Source
Select OPC Server.
The Tag Database editor does not check addressing syntax forprogrammable controllers that communicate through an OPCserver. If the syntax is invalid, an error is generated at runtime.
For details about the Direct Driver data source, see Chapter 5.
Name
Type a name up to 40 characters long to represent the OPC node.When you create an OPC tag, you must assign a node to the tag,and this name identifies the node.

� 6-11Setting up OPC communications
The name can have upper and lower case letters, numbers,dashes, and underscores. Spaces are not permitted.
Enabled
Normally nodes are enabled, allowing data collection. However,during setup or troubleshooting you might want to disable anode to prevent communication timeouts or invalid data. When anode is disabled, tag values can still be read and written, but thevalues are read from and written to the value table instead of thedevice.
To disable nodes, clear the Enabled check box.
Server Name
Do one of the following:
Click the Browse button beside the Server Name box andselect a server from the list of registered servers. The listdisplays servers on the development computer.
Type the name of the OPC server that your project willcommunicate with, in this format:
<Vendor>.<DriverName>.<Version>
If the OPC server is RSLinx, you don’t need to specify aversion number or vendor name.
You can type the name of an OPC server that has not beeninstalled yet and install the server later.
If you type the name of a remote computer and then click theBrowse button, the list displays the OPC servers on theremote computer.
Browse button

Preface
6-12 � RSView Machine Edition User’s Guide
For RAC6182 projects, the server must be on the RAC6182 (youcannot use the RSLinx Remote OPC server).
Remote Computer Name or Address (Windows 2000
projects only)
If the OPC server is remote, check this box, and then do one ofthe following:
Click the Browse button and select a server computer fromthe list.
Type the server computer’s name or address.
You can use these formats to specify the name or address:
Use this syntax For this
format
Example
\\ComputerName UNC(UniversalNamingConvention)
\\Line1
ComputerName.Domain.com
DNS (DomainName System)
Comp.NET2.COM
XXX.XXX.XXX.XXX TCP/IPaddress
134.87.167.148
You set up the computer’s name or address in the WindowsControl Panel. For more information, see your Windowsdocumentation.
Browse button

� 6-13Setting up OPC communications
Access Path
If your project will run on the RAC6182, do not specify anaccess path.
For Windows 2000 projects, the access path is maintained forcompatibility with older projects. If you are defining a new node,do not specify an access path.
If you specify an access path for the node, the OPC AddressBrowser in the Tag Database editor is not available.
Update Rate
Specify the fastest rate at which the OPC server sends data to theOPC client. The default is every 1 second.
To specify that the server use the fastest possible rate, type 0.
If the OPC server is RSLinx, the update rate should not be fasterthan the topic poll rate.
4. Click Accept to save the node configuration.
5. To configure another node, click Next.
6. When you finish configuring nodes, click Close.
Editing nodes at runtime
You can change a node’s configuration on the runtime computer.For example, you can change the node’s IP address to use the projectwith a different processor than was specified during projectdevelopment. To do this, stop the project and then use the Nodeseditor to specify another IP address. For more information, seepage 23-4.
For projects running on the RAC6182 and using the RSLinx OPCServer, the only setting you can change at runtime is the node’supdate rate.
Scanning for new tag valuesWhen your project is running, it must periodically update the tagvalues in the value table. This is done by scanning.
For projects using OPC, values are updated by the OPC server atthe rate specified in the server product. The update rate you specifyin the Nodes editor is the requested data rate. The server uses thisrate to determine the fastest rate at which to notify your project (theOPC client) of tag value changes, if there are any changes. For moredetails about setting the poll rate, see your server documentation.

Preface
6-14 � RSView Machine Edition User’s Guide
Scan class rates have no effect on OPC communications. They affectonly direct driver communications.
Monitoring communications
Use any or all of the following methods to monitor OPCcommunications:
Activity logging—In the Activity Log Setup editor, ensure thatthe errors, warnings, and information settings are enabled and areset up to log to the Activity list or printer. At runtime, messagesabout communications are sent to the specified destination.
For more information about activity logging, see Chapter 15.
Communication status—If communication status is on, whencommunication errors occur, a communication error banneropens to inform the operator about the error. By default,communication status is turned on.
For more information about the communication error banner,see page 24-15.
To check the communication status setting, open the Startupeditor. Communication status is on when the Communicationstatus check box is checked.
For more information about the Startup editor, see Chapter 20.
System tags—System tags are preconfigured tags created byRSView. The system\com*OPC tags provide information aboutOPC communication status. You can display these tags as neededin your project’s graphic displays.
For a complete list of system tags, see Appendix A.

� 7-1Creating tags
Creating tags
This chapter describes:
tags and the tag database
tag types and data sources
organizing tags
using the Tag Database editor
searching for tags
using folders to group tags
viewing, creating, editing, duplicating, and deleting tags
configuring analog, digital, string, and block tags
other methods for creating tags
importing tags
using tags and expressions in your project
logging tag values
using macros to assign values to tags
Tags and the tag database
In the tag database, you define the data you want RSView tomonitor. Each entry in the database is called a tag. Set up tagscorresponding to the addresses at the data source that will store thevalues you want to monitor when your project is running.
The current value of a tag, when required, is updated from the deviceit is connected to and stored in computer memory—referred to asthe value table—so it is immediately accessible to all parts ofRSView. For example, graphic displays use tag values to controlanimation or update a trend, and data logging stores tag values tocreate a historical record.
7Chapter

Preface
7-2 � RSView Machine Edition User’s Guide
The data source
The data source can be memory or a device such as a programmablecontroller or an OPC server. RSView writes values to and readsvalues from the data source. The data source is configured toexchange information (in the form of numeric or string values)between the RSView value table and the physical machine that yourproject is controlling.
Tag types
You can use these types of tags in RSView:
This tag
type
Stores this type of data
Analog Range of values.
Use analog tags to represent variable states such astemperature or the position of rotary controls.
Digital 0 or 1.
Use digital tags to represent devices that can only be on oroff, such as switches, contacts, and relays.
String ASCII string, series of characters, or whole words(maximum of 82 characters).
Use string tags to represent devices that use text, such as abar code scanner that uses an alphanumeric product code.
Block A contiguous bit string of up to 1024 bits. Each bit has avalue of either 0 or 1.
Block tags allow RSView to process and read an array ofvalues associated with a single tag reference.
You can assign block tags to alarm triggers only. Using blocktags, alarm triggers can monitor multiple active alarmconditions.
Block tags are read only. Block tags are not supported onOPC nodes.
System Information generated while the system is running, such ascommunication status, system time and date, and so on.
RSView creates system tags when you create a project, andwhen you create channels or OPC nodes. The system tagsare stored in the folder called “system” in the tag database.You cannot edit system tags. You can use system tagsanywhere you would use any other type of tag. For a list ofsystem tags, see Appendix A.

� 7-3Creating tags
Analog tags that use floating point values
You can assign analog tags to most of the controls in RSView. If theanalog tag uses the floating point data type but an integer value isrequired, the floating point value is rounded.
For information about the data types available for analog tags, seepage 7-16.
How values are rounded
When a floating point value must be rounded to an integer, this ishow the value is rounded:
If the number after the decimal is 4 or less, the value is roundeddown. For example, 8.495 is rounded to 8.
If the number after the decimal is 6 or more, the value is roundedup. For example, 8.6 is rounded to 9.
If the number after the decimal is 5, the value is rounded using a“banker’s algorithm,” to average out the rounding over time:
If the number before the decimal is 0, the value is roundeddown. For example, 10.5 is rounded to 10.
If the number before the decimal is an odd number, the valueis rounded up. For example, 11.5 is rounded to 12.
If the number before the decimal is an even number, the valueis rounded down. For example, 12.5 is rounded to 12.
Floating point values are rounded to a maximum of seven digits.Therefore, using a floating point data type and adding to it avalue that exceeds the seven significant digits will result in arounding error. For example, adding any number to 9,999,999will result in a rounding error.
This rounding method is also used for Numeric Input Enablebuttons that use the Implicit decimal position, if an integer tag isassigned to the button’s Value control.
Data sources
When defining a tag, you must specify a data source. The data sourcedetermines whether the tag receives its values externally orinternally.

Preface
7-4 � RSView Machine Edition User’s Guide
Device
A tag with Device as its data source receives its data from a sourceexternal to RSView. The data can come from a direct driver(connected to a programmable controller) or from an OPC server.You can use up to 5,000 device tags.
Memory
A tag with Memory as its data source receives its data from (andstores values in) the RSView internal value table. Tags with Memoryas the data source do not count toward the total tag limit.
Organizing tags
Organizing tags makes database creation faster and simpler. Toorganize your tags, try these tips:
Establish naming conventions.
Naming conventions enable you to use wildcards mosteffectively when searching for and displaying tags duringdevelopment.
Use folders to group related tags.
Naming tags
Tag names can be up to 40 characters long. If you create a folder, thefolder name becomes part of the tag name.
The tag name can contain the following characters:
A to Z
0 to 9
underscore (_) and dash (-)
Tag names cannot contain spaces. The tag name can be mixed case.Tag names preserve upper and lower case for readability but are notcase sensitive. For example, the tag name MixerValve1 is the same asmixervalve1.
When a tag name starts with a number or contains a dash, enclosethe name in braces { } when you use it in an expression, for example,{N33-0}. For more information about using tags in expressions seeChapter 14.

� 7-5Creating tags
Using folders to group tags
To organize tags, create a folder to store tags that are related to oneanother. To separate the folder name from the rest of the tag name,use a backslash (\). For example, tags in the folder called Pumpwould start with Pump\.
For greater organization, you can nest folders. For example, you canorganize the tag database first by area, then by machines in the area,and finally by devices in each machine. The result might beArea1\Machine1\Pump.
To create similar groups of tags quickly, create one folder with itstags and then duplicate the folder.
Using the Tag Database editor
To open the Tag Database editor:
� Double-click the Tag Database icon.
The Tag Database editor has these parts: form, query box, folderhierarchy, and spreadsheet.
Form area
Query box
Folder hierarchy
Spreadsheet area

Preface
7-6 � RSView Machine Edition User’s Guide
The information you enter in the form area is displayed in thespreadsheet area.
Using the View menu
Use the items on the View menu to control the appearance of theTag Database editor.
To do this On the View menu, click this
Show or hide the spreadsheet area Spreadsheet
Show or hide the form area Form
Change the font used in thespreadsheet area
Spreadsheet Font. In the Fontdialog box, specify the font, style,and size to use.
Restore the default font Restore Default Settings
Update the contents of the editor(for example, when you’ve createdtags in other editors). For details,see page 7-7.
Refresh
View information about the tagdatabase. For details, see page 7-7.
Tag Statistics
Using the Accept and Discard buttons
When you enter information, the Prev and Next buttons change toAccept and Discard buttons. Click Accept to save tag information.Click Discard to cancel changes to a tag.
Using the tools
The Tag Database editor has these tools for working in the editor:
Use this tool To do this
Delete Delete the selected tag. For details,see page 7-14.
Duplicate Create a duplicate of the selectedtag, with all the same settings,except for the name. For details, seepage 7-13.
Insert Row Insert a new tag above the selectedrow. For details, see page 7-13.
Refresh Update the contents of the databasewith changes from other editors.For details, see page 7-7.
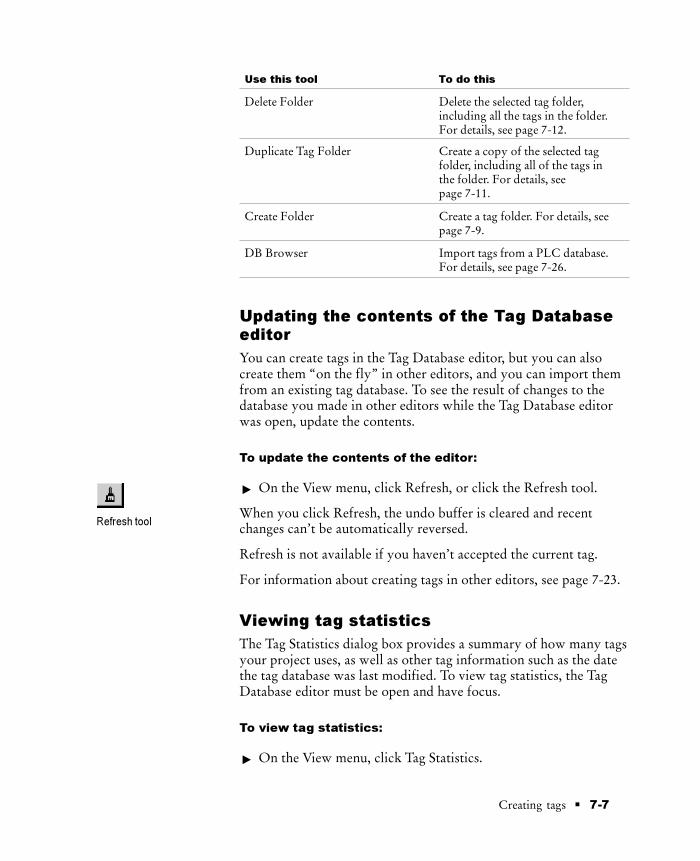
� 7-7Creating tags
Use this tool To do this
Delete Folder Delete the selected tag folder,including all the tags in the folder.For details, see page 7-12.
Duplicate Tag Folder Create a copy of the selected tagfolder, including all of the tags inthe folder. For details, seepage 7-11.
Create Folder Create a tag folder. For details, seepage 7-9.
DB Browser Import tags from a PLC database.For details, see page 7-26.
Updating the contents of the Tag Databaseeditor
You can create tags in the Tag Database editor, but you can alsocreate them “on the fly” in other editors, and you can import themfrom an existing tag database. To see the result of changes to thedatabase you made in other editors while the Tag Database editorwas open, update the contents.
To update the contents of the editor:
� On the View menu, click Refresh, or click the Refresh tool.
When you click Refresh, the undo buffer is cleared and recentchanges can’t be automatically reversed.
Refresh is not available if you haven’t accepted the current tag.
For information about creating tags in other editors, see page 7-23.
Viewing tag statistics
The Tag Statistics dialog box provides a summary of how many tagsyour project uses, as well as other tag information such as the datethe tag database was last modified. To view tag statistics, the TagDatabase editor must be open and have focus.
To view tag statistics:
� On the View menu, click Tag Statistics.
Refresh tool

Preface
7-8 � RSView Machine Edition User’s Guide
Searching for tagsUse the query box to select the tags you want to display in thespreadsheet. This allows you to edit tags in different folders withoutbrowsing the folder hierarchy. You can:
select a single tag by typing the tag name
select multiple tags by typing wildcards
These are the wildcards:
This character Does this
? Matches any single character.
* Matches any number of characters, including thebackslash (\) character.
Use this wildcard by itself to display all the tags in thetag database.
For example, to search for all the OPC tags in the system folder,open the folder and then type *opc in the Search For box. When youpress Enter, a list of tags ending with the letters “OPC” appears inthe spreadsheet.
When you do searches, remember that the backslash in a foldername counts as a character in the tag name.
Using foldersThe folder hierarchy and spreadsheet work together. The hierarchyshows the tag folders and the spreadsheet shows the tags within thefolders.

� 7-9Creating tags
Use the folder hierarchy to:create folders
open folders
add tags to folders
nest folders
duplicate folders
delete folders
A folder icon known as root is always present in the hierarchywindow, at the top of the folder hierarchy. This folder contains allthe tag folders you and RSView create. For example, the systemfolder holds the system tags that come with RSView. For a completelist of the system tags, display the contents of the folder or seeAppendix A.
You can nest folders. If a folder has a plus (+) sign, it contains one ormore folders. If a folder is blank, it does not contain any otherfolders.
This folder contains one or more folders.
This folder does not contain another folder.
Resizing the hierarchy box
To view a series of nested folders, resize the hierarchy box.
To resize the hierarchy box:
1. Place the cursor over the right border of the box until it changesto a double arrow.
2. Drag the border to the required size.
Creating folders
To create a folder:
1. On the Edit menu, click New Folder, or click the Create Foldertool.
Create Folder tool
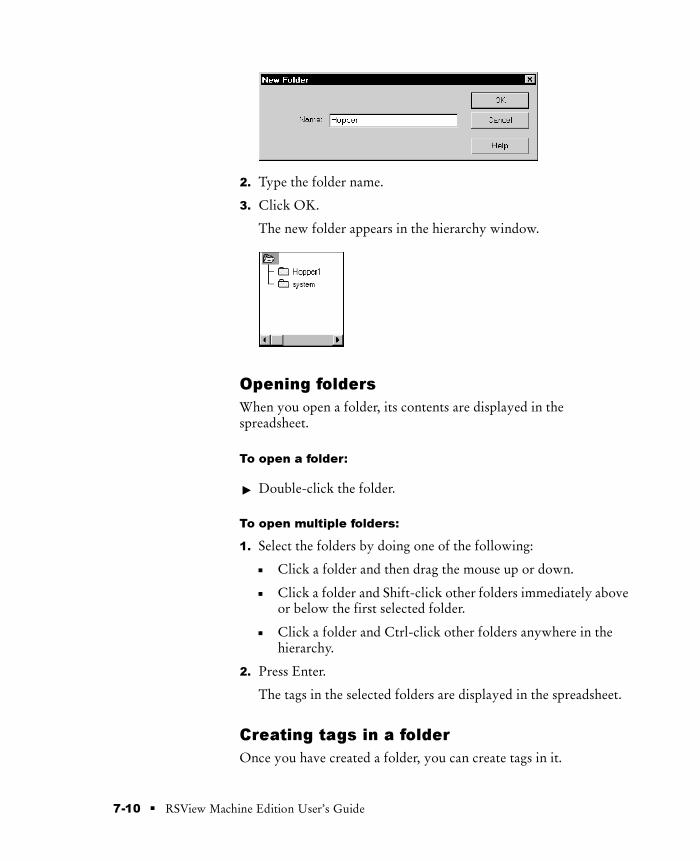
Preface
7-10 � RSView Machine Edition User’s Guide
2. Type the folder name.
3. Click OK.
The new folder appears in the hierarchy window.
Opening folders
When you open a folder, its contents are displayed in thespreadsheet.
To open a folder:
� Double-click the folder.
To open multiple folders:
1. Select the folders by doing one of the following:
Click a folder and then drag the mouse up or down.
Click a folder and Shift-click other folders immediately aboveor below the first selected folder.
Click a folder and Ctrl-click other folders anywhere in thehierarchy.
2. Press Enter.
The tags in the selected folders are displayed in the spreadsheet.
Creating tags in a folder
Once you have created a folder, you can create tags in it.

� 7-11Creating tags
To create a tag in a folder:
1. Double-click a folder in the folder hierarchy.
The folder name is displayed in the Name box of the form.
2. After the backslash (\), type the new tag name.
For information about configuring tags once you’ve created them,see page 7-14.
Nesting folders
Nesting folders means to create a folder inside another folder.
To create a folder inside another folder:
1. Select a folder in the folder hierarchy.
2. On the Edit menu, click New Folder, or click the Create Foldertool.
3. After the backslash (\), type the new folder name.
4. Click OK.
When you nest folders, remember that the backslash in a foldername counts as one character in the tag name.
Duplicating folders
When you duplicate a folder, all the tags in the folder are duplicatedand automatically given the new folder name. If the folder containsfolders, those folders are also duplicated.
Create Folder tool

Preface
7-12 � RSView Machine Edition User’s Guide
IMPORTANT Be sure to choose Duplicate Folder rather thanDuplicate. Duplicate only duplicates individual tags.
To duplicate a folder and its tags:
1. Select the folder in the hierarchy.
2. On the Edit menu, click Duplicate Folder, or click the DuplicateTag Folder tool.
3. In the To box, type the new folder name.
4. Click OK.
Deleting folders
To delete folders:
1. Select one or more folders in the hierarchy.
2. On the Edit menu, click Delete Folder, or click the Delete Foldertool.
Working with tagsUse the spreadsheet to:
view tags
create tags
edit tags
duplicate tags
delete tags
Use the query box or folder hierarchy to select the tags you want toview.
Moving through the spreadsheet
To scroll through the spreadsheet rows:
Use the Prev or Next buttons in the form area.
Duplicate Tag Folder
tool
Delete Folder tool

� 7-13Creating tags
Use the Up Arrow and Down Arrow keys.
Use the scroll bars on the spreadsheet.
To select a row, click anywhere in the row or click the row number.
Resizing columns and rows
To resize a column or row:
1. Place the cursor over the division between the column or row, inthe top or side border, until it changes to a double arrow.
2. Drag the column or row to the required size.
Creating tags
To create a tag inside a folder, first open the folder. For details, seepage 7-10.
To create a tag, use any of these methods:
Click New in the forms area.
Click the Insert Row tool.
On the Edit menu, click Insert Row.
Each method inserts a new row above the highlighted row, with theboxes in the form area ready to receive information about the newtag.
For information about configuring tags once you’ve created them,see page 7-14.
Duplicating tags
To duplicate a tag:
1. Select the tag to duplicate.
2. On the Edit menu, click Duplicate, or click the Duplicate Tagtool.
A new row is inserted below the highlighted row. The new rowcontains all the same information except the tag name.
3. In the form area, in the Name box, type the name for the newtag.
Insert Row tool
Duplicate Tag tool
Preface
7-14 � RSView Machine Edition User’s Guide
4. Click Accept.
Editing tags
You can edit all parts of a tag except the tag name and tag type.
To edit a tag:
1. Select the tag to edit.
The details of the tag appear in the form area.
2. Edit any details except the tag name or tag type.
Deleting tags
Delete tags carefully. Once you click the Delete button, the tag isdeleted. There is no confirmation message and you cannot undo thedeletion.
To delete a tag:
1. Select the tag you want to delete.
2. On the Edit menu, click Delete, or click the Delete tool, or pressthe Delete key on your keyboard.
Configuring tag types
The topics below describe how to complete the boxes in the Tagsection of the form. There are separate instructions for analog,digital, string, and block tag types.
For information on filling in the boxes in the Data Source section ofthe form, see page 7-20.
Configuring analog tags
To configure an analog tag:
1. Create the tag, as described on page 7-13.
2. In the Name box, type a tag name. If the tag is part of a folder,type the name after the backslash (\).
3. In the Type box, select Analog.
Delete tool

� 7-15Creating tags
4. Fill in the boxes as outlined below.
Numeric values that require a decimal must use the decimal point(.) as the decimal symbol, regardless of which decimal symbol isspecified in Regional Options in the Windows Control Panel.
Description
Type a description of the tag, up to 128 characters long.
Minimum and Maximum
Type the minimum and maximum values that can be written tothe programmable controller or server. These values do not affectwhat is read from the programmable controller or server. Forexample, if you specify a minimum of 0 and a maximum of 100,RSView would be able to read a value of 200 from a PLC andstore it in the value table, but would not be able to write thisvalue to the PLC.
The range between the minimum and maximum values cannotexceed the maximum floating point value (3.402823E38).
Scale and Offset
Type a number. For the scale, do not use 0. To disable the scale,type 1. To disable the offset, type 0.
The scale and offset modify the “raw data” that comes from theprogrammable controller before it is saved in the value table. Thescale and offset also modify the value specified in RSView beforeit is written to the programmable controller. The scale is amultiplication factor—the value from the PLC is multiplied bythe scale. The offset is a fixed value—after the value from thePLC is multiplied by the scale, the offset amount is added. Thefollowing formula shows the relationship between the PLC valueand the amount stored in the RSView value table.

Preface
7-16 � RSView Machine Edition User’s Guide
RSView value = (PLC value × scale) + offset
IMPORTANT Values from the programmable controller are firstscaled and then added to the offset. When a value iswritten to the programmable controller, the processis reversed: the offset is subtracted and the scale isused for division. This ensures that the correct,unchanged value is sent to the programmablecontroller.
Data Type
For tags with Device as the data source, select the data type thatmatches the format of the data stored in the programmablecontroller or Windows application. If you are using direct drivernodes, use the Default data type to automatically match the dataformat specified by the address.
For analog tags connecting to a ControlLogix processor, specifya data type that corresponds to the data type in the ControlLogixprocessor: Byte, Unsigned Integer, Integer, Long Integer, orFloating Point.
For tags with Memory as the data source, select the data type thatmatches the format of the data you will store in the tag.Choosing Default is the same as choosing Floating Point.
The data types are:
Data type Description Range
Default* Depends on the datasource and node type.
See below.
Unsigned Integer Unsigned 16-bit integer 0 to 65,535
* Do not use this data type with an OPC server, as doing so will produceunexpected results.

� 7-17Creating tags
Data type RangeDescription
Integer Signed 16-bit integer -32,768 to 32,767
Long Integer Signed 32-bit integer -2,147,483,648 to-2,147,483,647
Floating Point Single-precision (32-bit)floating point
-3.402823E+38 to-1.175494E-38,0,1.175494E-38 to3.402823E+38
Byte Unsigned 8-bit integer 0 to 255
3-Digit BCD* 3-digit binary-codeddecimal
0 to 999
4-Digit BCD* 4-digit binary-codeddecimal
0 to 9,999
* Do not use this data type with an OPC server, as doing so will produceunexpected results.
IMPORTANT For a tag with a Long Integer data type, if theminimum, maximum, scale, offset, or initial value isused with a decimal point, the value is storedinternally in floating point format. This means thatthe maximum value for the tag is 16,777,216, whichis the maximum integer value for single-precisionfloating point numbers.
For information on filling in the boxes in the Data Source section ofthe form, see page 7-20.5.
Configuring digital tags
To configure a digital tag:
1. Create the tag, as described on page 7-13.
2. In the Name box, type a tag name. If the tag is part of a folder,type the name after the backslash (\).
3. In the Type box, select Digital.

Preface
7-18 � RSView Machine Edition User’s Guide
4. In the Description box, type a description of the tag, up to 128characters long.
For information on filling in the boxes in the Data Source section ofthe form, see page 7-20.5.
Configuring string tags
To configure a string tag:
1. Create the tag, as described on page 7-13.
2. In the Name box, type a tag name. If the tag is part of a folder,type the name after the backslash (\).
3. In the Type box, select String.
4. Fill in the boxes as outlined below:
Description
Type a description of the tag, up to 128 characters long.
Length
Type a number between 1 and 82 to specify the length of thestring tag in characters. The length must be a multiple of the size
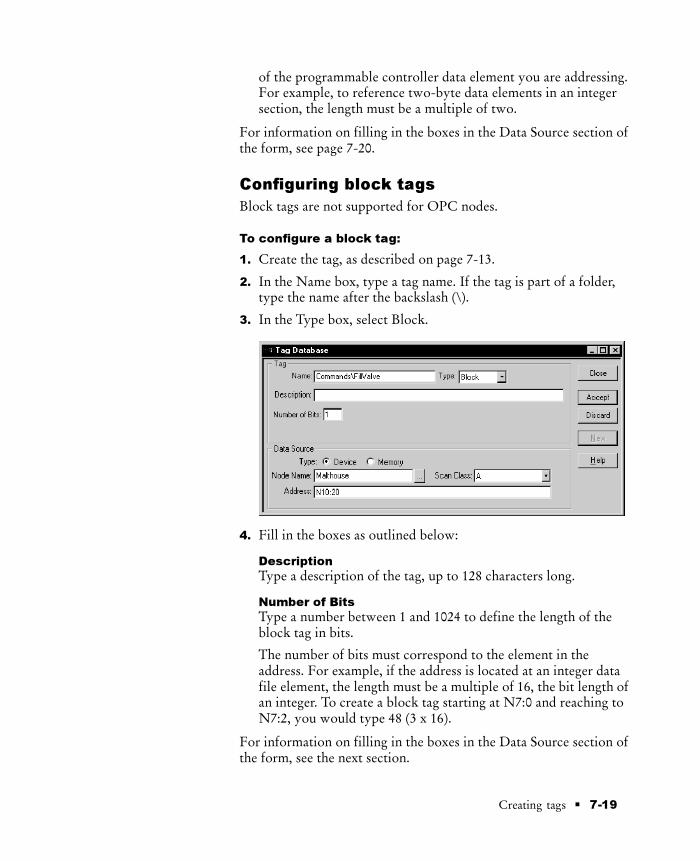
� 7-19Creating tags
of the programmable controller data element you are addressing.For example, to reference two-byte data elements in an integersection, the length must be a multiple of two.
For information on filling in the boxes in the Data Source section ofthe form, see page 7-20.5.
Configuring block tags
Block tags are not supported for OPC nodes.
To configure a block tag:
1. Create the tag, as described on page 7-13.
2. In the Name box, type a tag name. If the tag is part of a folder,type the name after the backslash (\).
3. In the Type box, select Block.
4. Fill in the boxes as outlined below:
Description
Type a description of the tag, up to 128 characters long.
Number of Bits
Type a number between 1 and 1024 to define the length of theblock tag in bits.
The number of bits must correspond to the element in theaddress. For example, if the address is located at an integer datafile element, the length must be a multiple of 16, the bit length ofan integer. To create a block tag starting at N7:0 and reaching toN7:2, you would type 48 (3 x 16).
For information on filling in the boxes in the Data Source section ofthe form, see the next section.5.

Preface
7-20 � RSView Machine Edition User’s Guide
Specifying a data source
The following topics describe how to fill in the boxes in the DataSource section of the form. For details about filling in the boxes inthe Tag section of the form, see page 7-14.
Specifying device as the data source
A tag with device as its data source receives its data from a sourceexternal to RSView. The data can come from:
programmable controllers through direct drivers
programmable controllers through an OPC server
another Windows program through an OPC server
To specify device as the data source:
1. Click Device.
2. In the Node Name box, do one of the following:
Type a node name.
Click the Browse button to open the Node Browser andselect a node name.
Click the Browse button to open the Node Browser and adda new node.
For information about adding a node for a direct driver, seepage 5-15. For information about adding a node for an OPCserver, see page 6-10.
3. If you are communicating through direct drivers, in the ScanClass box select a scan class.
For more information about scan classes, see page 5-17.
4. In the Address box, do one of the following:
To communicate through direct drivers to a programmablecontroller, specify the physical memory location in theprogrammable controller. The address syntax depends on thecontroller.
Browse button

� 7-21Creating tags
For information about addressing syntax, see thedocumentation that comes with your controller. Forinformation about addressing syntax for Allen-Bradleycontrollers, see Appendix B.
To connect to an OPC server, specify the address of the OPCitem in the OPC server. The item syntax depends on the OPCserver.
To open the OPC Address Browser and select the OPC item,click the Browse button beside the Address box. The browseris not available if you specify an access path for the OPCnode in the Nodes editor.
If the OPC node is for an OPC server on a remote computer,the OPC Address Browser displays the items of the OPCserver on the remote computer.
For more information about OPC see Chapter 6.
To specify memory as the data source:
1. Click Memory.
2. In the Initial Value box, type the tag’s starting value.
Each time you start the project, the value defined in the InitialValue box is assigned to the memory tag.
Browse button

Preface
7-22 � RSView Machine Edition User’s Guide
You can also use macros to assign initial values to tags when theproject starts or when a graphic display opens. For informationabout creating macros, see page 7-32.
Example: ControlLogix addressing
We recommend that you use the OPC Address Browser to selectOPC items. When you use the address browser the correct syntaxand data types are selected automatically.
However, if you want to define tags before setting upcommunications, you can type the address manually, as shown inthis example. If you type the address manually, be sure to select thedata type for the tag that matches the data type used by theControlLogix processor. Do not use the Default data type.
This example shows you how to specify the OPC topic, item name,and bit level of an item that uses the integer data type in aControlLogix processor.
OPC topic and item addressing
ControlLogix uses this addressing syntax:
[OPC topic name]item name
In this example, the RSLinx OPC topic name for the ControlLogixprocessor is CLGX. To connect to an OPC item called Motor, typethis address:
[CLGX]Motor
Bit level addressing
You can access the bit level of an item that uses the integer data typeby appending .# to the end of the tag address, where # is the numberof the bit to access.
For example, to access the first bit of the integer item Motor, typethis address:
[CLGX]Motor.0
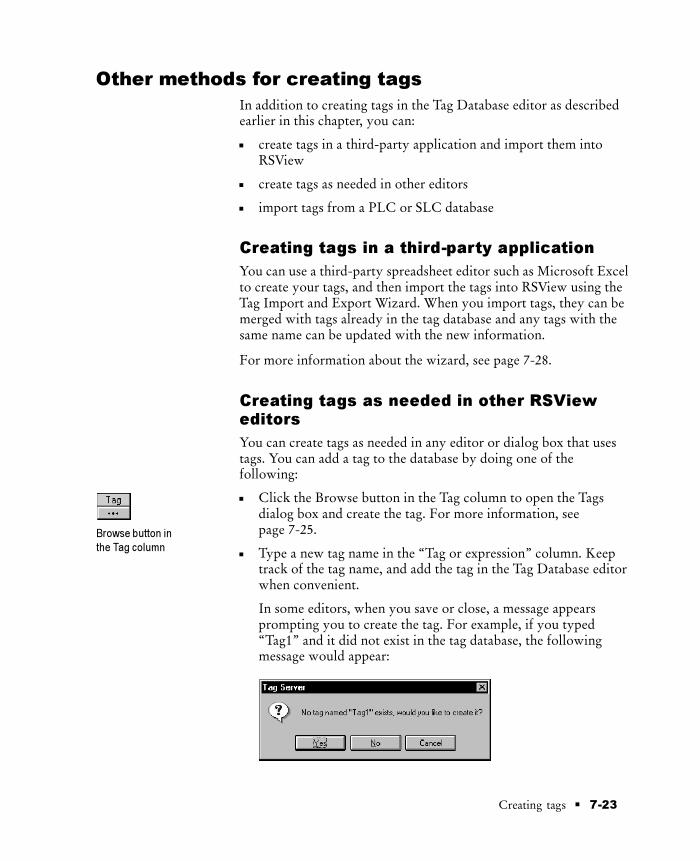
� 7-23Creating tags
Other methods for creating tags
In addition to creating tags in the Tag Database editor as describedearlier in this chapter, you can:
create tags in a third-party application and import them intoRSView
create tags as needed in other editors
import tags from a PLC or SLC database
Creating tags in a third-party application
You can use a third-party spreadsheet editor such as Microsoft Excelto create your tags, and then import the tags into RSView using theTag Import and Export Wizard. When you import tags, they can bemerged with tags already in the tag database and any tags with thesame name can be updated with the new information.
For more information about the wizard, see page 7-28.
Creating tags as needed in other RSVieweditors
You can create tags as needed in any editor or dialog box that usestags. You can add a tag to the database by doing one of thefollowing:
Click the Browse button in the Tag column to open the Tagsdialog box and create the tag. For more information, seepage 7-25.
Type a new tag name in the “Tag or expression” column. Keeptrack of the tag name, and add the tag in the Tag Database editorwhen convenient.
In some editors, when you save or close, a message appearsprompting you to create the tag. For example, if you typed“Tag1” and it did not exist in the tag database, the followingmessage would appear:
Browse button in
the Tag column

Preface
7-24 � RSView Machine Edition User’s Guide
Click Yes to create it now, or click No to create it later.
Creating tags as needed in the Data LogModels editor
In the Data Log Models editor, in the Tags in Model tab, you canadd a tag to the database by doing one of the following:
Click the Browse button beside the “Tags to add” box to openthe Tags dialog box and create the tag, as described in the nextsection.
Type a new tag name in the “Tags to add” box, and then clickAdd. You are warned that the tag does not exist. Click Yes to addthe tag to the list of tags in the datalog model. Keep track of thetag name, and add the tag in the Tag Database editor whenconvenient.
For more information about the Data Log Models editor, seeChapter 16.
Browse button in the
Data Log Models editor

� 7-25Creating tags
Using the Tags dialog box
When you click a Browse button in a dialog box or editor’s Tagcolumn, or in the Tags in Model tab of the Data Log Models editor,the Tags dialog box opens.
In the Tags dialog box, you can:
select a tag by double-clicking it, or by highlighting it and thenclicking OK
edit a tag by highlighting it and then clicking Edit Tag. The TagEditor dialog box opens so you can edit the tag’s definition
create a new tag by opening the desired folder and clicking NewTag. The Tag Editor dialog box opens so you can define the tag.
create a new folder by clicking New Folder. The New Folderdialog box opens so you can create the folder.
import tags from a PLC or SLC database by clicking Other DB.The PLC Database Browser opens so you can specify the tags toimport.

Preface
7-26 � RSView Machine Edition User’s Guide
Importing tags from a PLC database
To open the PLC Database Browser, do one of the following:
In the Tags dialog box, click the Other DB button.
In the Tag Database editor, on the Edit menu click OtherDatabases, or click the DB Browser tool.
Use the PLC Database Browser to selectively import tags from aPLC or other database into your project’s tag database. Tagsimported in this way are copied into the database—they are notshared with the source database. This means changes to tags in yourproject do not affect the database from which they have beenimported and vice versa.
You can import tags from any of these databases:
legacy PLC databases, created using WINtelligent LOGIC 5�or A.I.� 5, with file extension .dsc
RSLogix 5� or RSLogix 500�, saved as an external database,with file extension .ctd (before importing, explicitly export to the.ctd format to be sure of including the latest changes)
RSFrameworks databases, with file extension .fm?
For PLC and SLC addresses, the PLC Database Browser showsonly addresses that are used in the symbol or address list of the PLCprogramming software.
DB Browser tool
in the Tag
Database editor

� 7-27Creating tags
To import tags from a PLC database:
1. In the Node Name box, select a node.
2. If the node uses direct driver communications, in the Scan Classbox select a scan class.
3. In the PLC Database box, type the path to the database toimport tags from, or click Browse to locate and select thedatabase to import tags from.
The addresses and symbols from the selected database aredisplayed in the box below the Filter box.
4. To filter the tag list so that only certain addresses or symbols aredisplayed, in the Filter box type a character string, and then clickSearch.
To search on names only, click the Symbols button so that onlysymbol names are displayed. If an address does not have asymbol name it is not displayed.
Use filtering if the address or symbol list is too big to displayentirely. You cannot filter beyond a slash. For example, a filter ofB3/1 will not show B3/10, B3/11, and so on.
5. In the list box, click the symbols to import.

Preface
7-28 � RSView Machine Edition User’s Guide
6. In the Put Tags into Folder box, type a folder name if you wantthe tags to be in a folder. If the folder does not already exist inthe project’s tag database, it is created.
7. Click OK.
The selected symbols are added to the tag database for thecurrent project and displayed in the tag list. If you have alreadyimported a particular symbol, you are prompted to change itsname if you want to import it again.
Using the Tag Import and Export Wizard
You can also import PLC or SLC databases into RSView using theTag Import and Export Wizard.
You can use the wizard to:
import tags from legacy PLC databases, created usingWINtelligent LOGIC 5� or A.I.� 5, with file extension .dsc
import tags from RSLogix 5� or RSLogix 500�, saved as anexternal database, with file extension .ctd (before importing,explicitly export to the .ctd format to be sure of including thelatest changes)
export your project’s tags to a .csv file
import tags from another RSView project’s tag .csv file
merge tags from another RSView project (that is, import themdirectly from the project, without first creating a tag .csv file)
To start the wizard, do one of the following:
In RSView Studio, on the Tools menu click Tag Import andExport Wizard.
On the Windows Start menu, select Programs, RockwellSoftware, RSView Enterprise, Tools, and then click Tag Importand Export Wizard.
For details about using the wizard, see the wizard’s Help.
Using tags and expressions in your project
Once you’ve created tags, assign them to controls in your project toallow the project to interact with the data source and performactions based on the tag values.

� 7-29Creating tags
You can assign tags in these editors:
Global Connections
Graphics Display
Parameters
Alarm Setup
Information Setup
Data Log Model
Macros
This example shows the Trigger dialog box that opens when youclick the Add button in the Triggers tab of the Alarm Setup editor:
Type the tag name here... ... or click the Browse button
to open the Tags dialog box.
To specify a tag, do one of the following:
In the “Tag or expression” column, type the tag name.
In the Tag column, click the Browse button and then select a tagfrom the Tags dialog box.
Assigning tags to graphic objects
In the Graphics Display editor, you can assign tags to many of thegraphic objects you create.
Use one of these methods to assign tags to a graphic object:
Double-click the object to open the object’s Properties dialogbox, and then click the Connections tab.
Type the tag name here... ... or click the Browse button
to open the Tags dialog box.
Browse button in
the Tag column

Preface
7-30 � RSView Machine Edition User’s Guide
Select the object, and then assign tags in the Connections tab ofthe Property Panel.
Type the tag name here... ... or click the Browse button
to open the Tags dialog box.
Using expressions to manipulate tag values
Many of the controls to which you can assign a tag also permit theuse of expressions to perform logical or mathematical calculations ontag values. If you assign an expression, RSView monitors theexpression value rather than the original tag value. For example,your machine might send values to the data source in the form oftemperature in degrees Celsius. You could use an expression toconvert the value to degrees Fahrenheit, and then monitor theexpression result rather than the original tag value.
If you can assign an expression, a Browse button is present in theExprn column in the editor or Connections tab.
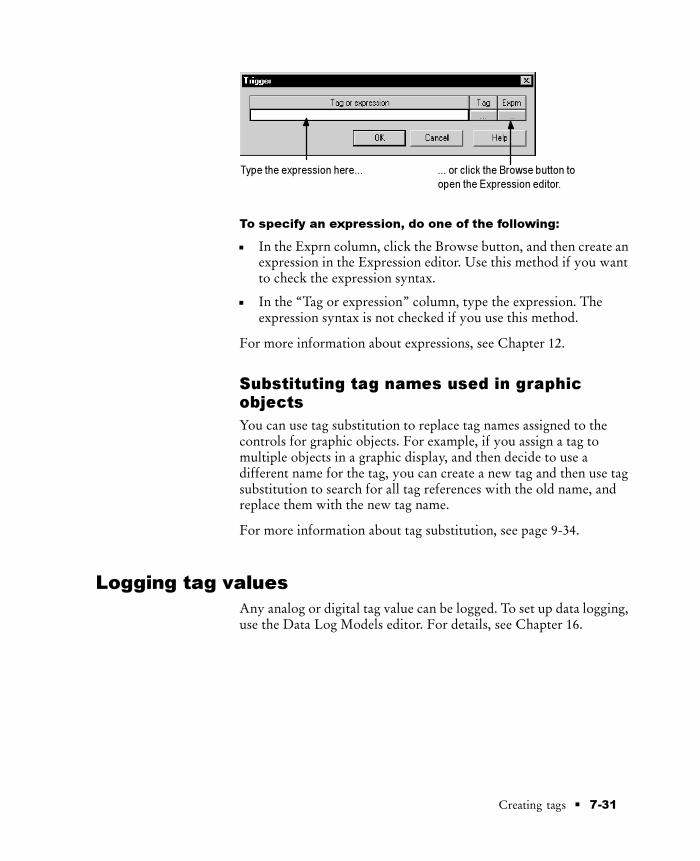
� 7-31Creating tags
Type the expression here... ... or click the Browse button to
open the Expression editor.
To specify an expression, do one of the following:
In the Exprn column, click the Browse button, and then create anexpression in the Expression editor. Use this method if you wantto check the expression syntax.
In the “Tag or expression” column, type the expression. Theexpression syntax is not checked if you use this method.
For more information about expressions, see Chapter 12.
Substituting tag names used in graphicobjects
You can use tag substitution to replace tag names assigned to thecontrols for graphic objects. For example, if you assign a tag tomultiple objects in a graphic display, and then decide to use adifferent name for the tag, you can create a new tag and then use tagsubstitution to search for all tag references with the old name, andreplace them with the new tag name.
For more information about tag substitution, see page 9-34.
Logging tag values
Any analog or digital tag value can be logged. To set up data logging,use the Data Log Models editor. For details, see Chapter 16.

Preface
7-32 � RSView Machine Edition User’s Guide
Using macros to assign values to tags
A macro is a list of tag assignments stored in a text file, in the format<tag>=<value>. Each assignment assigns a value to a tag. The valuecan be in the form of another tag, an expression, a numeric constant,or a string.
Examples: Using macros to set tag values
Tag1 = 8Sets the value of Tag1 to 8.
Tank1\Message = “Tank1 Overflow”Sets the string tag Tank1\Message to Tank1 Overflow.
Tag1 = Tag2Sets the value of Tag1 to be the same as Tag2.
Tag1 = Tag1 + 1Increases the value of Tag1 by 1.
Tag1 = If (Tag2 < Tag1) Then 4 Else 3Performs the if-then-else calculation and stores the result in Tag1.
� 7-33Creating tags
1Pump = {Industry-2} + {2Pump}Adds the values of Industry-2 and 2Pump and stores the result in1Pump.
Braces surround Industry-2 because of the dash in the name. Bracessurround 2Pump because the name starts with a number. No bracesare used for 1Pump because this name is on the left side of the equalsign.
For more information about expression syntax, see Chapter 12.
When to use macros
You can assign macros to run when:
the project starts or stops
a graphic display opens or closes
a user logs in or out
a specified tag or expression changes to a new non-zero value
At runtime, when the macro runs, the values are sent to the tags atthe data source.
IMPORTANT At runtime, the tag assignments are executedasynchronously. That is, the system does not wait forthe completion of one tag assignment before executingthe next. Therefore, do not rely on the order ofassignments to control your process.
Example: Using a Goto Display button to run a macro
This example shows you how to run a macro when the operatorpresses a Goto Display button. The macro resets a group ofproduction tags to 0.
1. Create a macro called Reset, with these tag assignments:
TotalProductionUnits=0LineDownTime=0TotalRejects=0
2. Create an On Top display containing the text “Production valueshave been reset.” Create a Close Display button in the display,with the caption “OK.” Call the display Reset Message.

Preface
7-34 � RSView Machine Edition User’s Guide
3. Create a Goto Display button with the caption “ResetProduction Data.” Assign the Reset Message display and theReset macro to the button.
At runtime when the operator presses the Reset Production Databutton, the display opens and the macro runs. When the operatorpresses OK the display closes.
Running macros when tags or expressionschange value
You can use global connections to run macros when tags orexpressions change value. This means you can use the data source totrigger the macro to run.
RSView allows you to create up to five macros for use with globalconnections. The macros must be named Macro1, Macro2, Macro3,Macro4, and Macro5 in order to work with global connections.
For more information about global connections, see Chapter 19.
Example: Using macros to reset tag values
This example shows you how to run a macro whenever the operatorneeds to reset production information tags to known values.
The macro writes the desired values to the tags whenever theoperator presses a Momentary Push button.
1. Create a memory tag called ResetProdData.
2. Create a Momentary Push button with the caption “ResetProduction Data.” Assign the ResetProdData tag to the Valuecontrol.
3. Create a macro called Macro1, with these tag assignments:
TotalProductionUnits=0LineDownTime=0TotalRejects=0
4. In the Global Connections editor, assign the ResetProdData tagto the Remote Macro1 control.

� 7-35Creating tags
When the operator presses the Reset Production Data button, thevalue of the ResetProdData tag changes from 0 to 1. This tellsRSView to run Macro1, which writes the specified values to the tagsin the macro.
Creating macros
To create a macro:
1. Open the Macros editor.
2. In the Tag column, type the name of the tag to assign a value to,or click the Browse button to open the Tags dialog box and selecta tag.
3. In the Expression column, type a tag name, expression, ornumeric value, or click the Browse button to open theExpression editor and create an expression.
Create the expression in the Expression editor if you want tocheck the expression syntax.
4. Repeat steps 2 and 3 to assign values to other tags.
5. On the File menu click Save, or click the Save tool.
6. In the Component name box, type a name for the macro, andthen click OK.
7. Click Close.
Browse button in
the Tag column
Save tool

Preface
7-36 � RSView Machine Edition User’s Guide
What to do next
Once you’ve created the macros you want to use, assign the macrosin these editors:
In this editor Do this
Startup Assign project startup and shutdown macros. SeeChapter 20.
GraphicsDisplay
Assign macros to run when displays open or close,using the Display Settings dialog box. See Chapter 8.
User Accounts Assign macros to run when users log in and log out.See Chapter 18.
GlobalConnections
Specify the tags or expressions that will start themacros named Macro1 to Macro5. See Chapter 19.

� 8-1Creating graphic displays
Creating graphicdisplays
This chapter describes the editors in the Graphics folder and outlineshow to:
create and open graphic displays
use the Graphics Display editor
test your displays as you work
specify display settings
create a background for your displays
use graphic libraries
import graphic images
create parameters to use the same display with different tags
create local messages in your displays
print graphic displays at runtime
IMPORTANT Before creating graphic displays, specify projectsettings. Project settings determine important aspects ofyour graphic displays such as display size and position.For more information, see page 4-7.
About graphic displays and graphic objects
A graphic display represents the operator’s view of plant activity.The display can show system or process data and provide operatorswith a way to write values to an external data source. The datasource can be memory or a device such as a programmable controlleror an OPC server.
Operators can print the display at runtime to create a visual recordof tag values, object states, or current messages.
8Chapter

Preface
8-2 � RSView Machine Edition User’s Guide
The elements that make up a graphic display are called graphicobjects. You can create objects in the Graphics Display editor, orcopy them from a graphic library or from another project.
For information about creating and copying graphic objects, seeChapter 9.
Before you begin
Before you begin, plan your displays. Think about what informationthe operator needs to see, and the best way to provide theinformation. For example:
Does the operator need to know the exact speed of a conveyorbelt, or just whether the belt is moving, jammed, or stopped?
Do different users need to have access to different types ofinformation?
Do you want to limit access to certain types of information?
Also consider the runtime environment and how the operator willuse the project:
Does the runtime computer have a touch screen, mouse,keyboard, or some combination of these?
How will the operator navigate through the displays of theproject?
Review the chapters on planning, security, and navigation beforeyou begin creating displays. Browse through the sample projects fordesign ideas. Map out a display hierarchy. Then create a graphicdisplay to use as a template.
The time you spend planning your displays will make your projecteasy to use and will save you time in the long run.
For information about See
Planning your displays and creating a template Chapter 3
Setting up project security to control access to displays Chapter 18
Setting up display navigation and creating a displayhierarchy
Chapter 19
Setting up how objects are used at runtime Chapter 10

� 8-3Creating graphic displays
Using the Graphics Display editor
The Graphics Display editor opens when you create or open agraphic display. Each display is stored in the Displays folder. Youcan open and work on multiple graphic displays at the same time.
Creating and opening graphic displays
To create a graphic display:
1. In the Graphics folder, do one of the following:
right-click Displays and then click New
click the New Display tool
drag and drop the Displays icon into the work area
2. On the Edit menu, click Display Settings to open the DisplaySettings dialog box and specify settings for the display.
For more information, see page 8-10.
3. Create the objects you want to put in the display.
For information about creating graphic objects, see Chapter 9.
4. On the File menu click Save, or click the Save tool.
5. In the Component name box, type a name for the display, andthen click OK.
The display is added to the list in the Displays folder.
The display is created as a Replace display by default, but youcan change it to an On Top display in the Display Settings dialogbox. For more information, see page 8-12.
To open a graphic display:
� In the Graphics folder, open the Displays folder and thendouble-click the display name, or right-click the display nameand then click Open.
You can also drag and drop the display from the Project Explorerto an empty area in the RSView Studio main window.
New Display tool
Save tool

Preface
8-4 � RSView Machine Edition User’s Guide
This example shows a graphic display from the Malthouse sampleproject, with the Project Explorer closed.
Graphics toolbar
Standard toolbar
Display area
Status bar
Objects toolbar
Property Panel
Object Explorer
Activity bar
The parts of the editor
This section provides an overview of the main parts of the GraphicsDisplay editor that you use to create your graphic displays.
Toolbars
The Graphics Display editor provides an array of toolbars inaddition to the Standard toolbar available in other editors. Thetoolbars contain tools for creating and configuring graphic objects.
The illustration shows the Graphics and Objects toolbars, whichyou’ll probably want to keep open at all times. There are othertoolbars that you can use when performing specific tasks such asassigning colors to objects. For more information, see page 8-6.
Display area
This area is your graphic display. The appearance of the display inthe Graphics Display editor is similar to what you see at runtime,except for the title bar and the display position. If you change thezoom settings, or resize a Replace display by dragging the borders,these changes do not affect the appearance of the runtime display.

� 8-5Creating graphic displays
If you want to use a title bar at runtime, set up the title bar in theProject Settings editor. Also use the Project Settings editor to specifythe display size (for Replace displays), position, and whether to use aborder at runtime. For more information, see page 4-7.
You can change the display type, color, and other settings in theDisplay Settings dialog box. For more information, see page 8-12.
Property Panel
The Property Panel displays the properties of the selected objects,and shows what values are assigned to the properties. For example, itshows whether an object’s background style (BackStyle) is solid ortransparent. It also lists the object’s controls, and shows which tagsor expressions have been assigned to them.
In addition to displaying information, you can use the PropertyPanel to modify the properties of graphic objects and assign tags andexpressions to the objects.
You can keep the Property Panel open as you work on differentobjects and in different displays. For more information, seepage 9-24.
Object Explorer
The Object Explorer lists all the objects and groups of objects inyour display (except objects that are converted to wallpaper). Youcan click an object in the list to select it in your display. You can alsoright-click the object to open the context menu for the object.
You can keep the Object Explorer open as you work on differentobjects and in different displays. For more information, seepage 9-20.
Status bar
The status bar describes the action to be performed by the selectedmenu item or tool. The status bar also displays the X and Ycoordinates, width, height, and name of the selected object.
Tools and tips for working in the Graphics Displayeditor
This section describes features of the Graphics Display editor thathelp you create your displays. It describes how to:
use context menus and toolbars to perform actions quicklyset up a grid that you can use to position and size objectsprecisely

Preface
8-6 � RSView Machine Edition User’s Guide
zoom in when you need to look at details closely
correct mistakes
test your displays as you work
Using context menus
No matter where you are in the Graphics Display editor, you canopen a menu by clicking the right mouse button. This is oftenquicker than moving the mouse up to the menus at the top of thescreen.
The items on the menu depend on the cursor’s location. Forexample, when you right-click an object, the menu contains the mostcommon actions you can perform on that object.
... a menu opens. It
contains menu items
for working with the
selected object.
When you
right-click an
object...
Using the toolbars
The toolbars provide another convenient way to perform an actionquickly. You can customize your work area by dragging the toolbarsto any location on the screen. You can also dock them to the insideedges of the RSView Studio main window.

� 8-7Creating graphic displays
Click the grab bars
and drag to undock a
docked toolbar.
Click the title bar and
drag to move a floating
(undocked) toolbar.
Click the Close button to
close the toolbar.
To display a toolbar:
� On the View menu, select Toolbars, and then click the toolbar todisplay.
The menu displays a check mark beside the toolbars that arealready open.
To undock a toolbar:
� Click the double “grab bars” at the left or top of the toolbar, andthen drag. Press the Ctrl key to prevent accidental redocking.
To move an undocked toolbar:
� Click the toolbar’s title bar, and then drag. Press the Ctrl key toprevent accidental redocking.
To dock a toolbar:
� Click the toolbar’s title bar, and then drag to any edge of thework area.
To close a toolbar:
� On the View menu, select Toolbars, and then click the toolbar toclose, or click the toolbar’s Close button.

Preface
8-8 � RSView Machine Edition User’s Guide
Using the grid
To size and position objects precisely, use the grid. You can changethe grid settings at any time during the drawing process.
The grid can be active or passive. When the grid is active, all theobjects you draw or position are pulled to the closest grid point.This makes it easy to align and size objects. When the grid is passive,it is visible but does not affect the position of your objects.
Make the grid passive to position an element between the grid lines.Make the grid active, and the next object you draw or place isautomatically aligned with the grid. Making the grid active does notaffect the placement of existing objects.
The grid is visible during project development only. It is not visibleat runtime.
To set up the grid:
1. On the View menu, click Grid Settings, or right-click an emptyarea of the display and then click Grid Settings.
Check this box to make
the grid visible.
Set the spacing of the grid
points in pixels.
Select a color for the
grid points.
Check this box to make
the grid active.
2. Specify the color and spacing of the grid points.
3. To turn on the grid, click Show Grid.
When the Grid Settings dialog box is not open you can turn thegrid on by clicking Show Grid on the View menu.
4. To make the grid active, click Snap To Grid.
When the Grid Settings dialog box is not open you can make thegrid active by clicking Snap On on the View menu.
5. Click OK.
To make the grid passive:
� In the Grid Settings dialog box, clear the Snap To Grid checkbox, or on the View menu deselect Snap On.
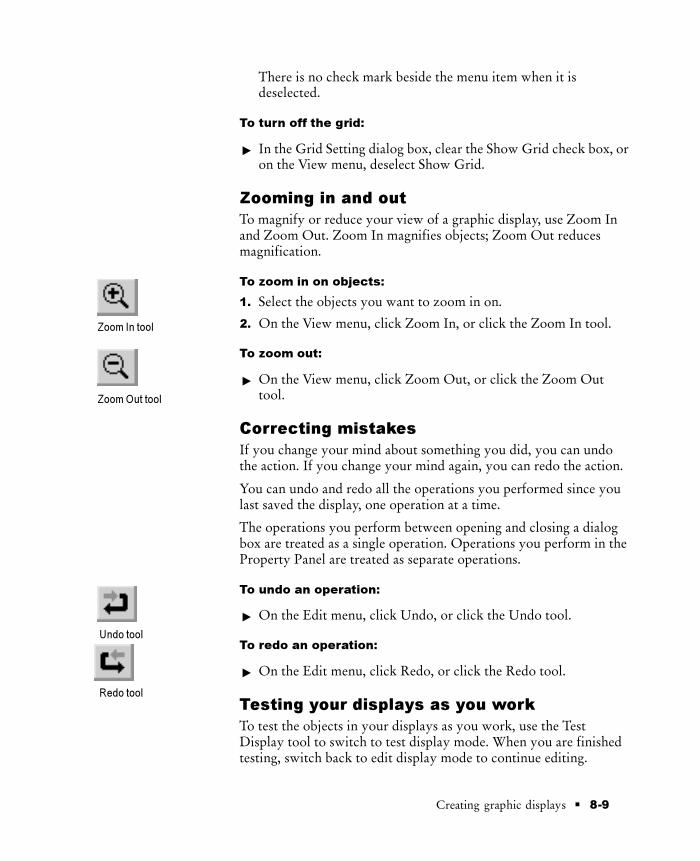
� 8-9Creating graphic displays
There is no check mark beside the menu item when it isdeselected.
To turn off the grid:
� In the Grid Setting dialog box, clear the Show Grid check box, oron the View menu, deselect Show Grid.
Zooming in and out
To magnify or reduce your view of a graphic display, use Zoom Inand Zoom Out. Zoom In magnifies objects; Zoom Out reducesmagnification.
To zoom in on objects:
1. Select the objects you want to zoom in on.
2. On the View menu, click Zoom In, or click the Zoom In tool.
To zoom out:
� On the View menu, click Zoom Out, or click the Zoom Outtool.
Correcting mistakes
If you change your mind about something you did, you can undothe action. If you change your mind again, you can redo the action.
You can undo and redo all the operations you performed since youlast saved the display, one operation at a time.
The operations you perform between opening and closing a dialogbox are treated as a single operation. Operations you perform in theProperty Panel are treated as separate operations.
To undo an operation:
� On the Edit menu, click Undo, or click the Undo tool.
To redo an operation:
� On the Edit menu, click Redo, or click the Redo tool.
Testing your displays as you work
To test the objects in your displays as you work, use the TestDisplay tool to switch to test display mode. When you are finishedtesting, switch back to edit display mode to continue editing.
Zoom In tool
Zoom Out tool
Redo tool
Undo tool

Preface
8-10 � RSView Machine Edition User’s Guide
IMPORTANT Test display mode is not the same as running thedisplay. It does not change the appearance or positionof the display as set up in the Display Settings dialogbox. Alarm and information messages are notdisplayed, although if communications are set up, tagvalues are read and written. Display navigation, datalogging, parameters, and macros do not work in thismode. If you want to test these features, test the projectas described on page 20-3.
Using the activity bar when in test display mode
The activity bar shows messages about system activities when youtest your graphic displays. You can specify the types of messages todisplay in the activity bar, move the bar, resize it, and clear themessages in it.
For information about using the activity bar, see page 2-4. Forinformation about specifying the types of activities to show in theactivity bar, see page 15-2.
To use test display mode:
� On the View menu, click Test Display, or click the Test Displaytool.
To return to edit display mode:
� On the View menu, click Edit Display, or click the Edit Displaytool.
Setting up graphic displays
To set up a graphic display, specify its type, background color, andruntime behavior in the Display Settings dialog box. You can specifyand edit the display settings at any time while you work on yourdisplay.
About display types
Replace
Replace is the default display type. Replace displays are full-sizeddisplays. They use the project window size specified in the ProjectSettings editor.
Edit Display tool
Test Display tool

� 8-11Creating graphic displays
For more information about the project window size, see page 4-8.
At runtime, you can have only one Replace display open at a time.When the operator opens a Replace display, this is what happens:
The Replace display that was open closes.
On Top displays that do not use the Cannot Be Replaced optionare closed.
The new Replace display opens.
On Top displays that use the Cannot Be Replaced option remainopen, on top of the new Replace display.
If the operator attempts to open a Replace display that is alreadyopen (for example, using a Goto Display button to which the samedisplay is assigned), the display does not close and RSView sends anerror message to the activity log.
On Top
Use this option to create “pop-up” displays that open on top of thecurrent Replace display. Usually, On Top displays are smaller thanReplace displays, so the operator doesn’t lose track of displaynavigation.
You can open multiple On Top displays. If more than one On Topdisplay is open, the display that has focus, or had the most recentfocus, appears on top.
Use the Cannot Be Replaced option if you want the On Top displayto remain open when a new Replace display is opened.
On Top displays do not have a Close button in the title bar. Be sureto create a Close button graphic object in On Top displays so theoperator can close them.
The operator cannot move an On Top display by dragging its titlebar. The runtime position of the display is fixed (according to theposition settings defined for the display).
Resizing displays
The project window size is used for all Replace displays. If youchange the project window size after you have designed any graphicdisplays, Replace displays are resized, but any objects in the displaysremain in the same position as before. On Top displays are notresized.

Preface
8-12 � RSView Machine Edition User’s Guide
For information about specifying the project window size, seepage 4-8.
Changing the display area while working
You can change the display area of a display while you’re workingon it by dragging the border of the display area. For example, youmight want to make the display area smaller so you can see parts oftwo displays in order to drag and drop objects between them.
Changing the display area in this manner does not change thedisplay size for Replace displays. For On Top displays that are sizedwith the “Use Current Size” option, dragging the border does resizethe display.
Another way to arrange multiple displays while working on them isto use the options on the Windows menu. For example, TileHorizontal arranges all the open displays with as much of the toppart of each display showing as possible.
Specifying display settings
To specify display settings:
1. On the Edit menu, click Display Settings, or right-click an emptyarea of the display and then click Display Settings.
Set up how the display looks.
Set up how the display works
at runtime.

� 8-13Creating graphic displays
2. In the General tab, specify these settings:
Display Type
Select the display type.
If you select On Top and you want the display to remain openwhen a new Replace display opens, select Cannot Be Replaced.
Display Number
For Replace displays, if you want the data source to open thedisplay remotely at runtime, specify a unique display number.Otherwise, accept the default number.
For information about remote display changes, see page 19-7.
Security Code
To restrict access to the display, select a security code. Atruntime, only users with access to the security code can open thedisplay.
For information about setting up security and user accounts, seeChapter 18.
Title Bar
This option is available only for On Top displays. To use a titlebar, check this box and then type the title in the box below.
Disable Initial Input Focus
Check this box if you don’t want the display to have input focuswhen it opens.
This option is useful for On Top displays, if you want theReplace display to retain the focus after the On Top displayopens.
The operator can still touch or click the On Top display to give itinput focus.
Size
For On Top displays, specify the display size. The operatorcannot resize the display at runtime.
Use Current Size—Select this option to size the display usingthe mouse.
Specify Size in Pixels—Select this option to specify the widthand height manually. Type the width and height (in pixels) inthe boxes.

Preface
8-14 � RSView Machine Edition User’s Guide
Position
For On Top displays, specify the display position relative to theupper left inside corner of the project window. (That is, insidethe window’s border and below the title bar, if these are selectedin the Project Settings editor.)
X—Type the number of pixels from the left of the projectwindow’s edge.
Y—Type the number of pixels from the top of the projectwindow’s edge.
IMPORTANT If the operator opens the display using a GotoDisplay button that uses the “Display positionenabled” option, the position specified by the buttonoverrides the position specified in the DisplaySettings dialog box.
Background Color
Click this box to select a different background color for thedisplay.
3. Click the Behavior tab, and then specify these settings:
Startup Macro
Click the Browse button to select a macro to run while thedisplay opens.
A macro assigns values to tags. For more information, seepage 7-32.
Browse button
� 8-15Creating graphic displays
Shutdown Macro
Click the Browse button to select a macro to run after the displaycloses.
Disable Highlight When Object has Focus
Check this box if you don’t want a highlight box to appeararound objects when they have the input focus. (When an objecthas input focus it is ready to accept keyboard input.)
The operator can still select and use input objects, but there is novisual indicator that the object is selected.
For more information about input focus, see page 10-8.
Highlight Color
Click this box to select a different highlight color for inputobjects.
Select a color that stands out from the display’s backgroundcolor or wallpaper objects. For information about wallpaperobjects, see the next section.
4. Click OK to save your changes and close the dialog box.
Creating a background for your displayYou can create a background for your graphic display by convertinggraphic objects to wallpaper. When objects are converted towallpaper, they are locked into position and become an unchangingbackground for the other objects in the display.
Converting objects that do not need to be animated or updated withtag values can significantly improve the runtime performance of agraphic display.
Objects that have been converted to wallpaper cannot be selected oredited until you unlock the wallpaper. Also, animations attached tothe wallpaper objects are not in effect. However, animations arerestored when you unlock the wallpaper.
Similarly, any tags or expressions assigned to an object becomeinactive when the object is converted to wallpaper. Connections arerestored if you unlock the wallpaper.
To manage a number of objects easily, group the objects, and thenconvert the group to wallpaper.
To convert objects to wallpaper:
1. Select the objects to convert.

Preface
8-16 � RSView Machine Edition User’s Guide
For information about selecting objects, see page 9-19.
2. On the Edit menu, select Wallpaper, and then click Convert toWallpaper.
For a single object, you can right-click it and then click Convertto Wallpaper.
To unlock the wallpaper:
� On the Edit menu, select Wallpaper, and then click Unlock AllWallpaper.
All objects in the graphic display are converted back to theiroriginal state.
Using graphic libraries
RSView Studio comes with a set of libraries, contained in theLibraries folder. As with a public library, the graphics libraries canprovide you with source materials and reference information.
Each graphic library consists of a graphic display, with the fileextension .gfx. The library displays contain graphic objects that youmight find useful in your own project. Many of the objects arepreconfigured with animation. For example, see the Conveyor partslibrary.
You can:
look at the objects and displays to get ideas for your own project
drag and drop (or copy and paste) objects from the libraries intoyour own displays
For information about copying objects from a library into yourgraphic display, see page 9-38.
use the objects as they are or change them to suit your needs
create your own libraries of objects
use libraries as displays in your project

� 8-17Creating graphic displays
To open a graphic library:
1. In the Project Explorer, open the Graphics folder, and then openthe Libraries folder.
2. Double-click the library name, or right-click it and then clickOpen.
Creating graphic libraries
You can create a graphic library in the Libraries folder, or create agraphic display in the Displays folder and then add the display to theLibraries folder.
To create a graphic library:
1. In the Graphics folder, right-click Libraries and then click New.2. Create the objects you want to put in the library.
For information about creating graphic objects, see Chapter 9.3. On the File menu click Save, or click the Save tool.4. In the Component name box, type a name for the library, and
then click OK.The library is added to the list in the Libraries folder.
You can also create a graphic display and then use Add ComponentInto Project to add the display to the Libraries folder.
To add a graphic display to the library:
1. Create the graphic display.2. In the Project Explorer, in the Graphics folder, right-click the
Libraries icon.3. Click Add Component Into Project.4. In the dialog box, navigate to the Gfx folder, and then click the
.gfx file for the display to use.The Gfx folder is located in \Documents and Settings\AllUsers\Documents\RSView Enterprise\ME\HMI projects\ProjectNamewhere Project Name is the name of your project.
5. Click Open. The display is copied into the Libraries folder.
Using libraries as displays in your project
The graphic libraries are available on the development computer, butdo not appear at runtime. To use a library as a graphic display atruntime, you must add the library into your project’s folder ofgraphic displays.
Save tool

Preface
8-18 � RSView Machine Edition User’s Guide
To use a library as a display in your project:
1. In the Project Explorer, in the Graphics folder, right-click theDisplays icon.
2. Click Add Component Into Project.
3. In the dialog box, navigate to the Libraries folder, and then clickthe .gfx file for the library to use.
The Libraries folder is located in \Documents and Settings\AllUsers\Documents\RSView Enterprise\ME.
4. Click Open. The library is copied into the Displays folder.
Location of library components
The Libraries folder is located in \Documents and Settings\AllUsers\Documents\RSView Enterprise\ME.
If desired, you can specify a different directory in which to storelibrary components. If you specify a different directory, RSViewsaves graphic libraries that you add or create in the new directory.Similarly, when you open a library component RSView looks for thecomponent in the specified directory.
If you specify a different directory but want to use the libraries thatcome with RSView, use My Computer or Windows Explorer tocopy the library component files into the directory you’ve specified,or else change the path back to the default path when you want toopen an RSView library component.
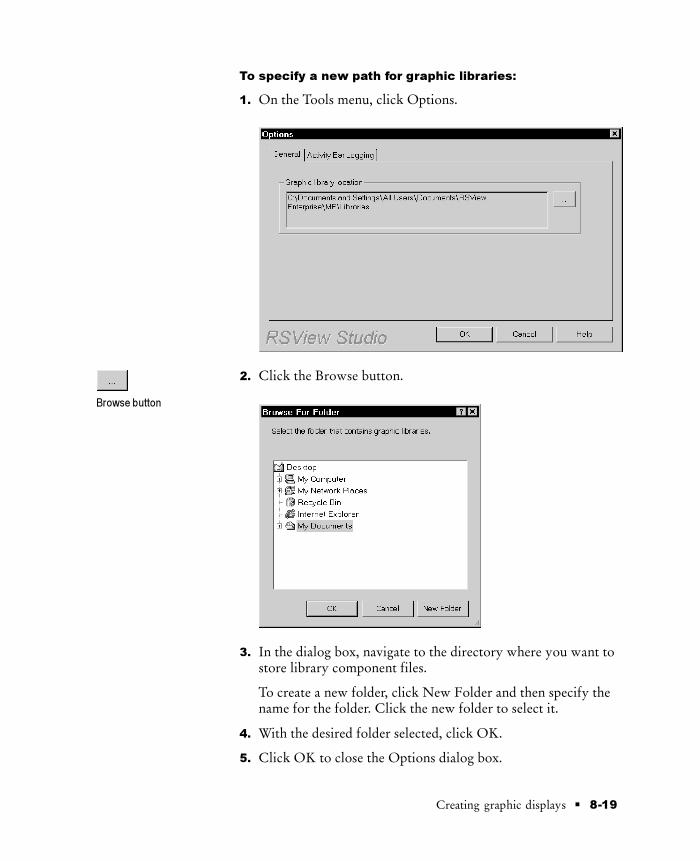
� 8-19Creating graphic displays
To specify a new path for graphic libraries:
1. On the Tools menu, click Options.
2. Click the Browse button.
3. In the dialog box, navigate to the directory where you want tostore library component files.
To create a new folder, click New Folder and then specify thename for the folder. Click the new folder to select it.
4. With the desired folder selected, click OK.
5. Click OK to close the Options dialog box.
Browse button

Preface
8-20 � RSView Machine Edition User’s Guide
Importing images into your project
You can use these types of external graphic files in your graphicdisplays:
.bmp—bitmap images
.dxf—AutoCAD� files
.wmf—Windows meta files
You import and place .dxf and .wmf files in your displays in onestep. Once imported, they are converted to drawing objects. Formore information about using these types of files in your displays,see page 9-17.
Bitmap images that come with RSViewStudio
RSView Studio comes with sets of bitmaps that are useful forillustrating graphic objects and displays:
arrows
DIN symbols
ISA symbols
keyboard button symbols such as Enter and Page Up
parts such as buttons, conveyors, pipes, tanks, and valves
The symbols and most of the arrows are monochrome (that is, useonly two colors, one for the foreground and one for thebackground).
You can configure the foreground and background colors for themonochrome images that you use for your objects.
For color images, you can specify whether to use a transparent orsolid background. If you select the transparent background style, theblack portions of the image become transparent.
For detailed information about configuring objects, see Chapter 10.
Location of bitmap files
The bitmap files that come with RSView Studio are stored in thisdirectory:
\Documents and Settings\All Users\Documents\RSViewEnterprise\Images

� 8-21Creating graphic displays
The images are in folders called Arrows, DIN, ISA, ListKey, andParts.
Importing bitmap images
To use bitmap images, you can:
import the images first, and then place them in your displays asneeded. This method is useful for bitmaps that you use toillustrate your displays.
For information about placing images in your display onceyou’ve imported them, see page 9-11.
use the Image Browser to import images as needed whileconfiguring your graphic objects. This method is useful forbitmaps that you use for labels on your graphic objects.
For information about using the Image Browser, see page 8-22.
copy and paste images from the graphic libraries
For information about copying and pasting objects, seepage 9-39.
copy and paste images from one project to another
For information about opening two projects at once, seepage 4-6.
If you will be using bitmaps that have more than 256 colors, beforeimporting the bitmaps configure your video adapter to display morethan 256 colors. This will ensure that the colors of imported imagesappear the same as in the original. For more tips about using bitmapimages, see page 8-24.

Preface
8-22 � RSView Machine Edition User’s Guide
To import bitmap images:
1. In the Graphics folder, right-click Images and then click AddComponent Into Project.
To view the bitmap images,
click this button and then
click Thumbnails.
2. Navigate to the directory where the bitmap file is stored, andthen click the file name.
Shift-click or Ctrl-click to select additional files.
3. Click Open to add the selected files to the list in the Imagesfolder.
To view a bitmap image that you’ve already imported:
� In the Images folder, double-click the image name, or right-clickit and then click Open.
Using the Image Browser to import bitmaps
Use the Image Browser to import bitmap images as needed whileyou configure graphic objects.
In the Image Browser you can:
import images into the project
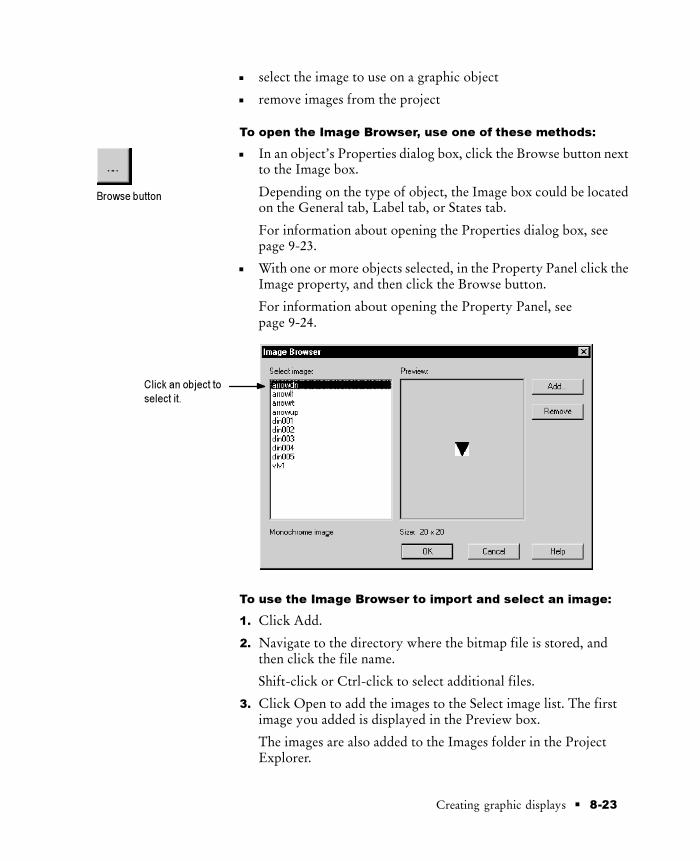
� 8-23Creating graphic displays
select the image to use on a graphic object
remove images from the project
To open the Image Browser, use one of these methods:
In an object’s Properties dialog box, click the Browse button nextto the Image box.
Depending on the type of object, the Image box could be locatedon the General tab, Label tab, or States tab.
For information about opening the Properties dialog box, seepage 9-23.
With one or more objects selected, in the Property Panel click theImage property, and then click the Browse button.
For information about opening the Property Panel, seepage 9-24.
Click an object to
select it.
To use the Image Browser to import and select an image:
1. Click Add.
2. Navigate to the directory where the bitmap file is stored, andthen click the file name.
Shift-click or Ctrl-click to select additional files.
3. Click Open to add the images to the Select image list. The firstimage you added is displayed in the Preview box.
The images are also added to the Images folder in the ProjectExplorer.
Browse button

Preface
8-24 � RSView Machine Edition User’s Guide
4. To view another image, click it in the list.
To scroll quickly through all the images in the list, select the firstimage and then press the Down Arrow key.
5. When you’re finished viewing images, click the image to use onthe object’s label.
6. Click OK to close the Image Browser and use the selected imageon the object’s label. To close the browser without using theselected image, click Cancel.
Clicking Cancel does not remove the imported images from theImages folder.
To use the Image Browser to remove images from the
project:
1. In the Select image list, click the file to remove.
Shift-click or Ctrl-click to select additional files.
2. Click Remove to delete the images from the project.
3. To close the browser, click OK or Cancel.
Clicking Cancel does not restore the images you removed.
You can also remove an image by clicking it in the Images folder andthen right-clicking Remove or Delete. For more information, seepage 2-13.
Tips for using bitmaps
Bitmaps consume Windows resources, so when using bitmapsfollow these guidelines:
Avoid unnecessary color depth.
The more colors you use, the more memory is consumed:
This bitmap type Consumes this many bits per pixel
Monochrome 1
16-color 4
256-color 8 (1 byte)
64-K color 16 (2 bytes)
16 million color 24 (3 bytes)

� 8-25Creating graphic displays
For example, a 24-bit image that measures 800x600 pixelsconsumes 1440 KB of memory. If the bitmap color depth isdecreased to 256 colors, the image might have minor color loss,but the new image uses only 480 KB of memory.
Avoid using unnecessary bitmaps.
For simple illustrations, create graphic objects using the drawingtools. You can change a bitmap to a collection of drawing objectsby converting the bitmap to wallpaper, tracing over the bitmapwith the drawing tools, and then deleting the bitmap.
Use your judgement here; if the illustration is complex, a bitmapmight display more quickly at runtime than a huge number ofdrawing objects would.
Using parameter files
To use the same graphic display with different sets of tags, useparameter files and tag placeholders. Using tag placeholders can bequicker than duplicating a display and reconfiguring the objects in itto use a different set of tags, especially when the display uses a lot oftags. Using parameter files also reduces the size of the runtimeproject file.
The parameter file specifies which tags to substitute for theplaceholders in the display, by assigning one tag to each uniqueplaceholder in the display. Create a parameter file for each set of tagsthat you want to use with the same graphic display.4.
At runtime, the tag values that are displayed depend on whichparameter file is used when the display opens. When you open thedisplay, the tags specified in the parameter file replace the tagplaceholders.
About tag placeholders
A tag placeholder consists of the # symbol and a number between 1and 500, for example, #1. You can use a placeholder anywhere thatyou would normally assign a tag.
For more information about using tag placeholders, see page 9-36.

Preface
8-26 � RSView Machine Edition User’s Guide
Assigning parameter files to graphicdisplays
You can use parameter files with:the graphic display that opens when the project is first run.Specify the graphic display to open, and the parameter file to usewith it, in the Startup editor.graphic displays that are opened using Goto Display buttons.Specify the graphic display to open, and the parameter file to usewith it, when you set up the button.
Example: Using a parameter file to replace tag placeholders
This example shows how to use a graphic display called CanningOverview with two sets of tags, one for canning corn, and one forcanning peas.
The Canning Overview display is opened from a graphic displaycalled Main Menu.1. Create these sets of tags:
Tag type Tag name Tag name
String Corn_Name Pea_Name
Analog Corn_Temp Pea_Temp
Analog Corn_Weight Pea_Weight
Analog Corn_Level Pea_Level
2. Create two parameter files, called Corn and Peas, containingthese parameters:
Corn Peas
#1=Corn_Name #1=Pea_Name
#2=Corn_Temp #2=Pea_Temp
#3=Corn_Weight #3=Pea_Weight
#4=Corn_Level #4=Pea_Level
3. In the Canning Overview display, assign tag placeholders to theValue controls for these graphic objects:
This graphic object Uses this tag placeholder
String display #1
Numeric display 1 #2

� 8-27Creating graphic displays
This graphic object Uses this tag placeholder
Numeric display 2 #3
Bar Graph #4
4. Use descriptive text to illustrate the objects in the display.
5. In the Main Menu display, create two Goto Display buttons foropening the Canning display. Assign the Corn parameter file toone button, and the Peas parameter file to the other.
At runtime, when the operator presses the Peas button in the MainMenu, the Canning Overview display opens and shows the values ofthe Pea_ tags. When the operator presses the Corn button, the valuesof the Corn_ tags are displayed.
The Canning Overview display looks like this when the operatorpresses the Peas button:
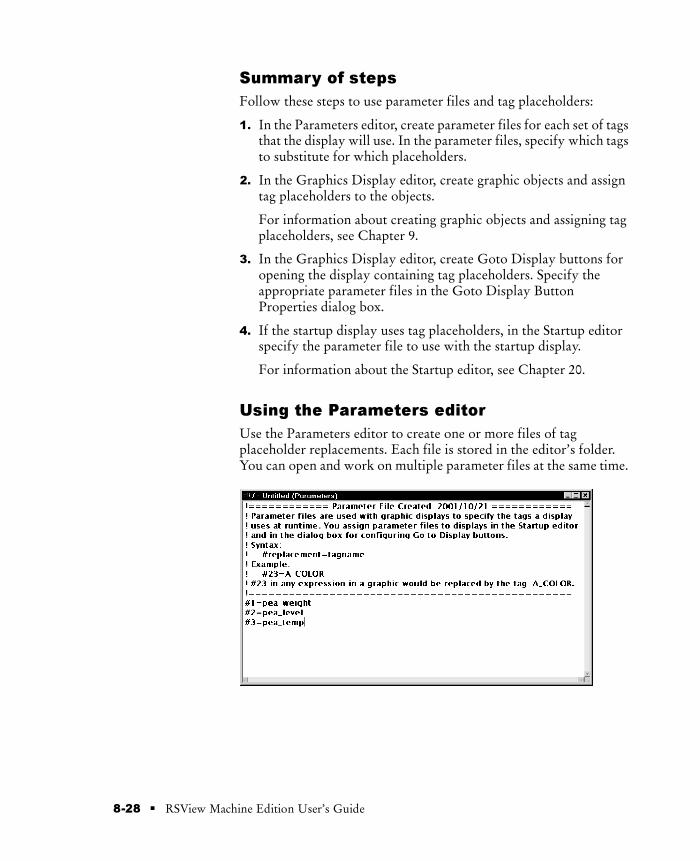
Preface
8-28 � RSView Machine Edition User’s Guide
Summary of steps
Follow these steps to use parameter files and tag placeholders:
1. In the Parameters editor, create parameter files for each set of tagsthat the display will use. In the parameter files, specify which tagsto substitute for which placeholders.
2. In the Graphics Display editor, create graphic objects and assigntag placeholders to the objects.
For information about creating graphic objects and assigning tagplaceholders, see Chapter 9.
3. In the Graphics Display editor, create Goto Display buttons foropening the display containing tag placeholders. Specify theappropriate parameter files in the Goto Display ButtonProperties dialog box.
4. If the startup display uses tag placeholders, in the Startup editorspecify the parameter file to use with the startup display.
For information about the Startup editor, see Chapter 20.
Using the Parameters editor
Use the Parameters editor to create one or more files of tagplaceholder replacements. Each file is stored in the editor’s folder.You can open and work on multiple parameter files at the same time.

� 8-29Creating graphic displays
Creating parameter files
To create a parameter file:
1. Open the Parameters editor.
2. Type one entry for each unique placeholder in the display, in theformat <placeholder>=<tag name>.
The placeholder consists of the # symbol and a number between1 and 500. For example:
#1=pea_weight#2=pea_level#3=pea_temp
To open the Tags dialog box and select a tag, double-click theeditor where you want to insert the tag name. The selected tagname is inserted in front of the cursor.
3. On the File menu click Save, or click the Save tool.
4. In the Component name box, type a name for the file, and thenclick OK.
Using local messages
Use local messages to give the operator ongoing information aboutthe status of devices and processes. For example, you might use localmessages to describe the status of a device whose condition cannotbe shown graphically with complete accuracy.
The messages you create in the Local Messages editor are displayedin Local Message display objects in graphic displays. You can usemultiple Local Message display objects in your project, and link eachobject to a different file of messages. Or, you can use the same file ofmessages for multiple Local Message display objects.
When to use local messages
Use local messages to give the operator information in a specificgraphic display while the display is open. To give the operatorinformation no matter which display is open, use informationmessages.
For details about information messages, see Chapter 14.
Save tool

Preface
8-30 � RSView Machine Edition User’s Guide
Preparing to set up local messages
As your project is running, information is continually sent to thedata source about the state of various processes. For example, yourproject might be monitoring whether a valve is open or closed, orthe temperature in a boiler. Values representing the status of theseprocesses are sent to the data source.
The data source
The data source can be memory or a device such as a programmablelogic controller or OPC server. RSView writes values to and readsvalues from the data source. The data source is configured toexchange information (in the form of numeric or string values)between RSView and the physical machine that your project iscontrolling.
Identifying the tags and values to monitor
To set up local messages, determine which tags associated withmachine processes to monitor, and identify the values for those tagsthat will trigger local messages.
For information about creating tags, see Chapter 7.
How local messages work
These are the key parts of the local message system:
Local message files—text files containing lists of messages, with anumeric trigger value for each message
Local Message display object—a graphic object that displayslocal messages when the Value control assigned to the objectmatches a message’s trigger value
Value control—a tag or expression. When the value of thiscontrol matches a message’s trigger value, the local messagedisplay object displays the associated message.
The Local Message display object always appears in the graphicdisplay it’s placed in, whether or not there is a message to display.However, the operator does not see the message unless the object islocated in the display the operator is currently viewing.
The following example shows how the key parts of the local messagesystem work together.

� 8-31Creating graphic displays
Example: Displaying local messages
This example shows how to notify the operator of the status of ahoist.
1. Create an analog tag called Hoist_Status. This tag points to anaddress in a programmable controller that is linked to sensors onthe hoist. The tag has five possible values:
The tag has this
value
When the hoist has this status
1 At bottom
2 Raising
3 Stopped between the top and bottom
4 Lowering
5 At top
2. In the Local Messages editor, create these messages with triggervalues matching the values that will be sent to the Hoist_Statustag:
Trigger value Message
1 The hoist is ready to rise.
2 The hoist is raising the pallet.
3 The hoist has stopped.
4 The hoist is lowering the pallet.
5 The hoist is finished rising.
Save the message file with the name “Hoist status.”
3. In the Graphics Display editor, create a Local Message displayobject. In the object’s Properties dialog box, assign theHoist_Status tag to the Value control, and select the Hoist statusmessage file.
At runtime, when the operator views the graphic display containingthe Local Message display object, the status of the hoist is displayed.

Preface
8-32 � RSView Machine Edition User’s Guide
Local messages and trigger values
Create messages associated with each tag value that you want toinform the operator about. Assign each message a trigger value, andconfigure the data source to send the trigger value to the Valuecontrol.
The trigger value can be any non-zero integer value (positive ornegative). Trigger values do not need to be contiguous, but theymust be unique for each message. For example, you could use triggervalues of 1, 2, and 3, or values of 10, 20, and 30.
If you use an analog tag or an expression, you can use any non-zerointeger or floating point value to trigger an alarm. Floating pointvalues are rounded to the nearest integer. For information abouthow values are rounded, see page 7-3.
Trigger values cannot be 0. Digital tags have two possible values, 0and 1. Therefore, if you use a digital tag you can only use the value 1to trigger a message. If you want to use a digital tag to trigger twodifferent messages, create an expression that adds 1 to the digitaltag’s value. That way, you can use the trigger values 1 and 2.
When the Value control’s value is 0, the Local Message displayobject is cleared.
Summary of steps
Follow these steps to configure local messages:
1. In the Local Messages editor, set up the messages and theirtrigger values.
2. In the Graphics Display editor, create Local Message displayobjects in the graphic displays in which you want the messages toappear at runtime. For each Local Message object, assign a tag orexpression to the Value control and specify the file of messages todisplay.
For information about creating graphic objects, see Chapter 9.

� 8-33Creating graphic displays
Using the Local Messages editor
Use the Local Messages editor to create one or more files of localmessages. Each file is stored in the editor’s folder. You can open andwork on multiple message files at the same time.
You can define up to 10,000 messages in each message file.
Creating local messages
To create local messages:
1. Open the Local Messages editor.
2. Specify these properties for the message:
Trigger value
Type a non-zero integer value. When the Value control changesto this value, the associated message is generated. This columncannot be blank.
For more information about trigger values, see page 8-32.
Message
Type the message, up to 256 characters. You can use the new linecharacters, \n, to specify that the message continues at thebeginning of the next line.
If you want the character sequence “\n” to appear in the message,type “\\n”. This way the sequence won’t be interpreted as thenew line characters. For example, to create the message “Loggingto \norm’s bakery\logs has been interrupted.” you would typethis: Logging to \\norm’s bakery\logs has been interrupted.

Preface
8-34 � RSView Machine Edition User’s Guide
3. Repeat steps 1 and 2 to create additional messages.
4. To sort the messages by trigger value, highlight the rows to sort,right-click in any of the selected rows, and then click Sort.
5. On the File menu click Save, or click the Save tool.
6. In the Component name box, type a name for the file, and thenclick OK.
7. Click Close.
To delete a message:
� Select any cell in the message’s row, and then press Delete.Shift-click in a column to select cells for multiple messages.
To copy a message:
1. In the Message column, select one or more messages and thenpress Ctrl-C (or right-click the selected cells and then clickCopy).
2. In the Message column, click the cell to paste the first message in,and then press Ctrl-V (or right-click the cell and then clickPaste).
Creating messages in a spreadsheetapplication
You can also create local messages in a spreadsheet application suchas Microsoft Excel, and then copy the messages into the LocalMessages editor.
Save tool

� 8-35Creating graphic displays
To create messages in a spreadsheet application:
� Create one message per row, as follows:
In column 1, type the trigger value.
In column 2, type the message.
Type the messages in the order you want them to appear in theLocal Messages editor.
To copy the messages into the Local Messages editor:
1. In the application where you created the messages, select the cellsfor the trigger values and messages to copy, and then pressCtrl-C (or right-click the selected cells and then click Copy).
2. In the Local Messages editor, click in the Trigger value columnfor the first message and then press Ctrl-V (or right-click in thecolumn and then click Paste).
The cell contents from the spreadsheet application are pasted intothe current and succeeding rows.
How the Local Message display graphicobject works
When you open a graphic display at runtime, RSView reads thevalue of the Value control and updates the Local Message displayobject based on the value.
What is displayed
If the Value control is unassigned, the display is filled withquestion marks (?).
The Value control is rounded to the nearest integer. If the valuedoes not match any of the trigger values in the specified messagefile, the display is filled with questions marks (?).
For information about how values are rounded, see page 7-3.
If the message is too long to fit in the object, the last displayedcharacter is replaced with an asterisk (*).
When the Value control’s value is 0, the display is cleared.
Printing displaysYou can print your graphic displays on the development computer.This might be useful if you want other people to review the displaysbefore implementing the project, or if you want to keep a visualrecord of the displays.

Preface
8-36 � RSView Machine Edition User’s Guide
You can also print graphic displays at runtime, to provide a printedrecord of process values such as trend data.
For information about printing on the development computer, seepage 2-14.
Printing displays at runtime
When you print a display at runtime, everything on the screen isprinted, including the current display, pop-up windows, and anyvisible background applications.
For information on specifying the printer to use at runtime, see page22-6.
To print graphic displays at runtime, use one or both of
these methods:
Create Display Print buttons in the graphic displays you want toprint. At runtime, the operator presses the buttons to print thedisplays.
For information about creating graphic objects, see Chapter 9.
Assign a tag or expression to the Remote Display Print control(in the Global Connections editor). When the value of the tag orexpression changes from 0 to a non-zero value, the currentdisplays are automatically printed.
Program the data source to trigger the change as often as youwant the data printed.
For more information about setting up remote display printing,see page 19-10.

� 9-1Creating and working with graphic objects
Creating and workingwith graphic objects
This chapter describes the types of graphic objects and outlines howto:
create interactive, drawing, and ActiveX objects
select and deselect objects and use the Object Explorer
use the Properties dialog box and Property Panel to configureobjects
color objects
name objects
test how objects look in different states
assign tags and expressions to objects
replace tags using tag substitution
use tag placeholders
move, copy, duplicate, resize, reshape, and delete objects
group and ungroup objects, and edit group objects
arrange objects and lock objects into position
For information about configuring graphic objects, see Chapter 10.
For examples of how to configure objects, see the sample projectsthat come with RSView Studio. The Help also provides examples ofhow to use objects.
Types of graphic objects
The components that make up a graphic display are called graphicobjects. Use objects to control your process and project.
9Chapter

Preface
9-2 � RSView Machine Edition User’s Guide
RSView comes with a complete range of configurable objects such aspush buttons, list selectors, bar graphs, and trends. Some objectsinteract with the data source, allowing the operator to change orview tag values. For example, the operator can push a button to set atag value to 1, causing a programmable controller to start a conveyorbelt. Other objects are used to control your project. For example,there are button objects that you can use to change displays andscroll through lists.
RSView also comes with drawing objects that you can use toillustrate your graphic displays. The drawing objects include text,bitmap images, and geometric and freehand shapes.
RSView also supports the use of ActiveX objects—third-partysoftware components that you can use to control processes anddisplay information. The ActiveX objects available depend on whichthird-party applications are installed on your developmentcomputer. For example, products such as Microsoft Visual Basic�,Rockwell Software RSTools�, and Microsoft Office provideActiveX objects that are configurable in RSView Studio.
Using the tables
The tables beginning on the next page will help you choose whichobjects to use to control your project and process. The tables groupthe objects according to function, provide an overview of what eachobject does, and list cross-references to more detailed informationabout using the objects.
About controls
Many of the objects use controls to interact with the data source. Acontrol is the link between the object and the data source.Depending on an object’s function, the object may have more thanone control. For example, a Momentary Push button has a Valuecontrol and an Indicator control. The Value control is used to set avalue at the data source, and the Indicator control is used to displaythe data source value in your graphic display.
By assigning tags or expressions to an object’s controls, you controlthe flow of data between the project and the data source, which inturn controls your process or equipment. Assign tags or expressionsto an object’s controls in the Connections tab of the object’sProperties dialog box (see page 9-22) or in the Connections tab ofthe Property Panel (see page 9-24).

� 9-3Creating and working with graphic objects
Illustrating your displays
Use this graphic
object
To do this
Text Create text for labels or instructions in the display. See page 9-10.
Image Place bitmap images in your display. For information about bitmaps, seepage 8-20. For details about creating image graphic objects, see page 9-11.
Panel Draw rectangles that have borders. See page 9-12.
Arc Draw an arc (a segment of an ellipse or circle’s perimeter). See page 9-12.
Ellipse Draw ellipses and circles. See page 9-13.
Freehand Draw freehand shapes as you would with a pen on paper. See page 9-14.
Line Draw straight diagonal, horizontal, and vertical lines. See page 9-14.
Polygon Draw a series of connected straight lines forming a closed shape. Seepage 9-14.
Polyline Draw a series of connected straight lines. See page 9-14.
Rectangle Draw rectangles and squares. See page 9-15.
Rounded Rectangle Draw rectangles or squares with rounded corners. See page 9-16.
Wedge Draw a filled segment of an ellipse or circle. See page 9-12.
Controlling the project
Use this graphic
object
To do this
Goto Display button Open a graphic display. For details, see page 19-4.
Return to Display button Close a display and return to the previous display. For details, seepage 19-5.
Close Display button Close a display. For details, see page 19-6.
Display List selector Select a display to open from a list of displays. For details, see page 19-6.
Login button Open the Login dialog box and then log in. For details, see page 18-9.
Logout button Log out of the project. For details, see page 18-9.
Display Print button Print the current display. For details, see page 8-35.
Shutdown button Stop the project and close RSView ME Station. For details, see page 19-7.

Preface
9-4 � RSView Machine Edition User’s Guide
Starting and controlling processesUse this graphic object To do this
Momentary Push button Start a process or action by sending one value to the tag when pressed,and another value when released. For details, see page 10-30.
Maintained Push button Toggle between two values, by sending one value to the tag whenpressed, and a second value the next time the button is pressed andreleased. This button is useful for changing a setting within a machine orprocess, but not for starting the machine or process. For details, seepage 10-37.
Latched Push button Start a machine or process. The button remains set (latched) until theprocess is complete. For example, use this button to start a bag fillingmachine. When the process is complete (the bag is full), the button isreset (unlatched) by the Handshake control. For details, see page 10-43.
Multistate Push button Cycle through a series of values. Each time the operator presses thebutton, the value for the next state is sent to the tag. When the button isin its last state, pressing it changes the button to its first state and writesout the first state value.
This button is useful when you want the operator to see and selectmultiple options in sequence, using a single button. The button displaysthe current state of a process or operation by showing a different color,caption, or image to reflect the different states. For details, seepage 10-49.
Interlocked Push button Use a group of buttons to send values to the same tag. When theoperator presses one button in the group, the button’s value is sent tothe tag, and the button remains highlighted as long as the tag value is thesame as the button’s value. Pressing another button in the group releasesthe first button, and sends a new value to the tag. For details, seepage 10-57.
Ramp button Increase or decrease the value of a tag by a specified integer or floatingpoint value. For example, use two ramp buttons together to create araise/lower control. For details, see page 10-62.
Control List selector Select from a list of states for a process or operation. The list ishighlighted to show the current state, and the operator can scrollthrough the list to select a different state. The value assigned to theselected state is written to the tag. For details, see page 10-126.
Drawing object withhorizontal or vertical slideranimation
Set the value of a tag by dragging the slider object. The pixel position ofthe slider is translated into a value that is written to the tag. If the valueof the tag is changed at the data source, the position of the slider changesto reflect this. For information about animation, see Chapter 11.
ActiveX object Change tag values using a third-party object connected to an analog,digital, or string tag. When the object’s property value changes, the newvalue is written to the associated tag. For details, see page 9-17.

� 9-5Creating and working with graphic objects
Displaying processes and values graphically
Use this graphic object To display this
Bar Graph Numeric values in bar graph format. The bar graph increases ordecreases in size to show the changing value. For details, seepage 10-115.
Gauge Numeric values in dial format. The gauge’s needle moves around thedial to show the changing value. For details, see page 10-115.
Scale A static indication of the range of values for a bar graph. For details, seepage 10-115.
Multistate indicator The state of a process, on a panel that changes its color, image, orcaption to indicate the current state. Each state is configured tocorrespond to a numeric tag value. For details, see page 10-100.
Symbol The state of a process, using a monochrome image that changes color toindicate the current state. Each state corresponds to a numeric tag value.
This object is useful for showing the state of a process or operation at aglance. For details, see page 10-100.
List indicator The state of a process, using a list of possible states with the currentstate highlighted. Each state is represented by a caption in the list, andcorresponds to a numeric tag value.
This indicator is useful if you want to view the current state, but alsowant to see the other possible states. For sequential processes, the listcan alert the operator about what happens next in the process. Fordetails, see page 10-100.
Trend Historical or real-time numeric tag values, plotted against time ordisplayed in an XY plot, where one or more tags’ values are plottedagainst another tag’s values to show the relationship between them. Fordetails, see Chapter 17.
Time and Date display Display the current time and date. For details, see page 10-136.
ActiveX object Data using a third-party object connected to an analog, digital, or stringtag. The format of the data displayed depends on the object. For details,see page 9-17.
Drawing object withrotation, width, height, fill,color, or horizontal orvertical position animation
The value of a tag using a pictorial representation of the current value inrelation to a range of possible values. For example, use rotationanimation to show the tag value as a needle’s position on a dial.
For color animation, assign different colors to represent different values.For information about animation, see Chapter 11.

Preface
9-6 � RSView Machine Edition User’s Guide
Working with lists and trends
Use this button With this graphic
object
To do this
Pause button Trend Toggle a trend between pausing and automaticscrolling.
Next Pen button Trend Change the vertical axis labels for a trend to thescale for the next pen.
Backspace button Control List selector Move the cursor back to the highlighted item inthe list.
End button Lists and trends List—move to the bottom item visible in the list.
Trend—resume trend scrolling and move to thecurrent (latest) data in the trend.
Enter button Lists Select the item the cursor is pointing to.
Home button Lists and trends List—move to the top item visible in the list.
Trend—pause the trend and move to the earliestdata in the trend.
Move Left / Right buttons Trend Pause the trend and scroll to the left or right.
Move Up / Down buttons Lists and trends List—move up or down one item in the list.
Trend—scroll up or down to display lower valueson the vertical scale.
Page Up / Down buttons Lists Move up or down one page in the list.
Acknowledge Alarmbutton
Alarm list Acknowledge and silence the selected alarm.
Acknowledge All Alarmsbutton
Alarm list Acknowledge and silence all currentlyunacknowledged alarms.
Clear Alarm Historybutton
Alarm list Remove all alarms from the alarm log file and allAlarm lists.
Silence Alarms button Alarm list Silence the audio indicator for all current alarms(Windows 2000 projects only).
Activity Clear button Activity list Remove the selected message from all Activitylists.
Activity Clear All button Activity list Remove all activity messages from all Activitylists.
InformationAcknowledge button
Information Messagedisplay
Acknowledge the current message in the display.

� 9-7Creating and working with graphic objects
For more information about using the buttons with lists and trends,see the topics on these pages:
For information about See
Linking a button to a specific list or trend object Page 10-9
Using buttons with Alarm lists Page 13-28
Using buttons with Information Message displays Page 14-10
Using buttons with Activity lists Page 15-9
Using buttons with trends Page 17-24
Entering and displaying numeric and string values
Use this graphic object To do this
Numeric Input Enablebutton
Enter a numeric value and then write the value to a tag or an expression.For details, see page 24-3.
String Input Enable button Enter a string value and then write the value to a tag. For details, seepage 24-7.
Numeric display Display numeric tag values. For example, display the currenttemperature of an oven. For details, see page 10-68.
String display Display string tag values. For example, set up the data source to generatestrings that report on the state of a process or operation, or that providethe operator with instructions about what to do next. For details, seepage 10-80.
ActiveX object Enter or display data using a third-party object connected to an analog,digital, or string tag. The format of the data entered or displayeddepends on the object. For details, see page 9-17.
Displaying alarms and messages
Use this graphic object To display this
Alarm list Alarm messages that notify the operator when a situation requiringimmediate attention occurs. For details, see page 13-27.
Activity list Messages about system activity such as tag reads, tag writes, andcommunication errors. For details, see page 15-8.
Information Messagedisplay
Messages about the process, prompts or instructions, and informationabout current states. For details, see page 14-12.
Local Message display Ongoing information about the status of devices or processes. Fordetails, see page 8-29.

Preface
9-8 � RSView Machine Edition User’s Guide
Selecting tools for creating graphic objects
The Objects menu in the Graphics Display editor contains items forcreating objects, as well as items for selecting and rotating objects.You can also create most objects using the tools on the Objectstoolbar.
Objects toolbarObjects menu
Before you can create an object, you must select the object’s tool,either by clicking a menu item or by clicking the tool on the toolbar.When you position a cursor over a tool on the toolbar, the name ofthe tool is displayed in a tooltip and in the status bar.
To select a tool:
� Click the tool on the toolbar or on the Objects menu. When youclick a tool, the pointer changes to show which tool is active.
Freehand tool Text tool
To deselect a tool, do one of the following:
Double-click an empty area in the display.

� 9-9Creating and working with graphic objects
Click the Select tool.
Click another tool.
For some drawing objects, double-clicking an empty area of thedisplay creates another instance of the object. For these objects, tofinish drawing, click the Select tool. For more information, see theinstructions for creating drawing objects, beginning on page 9-10.
Before you begin creating objects
To size and position objects precisely as you create them, use thegrid.
To use the grid:
� On the View menu, click Show Grid, and then click Snap On.
For information about setting up the grid, see page 8-8.
The next sections describe how to create graphic objects. Forinformation about attaching animation to the objects you create, seeChapter 11.
Creating graphic objects
This section applies to graphic objects in general.
ActiveX objects and some drawing objects require extra steps tocreate them. For details about creating drawing objects, see the nextsection. For information about ActiveX objects, see page 9-17.
To create a graphic object:
1. Select the tool for the object to create.
2. Click the mouse where you want to position the object, and thendrag to draw a rectangle the general size you want the object tobe.
3. Double-click the object to open its Properties dialog box.
4. In the dialog box, specify how the object looks, its behavior, andcontrols. For more information about the dialog box, seepage 9-22.
You can also use the Property Panel to configure objects. Forinformation about using the Property Panel, see page 9-24.
Select tool

Preface
9-10 � RSView Machine Edition User’s Guide
For information about configuring a specific object, seeChapter 10.
Creating drawing objects
The following instructions for creating drawing objects describehow to create the objects and then open the objects’ Propertiesdialog boxes to configure how the objects look. For informationabout using the Properties dialog box, see page 9-22.
You can also use the Property Panel to configure objects. Forinformation about using the Property Panel, see page 9-24.
For detailed information about configuring a specific object, seeChapter 10.
Creating text
Choosing fonts
You can select any font you have installed, but TrueType� andOpenType� fonts are recommended. These fonts can be resizedeasily, without losing text quality.
If you run a project on a computer that does not have the fonts youused when configuring the project, Windows substitutes with thefonts that most closely match the fonts you specified.
To create a text object:
1. Select the Text tool.
The pointer becomes an I-beam ( ).
2. Click the I-beam where you want the text to start.
3. Type the text.
To move the cursor to the next line of text, press Enter.
4. To create another text object, move to a new area in the display,click, and then type the text.
5. To finish entering text, right-click or double-click the text.
6. To change how the text looks, right-click the text and then clickProperties on the context menu, or double-click the text to openthe Text Properties dialog box.

� 9-11Creating and working with graphic objects
7. In the dialog box, specify how the text looks and the font to use.
For example, if the text has a solid background and you don’twant the background to show, select the transparent backgroundstyle.
8. To close the dialog box, click OK.
After you’ve configured one text object to look the way you want,copy and paste it to create additional text objects with the sameformatting. Then edit the text of the new objects.
To edit a text object:
1. Right-click the text, and then click Edit.
The pointer becomes an I-beam ( ).
2. Click where you want to make the change. To delete textcharacters, use the Backspace and Delete keys.
You can also edit the text in the Text Properties dialog box.
Creating images
Use the image graphic object to place bitmap images in your graphicdisplays.
Images support visibility animation only.
Using bitmaps
Before you can place a bitmap image in a display, you must importthe image into your project. For more information, see page 8-20.
To place a bitmap image in a display:
1. Select the Image tool.
2. Click the mouse where you want to position the image, and thendrag to draw a rectangle.
3. Double-click the rectangle to open the Image Properties dialogbox.
4. In the dialog box, specify the bitmap image to use.
The image is placed where you drew the rectangle, but the actualsize of the image is used, rather than the size of the rectangle youdrew.

Preface
9-12 � RSView Machine Edition User’s Guide
5. For monochrome bitmaps, specify the image color, backgroundstyle, and whether the image blinks.
For color bitmaps, specify the background style.
6. Click OK to close the dialog box.
Creating panels
Panels support visibility animation only.
To create a panel:
1. Select the Panel tool.
2. Click the mouse where you want to position the panel, and thendrag to draw a rectangle the general size you want the panel tobe.
3. To change how the panel looks, double-click the panel to openthe Panel Properties dialog box.
4. In the dialog box, specify how the panel looks.
5. To close the dialog box, click OK.
Creating arcs and wedges
Arcs and wedges are drawn in two steps: first you create an ellipse orcircle, and then you reshape it into the segment you want.
Arc Solid wedgeTransparent wedge
To create an arc or wedge:
1. Select the Arc or Wedge tool.
2. Click the mouse where you want to position the object, and thendrag to draw an ellipse or circle.
To base the arc or wedge on a circle rather than an ellipse, holddown Ctrl while you drag.
When you release the mouse button, a set of handles appears soyou can decrease the angle of the wedge or arc from 360 degreesto the desired angle.

� 9-13Creating and working with graphic objects
3. Click a handle, and drag the mouse to ‘cut out’ part of the circle.
4. To finish drawing, right-click the object.
5. To change how the object looks, click Properties on the contextmenu, or double-click the object to open its Properties dialogbox.
6. In the dialog box, specify how the object looks.
For example, if the shape you created has a solid background andyou don’t want the shape to be filled, select the transparentbackground style.
7. To close the dialog box, click OK.
You can also use the Arc and Wedge tools to reshape arcs andwedges. For more information, see page 9-42.
Creating ellipses and circles
Use the Ellipse tool to draw an ellipse or circle.
To create an ellipse or circle:
1. Select the Ellipse tool.
2. Click the mouse where you want to position the object, and thendrag to draw an ellipse or circle of the desired size.
To draw a circle, hold down Ctrl while you drag.
3. To change how the object looks, double-click it to open theobject’s Properties dialog box.
4. In the dialog box, specify how the object looks.

Preface
9-14 � RSView Machine Edition User’s Guide
5. To close the dialog box, click OK.
Creating freehand shapes
Using the Freehand tool is similar to drawing with a pen on paper.
To create a freehand shape:
1. Select the Freehand tool.
2. Click and drag to create the shape you want.
3. To change how the object looks, double-click it to open theFreehand Properties dialog box.
4. In the dialog box, specify how the object looks.
For example, if the shape you created has a solid background andyou don’t want the shape to be filled, select the transparentbackground style.
5. To close the dialog box, click OK.
Creating lines
To create a line:
1. Select the Line tool.
2. Click where you want the line to start, and then drag from thebeginning point to the end point.
To draw horizontal or vertical lines, hold down Ctrl while youdrag the mouse.
3. To change how the line looks, right-click the line and then clickProperties on the context menu. The Line Properties dialog boxopens.
4. In the dialog box, specify how the line looks.
5. To close the dialog box, click OK.
You can use the Polyline tool to convert the line into a polyline. Formore information, see page 9-42.
Creating polygons and polylines
A polyline is a series of connected line segments. A polygon is amulti-sided object (with three or more sides). For example, use thepolygon shape if you want to create triangles.

� 9-15Creating and working with graphic objects
Polyline Transparent polygon Solid polygon
To create a polygon or polyline:
1. Select the Polygon or Polyline tool.
2. Click and drag to create the first segment of the object. Releasethe mouse button.
To draw horizontal or vertical lines, hold down Ctrl while youdrag.
3. Move the mouse to where you want the next segment to end, andthen click.
Repeat this step until you have completed the object.
4. To finish drawing, double-click an empty area of the display, orclick the Select tool.
5. To change how the object looks, double-click it to open theobject’s Properties dialog box.
6. In the dialog box, specify how the object looks.
For example, if the shape you created has a solid background andyou don’t want the shape to be filled, select the transparentbackground style.
7. To close the dialog box, click OK.
You can use the Polygon tool to reshape lines, polygons, polylines,and rectangles. For more information, see page 9-42.
Creating rectangles and squares
To create a rectangle or square:
1. Select the Rectangle tool.
2. Click the mouse where you want to position the object, and thendrag until the rectangle or square is the size you want.

Preface
9-16 � RSView Machine Edition User’s Guide
To draw a square, hold down Ctrl while you drag.
3. To change how the object looks, double-click it to open theobject’s Properties dialog box.
4. In the dialog box, specify how the object looks.
5. To close the dialog box, click OK.
You can use the Polygon tool to reshape the rectangle into apolygon. For more information, see page 9-42.
Creating rounded rectangles and squares
Due to a Windows limitation, you cannot rotate rounded rectanglesand rounded squares.
To create a rounded rectangle or square:
1. Select the Rounded Rectangle tool.
2. Click the mouse where you want to position the object, and thendrag until the rectangle or square is the size you want.
To draw a square, hold down Ctrl while you drag.
You can change how rounded the corners are by using the handlethat appears inside the rounded rectangle. Click the handle anddrag inward to increase roundedness, or outward to decreaseroundedness.
3. To finish drawing, right-click the object.
4. To change how the object looks, click Properties on the contextmenu, or double-click the object to open its Properties dialogbox.
5. In the dialog box, specify how the object looks.
6. To close the dialog box, click OK.
For information about using the Rounded Rectangle tool to reshapethe rounded rectangle, see page 9-43.
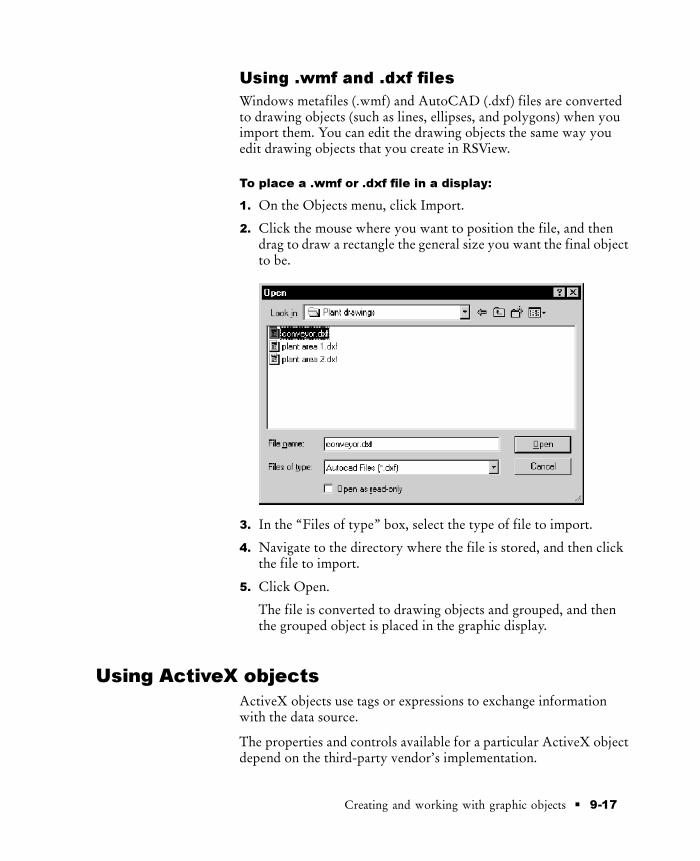
� 9-17Creating and working with graphic objects
Using .wmf and .dxf files
Windows metafiles (.wmf) and AutoCAD (.dxf) files are convertedto drawing objects (such as lines, ellipses, and polygons) when youimport them. You can edit the drawing objects the same way youedit drawing objects that you create in RSView.
To place a .wmf or .dxf file in a display:
1. On the Objects menu, click Import.
2. Click the mouse where you want to position the file, and thendrag to draw a rectangle the general size you want the final objectto be.
3. In the “Files of type” box, select the type of file to import.
4. Navigate to the directory where the file is stored, and then clickthe file to import.
5. Click Open.
The file is converted to drawing objects and grouped, and thenthe grouped object is placed in the graphic display.
Using ActiveX objects
ActiveX objects use tags or expressions to exchange informationwith the data source.
The properties and controls available for a particular ActiveX objectdepend on the third-party vendor’s implementation.

Preface
9-18 � RSView Machine Edition User’s Guide
IMPORTANT If your project will run on a RAC6182, the ActiveXobject must be available for both Windows 2000 andRAC6182 platforms. Make sure you install andregister the RAC6182 version of the ActiveX objecton the runtime computer.
ActiveX objects support visibility animation only.
To create an ActiveX object:
1. Select the ActiveX Control tool.
2. Click the mouse where you want to position the object, and thendrag until the object is the size you want.
3. In the dialog box, click the object you want to add to yourgraphic display. The list of objects depends on the software youhave installed.
If an object you have installed does not appear in the list, theobject might not be registered. To register an object, clickRegister, select the object to add to the list, and then click Open.
To remove an object from the list, select the object, and then clickUnregister.
4. Click OK.
The object is placed in the display. Depending on how the thirdparty implemented the object, it may be a different size than therectangle you drew.
5. To specify the object’s properties and assign tags or expressionsto its controls, do one of the following:
Right-click the object, and then click Properties to open theobject’s Properties dialog box.
� 9-19Creating and working with graphic objects
Depending on how the third party implemented the object, itmay not have a Properties dialog box. If the Properties menuitem is not available, use the next method.
Right-click the object, and then click Property Panel.
6. In the Properties dialog box or Properties tab of the PropertyPanel, specify the object’s properties.
7. In the Connections tab, assign tags or expressions to the object’scontrols.
8. To close the Properties dialog box, click OK. To close theProperty Panel, click the Close button.
For information about using the Properties dialog box, seepage 9-22. For information about using the Property Panel, seepage 9-24.
Tools and tips for working with objectsThis section describes features of the Graphics Display editor thathelp you work with the objects you create. It describes how to:
select and deselect objects
use the Object Explorer to view and select objects
use an object’s Properties dialog box to configure the object’sproperties and assign tags and expressions to its controls
use the Property Panel to configure individual and group objectproperties, and to assign tags and expressions to individualobjects’ controls
color objects
name objects
test how objects look in different states
Selecting and deselecting objects
To work with an object, you must first select it. You can use theSelect tool or the Object Explorer to select objects.
For information about using the Object Explorer, see page 9-20.
To select the Select tool:
� On the Objects menu, click Select, or on the Objects toolbarclick the Select tool.
The mouse pointer changes to a single arrow.

Preface
9-20 � RSView Machine Edition User’s Guide
To select objects, follow the procedures in this table:
To select Do this
An object or group of objects � Click the object or group.
� In the Object Explorer, click theobject or group.
An object within a group ofobjects
� Double-click the group, and thenclick the object.
� In the Object Explorer, open thegroup, and then click the object.
Several objects Click the first object, and then Ctrl-clickadditional objects.
All objects in an area Click and drag diagonally to draw aselection border around the objects.
Ctrl-click objects outside the border toadd them to the selection.
All objects in the drawing areaor in a group you are editing
On the Edit menu, click Select All, orpress Ctrl-A.
To deselect objects, follow the procedures in this table:
To deselect Do this
An object Ctrl-click the object.
Several objects Hold down Ctrl and drag a selectionborder around the objects.
All selected objects Click in the drawing area, away fromany objects.
Using the Object Explorer
Use the Object Explorer to view and select objects from a tree-list ofall the objects in a display. Groups are listed as expandable items inthe tree, with a + icon.
Use the Object Explorer to select an object that is hidden behindother objects in the display, without bringing it to the front. Objectsare listed in front-to-back order.
The Object Explorer does not show wallpaper objects, nor objectswithin ActiveX composite objects.

� 9-21Creating and working with graphic objects
To open the Object Explorer, use one of these methods:
On the Graphics toolbar, click the Object Explorer tool.
On the View menu, click Object Explorer.
Right-click an object, and then click Object Explorer.
You can keep the Object Explorer open as you work in the GraphicsDisplay editor.
To view the objects in a group:
� Click the + icon next to the group name, or double-click thegroup name.
The list expands to show the objects and groups within thegroup.
If the list is already expanded, double-clicking the group namecollapses the group.
Click the + icon to
view the objects and
groups within a group.
Right-click an object
to open its context
menu.
Object Explorer tool

Preface
9-22 � RSView Machine Edition User’s Guide
To select an object in the Object Explorer:
� Click the object.The object is selected in the Object Explorer and selectionhandles appear around the object in the graphic display.
Double-clicking objects in the Object Explorer
Double-clicking an object in the Object Explorer is the same asdouble-clicking it in the display:
For most graphic objects, including drawing objects,double-clicking the object in the Object Explorer opens theobject’s Properties dialog box.
For ActiveX objects, the behavior of the object whendouble-clicked depends on the vendor’s implementation.
Using the Properties dialog box
Every graphic object has a Properties dialog box that you can use toconfigure the object. Depending on how the vendor implementedthe object, third-party ActiveX objects might have a Propertiesdialog box as well.
The Properties dialog box contains tabs that you can use toconfigure the object’s properties and controls:
In this tab Do this
General Configure the object’s appearance, audio indicator andtouch margins (for buttons), and settings that are uniqueto the object, such as the button action for a pushbutton, whether to use key navigation to select theobject, or whether to link a button to a specific object.
For information about touch margins, see page 10-4.
For information about key navigation, see page 10-8.
For information about linking buttons to objects, seepage 10-9.
States Configure the states for the object, including the valuefor each state and whether to display a caption or imagefor the state.
For information about checking that the states areconfigured the way you intended, see page 9-31.
Label For objects that don’t have multiple states, specifywhether to use a caption or image on the object.
For information about using the Image Browser toselect an image to use in the label, see page 8-22.

� 9-23Creating and working with graphic objects
In this tab Do this
Timing Configure the object’s auto repeat (see page 10-11) orEnter key handshaking (see page 10-12) settings.
Connections Assign tags and expressions to the object’s controls.
For information about assigning tags and expressions,see page 9-32.
The tabs that are available depend on the object:
Some objects have only a General tab.
If an object can have more than one state, the object’s dialog boxcontains a States tab.
The trend and gauge objects have unique tabs that are not listedin the table above.
The tabs that an ActiveX object has depends on the vendor’simplementation, though if you can assign tags or expressions tothe object it has a Connections tab.
To open an object’s Properties dialog box, use one of these
methods:
Double-click the object.
Right-click the object and then click Properties.
Select the object, and then on the Edit menu, click Properties.
In the Property Panel, with the object selected, click the(Custom) property and then click the Browse button.
In the Property Panel, with the object selected, double-click the(Custom) property.
In the Object Explorer, double-click the object.
Browse button

Preface
9-24 � RSView Machine Edition User’s Guide
Click a tab to
select it.
Click Apply to apply your changes
without closing the dialog box. Also,
when you change to a different tab
the changes in the current tab are
applied.
You can also use the Property Panel to configure an object’sproperties, as described next.
For more information about assigning tags and expressions toobjects, see page 9-32. For details about configuring a particularobject, see Chapter 10.
Using the Property Panel
Use the Property Panel to modify the properties of graphic objectsand assign tags and expressions to the objects.
The Property Panel is especially useful for making changes to theproperties of multiple objects at the same time.
To open the Property Panel, use one of these methods:
On the Graphics toolbar, click the Property Panel tool.
On the View menu, click Property Panel.Property Panel tool

� 9-25Creating and working with graphic objects
Right-click an object, and then click Property Panel.
Right-click an empty area of the display, and then click PropertyPanel.
You can keep the Property Panel open as you work in the GraphicsDisplay editor. You can drag the panel’s borders to make theProperty Panel larger or smaller.
Configuring properties
Use the Property Panel’s Properties tab to configure the propertiesof the selected object or objects.
Viewing properties for multiple objects
If multiple objects are selected, you can specify which properties todisplay in the Property Panel:
To view all the properties of all the selected objects, click AllProperties.
To view only the properties that are common to the selectedobjects, click Shared Properties.
Viewing properties for group objects
When you first select a group object, the Property Panel displays thegroup properties only, such as the group’s name and height. To viewand edit the properties of the individual objects within the group,click Include Grouped Objects.
When you click Include Grouped Objects, if Shared Properties isselected, only the properties that are common to the selected objectsare displayed. To view all the properties of all the objects in thegroup, click All Properties.
If different objects in the group have different values assigned to aproperty, the cell next to the property name is blank.

Preface
9-26 � RSView Machine Edition User’s Guide
Click for help on the
selected property.
.. or drag the splitter
bar to see more
properties.
Click for help on the
Property Panel.
Scroll to see more
properties...
If a group object is
selected, click this button
to edit the properties of
the objects within the
group.
Click to Close.
This box describes the
selected property and
indicates the type of data
the property value uses.
If only one object is
selected, this box shows
the object’s name and
type.
To configure an object’s properties:
1. Select one or more objects.
2. Click the Properties tab if it is not already selected.
3. Double-click a property’s row to select the property.
If the property has a list of values associated with it, pressingEnter or double-clicking in the property’s row changes theproperty’s value to the next available value. A down-arrowappears in the right column. Click it to see the options for theproperty.
If the property has a dialog box (such as the Font dialog box)associated with it, double-clicking the row opens the dialog box.
Browse button

� 9-27Creating and working with graphic objects
Or, a Browse button appears in the right column—click it toopen the dialog box.
If the selected object has a dialog box for setting up properties, a(Custom) property appears in the first or second row of the grid.To open the object’s dialog box, double-click the row, or clickthe Browse button.
4. Type the new value for the property, select one from the list, ormake selections from the dialog box.
5. Press Enter or click another cell in the grid to save the change.The selected object is updated with the new property value andits appearance in the display changes, if appropriate.
Assigning tags and expressions to anobject’s controls
Use the Property Panel’s Connections tab to assign tags orexpressions to the selected object’s controls. If multiple objects areselected the tab is blank, because you can assign tags or expressionsto only one object at a time.
How values are updated
The arrows indicate the direction in which the data flows betweenthe control and the data source:
A right arrow indicates that the control sends values to the datasource. The control is a write control.
A left arrow indicates that the data source sends values to thecontrol. The control is a read control.
A double arrow indicates that the data flows in both directions.The control is a read-write control.

Preface
9-28 � RSView Machine Edition User’s Guide
Click for help on the
selected control.
The arrows show the direction in which data flows between the control and
the data source.
This box describes the
selected control and
indicates the type of data
the control uses.
To assign tags and expressions to an object’s controls:
1. Select an object.
2. Click the Connections tab if it is not already selected.
3. Click a control’s row to select it.
4. In the “Tag or expression” column, type a tag name orexpression. You can assign an expression only if the Browsebutton is available in the Exprn column.
To open the Tags dialog box and select a tag, click the Browsebutton in the Tag column. For information about using the Tagsdialog box, see page 7-25.
To open the Expression editor and use it to create an expression,click the Browse button in the Exprn column. For informationabout creating expressions, see Chapter 12.
For the Numeric Input Enable button’s Optional Expressioncontrol, you can assign write expressions only. For informationabout write expressions, see page 12-20.
5. Press Enter or click another row to save the tag or expressionassignment.
For more information about assigning tags and expressions toobjects, see page 9-32.
Browse button in
the Exprn column

� 9-29Creating and working with graphic objects
To delete a tag or expression assignment:
� Click the row and press Delete.
Coloring objects using the color toolbars
The Foreground Color and Background Color toolbars contain aselection of colors you can assign to objects’ color properties.
About color properties
The number of color properties an object has depends on the type ofobject and how you configure it. For example, a button with statescan use up to seven different colors for each state. When you selectcolors using the color toolbars, some properties are assigned theforeground color and some are assigned the background color.Other color properties, such as Fill color, cannot be assigned usingthe color toolbars (instead, use the object’s Properties dialog box orthe Property Panel).
This table lists the color properties you can assign using the colortoolbars:
Property Foreground color Background color
Back color �
Background color �
Border color �
Caption color �
Caption back color �
Fore color �
Foreground color �
Image color �
Image back color �
Legend color �
Needle color �
Pattern color �
For objects with states, the selected color is applied to the currentstate’s color properties only. In the Property Panel, properties thatapply to states have “St_” at the beginning of the property name.

Preface
9-30 � RSView Machine Edition User’s Guide
When to select colors using the toolbars
For all the drawing objects except Image and Panel, you can selectcolors from the color toolbars before you draw an object (eitherbefore or after you click the object’s tool).
The other objects are always drawn using their default colors, butyou can select the objects and then click the toolbars to change theircolors. The toolbars are especially useful for quickly assigning thesame colors to multiple objects.
To display a color toolbar:
� On the View menu, select Toolbars, and then click ForegroundColors or Background Colors.
To close a color toolbar:
� On the View menu, select Toolbars, and then click ForegroundColors or Background Colors, or click the toolbar’s Closebutton.
Other methods for assigning colors
You can also assign colors using an object’s Properties dialog box orthe Property Panel. Use one of these methods if you want to assignseparate colors to different foreground or background colorproperties, or to choose colors that don’t appear in the toolbars.
For example, if you want to use a dark blue background color for abutton, with a light blue background color for its image label, youmust assign the colors separately. Using the toolbar would assign thesame color to both properties.
Also use the Properties dialog box or Property Panel to change thedefault colors for properties that cannot be assigned using the colortoolbars.
Naming objects
Objects (and groups of objects) are automatically given a name andnumber when you create them, for example NumericInputEnable4.If desired, you can assign a more meaningful name to the object, forexample Conveyor_Speed_Input.
The object name appears in the status bar, activity bar, PropertyPanel, and Object Explorer in RSView Studio, and in activity logmessages at runtime.

� 9-31Creating and working with graphic objects
To name an object:
1. Select the object.
2. In the Property Panel, click the Properties tab.
3. Double-click the (Name) row, and then type the name.
The name must start with a letter, and cannot contain spaces. Youcan use the underscore character (_).
To name a group object:
1. Select the group object.
2. In the Property Panel, click the Properties tab.
3. Double-click the (GroupName) row, and then type the name.
The name must start with a letter, and cannot contain spaces. Youcan use the underscore character (_).
Testing how objects look in different states
To make sure the different states for an object are configuredcorrectly, you can view them using the States toolbar or the PropertyPanel.
To open the States toolbar:
� On the View menu, select Toolbars, and then click States.
To view an object’s states using the States toolbar:
1. Select one or more objects.
2. In the States toolbar, select the state to view.
If you selected multiple objects, the toolbar shows the states thatare common to all the objects.
3. To view the next state, select it in the toolbar or press the DownArrow key on your keyboard.
You can also use these keys to select the next state to view:
To view the previous state, press the Up Arrow key.

Preface
9-32 � RSView Machine Edition User’s Guide
To view the first state, press the Home key.
To see the last state, press the End key.
To view an object’s states using the Property Panel:
1. Select one or more objects.
2. In the Property Panel, click the State property and then select thestate to view.
3. To view the next state quickly, double-click the row, or press theEnter key on your keyboard.
Assigning tags and expressions to graphic objects
You can assign tags and expressions to many of the graphic objects,including ActiveX objects (depending, of course, on how the vendorimplemented the object). This section describes how to:
assign tags to graphic objects
use expressions to manipulate tag values
replace tags using tag substitution
use tag placeholders so the same display can be used withdifferent sets of tags
Assigning tags
To assign tags to a graphic object, use one of these
methods:
Double-click the object to open the object’s Properties dialogbox, and then assign tags in the Connections tab.
Type the tag name here... ... or click the button to open
the Tags dialog box.
Select the object and then assign tags in the Connections tab ofthe Property Panel.

� 9-33Creating and working with graphic objects
Type the tag name here... ... or click the button to open
the Tags dialog box.
Select the object, and then on the Edit menu click Connections.Assign tags in the Connections tab of the Properties dialog box.
Right-click the object, and then click Connections. Assign tags inthe Connections tab of the Properties dialog box.
For information about:
using the Tags dialog box, see page 7-25
using the Properties dialog box, see page 9-22
using the Property Panel, see page 9-24
Using expressions to manipulate tag values
Many of the controls to which you can assign a tag also permit theuse of expressions to perform logical or mathematical calculations ontag values. If you assign an expression, RSView monitors theexpression value rather than the original tag value. For example,your machine might send values to the data source in the form oftemperature in degrees Celsius. You could use an expression toconvert the value to degrees Fahrenheit, and then monitor theexpression result rather than the original tag value.
If you can assign an expression, a Browse button is present in theExprn column in the Connections tab.

Preface
9-34 � RSView Machine Edition User’s Guide
Type the expression here... ... or click the Browse button to
open the Expression editor.
To specify an expression, do one of the following:
In the “Tag or expression” column, type the expression.
In the Exprn column click the Browse button and then create anexpression in the Expression editor. Use this method if you wantto check the expression syntax, or to use multiple lines for theexpression.
For more information about expressions, see Chapter 12.
Replacing tags using tag substitution
You can replace tags assigned to the graphic objects in your displayby using tag substitution. You can also replace the tags used inexpressions assigned to graphic objects.
For example, if you assign a tag called HoistHeight to multipleobjects in the display, and then decide to use the tag Hoist_Heightinstead, you can use tag substitution to quickly replace the old tagwith the new tag.
You can replace:
a tag name (with or without folder names)
a folder name
the text in an expression
To replace tags:
1. Select one or more objects.
To select all the objects in the display, on the Edit menu, clickSelect All.
2. On the Edit menu, click Tag Substitution.
To replace the tags for a single object, right-click it and then clickTag Substitution.

� 9-35Creating and working with graphic objects
3. In the Search for box, type the name of the tag, folder, orexpression to replace, or click the down arrow to display a list ofthe possible items you can search for and replace.
To open the Tags dialog box and select a tag, click Tags.
4. In the Replace with box, type the name of the new tag, folder, orexpression.
To open the Tags dialog box and select a tag, click Tags.
5. To confirm each replacement before it is made, check ConfirmReplacements.
To automatically replace all occurrences of the tag, folder, orexpression for the selected object or objects, leave the boxunchecked.
6. Click Replace.
If the Confirm Replacements check box is not selected, alloccurrences of the text in the Search for box are automaticallyreplaced with the text in the Replace with box (for the selectedobject or objects).
If the Confirm Replacements check box is selected, the ConfirmReplacement dialog box opens, showing the objects in which thetext is used. The first object is selected.
7. To replace the text in the selected object, click Replace.
To move to the next object that uses the text string, click Next.
To replace the text for all the objects in the dialog box, clickReplace All.

Preface
9-36 � RSView Machine Edition User’s Guide
8. When all replacements are done, click Cancel to close theConfirm Replacements dialog box. (It closes automatically if youclick Replace All.)
9. To close the Tag Substitution dialog box, click Close.
Using tag placeholders
Tag placeholders provide a way to use one graphic display torepresent a number of similar operations.
For example, suppose you are creating displays for a plant that canscorn and peas. The machinery used in both processes is identical.Instead of creating two displays and specifying corn-related tags inone display and pea-related tags in another, you can create onedisplay and not specify any tag names. Where a tag name is required,type a tag placeholder.
You can use tag placeholders wherever you would normally assign atag to an object, including in expressions. You can also use tagplaceholders in the expressions you create to animate objects.
You can use tag placeholders in:
the graphic display that opens when the project is first run
graphic displays that are opened using a Goto Display button
Use parameter files to specify which tags to substitute for whichplaceholders. For information about creating parameter files, seepage 8-25.
Creating tag placeholders
A tag placeholder is the cross-hatch character (#) followed by anumber from 1 to 500, as shown in this example:
You can use tag placeholders in:
the Connections tab of an object’s Properties dialog box
the Connections tab of the Property Panel

� 9-37Creating and working with graphic objects
the Expression box in the Animation dialog box
To create a tag placeholder:
� Type the cross-hatch character followed by a number (no spacein between). For example, #1.
Performing basic operations on objects
Once you have drawn an object, you can select the object and workwith it. You can:
move objects
copy objects
duplicate objects
resize objects
reshape drawing objects
delete objects
Moving objects
You can move objects using the mouse or the keyboard. The keysgive you fine positioning, allowing you to move objects in smallincrements. You can also use the grid to position objects precisely.
Another option is to position an object using the object’s Top andLeft properties in the Property Panel. For information about usingthe Property Panel, see page 9-24.
Once you’ve moved objects into position, you might want to alignother objects with them, or lock them into place. For informationabout aligning objects, see page 9-47. For information about lockingobjects into position, see page 9-52.
To automatically align objects to the grid as you move
them:
� On the View menu, select Snap On. A check mark appears besidethe menu item when the option is selected.
For information about setting up the grid, see page 8-8.
To move objects by dragging with the mouse:
1. Select one or more objects.

Preface
9-38 � RSView Machine Edition User’s Guide
2. Place the pointer on an object (not on the edge or on thehandles).
3. Drag the objects to the desired position.
Select the object. Drag the object to the
desired position.
If you selected several objects, dragging one of the objects movesall the selected objects. The objects maintain their positionrelative to each other.
To move objects in small increments using the keyboard:
1. Select one or more objects.
2. Place the pointer on the object, not on its edge or handle.
3. Hold down Shift while you press an arrow key.
To adjust the amount of the increment, first hold down the Shiftkey and press the + or - keys on the keyboard’s numeric keypad.
4. Release the Shift key when the object is in place.
Copying objects
To copy objects, you can:
drag and drop objects in the same display
drag and drop objects between displays, or from a graphic libraryto a display
copy and paste objects
When an object is copied, any animation attached to the object isalso copied. If a group is copied, the new copy of the group can beungrouped to individual objects, just like the original.
To drag objects in the same display:
1. Select one or more objects.
2. Drag the object, and then press Ctrl.

� 9-39Creating and working with graphic objects
When you press Ctrl, a plus sign is added to the cursor.
3. When the object is where you want it, release the mouse buttonand then the Ctrl key.
A new copy of the object is created.
If you selected several objects, dragging one of the objects copiesall the selected objects. The objects maintain their positionrelative to each other.
To drag objects between displays:
1. Open both displays (or a graphic library and a display).
2. Position or resize the displays so both are visible.
For more information, see page 8-12.
3. Select one or more objects.
4. Click the selected object and drag it to the new display.
If you selected several objects, dragging one of the objects copiesall the selected objects. The objects maintain their positionrelative to each other.
Copying and pasting objects
You can cut, copy, or paste objects using the menu items on the Editmenu or the buttons on the toolbar.
Once you cut or copy an object, you can paste it anywhere in thedrawing area of:
the same graphic display
a graphic display in the same or a different project
a graphic library in the same or a different project
To cut or copy objects:
1. Select one or more objects.
2. On the Edit menu, click Cut or Copy, or click the Cut or Copytool on the Graphics toolbar.
To remove the original object, click Cut.
To retain the original object, click Copy.
To paste objects:
1. Click in the display or library to paste to.

Preface
9-40 � RSView Machine Edition User’s Guide
2. On the Edit menu, click Paste, or click the Paste tool on theGraphics toolbar.
Duplicating objects
When an object is duplicated, any animation attached to the object isalso duplicated. If a group is duplicated, the new copy of the groupcan be ungrouped to individual objects, just like the original.
To duplicate objects:
1. Select one or more objects.
2. On the Edit menu, click Duplicate, or click the Duplicate tool onthe Graphics toolbar.
The duplicated object is placed slightly offset from the original.
Duplicate also duplicates actions. For example, if you duplicate anobject, move it, and then duplicate it again, the second Duplicatewill, in one step, duplicate and move the object. This is useful forcreating a series of objects with an equal distance between them.
Select object. Duplicate object. Move object. Duplicate again.
Duplicate works until you deselect the object.
Resizing objects
You can resize objects using the mouse or using the keyboard. Thekeys let you resize objects in small increments. You can also use thegrid to resize objects precisely.
Another option is to size an object using the object’s Height andWidth properties in the Property Panel. This method is especiallyuseful for quickly resizing multiple objects to the same size. Forinformation about using the Property Panel, see page 9-24.

� 9-41Creating and working with graphic objects
When you resize text objects, the font size is adjusted to fit the newobject size as closely as possible.
To automatically align objects to the grid as you resize
them:
� On the View menu, select Snap On. A check mark appears besidethe menu item when the option is selected.
For information about setting up the grid, see page 8-8.
To resize an object using the mouse:
1. Select the object.
2. Place the pointer on one of the handles.
A double arrow appears.
3. Drag the handle until the object is the desired size or shape.
Drag a side handle to change width or height, or a corner handleto change both.
For perfect circles and squares, press Ctrl and hold the key downwhile you drag a corner handle.
To maintain the object’s original proportions (width to height),press Shift and hold the key down while you drag a cornerhandle.
To resize an object in small increments using the
keyboard:
1. Select the object.
2. Place the pointer on one of the handles.
A double arrow appears.
3. Hold down Shift and press an arrow key until the object is thedesired size.

Preface
9-42 � RSView Machine Edition User’s Guide
To adjust the amount of the increment, first hold down the Shiftkey and press the + or - keys on the keyboard’s numeric keypad.
Reshaping drawing objects
You can reshape arcs, lines, polygons, polylines, rectangles, roundedrectangles, and wedges.
To reshape lines, rectangles, polylines, and polygons:
1. Select the object you want to reshape.
2. Click the Polygon tool, or right-click the object and then clickEdit.
The cursor changes to the Polygon tool, and handles appear onthe object.
3. Move the cursor over any line or corner of the object.
A handle with a cross-hair appears.
4. Drag the handle until the object is the desired shape.
Dragging from a point along the line (between corners) creates anew angle between the two corners.
5. To delete an angle, position the pointer at the tip of the angle, andthen press Delete.
To reshape arcs and wedges:
1. Select the object you want to reshape.
2. Click the Arc or Wedge tool, or right-click the object and thenclick Edit.
The cursor changes to the Arc or Wedge tool, and handles appearon the object.
3. Place the pointer on one of the handles.
A cross-hair appears.
� 9-43Creating and working with graphic objects
4. Drag the handle until the object is the desired shape.
To reshape rounded rectangles:
1. Select the rounded rectangle.
2. Click the Rounded Rectangle tool, or right-click the object andthen click Edit.
A handle appears inside the rounded rectangle.
3. Click the handle and drag inward to increase roundedness, oroutward to decrease roundedness.
Deleting objects
If you accidentally delete an object, use the Undo tool to restore it.
To delete objects:
1. Select one or more objects.
2. On the Edit menu, click Delete, or press Delete on the keyboard.
To delete all the objects in the display:
� On the Edit menu, click Clear All.
Working with groups of objects
Grouping and ungrouping objects
Grouping combines several objects into a single object so you canmanipulate them as a single object. Grouping is useful for keepingobjects in the same position relative to each other. You can cut, copy,and paste groups, arrange the group as a single object relative toother objects, and apply the same properties to all the members ofthe group at once.
You can attach animation to a group, and any animation attached toindividual objects in the group remains active. The group animationgenerally takes precedence over the animation of individual objectswithin the group. For more information, see page 11-27.
Deleting a group deletes all individual objects in the group.
To group objects:
1. Select all the objects you want grouped.

Preface
9-44 � RSView Machine Edition User’s Guide
2. On the Arrange menu, click Group, or on the Graphics toolbarclick the Group tool.
The handles around each object are replaced by a set of handlesaround the group.
Select the objects. Group them.
... ... ... ... ...
.................................
... ... ... ... ...
.................................
To ungroup objects:
1. Select the group of objects to ungroup.
2. On the Arrange menu, click Ungroup, or on the Graphicstoolbar click the Ungroup tool.
The handles around the group are replaced with handles aroundeach object.
Select the group. Ungroup it.
Ungrouping deletes any animation attached to the group, becausethe group no longer exists. However, animation attached to theindividual objects that were in the group remains active.
� 9-45Creating and working with graphic objects
Editing groups of objects
Edit a group the same way you would edit an individual object. Youcan:
use the Property Panel to apply the same properties to all themembers of the group at once. For example, change the linewidth of all objects in the group to 2 pixels.
For information about using the Property Panel to edit groups ofobjects, see page 9-24.
use the toolbars to apply the same pattern style, backgroundstyle, foreground colors, and background colors to all themembers of the group
for objects with states, use the States toolbar to cycle through thestates and apply the same properties to the states for each objectin the group at once. When you select a group containing objectswith states, only the states that are common to all objects in thegroup appear in the toolbar.
For information about using the States toolbar, see page 9-31.
Editing objects within a group
You can also edit individual objects within the group withoutbreaking the group, which is particularly useful when you haveanimation attached to the group.
To edit objects within a group:
1. Double-click the grouped object, or right-click it and then clickEdit. A hatched border appears around the group.
When the hatched border is around the group, you are in groupedit mode. In this mode, you can select individual objects in thegroup and modify them.
You can also add new objects to the group.

Preface
9-46 � RSView Machine Edition User’s Guide
Double-click to edit the group. A hatched
border appears around the group.
Click again to select an object in the
group. Handles appear to indicate the
object is selected.
2. To select an individual object (or a group) in the group, click it.You can also use the Object Explorer to select objects within thegroup. For details, see page 9-20.
The status bar and Object Explorer indicate which object orgroup is selected.
3. Make your changes to the object.
You can change the selected object’s shape, size, or position, oruse the object’s Properties dialog box or the Property Panel toedit the object’s properties.
4. If desired, create new objects inside the hatched border.
5. To stop editing, click outside the group.
Arranging objectsYou can arrange objects (or groups of objects) in a number of ways.You can:
layer objects by moving them in front of or behind other objects
align objects with each other and with the grid
space objects horizontally or vertically
flip drawing objects horizontally or vertically
rotate drawing objects
lock objects into position
Layering objects
You can layer objects (or groups of objects) on top of each other.Objects are layered in the order they are created, with the mostrecently created object on top. Change the layer order with Send toBack and Bring to Front.

� 9-47Creating and working with graphic objects
Send to Back moves the selected object to the bottom layer.
Bring to Front moves the selected object to the top layer.
To bring an object to the front:
1. Select the object.
To select an object that’s behind another object, place yourpointer on the front object, click once, pause, and then clickagain. Do not double-click and do not move the mouse.
You can also select a concealed object easily by clicking theobject in the Object Explorer.
2. On the Arrange menu, click Bring to Front, or click the Bring toFront tool.
Select the object in
back.
Bring the
object to front.
To send an object to the back:
1. Select an object.
2. On the Arrange menu, click Send to Back, or click the Send toBack tool.
Select the
object.
Send the
object to the
back.
Aligning objects
You can align objects (or groups of objects) with each other andwith the grid.
To align objects:
1. Select the objects you want to align.

Preface
9-48 � RSView Machine Edition User’s Guide
2. On the Arrange menu, click the appropriate menu item, or click atool on the Alignment toolbar:
This tool or menu item Aligns selected objects with
Align Left Left-most selected object
Align Center Horizontal center of all selected objects
Align Right Right-most selected object
Align Top Top-most selected object
Align Middle Vertical center of all selected objects
Align Bottom Bottom-most selected object
Align CenterPoints
Center of all selected objects
Align to Grid Grid
To automatically align objects to the grid as you create or
move them:
� On the View menu, select Snap On. A check mark appears besidethe menu item when the option is selected.
For information about setting up the grid, see page 8-8.

� 9-49Creating and working with graphic objects
Examples: Aligning objects left, right, and center
Select objects. Align left.
Select objects. Align right.
Select objects. Align center.
Examples: Aligning objects top, middle, and bottom
Align
top.
Align
middle.
Align
bottom.

Preface
9-50 � RSView Machine Edition User’s Guide
Spacing objects
With Space Vertical and Space Horizontal, objects (or groups ofobjects) are moved vertically or horizontally to have the sameamount of space from the center point of each object.
To space objects:
1. Select the objects you want to space.
2. On the Arrange menu, click the appropriate menu item, or click atool on the Graphics toolbar:
This tool or menu item Does this
Space Horizontal Places the centers of the selected objectsan equal distance apart horizontally.
Space Vertical Places the centers of the selected objectsan equal distance apart vertically.
Examples: Spacing objects vertically and horizontally
Select objects. Space vertically.
Centers are
separated by
an equal vertical
distance.
Select objects. Space horizontally.
Centers are separated
by an equal horizontal
distance.
Flipping drawing objects
Flipping an object creates a mirror image of the object. You can flipall the drawing objects (or groups of drawing objects) except text,images, and panels.

� 9-51Creating and working with graphic objects
To flip a drawing object:
1. Click the object.
2. On the Arrange menu, click the appropriate menu item, or click atool on the Graphics toolbar:
This tool or menu
item
Flips selected objects
Flip Vertical Top to bottom (upside-down)
FlipHorizontal
Left to right
Examples: Flipping drawing objects vertically and horizontally
Select object. Flip vertical.
Select object. Flip horizontal.
Rotating drawing objects
You can rotate all the drawing objects (or groups of drawing objects)except images, panels, and rounded rectangles.
You can attach rotation animation to the same drawing objects. Withrotation animation, the object rotates around an anchor point toindicate a tag’s value at runtime. For details about rotationanimation, see page 11-22.
When you rotate text, it rotates around the anchor point but the textitself remains upright.

Preface
9-52 � RSView Machine Edition User’s Guide
To rotate a drawing object:
1. On the Objects menu, click Rotate, or on the Objects toolbarclick the Rotate tool.
2. Click the object you want to rotate. A small crosshair circleappears in the middle of the object. This is the anchor point thatis used as the center of rotation.
3. To move the center of rotation, click the cross-hair and drag it toa new anchor position. The anchor can be inside or outside theobject.
You can place the crosshair inside an object...
... or you can place it outside an object.
4. Click on an edge of the object and drag in the direction you wantto rotate it.
To rotate the object in five-degree increments, press Ctrl whileyou drag.
5. When the object is in the desired position, release the mousebutton.
Locking objects into position
You can lock graphic objects (or groups of objects) into position byconverting them to wallpaper. Once you convert objects towallpaper, you cannot select or edit them unless you unlock thewallpaper. Wallpaper objects cannot be animated at runtime.

� 9-53Creating and working with graphic objects
If the grid is on, wallpaper objects are positioned behind the grid.
If you just want to lock the objects into place while you’re workingin the display, unlock the wallpaper when you’re finished. If youwant to use the wallpaper objects as a background for your display,leave the wallpaper locked.
For more information about creating a background for your display,see page 8-15.
To convert objects to wallpaper:
1. Select the objects to convert.
2. On the Edit menu, select Wallpaper, and then click Convert toWallpaper.
For a single object, you can right-click it and then click Convertto Wallpaper.
To unlock the wallpaper:
� On the Edit menu, select Wallpaper, and then click Unlock AllWallpaper.
All objects in the graphic display are converted back to theiroriginal state.


� 10-1Configuring graphic objects
Configuringgraphic objects
This chapter describes how to set up graphic objects. It describeshow to:
work with objects that have states
position objects for touch screens
assign function keys to buttons
use the keyboard to navigate to and select objects
link buttons to lists and trends
repeat a button’s action by holding down the button
ensure values are read by the data source before sending newvalues
use objects’ Properties dialog boxes to set up options for theindividual graphic objects
For objects that are not described in other chapters of the manual,this chapter provides information about how to use the objects.
For information about creating graphic objects, see Chapter 9.
For information about creating and configuring the trend graphicobject, see Chapter 17.
Tips for configuring objects with states
The graphic objects that have configurable states have a States tabin their Properties dialog box.
10Chapter

Preface
10-2 � RSView Machine Edition User’s Guide
To set up the properties for a state:
1. Click the States tab.
2. In the Select state list, click the state.
3. Specify options for the state.
4. Repeat steps 2 and 3 for each additional state, including theerror state if the object has one.
Copying and pasting properties from onestate to another
Often, you’ll want most of the properties to be the same from stateto state, with only one or two settings changing to distinguish thedifferent states.
To simplify setting up states when many of the properties are thesame, you can copy and paste settings from one state to another.
To copy settings from one state to another:
1. In the Select state box, click the state whose settings you want tocopy.
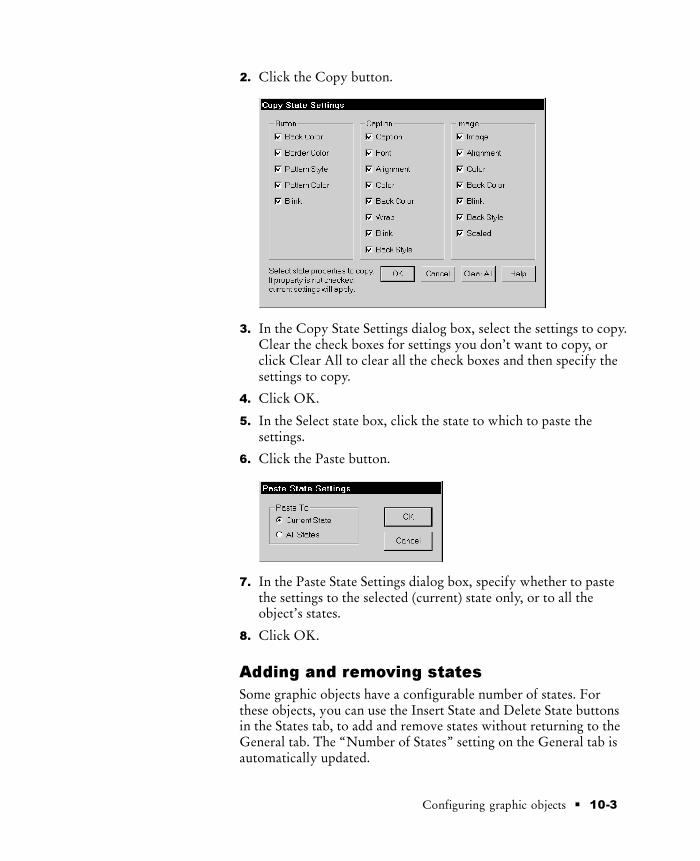
� 10-3Configuring graphic objects
2. Click the Copy button.
3. In the Copy State Settings dialog box, select the settings to copy.Clear the check boxes for settings you don’t want to copy, orclick Clear All to clear all the check boxes and then specify thesettings to copy.
4. Click OK.
5. In the Select state box, click the state to which to paste thesettings.
6. Click the Paste button.
7. In the Paste State Settings dialog box, specify whether to pastethe settings to the selected (current) state only, or to all theobject’s states.
8. Click OK.
Adding and removing states
Some graphic objects have a configurable number of states. Forthese objects, you can use the Insert State and Delete State buttonsin the States tab, to add and remove states without returning to theGeneral tab. The “Number of States” setting on the General tab isautomatically updated.

Preface
10-4 � RSView Machine Edition User’s Guide
Insert State Click a state, and then click Insert State. The newstate is inserted above the selected state.
Delete State Click the state to delete, and then click Delete State.
Setting up how objects are used at runtime
Just as you must provide operators with a way to navigate betweendisplays at runtime, you must also make sure that operators can usethe objects within the displays. The next sections in this chapterdescribe how to set up your objects so the operator can:
access objects using a touch screen
use function keys to press buttons when a mouse or touchscreen is not available on the runtime computer
use the keyboard or keypad to navigate to and select lists,trends, and ActiveX input objects
use buttons to work with lists and trends
repeat a button’s action by pressing and holding it
ensure that tag values are read by the data source before sendingnew values
Positioning objects for touch screens
If the operator will be using a touch screen at runtime, keep thesetips in mind when positioning graphic objects in your displays:
Don’t place important buttons where they’ll be blocked by anOn Top display. The user can’t press a covered button.
Ensure buttons are large enough for users to touch easily.
Use touch margins for buttons that are positioned closetogether, to ensure that the adjacent button is not pressed bymistake.
Using touch margins
Touch margins are touch-insensitive borders inside the button’smargin. If the operator presses on the touch margin, the buttonpress is not registered. Touch margins are useful when buttons arepositioned close to each other and you want to make sure theoperator doesn’t press the wrong button by mistake.
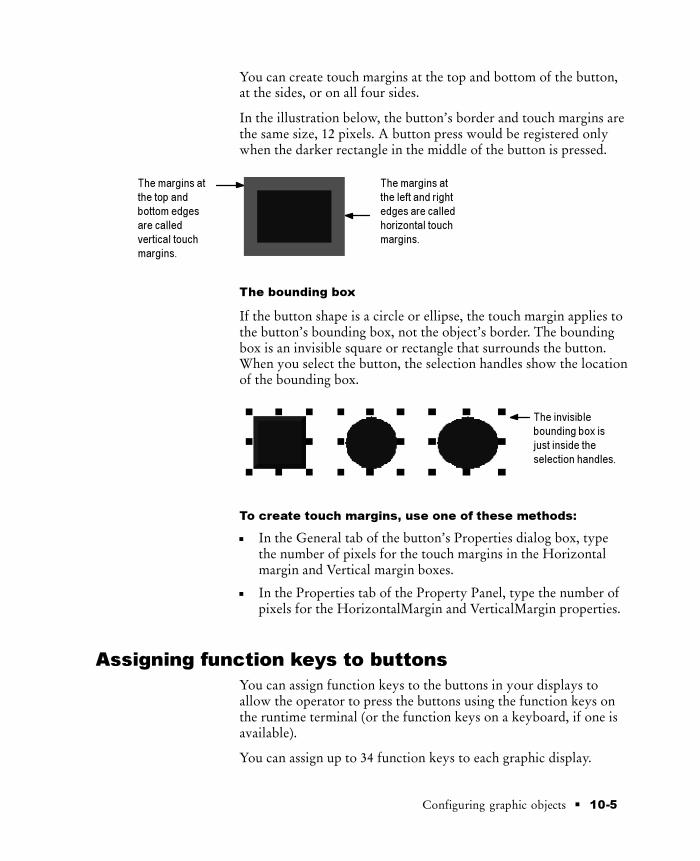
� 10-5Configuring graphic objects
You can create touch margins at the top and bottom of the button,at the sides, or on all four sides.
In the illustration below, the button’s border and touch margins arethe same size, 12 pixels. A button press would be registered onlywhen the darker rectangle in the middle of the button is pressed.
The margins at
the top and
bottom edges
are called
vertical touch
margins.
The margins at
the left and right
edges are called
horizontal touch
margins.
The bounding box
If the button shape is a circle or ellipse, the touch margin applies tothe button’s bounding box, not the object’s border. The boundingbox is an invisible square or rectangle that surrounds the button.When you select the button, the selection handles show the locationof the bounding box.
The invisible
bounding box is
just inside the
selection handles.
To create touch margins, use one of these methods:
In the General tab of the button’s Properties dialog box, typethe number of pixels for the touch margins in the Horizontalmargin and Vertical margin boxes.
In the Properties tab of the Property Panel, type the number ofpixels for the HorizontalMargin and VerticalMargin properties.
Assigning function keys to buttons
You can assign function keys to the buttons in your displays toallow the operator to press the buttons using the function keys onthe runtime terminal (or the function keys on a keyboard, if one isavailable).
You can assign up to 34 function keys to each graphic display.

Preface
10-6 � RSView Machine Edition User’s Guide
Here are some tips for assigning function keys:
Where possible, use the same function keys for the sameoperations in all your graphic displays. For example, if everydisplay contains a Goto Display button that returns the operatorto a graphic display called Main Menu, assign the same functionkey to this button in each display.
Include the name of the function key assigned to a button in acaption on the button.
For buttons with multiple states, include the function key namein the caption for each state, or create a text object to use as alabel for the button (so that you don’t have to configure thecaption for each state), and then group the text and buttontogether.
Function key equivalents
If your project will run on the RAC6182, the function keyscorrespond to the keys F1 to F14 and K1 to K20 on the computer’skeypad.
If your project will run in Windows 2000, the keyboard containsthe function keys F1 to F12 only. The remaining function keys areassociated with these key combinations:
For this function key Use this key combination
F13 Left Shift-F1
F14 Left Shift-F2
K1 - K12 Right Alt-F1 to Right Alt-F12
K13 Right Shift-F1
K14 Right Shift-F2
K15 Right Shift-F3
K16 Right Shift-F4
K17 Right Shift-F5
K18 Right Shift-F6
K19 Right Shift-F7
K20 Right Shift-F8
At runtime, the operator presses the key combination to activatethe object to which the function key is assigned.

� 10-7Configuring graphic objects
To assign function keys to buttons:
1. On the Edit menu, click Key Assignments, or right-click abutton and then click Key Assignments.
The list shows all the buttons in the graphic display to which afunction key can be assigned, and indicates which keys havealready been assigned.
2. In the “Select an object” list, click the button to which to assigna function key.
3. In the “Select a key assignment” box, select the key to assign.
The assigned key appears after the button name in the list.
4. Repeat steps 2 and 3 to assign keys to the other buttons in thedisplay.
5. Click OK to close the dialog box.
To change the function key assigned to a button:
� In the Key Assignment Properties dialog box, select the buttonand then select a new function key.

Preface
10-8 � RSView Machine Edition User’s Guide
Using the keyboard to navigate to and selectobjects
If a mouse or touch screen is not available on the runtime computer,the operator can use the keys on a keyboard or keypad to select(give the input focus to) these objects:
lists: Control List selector, Display List selector, Activity list,and Alarm list
trends
third-party ActiveX input objects
What input focus looks like
The object with focus is surrounded by a highlight box, unless the“Disable Highlight When Object has Focus” box is selected (in theDisplay Settings dialog box). You can specify the color of thehighlight in this dialog box as well. For more information, seepage 8-15.
Highlight box
Using the keys on the keyboard or keypad
When a graphic display opens, the list, trend, or ActiveX inputobject that is closest to the top left corner of the display is selected.The operator can use these keys to move to and select a differentobject:
Use this key To do this
Tab Move from the upper left to thelower right.
Shift-Tab Move from the lower right to theupper left.
Ctrl-arrow key Move left, right, up, or down
Removing objects from the tab sequence
By default, you can use the keys to navigate to all lists, trends, andActiveX input objects in a display. However, you can disable thekey navigation for objects if desired.

� 10-9Configuring graphic objects
When an object’s key navigation is disabled, the operator can stillselect the object using a mouse or touch screen, if available.
To disable key navigation, use one of these methods:
In the Properties tab of the Property Panel, set theKeyNavigation property to False.
In the General tab of the object’s Properties dialog box, clearthe Key navigation box. (This method is not available for trendsand ActiveX objects.)
Linking buttons to lists and trends
The table on page 10-22 lists buttons that work with the trend andlist objects. For the buttons in the list, you can specify whether thebutton works with a specific object only, or whether it works withwhichever trend or list is selected in the display.
If you are creating small graphic displays that don’t have muchroom, you might prefer to use one set of buttons to work with allthe lists and trends in the display.
By default, the buttons are configured to work with whicheverobject has input focus (is selected) in the display.
However, if space isn’t a concern, you can create multiple copies ofthe buttons you want to use and link them to specific lists or trends.One benefit of linking a button to a specific object is that theoperator doesn’t have to select the list or trend before pressing thebutton. Another benefit is that you can position the buttons closeto the specified object, making it easier for the operator tounderstand which buttons work with which objects.

Preface
10-10 � RSView Machine Edition User’s Guide
This object has
input focus.
These Move Up
and Move Down
buttons work with
all the objects in
the display.
Each object has
its own set of
buttons.
To link a button to a specific object using the button’s
Properties dialog box:
1. Double-click the button to open its Properties dialog box.
2. In the General tab, in the “Send press to” box, select LinkedObject.

� 10-11Configuring graphic objects
3. To select from a list of all the objects in the display that you canlink the button to, click the Browse button next to the Linkedobject box.
4. Click the name of the object to link the button to, and then clickOK.
5. Click OK to close the button’s Properties dialog box.
To link a button to a specific object using the Property
Panel:
� In the Properties tab, specify the SendPressTo andLinkedObject properties.
Once you have linked buttons to an object, you might want todisable the object’s key navigation, since this option is no longerneeded. For details, see page 10-8.
Repeating a button’s action by holding down thebutton
To repeat a button’s action by pressing and holding it, set up autorepeat for the button. If you set up auto repeat, when the operatorpresses and holds down the button, repeated button presses areregistered until the operator releases the button.
A button press occurs when the operator clicks an object with themouse, presses it on a touch screen, or presses the function keyassociated with the object. Auto repeat works with all thesemethods of pressing buttons.
Browse button

Preface
10-12 � RSView Machine Edition User’s Guide
You can use auto repeat with these buttons:
For this button Each button press does this
Multistate Push Sends the value for the next state to the data source.External changes to the Value control are notrecognized when the button is in auto repeat mode.
Ramp Sends the new ramped value to the data source.External changes to the Value control are notrecognized when the button is in auto repeat mode.
Move Up Moves the highlight up an item in the list, or scrollsup in the trend.
Move Down Moves the highlight down an item in the list, orscrolls down in the trend.
Page Up Moves the highlight up a page in the list.
Page Down Moves the highlight down a page in the list.
Move Left Scrolls the trend to the left.
Move Right Scrolls the trend to the right.
For each button that uses auto repeat, you can specify:
Auto repeat rate—the number of times per second a buttonpress is registered when the button goes into auto repeat mode.The default rate is 0, which means that auto repeat is disabled.
Auto repeat delay—the length of time the button has to bepressed and held down before auto repeat starts.
To set up auto repeat for a button, use one of these
methods:
In the Timing tab of the button’s Properties dialog box, specifythe Auto repeat rate and Auto repeat delay properties.
In the Properties tab of the Property Panel, specify theAutoRepeatRate and AutoRepeatDelay properties.
Ensuring values are read by the data source beforesending new values
To ensure a value is read by the data source before the operatorsends a new value, use Enter key handshaking. While Enter keyhandshaking is in effect for an object, the operator cannot send anew value to the object’s Value control.
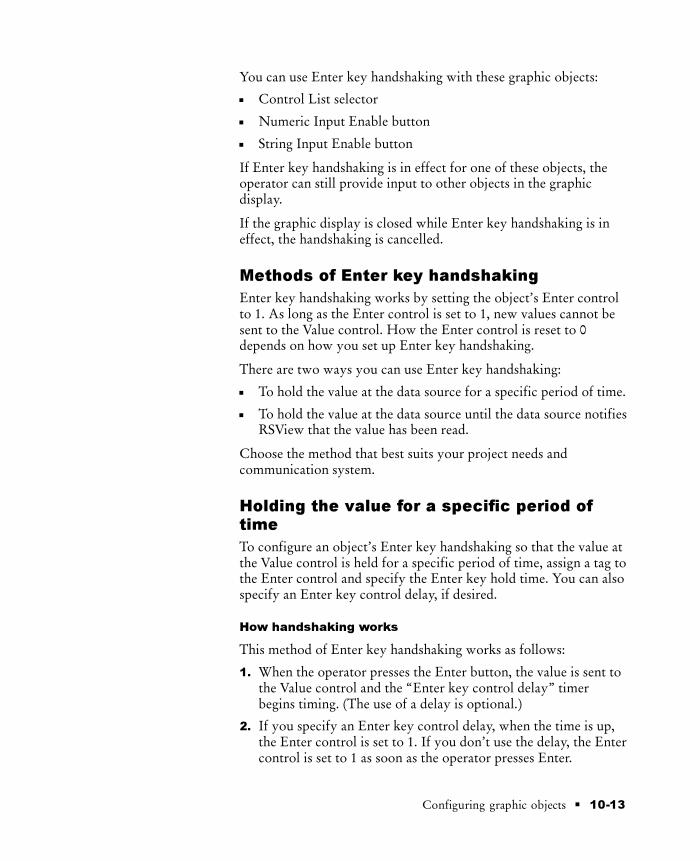
� 10-13Configuring graphic objects
You can use Enter key handshaking with these graphic objects:
Control List selector
Numeric Input Enable button
String Input Enable button
If Enter key handshaking is in effect for one of these objects, theoperator can still provide input to other objects in the graphicdisplay.
If the graphic display is closed while Enter key handshaking is ineffect, the handshaking is cancelled.
Methods of Enter key handshaking
Enter key handshaking works by setting the object’s Enter controlto 1. As long as the Enter control is set to 1, new values cannot besent to the Value control. How the Enter control is reset to 0depends on how you set up Enter key handshaking.
There are two ways you can use Enter key handshaking:
To hold the value at the data source for a specific period of time.
To hold the value at the data source until the data source notifiesRSView that the value has been read.
Choose the method that best suits your project needs andcommunication system.
Holding the value for a specific period oftime
To configure an object’s Enter key handshaking so that the value atthe Value control is held for a specific period of time, assign a tag tothe Enter control and specify the Enter key hold time. You can alsospecify an Enter key control delay, if desired.
How handshaking works
This method of Enter key handshaking works as follows:
1. When the operator presses the Enter button, the value is sent tothe Value control and the “Enter key control delay” timerbegins timing. (The use of a delay is optional.)
2. If you specify an Enter key control delay, when the time is up,the Enter control is set to 1. If you don’t use the delay, the Entercontrol is set to 1 as soon as the operator presses Enter.

Preface
10-14 � RSView Machine Edition User’s Guide
As long as the Enter control is set to 1, the operator cannot sendnew values to the data source.
3. When the Enter control is set to 1, the “Enter key hold time”timer begins timing.
4. When the Enter key hold time has expired, the Enter control isreset to 0 and the operator can send a new value to the Valuecontrol.
To set up Enter Key Handshaking to hold the value for a
specific period of time:
1. In Timing tab of the object’s Properties dialog box, specify theEnter key control delay (optional) and Enter key hold timeproperties.
2. In the Connections tab, assign a tag to the Enter control. Adigital tag is recommended.
You can also use the Property Panel to specify the properties andassign a tag to the Enter control.
Holding the value until the data sourceacknowledges that it has read the value
To configure an object’s Enter key handshaking so that the value atthe Value control is held until the data source notifies RSView thatit has read the value, use two controls: the Enter control and theEnter handshake control.
Instead of using an Enter key hold time, specify an Enter keyhandshake time. You must also specify the Handshake reset type.You can use an Enter key control delay, if desired.

� 10-15Configuring graphic objects
How the Handshake reset type works
How the Enter handshake control resets the Enter control dependson which Handshake reset type you select:
With this Handshake
reset type
The Enter control is set to 0 when
Non-zero value The Enter handshake control has anon-zero value.
If the Enter handshake control already hasa non-zero value when the value is sent tothe Value control (or when the Enter keycontrol delay has expired, if the delay isused), then the Enter control is not set to 1,and Enter key handshaking does not takeplace.
Zero to non-zero transition The Enter handshake control changes from0 to a non-zero value.
Configure the data source to send a non-zero value to the Enterhandshake control when it has read the new value at the Valuecontrol, and then to reset the Enter handshake control to 0.
If the Enter key handshake time expires before the Enter handshakecontrol resets the Enter control, an error message is sent to theactivity log.
How handshaking works
If you use the Enter handshake control, handshaking works likethis:
1. When the operator presses the Enter button, the value is sent tothe Value control and the “Enter key control delay” timerbegins timing. (The use of a delay is optional.)
2. If you specify an Enter key control delay, when the time is up,the Enter control is set to 1. If you don’t use the delay, the Entercontrol is set to 1 as soon as the operator presses Enter.
As long as the Enter control is set to 1, the operator cannot sendnew values to the data source.
If the Handshake reset type is Non-zero value, the Enterhandshake control must be 0 when the delay expires in order toset the Enter control to 1.

Preface
10-16 � RSView Machine Edition User’s Guide
If the data source has already read the value at the Value controland set the Enter handshake control to a non-zero value, it’s notnecessary to set the Enter control to 1. The operator can send anew value to the Value control.
3. When the Enter control is set to 1, the “Enter key handshaketime” timer begins timing.
4. The Enter control remains set until the Enter key handshaketime expires or until reset by the Enter handshake control,whichever happens first.
5. The Enter control is reset to 0 and the operator can send a newvalue to the Value control.
To set up Enter Key Handshaking to hold the value until the
data source has read it:
1. In the Timing tab of the object’s Properties dialog box, specifythese properties:
Enter key control delay (optional)
Enter key handshake time
Handshake reset type
2. In the Connections tab, assign these controls:
Enter—assign a tag. A digital tag is recommended.
Enter handshake—assign a tag or expression.
3. Configure the data source to send a non-zero value to the Enterhandshake control when it has read the new value at the Valuecontrol, and then to reset the Enter handshake control to 0.
You can also use the Property Panel to specify the properties andassign tags to the controls.

� 10-17Configuring graphic objects
Using buttons to operate the project
Use these button graphic objects to operate the project:
Use this button To do this
Return to Displaybutton
Close a display and return to the previous display.For details, see page 19-5.
Close Displaybutton
Close a display. For details, see page 19-6.
Login button Open the Login dialog box and then log in. Fordetails, see page 18-9.
Logout button Log out of the project. For details, see page 18-9.
Display Printbutton
Print the current display. For details, see page 8-35.
Shutdown button Stop the project and close RSView ME Station. Fordetails, see page 19-7.
Acknowledge AllAlarms button
Acknowledge and silence all currentlyunacknowledged alarms. For details, see page 13-30.
Clear AlarmHistory button
Remove all alarms from the alarm log file and allAlarm lists. For details, see page 13-30.
Silence Alarmsbutton
Silence the audio indicator for all current alarms(Windows 2000 projects only). For details, seepage 13-30.
Activity Clear Allbutton
Remove all activity messages from all Activity lists.For details, see page 15-9.
InformationAcknowledgebutton
Acknowledge the current message in the InformationMessage display. For details, see page 14-10.
You can set up any combination of these buttons in a graphicdisplay. For example, you might want to put a Login, Logout, andShutdown button in the same graphic display.
Create and then set up each button separately.
Setting up buttons to operate the project
All of the buttons listed in the previous table are configured thesame way. This section shows how to set up the Login button, butyou can use these instructions to set up any of the buttons in thetable.

Preface
10-18 � RSView Machine Edition User’s Guide
To set up a button:
1. Double-click the button.
2. In the button’s Properties dialog box, fill in the options on eachtab, as described in the sections that follow. When you arefinished, click OK.
Setting up the appearance of the button
In the General tab, specify what the button looks like at runtime.
Border style Click a border style in the list, or click None toremove the border.
Border width Type a number to change the thickness of thebutton’s border. Border width is measured in pixels.
Border uses back color Select the check box if you want thebutton’s border to have the same color as the button’s background.
Clear the check box if you want the button’s border to have adifferent color than the button’s background, and then choose aBorder color.

� 10-19Configuring graphic objects
Back color Click the color box, and then click a color for thebutton’s background.
Border color Click the color box, and then click a color for thebutton’s border.
Back style Click Solid to cover objects or the display backgroundbehind the button. Click Transparent to allow objects or the displaybackground behind the button to show through.
Pattern style Click a pattern style for the button.
Pattern color Click the color box, and then click a color for thepattern.
Highlight color Click the color box, and then click a color for theselection border that appears around the button when it is pressed.If the button does not use a border, the highlight color is not visiblewhen the button is pressed.
Blink Select the check box to make the button blink at runtime.Clear the check box to prevent the button from blinking at runtime.
Shape Click a shape for the button.
Horizontal margin Type the number of pixels for thetouch-insensitive margin inside the object’s left and right edges.
For information about using touch margins, see page 10-4.
Vertical margin Type the number of pixels for thetouch-insensitive margin inside the object’s top and bottom edges.
Audio Select this check box to beep the computer’s internal speakerwhen the operator presses the button.
If the computer running the display does not have an internalspeaker, pressing the button does not trigger a beep.

Preface
10-20 � RSView Machine Edition User’s Guide
Setting up a caption or image for the button
In the Label tab, specify what text or image to display on thebutton.
Caption Type the text you want to appear on the button. If youdon’t want any text on the button, leave the Caption box blank.
Caption back style Click Solid to cover the button’s background(such as a graphic image) with the text. Click Transparent to allowthe button’s background to show through between the letters.
Font, size, and style Click a font for the caption in the font list.Type or click a size for the font in the size box. Click B to make thefont bold, click I to make the font italic, click U to underline thetext.
Caption color Click the color box, and then click a color for thecaption’s text.
Caption back color Click the color box, and then click a color forthe caption’s background.
The caption’s background color is visible only if the Caption backstyle is Solid.

� 10-21Configuring graphic objects
Caption blink Select the check box to make the caption blink atruntime. Clear the check box to prevent the caption from blinkingat runtime.
Word wrap Select this check box to wrap words to the next line ifthey are too long for the width of the caption. Clear this check boxto wrap on characters instead.
Alignment Click a position in the grid, relative to the button. Inthe default alignment position, the text is centered vertically andhorizontally on the button.
Image Type the name of the image file to display on the button, orclick the Browse button to browse for the image.
If you click the Browse button, the Image Browser opens. Click animage in the Select image box, and then click OK.
Image back style Click Solid to cover the button’s backgroundbehind the image. Click Transparent to allow the button’sbackground to show through spaces in the image.
Image color Click the color box, and then click a color for amonochrome image. You cannot change the color of grayscale orcolor images.
Image back color Click the color box, and then click a color forthe background of a monochrome image. You cannot change thebackground color of grayscale or color images.
Image blink Select the check box to make a monochrome imageblink at runtime. Clear the check box to prevent the image fromblinking at runtime. You cannot make grayscale or color imagesblink.
Image scaled Select the check box to scale the image to fit the areaof the button. Clear this check box to crop the image to the area ofthe button if it is too large to fit on the button.
Browse button
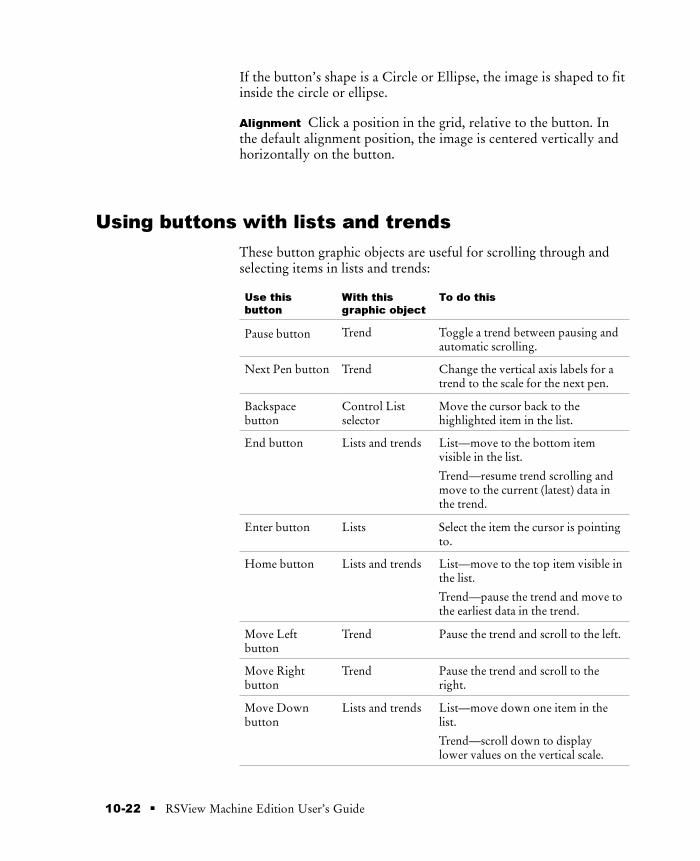
Preface
10-22 � RSView Machine Edition User’s Guide
If the button’s shape is a Circle or Ellipse, the image is shaped to fitinside the circle or ellipse.
Alignment Click a position in the grid, relative to the button. Inthe default alignment position, the image is centered vertically andhorizontally on the button.
Using buttons with lists and trends
These button graphic objects are useful for scrolling through andselecting items in lists and trends:
Use this
button
With this
graphic object
To do this
Pause button Trend Toggle a trend between pausing andautomatic scrolling.
Next Pen button Trend Change the vertical axis labels for atrend to the scale for the next pen.
Backspacebutton
Control Listselector
Move the cursor back to thehighlighted item in the list.
End button Lists and trends List—move to the bottom itemvisible in the list.
Trend—resume trend scrolling andmove to the current (latest) data inthe trend.
Enter button Lists Select the item the cursor is pointingto.
Home button Lists and trends List—move to the top item visible inthe list.
Trend—pause the trend and move tothe earliest data in the trend.
Move Leftbutton
Trend Pause the trend and scroll to the left.
Move Rightbutton
Trend Pause the trend and scroll to theright.
Move Downbutton
Lists and trends List—move down one item in thelist.
Trend—scroll down to displaylower values on the vertical scale.
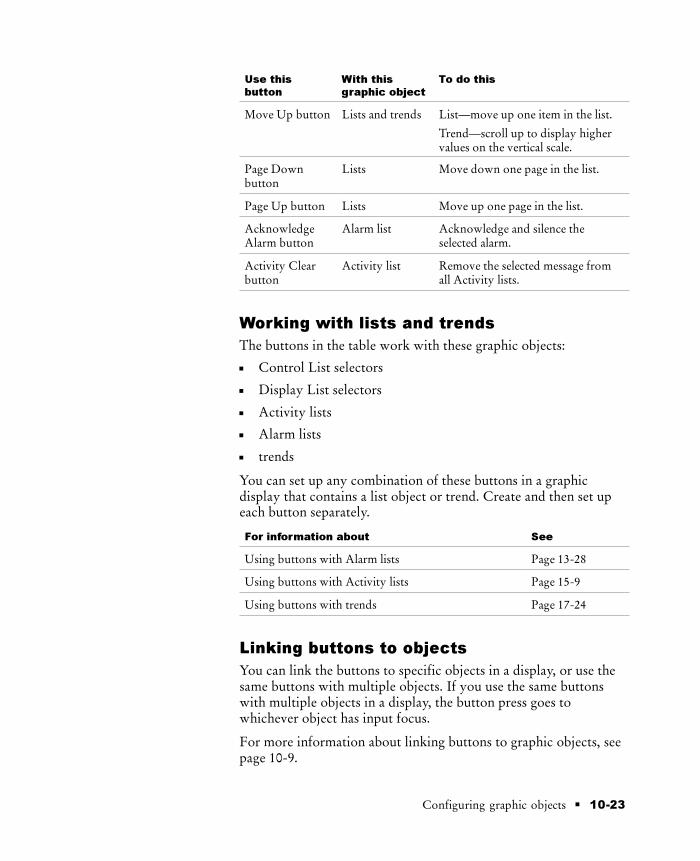
� 10-23Configuring graphic objects
Use this
button
To do thisWith this
graphic object
Move Up button Lists and trends List—move up one item in the list.
Trend—scroll up to display highervalues on the vertical scale.
Page Downbutton
Lists Move down one page in the list.
Page Up button Lists Move up one page in the list.
AcknowledgeAlarm button
Alarm list Acknowledge and silence theselected alarm.
Activity Clearbutton
Activity list Remove the selected message fromall Activity lists.
Working with lists and trends
The buttons in the table work with these graphic objects:
Control List selectors
Display List selectors
Activity lists
Alarm lists
trends
You can set up any combination of these buttons in a graphicdisplay that contains a list object or trend. Create and then set upeach button separately.
For information about See
Using buttons with Alarm lists Page 13-28
Using buttons with Activity lists Page 15-9
Using buttons with trends Page 17-24
Linking buttons to objects
You can link the buttons to specific objects in a display, or use thesame buttons with multiple objects. If you use the same buttonswith multiple objects in a display, the button press goes towhichever object has input focus.
For more information about linking buttons to graphic objects, seepage 10-9.

Preface
10-24 � RSView Machine Edition User’s Guide
Setting up buttons to use with lists and trends
All of the buttons listed in the previous table are configured thesame way, except that the Move Up, Move Down, Move Left,Move Right, Page Up, and Page Down buttons can be set up toauto repeat. The other buttons have no auto repeat function.
This section shows how to set up the Move Up button, but you canuse these instructions to set up any of the buttons in the table.
To set up a button:
1. Double-click the button.
2. In the button’s Properties dialog box, fill in the options on eachtab, as described in the sections that follow. When you arefinished, click OK.
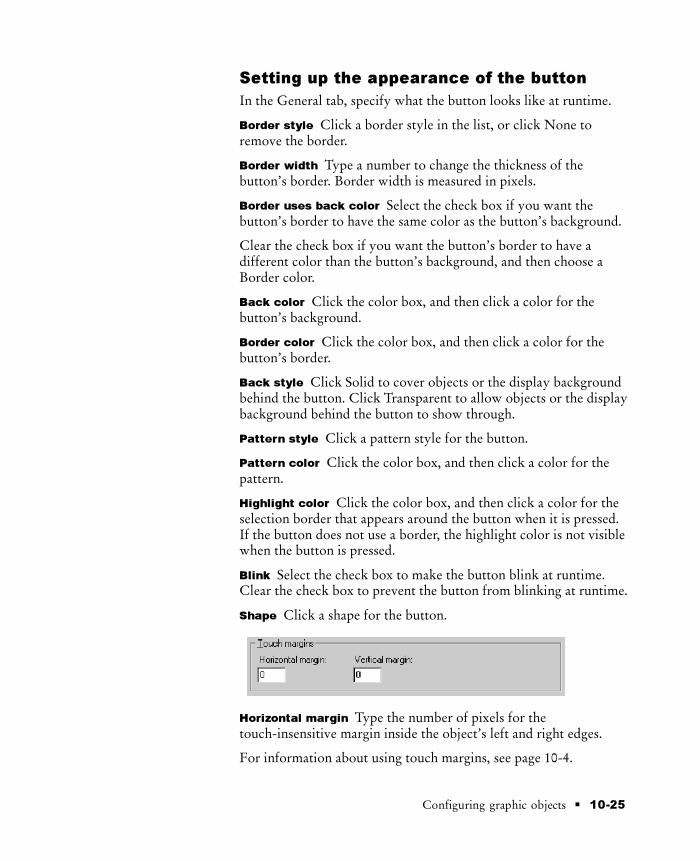
� 10-25Configuring graphic objects
Setting up the appearance of the button
In the General tab, specify what the button looks like at runtime.
Border style Click a border style in the list, or click None toremove the border.
Border width Type a number to change the thickness of thebutton’s border. Border width is measured in pixels.
Border uses back color Select the check box if you want thebutton’s border to have the same color as the button’s background.
Clear the check box if you want the button’s border to have adifferent color than the button’s background, and then choose aBorder color.
Back color Click the color box, and then click a color for thebutton’s background.
Border color Click the color box, and then click a color for thebutton’s border.
Back style Click Solid to cover objects or the display backgroundbehind the button. Click Transparent to allow objects or the displaybackground behind the button to show through.
Pattern style Click a pattern style for the button.
Pattern color Click the color box, and then click a color for thepattern.
Highlight color Click the color box, and then click a color for theselection border that appears around the button when it is pressed.If the button does not use a border, the highlight color is not visiblewhen the button is pressed.
Blink Select the check box to make the button blink at runtime.Clear the check box to prevent the button from blinking at runtime.
Shape Click a shape for the button.
Horizontal margin Type the number of pixels for thetouch-insensitive margin inside the object’s left and right edges.
For information about using touch margins, see page 10-4.

Preface
10-26 � RSView Machine Edition User’s Guide
Vertical margin Type the number of pixels for thetouch-insensitive margin inside the object’s top and bottom edges.
Audio Select this check box to beep the computer’s internal speakerwhen the operator presses the button.
If the computer running the display does not have an internalspeaker, pressing the button does not trigger a beep.
Send press to Click Object With Focus to send the button’s pressaction to the object that is selected on the display.
Click Linked Object to send the button’s press action to the objectto which the button is linked.
For more information about linking buttons to graphic objects, seepage 10-9.
Linked object Click the Browse button, and then click the objectyou want to link the button to.
Setting up a caption or image for the button
In the Label tab, specify what text or image to display on thebutton.
Browse button

� 10-27Configuring graphic objects
Caption Type the text you want to appear on the button. If youdon’t want any text on the button, leave the Caption box blank.
Caption back style Click Solid to cover the button’s background(such as a graphic image) with the text. Click Transparent to allowthe button’s background to show through between the letters.
Font, size, and style Click a font for the caption in the font list.Type or click a size for the font in the size box. Click B to make thefont bold, click I to make the font italic, click U to underline thetext.
Caption color Click the color box, and then click a color for thecaption’s text.
Caption back color Click the color box, and then click a color forthe caption’s background.
The caption’s background color is visible only if the Caption backstyle is Solid.
Caption blink Select the check box to make the caption blink atruntime. Clear the check box to prevent the caption from blinkingat runtime.

Preface
10-28 � RSView Machine Edition User’s Guide
Word wrap Select this check box to wrap words to the next line ifthey are too long for the width of the caption. Clear this check boxto wrap on characters instead.
Alignment Click a position in the grid, relative to the button. Inthe default alignment position, the text is centered vertically andhorizontally on the button.
Image Type the name of the image file to display on the button, orclick the Browse button to browse for the image.
If you click the Browse button, the Image Browser opens. Click animage in the Select image box, and then click OK.
Image back style Click Solid to cover the button’s backgroundbehind the image. Click Transparent to allow the button’sbackground to show through spaces in the image.
Image color Click the color box, and then click a color for amonochrome image. You cannot change the color of grayscale orcolor images.
Image back color Click the color box, and then click a color forthe background of a monochrome image. You cannot change thebackground color of grayscale or color images.
Image blink Select the check box to make a monochrome imageblink at runtime. Clear the check box to prevent the image fromblinking at runtime. You cannot make grayscale or color imagesblink.
Image scaled Select the check box to scale the image to fit the areaof the button. Clear this check box to crop the image to the area ofthe button if it is too large to fit on the button.
If the button’s shape is a Circle or Ellipse, the image is shaped to fitinside the circle or ellipse.
Alignment Click a position in the grid, relative to the button. Inthe default alignment position, the image is centered vertically andhorizontally on the button.
Browse button

� 10-29Configuring graphic objects
Setting up whether the button press repeatswhen held down
The Timing tab is available only for the Move Up, Move Down,Move Left, Move Right, Page Up, and Page Down buttons.
In the Timing tab, set up whether or not the button press repeatsautomatically when the operator presses and holds the buttondown. You can also set up the rate at which the button pressrepeats.
For more information about auto repeat, see page 10-11.
Auto repeat rate Select the number of times per second a buttonpress is registered when the button goes into auto repeat mode.If you don’t want the button press to repeat automatically, click 0.
Auto repeat delay Click the number of milliseconds or secondsthe button must remain pressed before auto repeat starts.
How to use push buttonsPush buttons start or stop processes or actions by changing tagvalues.
IMPORTANT Never use push buttons for emergency stops.Emergency stop buttons must always be hard-wired.
You can use different kinds of push buttons, depending on whatkind of machinery you are running or process you are controlling:
Momentary Push buttons change a tag to one value when thebutton is pressed, and another value when the button is released.Momentary push buttons work like the Pulse button on a foodprocessor. The machine is on only while the button is held down.When the button is released, the machine turns off. Momentarypush buttons are useful for jogging a motor, and they can be set upto start and stop a machine or process.

Preface
10-30 � RSView Machine Edition User’s Guide
Maintained Push buttons toggle between two values. This type ofbutton is useful for changing a setting within a machine or process,but not for starting the machine or process. For example, use theMaintained Push button for changing modes, such as Auto toManual, or Metric to Imperial.
Latched Push buttons latch in the on position, and must beunlatched by another button or process to return to the offposition. This type of button is useful for starting a machine orprocess.
Multistate Push buttons allow an operator to cycle throughmultiple options consecutively, using a single button. The currentstate of a process or operation is displayed on the button by adifferent color, caption, or image for each state.
Interlocked Push buttons work in groups, and share the same tag.The buttons work together like the preset station selector buttonson a car radio: pressing one button cancels another. AlthoughInterlocked Push buttons work as a group, you add them to thedisplay one at a time.
Ramp buttons increase or decrease the value of a tag by either aninteger or floating point value. You can use two ramp buttonstogether to create an increase/decrease control, for example for thespeed of a motor.
Setting up Momentary Push buttonsUse the Momentary Push button to start a process or action. Whenpressed, the button changes a tag to one value, and when released,the button changes the tag to another value.
The Momentary Push button’s states can perform one of threekinds of actions:
Change the Value control to 1 when the button is pressed, andto zero when the button is released. This kind of button is callednormally open, because its released state is off. Pressing thebutton completes the circuit.
Change the Value control to zero when the button is pressed,and to 1 when the button is released. This kind of button iscalled normally closed, because its released state is on. Pressingthe button breaks the circuit.
Change the Value control to a value you specify. You assign thedesired values to the button’s press and release actions. Forexample, 50 when pressed, and 100 when released.

� 10-31Configuring graphic objects
To set up a Momentary Push button:
1. Double-click the Momentary Push button.
2. In the Momentary Push Button Properties dialog box, fill in theoptions on each tab, as described in the sections that follow.When you are finished, click OK.
Setting up the appearance and action of theMomentary Push button
In the General tab, specify what the Momentary Push button lookslike at runtime, and what type of action the button performs.

Preface
10-32 � RSView Machine Edition User’s Guide
Border style Click a border style in the list, or click None toremove the border.
Border width Type a number to change the thickness of thebutton’s border. Border width is measured in pixels.
Border uses back color Select the check box if you want thebutton’s border to have the same color as the button’s background.
Clear the check box if you want the button’s border to have adifferent color than the button’s background, and then choose aBorder color on the States tab.
Highlight color Click the color box, and then click a color for theselection border that appears around the button when it is pressed.If the button does not use a border, the highlight color is not visiblewhen the button is pressed.
Back style Click Solid to cover objects or the display backgroundbehind the button. Click Transparent to allow objects or the displaybackground behind the button to show through.
Shape Click a shape for the button.
Button action Click Normally open to change the button’s tag to1 when the button is pressed, and zero when the button is released.
Click Normally closed to change the button’s tag to zero when thebutton is pressed, and 1 when the button is released.
Click Value to specify values for each of the button’s states. Typevalues on the States tab, described on page 10-33.
Hold time Select the amount of time the button remains pressedbefore the Release action takes effect, even if the operator releasesthe button sooner.
The hold time should reflect network traffic. Increasing the holdtime prevents a very quick object press from being missed by theprogrammable controller. If you are using a memory tag, click theshortest hold time.
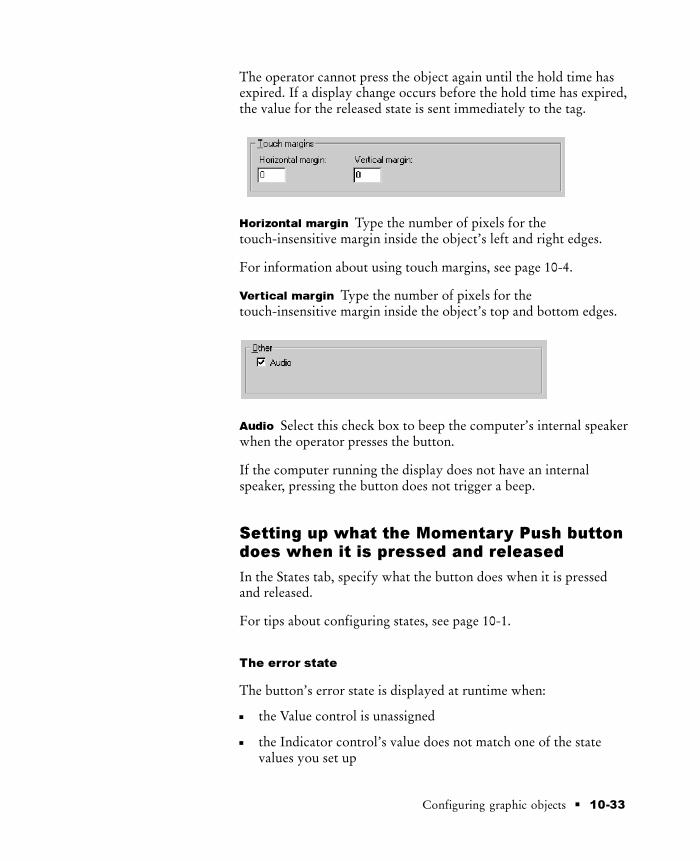
� 10-33Configuring graphic objects
The operator cannot press the object again until the hold time hasexpired. If a display change occurs before the hold time has expired,the value for the released state is sent immediately to the tag.
Horizontal margin Type the number of pixels for thetouch-insensitive margin inside the object’s left and right edges.
For information about using touch margins, see page 10-4.
Vertical margin Type the number of pixels for thetouch-insensitive margin inside the object’s top and bottom edges.
Audio Select this check box to beep the computer’s internal speakerwhen the operator presses the button.
If the computer running the display does not have an internalspeaker, pressing the button does not trigger a beep.
Setting up what the Momentary Push buttondoes when it is pressed and released
In the States tab, specify what the button does when it is pressedand released.
For tips about configuring states, see page 10-1.
The error state
The button’s error state is displayed at runtime when:
the Value control is unassigned
the Indicator control’s value does not match one of the statevalues you set up
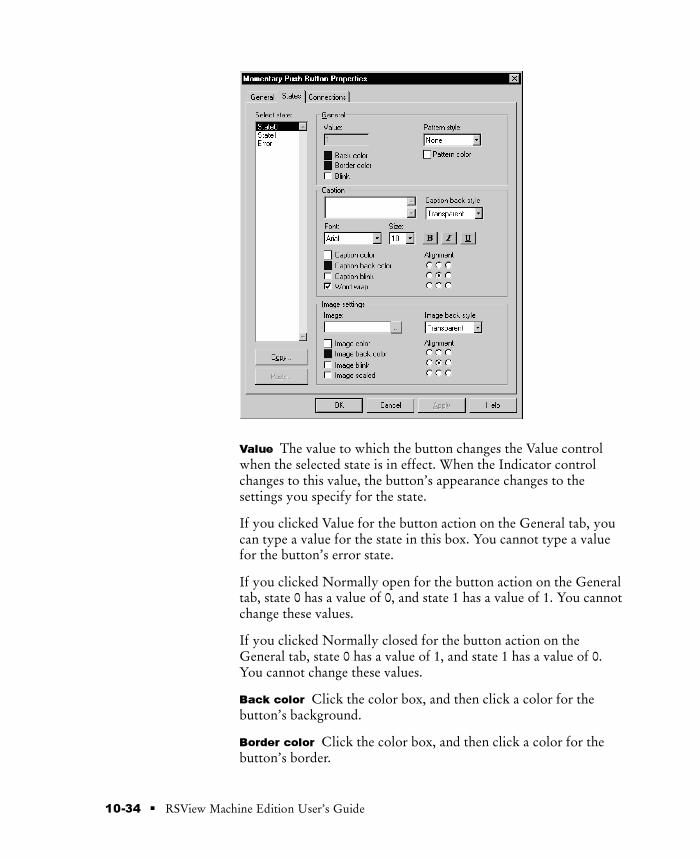
Preface
10-34 � RSView Machine Edition User’s Guide
Value The value to which the button changes the Value controlwhen the selected state is in effect. When the Indicator controlchanges to this value, the button’s appearance changes to thesettings you specify for the state.
If you clicked Value for the button action on the General tab, youcan type a value for the state in this box. You cannot type a valuefor the button’s error state.
If you clicked Normally open for the button action on the Generaltab, state 0 has a value of 0, and state 1 has a value of 1. You cannotchange these values.
If you clicked Normally closed for the button action on theGeneral tab, state 0 has a value of 1, and state 1 has a value of 0.You cannot change these values.
Back color Click the color box, and then click a color for thebutton’s background.
Border color Click the color box, and then click a color for thebutton’s border.

� 10-35Configuring graphic objects
Blink Select the check box to make the button blink at runtime.Clear the check box to prevent the button from blinking at runtime.
Pattern style Click a pattern style for the button.
Pattern color Click the color box, and then click a color for thepattern.
Caption Type the text you want to appear on the button. If youdon’t want any text on the button, leave the Caption box blank.
Caption back style Click Solid to cover the button’s background(such as a graphic image) with the text. Click Transparent to allowthe button’s background to show through between the letters.
Font, size, and style Click a font for the caption in the Font list.Type or click a size for the font in the Size box. Click B to make thefont bold, click I to make the font italic, click U to underline thetext.
Caption color Click the color box, and then click a color for thecaption’s text.
Caption back color Click the color box, and then click a color forthe caption’s background.
The caption’s background color is visible only if the Caption backstyle is Solid.
Caption blink Select the check box to make the caption blink atruntime. Clear the check box to prevent the caption from blinkingat runtime.
Word wrap Select this check box to wrap words to the next line ifthey are too long for the width of the caption. Clear this check boxto wrap on characters instead.
Alignment Click a position in the grid, relative to the button. Inthe default alignment position, the text is centered vertically andhorizontally on the button.

Preface
10-36 � RSView Machine Edition User’s Guide
Image Type the name of the image file to display on the button, orclick the Browse button to browse for the image.
If you click the Browse button, the Image Browser opens. Click animage in the Select image box, and then click OK.
Image back style Click Solid to cover the button’s backgroundbehind the image. Click Transparent to allow the button’sbackground to show through spaces in the image.
Image color Click the color box, and then click a color for amonochrome image. You cannot change the color of grayscale orcolor images.
Image back color Click the color box, and then click a color forthe background of a monochrome image. You cannot change thebackground color of grayscale or color images.
Image blink Select the check box to make a monochrome imageblink at runtime. Clear the check box to prevent the image fromblinking at runtime. You cannot make grayscale or color imagesblink.
Image scaled Select the check box to scale the image to fit the areaof the button. Clear this check box to crop the image to the area ofthe button if it is too large to fit on the button.
If the button’s shape is a Circle or Ellipse, the image is shaped to fitinside the circle or ellipse.
Alignment Click a position in the grid, relative to the button. Inthe default alignment position, the image is centered vertically andhorizontally on the button.
Browse button

� 10-37Configuring graphic objects
Connecting the Momentary Push buttonto data
In the Connections tab, specify the tags or expression with whichbutton exchanges data. For information about assigning tags andexpressions, see page 9-32.
Type the tag name,
or expression if
applicable, here.
The arrow shows
whether the control
is a read control
(arrow points left),
a write control
(arrow points right),
or a read and write
control
(double-headed
arrow).
Value The Value control triggers the button’s action. For example,when the tag assigned to the control is set to 1, the data sourcestarts a motor.
Indicator The Indicator control provides visual feedback to thebutton of its state. For example, the control can show whether amotor is running. If you assign this control, the button does notdisplay the pressed state until it receives a response from theIndicator control. Configure the data source to change the Indicatorcontrol’s value when it has read the Value control’s value.
Setting up Maintained Push buttons
Use the Maintained Push button to change a setting in a machine orprocess. Maintained push buttons are not useful for starting orstopping a machine or process.
When pressed the first time, the Maintained Push button changes atag to one value. When pressed and released a second time, thebutton changes the tag to another value.
To set up a Maintained Push button:
1. Double-click the Maintained Push button.

Preface
10-38 � RSView Machine Edition User’s Guide
2. In the Maintained Push Button Properties dialog box, fill in theoptions on each tab, as described in the sections that follow.When you are finished, click OK.
Setting up the appearance of the MaintainedPush button and how it changes state
In the General tab, specify what the button looks like at runtime,and how the button changes state.
Border style Click a border style in the list, or click None toremove the border.
Border width Type a number to change the thickness of thebutton’s border. Border width is measured in pixels.
Border uses back color Select the check box if you want thebutton’s border to have the same color as the button’s background.
Clear the check box if you want the button’s border to have adifferent color than the button’s background, and then choose aBorder color on the States tab.
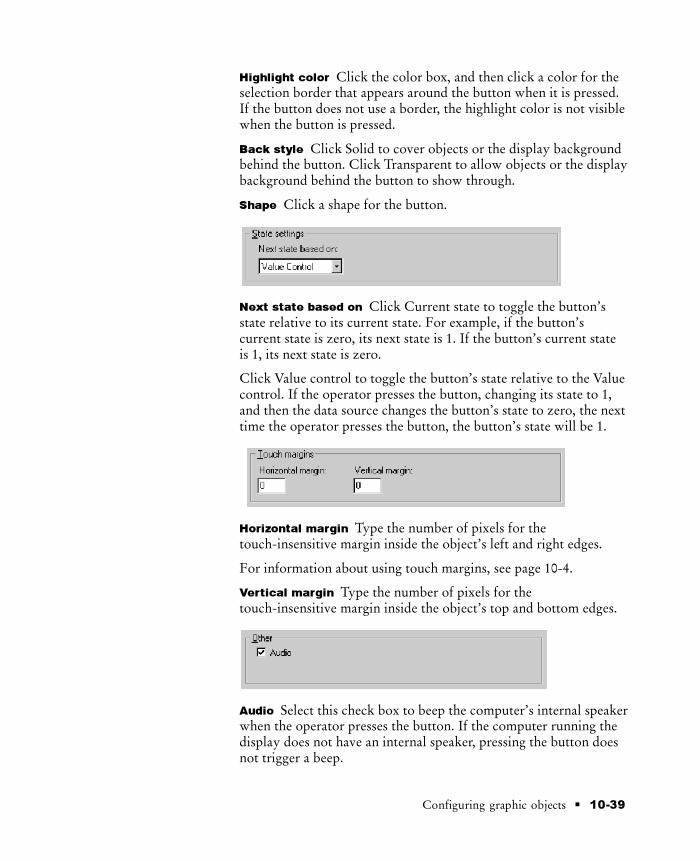
� 10-39Configuring graphic objects
Highlight color Click the color box, and then click a color for theselection border that appears around the button when it is pressed.If the button does not use a border, the highlight color is not visiblewhen the button is pressed.
Back style Click Solid to cover objects or the display backgroundbehind the button. Click Transparent to allow objects or the displaybackground behind the button to show through.
Shape Click a shape for the button.
Next state based on Click Current state to toggle the button’sstate relative to its current state. For example, if the button’scurrent state is zero, its next state is 1. If the button’s current stateis 1, its next state is zero.
Click Value control to toggle the button’s state relative to the Valuecontrol. If the operator presses the button, changing its state to 1,and then the data source changes the button’s state to zero, the nexttime the operator presses the button, the button’s state will be 1.
Horizontal margin Type the number of pixels for thetouch-insensitive margin inside the object’s left and right edges.
For information about using touch margins, see page 10-4.
Vertical margin Type the number of pixels for thetouch-insensitive margin inside the object’s top and bottom edges.
Audio Select this check box to beep the computer’s internal speakerwhen the operator presses the button. If the computer running thedisplay does not have an internal speaker, pressing the button doesnot trigger a beep.

Preface
10-40 � RSView Machine Edition User’s Guide
Setting up what the Maintained Push buttondoes when it is pressed and released
In the States tab, specify what the button does when it is pressedand released.
For tips about configuring states, see page 10-1.
The error state
The button’s error state is displayed at runtime when:
the Value control is unassigned
the Indicator control’s value does not match one of the statevalues you set up
The error state is also displayed when the display containing theMaintained Push button first opens, if the Value control’s valuedoes not match one of the state values you set up.
Value The value to which the button changes the Value controlwhen the selected state is in effect. When the Indicator controlchanges to this value, the button’s appearance changes to thesettings you specify for the state.

� 10-41Configuring graphic objects
Back color Click the color box, and then click a color for thebutton’s background.
Border color Click the color box, and then click a color for thebutton’s border.
Blink Select the check box to make the button blink at runtime.Clear the check box to prevent the button from blinking at runtime.
Pattern style Click a pattern style for the button.
Pattern color Click the color box, and then click a color for thepattern.
Caption Type the text you want to appear on the button. If youdon’t want any text on the button, leave the Caption box blank.
Caption back style Click Solid to cover the button’s background(such as a graphic image) with the text. Click Transparent to allowthe button’s background to show through between the letters.
Font, size, and style Click a font for the caption in the Font list.Type or click a size for the font in the Size box. Click B to make thefont bold, click I to make the font italic, click U to underline thetext.
Caption color Click the color box, and then click a color for thecaption’s text.
Caption back color Click the color box, and then click a color forthe caption’s background.
The caption’s background color is visible only if the Caption backstyle is Solid.
Caption blink Select the check box to make the caption blink atruntime. Clear the check box to prevent the caption from blinkingat runtime.
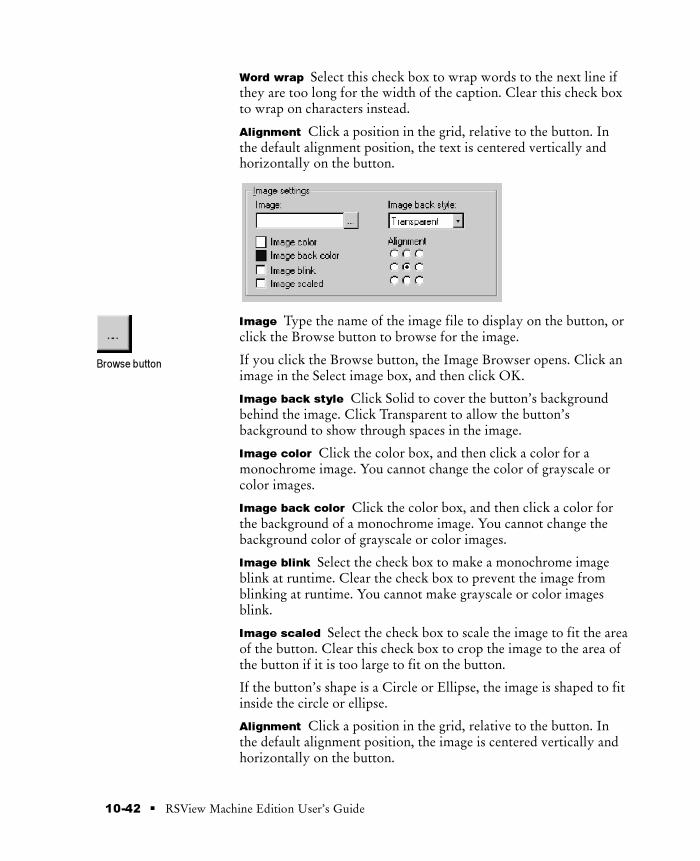
Preface
10-42 � RSView Machine Edition User’s Guide
Word wrap Select this check box to wrap words to the next line ifthey are too long for the width of the caption. Clear this check boxto wrap on characters instead.
Alignment Click a position in the grid, relative to the button. Inthe default alignment position, the text is centered vertically andhorizontally on the button.
Image Type the name of the image file to display on the button, orclick the Browse button to browse for the image.
If you click the Browse button, the Image Browser opens. Click animage in the Select image box, and then click OK.
Image back style Click Solid to cover the button’s backgroundbehind the image. Click Transparent to allow the button’sbackground to show through spaces in the image.
Image color Click the color box, and then click a color for amonochrome image. You cannot change the color of grayscale orcolor images.
Image back color Click the color box, and then click a color forthe background of a monochrome image. You cannot change thebackground color of grayscale or color images.
Image blink Select the check box to make a monochrome imageblink at runtime. Clear the check box to prevent the image fromblinking at runtime. You cannot make grayscale or color imagesblink.
Image scaled Select the check box to scale the image to fit the areaof the button. Clear this check box to crop the image to the area ofthe button if it is too large to fit on the button.
If the button’s shape is a Circle or Ellipse, the image is shaped to fitinside the circle or ellipse.
Alignment Click a position in the grid, relative to the button. Inthe default alignment position, the image is centered vertically andhorizontally on the button.
Browse button

� 10-43Configuring graphic objects
Connecting the Maintained Push buttonto data
In the Connections tab, specify the tags or expression with whichthe button exchanges data. For information about assigning tagsand expressions, see page 9-32.
Type the tag name,
or expression if
applicable, here.
The arrow shows
whether the control
is a read control
(arrow points left),
a write control
(arrow points right),
or a read and write
control
(double-headed
arrow).
Value The Value control triggers the button’s action. For example,when the tag assigned to the control is set to 1, the data sourcechanges the machine to Auto mode.
Indicator The Indicator control provides visual feedback to thebutton of its state. For example, the control can show which modea machine is using. If you assign this control, the button does notdisplay the pressed state until it receives a response from theIndicator control. Configure the data source to change the Indicatorcontrol’s value when it has read the Value control’s value.
Setting up Latched Push buttonsThe Latched Push button latches in the on position, and must beunlatched by another button or process to return to the offposition.
Latched Push buttons work like Momentary Push buttons, exceptthat the tag doesn’t change to the button’s release value until thebutton is unlatched by another button or process. This type ofbutton is useful for starting a machine or process.
When the operator presses a Latched Push button, it changes a tagto one value, and remains at that value until the operator pressesanother button to change the Handshake control to a differentvalue.
To set up a Latched Push button:
1. Double-click the Latched Push button.
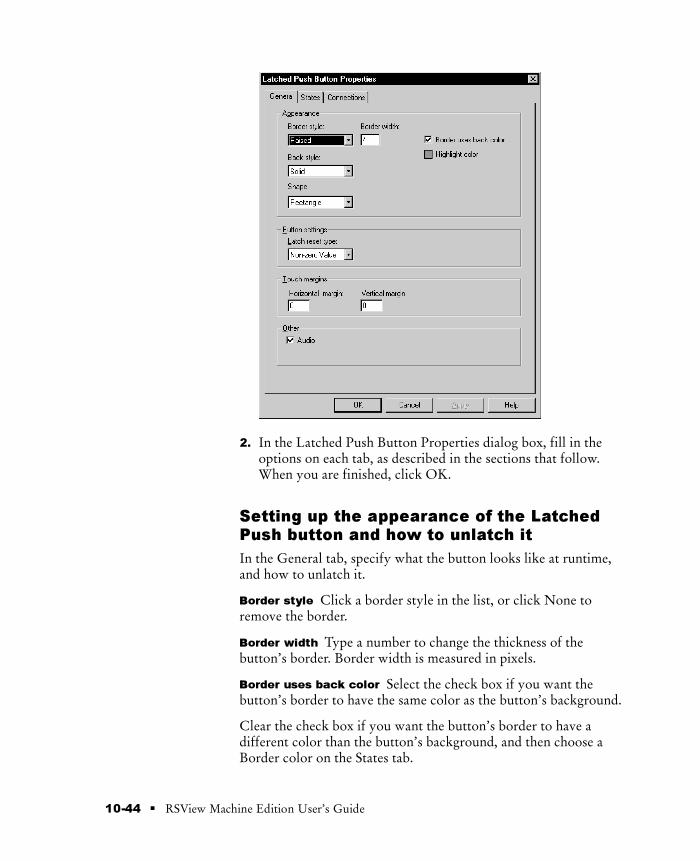
Preface
10-44 � RSView Machine Edition User’s Guide
2. In the Latched Push Button Properties dialog box, fill in theoptions on each tab, as described in the sections that follow.When you are finished, click OK.
Setting up the appearance of the LatchedPush button and how to unlatch it
In the General tab, specify what the button looks like at runtime,and how to unlatch it.
Border style Click a border style in the list, or click None toremove the border.
Border width Type a number to change the thickness of thebutton’s border. Border width is measured in pixels.
Border uses back color Select the check box if you want thebutton’s border to have the same color as the button’s background.
Clear the check box if you want the button’s border to have adifferent color than the button’s background, and then choose aBorder color on the States tab.

� 10-45Configuring graphic objects
Highlight color Click the color box, and then click a color for theselection border that appears around the button when it is pressed.If the button does not use a border, the highlight color is not visiblewhen the button is pressed.
Back style Click Solid to cover objects or the display backgroundbehind the button. Click Transparent to allow objects or the displaybackground behind the button to show through.
Shape Click a shape for the button.
Latch reset type To unlatch the push button when the Handshakecontrol has a non-zero value, click Non-zero Value.
To unlatch the push button when the Handshake control changesfrom a zero to a non-zero value, click Zero to Non-zero transition.
Be sure to assign values to states 0 (unlatched) and 1 (latched) onthe States tab, and assign a tag or expression to the Handshakecontrol in the Connections tab.
Horizontal margin Type the number of pixels for thetouch-insensitive margin inside the object’s left and right edges.
For information about using touch margins, see page 10-4.
Vertical margin Type the number of pixels for thetouch-insensitive margin inside the object’s top and bottom edges.
Audio Select this check box to beep the computer’s internal speakerwhen the operator presses the button.
If the computer running the display does not have an internalspeaker, pressing the button does not trigger a beep.

Preface
10-46 � RSView Machine Edition User’s Guide
Setting up what the Latched Push buttondoes when it is latched and unlatched
In the States tab, specify what the button does when it is latchedand unlatched.
For tips about configuring states, see page 10-1.
The error state
The button’s error state is displayed at runtime when:
the Value control is unassigned
the Indicator control’s value does not match one of the statevalues you set up
The error state is also displayed when the display containing theLatched Push button first opens, if the Value control’s value doesnot match one of the state values you set up.
Value The value to which the button changes the Value controlwhen the selected state is in effect. When the Indicator controlchanges to this value, the button’s appearance changes to thesettings you specify for the state.

� 10-47Configuring graphic objects
Back color Click the color box, and then click a color for thebutton’s background.
Border color Click the color box, and then click a color for thebutton’s border.
Blink Select the check box to make the button blink at runtime.Clear the check box to prevent the button from blinking at runtime.
Pattern style Click a pattern style for the button.
Pattern color Click the color box, and then click a color for thepattern.
Caption Type the text you want to appear on the button. If youdon’t want any text on the button, leave the Caption box blank.
Caption back style Click Solid to cover the button’s background(such as a graphic image) with the text. Click Transparent to allowthe button’s background to show through between the letters.
Font, size, and style Click a font for the caption in the Font list.Type or click a size for the font in the Size box. Click B to make thefont bold, click I to make the font italic, click U to underline thetext.
Caption color Click the color box, and then click a color for thecaption’s text.
Caption back color Click the color box, and then click a color forthe caption’s background.
The caption’s background color is visible only if the Caption backstyle is Solid.
Caption blink Select the check box to make the caption blink atruntime. Clear the check box to prevent the caption from blinkingat runtime.

Preface
10-48 � RSView Machine Edition User’s Guide
Word wrap Select this check box to wrap words to the next line ifthey are too long for the width of the caption. Clear this check boxto wrap on characters instead.
Alignment Click a position in the grid, relative to the button. Inthe default alignment position, the text is centered vertically andhorizontally on the button.
Image Type the name of the image file to display on the button, orclick the Browse button to browse for the image.
If you click the Browse button, the Image Browser opens. Click animage in the Select image box, and then click OK.
Image back style Click Solid to cover the button’s backgroundbehind the image. Click Transparent to allow the button’sbackground to show through spaces in the image.
Image color Click the color box, and then click a color for amonochrome image. You cannot change the color of grayscale orcolor images.
Image back color Click the color box, and then click a color forthe background of a monochrome image. You cannot change thebackground color of grayscale or color images.
Image blink Select the check box to make a monochrome imageblink at runtime. Clear the check box to prevent the image fromblinking at runtime. You cannot make grayscale or color imagesblink.
Image scaled Select the check box to scale the image to fit the areaof the button. Clear this check box to crop the image to the area ofthe button if it is too large to fit on the button.
If the button’s shape is a Circle or Ellipse, the image is shaped to fitinside the circle or ellipse.
Alignment Click a position in the grid, relative to the button. Inthe default alignment position, the image is centered vertically andhorizontally on the button.
Browse button

� 10-49Configuring graphic objects
Connecting the Latched Push button to data
In the Connections tab, specify the tags or expressions with whichthe button exchanges data. For information about assigning tagsand expressions, see page 9-32.
Type the tag name,
or expression if
applicable, here.
The arrow shows
whether the control
is a read control
(arrow points left),
a write control
(arrow points right),
or a read and write
control
(double-headed
arrow).
Value The Value control triggers the button’s action. For example,when the tag assigned to the control is set to 1, the data sourcestarts a motor.
Indicator The Indicator control provides visual feedback to thebutton of its state. For example, the control can show whether amotor is running. If you assign this control, the button does notdisplay the pressed state until it receives a response from theIndicator control. Configure the data source to change the Indicatorcontrol’s value when it has read the Value control’s value.
Handshake To unlatch the button, the Handshake control workswith the “Latch reset type” setting (on the General tab, seepage 10-45).
Depending on which latch reset method you select, the Handshakecontrol unlatches the button either when the Handshake controlhas a non-zero value, or when the Handshake control changes froma zero to a non-zero value.
Setting up Multistate Push buttonsThe Multistate Push button displays—and allows an operator tocycle through—multiple options consecutively. The Multistate Pushbutton displays the current state of a process or operation byshowing a different color, caption, or image to reflect differentstates.
Each time the operator presses the button, the tag changes to thevalue for the next state. When the button is in its last state and theoperator presses the button, the button returns to its first state.
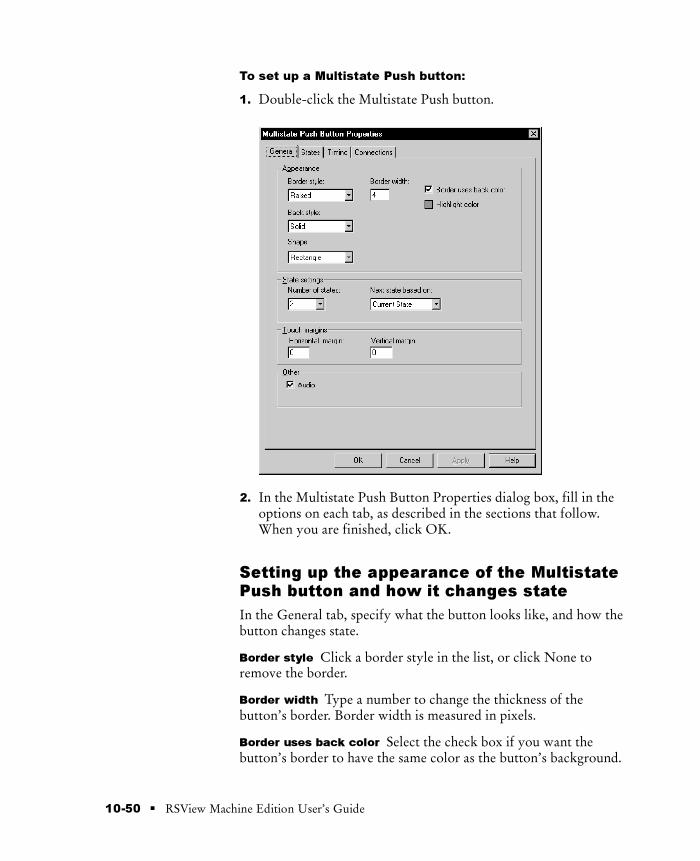
Preface
10-50 � RSView Machine Edition User’s Guide
To set up a Multistate Push button:
1. Double-click the Multistate Push button.
2. In the Multistate Push Button Properties dialog box, fill in theoptions on each tab, as described in the sections that follow.When you are finished, click OK.
Setting up the appearance of the MultistatePush button and how it changes state
In the General tab, specify what the button looks like, and how thebutton changes state.
Border style Click a border style in the list, or click None toremove the border.
Border width Type a number to change the thickness of thebutton’s border. Border width is measured in pixels.
Border uses back color Select the check box if you want thebutton’s border to have the same color as the button’s background.

� 10-51Configuring graphic objects
Clear the check box if you want the button’s border to have adifferent color than the button’s background, and then choose aBorder color on the States tab. For details, see page 10-53.
Highlight color Click the color box, and then click a color for theselection border that appears around the button when it is pressed.If the button does not use a border, the highlight color is not visiblewhen the button is pressed.
Back style Click Solid to cover objects or the display backgroundbehind the button. Click Transparent to allow objects or the displaybackground behind the button to show through.
Shape Click a shape for the button.
Number of states Click the number of states you want the buttonto have.
Select only as many states as you want to use. If you don’t assignvalues to all the states the button has, the operator must press thebutton repeatedly through all the empty states before the first statebecomes available again.
Next state based on When the operator presses the button, thenext state that is displayed can be based on the current state, or onthe value of the Value control.
Click Current state to use the current state as the basis for decidingwhat the next state will be. With this method, the button itselfdetermines what its next state will be.
Click Value control to use the Value control as the basis fordeciding what the next state will be. With this method, otherdevices can change the Value control’s value, and determine whatthe button’s next state will be.
If the Value control does not match one of the button’s state values,the button changes to State 0, and changes the Value control to thevalue of State 0.

Preface
10-52 � RSView Machine Edition User’s Guide
Horizontal margin Type the number of pixels for thetouch-insensitive margin inside the object’s left and right edges.
For information about using touch margins, see page 10-4.
Vertical margin Type the number of pixels for thetouch-insensitive margin inside the object’s top and bottom edges.
Audio Select this check box to beep the computer’s internal speakerwhen the operator presses the button.
If the computer running the display does not have an internalspeaker, pressing the button does not trigger a beep.
Setting up what the Multistate Push buttondoes when it is pressed and released
In the States tab, specify what the button does when it is pressedand released.
For tips about configuring states, see page 10-1.
The error state
The button’s error state is displayed at runtime when:
the Value control is unassigned
the Indicator control’s value does not match one of the statevalues you set up
The error state is also displayed when the display containing theMultistate Push button first opens, if the Value control’s value doesnot match one of the state values you set up.

� 10-53Configuring graphic objects
Value The value to which the button changes the Value controlwhen the selected state is in effect. When the Indicator controlchanges to this value, the button’s appearance changes to thesettings you specify for the state.
Back color Click the color box, and then click a color for thebutton’s background.
Border color Click the color box, and then click a color for thebutton’s border.
Blink Select the check box to make the button blink at runtime.Clear the check box to prevent the button from blinking at runtime.
Pattern style Click a pattern style for the button.
Pattern color Click the color box, and then click a color for thepattern.

Preface
10-54 � RSView Machine Edition User’s Guide
Caption Type the text you want to appear on the button. If youdon’t want any text on the button, leave the Caption box blank.
Caption back style Click Solid to cover the button’s background(such as a graphic image) with the text. Click Transparent to allowthe button’s background to show through between the letters.
Font, size, and style Click a font for the caption in the Font list.Type or click a size for the font in the Size box. Click B to make thefont bold, click I to make the font italic, click U to underline thetext.
Caption color Click the color box, and then click a color for thecaption’s text.
Caption back color Click the color box, and then click a color forthe caption’s background.
The caption’s background color is visible only if the Caption backstyle is Solid.
Caption blink Select the check box to make the caption blink atruntime. Clear the check box to prevent the caption from blinkingat runtime.
Word wrap Select this check box to wrap words to the next line ifthey are too long for the width of the caption. Clear this check boxto wrap on characters instead.
Alignment Click a position in the grid, relative to the button. Inthe default alignment position, the text is centered vertically andhorizontally on the button.

� 10-55Configuring graphic objects
Image Type the name of the image file to display on the button, orclick the Browse button to browse for the image.
If you click the Browse button, the Image Browser opens. Click animage in the Select image box, and then click OK.
Image back style Click Solid to cover the button’s backgroundbehind the image. Click Transparent to allow the button’sbackground to show through spaces in the image.
Image color Click the color box, and then click a color for amonochrome image. You cannot change the color of grayscale orcolor images.
Image back color Click the color box, and then click a color forthe background of a monochrome image. You cannot change thebackground color of grayscale or color images.
Image blink Select the check box to make a monochrome imageblink at runtime. Clear the check box to prevent the image fromblinking at runtime. You cannot make grayscale or color imagesblink.
Image scaled Select the check box to scale the image to fit the areaof the button. Clear this check box to crop the image to the area ofthe button if it is too large to fit on the button.
If the button’s shape is a Circle or Ellipse, the image is shaped to fitinside the circle or ellipse.
Alignment Click a position in the grid, relative to the button. Inthe default alignment position, the image is centered vertically andhorizontally on the button.
Setting up whether the Multistate Pushbutton press repeats when held down
In the Timing tab, set up whether or not the button press repeatsautomatically when the operator presses and holds the buttondown. You can also set up the rate at which the button pressrepeats.
Browse button
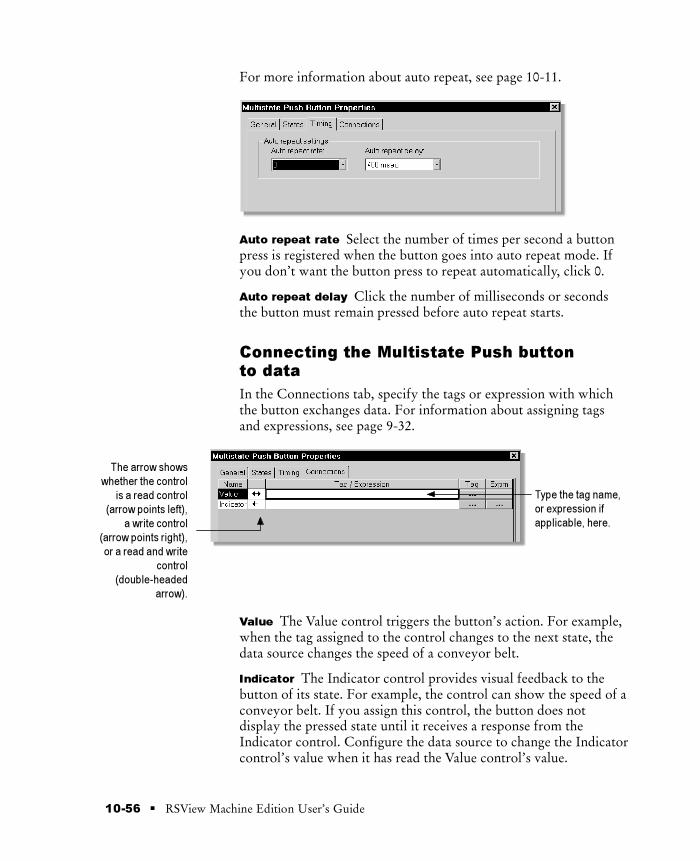
Preface
10-56 � RSView Machine Edition User’s Guide
For more information about auto repeat, see page 10-11.
Auto repeat rate Select the number of times per second a buttonpress is registered when the button goes into auto repeat mode. Ifyou don’t want the button press to repeat automatically, click 0.
Auto repeat delay Click the number of milliseconds or secondsthe button must remain pressed before auto repeat starts.
Connecting the Multistate Push buttonto data
In the Connections tab, specify the tags or expression with whichthe button exchanges data. For information about assigning tagsand expressions, see page 9-32.
Type the tag name,
or expression if
applicable, here.
The arrow shows
whether the control
is a read control
(arrow points left),
a write control
(arrow points right),
or a read and write
control
(double-headed
arrow).
Value The Value control triggers the button’s action. For example,when the tag assigned to the control changes to the next state, thedata source changes the speed of a conveyor belt.
Indicator The Indicator control provides visual feedback to thebutton of its state. For example, the control can show the speed of aconveyor belt. If you assign this control, the button does notdisplay the pressed state until it receives a response from theIndicator control. Configure the data source to change the Indicatorcontrol’s value when it has read the Value control’s value.

� 10-57Configuring graphic objects
Setting up Interlocked Push buttons
Multiple Interlocked Push buttons work together and share thesame tag.
The buttons work together like the preset station selector buttonson a car radio: pressing one button cancels another. AlthoughInterlocked Push buttons work as a group, you add them to thedisplay one at a time.
When the operator presses one of the Interlocked Push buttons, thetag assigned to its Value control changes to one value. When theoperator presses a different Interlocked Push button, the tagchanges to another value. Assign the same tag to each button’sValue control.
To set up an Interlocked Push button:
1. Double-click the Interlocked Push button.
2. In the Interlocked Push Button Properties dialog box, fill in theoptions on each tab, as described in the sections that follow.When you are finished, click OK.

Preface
10-58 � RSView Machine Edition User’s Guide
Setting up the Interlocked Push button’sappearance and value
In the General tab, specify the button’s appearance, and the value itsends to the Value control.
Border style Click a border style in the list, or click None toremove the border.
Border width Type a number to change the thickness of thebutton’s border. Border width is measured in pixels.
Border uses back color Select the check box if you want thebutton’s border to have the same color as the button’s background.
Clear the check box if you want the button’s border to have adifferent color than the button’s background, and then choose aBorder color on the States tab.
Highlight color Click the color box, and then click a color for theselection border that appears around the button when it is pressed.If the button does not use a border, the highlight color is not visiblewhen the button is pressed.
Back style Click Solid to cover objects or the display backgroundbehind the button. Click Transparent to allow objects or the displaybackground behind the button to show through.
Shape Click a shape for the button.
Button value Type an integer value for the button. When theoperator presses the button, the button changes to State 1, andchanges the Value control to this value.
Horizontal margin Type the number of pixels for thetouch-insensitive margin inside the object’s left and right edges.
For information about using touch margins, see page 10-4.

� 10-59Configuring graphic objects
Vertical margin Type the number of pixels for thetouch-insensitive margin inside the object’s top and bottom edges.
Audio Select this check box to beep the computer’s internal speakerwhen the operator presses the button.
If the computer running the display does not have an internalspeaker, pressing the button does not trigger a beep.
Setting up the appearance of theInterlocked Push button when it is pressedand released
In the States tab, specify what the button looks like when it ispressed and released at runtime.
For tips about configuring states, see page 10-1.

Preface
10-60 � RSView Machine Edition User’s Guide
Back color Click the color box, and then click a color for thebutton’s background.
Border color Click the color box, and then click a color for thebutton’s border.
Blink Select the check box to make the button blink at runtime.Clear the check box to prevent the button from blinking at runtime.
Pattern style Click a pattern style for the button.
Pattern color Click the color box, and then click a color for thepattern.
Caption Type the text you want to appear on the button. If youdon’t want any text on the button, leave the Caption box blank.
Caption back style Click Solid to cover the button’s background(such as a graphic image) with the text. Click Transparent to allowthe button’s background to show through between the letters.
Font, size, and style Click a font for the caption in the Font list.Type or click a size for the font in the Size box. Click B to make thefont bold, click I to make the font italic, click U to underline thetext.
Caption color Click the color box, and then click a color for thecaption’s text.
Caption back color Click the color box, and then click a color forthe caption’s background.
The caption’s background color is visible only if the Caption backstyle is Solid.
Caption blink Select the check box to make the caption blink atruntime. Clear the check box to prevent the caption from blinkingat runtime.

� 10-61Configuring graphic objects
Word wrap Select this check box to wrap words to the next line ifthey are too long for the width of the caption. Clear this check boxto wrap on characters instead.
Alignment Click a position in the grid, relative to the button. Inthe default alignment position, the text is centered vertically andhorizontally on the button.
Image Type the name of the image file to display on the button, orclick the Browse button to browse for the image.
If you click the Browse button, the Image Browser opens. Click animage in the Select image box, and then click OK.
Image back style Click Solid to cover the button’s backgroundbehind the image. Click Transparent to allow the button’sbackground to show through spaces in the image.
Image color Click the color box, and then click a color for amonochrome image. You cannot change the color of grayscale orcolor images.
Image back color Click the color box, and then click a color forthe background of a monochrome image. You cannot change thebackground color of grayscale or color images.
Image blink Select the check box to make a monochrome imageblink at runtime. Clear the check box to prevent the image fromblinking at runtime. You cannot make grayscale or color imagesblink.
Image scaled Select the check box to scale the image to fit the areaof the button. Clear this check box to crop the image to the area ofthe button if it is too large to fit on the button.
If the button’s shape is a Circle or Ellipse, the image is shaped to fitinside the circle or ellipse.
Alignment Click a position in the grid, relative to the button. Inthe default alignment position, the image is centered vertically andhorizontally on the button.
Browse button

Preface
10-62 � RSView Machine Edition User’s Guide
Connecting the Interlocked Push buttonto data
In the Connections tab, specify the tag with which the buttonexchanges data. Interlocked push buttons have no Indicator control.For information about assigning tags, see page 9-32.
Type the tag name
here.
The arrow shows
whether the control
is a read control
(arrow points left),
a write control
(arrow points right),
or a read and write
control
(double-headed
arrow).
Value The Value control triggers the button’s action. For example,when the tag assigned to the control is set to 1, the data sourcechanges the machine to Auto mode.
Setting up Ramp buttons
Use the Ramp button to increase or decrease the value of a tag.
Ramp buttons can change a tag by either an integer or floatingpoint value. You can use two ramp buttons together to create anincrease/decrease control.
Each time the operator presses the button, the tag changes to thenext highest or next lowest value, depending on how you set up thebutton.
To set up a Ramp button:
1. Double-click the Ramp button.

� 10-63Configuring graphic objects
2. In the Ramp Push Button Properties dialog box, fill in theoptions on each tab, as described in the sections that follow.When you are finished, click OK.
Setting up the appearance of the Rampbutton and how it works
In the General tab, specify what the button looks like, and whetherthe button ramps a value up or down.
Border style Click a border style in the list, or click None toremove the border.
Border width Type a number to change the thickness of thebutton’s border. Border width is measured in pixels.
Border uses back color Select the check box if you want thebutton’s border to have the same color as the button’s background.
Clear the check box if you want the button’s border to have adifferent color than the button’s background, and then choose aBorder color.

Preface
10-64 � RSView Machine Edition User’s Guide
Back color Click the color box, and then click a color for thebutton’s background.
Border color Click the color box, and then click a color for thebutton’s border.
Back style Click Solid to cover objects or the display backgroundbehind the button. Click Transparent to allow objects or the displaybackground behind the button to show through.
Pattern style Click a pattern style for the button.
Pattern color Click the color box, and then click a color for thepattern.
Highlight color Click the color box, and then click a color for theselection border that appears around the button when it is pressed.If the button does not use a border, the highlight color is not visiblewhen the button is pressed.
Shape Click a shape for the button.
Blink Select the check box to make the button blink at runtime.Clear the check box to prevent the button from blinking at runtime.
Ramp up Click Ramp up to increase the value of the tag.
Ramp down Click Ramp down to decrease the value of the tag.
Upper limit This box appears only if you click Ramp up. Type theupper limit for the tag’s value.
Lower limit This box appears only if you click Ramp down. Typethe lower limit for the tag’s value.
Ramp value Type the positive value by which the button increasesor decreases the tag’s value.

� 10-65Configuring graphic objects
Horizontal margin Type the number of pixels for thetouch-insensitive margin inside the object’s left and right edges.
For information about using touch margins, see page 10-4.
Vertical margin Type the number of pixels for thetouch-insensitive margin inside the object’s top and bottom edges.
Audio Select this check box to beep the computer’s internal speakerwhen the operator presses the button.
If the computer running the display does not have an internalspeaker, pressing the button does not trigger a beep.
Setting up a caption and image for the Rampbutton
In the Label tab, specify what text or image appears on the button.
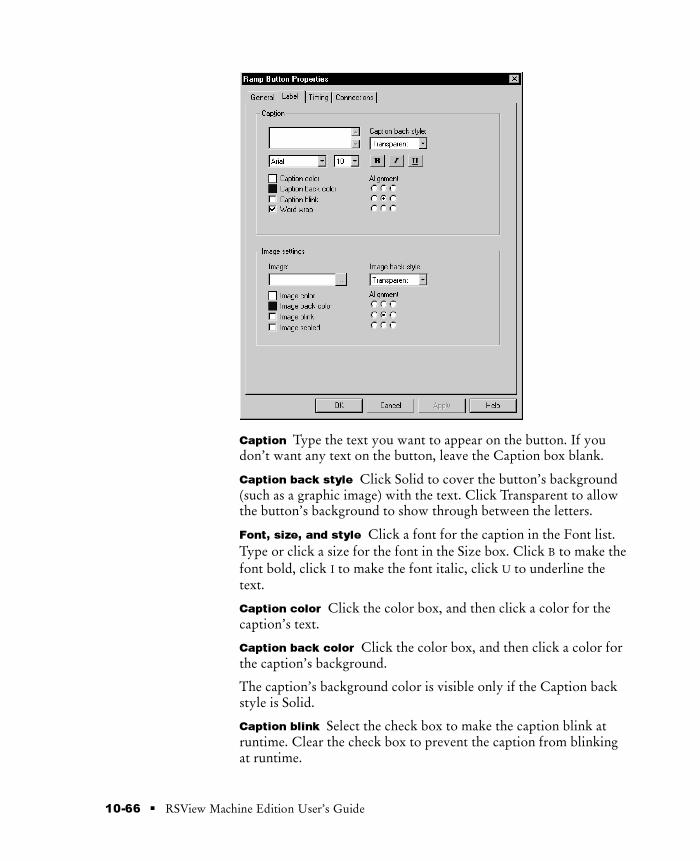
Preface
10-66 � RSView Machine Edition User’s Guide
Caption Type the text you want to appear on the button. If youdon’t want any text on the button, leave the Caption box blank.
Caption back style Click Solid to cover the button’s background(such as a graphic image) with the text. Click Transparent to allowthe button’s background to show through between the letters.
Font, size, and style Click a font for the caption in the Font list.Type or click a size for the font in the Size box. Click B to make thefont bold, click I to make the font italic, click U to underline thetext.
Caption color Click the color box, and then click a color for thecaption’s text.
Caption back color Click the color box, and then click a color forthe caption’s background.
The caption’s background color is visible only if the Caption backstyle is Solid.
Caption blink Select the check box to make the caption blink atruntime. Clear the check box to prevent the caption from blinkingat runtime.

� 10-67Configuring graphic objects
Word wrap Select this check box to wrap words to the next line ifthey are too long for the width of the caption. Clear this check boxto wrap on characters instead.
Alignment Click a position in the grid, relative to the button. Inthe default alignment position, the text is centered vertically andhorizontally on the button.
Image Type the name of the image file to display on the button, orclick the Browse button to browse for the image.
If you click the Browse button, the Image Browser opens. Click animage in the Select image box, and then click OK.
Image back style Click Solid to cover the button’s backgroundbehind the image. Click Transparent to allow the button’sbackground to show through spaces in the image.
Image color Click the color box, and then click a color for amonochrome image. You cannot change the color of grayscale orcolor images.
Image back color Click the color box, and then click a color forthe background of a monochrome image. You cannot change thebackground color of grayscale or color images.
Image blink Select the check box to make a monochrome imageblink at runtime. Clear the check box to prevent the image fromblinking at runtime. You cannot make grayscale or color imagesblink.
Image scaled Select the check box to scale the image to fit the areaof the button. Clear this check box to crop the image to the area ofthe button if it is too large to fit on the button.
If the button’s shape is a Circle or Ellipse, the image is shaped to fitinside the circle or ellipse.
Alignment Click a position in the grid, relative to the button. Inthe default alignment position, the image is centered vertically andhorizontally on the button.
Browse button

Preface
10-68 � RSView Machine Edition User’s Guide
Setting up whether the Ramp button pressrepeats when held down
In the Timing tab, set up whether or not the button press repeatsautomatically when the operator presses and holds the buttondown. You can also set up the rate at which the button pressrepeats.
For more information about auto repeat, see page 10-11.
Auto repeat rate Select the number of times per second a buttonpress is registered when the button goes into auto repeat mode. Ifyou don’t want the button press to repeat automatically, click 0.
Auto repeat delay Click the number of milliseconds or secondsthe button must remain pressed before auto repeat starts.
Connecting the Ramp button to data
In the Connections tab, specify the tag with which the buttonexchanges data. Ramp buttons have no Indicator control. Forinformation about assigning tags, see page 9-32.
Value The Value control triggers the button’s action. For example,when the tag assigned to the control is increased, the data sourceincreases a motor’s speed.
How to use Numeric displaysUse the Numeric display object to show the operator numericinformation from the data source. For example, you might use aNumeric display to show the current temperature of an oven.
� 10-69Configuring graphic objects
How values are displayed
The Numeric display shows the value of the Value control at thedata source. The value shown depends on whether the Valuecontrol value is a floating point or integer. Integer values aredisplayed as is. Floating point values are rounded to fit the display.
For example, if the Numeric display is configured to show 6 digits,1234.56 is rounded to 1234.6. 1234.44 is rounded to 1234.4. Thedecimal counts as one of the digits.
For more information about how values are rounded, see page 7-3.
Number formats
The Numeric display uses the number format you set up on theruntime computer. For example, if the runtime computer is set upto use a comma for the decimal symbol, the Numeric display uses acomma for the decimal symbol.
For information about specifying time, date, and number formatson the RAC6182, see page 21-3. For information about specifyingtime, date, and number formats in Windows 2000, see page 22-3.
Problems with displaying values
If the Value control is unassigned, the Numeric display is filledwith asterisks (*).
If the value, including the decimal point and minus sign,contains more digits than specified for the display, the Numericdisplay is filled with asterisks.
If the Numeric display is sized so that the value cannot be fullydisplayed, the value is truncated and the last displayable digit isreplaced with an asterisk.
If the value doesn’t fit on the first line of the display, and there isroom for a second line, the value continues onto the second line.
Setting up Numeric displays
The Numeric display shows the operator numeric values from thedata source.
Specify the appearance of the display, the number of digits todisplay, and the tag or expression to display.

Preface
10-70 � RSView Machine Edition User’s Guide
To set up a Numeric display:
1. Double-click the Numeric display.
2. In the Numeric Display Properties dialog box, fill in the optionson each tab, as described in the sections that follow. When youare finished, click OK.
Setting up the appearance of the Numericdisplay
In the General tab, specify what the Numeric display looks like atruntime.
Border style Click a border style in the list, or click None toremove the border.
Border width Type a number to change the thickness of theNumeric display’s border. Border width is measured in pixels.
Border uses back color Select the check box if you want theNumeric display’s border to have the same color as the display’sbackground.

� 10-71Configuring graphic objects
Clear the check box if you want the Numeric display’s border tohave a different color than the display’s background, and thenchoose a Border color.
Back color Click the color box, and then click a color for theNumeric display’s background.
Border color Click the color box, and then click a color for theNumeric display’s border.
Back style Click Solid to cover objects or the display backgroundbehind the Numeric display. Click Transparent to allow objects orthe display background behind the Numeric display to showthrough.
Pattern style Click a pattern style for the display.
Pattern color Click the color box, and then click a color for thepattern.
Fore color Click the color box, and then click a color for the textin the display.
Blink Select the check box to make the display blink at runtime.Clear the check box to prevent the display from blinking atruntime.
Font, size, and style Click a font for the caption in the Font list.Type or click a size for the font in the Size box. Click B to make thefont bold, click I to make the font italic, click U to underline thetext.
Alignment Click a position in the grid, relative to the Numericdisplay. In the default alignment position, the text is centeredvertically and horizontally on the display.

Preface
10-72 � RSView Machine Edition User’s Guide
Number of digits Click the maximum number of digits to display,up to 17 digits. The decimal point and minus sign each count as adigit.
Fill left with Select a character to fill the left of the display with ifthe value at the data source contains fewer than the maximumnumber of digits. If you don’t want to use a fill character, selectNone.
Connecting the Numeric display to data
In the Connections tab, specify the tags or expressions whose datais displayed. For information about assigning tags and expressions,see page 9-32.
Type the tag name
or expression here.
The arrow shows
that the control is a
read control. You
cannot write a
value to the
control.
Value The Value control’s value is shown in the display. Forexample, the display can show the temperature of an oven.
Polarity The Polarity control determines whether or not a minussign is displayed. A minus sign is displayed when this control has apositive non-zero value.
If the Polarity control is assigned, it overrides the polarity of theValue control’s value.
If the Polarity control uses a tag with a floating point value, valuesof less than .5 are rounded down (to zero) and values of .5 orgreater are rounded up (to 1).

� 10-73Configuring graphic objects
Setting up Numeric Input Enable buttons
The operator can press the Numeric Input Enable button to open anumeric pop-up keypad or scratchpad. The operator can enter anumber in the keypad or scratchpad, and then send the number tothe data source.
For more information about using the Numeric Input Enablebutton and the numeric pop-ups, see page 24-3.
Specify the appearance of the button, whether the button opens akeypad or scratchpad, and how the button interacts with the datasource.
To set up a Numeric Input Enable button:
1. Double-click the Numeric Input Enable button.
2. In the Numeric Input Enable Properties dialog box, fill in theoptions on each tab, as described in the sections that follow.When you are finished, click OK.
Preface
10-74 � RSView Machine Edition User’s Guide
Setting up the appearance and action of theNumeric Input Enable button
In the General tab, specify what the button looks like at runtime,whether the button opens the keypad or scratchpad, and the type ofdata the operator can enter.
Border style Click a border style in the list, or click None toremove the border.
Border width Type a number to change the thickness of thebutton’s border. Border width is measured in pixels.
Border uses back color Select the check box if you want thebutton’s border to have the same color as the button’s background.
Clear the check box if you want the button’s border to have adifferent color than the button’s background, and then choose aBorder color.
Back color Click the color box, and then click a color for thebutton’s background.
Border color Click the color box, and then click a color for thebutton’s border.
Back style Click Solid to cover objects or the display backgroundbehind the button. Click Transparent to allow objects or the displaybackground behind the button to show through.
Pattern style Click a pattern style for the button.
Pattern color Click the color box, and then click a color for thepattern.
Highlight color Click the color box, and then click a color for theselection border that appears around the button when it is pressed.If the button does not use a border, the highlight color is not visiblewhen the button is pressed.
Blink Select the check box to make the button blink at runtime.Clear the check box to prevent the button from blinking at runtime.
Shape Click a shape for the button.

� 10-75Configuring graphic objects
Numeric pop--up Select whether to use the keypad or scratchpad.
To use the scratchpad, the runtime computer must have an externalkeyboard or keypad.
Decimal point Click Implicit if the operator manually enters thedecimal point and you want the decimal point to be used when thevalue is sent to the Value control.
Click Fixed Position if the values to enter in the pop-up alwayshave the same number of digits after the decimal point. If you selectthis type of decimal point, specify a ”Digits after decimal” value.The decimal point is stripped when the value is sent to the Valuecontrol.
Minimum value Type the minimum value to send to the Valuecontrol. For the Fixed Position decimal point, the minimum appliesto the stripped value, not the displayed value.
If you use the Optional Expression control, the minimum alsoapplies to the value sent to the expression.
Maximum value Type the maximum value to send to the Valuecontrol. For the Fixed Position decimal point, the maximum appliesto the stripped value, not the displayed value.
If you use the Optional Expression control, the maximum alsoapplies to the value sent to the expression.
Digits after decimal If you select the Fixed Position decimalpoint, select the number of digits to appear after the decimal point.
Horizontal margin Type the number of pixels for thetouch-insensitive margin inside the object’s left and right edges.
For information about using touch margins, see page 10-4.

Preface
10-76 � RSView Machine Edition User’s Guide
Vertical margin Type the number of pixels for thetouch-insensitive margin inside the object’s top and bottom edges.
Audio Select this check box to beep the computer’s internal speakerwhen the operator presses the button.
If the computer running the display does not have an internalspeaker, pressing the button does not trigger a beep.
Setting up a caption or image for theNumeric Input Enable button
In the Label tab, specify what text or image to display on thebutton.

� 10-77Configuring graphic objects
Caption Type the text you want to appear on the button. If youdon’t want any text on the button, leave the Caption box blank.
Caption back style Click Solid to cover the button’s background(such as a graphic image) with the text. Click Transparent to allowthe button’s background to show through between the letters.
Font, size, and style Click a font for the caption in the font list.Type or click a size for the font in the size box. Click B to make thefont bold, click I to make the font italic, click U to underline thetext.
Caption color Click the color box, and then click a color for thecaption’s text.
Caption back color Click the color box, and then click a color forthe caption’s background.
The caption’s background color is visible only if the Caption backstyle is Solid.
Caption blink Select the check box to make the caption blink atruntime. Clear the check box to prevent the caption from blinkingat runtime.
Word wrap Select this check box to wrap words to the next line ifthey are too long for the width of the caption. Clear this check boxto wrap on characters instead.
Alignment Click a position in the grid, relative to the button. Inthe default alignment position, the text is centered vertically andhorizontally on the button.
Image Type the name of the image file to display on the button, orclick the Browse button to browse for the image.
If you click the Browse button, the Image Browser opens. Click animage in the Select image box, and then click OK.
Image back style Click Solid to cover the button’s backgroundbehind the image. Click Transparent to allow the button’sbackground to show through spaces in the image.
Browse button

Preface
10-78 � RSView Machine Edition User’s Guide
Image color Click the color box, and then click a color for amonochrome image. You cannot change the color of grayscale orcolor images.
Image back color Click the color box, and then click a color forthe background of a monochrome image. You cannot change thebackground color of grayscale or color images.
Image blink Select the check box to make a monochrome imageblink at runtime. Clear the check box to prevent the image fromblinking at runtime. You cannot make grayscale or color imagesblink.
Image scaled Select the check box to scale the image to fit the areaof the button. Clear this check box to crop the image to the area ofthe button if it is too large to fit on the button.
If the button’s shape is a Circle or Ellipse, the image is shaped to fitinside the circle or ellipse.
Alignment Click a position in the grid, relative to the button. Inthe default alignment position, the image is centered vertically andhorizontally on the button.
Setting up the how the Numeric InputEnable button’s pop-up works with an Enterkey
In the Timing tab, set up the timing and handshake settings for theEnter key.
For information about using Enter key handshaking, see page10-12.
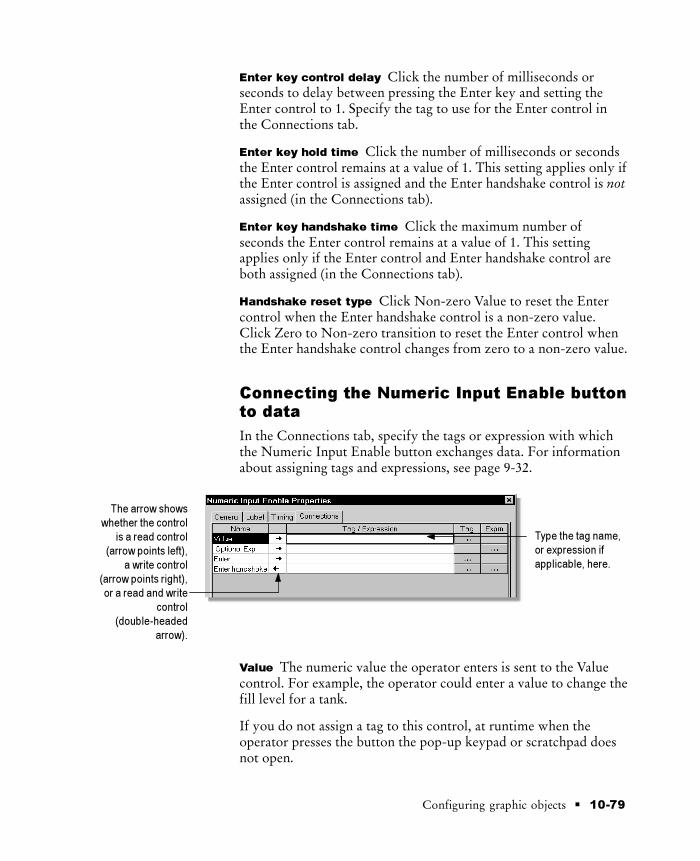
� 10-79Configuring graphic objects
Enter key control delay Click the number of milliseconds orseconds to delay between pressing the Enter key and setting theEnter control to 1. Specify the tag to use for the Enter control inthe Connections tab.
Enter key hold time Click the number of milliseconds or secondsthe Enter control remains at a value of 1. This setting applies only ifthe Enter control is assigned and the Enter handshake control is notassigned (in the Connections tab).
Enter key handshake time Click the maximum number ofseconds the Enter control remains at a value of 1. This settingapplies only if the Enter control and Enter handshake control areboth assigned (in the Connections tab).
Handshake reset type Click Non-zero Value to reset the Entercontrol when the Enter handshake control is a non-zero value.Click Zero to Non-zero transition to reset the Enter control whenthe Enter handshake control changes from zero to a non-zero value.
Connecting the Numeric Input Enable buttonto data
In the Connections tab, specify the tags or expression with whichthe Numeric Input Enable button exchanges data. For informationabout assigning tags and expressions, see page 9-32.
Type the tag name,
or expression if
applicable, here.
The arrow shows
whether the control
is a read control
(arrow points left),
a write control
(arrow points right),
or a read and write
control
(double-headed
arrow).
Value The numeric value the operator enters is sent to the Valuecontrol. For example, the operator could enter a value to change thefill level for a tank.
If you do not assign a tag to this control, at runtime when theoperator presses the button the pop-up keypad or scratchpad doesnot open.

Preface
10-80 � RSView Machine Edition User’s Guide
Optional Expression The Optional Expression control is anoptional write control. Assign a write expression to this control.When the operator enters a value, the expression’s logic isperformed on the value, and the result is sent to the Value control.
The write expression must contain a question mark (?) as aplaceholder for the value the operator enters at runtime.
For more information about write expressions, see page 12-20.
Enter The Enter control accepts values of 0 or 1 only. The controldetermines how long the Enter key press is registered. No furthervalues can be entered by the button when the Enter control is setto 1.
Enter handshake The Enter handshake control resets the Entercontrol, using the ”Handshake reset type” option specified on theTiming tab.
Use this control for Enter key handshaking if you want to reset theEnter control when a value in the programmable controllerchanges.
How to use String displaysUse the String display object to show the operator messages fromthe data source. For example, you might configure the data sourceto generate strings that report on the state of a process or operation,or that provide instructions about what the operator should donext. At runtime the display shows the operator the string value ofthe Value control at the data source.
You can use hex control codes to format and position the textstrings. For more information, see the Help.
How values are displayedIf the Value control is unassigned, the String display is blank.
RSView displays the number of characters (bytes) specified forthe tag assigned to the Value control. If a longer string is sent tothe control, only the specified number of characters is displayed.
Setting up String displaysThe String display shows the operator string values from the datasource.
Specify the appearance of the display and the tag or expression todisplay.
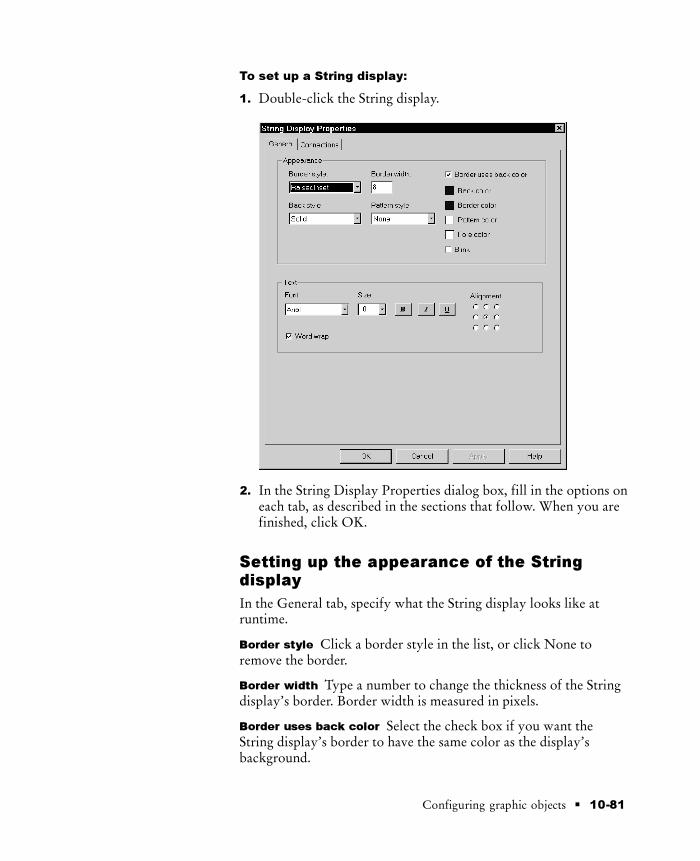
� 10-81Configuring graphic objects
To set up a String display:
1. Double-click the String display.
2. In the String Display Properties dialog box, fill in the options oneach tab, as described in the sections that follow. When you arefinished, click OK.
Setting up the appearance of the Stringdisplay
In the General tab, specify what the String display looks like atruntime.
Border style Click a border style in the list, or click None toremove the border.
Border width Type a number to change the thickness of the Stringdisplay’s border. Border width is measured in pixels.
Border uses back color Select the check box if you want theString display’s border to have the same color as the display’sbackground.

Preface
10-82 � RSView Machine Edition User’s Guide
Clear the check box if you want the String display’s border to havea different color than the display’s background, and then choose aBorder color.
Back color Click the color box, and then click a color for theString display’s background.
Border color Click the color box, and then click a color for theString display’s border.
Back style Click Solid to cover objects or the display backgroundbehind the String display. Click Transparent to allow objects or thedisplay background behind the String display to show through.
Pattern style Click a pattern style for the display.
Pattern color Click the color box, and then click a color for thepattern.
Fore color Click the color box, and then click a color for the textin the display.
Blink Select the check box to make the display blink at runtime.Clear the check box to prevent the display from blinking atruntime.
Font, size, and style Click a font for the text in the Font list. Typeor click a size for the font in the Size box. Click B to make the fontbold, click I to make the font italic, click U to underline the text.
Alignment Click a position in the grid, relative to the Stringdisplay. In the default alignment position, the text is centeredvertically and horizontally on the display.
Word wrap Select this check box to wrap words to the next line ifthey are too long for the width of the display.
Clear this check box to wrap on characters instead. If there is roomfor another line, the rest of the truncated word is displayed on thenext line.

� 10-83Configuring graphic objects
Connecting the String display to data
In the Connections tab, specify the tag or expression whose data isdisplayed. For information about assigning tags and expressions, seepage 9-32.
Type the tag name
or expression here.
The arrow shows
that the control is a
read control. You
cannot write a
value to the
control.
Value The Value control’s value is shown in the display. Forexample, the display can show a message about the status of aconveyor belt.
Assign a tag or expression that can support up to 82 characters(bytes).
Setting up String Input Enable buttons
The operator can press the String Input Enable button to open astring pop-up scratchpad or keyboard. The operator can enter textin the scratchpad or keyboard, and then send the string to the datasource.
For more information about using the String Input Enable buttonand the string pop-ups, see page 24-7.
Specify the appearance of the button, whether the button opens ascratchpad or keyboard, and how the button interacts with the datasource.
To set up a String Input Enable button:
1. Double-click the String Input Enable button.

Preface
10-84 � RSView Machine Edition User’s Guide
2. In the String Input Enable Properties dialog box, fill in theoptions on each tab, as described in the sections that follow.When you are finished, click OK.
Setting up the appearance and action of theString Input Enable button
In the General tab, specify what the button looks like at runtime,whether the button opens the scratchpad or keyboard, and thenumber of characters the operator can enter.
Border style Click a border style in the list, or click None toremove the border.
Border width Type a number to change the thickness of thebutton’s border. Border width is measured in pixels.
Border uses back color Select the check box if you want thebutton’s border to have the same color as the button’s background.
Clear the check box if you want the button’s border to have adifferent color than the button’s background, and then choose aBorder color.

� 10-85Configuring graphic objects
Back color Click the color box, and then click a color for thebutton’s background.
Border color Click the color box, and then click a color for thebutton’s border.
Back style Click Solid to cover objects or the display backgroundbehind the button. Click Transparent to allow objects or the displaybackground behind the button to show through.
Pattern style Click a pattern style for the button.
Pattern color Click the color box, and then click a color for thepattern.
Highlight color Click the color box, and then click a color for theselection border that appears around the button when it is pressed.If the button does not use a border, the highlight color is not visiblewhen the button is pressed.
Blink Select the check box to make the button blink at runtime.Clear the check box to prevent the button from blinking at runtime.
Shape Click a shape for the button.
String pop--up Select whether to use the scratchpad or keyboard.
To use the scratchpad, the runtime computer must have an externalkeyboard or keypad.
Number of input characters Specify the maximum number ofinput characters for the pop-up to accept, up to 82 characters.
Fill character Select a character to pad the string with if theoperator enters fewer than the maximum number of inputcharacters.
When the value is sent to the Value control, the fill characters areplaced after the string the operator enters. The characters do notappear in the pop-up.
Mask scratchpad Check this box to hide the text the operatorenters by using the # character instead of the actual text.

Preface
10-86 � RSView Machine Edition User’s Guide
If you don’t want to hide the text the operator types, clear thecheck box.
Horizontal margin Type the number of pixels for thetouch-insensitive margin inside the object’s left and right edges.
For information about using touch margins, see page 10-4.
Vertical margin Type the number of pixels for thetouch-insensitive margin inside the object’s top and bottom edges.
Audio Select this check box to beep the computer’s internal speakerwhen the operator presses the button.
If the computer running the display does not have an internalspeaker, pressing the button does not trigger a beep.
Setting up a caption or image for the StringInput Enable button
In the Label tab, specify what text or image to display on thebutton.

� 10-87Configuring graphic objects
Caption Type the text you want to appear on the button. If youdon’t want any text on the button, leave the Caption box blank.
Caption back style Click Solid to cover the button’s background(such as a graphic image) with the text. Click Transparent to allowthe button’s background to show through between the letters.
Font, size, and style Click a font for the caption in the font list.Type or click a size for the font in the size box. Click B to make thefont bold, click I to make the font italic, click U to underline thetext.
Caption color Click the color box, and then click a color for thecaption’s text.
Caption back color Click the color box, and then click a color forthe caption’s background.
The caption’s background color is visible only if the Caption backstyle is Solid.
Caption blink Select the check box to make the caption blink atruntime. Clear the check box to prevent the caption from blinkingat runtime.

Preface
10-88 � RSView Machine Edition User’s Guide
Word wrap Select this check box to wrap words to the next line ifthey are too long for the width of the caption. Clear this check boxto wrap on characters instead.
Alignment Click a position in the grid, relative to the button. Inthe default alignment position, the text is centered vertically andhorizontally on the button.
Image Type the name of the image file to display on the button, orclick the Browse button to browse for the image.
If you click the Browse button, the Image Browser opens. Click animage in the Select image box, and then click OK.
Image back style Click Solid to cover the button’s backgroundbehind the image. Click Transparent to allow the button’sbackground to show through spaces in the image.
Image color Click the color box, and then click a color for amonochrome image. You cannot change the color of grayscale orcolor images.
Image back color Click the color box, and then click a color forthe background of a monochrome image. You cannot change thebackground color of grayscale or color images.
Image blink Select the check box to make a monochrome imageblink at runtime. Clear the check box to prevent the image fromblinking at runtime. You cannot make grayscale or color imagesblink.
Image scaled Select the check box to scale the image to fit the areaof the button. Clear this check box to crop the image to the area ofthe button if it is too large to fit on the button.
If the button’s shape is a Circle or Ellipse, the image is shaped to fitinside the circle or ellipse.
Alignment Click a position in the grid, relative to the button. Inthe default alignment position, the image is centered vertically andhorizontally on the button.
Browse button
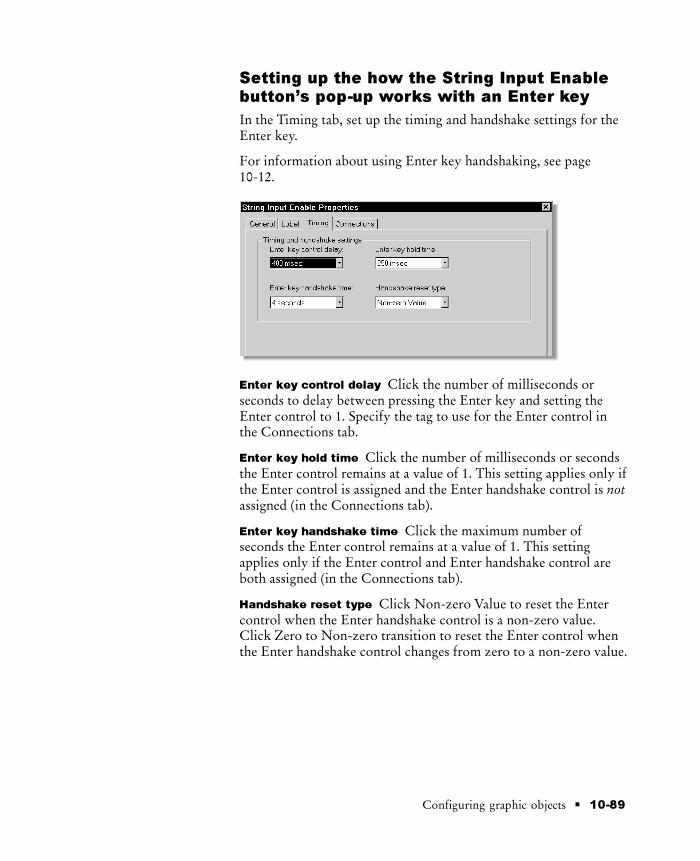
� 10-89Configuring graphic objects
Setting up the how the String Input Enablebutton’s pop-up works with an Enter key
In the Timing tab, set up the timing and handshake settings for theEnter key.
For information about using Enter key handshaking, see page10-12.
Enter key control delay Click the number of milliseconds orseconds to delay between pressing the Enter key and setting theEnter control to 1. Specify the tag to use for the Enter control inthe Connections tab.
Enter key hold time Click the number of milliseconds or secondsthe Enter control remains at a value of 1. This setting applies only ifthe Enter control is assigned and the Enter handshake control is notassigned (in the Connections tab).
Enter key handshake time Click the maximum number ofseconds the Enter control remains at a value of 1. This settingapplies only if the Enter control and Enter handshake control areboth assigned (in the Connections tab).
Handshake reset type Click Non-zero Value to reset the Entercontrol when the Enter handshake control is a non-zero value.Click Zero to Non-zero transition to reset the Enter control whenthe Enter handshake control changes from zero to a non-zero value.

Preface
10-90 � RSView Machine Edition User’s Guide
Connecting the String Input Enable buttonto data
In the Connections tab, specify the tags or expression with whichthe String Input Enable button exchanges data. For informationabout assigning tags and expressions, see page 9-32.
Type the tag name,
or expression if
applicable, here.
The arrow shows
whether the control
is a read control
(arrow points left),
a write control
(arrow points right),
or a read and write
control
(double-headed
arrow).
Value The string value the operator enters is sent to the Valuecontrol. Assign a tag that can support up to 82 characters (bytes).
When the operator presses the Enter key, the alphanumeric string issent to the data source.
If you do not assign a tag to this control, at runtime when theoperator presses the button the pop-up does not open.
Enter The Enter control accepts values of 0 or 1 only. The controldetermines how long the Enter key press is registered. No furthervalues can be entered by the button when the Enter control is setto 1.
Enter handshake The Enter handshake control resets the Entercontrol, using the ”Handshake reset type” option specified on theTiming tab.
Use this control for Enter key handshaking if you want to reset theEnter control when a value in the programmable controllerchanges.
Setting up Goto Display buttons
Use the Goto Display button to open a graphic display. You cancreate as many Goto Display buttons as you need, but each buttonopens a single display only.
For more information about using Goto Display buttons, seepage 19-4.

� 10-91Configuring graphic objects
Specify the graphic display to open, and a parameter file to use withtag placeholders in the display (if any).
To set up a Goto Display button:
1. Double-click the Goto Display button.
2. In the Goto Display Button Properties dialog box, fill in theoptions on each tab, as described in the sections that follow.When you are finished, click OK.

Preface
10-92 � RSView Machine Edition User’s Guide
Setting up the appearance of the GotoDisplay button
In the General tab, specify what the button looks like at runtime.
Border style Click a border style in the list, or click None toremove the border.
Border width Type a number to change the thickness of thebutton’s border. Border width is measured in pixels.
Border uses back color Select the check box if you want thebutton’s border to have the same color as the button’s background.
Clear the check box if you want the button’s border to have adifferent color than the button’s background, and then choose aBorder color.
Back color Click the color box, and then click a color for thebutton’s background.
Border color Click the color box, and then click a color for thebutton’s border.
Back style Click Solid to cover objects or the display backgroundbehind the button. Click Transparent to allow objects or the displaybackground behind the button to show through.
Pattern style Click a pattern style for the button.
Pattern color Click the color box, and then click a color for thepattern.
Highlight color Click the color box, and then click a color for theselection border that appears around the button when it is pressed.If the button does not use a border, the highlight color is not visiblewhen the button is pressed.
Blink Select the check box to make the button blink at runtime.Clear the check box to prevent the button from blinking at runtime.
Shape Click a shape for the button.
Display Type the name of the graphic display to open when thebutton is pressed. To browse for a graphic display, click the Browsebutton.
Browse button

� 10-93Configuring graphic objects
Parameter file Type the name of the parameter file to run whenthe button is pressed. To browse for a parameter file, click theBrowse button.
A parameter file assigns tags to tag placeholders in the display whenthe display opens.
Top position Type the number of pixels from the top edge of theproject window to position the display. This option applies only ifthe graphic display the button opens is an On Top display.
Left position Type the number of pixels from the left edge of theproject window to position the display. This option applies only ifthe graphic display the button opens is an On Top display.
Display position enabled Check this box if you want to use theTop position and Left position options to position the display thebutton opens.
Horizontal margin Type the number of pixels for thetouch-insensitive margin inside the object’s left and right edges.
For information about using touch margins, see page 10-4.
Vertical margin Type the number of pixels for thetouch-insensitive margin inside the object’s top and bottom edges.
Audio Select this check box to beep the computer’s internal speakerwhen the operator presses the button.
If the computer running the display does not have an internalspeaker, pressing the button does not trigger a beep.

Preface
10-94 � RSView Machine Edition User’s Guide
Setting up a caption or image for the GotoDisplay button
In the Label tab, specify what text or image to display on thebutton.
Caption Type the text you want to appear on the button. If youdon’t want any text on the button, leave the Caption box blank.
Caption back style Click Solid to cover the button’s background(such as a graphic image) with the text. Click Transparent to allowthe button’s background to show through between the letters.
Font, size, and style Click a font for the caption in the font list.Type or click a size for the font in the size box. Click B to make thefont bold, click I to make the font italic, click U to underline thetext.
Caption color Click the color box, and then click a color for thecaption’s text.
Caption back color Click the color box, and then click a color forthe caption’s background.

� 10-95Configuring graphic objects
The caption’s background color is visible only if the Caption backstyle is Solid.
Caption blink Select the check box to make the caption blink atruntime. Clear the check box to prevent the caption from blinkingat runtime.
Word wrap Select this check box to wrap words to the next line ifthey are too long for the width of the caption. Clear this check boxto wrap on characters instead.
Alignment Click a position in the grid, relative to the button. Inthe default alignment position, the text is centered vertically andhorizontally on the button.
Image Type the name of the image file to display on the button, orclick the Browse button to browse for the image.
If you click the Browse button, the Image Browser opens. Click animage in the Select image box, and then click OK.
Image back style Click Solid to cover the button’s backgroundbehind the image. Click Transparent to allow the button’sbackground to show through spaces in the image.
Image color Click the color box, and then click a color for amonochrome image. You cannot change the color of grayscale orcolor images.
Image back color Click the color box, and then click a color forthe background of a monochrome image. You cannot change thebackground color of grayscale or color images.
Image blink Select the check box to make a monochrome imageblink at runtime. Clear the check box to prevent the image fromblinking at runtime. You cannot make grayscale or color imagesblink.
Image scaled Select the check box to scale the image to fit the areaof the button. Clear this check box to crop the image to the area ofthe button if it is too large to fit on the button.
Browse button
Preface
10-96 � RSView Machine Edition User’s Guide
If the button’s shape is a Circle or Ellipse, the image is shaped to fitinside the circle or ellipse.
Alignment Click a position in the grid, relative to the button. Inthe default alignment position, the image is centered vertically andhorizontally on the button.
Setting up Display List selectors
The Display List selector is a list of displays in the project. Eachgraphic display is represented by a different state in the DisplayList selector. An operator can scroll through the list of displays, andthen select the display to open.
For more information about using Display List selectors, seepage 19-6.
Specify the graphic displays associated with each state. At runtime,the operator selects a graphic display by highlighting the state in thelist, and then pressing an Enter button or key to select the state.
To set up a Display List selector:
1. Double-click the Display List selector.

� 10-97Configuring graphic objects
2. In the Display List Selector Properties dialog box, fill in theoptions on each tab, as described in the sections that follow.When you are finished, click OK.
Setting up the appearance of theDisplay List selector
In the General tab, specify what the Display List selector looks likeat runtime.
Border style Click a border style in the list, or click None toremove the border.
Border width Type a number to change the thickness of theDisplay List selector’s border. Border width is measured in pixels.
Border uses back color Select the check box if you want theDisplay List selector’s border to have the same color as theselector’s background.
Clear the check box if you want the Display List selector’s borderto have a different color than the selector’s background, and thenchoose a Border color.
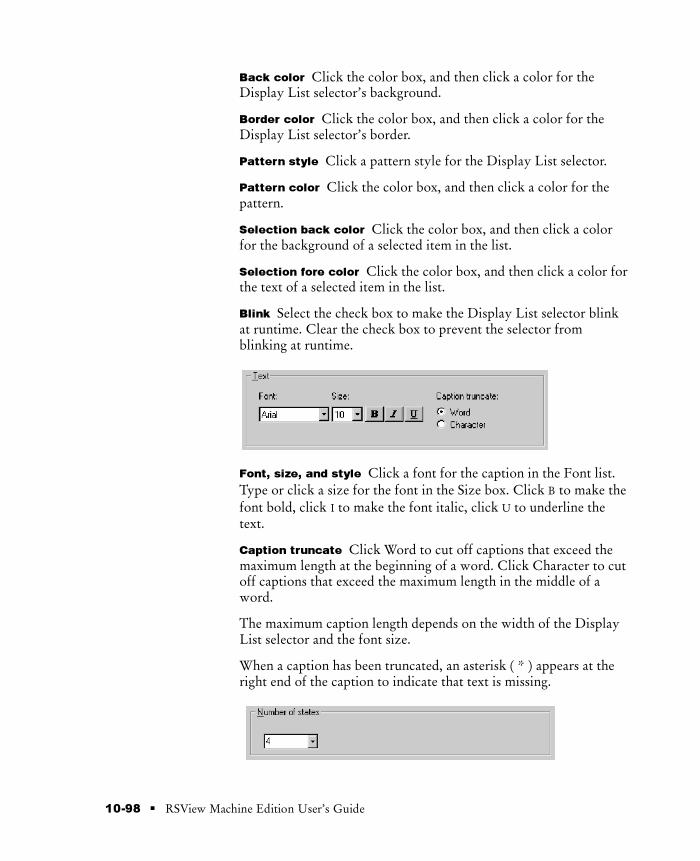
Preface
10-98 � RSView Machine Edition User’s Guide
Back color Click the color box, and then click a color for theDisplay List selector’s background.
Border color Click the color box, and then click a color for theDisplay List selector’s border.
Pattern style Click a pattern style for the Display List selector.
Pattern color Click the color box, and then click a color for thepattern.
Selection back color Click the color box, and then click a colorfor the background of a selected item in the list.
Selection fore color Click the color box, and then click a color forthe text of a selected item in the list.
Blink Select the check box to make the Display List selector blinkat runtime. Clear the check box to prevent the selector fromblinking at runtime.
Font, size, and style Click a font for the caption in the Font list.Type or click a size for the font in the Size box. Click B to make thefont bold, click I to make the font italic, click U to underline thetext.
Caption truncate Click Word to cut off captions that exceed themaximum length at the beginning of a word. Click Character to cutoff captions that exceed the maximum length in the middle of aword.
The maximum caption length depends on the width of the DisplayList selector and the font size.
When a caption has been truncated, an asterisk ( * ) appears at theright end of the caption to indicate that text is missing.

� 10-99Configuring graphic objects
Number of states Click the number of states you want theDisplay List selector to have.
Key navigation Select this check box to allow the operator tonavigate to the Display List selector and give it focus using thekeyboard.
For more information about key navigation, see page 10-8.
Setting up which displays appear in theDisplay List selector
In the States tab, specify which graphic display to use for each ofthe Display List selector’s states, and how each graphic display isnamed in the list.
For tips about configuring states, see page 10-1.
Display Type the name of the graphic display for the selected state.To browse for a graphic display, click the Browse button.
Browse button

Preface
10-100 � RSView Machine Edition User’s Guide
Use display name Select this check box to use the name of thegraphic display as the caption for the state. Clear this check box totype a different caption for the state.
Caption Type the text you want to appear as the name of thegraphic display in the Display List selector.
Caption back style Click Solid to cover the Display List selector’sbackground with the text. Click Transparent to allow the DisplayList selector’s background to show through between the letters.
Caption color Click the color box, and then click a color for thecaption’s text.
Caption back color Click the color box, and then click a color forthe caption’s background.
The caption’s background color is visible only if the Caption backstyle is Solid.
Caption blink Select the check box to make the caption blink atruntime. Clear the check box to prevent the caption from blinkingat runtime.
Alignment Click a position in the grid for the text, relative to theDisplay List selector. In the default alignment position, the text isaligned at the left edge of the Display List selector.
How to use indicators
Indicators display the status of processes or operations by showingdifferent colors, captions, images, or options to reflect differentstates.
You can create different kinds of indicators, depending on yourneeds:
Multistate indicators display the current state of a process oroperation by showing a different color, caption, or image to reflectdifferent states.

� 10-101Configuring graphic objects
Symbols display a symbol that changes to match the state of aprocess or operation. This allows the operator to see the status of aprocess or operation at a glance.
List indicators display a list of states for a process or operation, andhighlight the current state. Each state is represented by a caption inthe list. This type of indicator is useful if you want operators toview the current state, but also see the other possible states. Forsequential processes, the list can inform the operator about whathappens next.
Setting up Multistate indicators
The Multistate indicator displays the current state of a process oroperation by showing a different color, caption, or image for eachstate.
Specify the state values of the Multistate indicator. At runtime, theindicator displays the state whose value matches the Indicatorcontrol’s value.
To set up a Multistate indicator:
1. Double-click the Multistate indicator.
2. In the Multistate Indicator Properties dialog box, fill in theoptions on each tab, as described in the sections that follow.When you are finished, click OK.
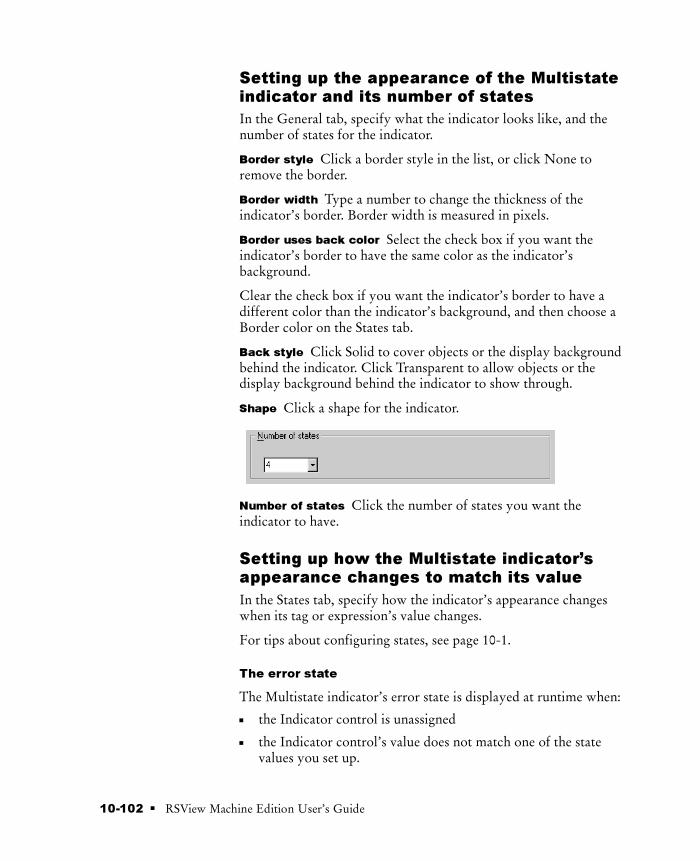
Preface
10-102 � RSView Machine Edition User’s Guide
Setting up the appearance of the Multistateindicator and its number of states
In the General tab, specify what the indicator looks like, and thenumber of states for the indicator.
Border style Click a border style in the list, or click None toremove the border.
Border width Type a number to change the thickness of theindicator’s border. Border width is measured in pixels.
Border uses back color Select the check box if you want theindicator’s border to have the same color as the indicator’sbackground.
Clear the check box if you want the indicator’s border to have adifferent color than the indicator’s background, and then choose aBorder color on the States tab.
Back style Click Solid to cover objects or the display backgroundbehind the indicator. Click Transparent to allow objects or thedisplay background behind the indicator to show through.
Shape Click a shape for the indicator.
Number of states Click the number of states you want theindicator to have.
Setting up how the Multistate indicator’sappearance changes to match its value
In the States tab, specify how the indicator’s appearance changeswhen its tag or expression’s value changes.
For tips about configuring states, see page 10-1.
The error state
The Multistate indicator’s error state is displayed at runtime when:
the Indicator control is unassigned
the Indicator control’s value does not match one of the statevalues you set up.

� 10-103Configuring graphic objects
Value Type the integer value for the selected state. When theIndicator control changes to this value, the indicator’s appearancechanges to use the settings you specify for the state.
Back color Click the color box, and then click a color for theindicator’s background.
Border color Click the color box, and then click a color for theindicator’s border.
Blink Select the check box to make the indicator blink at runtime.Clear the check box to prevent the indicator from blinking atruntime.
Pattern style Click a pattern style for the indicator.
Pattern color Click the color box, and then click a color for thepattern.

Preface
10-104 � RSView Machine Edition User’s Guide
Caption Type the text you want to appear on the indicator. If youdon’t want any text on the indicator, leave the Caption box blank.
Caption back style Click Solid to cover the indicator’sbackground (such as a graphic image) with the text. ClickTransparent to allow the indicator’s background to show throughbetween the letters.
Font, size, and style Click a font for the caption in the Font list.Type or click a size for the font in the Size box. Click B to make thefont bold, click I to make the font italic, click U to underline thetext.
Caption color Click the color box, and then click a color for thecaption’s text.
Caption back color Click the color box, and then click a color forthe caption’s background.
The caption’s background color is visible only if the Caption backstyle is Solid.
Caption blink Select the check box to make the caption blink atruntime. Clear the check box to prevent the caption from blinkingat runtime.
Word wrap Select this check box to wrap words to the next line ifthey are too long for the width of the caption. Clear this check boxto wrap on characters instead.
Alignment Click a position in the grid for the text, relative to theindicator. In the default alignment position, the text is centeredvertically and horizontally on the indicator.
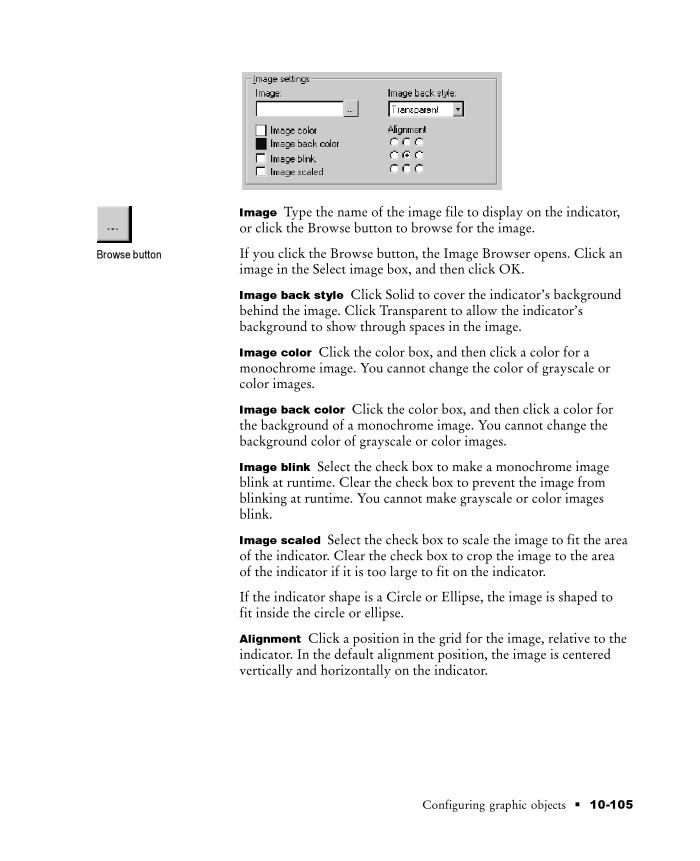
� 10-105Configuring graphic objects
Image Type the name of the image file to display on the indicator,or click the Browse button to browse for the image.
If you click the Browse button, the Image Browser opens. Click animage in the Select image box, and then click OK.
Image back style Click Solid to cover the indicator’s backgroundbehind the image. Click Transparent to allow the indicator’sbackground to show through spaces in the image.
Image color Click the color box, and then click a color for amonochrome image. You cannot change the color of grayscale orcolor images.
Image back color Click the color box, and then click a color forthe background of a monochrome image. You cannot change thebackground color of grayscale or color images.
Image blink Select the check box to make a monochrome imageblink at runtime. Clear the check box to prevent the image fromblinking at runtime. You cannot make grayscale or color imagesblink.
Image scaled Select the check box to scale the image to fit the areaof the indicator. Clear the check box to crop the image to the areaof the indicator if it is too large to fit on the indicator.
If the indicator shape is a Circle or Ellipse, the image is shaped tofit inside the circle or ellipse.
Alignment Click a position in the grid for the image, relative to theindicator. In the default alignment position, the image is centeredvertically and horizontally on the indicator.
Browse button
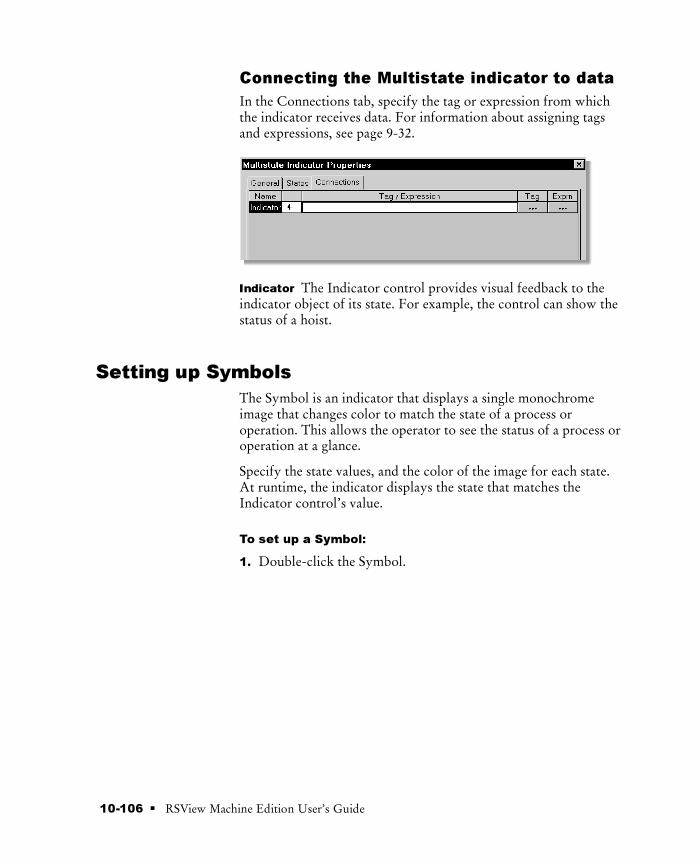
Preface
10-106 � RSView Machine Edition User’s Guide
Connecting the Multistate indicator to data
In the Connections tab, specify the tag or expression from whichthe indicator receives data. For information about assigning tagsand expressions, see page 9-32.
Indicator The Indicator control provides visual feedback to theindicator object of its state. For example, the control can show thestatus of a hoist.
Setting up Symbols
The Symbol is an indicator that displays a single monochromeimage that changes color to match the state of a process oroperation. This allows the operator to see the status of a process oroperation at a glance.
Specify the state values, and the color of the image for each state.At runtime, the indicator displays the state that matches theIndicator control’s value.
To set up a Symbol:
1. Double-click the Symbol.

� 10-107Configuring graphic objects
2. In the Symbol Properties dialog box, fill in the options on eachtab, as described in the sections that follow. When you arefinished, click OK.
Setting up the appearance of the Symboland its number of states
In the General tab, specify what the indicator looks like at runtime,and the number of states for the indicator.
Border style Click a border style in the list, or click None toremove the border.
Border width Type a number to change the thickness of theindicator’s border. Border width is measured in pixels.
Shape Click a shape for the indicator.

Preface
10-108 � RSView Machine Edition User’s Guide
Number of states Click the number of states you want theindicator to have.
Image Type the name of the monochrome image file to display onthe indicator, or click the Browse button to browse for the image.
If you click the Browse button, the Image Browser opens. Click animage in the Select image box, and then click OK.
Setting up how the Symbol changesappearance when its value changes
In the States tab, specify how the indicator’s appearance changeswhen its tag or expression’s value changes.
For tips about configuring states, see page 10-1.
The error state
The Symbol’s error state is displayed at runtime when:
the Indicator control is unassigned
the Indicator control’s value does not match one of the statevalues you set up.
Browse button

� 10-109Configuring graphic objects
Value Type the integer value for the selected state. When theIndicator control changes to this value, the indicator’s appearancechanges to the settings you specify for the state.
Border color Click the color box, and then click a color for theindicator’s border.
Image color Click the color box, and then click a color for themonochrome image.
Image back color Click the color box, and then click a color forthe background of the monochrome image.

Preface
10-110 � RSView Machine Edition User’s Guide
Image back style Click Solid to cover the indicator’s backgroundbehind the image. Click Transparent to allow the indicator’sbackground to show through spaces in the image.
Image blink Select the check box to make the monochrome imageblink at runtime. Clear the check box to prevent the image fromblinking at runtime.
Connecting the Symbol to data
In the Connections tab, specify the tag or expression from whichthe indicator receives data. For information about assigning tagsand expressions, see page 9-32.
Type the tag name
or expression here.
The arrow shows
that the control is a
read control. You
cannot write a
value to an
Indicator control.
Indicator The Indicator control provides visual feedback to theindicator object of its state. For example, the control can show thestate of a pump.
Setting up List indicators
The List indicator displays a list of states for a process or operation,and highlights the current state.
Each state is represented by a caption in the list. This type ofindicator is useful if you want operators to view the current state,but also see the other possible states.
For sequential processes, the list can inform the operator aboutwhat happens next.
Specify the state values of the List indicator. At runtime, theindicator highlights the state whose value matches the Indicatorcontrol’s value.
The List indicator has no error state. If the value of the Indicatorcontrol does not match any of the available states, none of the statesis highlighted.

� 10-111Configuring graphic objects
To set up a List indicator:
1. Double-click the List indicator.
2. In the List Indicator Properties dialog box, fill in the options oneach tab, as described in the sections that follow. When you arefinished, click OK.
Setting up the appearance of the Listindicator and its number of states
In the General tab, specify what the indicator looks like at runtime,and the number of states for the indicator.
Border style Click a border style in the list, or click None toremove the border.
Border width Type a number to change the thickness of theindicator’s border. Border width is measured in pixels.
Border uses back color Select the check box if you want theindicator’s border to have the same color as the indicator’sbackground.

Preface
10-112 � RSView Machine Edition User’s Guide
Clear the check box if you want the indicator’s border to have adifferent color than the indicator’s background, and then choose aBorder color.
Back color Click the color box, and then click a color for theindicator’s background.
Border color Click the color box, and then click a color for theindicator’s border.
Pattern style Click a pattern style for the indicator.
Pattern color Click the color box, and then click a color for thepattern.
Selection fore color Click the color box, and then click a color forthe text of a selected item in the list.
Selection back color Click the color box, and then click a colorfor the background of a selected item in the list.
Blink Select the check box to make the indicator blink at runtime.Clear the check box to prevent the indicator from blinking atruntime.
Font, size, and style Click a font for the indicator’s text in theFont list. Type or click a size for the font in the Size box. Click B tomake the font bold, click I to make the font italic, click U tounderline the text.
Caption truncate Click Word to cut off captions that exceed themaximum length at the beginning of the word. Click Character tocut off captions that exceed the maximum length in the middle of aword.
The maximum caption length depends on the width of the indicatorand the font size.
When a caption has been truncated, an asterisk ( * ) appears on theright of the caption to indicate that text is missing.

� 10-113Configuring graphic objects
Number of states Click the number of states you want theindicator to have.
Setting up how the List indicator’sappearance changes when its valuechanges
In the States tab, specify how the indicator’s appearance changeswhen its tag or expression’s value changes.
For tips about configuring states, see page 10-1.
Value Type the integer value for the selected state. When theIndicator control changes to this value, this state becomes theselected state.

Preface
10-114 � RSView Machine Edition User’s Guide
Caption Type the text to display on the indicator for this state.
Caption back style Click Solid to use the Caption back colorbehind the text. Click Transparent to allow the indicator’sbackground to show through between the letters.
Caption color Click the color box, and then click a color for thecaption’s text.
Caption back color Click the color box, and then click a color forthe caption’s background.
The caption’s background color is visible only if the Caption backstyle is Solid.
Caption blink Select the check box to make the caption blink atruntime. Clear the check box to prevent the caption from blinkingat runtime.
Alignment Click a position in the grid for the text, relative to theindicator. In the default alignment position, the text is positioned atthe left of the indicator, inside the border (if a border is used).
Connecting the List indicator to data
In the Connections tab, specify the tag or expression from whichthe indicator receives data. For information about assigning tagsand expressions, see page 9-32.
Type the tag name
or expression here.
The arrow shows
that the control is a
read control. You
cannot write a
value to an
Indicator control.
Indicator The Indicator control provides visual feedback to theindicator object of its state. For example, the control can show themode of operation of a blower.

� 10-115Configuring graphic objects
How to use bar graphs, gauges, and scales
Bar graphs and gauges display graphical representations of numericvalues.
Bar graphs make it easy to compare values
Bar graphs display numeric values in bar graph format. They areuseful for allowing comparisons between multiple values, or forrepresenting the fill levels of tanks for which a reading on a verticalscale is appropriate.
For example, one bar graph can show the required level of a tank,and a second bar graph can show the actual level of the tank. Thefirst graph changes to represent the required level for a particularapplication, and the second graph changes as the actual level in thetank rises or drops.
Bar graphs are more useful than Numeric displays when it’simportant for the operator to analyze the relationships betweennumeric values. It’s easier for the operator to see that one graph isat a lower level than the other, or that one’s fill is blue and theother’s is yellow, than it is to subtract one numeric value fromanother.
Thresholds change a bar graph’s fill color
As it fills, a bar graph can change its fill color to help an operatorrecognize abnormal conditions. The change in color happens whenthe tag (or expression) value crosses a threshold you set up for thegraph. For example:
if the level of the tank of ingredients is lower than the reciperequires, the graph can show the tank’s level in red
if the recipe will empty the tank, the graph can show the level inyellow
if the level is higher than the level the recipe requires, the graphcan show the level in green
If you want to use a different fill color on a bar graph to showabnormal conditions, make sure enough of the new fill color isvisible when the abnormal condition occurs that the operator cansee the condition.

Preface
10-116 � RSView Machine Edition User’s Guide
Use bar graphs with scales to show limits
Unlike gauges, bar graphs do not have integrated scales. You canshow values on a bar graph using a scale graphic object and text.
Scales consist of major ticks, represented by long lines, and minorticks, represented by short lines. To indicate the values of major orminor ticks, use text objects.
Gauges make it easy to see limits
Gauges display numeric values in dial format. They are useful fordisplaying a value in relation to its lower and upper limits.
For example, a temperature gauge shows the current temperature inrelation to its minimum and maximum extremes. By looking at theposition of the needle on the gauge (pointing left, up, or right), theoperator can tell at a glance whether the temperature is nearer itslower limit, nearer the middle, or nearer its upper limit.
Gauges are used instead of Numeric displays when it’s importantfor the operator to recognize an abnormal condition instantly,either from far away when the scale on the gauge isn’t visible, orbefore the operator has had the opportunity to determine the exactreading on the gauge. This characteristic of gauges is one of thereasons why they are used in automobile instrumentation.
Thresholds change a gauge’s fill color
As the needle sweeps higher on a gauge, the gauge can fill the areabehind the needle with a color. The gauge can change its fill colorto help an operator recognize abnormal conditions. The change incolor happens when the tag (or expression) value crosses athreshold you set up for the gauge. For example:
if the temperature of an oven is lower than required for a recipe,the gauge can show the temperature in blue
if the temperature is in the correct range for the recipe, thegauge can show the temperature in green
if the temperature is higher than the recipe allows, the gauge canshow the temperature in red
If you plan to use colored fills on a gauge to show abnormalconditions, make sure enough of the fill is visible when theabnormal condition occurs that the operator can see the condition.

� 10-117Configuring graphic objects
IMPORTANT Some people are color blind to red and green so don’trely on color alone to establish meaning.
Setting up bar graphs
Use bar graphs to represent numeric values by filling and emptyingas the values rise and fall.
Specify the minimum and maximum values of the bar graph, andthe tag or expression to which the graph is connected. At runtime,the graph shows the value of the tag or expression in relation to thegraph’s minimum and maximum values.
To set up a bar graph:
1. Double-click the bar graph.
2. In the Bar Graph Properties dialog box, fill in the options oneach tab, as described in the sections that follow. When you arefinished, click OK.

Preface
10-118 � RSView Machine Edition User’s Guide
Setting up the appearance of the bar graph
In the General tab, specify what the bar graph looks like at runtime.
Border style Click a border style in the list, or click None toremove the border.
Border width Type a number to change the thickness of the bargraph’s border. Border width is measured in pixels.
Border uses back color Select the check box if you want the bargraph’s border to have the same color as the bar graph’sbackground.
Clear the check box if you want the bar graph’s border to have adifferent color than the bar graph’s background.
Back style Click Solid to cover objects or the display backgroundbehind the bar graph. Click Transparent to allow objects or thedisplay background behind the bar graph to show through.
Back color Click the color box, and then click a color for the bargraph’s background.
Border color Click the color box, and then click a color for the bargraph’s border.
Fill color Click the color box, and then click a color for the filledpart of the graph. The filled part represents a numeric value, and isdisplayed against the graph’s background. If you use thresholds,this color is used until the graph’s value reaches the first threshold.
Minimum value Type the minimum value to display on the graph.If the Value control is at or below this value, the graph is empty.
Maximum value Type the maximum value to display on the graph.If the Value control is at or above this value, the graph is filled.
Fill direction Click the direction in which to fill the graph.

� 10-119Configuring graphic objects
Number of thresholds Click the number of thresholds you wantthe graph to have, or click 0 if you don’t want to use thresholds.
Threshold type Click Value to set up thresholds using constantvalues. Click Percentage to set up thresholds using percentages ofthe graph’s total range.
Threshold 1 value, Threshold 2 value Type a constant value, or apercentage, depending on the threshold type. When the tag orexpression crosses this value, the fill color changes. The section ofthe graph above the threshold can also begin to blink.
Fill color Click the color box, and then click a color for the filledpart of the graph above the threshold.
Blink Select the check box to make the filled section above thethreshold blink at runtime. Clear the check box to prevent the filledsection from blinking at runtime.
Connecting the bar graph to data
In the Connections tab, specify the tag or expression from whichthe bar graph receives data. For information about assigning tagsand expressions, see page 9-32.
Type the tag name
or expression here.
The arrow shows
that the control is a
read control. You
cannot write a
value to a bar
graph’s tag.

Preface
10-120 � RSView Machine Edition User’s Guide
Value The Value control changes the fill level on the bar graph. Forexample, the Value control can show the temperature in an ovengoing up.
Setting up gauges
The gauge graphic object represents numeric values using a needleon a dial.
Specify the minimum and maximum values of the gauge, and thetag or expression to which the gauge is connected. At runtime, thegauge indicates the value of the tag or expression in relation to thegauge’s minimum and maximum values.
To set up a gauge:
1. Double-click the gauge.
2. In the Gauge Properties dialog box, fill in the options on eachtab, as described in the sections that follow. When you arefinished, click OK.
Setting up the appearance of the gauge
In the General tab, specify what the gauge looks like at runtime.
� 10-121Configuring graphic objects
Back style Click Solid to cover objects or the display backgroundbehind the gauge. Click Transparent to allow objects or the displaybackground behind the gauge to show through.
Back color Click the color box, and then click a color for thegauge’s background.
Fill color Click the color box, and then click a color for the filledpart of the gauge. The filled part represents a numeric value, and isdisplayed against the gauge’s background. If you use thresholds,this color is used until the gauge’s value reaches the first threshold.
Line style Click a line style for the gauge’s scale. If you want a linestyle other than solid, the line width must be 1 pixel.
Line width Type a number to change the line thickness of thegauge’s scale. Line width is measured in pixels.
Needle color Click the color box, and then click a color for thegauge’s needle.
Fore color Click the color box, and then click a color for thegauge’s scale. The scale is the curved line and ticks that form thedial shape.
Sweep style Click Point to point the needle at the scale as theneedle sweeps over the gauge. Click Fill to fill the area behind theneedle with color as the needle sweeps over the gauge.
Needle width Type a number to change the thickness of thegauge’s needle. Needle width is measured in pixels.
Major ticks Click the number of major ticks you want on thegauge’s scale.
Minor ticks Click the number of minor ticks you want on thegauge’s scale. Minor ticks are spaced evenly between the majorticks.
Font, size, and style Click a font for the gauge’s legends in theFont list. Type or click a size for the font in the Size box. Click B tomake the font bold, click I to make the font italic, click U tounderline the text.
Setting up how the gauge works
In the Display tab, specify how the gauge displays values atruntime.

Preface
10-122 � RSView Machine Edition User’s Guide
Minimum value Type the minimum value to display on the gauge.If the Value control is at or below this value, the needle is at the leftend of the dial.
Maximum value Type the maximum value to display on the gauge.If the Value control is at or above this value, needle is at the rightend of the dial.
Show legend Select this check box to show numeric labels on thegauge. The labels show the numeric value for each major tick on thegauge. Clear this check box to remove labels from the gauge.
Digits after decimal Click the number of digits to display afterthe decimal point for the numeric labels on the gauge’s scale.
Legend color Click the color box, and then click a color for thenumeric labels on the gauge’s scale.

� 10-123Configuring graphic objects
Number of thresholds Click the number of thresholds you wantthe gauge to have, or click 0 if you don’t want to use thresholds.
Threshold type Click Value to set up thresholds using constantvalues. Click Percentage to set up thresholds using percentages ofthe gauge’s total range.
Threshold 1 value, and Threshold 2 value Type a constant value,or a percentage, depending on the threshold type. When the tag orexpression crosses this value, the fill color changes. The section ofthe gauge above the threshold can also begin to blink.
Threshold fill and blink indicators do not appear if the Sweep styleis Point. The Sweep style is specified in the General tab.
Fill color Click the color box, and then click a color for the filledpart of the gauge above the threshold.
Blink Select the check box to make the filled section above thethreshold blink at runtime. Clear the check box to prevent the filledsection from blinking at runtime.
Connecting the gauge to data
In the Connections tab, specify the tag or expression from whichthe gauge receives data. For information about assigning tags andexpressions, see page 9-32.
Type the tag name
or expression here.
The arrow shows
that the control is a
read control. You
cannot write a
value to a
gauge’s tag.

Preface
10-124 � RSView Machine Edition User’s Guide
Value The Value control changes the position of the needle on thegauge. For example, the Value control can show that a machine isoverheating, or that a tank is empty.
Setting up scalesUse the scale graphic object to show the possible range of values fora bar graph.
Specify how the scale looks. Because the scale doesn’t change atruntime, you don’t need to assign tags or expressions to it.
To place value labels on the scale (to create a legend), use textobjects. Create the text objects and then position them next to thetick marks on the scale.
To set up a scale:
1. Double-click the scale.
2. In the Scale Properties dialog box, fill in the options on theGeneral tab, as described in the next section. When you arefinished, click OK.

� 10-125Configuring graphic objects
Setting up the appearance of the scale
In the General tab, specify what the scale looks like at runtime.
Border style Click a border style in the list, or click None toremove the border.
Border width Type a number to change the thickness of the scale’sborder. Border width is measured in pixels.
Border uses back color Select the check box if you want thescale’s border to have the same color as the scale’s background.
Clear the check box if you want the scale’s border to have adifferent color than the scale’s background, and then choose aBorder color.
Back color Click the color box, and then click a color for thescale’s background.
Border color Click the color box, and then click a color for thescale’s border.
Line style Click a line style for the scale. If you want a line styleother than solid, the line width must be 1 pixel.
Line width Type a number to change the line thickness of the scale.Line width is measured in pixels.
Fore color Click the color box, and then click a color for the linesof the scale.
Blink Select the check box to make the scale blink at runtime.Clear the check box to prevent the scale from blinking at runtime.
Back style Click Solid to cover objects or the display backgroundbehind the scale. Click Transparent to allow objects or the displaybackground behind the scale to show through.
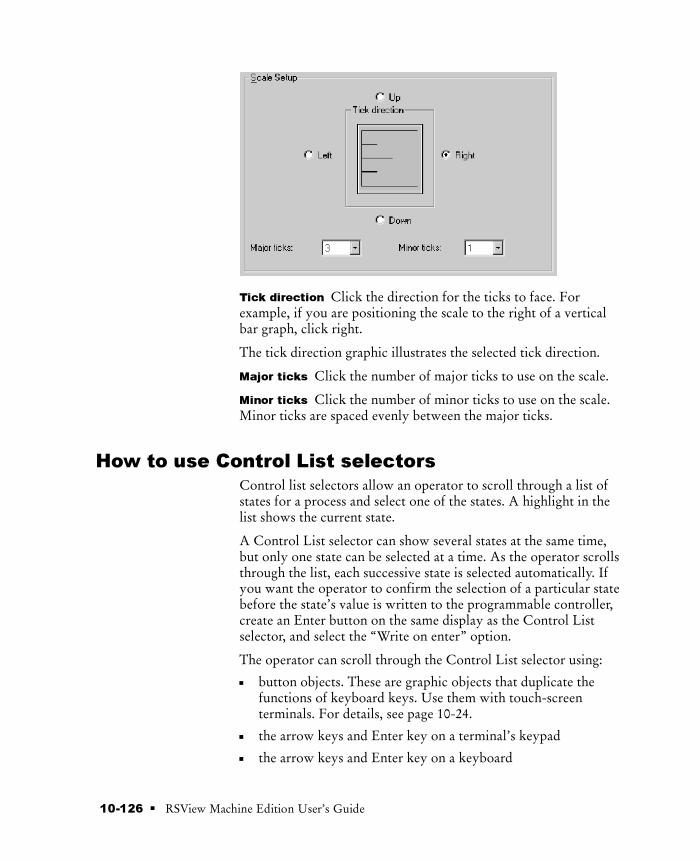
Preface
10-126 � RSView Machine Edition User’s Guide
Tick direction Click the direction for the ticks to face. Forexample, if you are positioning the scale to the right of a verticalbar graph, click right.
The tick direction graphic illustrates the selected tick direction.
Major ticks Click the number of major ticks to use on the scale.
Minor ticks Click the number of minor ticks to use on the scale.Minor ticks are spaced evenly between the major ticks.
How to use Control List selectors
Control list selectors allow an operator to scroll through a list ofstates for a process and select one of the states. A highlight in thelist shows the current state.
A Control List selector can show several states at the same time,but only one state can be selected at a time. As the operator scrollsthrough the list, each successive state is selected automatically. Ifyou want the operator to confirm the selection of a particular statebefore the state’s value is written to the programmable controller,create an Enter button on the same display as the Control Listselector, and select the “Write on enter” option.
The operator can scroll through the Control List selector using:
button objects. These are graphic objects that duplicate thefunctions of keyboard keys. Use them with touch-screenterminals. For details, see page 10-24.
the arrow keys and Enter key on a terminal’s keypad
the arrow keys and Enter key on a keyboard

� 10-127Configuring graphic objects
The operator presses the buttons to scroll up or down the list, or tomake selections from the list. The buttons can be set up to workwith the Control List selector that has input focus, or you can linkthe buttons to a specific Control List selector. For informationabout how particular buttons work with the Control List selector,see page 10-24.
How Enter key handshaking works
When the operator selects a state in the Control List selector andpresses an Enter button or Enter key, the highlighted state’s value iswritten to the programmable controller or device.
You can use Enter key handshaking to hold the value of the tag atthe programmable controller or device for a specific period of time,to ensure the value is read before the Control List selectoroverwrites the value with a new value.
For more information about using Enter key handshaking, seepage 10-12.
Setting up Control List selectors
The Control List selector is a list that allows an operator to cyclethrough and select from multiple options. The Control List selectordisplays the current state of a process or operation by highlightingthe state.
To set up a Control List selector:
1. Double-click the Control List selector.

Preface
10-128 � RSView Machine Edition User’s Guide
2. In the Control List Selector Properties dialog box, fill in theoptions on each tab, as described in the sections that follow.When you are finished, click OK.
Setting up the appearance of theControl List selector
In the General tab, specify what the Control List selector looks likeat runtime.
Border style Click a border style in the list, or click None toremove the border.
Border width Type a number to change the thickness of theControl List selector’s border. Border width is measured in pixels.
Border uses back color Select the check box if you want theControl List selector’s border to have the same color as theselector’s background.
Clear the check box if you want the Control List selector’s borderto have a different color than the selector’s background, and thenchoose a Border color.

� 10-129Configuring graphic objects
Back color Click the color box, and then click a color for theControl List selector’s background.
Border color Click the color box, and then click a color for theControl List selector’s border.
Pattern style Click a pattern style for the selector.
Pattern color Click the color box, and then click a color for thepattern.
Selection back color Click the color box, and then click a colorfor the background of a selected item in the list.
Selection fore color Click the color box, and then click a color forthe text of a selected item in the list.
Blink Select the check box to make the selector blink at runtime.Clear the check box to prevent the selector from blinking atruntime.
Font, size, and style Click a font for the caption in the Font list.Type or click a size for the font in the Size box. Click B to make thefont bold, click I to make the font italic, click U to underline thetext.
Caption truncate Click Word to cut off captions that exceed themaximum length at the beginning of a word. Click Character to cutoff captions that exceed the maximum length in the middle of aword.
The maximum caption length depends on the width of the selectorand the font size.
When a caption has been truncated, an asterisk ( * ) appears on theright of the caption to indicate that text is missing.
Number of states Click the number of states you want theselector to have.

Preface
10-130 � RSView Machine Edition User’s Guide
Write on enter Select this check box to send the Control Listselector’s state value to the programmable controller when theoperator presses Enter.
Clear this check box to send the state value as soon as the operatorselects a new state.
Key navigation Select this check box to allow the operator tonavigate to the Control List selector and give it focus using thekeyboard.
For more information about key navigation, see page 10-8.
Setting up the Control List selector’s statevalues and captions
In the States tab, set up the value and caption for each state. Thevalue defines the Control List selector’s action, by changing theValue control to the value you specify when the selected state is ineffect.
For tips about configuring states, see page 10-1.

� 10-131Configuring graphic objects
Value Type the integer value for each state. The Value controlchanges to this value when the selected state is in effect.
Caption Type the text to display in the list for this state.
Caption back style Click Solid to cover the Control List selector’sbackground color with the caption’s background color. ClickTransparent to hide the caption’s background color.
Caption color Click the color box, and then click a color for thecaption’s text.
Caption back color Click the color box, and then click a color forthe caption’s background.
The caption’s background color is visible only on items in the listthat are not highlighted, and if the Caption back style is Solid.

Preface
10-132 � RSView Machine Edition User’s Guide
Caption blink Select the check box to make the caption blink atruntime. Clear the check box to prevent the caption from blinkingat runtime.
Alignment Click a position in the grid, relative to the Control Listselector. In the default alignment position, the text is aligned on theleft side of the Control List selector.
Setting up the Control List selector to workwith an Enter key
In the Timing tab, set up the timing and handshake settings for theEnter key.
For information about using Enter key handshaking, see page10-12.
Enter key control delay Click the number of milliseconds orseconds to delay between pressing the Enter key and setting theEnter control to 1. Specify the tag to use for the Enter control inthe Connections tab.
Enter key hold time Click the number of milliseconds or secondsthe Enter control remains at a value of 1. This setting applies only ifthe Enter control is assigned and the Enter handshake control is notassigned (in the Connections tab).
Enter key handshake time Click the maximum number ofseconds the Enter control remains at a value of 1. This settingapplies only if the Enter control and Enter handshake control areboth assigned (in the Connections tab).
Handshake reset type Click Non-zero Value to reset the Entercontrol when the Enter handshake control is a non-zero value.Click Zero to Non-zero transition to reset the Enter control whenthe Enter handshake control changes from zero to a non-zero value.

� 10-133Configuring graphic objects
Connecting the Control List selector to data
In the Connections tab, specify the tags or expression with whichthe Control List selector exchanges data. For information aboutassigning tags and expressions, see page 9-32.
Type the tag name,
or expression if
applicable, here.
The arrow shows
whether the control
is a read control
(arrow points left),
a write control
(arrow points right),
or a read and write
control
(double-headed
arrow).
Value The Value control triggers the state’s action. For example,when the tag assigned to the control changes to a new state, the datasource changes a motor’s speed to a new setting.
Enter The Enter control accepts values of 0 or 1 only. The controldetermines how long the Enter key press is registered. No furthervalues can be entered by the selector when the Enter control is setto 1.
Enter handshake The Enter handshake control resets the Entercontrol, using the ”Handshake reset type” option specified on theTiming tab.
Use this control for Enter key handshaking if you want to reset theEnter control when a value in the programmable controllerchanges.
Setting up Local Message displays
Use Local Message displays to provide the operator withinformation about what to do next, or with information about aprocess. At runtime, the Local Message display shows one messageat a time.
To use local messages, create a Local Message display object in agraphic display, and then assign a local message file to the LocalMessage display.

Preface
10-134 � RSView Machine Edition User’s Guide
For more information about local messages, see page 8-29. Forinformation about creating local message files, see page 8-33.
Specify the Local Message display’s appearance, the file of messagesto use with the display, and the tag or expression to monitor formessage trigger values.
To set up a Local Message display:
1. Double-click the Local Message display.
2. In the Local Message Display Properties dialog box, fill in theoptions on each tab, as described in the sections that follow.When you are finished, click OK.
Setting up the appearance of theLocal Message display
In the General tab, specify what the Local Message display lookslike at runtime.
Border style Click a border style in the list, or click None toremove the border.

� 10-135Configuring graphic objects
Border width Type a number to change the thickness of the LocalMessage display’s border. Border width is measured in pixels.
Border uses back color Select the check box if you want theLocal Message display’s border to have the same color as thedisplay’s background.
Clear the check box if you want the Local Message display’s borderto have a different color than the display’s background, and thenchoose a Border color.
Back color Click the color box, and then click a color for theLocal Message display’s background.
Border color Click the color box, and then click a color for theLocal Message display’s border.
Back style Click Solid to cover objects or the display backgroundbehind the Local Message display. Click Transparent to allowobjects or the display background behind the Local Messagedisplay to show through.
Pattern style Click a pattern style for the Local Message display.
Pattern color Click the color box, and then click a color for thepattern.
Fore color Click the color box, and then click a color for the textof the message in the Local Message display.
Blink Select the check box to make the Local Message displayblink at runtime. Clear the check box to prevent the display fromblinking at runtime.
Font, size, and style Click a font for the caption in the Font list.Type or click a size for the font in the Size box. Click B to make thefont bold, click I to make the font italic, click U to underline thetext.
Word wrap Select this check box to wrap words to the next line ifthey are too long for the width of the Local Message display. Clearthis check box to wrap on characters instead.

Preface
10-136 � RSView Machine Edition User’s Guide
The maximum number of characters displayed in the Local Messagedisplay depends on the size of the display and the font.
Alignment Click a position in the grid, relative to the LocalMessage display. In the default alignment position, the text iscentered vertically and horizontally on the Local Message display.
Message file Type the name of the message file to use for thisLocal Message display. Click the Browse button to browse for thefile instead of typing its name.
Connecting the Local Message display todata
In the Connections tab, specify the tag or expression the LocalMessage display is connected to. For information about assigningtags and expressions, see page 9-32.
Type the tag name
or expression here.
The arrow shows
that the tag or
expression is read
only. You cannot
write a value to the
tag or expression.
Value The Value control determines which message in the messagefile is displayed in the Local Message display. For example, if theValue control is 1, the Local Message display shows the messagewhose trigger value is 1.
If no message exists for the trigger value, the display is filled withquestion marks (?).
Setting up Time and Date displays
A Time and Date display shows the current time and date in agraphic display.
Specify the appearance of the Time and Date display, and theformat in which the time and date appear.
Browse button
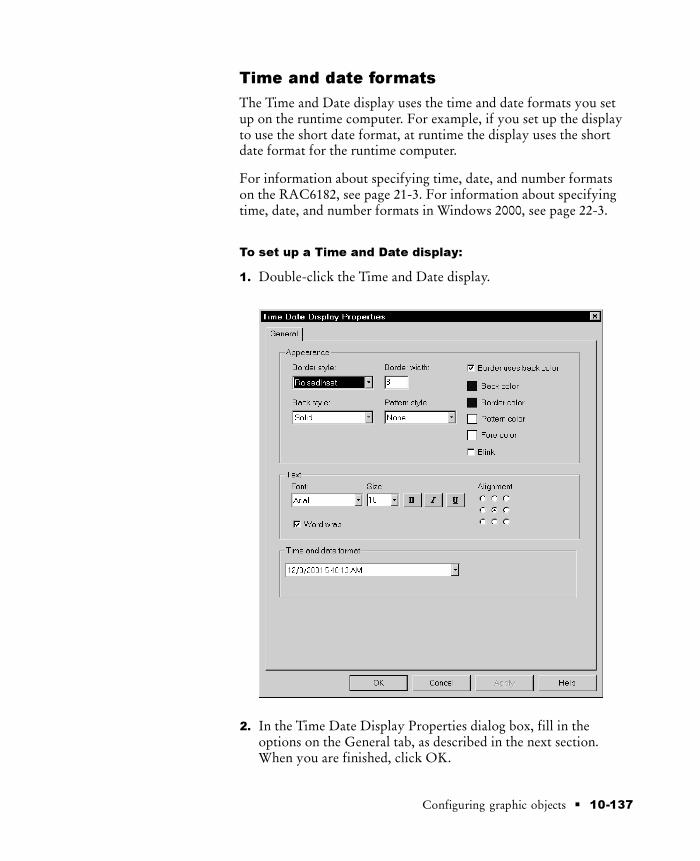
� 10-137Configuring graphic objects
Time and date formats
The Time and Date display uses the time and date formats you setup on the runtime computer. For example, if you set up the displayto use the short date format, at runtime the display uses the shortdate format for the runtime computer.
For information about specifying time, date, and number formatson the RAC6182, see page 21-3. For information about specifyingtime, date, and number formats in Windows 2000, see page 22-3.
To set up a Time and Date display:
1. Double-click the Time and Date display.
2. In the Time Date Display Properties dialog box, fill in theoptions on the General tab, as described in the next section.When you are finished, click OK.

Preface
10-138 � RSView Machine Edition User’s Guide
Setting up the appearance of theTime and Date display
In the General tab, specify what the Time and Date display lookslike at runtime.
Border style Click a border style in the list, or click None toremove the border.
Border width Type a number to change the thickness of the Timeand Date display’s border. Border width is measured in pixels.
Border uses back color Select the check box if you want the Timeand Date display’s border to have the same color as the display’sbackground.
Clear the check box if you want the Time and Date display’s borderto have a different color than the display’s background, and thenchoose a Border color.
Back color Click the color box, and then click a color for the Timeand Date display’s background.
Border color Click the color box, and then click a color for theTime and Date display’s border.
Back style Click Solid to cover objects or the display backgroundbehind the Time and Date display. Click Transparent to allowobjects or the display background behind the Time and Datedisplay to show through.
Pattern style Click a pattern style for the Time and Date display.
Pattern color Click the color box, and then click a color for thepattern.
Fore color Click the color box, and then click a color for the textof the Time and Date display.
Blink Select the check box to make the Time and Date displayblink at runtime. Clear the check box to prevent the display fromblinking at runtime.

� 10-139Configuring graphic objects
Font, size, and style Click a font for the caption in the Font list.Type or click a size for the font in the Size box. Click B to make thefont bold, click I to make the font italic, click U to underline thetext.
Word wrap Select this check box to wrap words to the next line ifthey are too long for the width of the Time and Date display. Clearthis check box to wrap on characters instead.
The maximum number of characters displayed in the Time andDate display depends on the size of the display and the font.
Alignment Click a position in the grid, relative to the Time andDate display. In the default alignment position, the text is centeredvertically and horizontally on the display.
Time and date format Click the format in which to display thetime and date.
Setting up Alarm lists
The Alarm list graphic object notifies the operator when a situationrequiring immediate attention occurs. For example, the list coulddisplay a message that warns the operator that the pressure in aboiler is too high.
RSView comes with a default graphic display called [ALARM] thatcontains an Alarm list object. You can use the display and object asis, customize them, or create your own.
For more information about using Alarm lists, see page 13-27.
Specify the appearance of the Alarm list, and whether it displays allalarms or only unacknowledged alarms.
To set up an Alarm list:
1. Double-click the Alarm list.

Preface
10-140 � RSView Machine Edition User’s Guide
2. In the Alarm List Properties dialog box, fill in the options onthe General tab, as described in the next section. When you arefinished, click OK.
Setting up the appearance and content ofthe Alarm list
In the General tab, specify what the Alarm list looks like atruntime, and which alarms and alarm information it contains.
Border style Click a border style in the list, or click None toremove the border.
Border width Type a number to change the thickness of the Alarmlist’s border. Border width is measured in pixels.
Border uses back color Select the check box if you want theAlarm list’s border to have the same color as the list’s background.
Clear the check box if you want the Alarm list’s border to have adifferent color than the list’s background, and then choose a Bordercolor.

� 10-141Configuring graphic objects
Back color Click the color box, and then click a color for theAlarm list’s background.
Border color Click the color box, and then click a color for theAlarm list’s border.
Header back color Click the color box, and then click a color forthe heading bar at the top of the list.
Header fore color Click the color box, and then click a color forthe text in the heading bar at the top of the list.
Selection back color Click the color box, and then click a colorfor the background of a selected item in the list.
Selection fore color Click the color box, and then click a color forthe text of a selected item in the list.
Font, size, and style Click a font for the caption in the Font list.Type or click a size for the font in the Size box. Click B to make thefont bold, click I to make the font italic, click U to underline thetext.
List type Select whether to show all alarms or only alarms thathaven’t been acknowledged.
Header Select the check box to display a heading bar at the top ofthe alarm list. The heading bar provides titles for the columns ofinformation in the list.
Clear the check box if you don’t want to use a heading bar.

Preface
10-142 � RSView Machine Edition User’s Guide
Alarm time Select the check box to display the Alarm timecolumn. This column shows the time the alarm was triggered.
Clear the check box if you don’t want to use the Alarm timecolumn.
Acknowledge time Select the check box to display theAcknowledge time column. This column shows the time the alarmwas acknowledged. Don’t use this column if the List type is”Unacknowledged alarms only.”
Clear the check box if you don’t want to use the Acknowledge timecolumn.
Time and date format Click the format in which to display thetime and date.
Key navigation Select this check box to allow the operator tonavigate to the Alarm list and give it focus using the keyboard.
For more information about key navigation, see page 10-8.
Setting up Activity lists
The Activity list graphic object displays runtime information aboutsystem activity:
Information messages, such as messages about tag assignments,tag read and write activity, and macro usage.
Warning messages.
Error messages, such as messages about communication errors,invalid values, and unassigned controls.
RSView comes with a default graphic display called [ACTIVITY]that contains an Activity list object. You can use the display andobject as is, customize them, or create your own.

� 10-143Configuring graphic objects
For more information about using Activity lists, see page 15-8.
Specify the appearance of the Activity list, and whether theoperator can navigate to the list using a keyboard.
To set up an Activity list:
1. Double-click the Activity list.
2. In the Activity List Properties dialog box, fill in the options onthe General tab, as described in the next section. When you arefinished, click OK.
Setting up the appearance of the Activitylist
In the General tab, specify what the Activity list looks like atruntime.
Border style Click a border style in the list, or click None toremove the border.
Border width Type a number to change the thickness of theActivity list’s border. Border width is measured in pixels.

Preface
10-144 � RSView Machine Edition User’s Guide
Border uses back color Select the check box if you want theActivity list’s border to have the same color as the list’sbackground.
Clear the check box if you want the Activity list’s border to have adifferent color than the list’s background, and then choose a Bordercolor.
Back color Click the color box, and then click a color for theActivity list’s background.
Border color Click the color box, and then click a color for theActivity list’s border.
Fore color Click the color box, and then click a color for the textin the Activity list.
Selection back color Click the color box, and then click a colorfor the background of a selected item in the list.
Selection fore color Click the color box, and then click a color forthe text of a selected item in the list.
Font, size, and style Click a font for the caption in the Font list.Type or click a size for the font in the Size box. Click B to make thefont bold, click I to make the font italic, click U to underline thetext.
Key navigation Select this check box to allow the operator tonavigate to the Activity list and give it focus using the keyboard.
For more information about key navigation, see page 10-8.
Setting up Information Message displays
The Information Message display graphic object gives the operatorruntime messages about information that requires immediateattention.

� 10-145Configuring graphic objects
RSView comes with a default graphic display called[INFORMATION] that contains an Information Message displayobject. You can use the display and object as is, customize them, orcreate your own.
For more information about using Information Message displays,see page 14-12.
Specify the appearance of the Information Message display.
To set up an Information Message display:
1. Double-click the Information Message display.
2. In the Information Message Display Properties dialog box, fillin the options on the General tab, as described in the nextsection. When you are finished, click OK.
Setting up the appearance of theInformation Message display
In the General tab, specify what the Information Message displaylooks like at runtime.
Border style Click a border style in the list, or click None toremove the border.

Preface
10-146 � RSView Machine Edition User’s Guide
Border width Type a number to change the thickness of theInformation Message display’s border. Border width is measured inpixels.
Border uses back color Select the check box if you want theInformation Message display’s border to have the same color as thedisplay’s background.
Clear the check box if you want the Information Message display’sborder to have a different color than the display’s background, andthen choose a Border color.
Back color Click the color box, and then click a color for theInformation Message display’s background.
Border color Click the color box, and then click a color for theInformation Message display’s border.
Back style Click Solid to cover objects or the display backgroundbehind the Information Message display. Click Transparent to allowobjects or the display background behind the Information Messagedisplay to show through.
Pattern style Click a pattern style for the Information Messagedisplay.
Pattern color Click the color box, and then click a color for thepattern.
Fore color Click the color box, and then click a color for the textof the Information Message display.
Blink Select the check box to make the Information Messagedisplay blink at runtime. Clear the check box to prevent the displayfrom blinking at runtime.
Font, size, and style Click a font for the caption in the Font list.Type or click a size for the font in the Size box. Click B to make thefont bold, click I to make the font italic, click U to underline thetext.
Word wrap Select this check box to wrap words to the next line ifthey are too long for the width of the Information Message display.Clear this check box to wrap on characters instead.

� 10-147Configuring graphic objects
The maximum number of characters displayed in the InformationMessage display depends on the size of the display and the font.
Alignment Click a position in the grid, relative to the InformationMessage display. In the default alignment position, the text iscentered vertically and horizontally on the display.


� 11-1Animating graphic objects
Animating graphicobjectsThis chapter describes:
the types of animation and which objects support which types ofanimation
using the Animation dialog boxtesting animation
using tag names, tag placeholders, and expressions whenattaching animation
setting the minimum and maximum values for animation thatuses a range of motion
using Object Smart Path� to define an object’s range of motion
configuring each type of animationapplying animation to groups
checking what kind of animation is attached to an objectchanging animation settings
copying and pasting animation
Types of animationAnimation associates graphic objects with tags so the appearance orposition of an object changes to reflect changes to the tag’s value.For example, the object’s color could change from yellow to orangeto red as the tag’s value increases. Or a slider could move from left toright as a tag’s value increases.
You can use these types of animation:
color
fillheight
horizontal positionhorizontal slider
rotation
11Chapter

Preface
11-2 � RSView Machine Edition User’s Guide
vertical position
vertical slider
visibility
width
The Objects sample project contains many examples of animation.In particular, see the graphic displays called “Animation I” and“Animation II.”
Which objects can have which types ofanimation?
This table summarizes which types of objects support which typesof animation. For information about the different types of graphicobjects, see page 9-1.
These objects Support these types of
animation
Drawing objects, except images,panels, and rounded rectangles
All types
Rounded rectangles All types except rotation
All other objects Visibility
You can also attach all types of animation to groups of drawingobjects. For more information, see page 11-27.
You can attach as many types of animation to a drawing object asyou like. For example, apply width, height, horizontal position, andvertical position animation to an object to give it the appearance ofmoving into or out of the display as it shrinks and grows.
Using the Animation dialog box
To attach animation, use the Animation dialog box.
To open the Animation dialog box, do one of the following:
Select an object, and then on the View menu click Animation.
Select an object, and then on the Animation menu click ananimation type. Animation types that are not supported for theselected object are disabled.

� 11-3Animating graphic objects
Right-click an object, select Animation, and then click ananimation type. Animation types that are not supported for theselected object are disabled.
View menu Animation menu
About the Animation dialog box
The Animation dialog box is a floating dialog box, which means youcan keep it open all the time and can move it around the screen,select other objects, and open other dialog boxes.

Preface
11-4 � RSView Machine Edition User’s Guide
Animation tabs Expression box
Expression range Animation result
Animation tabs
Click the tab for the type of animation to configure. If the animationtype is not supported for the selected object, the boxes in the tab aredimmed.
Touch and OLE Verb animation are not supported in machine-levelprojects.
Expression box
Create an expression either by typing it or by clicking theExpression button.
To supply a tag name for an expression, click the Tags button andthen select a name, or type the name in the Expression box. If youuse multiple tags in an expression, the first tag’s minimum andmaximum values are used if you select the “Use tag’s min and maxproperty values” expression range.
Enclose tag names that contain dashes or start with a number inbraces { } when you use them in an expression. This distinguishes thecharacters in the tag name from the characters in the expression.
For more information about creating expressions, see Chapter 12.

� 11-5Animating graphic objects
For horizontal and vertical sliders, you assign a single tag to defineanimation. In the Animation tabs for slider animation, there is a Tagsbox rather than an Expression box.
Expression range
Specify how to calculate the minimum and maximum values for thetag or expression. If a value falls outside the specified range, it will beevaluated as either the minimum or maximum value. For details, seepage 11-7.
Animation Result
Specify how the object’s appearance changes based on the result ofthe expression. The boxes in this area change for each type ofanimation.
For some types of animation, you specify a change of state. Forexample, an object with visibility animation switches between visibleand invisible.
For other types of animation, you specify a range of motion. Forexample, an object can move from a fixed starting point to a fixedend point. The range of motion is related to the minimum andmaximum values for the expression. The object moves from the AtMinimum position to the At Maximum position as the expressionvalue changes to the maximum value.
Apply, Delete, and Close Buttons
These buttons do the following:
This button Does this
Apply Applies the animation configuredfor the selected object or group ofobjects. Choosing another tab is thesame as choosing Apply—theanimation you configured is appliedto the object.
Delete Deletes the animation for theselected object.
Close Prompts to apply changes andcloses the dialog box.

Preface
11-6 � RSView Machine Edition User’s Guide
Using Object Smart Path to visually setanimation
Because the Animation dialog box stays open, you can go back andforth between the dialog box and the graphic display. This makes iteasy to set the range of motion for an object because you do nothave to know how many pixels you want an object to move. Instead,use the Object Smart Path feature. For details, see page 11-8.
Testing animationTo test the animation you have set up in a graphic display, use theTest Display tool to switch to test display mode. When you arefinished testing, switch back to edit display mode to continueediting.
To switch between test display and edit display modes:
� On the View menu, click Test Display or Edit Display, or clickthe Test Display and Edit Display tools.
IMPORTANT Test display mode is not the same as running thedisplay. Test display mode does not change theappearance or position of the display as set up inthe Display Settings dialog box.
Using tag names and tag placeholdersWhen configuring animation for objects, you are linking objects totags, so you have to specify a tag name or tag placeholder. Followingis a brief description of how to use tag names and placeholders.
Tag names
You can use tag names that you have already added to the tagdatabase or you can use a new tag name.
Tag placeholders
Tag placeholders allow you to create displays that can be used withdifferent tags.
You can use tag placeholders in:
the graphic display that opens when the project is first run
graphic displays that are opened using a Goto Display button
Edit Display tool
Test Display tool

� 11-7Animating graphic objects
Use parameter files to specify which tags to substitute for whichplaceholders. For information about creating parameter files, seepage 8-25.
To create a tag placeholder:
� In the Expression box, type the cross-hatch character followedby a number (no space in between). For example, #1.
Using expressions
Many types of animation require an expression. You can useexpressions containing tag values, constants, mathematical equations,and if-then-else logic. A tag name or tag placeholder can be includedas part of an expression, or it can stand alone as the entireexpression.
For more information about expressions, see Chapter 12.
Setting minimum and maximum values
Many types of animation require a minimum and maximum rangefor the tag or expression. These values determine the start and endpoints for a range of motion.
For example, if you specify a minimum of 0 and a maximum of 100,the object will not react to values outside of this range. So, even ifthe expression has a value of 200, the object does not change from itsAt Maximum position.
When configuring animation, select one of these methods forcalculating the minimum and maximum values:
Use tag’s min and max property values—select this method touse the minimum and maximum values of the first tag in theexpression. That is, if multiple tags are used in the expression, thefirst tag’s minimum and maximum values are used.
For analog tags, the values are taken from the Minimum andMaximum boxes in the Tag Database editor. For digital tags, theminimum is 0 and the maximum is 1.
Use constant—select this method to use numeric constants. Typethe minimum and maximum values in the boxes.

Preface
11-8 � RSView Machine Edition User’s Guide
Read from tags—select this method to read two tags’ values todetermine the minimum and maximum values. Type the tagnames in the boxes, or click the Browse buttons to open the Tagsdialog box and select the tags.
If you use this method, the tags are read when the graphic displayopens. Their values at that time are used for the minimum andmaximum values. The tags are not read again after this.
Defining a range of motion
To define a range of motion for an object, do one of the following:
Use the mouse to move the object in the display. This uses theObject Smart Path feature to visually define the range of motion.
Type values in the At Minimum and At Maximum boxes.
All motion is defined in pixels.
Animation that does not use a range ofmotion
Visibility and color animation do not use a range of motion, becausethese types of animation represent a change of state, not a range.
Using Object Smart Path
With Object Smart Path, you can easily set the range of motion foran object. The following example shows how Object Smart Pathworks.
Example: Using Object Smart Path to define the range ofmotion for horizontal slider animation
To define a range of motion for a slider object:
1. In the Graphics Display editor, create a slider object using a lineand a rectangle, or copy a slider object from the Sliders graphiclibrary.
2. Open the Animation dialog box and click the Horizontal Slidertab.
3. In the display, select the rectangle in the slider object.
Browse button

� 11-9Animating graphic objects
4. In the Tag box of the Animation dialog box, specify a tag name.
5. In the display, drag the rectangle to the position that will indicatethe lowest number in the range.
In the Animation dialog box, set this position by clicking the AtMinimum check box.
6. In the display, drag the rectangle to the position that will indicatethe highest number in the range.
In the Animation dialog box, set this position by clicking the AtMaximum check box.

Preface
11-10 � RSView Machine Edition User’s Guide
7. To save the settings, click Apply.
When you finish configuring the animation, the rectangle returnsto its original position.
Configuring visibility animation
With visibility animation, an object becomes visible or invisiblebased on a tag value or the result of an expression.
If an object is invisible, it is disabled.
Visibility animation is available for all objects. Visibility animationoverrides an object’s Visible property.
To configure visibility animation:
1. Select the object.
2. In the Animation dialog box, click the Visibility tab.
3. In the Expression box, create an expression.

� 11-11Animating graphic objects
4. Specify the Expression True State:
Invisible—Click this if you want the object to be invisiblewhen the tag or expression value is true—that is, when it doesnot equal 0.
Visible—Click this if you want the object to be visible whenthe tag or expression value is true—that is, when it does notequal 0.
5. Click Apply.
Example: Using visibility animation to set up security for agraphic display
This example shows how to use visibility animation to control whatoperators can see. In a graphic display that all users can access, onlythe Admin user can see the graphic object to which this animation isattached.
This example uses the security function CurrentUserName( ). Thefunction returns the string value of the Account ID (user name) forthe user who is currently logged in.
The CurrentUserName( ) function is case sensitive. All user namesuse upper case letters, so make sure that you use upper case letters inyour expression.
To specify which user can view an object in a display:
1. Select the object to which to limit visibility.
2. Open the Animation dialog box and click the Visibility tab.
3. In the Expression box, type this:
CurrentUserName( ) == “ADMIN”
4. For the Expression True State, click Visible.

Preface
11-12 � RSView Machine Edition User’s Guide
5. Click Apply, and then click Close.
At runtime, the object will only be visible if the Admin user islogged in.
Configuring color animation
With color animation, an object changes color based on a tag valueor the result of an expression. You can specify up to 16 color changes(A to P) for any object. Colors can be solid or blinking. For eachcolor change, specify the value or threshold at which the color is tochange and specify the colors to change to. At runtime, when thevalue reaches or crosses the threshold, the color changes.
Color animation is available for all drawing objects except imagesand panels.

� 11-13Animating graphic objects
To return to the default
colors and thresholds,
click this button.
The list box displays
the values and colors
for each threshold.
The parts of the list box
Foreground color
Background color
Threshold value
Threshold
If you select white, the color box is
not visible against the white
background of the dialog box.
A box with two colors shows the
colors the object will alternate
between when blinking.
To configure color animation:
1. Select the object.
2. In the Animation dialog box, click the Color tab.
3. In the Expression box, create an expression.
4. In the list box, select a threshold (A through P) for which toconfigure a value and colors. You can change the default valuesand colors for thresholds A and B. The other thresholds have nodefaults.

Preface
11-14 � RSView Machine Edition User’s Guide
5. In the Value box, type the threshold value. When the expressionvalue reaches this threshold, the object’s color changes.
Enter threshold values in ascending order. That is, A must belower than B, B must be lower than C, and so on.
To delete a value for a threshold (A - P), select the threshold anddelete the value in the Value box. In the list box, the value isreplaced with “No value.”
6. Click Solid or Blink for the foreground and background colors,and then select the foreground and background colors to use.
Foreground colors apply to the object’s Fore color and Patterncolor properties. Background colors apply to the object’s Backcolor properties.
To select a color, click the color box, and then click the desiredcolor.
Specify the solid color here. Specify the blinking colors here.
If you select blink, the two colors must be different.
7. Repeat steps 4 through 6 to configure additional thresholds.
8. In the Blink Rate box, specify how many seconds each blinkcycle will be. For example, if you specify four seconds, the objectwill be one color for two seconds and the other color for twoseconds.
9. Click Apply.
Example 1: Creating a Text object that blinks
This example describes how to create a text object that constantlyblinks between two colors. Since the blinking is not based onchanges in tag values, the expression is simply a constant value thatmatches the value for the selected threshold.
For details about creating text, see page 9-10.
1. Select the text object.
2. Open the Animation dialog box, and then click the Color tab.

� 11-15Animating graphic objects
3. In the Expression box, type 0.
Zero is the default value for threshold A.
4. In the list box, click threshold A. (Leave the value in the Valuebox as 0.)
5. For the foreground color, click Blink. (If desired, click Blink forthe background color too.)
6. For each color, click the color box, and then click the color touse.
7. Click Apply.
Example 2: Creating an object that changes color as the filllevel changes
This example describes how to create a rectangle object that changescolor as the object’s fill level increases. This example uses a tag calledHopper1\FlourLevel. The tag has a range of 1 to 100. When theflour level reaches 80, the rectangle blinks between gray and yellowto warn the operator that the hopper is nearly full. When the flourlevel reaches 95, the rectangle blinks between gray and red.
You could use a Bar Graph object (without animation) to achieve asimilar result.
1. Double-click the rectangle to open its Properties dialog box.Assign these properties to the rectangle:
In the Back style box, select Solid.
For the Fore color and Back color, select gray.
2. Click OK to close the properties dialog box.
3. With the rectangle selected, open the Animation dialog box, andthen click the Fill tab. Attach fill animation as follows:
In the Expression box, type Hopper1\FlourLevel (this is thetag that controls the fill level).
For Fill Direction, click Up.
4. Click the Color tab and then attach color animation as follows:
In the Expression box, type Hopper1\FlourLevel (the sametag that was used in the Fill tab).

Preface
11-16 � RSView Machine Edition User’s Guide
Configure the color for the normal state
In the list box, click A. (In the Value box, leave the value as 0.)
For foreground and background colors, click Solid.
For each, click the color box, and then click gray (the samegray used for the rectangle).
Configure the color for the first warning
In the list box, click B.
In the Value box, type 80.
For foreground and background colors, click Blink.
GrayYellow
For the foreground colors, select gray for the first color andyellow for the second color. Repeat for the backgroundcolors.
Configure the color for the second warning
In the list box, click C.
In the Value box, type 95.
For the foreground and background colors, click Blink.
GrayRed
For the foreground colors, select gray for the first color andred for the second color. Repeat for the background colors.
5. Click Apply.
Configuring fill animationWith fill animation, the level of fill in an object is based on a tagvalue (or the result of an expression) in relation to the specifiedminimum and maximum values. For example, if the value of theexpression is halfway between the minimum and maximum values,the object will be half full.

� 11-17Animating graphic objects
Fill animation is available for all drawing objects (including groupobjects) except images and panels.
If you select the Inside Only check box, fill animation does notaffect line objects or objects with transparent backgrounds.
If you clear the Inside Only check box, fill animation does not affecthorizontal lines.
To configure fill animation:
1. Select the object.
2. In the Animation dialog box, click the Fill tab.
3. In the Expression box, create an expression.
4. Specify At Minimum and At Maximum values for the fillpercentage levels.
5. Click a fill direction.
6. If you want the object’s outline to remain constant so only theinside fill level varies, select the Inside Only check box.
7. Select the method to use to calculate the expression’s minimumand maximum values.
8. Click Apply.

Preface
11-18 � RSView Machine Edition User’s Guide
Configuring horizontal position animation
With horizontal position animation, an object moves horizontallybased on a tag value (or the result of an expression) in relation to thespecified minimum and maximum values. For example, if the valueof the expression is halfway between the minimum and maximumvalues, the object will be halfway between its minimum andmaximum pixel offset.
Horizontal position animation is available for all drawing objectsexcept images and panels.
To configure horizontal position animation:
1. Select the object.
2. In the Animation dialog box, click the Horizontal Position tab.
3. In the Expression box, create an expression.
4. Set the starting point for the object by dragging the object or bytyping a value in pixels (in relation to its current position on thedisplay). Click the At Minimum check box.
5. Set the ending point for the object by dragging the object or bytyping a value in pixels (in relation to its current position on thedisplay). Click the At Maximum check box.
6. Select the method to use to calculate the expression’s minimumand maximum values.
7. Click Apply.

� 11-19Animating graphic objects
Configuring vertical position animation
With vertical position animation, an object moves vertically based ona tag value (or the result of an expression) in relation to the specifiedminimum and maximum values. For example, if the value of theexpression is halfway between the minimum and maximum values,the object will be halfway between its minimum and maximumoffset.
Vertical position animation is available for all drawing objects exceptimages and panels.
To configure vertical position animation:
1. Select the object.
2. In the Animation dialog box, click the Vertical Position tab.
3. In the Expression box, create an expression.
4. Set the starting point for the object by dragging the object or bytyping a value in pixels (in relation to its current position on thedisplay). Click the At Minimum check box.
5. Set the ending point for the object by dragging the object or bytyping a value in pixels (in relation to its current position on thedisplay). Click the At Maximum check box.
6. Select the method to use to calculate the expression’s minimumand maximum values.
7. Click Apply.

Preface
11-20 � RSView Machine Edition User’s Guide
Configuring width animation
With width animation, an object’s width changes based on a tagvalue (or the result of an expression) in relation to the specifiedminimum and maximum values. For example, if the value of theexpression is halfway between the minimum and maximum values,the object will be half the full width.
Width animation is available for all drawing objects except imagesand panels.
To configure width animation:
1. Select the object.
When the object is first selected, its width is 100 percent.
2. In the Animation dialog box, click the Width tab.
3. In the Expression box, create an expression.
4. Set the minimum width for the object by doing one of thefollowing:
Click a handle on the left or right side of the object and dragit to resize the object.
Type the width (as a percentage of the full width) you wantthe object to be when the expression evaluates to its minimumvalue.
Select the At Minimum check box.

� 11-21Animating graphic objects
5. Set the maximum width for the object by doing one of thefollowing:
Click a handle on the left or right side of the object and dragit to resize the object.
Type the width (as a percentage of the full width) you wantthe object to be when the expression evaluates to itsmaximum value.
Select the At Maximum check box.
6. Click an anchor point.
This is the part of the object that does not move. For example,click Left if you do not want the left side of the object to move.As the value of the expression changes, the object will grow to orshrink from the right.
7. Select the method to use to calculate the expression’s minimumand maximum values.
8. Click Apply.
Configuring height animationWith height animation, an object’s height changes based on a tagvalue (or the result of an expression) in relation to the specifiedminimum and maximum values. For example, if the value of theexpression is halfway between the minimum and maximum values,the object will be half the full height.
Height animation is available for all drawing objects except imagesand panels.

Preface
11-22 � RSView Machine Edition User’s Guide
To configure height animation:
1. Select the object.
When the object is first selected, its height is 100 percent.
2. In the Animation dialog box, click the Height tab.
3. In the Expression box, create an expression.
4. Set the minimum height for the object by doing one of thefollowing:
Click a handle on the top or bottom of the object and drag itto resize the object.
Type the height (as a percentage of the full height) you wantthe object to be when the expression evaluates to its minimumvalue.
Select the At Minimum check box.
5. Set the maximum height for the object by doing one of thefollowing:
Click a handle on the top or bottom of the object and drag itto resize the object.
Type the height (as a percentage of the full height) you wantthe object to be when the expression evaluates to itsmaximum value.
Click the At Maximum check box.
6. Click an anchor point.
This is the part of the object that does not move. For example,click Top if you do not want the top of the object to move. Asthe value of the expression changes, the object will grow to orshrink from the bottom.
7. Select the method to use to calculate the expression’s minimumand maximum values.
8. Click Apply.
Configuring rotation animation
With rotation animation, an object rotates around an anchor pointbased on a tag value (or the result of an expression) in relation to thespecified minimum and maximum values. For example, if the valueof the expression is halfway between the minimum and maximumvalues, the object will rotate half the specified amount.

� 11-23Animating graphic objects
Rotation animation is available for all drawing objects except images,panels, and rounded rectangles. If you apply rotation animation totext, the text rotates around the anchor point but remains in theupright position.
To configure rotation animation:
1. Select the object.
2. In the Animation dialog box, click the Rotation tab.
3. In the Expression box, create an expression.
4. Set the center of rotation using one of the methods describedbelow. The center of rotation is the point around which theobject will rotate. This point can be inside or outside of theobject. If it is outside, the object will appear as if it is moving inan arc.
Using the Default Center Points
To use the default center points, click a Center of Rotationbutton.
Why use the default center points? If you set the center ofrotation with the default center points, the object will rotatearound the same point even if the object is resized. For example,the top-middle point will always be the center of rotation nomatter what size the object is.

Preface
11-24 � RSView Machine Edition User’s Guide
Specifying Coordinates
The default coordinates 0,0 are the center of the object; allcoordinate values are relative to the center. To specifycoordinates, do one of the following:
Select the button beside the coordinates box. Place the mousepointer over the object’s cross-hair until the cursor changes toa cross-hair, and then click and drag the cross-hair to thedesired center of rotation.
Type values in the coordinates box, and then select the buttonbeside the box.
5. Set the range of motion for the object.
To set the minimum, do one of the following and then select theAt Minimum check box:
With the cursor indicating the Rotate tool (not thecross-hair), visually set the degree of rotation by clicking themouse and dragging until the object is in the desiredminimum (beginning) position.
Type the desired minimum degree of rotation (this value isrelative to the object’s current position). For clockwiserotation, use a positive number. For counterclockwiserotation, use a negative number.
To set the maximum, do one of the following and then select theAt Maximum check box:
With the cursor indicating the Rotate tool (not thecross-hair), visually set the degree of rotation by clicking themouse and dragging until the object is in the desiredmaximum (ending) position.
Type the desired maximum degree of rotation (this value isrelative to the object’s current position). For clockwiserotation, use a positive number. For counterclockwiserotation, use a negative number.
6. Select the method to use to calculate the expression’s minimumand maximum values.
7. Click Apply.
Object’s
cross-hair
Rotate tool

� 11-25Animating graphic objects
Configuring horizontal slider animationWith horizontal slider animation, you can use a drawing object to setthe value of a tag. To do this, define a path for the object. Atruntime, when the operator moves the object horizontally (using amouse), the pixel position of the object is translated into values thatare written to the tag. If the tag value is changed externally, theposition of the slider changes as well.
An object can have both vertical and horizontal slider animation.
Horizontal slider animation is available for all drawing objectsexcept images and panels.
Here are some tips for creating slider objects:
The Sliders graphic library contains several slider objects you candrag and drop into your graphic displays. Attach slideranimation to the button portion of the slider object.
If you create your own slider object, it’s useful to draw an object(for example, a line) to represent the path the slider will movealong.
To configure horizontal slider animation:
1. Select the object.
2. In the Animation dialog box, click the Horizontal Slider tab.
3. In the Tag box, type the name of the tag whose value will be setby the slider.
4. Set the starting point for the slider object by dragging the objector by typing a value (in relation to its current position on thedisplay). Select the At Minimum check box.

Preface
11-26 � RSView Machine Edition User’s Guide
5. Set the ending point for the slider object by dragging the objector by typing a value (in relation to its current position on thedisplay). Select the At Maximum check box.
6. Select the method to use to calculate the minimum and maximumvalues that are written to the tag.
7. Click Apply.
Configuring vertical slider animation
With vertical slider animation, you can use a drawing object to setthe value of a tag. To do this, define a path for the object. Atruntime, when the operator moves the object vertically (using amouse), the pixel position of the object is translated into values thatare written to the tag. If the tag value is changed externally, theposition of the slider changes as well.
An object can have both vertical and horizontal slider animation.
Vertical slider animation is available for all drawing objects exceptimages and panels.
For tips for creating slider objects, see page 11-25.
To configure vertical slider animation:
1. Select the object.
2. In the Animation dialog box, click the Vertical Slider tab.
3. In the Tag box, type the name of the tag whose value will be setby the slider.

� 11-27Animating graphic objects
4. Set the starting point for the slider object by dragging the objector by typing a value (in relation to its current position on thedisplay). Select the At Minimum check box.
5. Set the ending point for the slider object by dragging the objector by typing a value (in relation to its current position on thedisplay). Select the At Maximum check box.
6. Select the method to use to calculate the minimum and maximumvalues that are written to the tag.
7. Click Apply.
Applying animation to groupsYou can apply animation to objects and then group those objectsand apply animation to the group. When the display is running,animation is applied as follows:
These types of animation Are applied like this
Color, fill Animation attached to individual objectswithin the group overrides groupanimation.
Horizontal slider, verticalslider
Group animation overrides animationattached to individual objects within thegroup.
Height, width, horizontalposition, vertical position,and rotation
Animation results for individual objectsand the group are combined. For example,if an individual’s horizontal positionanimation result is to offset the object by100 pixels, and the group’s result is tooffset the group by 200 pixels, theindividual object is offset by 300 pixels.
Visibility When the group’s animation visibility isFalse (the group is not visible), then noobjects in the group are visible, regardlessof the animation status of the individualobjects.
When the group’s animation visibility isTrue (the group is visible), the visibility ofan object within the group is determinedby the individual object animation.
Test your animation to ensure you achieve the intended results.
To apply animation to objects within groups, use the group editfeature. For details, see page 9-45.

Preface
11-28 � RSView Machine Edition User’s Guide
Checking the animation on objects
To see what type of animation has been set up for an object or groupof objects, use the Animation menu or the Animation dialog box. Tosee what type of animation has been set up for objects within agroup, use the group edit feature. For details, see page 9-45.
To view the animation on an object using the menu:
1. Select an object.
2. View the animation by doing one of the following:
Click the Animation menu and see which items have a checkmark.
Right-click the object and then select Animation to see whichitems have a check mark.
This strangely-
designed object
has visibility,
color, fill, and
horizontal slider
animation.
To view the animation on an object using the Animation
dialog box:
1. Select an object.
2. On the View menu, click Animation.
When the Animation dialog box opens, look at which tabs havecheck marks on them to see which types of animation have beenset up.

� 11-29Animating graphic objects
Changing the animation on objectsYou can change the animation attached to an object, a group ofobjects, or to individual objects within the group. To access objectswithin a group, use the group edit feature. For details, see page 9-45.
To change the animation on objects:
1. Select the object or group.
2. Open the Animation dialog box.3. Make the required changes.
4. Click Apply.
Copying or duplicating objects with animationYou can copy or duplicate objects that have animation attached tothem. When you do, the animation attached to the objects is alsocopied or duplicated. If you copy or duplicate a group, the copy ofthe group can be ungrouped to individual objects, just like theoriginal.
For information about copying and duplicating objects, seepages 9-38 and 9-40.
Copying animation without copying objectsIf you have attached animation to an object, you can copy theanimation and paste it onto another object. If the object has morethan one type of animation, all animation is copied and pasted. Notethat you can only copy animation to an object that supports thesame type of animation.

Preface
11-30 � RSView Machine Edition User’s Guide
To copy and paste animation:
1. Select the object that has the animation you want to copy.
2. On the Edit menu, click Copy Animation, or right-click theobject and then click Copy Animation.
3. Select the objects to copy the animation to.
4. On the Edit menu, click Paste Animation.
To paste to a single object, you can right-click the object andthen click Paste Animation.

� 12-1Creating expressions
Creating expressionsThis chapter describes:
the types of expression components
which editors use expressions
using the Expression editor
creating and formatting expressions
using tag names and tag placeholders with expressions
using constants
using operators, math and security functions, and if-then-elselogic in expressions
the evaluation order of operators
using write expressions
About expressionsSometimes the data you gather from devices is meaningful onlywhen you:
compare it to other values
combine it with other values
create a cause-effect relationship with other values
Expressions allow you to create mathematical or logicalcombinations of data that return more meaningful values.Depending on the components used in the expression, the valuereturned can be in the form of a numeric value, a true/false value, ora text string.
Expressions that result in floating pointvalues
You can assign expressions to many of the controls in RSView. If theexpression results in a floating point value but an integer value isrequired, the floating point value is rounded.
For information about how values are rounded, see page 7-3.
12Chapter

Preface
12-2 � RSView Machine Edition User’s Guide
Expression components
Expressions can be built from:
tag values
constants
arithmetic, relational, logical, and bitwise operators
mathematical and security functions
if-then-else logic
Tags, arithmetic operators, bitwise operators, and mathematicalfunctions such as SQRT (square root) return numeric values.
Relational and logical operators return true/false values. The securityfunction CurrentUserHasCode(x) also returns a true/false value.
The security function CurrentUserName( ) returns a string value.
Expressions that use if-then-else logic can return numeric values,true/false values, or text strings, depending on how they arestructured. These are called conditional expressions because theresult of the expression depends on whether the If statement is trueor false. When the If statement evaluates to true, the result is definedby the Then statement. When the If statement is false, the result isdefined by the Else statement.
The Objects sample project contains many examples of expressions.For example, see the alarm triggers in the Alarm Setup editor.
Where you can use expressions
You can use expressions in these editors:
Graphics Display—You can define an expression to controlvarious aspects of a graphic object’s appearance. For moreinformation, see Chapter 9.
You can also use expressions to attach animation to graphicobjects. For more information, see Chapter 11.
Global Connections—You can use expressions to remotelycontrol the opening and printing of displays, as well as the dateand time to display. For more information, see Chapter 19.
Alarm Setup—When configuring alarms, you can use expressionsfor alarm triggers, and with some of the controls that silence andacknowledge alarms. For more information, see Chapter 13.

� 12-3Creating expressions
Information Setup—You can use expressions to determine whento display information messages. For more information, seeChapter 14.
Macros—You can use expressions in macros to assign values totags. For more information, see page 7-32.
Using the Expression editor
To create an expression, you can:
type it directly in the “Tag or expression” column, for anycontrol that accepts expressions, or in the Expression box (foranimation)
open the Expression editor, and then create the expression in theeditor, as described on page 12-5
Using the Expression editor versus typingexpressions directly
Once you are familiar with expression syntax, you might find itquicker to create short expressions by typing them directly in the“Tag or expression” column.
The Expression editor allows you to see more text at once, which isuseful for longer, more complicated expressions. Also, you can clickbuttons to enter tag names, operators, and functions, thus avoidingtyping mistakes. Also, in the Expression editor, you can check thatthe syntax of the expression you’ve created is valid.
To create an expression by typing it directly:
� Type an expression up to 999 characters long.
Expressions that you type directly are not checked for syntax.
To open the Expression editor, do one of the following:
Click the Browse button in the Exprn column for a control thataccepts expressions.
The Browse button is not available for controls to which you canassign only tags.
In the Animation dialog box only, click the Expression button.
Browse button in
the Exprn column

Preface
12-4 � RSView Machine Edition User’s Guide
About the Expression editor
The Expression editor has these parts:
Expression box
Expression buttons
Validation area
Cursor position
Expression box
The Expression box is a text edit area where you can buildexpressions. Enter text directly and use the expression buttons tobuild the expression.
Expression buttons
These are the expression buttons:
This button Displays a list of
If If-then-else operators
Logical Logical operators
Relational Relational operators
Arithmetic Arithmetic operators
Bitwise Bitwise operators
Functions Mathematical and securityfunctions (clicking the buttonopens the Functions box)
Tags Tags in the tag database

� 12-5Creating expressions
Validation area
To validate your expression, click the Check Syntax button. You cancheck the syntax as often as you like. When you make changes, theexpression is no longer validated.
If an expression is without errors, “Valid” appears in the textbox.
If an expression has not been validated, the text box remainsempty.
If there are errors in the expression, a description of the error andthe location appears in the text box.
Cursor position
The Line and Column boxes show the cursor position in theExpression box.
Creating expressions
Choose the type of
operation performed by
the expression.
Create an expression.
Validate the syntax.
Locate syntax errors.
To create an expression in the Expression editor:
1. Type the expression in the Expression box, up to 999 characterslong.
2. To use a tag in the expression, you can type the tag name directlyor click Tags and then select the tag to use.
You cannot use block tags in expressions.

Preface
12-6 � RSView Machine Edition User’s Guide
For more information about using tags in expressions, seepage 12-7.
3. To use an operator, you can type it directly or click an expressionbutton and then click the operator to use.
4. To use a function, click Functions.
To limit the functions in the
list to the type of function you
want to use, click a category.
5. In the Functions box, click the function to use, and then clickOK.
6. To validate your expression, click Check Syntax.
If your expression has a syntax error, the line and columnlocation appears beside the Check Syntax button.
For information about formatting expressions, see page 12-6.
Cutting, copying, and pasting expressionsYou can cut, copy, or paste an expression or parts of an expressionbetween objects and editors.
To do this Do this And then press this
Cut Select the text Ctrl-X
Copy Select the text Ctrl-C
Paste Double-click in the columnor click in the Expressionbox and then position thecursor where you want thetext
Ctrl-V
Formatting expressionsYou can format expressions so they are easier to read. However, donot let tag names, function names, or function arguments span morethan one line.

� 12-7Creating expressions
When formatting expressions, you can use line returns and multiplespaces.
Enclose strings in quotes. The string can contain any character, andcan include spaces.
Example: Formatting an expression
To format this if-then-else statement, you can align the Else with theappropriate If so the logic is easy to understand:
If (tag1 > tag2) Then 0Else If (tag1 > tag3) Then 2Else 4
Or you can condense it to the following:
If (tag1 > tag2) Then 0 Else If (tag1 > tag3) Then 2 Else 4
Using tag names and tag placeholdersA tag name can be included as part of an expression or can standalone as the entire expression.
To supply a tag name, do one of the following:
Type a tag name.
You can type a tag name that does not exist in the tag database.When you click OK, you are prompted to create the tag. You cancreate it now, or write down the name and create it later.
Click the Tags button and select a tag from the Tags dialog box.
Enclose tag names that contain dashes or start with a number inbraces { } when you use them in an expression. This distinguishes thecharacters in the tag name from the characters in the expression.
You can use string tags as operands with the plus (+) arithmeticoperator and with the relational operators.
You cannot use block tags in expressions.
Using tag placeholders instead of tagnames
The Graphics Display editor accepts tag placeholders instead of tagnames. Placeholders allow you to use the same display with differentsets of tags.

Preface
12-8 � RSView Machine Edition User’s Guide
You can use tag placeholders in:
the graphic display that opens when the project is first run
graphic displays that are opened using a Goto Display button
Use parameter files to specify which tags to substitute for whichplaceholders. For information about creating parameter files, seepage 8-25.
To create a tag placeholder in an expression:
� Type the cross-hatch character followed by a number (no spacein between). For example, #1.
Constants
A constant can have any of the following formats:
integer (123)
floating point (123.45)
string constant (“character string”)
Arithmetic operators
Arithmetic operators calculate values based on two or more numericvalues. The arithmetic operators are:
Symbol Operator Example
(For these examples, tag1 = 5 and
tag2 = 7)
+ addition tag1 + tag2returns a value of 12
You can also use this operator with stringoperands. See page 12-9.
- subtraction tag1 - tag2returns a value of -2
* multiplication tag1 * tag2returns a value of 35
/ division tag1 / tag2returns a value of 0.7142857

� 12-9Creating expressions
Symbol Example
(For these examples, tag1 = 5 and
tag2 = 7)
Operator
MOD,%
modulus(remainder)
tag2 MOD tag1returns a value of 2
The modulus operator is the remainder ofone number divided by another. Forexample, the remainder of 13 divided by 5is 3; so 13 % 5 = 3.
Important: This operator is for integersonly, not floating point numbers.
** exponent tag1 ** tag2returns a value of 78125
IMPORTANT Be sure that any tag value you use as a divisor cannot atsome point have a value of zero. Expressions thatattempt to divide a number by zero produce an error atruntime.
String operands
The + operator can be used to join string operands. For example, theexpression “hello” + “world” returns: helloworld.
Relational operators
Relational operators compare two numeric or string values toprovide a true or false result. If the statement is true, a value of 1 isreturned. If false, 0 is returned.
The relational operators are:
Symbols Operator Numeric
Examples
String Examples
For the numeric examples, tag1 = 5 and tag2 = 7
For the string examples, serial_no = “ST009”
EQ, == equal tag1 == tag2false
serial_no == “ST011”false
NE, <> not equal tag1 <> tag2true
serial_no <> “ST011”true
LT, < less than tag1 < tag2true
serial_no < “ST011”true

Preface
12-10 � RSView Machine Edition User’s Guide
Symbols String ExamplesNumeric
Examples
Operator
GT, > greater than tag1 > tag2false
serial_no > “ST011”false
LE, <= less than orequal to
tag1 <= tag2true
serial_no <= “ST011”true
GE, >= greater than orequal to
tag1 >= tag2false
serial_no >= “ST011”false
How string operands are evaluated
String operands are evaluated by case and by alphabetical order.Upper case letters are greater than lower case letters. For example, His greater than h. Letters later in the alphabet are greater than thoseearlier in the alphabet. For example, B is greater than A.
Logical operators
Logical operators determine the validity of one or more statements.There are three logical operators: AND, OR, and NOT. Theoperators return a non-zero value if the expression is true, or a zeroif the expression is false.
Any statement that evaluates to a non-zero value is regarded as true.For example, the statement tag1 will be false if the value of tag1 is 0,and true if tag1 has any other value.

� 12-11Creating expressions
The logical operators are:
Symbols Operator Action Example
(For these examples, tag1 =
5 and tag2 = 7)
AND, && and Returns a 1if thestatementsto the rightand left ofthe operatorare bothtrue.
(tag1 < tag2) AND (tag1 == 5)both statements are true;returns a 1
OR, || or Returns a 1if either thestatement tothe left orright of theoperator istrue.
(tag1 > tag2) OR (tag1 == 5)tag1 == 5 is true;returns a 1
NOT negation Reverses thelogical valueof thestatement itoperates on.
NOT (tag1 < tag2)although tag1 < tag2 is true,NOT reverses the logical value;returns a 0
IMPORTANT The parentheses are essential in the above expressions.See page 12-13.
Bitwise operators
Bitwise operators examine and manipulate individual bits within avalue.
IMPORTANT These operators are for integers only, not floating pointnumbers. Do not use them with tags or expressions thatreturn floating point values.

Preface
12-12 � RSView Machine Edition User’s Guide
Symbol Operator Action
& AND Compares two integers or tags on a bit-by-bitbasis.
Returns an integer with a bit set to 1 if both thecorresponding bits in the original numbers are1. Otherwise, the resulting bit is 0.
| inclusiveOR
Compares two integers or tags on a bit-by-bitbasis.
Returns an integer with a bit set to 1 if either orboth of the corresponding bits in the originalnumbers are 1. If both bits are 0, the resultingbit is 0.
^ exclusiveOR (XOR)
Compares two integers or tags on a bit-by-bitbasis.
Returns an integer with a bit set to 1 if thecorresponding bits in the original numbersdiffer. If both bits are 1 or both are 0, theresulting bit is 0.
>> right shift Shifts the bits within an integer or tag to theright.
Shifts the bits within the left operand by theamount specified in the right operand. The biton the right disappears.
Either a 0 or a 1 is shifted in on the left,depending on whether the left-most bit is a 0 ora 1. If the left-most bit is 0, a 0 is shifted in. Ifthe left-most bit is 1, a 1 is shifted in. In otherwords, the sign of the number is preserved.
<< left shift Shifts the bits within an integer or tag to the left.
Shifts the bits within the left operand by theamount specified in the right operand. The biton the left disappears and 0 always shifts in onthe right.
See “Using the left shift operator,” next.
~ complement Returns one’s complement; that is, it toggles thebits within an integer or tag.
Reverses every bit within the number so every 1bit becomes a 0 and vice versa.

� 12-13Creating expressions
Using the left shift operator
If the left bit is a 1 an overflow will occur, and an error message iscreated. To prevent this, use the bitwise And (&) operator with theleft shift operator in an expression. For example:
(dev << 1) & 65535
where dev is a tag whose value is being shifted left, and 65535 is 11111111 1111 1111 in binary form.
Examples: Bitwise operators
For these examples tag1 = 5 (binary 0000 0000 0000 0101),tag2 = 2 (binary 0000 0000 0000 0010)
tag1 & tag2Returns 0 (binary 0000 0000 0000 0000).
tag1 | tag2Returns 7 (binary 0000 0000 0000 0111).
tag1 ^ tag2Returns 7 (binary 0000 0000 0000 0111).
tag1 >> 1Returns 2 (binary 0000 0000 0000 0010).
tag1 << 1Returns 10 (binary 0000 0000 0000 1010).
~ tag1Returns -6 (binary 1111 1111 1111 1010).
Evaluation order of operators
Expressions with more than one operator are evaluated in this order:
Operators in parentheses are evaluated first.
Therefore, to change the order of precedence, use parentheses.
The operator with the highest precedence is evaluated next.
When two operators have equal precedence, they are evaluatedfrom left to right.

Preface
12-14 � RSView Machine Edition User’s Guide
Operators are evaluated in this order:
Evaluation order Symbols
1 (highest) ( )
2 NOT~
3 */MOD, %**AND, &&&>><<
4 +-OR, |||^
5 (lowest) EQ, ==NE, <>LT, <GT, >LE, <=GE, >=
Examples: Evaluation order
For these examples, tag1 = 5, tag2 = 7, and tag3 =10.
_____________________________
(tag1 > tag2) AND (tag1 < tag3)
is evaluated in this sequence:
1. tag1 > tag2 = 0
2. tag1 < tag3 = 1
3. 0 AND 1 = 0
The expression evaluates to 0 (false).
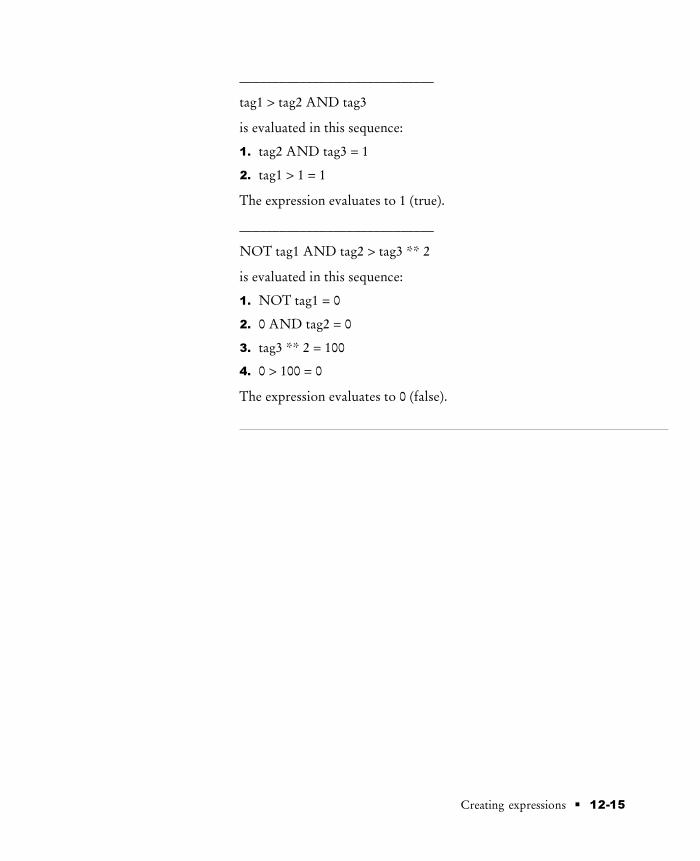
� 12-15Creating expressions
_____________________________
tag1 > tag2 AND tag3
is evaluated in this sequence:
1. tag2 AND tag3 = 1
2. tag1 > 1 = 1
The expression evaluates to 1 (true).
_____________________________
NOT tag1 AND tag2 > tag3 ** 2
is evaluated in this sequence:
1. NOT tag1 = 0
2. 0 AND tag2 = 0
3. tag3 ** 2 = 100
4. 0 > 100 = 0
The expression evaluates to 0 (false).

Preface
12-16 � RSView Machine Edition User’s Guide
Mathematical functions
Use math functions to calculate the square root, log (natural orbase 10), or trigonometry ratios (in radians or degrees) of a tag.
These functions perform math on an expression:
This function Returns this value
SQRT (expression) The square root of the expression
LOG (expression) The natural log of the expression
LOG10 (expression) The base ten log of the expression
SIN (expression) The sine of the expression in radians
COS (expression) The cosine of the expression in radians
TAN (expression) The tangent of the expression in radians
ARCSIN (expression) The arc sine of the expression in radians
ARCCOS (expression) The arc cosine of the expression in radians
ARCTAN (expression) The arc tangent of the expression inradians
SIND (expression) The sine of the expression in degrees
COSD (expression) The cosine of the expression in degrees
TAND (expression) The tangent of the expression in degrees
ARCSIND (expression) The arc sine of the expression in degrees
ARCCOSD (expression) The arc cosine of the expression in degrees
ARCTAND (expression) The arc tangent of the expression indegrees

� 12-17Creating expressions
Security functionsUse security functions to control access to your project.
These functions allow you to determine a user’s identity or securityrights in order to limit access to the project based on these criteria.
This function Returns this value
CurrentUserHasCode(Security Code Letters)
True (1) if any of the specified securitycodes have been assigned to the user; False(0) if not.
If checking multiple security codes, do nottype a space between the security codeletters.
For example:CurrentUserHasCode (ABP)returns the value 1 if the user has beenassigned one or more of the specifiedcodes.
CurrentUserName( ) A string containing the name of thecurrent user. The name does not includethe name of the user’s domain.
This function is case sensitive. All usernames use upper case letters, so make surethat you use upper case letters in yourexpression.
For more information about setting up security for your project, seeChapter 18.
For an example of using the CurrentUserHasCode( ) function, seepage 18-3. For examples of using the CurrentUserName( ) function,see page 18-13.
If-then-elseIf-then-else expressions carry out an action conditionally or branchactions depending on the statements in the expression. Theif-then-else statements enable the expression to perform differentactions in different situations and to repeat activities until acondition changes.
To build conditional expressions, use the relational operators and thelogical operators.
The if-then-else structure is:
if statement then value1 else value2

Preface
12-18 � RSView Machine Edition User’s Guide
If the statement is true then the expression returns value1; if thestatement is false then the expression returns value2. Keep in mindthat the statement is a mathematical equation and true means anon-zero value, and false means zero.
The if-then-else structure is illustrated below.
enter
true
false
value1value2
statement
exit

� 12-19Creating expressions
Nested if-then-else
You can also nest an if-then-else structure inside the ‘then’ or ‘else’part of an if-then-else structure.
Example 1: Nested if-then-else
This expression:
if (statement1) then (value1)else if (statement2) then (value2)else (value3)
has this interpretation:
enter
false
true
value2
value1
true
false
statement1
statement2
value3
exit

Preface
12-20 � RSView Machine Edition User’s Guide
Example 2: Nested if-then-else
This expression:
if (statement1) thenif (statement2) then (value1)else (value2)else (value3)
has this interpretation:
enter
true
false
value2
statement2true
value1
false
statement1
value3
exit
Using write expressions
Write expressions allow the operator to enter a value at runtime.RSView substitutes the value the operator enters for the placeholderin the expression, calculates the value of the expression, and writesthe result to the Value control. All write expressions must contain aquestion mark (?) as a placeholder for the value the operator enters.
You can use write expressions with the Numeric Input Enablebutton graphic object. When the operator presses the button, akeypad or scratchpad opens. The operator enters a value in thekeypad or scratchpad, and this value is substituted for the ?placeholder in the write expression.

� 12-21Creating expressions
Example: Using write expressions
In this example, the operator regulates the speed of a conveyor beltby entering a value in feet or meters per second. When the operatorenters the value in meters per second, the value is converted to feetper second before being passed to the data source.
The operator first indicates whether the value is in feet or meters bypushing a Maintained Push button. The push button has one statecorresponding to feet per second, and the other state to meters persecond.
Then the operator presses the Numeric Input Enable button andenters the value for the conveyor speed in a numeric pop-up keypad.The ? character in the write expression is the placeholder for thevalue the operator enters.
To configure the Maintained Push button:
1. In the Maintained Push Button Properties dialog box, in theStates tab, configure these states:
State 0—Value: 0, Caption: Feet/S
State 1—Value: 1, Caption: Meters/S
2. In the Connections tab, assign a digital tag called Feet_or_metersto the Value control.
To configure the Numeric Input Enable button:
1. In the Numeric Input Enable Properties dialog box, in the Labeltab, type the caption “Enter conveyor speed.”
2. In the Connections tab, assign an analog tag calledConveyor_speed to the Value control.
3. Assign this expression to the Optional Exp control:
If Feet_or_meters == 0 Then
?
Else
? * 3.281
RSView writes the result of the expression to the Conveyor_speedtag at the data source.


� 13-1Setting up alarms
Setting up alarmsThis chapter describes:
preparing to set up alarms
how alarms work
alarm trigger data types
optional alarm controls
steps for configuring alarms
using the Alarm Setup editor
configuring alarms
the [ALARM] display and [HISTORY] library
creating your own alarm display
opening and closing the alarm display
how the Alarm list works
using alarm buttons to acknowledge, silence, and clear alarms
About alarmsAn alarm occurs when something goes wrong or is about to gowrong. Alarms can signal that a device or process has ceasedoperating within acceptable, predefined limits, and can indicatebreakdown, wear, or process malfunctions. Alarms are also used toindicate the approach of a dangerous condition.
Alarms are an important part of most plant control applicationsbecause an operator must know the instant something goes wrong. Itis often equally important to have a record of the alarm and whetherthe alarm was acknowledged.
Preparing to set up alarmsAs your project is running, information is continually sent to thedata source about the state of the various processes. For example,your project might be monitoring whether a valve is open or closed,or the temperature in a boiler. Values representing the status of theseprocesses are sent to the data source.
13Chapter

Preface
13-2 � RSView Machine Edition User’s Guide
The data source
The data source can be memory or a device such as a programmablecontroller or an OPC server. RSView writes values to and readsvalues from the data source. The data source is configured toexchange information (in the form of numeric or string values)between RSView and the physical machine that your project iscontrolling.
Tags and expressions
Before setting up alarms, you must set up tags corresponding to theaddresses at the data source that will store the values you want tomonitor for alarm conditions. You can monitor analog, digital, andblock tags for alarm conditions. You cannot monitor string tags.
For information about creating tags, see Chapter 7.
You can also use expressions to perform logical or mathematicalcalculations on tag values, and monitor the expression value ratherthan the original tag value. For example, you could use an expressionto monitor whether a tag value has increased or decreased beyond athreshold value: If Tag1 > 100 then 1 else 0.
For information about creating expressions, see Chapter 12.
Identifying alarm conditions
Once you have identified the processes you want to monitor foralarms, and the tag addresses or expressions that will store the valuesrepresenting the status of the processes, you must determine theacceptable range of values for each tag or expression. Then you canset up alarms to notify the operator when a value is outside thenormal operating range.
How alarms work
This section provides an overview of the key components of yourproject’s alarm system, and describes how the different parts worktogether.
Alarm triggers and trigger values
You specify the tags and expressions (also known as controls) tomonitor for alarm conditions by creating an alarm trigger for eachcontrol.

� 13-3Setting up alarms
Each alarm trigger can generate one or more alarm messages,associated with different trigger control values. For each alarmtrigger, you specify the trigger values that will generate alarmmessages, and create the messages to display for the trigger values.
The trigger value can be a non-zero integer value or a bit position,depending on which trigger data type you assign. For moreinformation about trigger data types, see page 13-6.
Alarm notification methods
You can use any combination of these methods to notify theoperator that an alarm condition has occurred:
Open an alarm graphic display containing an appropriate alarmmessage.
Set off an audible signal (if the project is running inWindows 2000).
Send a message to a printer.
To use these methods, select the Display, Audio, and Print optionswhen you create your messages, as described on page 13-18.
IMPORTANT Be sure to select the Print option if you need to keep apermanent record of alarms.
Displaying alarm information
RSView comes with a preconfigured alarm graphic display called[ALARM] and a graphic library called [HISTORY]. Both containAlarm list graphic objects for displaying alarm information. Bydefault, the [ALARM] graphic display opens automatically atruntime when an alarm is generated.
You can accept the default, edit the [ALARM] display, or use yourown display. If you elect not to open a graphic display for alarmnotification, an alternative is to place the Alarm list object in agraphic display that doesn’t open automatically when an alarm isgenerated.
For information about See
The [ALARM] display Page 13-23
The [HISTORY] graphic library Page 13-24
Creating your own alarm display Page 13-26
The Alarm list graphic object Page 13-27

Preface
13-4 � RSView Machine Edition User’s Guide
Responding to alarms
Depending on how you configure alarms, the operator can:
acknowledge one or all alarms
clear all alarms
silence alarms (if the project is running in Windows 2000)
For information about the alarm button graphic objects the operatorcan use to acknowledge, clear, and silence alarms, see page 13-28.
You can also set up remote acknowledgement or silencing of alarms,to allow the data source to acknowledge or silence the alarms. Formore information, see pages 13-12 and 13-14.
Methods for acknowledging alarms
A single alarm is acknowledged when:
the operator selects an alarm in the Alarm list and presses theAcknowledge Alarm button
the operator selects an alarm in the Alarm list and presses anEnter button object, or the Enter key on an external keyboard orkeypad
All alarms for a single trigger’s trigger value (or bit position) areacknowledged when:
the Remote Ack control’s value changes to an alarm’s triggervalue (or bit position, for bit triggers)
All alarms for a trigger are acknowledged when:
the Remote Ack control’s value changes to the “Acknowledgeall” value. The “Acknowledge all” value is specified in the “Useack all value” box in the Alarm Setup editor.
All alarms are acknowledged when:
the operator presses the Acknowledge All Alarms button
the Remote Ack All control’s value changes to a new non-zerovalue
Methods for clearing alarms
All alarms are cleared from the alarm log file and from all Alarm listswhen the operator presses the Clear Alarm History button.

� 13-5Setting up alarms
Methods for silencing alarms
The audio alarm indicator is available for projects running inWindows 2000 only.
All alarms are silenced when:
the operator presses the Silence Alarms button
an alarm is acknowledged
the Remote Silence control’s value changes to a new non-zerovalue
the operator presses the Clear Alarm History button
The alarm log file
As soon as the project starts running, RSView begins monitoringtrigger controls for alarm conditions. When an alarm occurs,RSView adds the associated message to the alarm log file. When thefile is full, the oldest messages are deleted to make room for newmessages. Specify the maximum number of messages to store in theAlarm Setup editor, as described on page 13-22.
For each message, the log file records the time the alarm wastriggered and the time the alarm was acknowledged (if it wasacknowledged).
The log file is saved every 30 seconds, if there are new alarms. Thelog file is also saved when the project is shut down.
If the operator presses the Clear Alarm History button, all alarmsare removed from the log file.
The alarm log file is retained when you restart a project after ashutdown or power loss. You can delete the log file from theruntime computer at project startup. For information about deletingthe log file, see Chapter 23.
If you download a newer version of a project to the runtimecomputer, the alarm log file for the older version is deletedautomatically.
The Alarm list
The contents of the alarm log file are displayed in the Alarm listgraphic object.

Preface
13-6 � RSView Machine Edition User’s Guide
You can specify the information that is displayed in the list:
messages for unacknowledged alarms only
messages for all alarms
the time the alarm was triggered
the time the alarm was acknowledged (if you display messagesfor all alarms)
The Alarm list in the [ALARM] display is configured to display allalarms, and to display both the alarm time and the acknowledgetime.
For more information about the Alarm list, see page 13-27.
Alarm trigger data types
When you create alarm triggers, you must specify the type of datathe trigger’s tag or expression uses. The type of data affects howalarms are triggered.
The Value trigger type
If the trigger’s control uses integer or floating point values, use theValue trigger type. When the value of the trigger control equals thetrigger value of a message, an alarm is generated.
If you use an analog tag or an expression, you can use any non-zerointeger or floating point value to trigger an alarm. Floating pointvalues are rounded to the nearest integer. For information abouthow values are rounded, see page 7-3.
Trigger values cannot be 0. Digital tags have two possible values, 0and 1. Therefore, if you use a digital tag you can only use the value 1to trigger a message. If you want to use a digital tag to trigger twodifferent messages, create an expression that adds 1 to the digitaltag’s value. That way, you can use the trigger values 1 and 2.
Example: Integer trigger values
This example shows how to set up alarms using integer trigger valuesto monitor the level of acid in a 100-gallon tank. Alarms aregenerated when the tank is 75% full and 90% full.

� 13-7Setting up alarms
1. Create an alarm trigger for the analog tag Acid_Tank_Level. Thistag points to an address in a programmable controller that islinked to a sensor in the tank. The tag’s minimum value is 0 andits maximum value is 100.
Use this expression for the alarm trigger:
If ((Acid_Tank_Level > 74) AND (Acid_Tank_Level < 90))
then 1
else if (Acid_Tank_Level > 89)
then 2
else 0
2. Use the Value trigger type for the alarm trigger.
3. Specify these trigger values and alarm messages for the alarmtrigger:
Trigger value Message
1 Warning! The acid tank has exceeded safe filllevels.
2 Danger! The acid tank is overflowing.
At runtime, when the value of Acid_Tank_Level is 75 or greater,RSView generates the first alarm message. The second message isgenerated when the tag value is 90 or greater.
Using the expression illustrated above allows a range of values totrigger each alarm. This is useful in case the tag is not being scannedat the exact moment it reaches a threshold level.
The Bit trigger type
If the trigger’s control is a block tag (a bit array consisting of up to1024 bit positions), use the Bit trigger type to generate multiplesimultaneous alarm messages. Each bit in the array whose valuechanges from 0 to 1 triggers an alarm (if a message is configured forthe bit position).
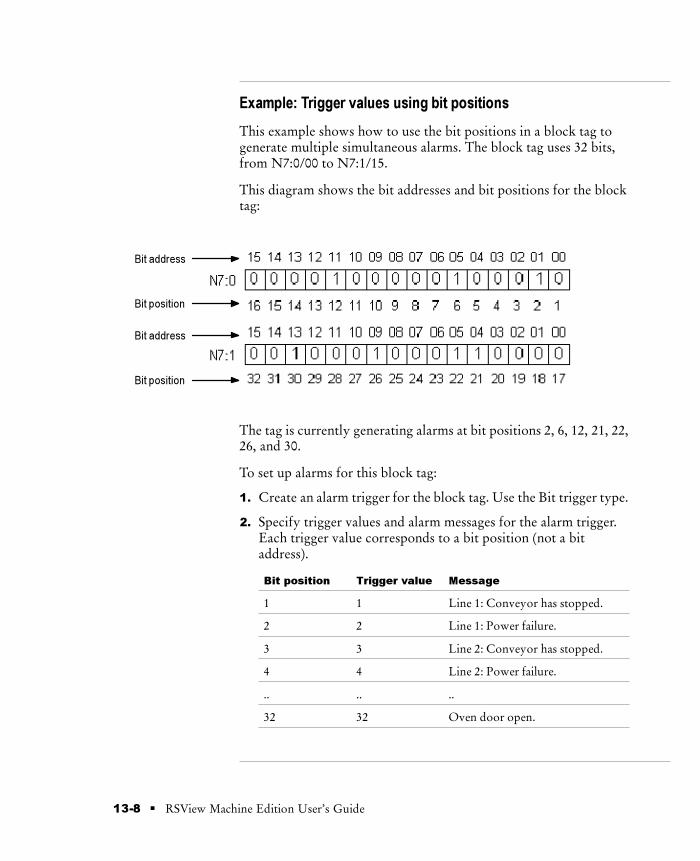
Preface
13-8 � RSView Machine Edition User’s Guide
Example: Trigger values using bit positions
This example shows how to use the bit positions in a block tag togenerate multiple simultaneous alarms. The block tag uses 32 bits,from N7:0/00 to N7:1/15.
This diagram shows the bit addresses and bit positions for the blocktag:
Bit position
Bit address
Bit position
Bit address
The tag is currently generating alarms at bit positions 2, 6, 12, 21, 22,26, and 30.
To set up alarms for this block tag:
1. Create an alarm trigger for the block tag. Use the Bit trigger type.
2. Specify trigger values and alarm messages for the alarm trigger.Each trigger value corresponds to a bit position (not a bitaddress).
Bit position Trigger value Message
1 1 Line 1: Conveyor has stopped.
2 2 Line 1: Power failure.
3 3 Line 2: Conveyor has stopped.
4 4 Line 2: Power failure.
.. .. ..
32 32 Oven door open.

� 13-9Setting up alarms
The Least Significant Bit (LSBit) triggertype
If the trigger’s control is a block tag (a bit array consisting of up to1024 bit positions), use the Least Significant Bit trigger type togenerate alarm messages based on a priority sequence that isdetermined by bit position. When multiple bits in the array changefrom 0 to 1, only the alarm with the lowest bit position is generated.
Example: Trigger values using least significant bits
This example shows how to use the Least Significant Bit trigger typeto prioritize which alarm is generated when multiple alarmconditions occur.
In this example, a programmable controller monitors a motor’spower, manual stop, and overload status. The diagram indicates thelocation of sensors that are linked to a block tag in theprogrammable controller.
Power loss
Bit 00
Start
Overload
CR
Stop
L1 L2
CR
Manual stop
Bit 01
Overload
Bit 02
If power to the motor is lost, the manual stop and overload switchalso lose power, generating alarms for all three components. Theonly alarm the operator needs to see is the alarm for the motor, sincethe cause of the alarm is power loss to the motor, not a problem withthe other two components.
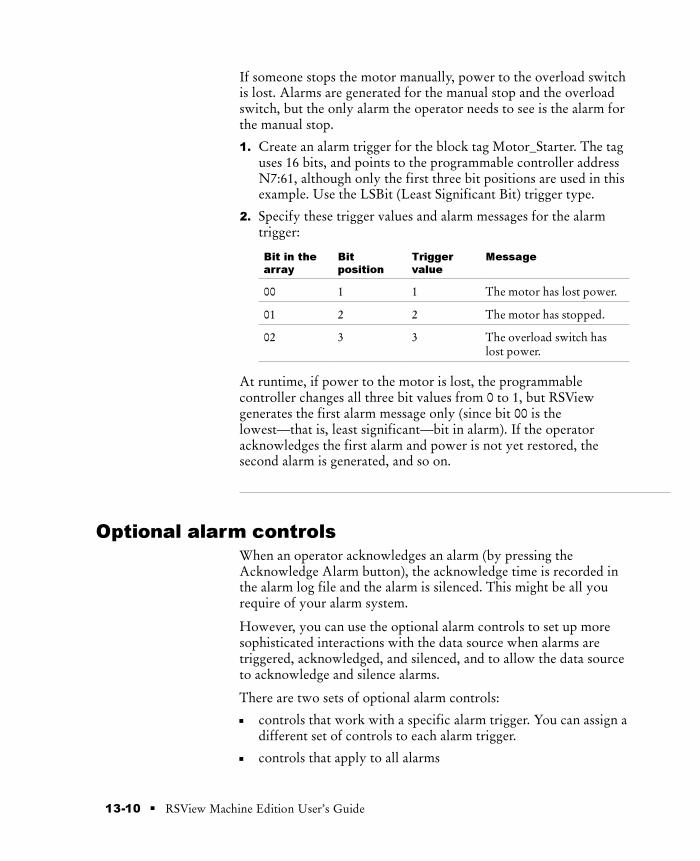
Preface
13-10 � RSView Machine Edition User’s Guide
If someone stops the motor manually, power to the overload switchis lost. Alarms are generated for the manual stop and the overloadswitch, but the only alarm the operator needs to see is the alarm forthe manual stop.
1. Create an alarm trigger for the block tag Motor_Starter. The taguses 16 bits, and points to the programmable controller addressN7:61, although only the first three bit positions are used in thisexample. Use the LSBit (Least Significant Bit) trigger type.
2. Specify these trigger values and alarm messages for the alarmtrigger:
Bit in the
array
Bit
position
Trigger
value
Message
00 1 1 The motor has lost power.
01 2 2 The motor has stopped.
02 3 3 The overload switch haslost power.
At runtime, if power to the motor is lost, the programmablecontroller changes all three bit values from 0 to 1, but RSViewgenerates the first alarm message only (since bit 00 is thelowest—that is, least significant—bit in alarm). If the operatoracknowledges the first alarm and power is not yet restored, thesecond alarm is generated, and so on.
Optional alarm controlsWhen an operator acknowledges an alarm (by pressing theAcknowledge Alarm button), the acknowledge time is recorded inthe alarm log file and the alarm is silenced. This might be all yourequire of your alarm system.
However, you can use the optional alarm controls to set up moresophisticated interactions with the data source when alarms aretriggered, acknowledged, and silenced, and to allow the data sourceto acknowledge and silence alarms.
There are two sets of optional alarm controls:
controls that work with a specific alarm trigger. You can assign adifferent set of controls to each alarm trigger.
controls that apply to all alarms

� 13-11Setting up alarms
Controls that work with a specific alarmtrigger
You can assign a different set of these controls to each alarm trigger,or to only one or some alarm triggers:
Handshake—Assign a digital tag to this control to notify the datasource when the trigger’s value changes.
Ack—Assign an analog or digital tag to this control to notify thedata source when the operator acknowledges an alarm (or allalarms).
Remote Ack—Assign an analog tag or an expression to thiscontrol to allow the data source to acknowledge alarms.
Remote Ack Handshake—Assign a digital tag to this control tonotify the data source when a remote acknowledgement occurs.
Assign tags or expressions to these controls when you create youralarm triggers, as described on page 13-16. For more detailedinformation about how these controls work, see the next sections.
How the Handshake control works
The Handshake control is useful for triggers that use the Value datatype. Program the data source to queue alarm notifications whenmultiple alarms are generated for the same trigger. Use theHandshake control to notify the data source that RSView hasdetected the alarm notification. Then the data source can send thenext alarm to RSView.
When the project starts, the Handshake control has a value of 1.When the trigger control’s value changes, the Handshake control’svalue toggles from 1 to 0. The next time the trigger value changes,the Handshake control’s value toggles from 0 to 1.
When the trigger control’s value changes, this does not necessarilyindicate an alarm—the value might still be within acceptable limits.
How the Ack control works
When the project starts, this control has a value of 0.
When the operator acknowledges an alarm by pressing theAcknowledge Alarm button, RSView sends the alarm’s trigger value(or bit position, for bit triggers) to this control, and holds the valueas long as the operator presses the button, or for the duration of thenotification hold time, whichever is longer. Then the control’s valueis reset to 0.
Preface
13-12 � RSView Machine Edition User’s Guide
When the operator acknowledges all alarms by pressing theAcknowledge All Alarms button, RSView sends the trigger’s“Acknowledge all” value to this control, and holds the value as longas the operator presses the button, or for the duration of thenotification hold time, whichever is longer. Then the control’s valueis reset to 0.
To avoid confusion about whether a specific trigger’s alarm has beenacknowledged or all alarms have been acknowledged, make sure the“Acknowledge all” value is not the same as one of the trigger values.
How the Remote Ack control works
The Remote Ack control allows for the remote acknowledgement ofalarms. The data source writes the alarm’s trigger value (or bitposition, for bit triggers) to this control, and the unacknowledgedalarm with this trigger value is acknowledged.
If you assign this control and specify an “Acknowledge all” value forthe trigger, when the data source sends the “Acknowledge all” valueto this control, all unacknowledged alarms for the trigger areacknowledged.
Make sure that the “Acknowledge all” value is not the same as oneof the trigger values.
Configure the data source to send the correct value to the RemoteAck control when you want a remote acknowledgement to takeplace.
Remote acknowledgement does not take place if the notificationhold time is in effect for the Ack control.
Example: Using the Remote Ack control
This example shows how to use the Remote Ack control toacknowledge an alarm.
In this example, the same project is run at two different locations onthe plant floor, and both terminals are connected to the sameprogrammable controller. All the tags in the example refer toaddresses in the programmable controller.

� 13-13Setting up alarms
Project X
Location 1
Programmable
controller
Project X
Location 2
1. Create an alarm trigger for an analog tag called Alarm. Use theValue trigger type.
2. Assign an analog tag called Ack to the Ack control.
3. Assign an analog tag called Remote_Ack to the Remote Ackcontrol.
4. Create four alarm messages for the alarm trigger, with the triggervalues 1 to 4.
5. Configure the data source to write the value at the Ack control tothe Remote Ack control whenever the value of the Ack controlchanges from 0 to a non-zero value.
At runtime, when an alarm with the trigger value 1 is generated, thefirst alarm message appears at both locations simultaneously. If theoperator acknowledges the alarm at Location 1, RSView writes thevalue 1 to the Ack control.
Since the Ack control is write-only (not read), the acknowledgementdoesn’t appear at Location 2. However, the programmable controllerwrites the value from the Ack control (1) to the Remote Ackcontrol, and the alarm at Location 2 is acknowledged.
How the Remote Ack Handshake controlworks
This control is used to notify the data source that the remoteacknowledgement has been detected by RSView.
When the project starts, the Remote Ack Handshake control has avalue of 1. When the Remote Ack control value changes, the RemoteAck Handshake control’s value toggles from 1 to 0. The next timethe Remote Ack value changes, the Remote Ack Handshake valuetoggles from 0 to 1.
Preface
13-14 � RSView Machine Edition User’s Guide
The Remote Ack Handshake value toggles whether or not the newRemote Ack value matches a trigger value.
Controls that apply to all alarms
These controls apply to all alarms:
Silence—Assign a digital tag to this control to notify the datasource that all alarms have been silenced (Windows 2000 projectsonly).
Remote Silence—Assign an analog tag or an expresson to thiscontrol to allow the data source to silence all alarms(Windows 2000 projects only).
Remote Ack All—Assign an analog tag to this control to allowthe data source to acknowledge all alarms at once.
Assign tags or expressions to these controls in the Advanced tab ofthe Alarm Setup editor, as described on page 13-21. For moredetailed information about how these controls work, see the nextsections.
How the Silence control works
When the project starts, this control has a value of 0. When alarmsare silenced, this control is set to 1 for the notification hold time andthe internal beeper is turned off. At the end of the notification holdtime, the control is reset to 0.
If subsequent alarms (that have been set up to sound the internalbeeper) are generated, the alarms sound the beeper regardless of theSilence control value or notification hold time status.
While the notification hold time is in effect, new alarms cannot besilenced.
How the Remote Silence control works
When this control changes to a new non-zero value, all alarms aresilenced. Alarms can be silenced using other methods regardless ofthis control’s value.
Configure the data source to send a new non-zero value to theRemote Silence control each time you want a remote silencing ofalarms to take place.
How the Remote Ack All control works
When this control changes to a new non-zero value, all alarms areacknowledged.
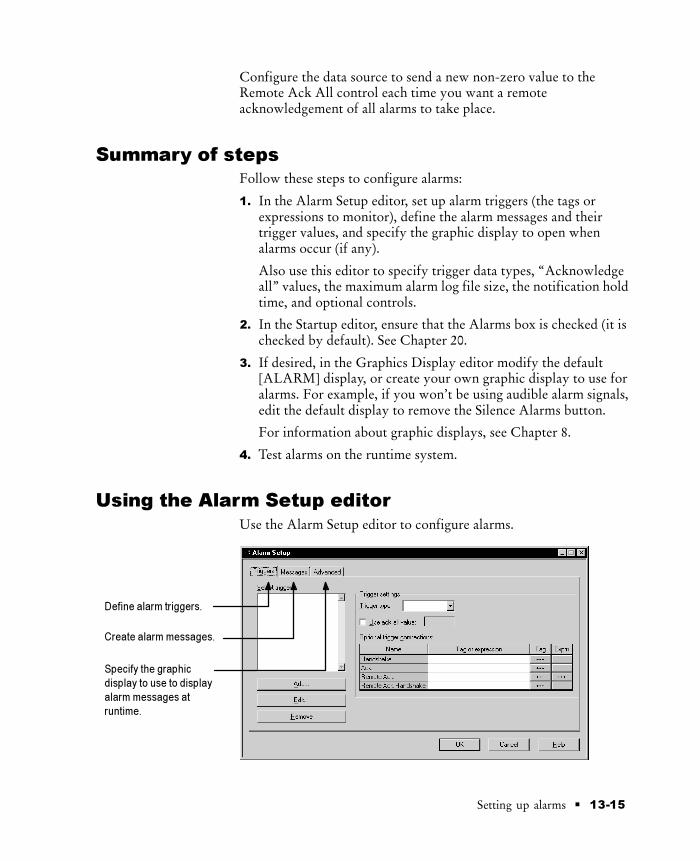
� 13-15Setting up alarms
Configure the data source to send a new non-zero value to theRemote Ack All control each time you want a remoteacknowledgement of all alarms to take place.
Summary of stepsFollow these steps to configure alarms:
1. In the Alarm Setup editor, set up alarm triggers (the tags orexpressions to monitor), define the alarm messages and theirtrigger values, and specify the graphic display to open whenalarms occur (if any).
Also use this editor to specify trigger data types, “Acknowledgeall” values, the maximum alarm log file size, the notification holdtime, and optional controls.
2. In the Startup editor, ensure that the Alarms box is checked (it ischecked by default). See Chapter 20.
3. If desired, in the Graphics Display editor modify the default[ALARM] display, or create your own graphic display to use foralarms. For example, if you won’t be using audible alarm signals,edit the default display to remove the Silence Alarms button.
For information about graphic displays, see Chapter 8.
4. Test alarms on the runtime system.
Using the Alarm Setup editor
Use the Alarm Setup editor to configure alarms.
Create alarm messages.
Define alarm triggers.
Specify the graphic
display to use to display
alarm messages at
runtime.

Preface
13-16 � RSView Machine Edition User’s Guide
To configure alarms:
1. Open the Alarm Setup editor
2. Configure alarms in the tabs of the editor, as described in thesections that follow.
3. Click OK.
Creating alarm triggers
The “Select trigger” box
displays the tags and
expressions that have
been added so far.
To edit a trigger, click it
and then click Edit.
Make your changes in
the Trigger dialog box.
To remove a trigger,
click it and then click
Remove.
Each trigger is a control (a tag or an expression) you want tomonitor for alarm conditions. For detailed information about alarmtriggers, see page 13-2.
The Select trigger box lists the triggers you create.
To create alarm triggers:
1. In the Triggers tab, click Add.
The Trigger dialog box opens.
2. Specify the tag or expression to use.
You can use analog, digital, and block tags to generate alarms.

� 13-17Setting up alarms
For information about specifying tags and expressions, seepage 7-28.
3. Click OK. The trigger you created is selected in the “Selecttrigger” box.
4. Specify these properties for the trigger:
Trigger type
Select the type of data the trigger’s tag or expression uses (fordetails, see page 13-6):
Value—integer or floating point values. Floating point valuesare rounded to the nearest integer. Use with analog or digitaltags.
Bit—a bit array consisting of one or more bit positions. Usethis trigger type with block tags, to generate multiple alarmmessages with a single tag or expression.
LSBit—a bit array consisting of one or more bit positions.Use this trigger type with block tags, to trigger alarms basedon a priority sequence determined by bit position.
Use ack all value
Check this box to send a value to the data source when theoperator presses the Acknowledge All Alarms button. Type theinteger value to send.
The “Acknowledge all” value works with the Ack and RemoteAck controls. For details see page 13-11.
Optional trigger connections
If desired, assign tags to use for handshaking andacknowledgement for the selected trigger (for details, seepage 13-11):
Handshake—Assign a digital tag to this control to notify thedata source when the trigger’s value changes.
Ack—Assign an analog or digital tag to this control to notifythe data source when the operator acknowledges an alarm (orall alarms).
Remote Ack—Assign an analog tag or an expression to thiscontrol to allow the data source to acknowledge alarms.
Remote Ack Handshake—Assign a digital tag to this controlto notify the data source when a remote acknowledgementhas been detected by RSView.

Preface
13-18 � RSView Machine Edition User’s Guide
For information about assigning tags and expressions, seepage 7-28.
5. Repeat steps 1 through 4 to create and configure additionaltriggers.
Creating alarm messagesTo view only the messages for
a single trigger, select it in the
“Trigger filter” box.
To sort the list of messages by
trigger or by message, select
an option in the “Sort by” box.
Use the scroll bar to see more
columns.
To create alarm messages:
1. In the Messages tab, in the Trigger column, select the trigger forwhich to create messages.
To assign the same message to all the triggers you set up in theTriggers tab, select <AllTriggers>.
If you are creating messages before setting up triggers, select<Unassigned>. Once you set up triggers, select the appropriatetrigger for each message.
2. Specify these properties for the message:
Trigger value
Type a non-zero integer value or bit position. When the triggercontrol’s value changes to this value, or when the bit in thisposition changes from 0 to 1, the associated message is generated.This column cannot be blank.
� 13-19Setting up alarms
For more information about trigger values, see page 13-2.
Message
Type the message, up to 256 characters.
Display
Check this box to open the alarm graphic display (if it is notalready open) when this alarm is generated.
The message is added to the alarm log file, and to any Alarm listobjects in your graphic displays, even if you do not check thisbox.
Audio
For Windows 2000 projects, check this box to sound the runtimecomputer’s internal beeper when this alarm is generated. Thebeeper beeps continuously, .5 seconds on and .5 seconds off, untilthe alarm is silenced.
Check this box to print the alarm message when this alarm isgenerated.
To print alarm messages at runtime, set up a printer on theruntime terminal. For more information, see Chapter 23.
Background
Click this button to select a different color for the background ofthe message text.
Foreground
Click this button to select a different color for the message text.
3. Repeat steps 1 and 2 to create additional messages.
Deleting messages
To delete a message:
� Select any cell in the message’s row, and then press Delete.Shift-click in a column to select cells for multiple messages.
Copying messages
To copy a message:
1. In the Message column, select one or more messages and thenpress Ctrl-C (or right-click the selected cells and then clickCopy).

Preface
13-20 � RSView Machine Edition User’s Guide
2. In the Message column, click the cell to paste the first message in,and then press Ctrl-V (or right-click the cell and then clickPaste).
Creating messages in a spreadsheetapplication
You can also create alarm messages in a spreadsheet application suchas Microsoft Excel, and then copy the messages into the Alarm Setupeditor.
To create messages in a spreadsheet application:
1. Create one message per row, as follows:
In column 1, type the trigger value.
In column 2, type the message.
Type the messages in the order you want them to appear in theAlarm Setup editor.
2. If desired, in columns 3 through 5 configure the display, audio,and print options. To use a display, audio, or print option, type acharacter in the column. If you don’t want to use the option,leave the column blank.
To copy the messages into the Alarm Setup editor:
1. In the Alarm Setup editor, create a row for each message byclicking in the Trigger column and selecting the trigger to use.
To select a trigger without opening the list, type the firstcharacter in the trigger name.

� 13-21Setting up alarms
2. In the application where you created the messages, select the cellsto copy, and then press Ctrl-C (or right-click the selected cellsand then click Copy).
3. In the Alarm Setup editor, click in the Trigger value column forthe first message and then press Ctrl-V (or right-click in thecolumn and then click Paste).
The cell contents from the spreadsheet application are pasted intothe first and succeeding rows.
4. If desired, configure the background and foreground settings forthe messages.
Specifying how alarms are displayed, stored, andsilenced
The options in the Advanced tab apply to all alarms (as opposed to asingle alarm trigger or message).
To specify how alarms are displayed, stored, and silenced:
1. In the Advanced tab, in the Current alarms box, select thegraphic display to use to display alarm messages. Click theBrowse button to select from a list of all the graphic displays inthe project.
The specified display opens when an alarm occurs, if you selectthe Display option for the alarm message (in the Messages tab).
If you don’t want to open a graphic display automatically whenalarms occur, clear the box.
Browse button

Preface
13-22 � RSView Machine Edition User’s Guide
For information about the different graphic displays you can useto display alarm information, see page 13-3.
2. To edit the selected graphic display, click Edit. The GraphicsDisplay editor opens with the selected display open for editing.
For information about graphic displays, see Chapter 8.
3. Specify these settings:
History Size
Type the number of alarms to retain in the alarm log file, upto 10,000. When the log file contains this number of alarms, theoldest alarms are deleted when new alarms occur.
For more information about the alarm log file, see page 13-5.
Hold time
Select the hold time to use when acknowledging and silencingalarms. RSView holds the values at the Ack and Silence controlsfor the specified length of time, then resets the controls to 0.
Optional connections
If desired, assign tags to use for silencing and remotelyacknowledging all alarms (for details, see page 13-14).
The Silence and Remote Silence controls apply to projects thatwill run in Windows 2000 only.
Silence—Assign a tag to this control to notify the data sourcethat alarms have been silenced.
Remote Silence—Assign a tag or an expression to this controlto allow the data source to silence alarms.
Remote Ack All—Assign a tag to this control to allow thedata source to acknowledge all alarms at once.
For information about assigning tags and expressions, seepage 7-28.

� 13-23Setting up alarms
What to do next
Now that you’ve configured alarms:
In the Startup editor, ensure that the Alarms box is checked (it ischecked by default). For more information, see Chapter 20.
If desired, in the Graphics Display editor, modify the default[ALARM] display, or create your own graphic display to use foralarms. For example, if you won’t be using audible alarm signals,edit the default display to remove the Silence Alarms button.
See the topics in the remainder of this chapter.
Test alarms on the runtime system.
The [ALARM] display
When you create a project, it comes with a graphic display called[ALARM]. The [ALARM] display is the default display for showingalarm messages at runtime.
Alarm list graphic
object
Buttons
Header
You can use the [ALARM] display as is, or modify the display. Forexample, you can change the color of the objects, or add and removebuttons.
Another option is to create your own graphic display to use when analarm occurs. For example, you could create a display with a statictext object that notifies the operator that an alarm has occurred, anda Goto Display button that the operator can press to open a displaythat lists the actual alarm message.
In the Advanced tab of the Alarm Setup editor, specify the display touse.

Preface
13-24 � RSView Machine Edition User’s Guide
The Alarm list graphic object
The [ALARM] display contains an Alarm list graphic object, whichlists the alarm messages. You can configure the Alarm list to show allalarms, or to show unacknowledged alarms only. The Alarm list inthe [ALARM] display is configured to show all alarms (but you canedit it, if desired).
For more information about the Alarm list, see page 13-27.
Buttons in the [ALARM] display
The [ALARM] display contains alarm buttons for acknowledging,clearing, and silencing alarms, as well as buttons for scrolling the listand closing the display. For information about how the buttonswork, see page 13-28.
The [HISTORY] library
The Graphics Library contains a [HISTORY] library. It is similar tothe [ALARM] display, but the Alarm list graphic object is larger (todisplay more alarm messages at once), and the library containsadditional Key buttons.
Alarm list graphic
object
Buttons
Header

� 13-25Setting up alarms
To use objects in the [HISTORY] library in your project, copy theobjects to your own graphic displays. For information aboutcopying objects from a library into your graphic display, see page9-38.
You can also add the [HISTORY] library component into yourproject. The graphic libraries are available on the developmentcomputer, but do not appear at runtime. To use a library as a graphicdisplay at runtime, you must add the library into your project’sfolder of graphic displays.
To add the [HISTORY] library into your project:
1. In the Project Explorer, in the Graphics folder, right-click theDisplays icon.
2. Click Add Component Into Project.
3. In the dialog box, navigate to the Libraries folder, and then click[HISTORY].gfx.
The Libraries folder is located in \Documents and Settings\AllUsers\Documents\RSView Enterprise\ME.
For information about changing the location of librarycomponent files see page 8-18.
4. Click Open. The [HISTORY] library is copied into the Displaysfolder.
Once you copy the library into your project, you can use the[HISTORY] display as the display to open when alarms aretriggered, or use it in conjunction with the [ALARM] display orwith an alarm display that you create.
Example: Using the [ALARM] and [HISTORY] displaystogether
To use the [ALARM] display to alert the operator aboutunacknowledged alarms only, and the [HISTORY] display as a fullrecord of all alarms:
1. In the Alarm Setup editor, in the Advanced tab, select the[ALARM] display as the display to open when alarms aretriggered.

Preface
13-26 � RSView Machine Edition User’s Guide
2. Edit the [ALARM] display as follows:
Configure the Alarm list to show unacknowledged alarmsonly. The list will display both new alarms and past alarmsthat have not been acknowledged.
Create a Goto Display button that opens the [HISTORY]display when pressed.
Creating your own alarm display
You can create your own graphic display for displaying alarms,containing an Alarm list graphic object and the buttons the operatorneeds for responding to alarms.
If you create your own graphic display, use an On Top display andselect the Cannot Be Replaced option.
For more information about the Alarm list, see page 13-27. Forinformation about the buttons you can use with the list, seepage 13-28. For information about creating graphic displays andgraphic objects, see Chapters 8 and 9.
Opening and closing the alarm display
Opening the display
The alarm display you specify in the Advanced tab of the AlarmSetup editor (either the default [ALARM] display, the [HISTORY]display you create, or your own display) is automatically openedwhenever a trigger control’s value matches a trigger value.
You can also create a Goto Display button that the operator canpress to open the alarm display. For information about configuring aGoto Display button and specifying the display to open, seeChapter 10.
Closing the display
The operator can close the display by pressing a Close Displaybutton.

� 13-27Setting up alarms
How the Alarm list works
At runtime, when a trigger control at the data source matches amessage’s trigger value, an alarm appears in the Alarm list. TheAlarm list can be in the [ALARM] or [HISTORY] display, in analarm display you have created, or can be placed on any display inyour project.
You can use multiple Alarm lists, in the same display or in differentdisplays. Each Alarm list displays information from the same alarmlog file, although you can configure different lists to displaydifferent information (all alarms or only unacknowledged alarms).
What is displayed
If you configure the list to display a header, a heading barcontaining column headings appears at the top of the list.
If you configure the list to display the alarm time oracknowledge time, these columns appear in the list.
If the list is configured to show unacknowledged alarms only,only alarms that haven’t been acknowledged appear in the list.The acknowledge time column, if any, is always blank.
If the list is configured to show all alarms, when an alarm hasbeen acknowledged, an asterisk (*) appears at the left end of therow, and the acknowledge time appears in the acknowledge timecolumn, if any.
If the message is too long to fit in the object, the last displayedcharacter is replaced with an asterisk.
The number of alarm messages that fits in the display depends onthe height of the Alarm list and the list’s font size.
Alarms are listed with the newest alarms on top.
How the list scrolls
When a display containing an Alarm list is opened, the highlightbar is at the top of the list, on the most recent alarm. As newalarms come in, the old alarms scroll down, but the highlightremains at the top.
If the operator highlights an alarm other than the top one in thelist (by using the Move Down button), and new alarms come in,they appear at the top of the list and all other alarms, includingthe highlighted alarm, scroll down.

Preface
13-28 � RSView Machine Edition User’s Guide
The highlighted alarm never scrolls off the bottom of the list.Therefore, once the list fills it stops scrolling, and the operator isunable to see new alarms that come in above the top alarm in thelist.
If the operator scrolls up to the top of the list (using the MoveUp button), the top alarm is highlighted. As new alarms come inthe old alarms scroll down but the highlight remains at the top,on the most recent alarm.
Using buttons with the Alarm list
Alarm buttons
You can use these alarm buttons to interact with the Alarm list:
This button Does this
Acknowledge Alarm Acknowledges and silences the selected alarm.
Acknowledge AllAlarms
Acknowledges and silences all currentlyunacknowledged alarms.
Silence Alarms Silences the audio indicator for all alarms(Windows 2000 projects only).
Clear Alarm History Removes all alarms from the alarm log file and allAlarm lists. If the Ack control is assigned for anyof the alarm triggers, the operator is prompted toacknowledge all alarms before clearing them.
You can assign any caption you choose to the labels on the alarmbuttons.
You can link the Acknowledge Alarm button to a specific Alarm list,or configure the button to work with whichever Alarm list isselected in the graphic display. This option is useful if you havemultiple Alarm lists in the same graphic display. For moreinformation, see page 10-9.
For information about configuring alarm buttons, see Chapter 10.For information about how the alarm buttons work at runtime, seepage 13-29.
Key buttons
You can also use these Key button graphic objects to interact withthe Alarm list:
This button Does this
Move Up Scrolls up one row in the list.
Move Down Scrolls down one row in the list.

� 13-29Setting up alarms
This button Does this
Page Up Moves the highlight bar up one page in the list.
Page Down Moves the highlight bar down one page in thelist.
Home Moves the highlight bar to the top alarm in thelist.
End Moves the highlight bar to the bottom alarm inthe list.
Enter Acknowledges the currently highlighted alarm.
You can link Key buttons to a specific Alarm list, or configure thebuttons to work with whichever object is selected in the graphicdisplay. For more information, see page 10-9.
For information about creating graphic objects, see Chapter 9. Forinformation about configuring buttons, see Chapter 10.
Using alarm buttons to acknowledge, silence, anddelete alarms
Acknowledging messages does not remove them from the alarm logfile. You can still display acknowledged alarms in an Alarm list thatis configured to show all alarms.
Acknowledging the selected alarm
When the operator presses the Acknowledge Alarm button, an Enterbutton object, or the Enter key on an external keyboard or keypad,the selected alarm is acknowledged and the audio indicator for thealarm, if any, is silenced.
This is what happens when the alarm is acknowledged:
If assigned, the alarm trigger’s Ack control is set to the alarmtrigger value at the data source. The value is held as long as theoperator presses the button, or for the notification hold time,whichever is longer.
If the hold time is still in effect and the operator acknowledges anew instance of the same alarm, the new acknowledgment isignored.
If the list is configured to display unacknowledged alarms only,the alarm is removed from the list. The highlight bar moves up tothe next unacknowledged alarm, unless it is already on the topunacknowledged alarm.

Preface
13-30 � RSView Machine Edition User’s Guide
If the highlight bar is on an acknowledged alarm when theoperator presses the Acknowledge Alarm button, the buttonpress is ignored.
Acknowledging all alarms
When the operator presses the Acknowledge All Alarms button, allunacknowledged alarms in the system are acknowledged.
This is what happens when all alarms are acknowledged:
For each alarm trigger to which an “Acknowledge all” value isassigned, the specified “Acknowledge all” value is sent to thetrigger’s Ack control. The value is held as long as the operatorpresses the button, or for the notification hold time, whichever islonger. Then the control’s value is reset to 0.
If the “Acknowledge all” value is not assigned for a trigger, novalue is sent to the trigger’s Ack control.
If the hold time for any alarm is still in effect and the operatorpresses Acknowledge All Alarms, the button press is ignored.
If the list is configured to display unacknowledged alarms only,all alarms are removed from the list.
Silencing alarms
When the operator presses the Silence Alarms button, any audiblesignal triggered by an alarm is silenced and the Silence control is setto 1 for the notification hold time. Then the control’s value is resetto 0.
If the hold time for any alarm is still in effect and the operatorpresses Silence Alarms, the button press is ignored.
The audio alarm indicator is available for projects running inWindows 2000 only.
Deleting messages
When the operator presses the Clear Alarm History button, allalarms in the system are deleted from the alarm log file and from allAlarm lists. For information about the alarm log file, see page 13-5.

� 13-31Setting up alarms
If the Ack control is assigned for any of the alarm triggers, theoperator is prompted to acknowledge the unacknowledged messagesbefore deleting them. If the operator chooses to acknowledge thealarms, the “Acknowledge all” value (if any) is sent to the Ackcontrol before deleting the messages. If the Ack control is notassigned, or if the operator chooses not to acknowledge alarms, allmessages are deleted immediately.


� 14-1Creating information messages
Creating informationmessagesThis chapter describes:
preparing to set up information messageshow information messages worksteps for setting up information messages
using the Information Messages and Information Setup editorscreating information messagessetting up how messages are displayedthe [INFORMATION] displaycreating your own information message display
opening and closing the information message displayhow the Information Message display graphic object workschanging the information message file used at runtime
About information messagesUse information messages to give the operator messages about theprocess, prompts or instructions, and information about currentstates.
When to use information messages
Use information messages to give the operator information nomatter which display is open. To give the operator information in aspecific graphic display while the display is open, use local messages.
For details about local messages, see page 8-29.
Preparing to set up information messagesAs your project is running, information is continually sent to thedata source about the state of various processes. For example, yourproject might be monitoring whether a valve is open or closed, orthe temperature in a boiler. Values representing the status of theseprocesses are sent to the data source.
14Chapter

Preface
14-2 � RSView Machine Edition User’s Guide
The data source
The data source can be memory or a device such as a programmablecontroller or an OPC server. RSView writes values to and readsvalues from the data source. The data source is configured toexchange information (in the form of numeric or string values)between RSView and the physical machine that your project iscontrolling.
Identifying the tags and values to monitor
To set up information messages, determine which tags associatedwith machine processes to monitor, and identify the values for thosetags that will trigger information messages.
For information about creating tags, see Chapter 7.
How information messages work
These are the key parts of the information message system:
Information message file—a text file containing a list of messages,with a numeric trigger value for each message.
Information message display—a graphic display that opens atruntime and displays information messages.
Value control—a tag or expression. When the value of thiscontrol matches a message’s trigger value, the informationmessage display opens with the associated message displayed.
The following example shows how the key parts of the informationmessage system work together.
Example: Configuring the data source to display informationmessages
This example shows how to configure the data source to notify theoperator that a conveyor belt has stopped. In this example, there aretwo conveyor belts whose statuses are monitored.
1. Create a digital tag called Conveyor_1_Status. This tag points toan address in a programmable controller that is linked to a sensoron the first conveyor belt. When the belt is running, the tag’svalue is 0. When the belt stops running, the value changes to 1.

� 14-3Creating information messages
2. Create a second digital tag called Conveyor_2_Status, pointing toan address in the programmable controller that is linked to asensor on the second conveyor belt. When the belt is running, thetag’s value is 0. When the belt stops running, the value changes to1.
3. Create an analog tag called Information_Messages, and configurethe data source to send a value of 1 to this tag whenConveyor_1_Status has a value of 1. Configure the data source tosend a value of 2 to the Information_Messages tag when theConveyor_2_Status tag has a value of 1.
4. In the Information Messages editor, create these messages withtrigger values matching the values that will be sent to theInformation_Messages tag:
Trigger value Message
1 Conveyor belt 1 has stopped.
2 Conveyor belt 2 has stopped.
Save the message file with the name “Conveyor belts.”
5. In the Information Setup editor, assign theInformation_Messages tag to the Value control, and select theConveyor belts message file.
At runtime, when the value of Conveyor_1_Status changes to 1, thefirst message is displayed (in the default information messagedisplay). When the value of Conveyor_2_Status changes to 1, thesecond message is displayed.
Information messages and trigger values
Create messages associated with each tag value change that you wantto inform the operator about. Assign each message a trigger value,and configure the data source to send the trigger value to the Valuecontrol.
The trigger value can be any non-zero integer value (positive ornegative). Trigger values do not need to be contiguous, but theymust be unique for each message. For example, you could use triggervalues of 1, 2, and 3, or values of 10, 20, and 30.

Preface
14-4 � RSView Machine Edition User’s Guide
Trigger values cannot be 0. Digital tags have two possible values, 0and 1. Therefore, if you use a digital tag you can only use the value 1to trigger a message. If you want to use a digital tag to trigger twodifferent messages, create an expression that adds 1 to the digitaltag’s value. That way, you can use the trigger values 1 and 2.
If you use an analog tag or an expression, you can use any non-zerointeger or floating point value to trigger an alarm. Floating pointvalues are rounded to the nearest integer. For information abouthow values are rounded, see page 7-3.
You can create multiple information message files, but you can useonly one message file at runtime. For information about using adifferent message file, see page 14-12.
The information message display
RSView comes with a preconfigured information message graphicdisplay called [INFORMATION]. It contains an InformationMessage display graphic object and buttons for acknowledging thedisplayed message and closing the display. By default, the[INFORMATION] graphic display opens automatically at runtimewhen an information message is generated.
You can accept the default, edit the [INFORMATION] display, orcreate your own display. Another option is to place the InformationMessage display object in a graphic display that doesn’t openautomatically when a message is generated.
For more information about the [INFORMATION] display, seepage 14-10. For information about creating your own informationmessage display, see page 14-11. For information about theInformation Message display graphic object, see page 14-12.
Summary of stepsFollow these steps to configure information messages:
1. In the Information Messages editor, set up the messages and theirtrigger values.
2. In the Information Setup editor, specify the graphic display toopen when information messages occur, and the file of messagesto display.
Also use this editor to assign a tag or expression to the Valuecontrol. If you want the operator to acknowledge messages,assign the Ack control and specify the acknowledge hold time.

� 14-5Creating information messages
3. In the Startup editor, ensure that the Information messages box ischecked (it is checked by default). See Chapter 20.
4. If desired, in the Graphics Display editor modify the default[INFORMATION] display, or create your own graphic displayto use for information messages. For example, if you don’t wantthe operator to acknowledge messages, edit the default display toremove the Information Acknowledge button.
For information about graphic displays, see Chapter 8.
Using the Information Messages editorUse the Information Messages editor to create one or more files ofinformation messages. Each file is stored in the editor’s folder. Youcan open and work on multiple message files at the same time.
You can define up to 10,000 messages in each message file.
Creating information messages
To create information messages:
1. Open the Information Messages editor.
2. Specify these properties for the message:
Trigger value
Type a non-zero integer value. When the Value control changesto this value, the associated message is generated. This columncannot be blank.
For more information about trigger values, see page 14-3.

Preface
14-6 � RSView Machine Edition User’s Guide
Message
Type the message, up to 256 characters. You can use the new linecharacters, \n, to specify that the message continues at thebeginning of the next line.
3. Repeat steps 1 and 2 to create additional messages.
4. To sort the messages by trigger value, highlight the rows to sort,right-click in any of the selected rows, and then click Sort.
5. On the File menu click Save, or click the Save tool.
6. In the Component name box, type a name for the file, and thenclick OK.
7. Click Close.
Deleting messages
To delete a message:
� Select any cell in the message’s row, and then press Delete.Shift-click in a column to select cells for multiple messages.
Copying messages
To copy a message:
1. In the Message column, select one or more messages and thenpress Ctrl-C (or right-click the selected cells and then clickCopy).
2. In the Message column, click the cell to paste the first message in,and then press Ctrl-V (or right-click the cell and then clickPaste).
Creating messages in a spreadsheetapplication
You can also create information messages in a spreadsheetapplication such as Microsoft Excel, and then copy the messages intothe Information Messages editor.
Save tool

� 14-7Creating information messages
To create messages in a spreadsheet application:
� Create one message per row, as follows:
In column 1, type the trigger value.
In column 2, type the message.
Type the messages in the order you want them to appear in theInformation Messages editor.
To copy the messages into the Information Messages
editor:
1. In the application where you created the messages, select the cellsfor the trigger values and messages to copy, and then pressCtrl-C (or right-click the selected cells and then click Copy).
2. In the Information Messages editor, click in the Trigger valuecolumn for the first message and then press Ctrl-V (or right-clickin the column and then click Paste).
The cell contents from the spreadsheet application are pasted intothe current and succeeding rows.

Preface
14-8 � RSView Machine Edition User’s Guide
Setting up how information messages are displayed
Use the Information Setup editor to set up how informationmessages are displayed.
To set up how information messages are displayed:
1. Open the Information Setup editor.
2. In the “Display file name” box, select the graphic display to useto display information messages. Click the Browse button toselect from a list of all the graphic displays in the project.
If you clear the box, no display is opened when the Value controlchanges to an assigned trigger value.
For information about the different graphic displays you can useto display information messages, see page 14-4.
3. To edit the selected graphic display, click Edit. The GraphicsDisplay editor opens with the selected display open for editing.
For information about graphic displays, see Chapter 8.
4. In the “Message file name” box, select the file of informationmessages to display. Click the Browse button to select from a listof all the information message files in the project.
If you leave the box blank, no messages are ever displayed. If youspecify a message file, it is used for all Information Messagedisplay objects you place in your graphic displays.
For information about creating information message files, seepage 14-5.
Browse button

� 14-9Creating information messages
5. To edit the selected message file, click Edit. The InformationMessages editor opens with the selected message file open forediting.
6. Specify these settings:
Acknowledge hold time
Select the hold time to use when acknowledging informationmessages. RSView sets the value at the Ack control to 1 for thespecified length of time (or as long as the operator presses theInformation Acknowledge button, whichever is longer), thenresets the control to 0.
Connection
Assign a tag or expression to these controls:
Value—Assign a tag or expression to this control. Theinformation message graphic display opens when the Valuecontrol at the data source changes from 0 to a non-zero value.
If you assign an expression, RSView calculates the value of theexpression and opens the display when the expression valuechanges from 0 to a non-zero value.
Ack—Assign a digital tag to this control to notify the datasource when the operator acknowledges an informationmessage.
For information about assigning tags and expressions, seepage 7-28.
7. Click OK.
What to do next
Now that you’ve configured information messages:
In the Startup editor, ensure that the Information messages box ischecked (it is checked by default). For more information, seeChapter 20.
If desired, in the Graphics Display editor, modify the default[INFORMATION] display, or create your own graphic displayto use for information messages. For example, if you don’t wantthe operator to acknowledge information messages, edit thedefault display to remove the Information Acknowledge button.
See the topics in the remainder of this chapter.

Preface
14-10 � RSView Machine Edition User’s Guide
The [INFORMATION] displayWhen you create a project, it comes with a graphic display called[INFORMATION]. The [INFORMATION] display is the defaultdisplay for showing information messages at runtime.
Information
Message display
graphic object
Buttons
You can use the [INFORMATION] display as is, or modify thedisplay. For example, you can change the color of the objects, or addand remove buttons. Or, you can create your own graphic display touse for displaying information messages. In the Information Setupeditor, specify the display to use.
The Information Message display graphic object
The [INFORMATION] display contains an Information Messagedisplay graphic object, which lists one information message at atime.
For information about how the Information Message display objectworks at runtime, see page 14-12.
Buttons in the [INFORMATION] display
The [INFORMATION] display contains these buttons:
This button Does this
Ack(InformationAcknowledge)
Acknowledges the information message.
Close(Close Display)
Closes the information message graphic display.
You can assign any caption you choose to the labels on the buttons.
Using the Information Acknowledge button
When the operator presses the Information Acknowledge button, ifthe Ack control is assigned, the control value is set to 1 at the datasource. The value is held as long as the operator presses the button,or for the acknowledge hold time, whichever is longer. Then thecontrol is reset to 0.

� 14-11Creating information messages
Creating your own information message display
You can create your own graphic display for displaying informationmessages, containing an Information Message display graphic objectand the buttons you want to use in the display.
If you create your own graphic display, use an On Top display andselect the Cannot Be Replaced option.
For more information about the Information Message displaygraphic object, see page 14-12. For information about creatinggraphic displays and graphic objects, see Chapters 8 and 9.
Opening and closing the information messagedisplay
Opening the display
The information message display you specify in the InformationSetup editor (either the default [INFORMATION] display or yourown display) is automatically opened whenever the Value control’svalue matches a trigger value.
You can also create a Goto Display button that the operator canpress to open the information message display. For informationabout configuring a Goto Display button and specifying the displayto open, see Chapter 10.
Closing the display
The information message display closes when the Value control’svalue changes to 0.
To automatically close the display when the operator acknowledgesa message, configure the data source to set the Value control to 0when the Ack control is set to 1.
The operator can also close the display by pressing a Close Displaybutton.

Preface
14-12 � RSView Machine Edition User’s Guide
How the Information Message display graphicobject works
At runtime, when the Value control at the data source changes from0 to a non-zero value, the assigned information message displayopens. If the value matches a message’s trigger value, the associatedinformation message appears in the Information Message displaygraphic object. The object can be in the default [INFORMATION]display, in an information message display you have created, or canbe placed in any display in your project.
What is displayed
If the Value control is unassigned, the information messagegraphic display never opens automatically. If the operator opensa graphic display containing an Information Message displayobject, the object is blank.
The Value control is rounded up to the nearest integer. If thevalue does not match any of the trigger values in the specifiedmessage file, the display is filled with questions marks (?).
For information about how values are rounded, see page 7-3.
If the message is too long to fit in the Information Messagedisplay object, the last displayed character is replaced with anasterisk (*).
When the Value control’s value is 0, the information messagegraphic display is closed.
Changing the message file used at runtime
Your project can use only one message file at a time. Follow thisprocedure to switch message files.
To use a different message file:
1. Shut down the project.
2. Open RSView Studio and open the project.
3. In the Information Setup editor, specify the new informationmessage file.
4. Create the runtime project. See Chapter 20.
5. Transfer the runtime project to the runtime platform.

� 14-13Creating information messages
For information about transferring projects to a Windows CEplatform, see Chapter 21.
For information about transferring projects to a Windows 2000platform, see Chapter 22.
6. Run the new project.


� 15-1Setting up activity logging
Setting up activitylogging
This chapter describes:
what activity logging is
message severities and categories of system activities
displaying activity messages during project development
displaying activity messages at runtime
steps for changing the default settings for runtime activitylogging
using the Activity Log Setup editor
the [ACTIVITY] display
creating your own activity display
opening and closing the activity display
how the Activity list works
About activity logging
While you develop your project, use activity logging to track whatthe system is doing and to ensure you’ve set things up the way youintend. At runtime, use activity logging to show the operatormessages about system activity.
Message severity
There are three different severities of activity messages:
Information—messages about activities such as tag read andwrite activity, users logging in and out, and server usage (RSViewuses servers to control different aspects of runtime operations,such as data logging and alarm monitoring).
15Chapter

Preface
15-2 � RSView Machine Edition User’s Guide
Warnings—messages about activities such as tag read and writefailures, server failures, or problems opening and closing graphicdisplays.
Errors—messages about activities such as communication errors,invalid values, connection failures, and unassigned controls.
Activity messages are preceded by a white, yellow, or red icon.White indicates information, yellow indicates a warning, and redindicates an error. The content of the messages is provided by thesystem—you don’t need to do anything to set up message content.
You can choose which message severities to log.
Which activities can be logged?
While your project is running, various system activities occur. Youcan log any or all of these categories of system activity:
application messages (about server status, server activity, andproblems running the project)
communication errors (from the communication network)
macro usage
tag write activity
tag read activity (normal scanning is not logged as a tag read)
For each category of system activity, you can specify whether todisplay any or all severities of messages.
Displaying activity messages during projectdevelopment
During project development, activity messages are displayed whenyou test your graphic displays. The messages are displayed in theactivity bar at the bottom of the RSView Studio window.
By default, all warning and error messages are displayed.
For information about testing graphic displays, see page 8-9.
To display the activity bar:
� On the View menu, click Activity Bar. A check mark beside themenu item indicates the Activity Bar is displayed.
For information about moving, resizing, and clearing messages in theactivity bar, see page 2-4.

� 15-3Setting up activity logging
If you don’t want to display activity messages:
� On the View menu, deselect Activity Bar. The menu item isdeselected when no check mark appears.
To change the categories and severities of messages that
are displayed:
1. On the Tools menu, click Options.
2. Click the Activity Bar Logging tab.
3. In the Categories list, click a category of system activities.
4. To display a severity of messages, check the box for the severity.Clear the check box for the severity of message you don’t wantto display. To disable all messages for the category, clear all theboxes.
5. Repeat steps 2 and 3 to set up additional categories and severitiesof messages.
6. Click OK.
Displaying activity messages at runtime
At runtime, you can display activity messages in a graphic display.You can also print the messages.
Printed messages list the date and time, the category of systemactivity, and the message text.
Preface
15-4 � RSView Machine Edition User’s Guide
By default, your project is set up to display errors and warnings (butnot information messages) for all categories of system activity atruntime. If you want to use the default settings, you don’t need todo anything further to set up activity logging.
If you don’t want to display activity messages at runtime:
� In the Activity Log Setup editor, clear the Display name box, orclear the three “Open display automatically when” boxes.
The activity message display
RSView comes with a preconfigured activity message graphic displaycalled [ACTIVITY]. It contains an Activity list graphic object,which lists the activity messages, and buttons for scrolling throughthe list of messages, clearing messages, and closing the display. Bydefault, the [ACTIVITY] graphic display opens automatically atruntime when an activity warning or error message is generated.
You can use the [ACTIVITY] display as is, edit the display, or createyour own display. Another option is to place the Activity list objectin a graphic display that doesn’t open automatically when a messageis generated.
For more information about the [ACTIVITY] display, seepage 15-7. For information about creating your own activitymessage display, see page 15-7. For more information about theActivity list, see page 15-8.
Summary of steps
Follow these steps to change the default settings for runtime activitylogging:
1. In the Activity Log Setup editor, specify the categories of systemactivity and severities of messages to log, how to displayinformation at runtime, the graphic display to use, and themaximum number of messages to store in memory.
2. If desired, in the Graphics Display editor modify the default[ACTIVITY] display, or create your own graphic display to usefor activity messages. For example, if you don’t want theoperator to clear all messages at once, edit the default display toremove the Clear All button.
For information about graphic displays, see Chapter 8.

� 15-5Setting up activity logging
Using the Activity Log Setup editor
Use the Activity Log Setup editor to set up how activity loggingworks at runtime.
To set up how activity logging works at runtime:
1. Open the Activity Log Setup editor.
2. In the Select category list, click a category of system activities.
3. Select one or both destinations for logging errors, warnings, andinformation messages. If you don’t want to log to eitherdestination, clear the check boxes.
To print activity messages at runtime, check the appropriatePrinter boxes and set up a printer on the runtime terminal.
For information about specifying the printer to use at runtime,see Chapter 23.
4. Repeat steps 2 and 3 to set up logging destinations for additionalcategories of system messages.
5. In the Display name box, select the graphic display to use todisplay activity messages. Click the Browse button to select froma list of all the graphic displays in the project.
If you don’t want to display activity messages at runtime, clearthe box.
Browse button

Preface
15-6 � RSView Machine Edition User’s Guide
For information about the different graphic displays you can useto display activity messages, see page 15-4.
6. To edit the selected graphic display, click Edit. The GraphicsDisplay editor opens with the selected display open for editing.
For information about graphic displays, see Chapter 8.
7. Specify these settings:
Open display automatically when
Specify when to open the activity display. Select any or alloptions:
Error occurs—RSView opens the activity display when a newerror occurs.
Warning occurs—RSView opens the activity display when anew warning occurs.
Information occurs—RSView opens the activity display whena new information message occurs.
If you don’t want the activity display to open automatically, clearall the check boxes.
The specified categories and severities of activity messages arelogged to the Activity list whether or not you set up the activitydisplay to open automatically.
If you elect not to open an activity display automatically, you canstill display activity messages in any Activity list graphic object,in any graphic display. Create a Goto Display button that theoperator can use to open the graphic display containing theActivity list.
Maximum number of messages
Type the maximum number of messages to store in memory, upto 2000. When this number is reached, the oldest message isdeleted to make room for a new message. When you stoprunning the project, the messages are removed from memory.
8. Click OK.
What to do next
Now that you’ve set up activity logging, you can, if you like, use theGraphics Display editor to modify the default [ACTIVITY] displayor to create your own graphic display for activity messages. Forexample, if you don’t want the operator to clear all messages at once,edit the default display to remove the Clear All button.
See the topics in the remainder of this chapter.

� 15-7Setting up activity logging
The [ACTIVITY] display
When you create a project, it comes with a graphic display called[ACTIVITY]. The [ACTIVITY] display is the default display forshowing activity messages at runtime.
Activity list graphic
object
Buttons
You can use the [ACTIVITY] display as is, or modify the display.For example, you can change the color of the objects, or add andremove buttons. Or, you can create your own graphic display to usefor displaying activity messages. In the Activity Log Setup editor,specify the display to use.
The Activity list graphic object
The [ACTIVITY] display contains an Activity list graphic object,which lists the activity messages. For more information about theActivity list, see page 15-8.
Buttons in the [ACTIVITY] display
The [ACTIVITY] display contains activity log buttons for clearingthe messages, as well as buttons for scrolling the list and closing thedisplay. For information about how the buttons work, seepage 15-9.
Creating your own activity display
You can create your own graphic display for displaying activitymessages, containing an Activity list graphic object and the buttonsthe operator needs for using the display.
If you create your own graphic display, use an On Top display andselect the Cannot Be Replaced option.
For more information about the Activity list, see page 15-8. Forinformation about the buttons you can use with the list, seepage 15-9. For information about creating graphic displays andgraphic objects, see Chapters 8 and 9.

Preface
15-8 � RSView Machine Edition User’s Guide
Opening and closing the activity display
Opening the display
The activity display you specify in the Activity Log Setup editor(either the default [ACTIVITY] display or a display you create) isautomatically opened whenever an activity message of the specifiedseverity occurs.
The display remains open until the operator closes the display.
If you decide not to open the activity display automatically, you cancreate a Goto Display button that the operator can press to open theactivity display. For information about configuring a Goto Displaybutton and specifying the display to open, see Chapter 10.
Closing the display
The operator can close the display by pressing a Close Displaybutton.
How the Activity list works
At runtime, when a category and severity of system activity occursthat you’ve configured to log, a message about the activity is addedto the Activity list. The Activity list can be in the [ACTIVITY]display, in an activity display you have created, or can be placed onany display in your project.
You can use multiple Activity lists, in the same display or indifferent displays. Each Activity list displays the same information.
What is displayed
If the message is too long to fit in the list, the last displayedcharacter is replaced with an asterisk (*).
The number of activity messages that is visible at one timedepends on the height of the Activity list and the list’s font size.
Activity messages are listed with the newest activity message ontop.

� 15-9Setting up activity logging
Using buttons with the Activity list
Activity buttons
You can use these activity buttons to interact with the Activity list:
This button Does this
Activity Clear Clears the selected message from all Activity listsin the project.
Activity Clear All Clears all activity messages from all Activity listsin the project.
You can assign any captions you choose to the labels on the activitybuttons.
You can link the Clear button to a specific Activity list. When theoperator presses the button, the selected message is deleted from thelinked activity list, and also from any other activity lists in theproject. For information about linking buttons to objects, seepage 10-9.
Key buttons
You can also use these Key button graphic objects to interact withthe Activity list:
This button Does this
Move Up Scrolls up one row in the list.
Move Down Scrolls down one row in the list.
Page Up Moves the cursor up one page in the list.
Page Down Moves the cursor down one page in the list.
Home Moves the cursor to the top message in the list.
End Moves the cursor to the bottom message in thelist.
You can configure the Key buttons to work only with the specifiedActivity list, or to work with whichever object is selected in thegraphic display. For information about linking buttons to objects,see page 10-9.
For information about creating graphic objects, see Chapter 9. Forinformation about configuring buttons, see Chapter 10.


� 16-1Setting up data logging
Setting up data loggingThis chapter describes:
data logging and the trend graphic object
data log models
the different data logging methods
data storage locations
steps for configuring data logging
using the Data Log Models editor
creating and configuring data log models
changing the data log model used at runtime
problems with data logging
Data logging and the trend graphic objectUse data logging to keep a permanent record of tag data. You canrecord tag data as tag values change, or on a periodic basis (forexample, every minute).
You can use the trend graphic object to display the data that you’velogged. At runtime, when the operator opens a graphic displaycontaining a trend, the trend displays values from the data log filefor the data log model that is running. The data log model specifieswhich data to collect in the data log file.
In addition to displaying historical values from the data log file,trends can display current tag values for the tags in the model.Trends can also display current values for tags or expressions that arenot in a data log model. For more information about trends, seeChapter 17.
What is a data log model?A data log model defines which tags to log data for, as well as howand where the data is logged. For information about creating a datalog model, see page 16-5.
16Chapter
Preface
16-2 � RSView Machine Edition User’s Guide
You can configure multiple data log models, but you can run onlyone data log model at a time. For information about running adifferent data log model, see page 16-10.
Tags in the data log model
The data log model can contain up to 100 analog or digital tags.
You cannot use string tags, block tags, tag placeholders, orexpressions in your data log model.
Deleting tags from the model
If you delete a tag from the data log model, previously logged datafor the tag is not accessible unless you add the tag back to the model.
Data log files
As soon as the project starts running, RSView begins logging tagvalues to the data log files. When the maximum number of datapoints have been logged, the oldest data is deleted to make room forthe new data. RSView supplies data from the log files to the trendobject for the requested tags and time span.
The data log files are retained when you restart a project after ashutdown or power loss. You can delete the log files from theruntime computer at project startup.
For information about deleting the log files, see Chapter 23.
File names
RSView creates two data log files:
Data Log Model Name.log
Data Log Model Name.tag
You’ll need this information if you log to a custom path and want todelete the log files manually.
Data logging methods
There are two methods for triggering data logging. You can set uplogging so tag values are logged:
periodically (periodic logging)
only when a tag value changes (on-change logging)

� 16-3Setting up data logging
Logging periodically
Periodic logging is used to take a snapshot of all tag values at aparticular point in time. Tag values are logged even if there has beenno change.
Do not set the logging interval to be faster than the scan class rate orOPC update rate, or you will log redundant data. For informationabout scan classes, see page 5-17. For information about OPCupdate rates, see page 6-13.
You cannot change the periodic log rate at runtime.
Logging on change
On-change logging is used to log only tags whose values havechanged. Before logging occurs, the change must equal a specifiedpercentage of change in the tag value.
The percentage is based on the tag’s minimum and maximum valuesas configured in the Tag Database editor. Only the tags that changeby the specified percentage are logged. If you specify a percentageof 0, all changes are logged.
You can also specify a heartbeat rate, to log values at specified timeseven if no tag value changes have occurred. The heartbeat ensuresthat the data in the log file is current. The heartbeat is also a goodway to ensure that data logging is working and acquiring valid data.If you specify a heartbeat of 0, the heartbeat is not used.
Data storage locations
You can store data log files in any one of these locations:
on the runtime computer
on another computer on the network
on a PCMCIA card (for RAC6182 projects only)
Logging to a network location
To log data to a network location, the runtime computer must belogged in to the same domain as the computer on the network. Todo this, the user must have access rights for the domain.
For information on logging in to a Windows domain, see page 24-1.
Preface
16-4 � RSView Machine Edition User’s Guide
Summary of steps
Follow these steps to set up data logging:
1. In the Data Log Models editor, set up a data log model thatspecifies how many log values to store, the conditions that triggerdata logging, where to log data, and which tags to monitor.
2. In the Startup editor, turn on data logging by selecting the Datalogging check box. Also use this editor to specify the data logmodel to use at runtime. See Chapter 20.
3. In the Graphics Display editor, create a graphic displaycontaining the trend graphic object, and set up how the objectlooks, which tag values to display, the start time, and the timespan for the data. Also specify the name of the data log model touse. See Chapters 8 and 17.
Using the Data Log Models editor
Use the Data Log Models editor to create one or more data logmodels. Each data log model is a file stored in the editor’sfolder—you can open and work on multiple models at the sametime.

� 16-5Setting up data logging
Set up general aspects
of the model.
Specify how logging
should occur.
Specify which tags
to log data for.
Specify where to log
the data.
Creating data log models
To create a data log model:
1. Open the Data Log Models editor.
2. Configure the model in the tabs of the editor, as described in thesections that follow.
3. On the File menu click Save, or click the Save tool.
4. In the Component name box, type a name for the model, andthen click OK.
5. Click Close.Save tool

Preface
16-6 � RSView Machine Edition User’s Guide
Configuring data log models
Specifying how much data to store
You specify a name
for the model when
you save it.
To specify the maximum amount of data to store:
1. In the Setup tab, type a description of the model, up to 50characters. This is for your information only.
2. Type the maximum number of data values to store, between 100and 300,000.
When your data exceeds the limit, the oldest data is deleted fromthe data log file. The higher the limit, the more space the data logfile requires on the runtime computer, or on the remotecomputer (if logging to a custom path on a remote PC).
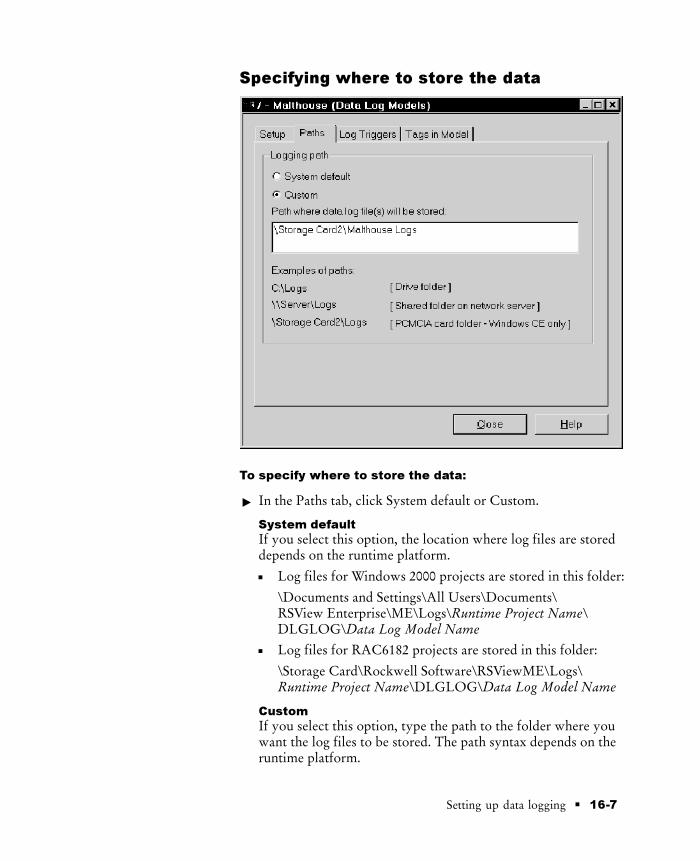
� 16-7Setting up data logging
Specifying where to store the data
To specify where to store the data:
� In the Paths tab, click System default or Custom.
System default
If you select this option, the location where log files are storeddepends on the runtime platform.
Log files for Windows 2000 projects are stored in this folder:
\Documents and Settings\All Users\Documents\RSView Enterprise\ME\Logs\Runtime Project Name\DLGLOG\Data Log Model Name
Log files for RAC6182 projects are stored in this folder:
\Storage Card\Rockwell Software\RSViewME\Logs\Runtime Project Name\DLGLOG\Data Log Model Name
Custom
If you select this option, type the path to the folder where youwant the log files to be stored. The path syntax depends on theruntime platform.

Preface
16-8 � RSView Machine Edition User’s Guide
For Windows 2000 projects, the path must contain a driveletter (such as C:\) or use the Universal Naming Convention(UNC) style.
Paths using UNC style begin with two backslashes. Forexample, \\server\logs uses UNC style. In this example, logsis a shared folder on a network server.
For RAC6182 projects, you can log to a location on theRAC6182 or to a PCMCIA card. For example, \StorageCard\Data\Logs specifies a location on the RAC6182.
To log from the RAC6182 to a network folder, use UNCstyle.
You can specify a path to a folder that does not exist. If it doesn’texist, it is created at runtime, as long as the user logged in to theruntime computer has folder creation rights at the specifiedlocation.
Specifying when to log data
To specify when to log data:
1. In the Log Triggers tab, click Periodic or On Change to specifywhether logging takes place at regular intervals or when tagvalues change.
2. Fill in the boxes as follows:
Log Periodically
In the Interval box, type a time and click a time unit to specifyhow often tag values are logged. All tags in the model are loggedeach time this interval expires.

� 16-9Setting up data logging
Log on tag change
In the Change Percentage box, type the percent the tag value hasto change in order to trigger logging. To log all changes, type 0.
To specify how often tag values are logged even if no change hasoccurred, in the Heartbeat box type a time, and then click a timeunit. If you do not want to use the heartbeat, type 0. If youtype 0, tags values are logged only when a tag value changes.
Specifying the tags to log data for
The “Tags in model”
box displays the tags
that have been added
to the model so far.
To remove a tag from
the model, click it and
then click Remove.
To remove all the tags
from the model, click
Remove All.

Preface
16-10 � RSView Machine Edition User’s Guide
To specify the tags to log data for:
1. In the Tags in Model tab, in the “Tags to add” box, specify thetags to log by doing one of the following:
Type the tag names, with a space between each tag name.
Click the Browse button to open the Tags dialog box, andthen select tags. Shift-click or click and drag to select groupsof tags. Ctrl-click to select multiple individual tags. Click OKwhen you’re finished selecting tags.
2. Click Add. The tags listed in the “Tags to add” box move to the“Tags in model” box.
What to do next
Now that you’ve created the data log model:
In the Startup editor, turn on data logging and specify the datalog model to use at runtime. For more information, seeChapter 20.
In the Graphics Display editor, create a display containing atrend graphic object, and configure the trend to display thevalues from the data log model. For more information, seeChapters 8 and 17.
Changing the data log model used at runtime
Your project can run only one data log model at a time. Follow thisprocedure to switch data log models.
To run a different data log model:
1. Shut down the project.
2. Open RSView Studio and open the project.
3. In the Startup editor, specify the new data log model.
4. Create the runtime project. See Chapter 20.
5. Transfer the runtime project to the runtime platform.
For information about transferring projects to a Windows CEplatform, see Chapter 21.
For information about transferring projects to a Windows 2000platform, see Chapter 22.
6. Run the new project.
Browse button

� 16-11Setting up data logging
Problems with data logging
Problems with data logging occur under these circumstances:
If logging to a folder on a networked computer, and the runtimecomputer is not logged in to the Windows domain of thenetwork computer, the log folder cannot be created. An errormessage is sent to the activity log.
If logging to an invalid path, the log folder cannot be created. Anerror message is sent to the activity log.
If the storage device becomes full due to lack of disk space, datalogging stops and an error message is sent to the activity log.When sufficient disk space becomes available, data loggingcontinues, but the data that would have been logged during theintervening time cannot be retrieved.
If there is not enough disk space at project startup, the data logmodel does not start when the project starts. An error message issent to the activity log.


� 17-1Configuring trends
Configuring trends
This chapter describes:
what trends are
the parts of the trend graphic object
the different chart types
choosing colors, fonts, lines and markers for the trend
testing the trend
steps for creating trends
creating and configuring trend graphic objects
using objects from the Trends graphic library
using buttons to control the trend at runtime
printing trend data
runtime errors for trends
About trends
A trend is a visual representation of real-time or historical tag values.The trend provides operators with a way of tracking plant activity asit is happening.
You can:
plot data for as many as eight tags on one trend
create a trend that is part of a graphic display or acts as the entiregraphic display
plot data over time, or plot one variable against another in an XYPlot chart to show the relationship between them
display isolated or non-isolated graphs. Isolated graphing placeseach pen in a separate band of the chart. With non-isolatedgraphing, pen values can overlap.
create buttons to allow the operator to pause, scroll, and print thetrend data
17Chapter

Preface
17-2 � RSView Machine Edition User’s Guide
The illustration below shows a trend that has been added to agraphic display. You can view the Kiln Status display by opening theMalthouse sample project.
Trend
graphic
object
Current versus historical data
The data displayed in a trend can come from two sources. Forcurrent values, data comes from the value table as it is collected. Thevalue table is a record of the most recent values collected from thedata source, and is stored in temporary memory while the project isrunning.
For historical values, data comes from a data log model’s log file, if amodel is assigned to the trend. You can display both current andhistorical data in the same trend.
For information about data log models, see Chapter 16.
Time, date, and number formats
The trend is displayed using the time, date, and number formats youset up on the runtime computer.

� 17-3Configuring trends
For information about specifying time, date, and number formats onthe RAC6182, see page 21-3. For information about specifying time,date, and number formats in Windows 2000, see page 22-3.
The parts of a trend
The illustration below shows a standard trend chart, with three pensand a two-minute time span. Two of the pens have markers. Thethird uses digital plotting. For more information about plot types,see page 17-22.
Chart
Y-axis
Vertical (Y) axis
label
Trend border
Horizontal (X) axis labelX-axis
Digital
plotting
Pen icon
Pen marker
Pen markerTrend window
Trend border
The border appears around the trend object at runtime when thetrend is selected. The border uses the highlight color for the graphicdisplay, specified in the Behavior tab of the Display Settings dialogbox.

Preface
17-4 � RSView Machine Edition User’s Guide
Trend window
The area around the chart, between the border and the chart, is thetrend window. You can use the Property Panel to specify whetherthe window is transparent or opaque. If it is opaque, you can specifyits color.
Chart
The chart is the area of the trend in which values are plotted. It isbounded by the Y-axis on the left and the X-axis on the bottom. Itcontains the plotted trend data (shown using pen lines and penmarkers), as well as grid lines (if you choose to display them).
Y-axis
The Y-axis is the left vertical edge of the chart. It is also known asthe vertical axis.
Vertical axis labels
The vertical axis labels show the scale (range) of values for the pens.If desired, you can configure the trend to omit the vertical axislabels.
The minimum and maximum values for the scale can be determinedautomatically (using the best fit for the current data), derived from apen’s minimum and maximum values, use a constant value, or becontrolled by tags.
You can configure the trend so all pens use the same scale, or useindividual ranges for each pen. If you choose the latter method,create a Next Pen button in the graphic display, to allow operatorsto view the range for each pen. When the operator presses thebutton, the vertical axis changes to the new pen’s range.
For example, if Pen 1 has a minimum value of 10 and a maximumvalue of 100, the range on the vertical axis is 10 to 100 when the penis selected. If Pen 2 has a minimum of -10 and a maximum of 50, therange on the vertical axis changes to -10 to 50 when the operatorpresses the Next Pen button.
X-axis
The X-axis is the bottom horizontal edge of the chart. It is alsoknown as the horizontal axis.

� 17-5Configuring trends
Horizontal axis labels
For standard charts, the horizontal axis labels indicate the time spancovered by the trend. For XY Plot charts, the horizontal axis labelsshow the scale (range) of values for the pen selected to serve as theX-axis pen.
If desired, you can configure the trend to omit the horizontal axislabels. The number of labels depends on the size of the trend objectand the number of vertical grid lines.
Pens
Pens are the lines and/or symbols used to represent values. Thevalues can be tags you are monitoring, expressions that manipulatetag values, or constants. For details, see page 17-20.
If there is no data for a pen, or if the data is outside the vertical axisrange, the pen does not appear in the chart.
Pen icons
Pen icons appear at the right edge of the chart at runtime, if youchoose to display them. The icon’s position indicates the pen’s mostrecent recorded value (from the value table), even if the trend ispaused or if the most recent value has not been plotted yet.
Pen markers
Pen markers are symbols that indicate data points. If data is plottedfrequently, the markers might not appear as distinct, separatesymbols. For example, see the lowest pen in the illustration onpage 17-3.
Chart types
Standard vs. XY Plots
You can create a standard chart, which plots tag values against time,or an XY Plot chart, which plots one (or more) tag’s values againstanother’s.

Preface
17-6 � RSView Machine Edition User’s Guide
This illustration shows what an XY Plot chart might look like:
Time period
Notice that the horizontal axis labels display the range for thespecified X-axis pen. The time period covered by the chart is at theupper left.
Isolated graphing
For charts with multiple pens, you can allow the pen values tooverlap, or you can isolate each pen in its own horizontal band onthe chart.

� 17-7Configuring trends
This is an example of isolated graphing, with a 10% buffer betweeneach pen’s band:
Notice that in this illustration each pen uses its own scale. If desired,you can use the same scale for all pens.
With isolated graphing, a grid line is automatically placed above eachpen’s band.
Plotting a value across the full width of thechart
Use horizontal lines to provide a frame of reference for your tagdata. For example, if you define values that are the limits withinwhich a tag should operate, and display horizontal lines in yourtrend to indicate the limits, when a tag crosses one of these limits thetag’s alarm condition is obvious on the trend.
There are two ways to plot a value across the full width of the chart:
In the Connections tab, assign a constant value to a pen.
When values for the pen have been plotted across the full widthof the chart, the pen appears as a solid line.

Preface
17-8 � RSView Machine Edition User’s Guide
In the Connections tab, assign to a pen the tag, expression, orconstant whose value will be used to determine the position ofthe line, and then in the Pens tab, choose the pen type FullWidth.
As soon as the trend is displayed, the pen appears as a horizontalline across the full width of the chart. Its vertical position isdetermined by the tag, expression, or constant’s value. If thevalue changes, the position changes.
Choosing colors, fonts, lines, and markers
The following table summarizes where in the Trend ObjectProperties dialog box to specify colors, fonts, lines, and markers fora trend.
You can also specify these settings in the Properties tab of theProperty Panel.
To specify this Use this box or
column
In this tab
Chart backgroundcolor
Background color Display
Horizontal label color Text color Display
Text font, style, andsize
Font (button) Display
Pen line, pen marker,pen icon, and verticallabel color
Color Pens
Pen line width Width Pens
Pen line style Style Pens
Pen marker Marker Pens
Vertical grid line color Grid color X-Axis
Horizontal grid linecolor
Grid color Y-Axis
The trend border color
The trend border uses the highlight color for the graphic display,specified in the Behavior tab of the Display Settings dialog box.

� 17-9Configuring trends
The trend window color
By default, the trend window uses the background color of thedisplay, specified in the General tab of the Display Settings dialogbox.
To use a different window color:
� In the Property Panel, select the opaque WindowStyle, and thenspecify the WindowColor property.
For information about using the Property Panel, see page 9-24.
Testing the trend
You can quickly test the trend by switching to test display mode. Ifcommunications are active and there is data for the tags, the pensplot values in the trend. When you are finished testing, switch backto edit display mode to continue editing.
To switch between test display and edit display modes:
� On the View menu, click Test Display or Edit Display, or clickthe Test Display and Edit Display tools.
IMPORTANT Test display mode is not the same as running thedisplay. Test display mode does not change theappearance or position of the display as set up inthe Display Settings dialog box. Also, data loggingis not enabled in test display mode.
Summary of steps
These are the steps for creating a trend:
1. To plot historical data, create a data log model in the Data LogModel editor. For information, see Chapter 16.
2. Create a trend graphic object in the Graphics Display editor.
3. Configure the trend in the Trend Object Properties dialog box.
4. If desired, create a Next Pen button, a Pause button, or Keybuttons in the same graphic display, to allow the operator toswitch between pens, pause the trend, or scroll the trend.
Edit Display tool
Test Display tool

Preface
17-10 � RSView Machine Edition User’s Guide
For information about the buttons you can use with trends, seepage 17-24.
5. To have a printed record of the trend data, provide a way for theoperator to print the graphic display. For information seepage 17-26.
Creating trend objects
To create a trend object:
1. In the Graphics Display editor, create or open a graphic display.
2. Select the Trend drawing tool by doing one of the following:
In the Objects toolbox, click the Trend tool.
On the Objects menu, select Trending, and then click Trend.
3. Drag the mouse to create a box approximately the size you wantfor the trend.
4. Double-click the trend to open the Trend Object Propertiesdialog box.
5. Configure the trend as described in the next section.
6. When you’re finished configuring the trend, click OK to saveyour changes.
7. To name the trend, open the Property Panel and then type aname in the (Name) row.
The name can contain letters, numbers, and the underscorecharacter (_), but the first character must be a letter. Do not usespaces in the name.
The name is used in the status bar, activity bar, Property Panel,Object Explorer, and activity log messages.
Once you have configured the trend, you can edit it as you wouldany other graphic object. You can move it, resize it, attach animationto it, and so on. You can also use this object in other graphic displaysby dragging it from one display and dropping it into another.
For more information about graphic objects, see Chapter 9.
Configuring trendsWhen you double-click a trend object, the Trend Object Propertiesdialog box opens. Use the dialog box to configure the trend.
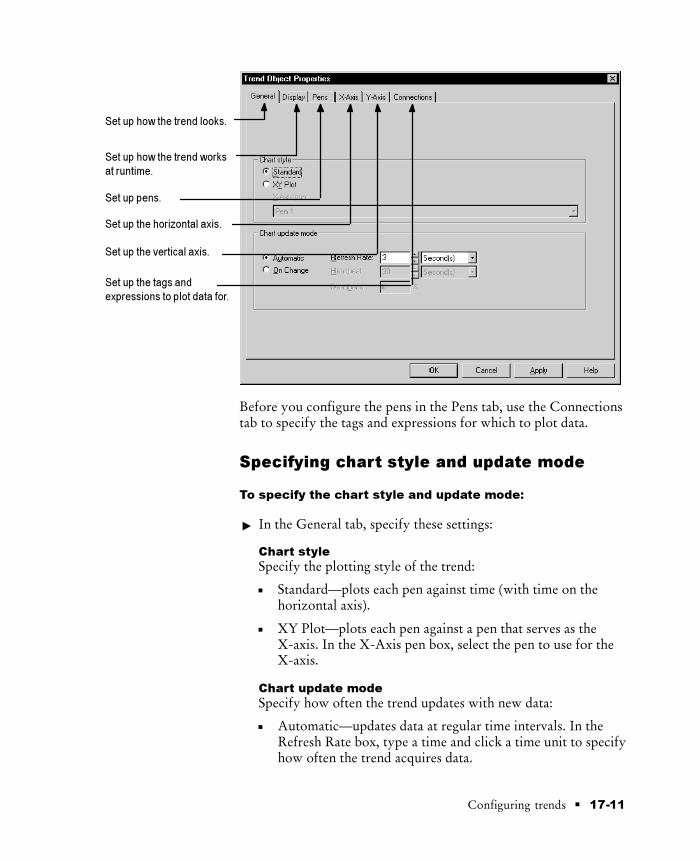
� 17-11Configuring trends
Set up how the trend looks.
Set up the horizontal axis.
Set up how the trend works
at runtime.
Set up pens.
Set up the vertical axis.
Set up the tags and
expressions to plot data for.
Before you configure the pens in the Pens tab, use the Connectionstab to specify the tags and expressions for which to plot data.
Specifying chart style and update mode
To specify the chart style and update mode:
� In the General tab, specify these settings:
Chart style
Specify the plotting style of the trend:
Standard—plots each pen against time (with time on thehorizontal axis).
XY Plot—plots each pen against a pen that serves as theX-axis. In the X-Axis pen box, select the pen to use for theX-axis.
Chart update mode
Specify how often the trend updates with new data:
Automatic—updates data at regular time intervals. In theRefresh Rate box, type a time and click a time unit to specifyhow often the trend acquires data.

Preface
17-12 � RSView Machine Edition User’s Guide
The refresh rate range is 50 milliseconds to 596 hours.
On Change—updates the data as values change. This mode isuseful for data that changes rapidly.
To specify how often data is updated even if no change hasoccurred, in the Heartbeat box type a time, and then click atime unit. If you do not want to use the heartbeat, type 0.
To specify a percentage by which a value must change beforethe trend displays the new value, in the Deadband box type anumber.
Setting up how the trend works at runtime
To set up how the trend works at runtime:
� In the Display tab, specify these settings:
Time format
Select how the trend displays time:
Use system time format—displays time using the formatspecified in the Windows Control Panel, in the RegionalOptions dialog box.

� 17-13Configuring trends
24-hour format
AM/PM format
Chart radix
Specify the number base to use for displaying numeric values inthe trend labels. If you select the XY Plot chart style, this settingaffects the labels on the Y-axis and the X-axis.
However, if the number of decimal places specified in the Y-Axistab is set to anything other than 0, that setting overrides the radixselection and all numbers are displayed as decimals.
Data point connection
Specify how data points on the trend are connected:
Connect points—data points are connected with a line.
Show discontinuity—plot lines are disconnected between thestart and end of a discontinuity in data. A discontinuity indata indicates a communication error, or a break in a model’sdata logging (for example, when the operator stops and thenrestarts the project).
Show only markers—a marker is displayed for each datapoint. Lines do not connect the data points, so if a pendoesn’t have a marker assigned to it (in the Pens tab), then thepen does not appear in the trend.
Display milliseconds
If you select the standard chart style, select this box to displaymilliseconds in the time labels on the X-axis. (To display timelabels, in the X-Axis tab select the Display Scale check box.)
Display pen icons
Select this box to display an icon for each pen at the right side ofthe trend chart. The pen icon moves vertically to indicate thecurrent value of the pen, even if the chart is not scrolling, so somepen icons might not be at the end of a line.
Background color
Click this box to select a background color for the chart.
The chart border is always black. For information aboutspecifying the background color for the other areas in the trend,see page 17-9.
Text color
Click this box to select the text color for the labels above andbelow the chart.

Preface
17-14 � RSView Machine Edition User’s Guide
The labels on the vertical axis use the color of the first pen, unlessyou select the “Each pen on independent scale” option (in theY-Axis tab), in which case the label’s color matches the penwhose range is currently displayed on the vertical axis.
If you use isolated graphing, each pen is shown in a separatesection of the chart, with its own color labels.
Font
Click this button to select the font to use for the text in the trend.
Allow scrolling
Check this box to continually update the trend with new data atruntime. If you deselect this option, once the trend has filledwith data up to the buffer limit the chart does not update untilthe operator manually toggles the scroll mode (using the Pausebutton).
If you allow scrolling, select a scroll mode:
Continuous Scroll—chart scrolls from right to left for eachnew data reading.
Half Screen Scroll—chart scrolls half a screen at a time. Pensscroll from the middle of the chart to the right. When thepens reach the right side of the screen, the screen scrolls leftand the pens continue at the middle of the chart.
Full Screen Scroll—chart scrolls a full screen at a time. Pensscroll from the left to the right, starting at the left of the chart.When the pens reach the right side of the screen, the entirescreen scrolls and the pens begin again at the left side.
Buffer for extra data
Specify the number of extra data points (outside of the displayarea) to store for each pen. The operator can view these datarecords by manually scrolling (using the Key buttons).
The maximum buffer size is 32,767 data points. Divide thisnumber by the number of pens in the trend to determine themaximum data records per pen.
The more data points held in the buffer, the faster it is to scroll.However, a larger buffer size also requires more systemresources.

� 17-15Configuring trends
Setting up the horizontal axis
For a standard chart, the horizontal axis represents time; for an XYPlot chart, the horizontal axis represents the selected pen’s values.The settings in this tab apply to both types of chart.
To set up the horizontal axis:
� In the X-Axis tab, specify these settings:
Start date and Start time
These settings are not available if you select “Allow scrolling,”on the Display tab.
If you want to specify a starting date and time for the trend, clearthe Allow scrolling check box, on the Display tab. To select adate from the calendar, click the Down Arrow beside the Startdate box.
These settings determine when to begin displaying data for thetrend. As the operator manually scrolls, the chart updates withthe latest data for the specified time span.
If the trend is plotting current values only, and it is first displayedafter the specified time, the current time is used as the startingpoint.

Preface
17-16 � RSView Machine Edition User’s Guide
If the trend is plotting historical data, and the data log model isrunning at the specified start time, data is displayed from thistime onwards. Otherwise, the earliest available data (after thestart time) is displayed. Once the operator scrolls to the currenttime, values are taken from the value table, not the data log file.
Time span
In this box type a time, and then click a time unit, to specify theamount of data the trend displays at runtime.
For a standard chart, the time span controls the horizontal scale.For an XY Plot chart, the Min and Max values (specified in thePens tab) of the selected pen control the horizontal scale, and thetime span controls the number of data points plotted.
Display scale
Check this box to display X-axis labels at the bottom of thetrend.
For a standard chart, the labels show the start and end times. Ifthere’s room, intermediate times are shown below each verticalgrid line.
For an XY Plot chart, the labels show the minimum andmaximum value range of the pen selected as the X-axis. If there’sroom, intermediate values are shown as well.
Display grid lines
Check this box to display vertical grid lines on the chart, andthen type the number of major and minor lines to display.
You can display up to 30 major lines, and up to 10 minor linesbetween each major line. The major lines are solid, and the minorlines are dashed.
Grid color
If you display grid lines, click this box to select the color for thelines.

� 17-17Configuring trends
Setting up the vertical axis
To set up the vertical axis:
� In the Y-Axis tab, specify these settings:
Minimum / maximum value options
Select the method for determining the minimum and maximumvalues for the vertical axis:
Automatic—the lowest data reading serves as the minimumvalue and the highest data reading serves as the maximum. Asthe trend acquires new data, the Y-axis may rescale to fit thenew values.
Preset—the minimum and maximum pen values, configuredin the Pens tab, serve as the Y-axis scale. The scale does notchange. Which pen’s minimum and maximum values are useddepends on the scale options you select in this tab.
Custom—allows you to specify constant minimum andmaximum values, or to assign tags or expressions whosevalues are used to determine the minimum and maximumvalues.
To use constant minimum and maximum values, click “Actualminimum value” and type the value in the box. Repeat for themaximum value.

Preface
17-18 � RSView Machine Edition User’s Guide
To use tags or expressions to determine the values, you mustfirst assign the tags or expressions in the Connections tab.Then return to this tab and click “Controlled by tag.”
Isolated graphing
Check this box to place each pen in a separate band of the chart,and then, in the “% isolation” box, type the distance betweenbands. The distance is a percentage of the chart height, between 0and 10%.
To allow pens to overlap, clear the check box.
If you select isolated graphing, you cannot display horizontalgrid lines. Instead, a horizontal line appears above each band.
Display scale
Check this box to display Y-axis labels at the left of the trend.
To display decimals in the labels, type a number in the Decimalplaces box. If you type a number other than 0, this settingoverrides the Chart Radix setting in the Display tab, and allnumbers are displayed as decimals.
Display grid lines
Check this box to display horizontal grid lines on the chart, andthen type the number of major and minor lines to display.
You can display up to 30 major lines, and up to 10 minor linesbetween each major line. The major lines are solid, and the minorlines are dashed.
Grid color
If you display grid lines, click this box to select the color for thelines.
If you use isolated graphing, this color is used for the horizontallines between bands.
Scale options
Specify how multiple pens with different minimum andmaximum ranges scale together on the chart (this option is notavailable if you use the Custom minimum/maximum valueoption):
All pens on same scale—displays all pens relative to the samescale, determined by the lowest minimum and highestmaximum values of all pens.

� 17-19Configuring trends
Each pen on independent scale—scales each penindependently using the pen’s minimum and maximum valuesas the range. Only one pen’s range is used in the labels on thevertical axis, which can be misleading if other pens use adifferent range.
To allow the operator to view each pen’s vertical axis labels,create a Next Pen button. When the operator presses thebutton, the vertical axis changes to the new pen’s range. Thecolor for the labels changes to the color of the selected pen.
Scale using pen—uses the same scale for all pens, based on theminimum and maximum values for the specified pen, or basedon the best fit for the pen’s actual data. Select the pen to use.
If you use the Preset minimum/maximum value option,configure the minimum and maximum values in the Pens tab,as described on page 17-21.
This option does not apply if you use the Customminimum/maximum value option.
Scale as percentage
Check this box to display the Y-axis values as a percentage of theminimum and maximum range. The Y-axis labels display thepercentage range, from 0 to 100%.

Preface
17-20 � RSView Machine Edition User’s Guide
Specifying the tags and expressions to plotdata for
To specify the tags and expressions to plot data for:
1. In the Connections tab, specify up to 8 tags or expressions toplot values for. Do not use string tags or block tags.
To plot historical values, specify tags from the data log modelyou’ll be using at runtime. (Specify the data log model in thePens tab.)
If desired, you can specify both tags that are in a data log modeland tags that are not. You cannot use expressions to plothistorical values.
For information about specifying tags and expressions, seepage 7-28.
2. To control the vertical axis minimum and maximum values usingtags or expressions (using the Custom setting in the Y-axis tab),assign tags or expressions to the Minimum and Maximumcontrols.
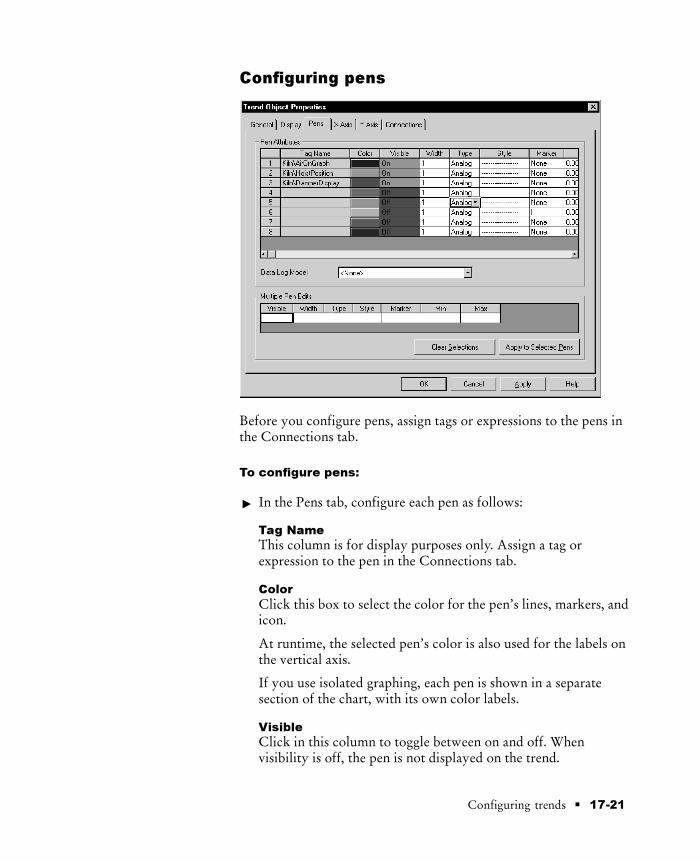
� 17-21Configuring trends
Configuring pens
Before you configure pens, assign tags or expressions to the pens inthe Connections tab.
To configure pens:
� In the Pens tab, configure each pen as follows:
Tag Name
This column is for display purposes only. Assign a tag orexpression to the pen in the Connections tab.
Color
Click this box to select the color for the pen’s lines, markers, andicon.
At runtime, the selected pen’s color is also used for the labels onthe vertical axis.
If you use isolated graphing, each pen is shown in a separatesection of the chart, with its own color labels.
Visible
Click in this column to toggle between on and off. Whenvisibility is off, the pen is not displayed on the trend.

Preface
17-22 � RSView Machine Edition User’s Guide
Width
Type the number of pixels for the width of the pen’s line. If youuse a width other than 1, you cannot change the line style setting.
Type
Specify how to plot the pen lines:
Analog—plots pen lines using diagonals from one point tothe next.
Digital—plots pen lines using only horizontal and verticallines between points.
Full-Width—plots a tag’s value as a horizontal line thatextends across the full width of the chart. The line moves upand down in the chart as the tag or expression value changes.
Style
Click in the column to select a line style. If you select a styleother than solid, the line width must be 1 pixel.
Marker
Click in the column to select a plot symbol for each data point. Ifyou use the “Show only markers” option (specified in theDisplay tab), only pens that you select a plot symbol for aredisplayed in the trend.
If a pen displays new data frequently, for example every fewseconds, the markers might appear to form a solid line.
Min and Max
If you specify the “Preset minimum/maximum value” option (inthe Y-Axis tab), type the minimum and maximum values for thepens.
The minimum and maximum values, together with the scalingoptions you select in the Y-Axis tab, determine the range of thetrend’s vertical axis. Tag values outside this range do not appearon the chart.
Link Data
Check this box to use the assigned tag’s minimum and maximumvalues. Checking this box disables the Min and Max columns. Ifthe tag’s minimum and maximum values are not available, ???appears in the columns.
For digital tags, the minimum is 0 and the maximum is 1. Foranalog tags, specify the minimum and maximum values in the TagDatabase editor.
� 17-23Configuring trends
Data Log Model
For historical data, select the data log model to use to supply thedata when the trend is first displayed or you scroll back in time(using the Key buttons). If buffered data is available, that data isused instead of the data from the model.
If the trend plots current values only, accept the default of None.
Make sure you add the tags to the data log model.
To configure multiple pens at the same time:
1. Select the pens to configure by Shift-clicking or Ctrl-clicking inthe Tag Name column.
2. In the Multiple Pen Edits columns, specify the attributes to use.
To clear the Multiple Pen Edits columns, click Clear Selections.
3. To apply the attributes, click Apply to Selected Pens.
What to do next
Now that you’ve created the trend:
If desired, create a Next Pen button, a Pause button, or Keybuttons in the same graphic display, to allow the operator toswitch between pens, pause the trend, or scroll the trend.
For information about the buttons you can use with trends, seepage 17-24.
To have a printed record of the trend data, provide a way for theoperator to print the graphic display. For information seepage 17-26.
Using the Trends graphic library
The Trends graphic library contains a trend graphic object andbuttons for controlling the trend. It also contains Numeric displayobjects that display the value of each tag used in the trend.
You can use the trend and objects as they are, or you can edit themto suit your needs. To use the objects, drag and drop (or copy andpaste) them into your graphic display.
For information about copying and pasting objects from the graphiclibraries, see page 9-38.

Preface
17-24 � RSView Machine Edition User’s Guide
To use the Trends graphic library:
1. Open the Graphics folder, and then open the Libraries folder.
2. Double-click the Trends library.
3. Drag and drop or copy and paste objects into your display.
Using buttons to control the trend at runtime
You can place buttons in the same graphic display as the trend, toallow the operator to pause the trend, switch between pens, or scrollthe trend.
You can link the buttons to a specific trend object, or configure thebutton to work with whichever object is selected in the graphicdisplay. For information about linking buttons, see page 10-9.

� 17-25Configuring trends
Use these buttons with trends:
This button Does this
Pause Toggles between pausing andautomatic scrolling.
When the trend is paused, the penicons continue to move vertically toindicate the pens’ current values.
When the trend resumes scrolling,values that occurred while the trendwas paused are filled in, bringingthe trend up to the current time(unless you are scrolling historicaldata).
Next Pen Changes the vertical axis labels tothe scale for the next pen. The colorof the labels matches the color ofthe selected pen.
Move Up Scrolls up to display higher valueson the vertical scale. For example, ifthe visible scale range is 0 to 100,pressing Move Up changes thevisible range to 10 to 110.
The incremental amount the axisscrolls depends on the pen’s rangeand the number of horizontal gridlines.
This button does not work if theY-Axis “Minimum / maximumvalue option” is set to Automatic.
Move Down Scrolls down to display lowervalues on the vertical scale.
This button does not work if theY-Axis “Minimum / maximumvalue option” is set to Automatic.
Move Left Pauses the trend and scrolls to theleft.
Move Right Pauses the trend and scrolls to theright.

Preface
17-26 � RSView Machine Edition User’s Guide
This button Does this
Home Pauses the trend and moves to theearliest data in the trend.
End Resumes trend scrolling and movesto the current (latest) data in thetrend.
To see how the buttons work with the trend, open the Trendsgraphic library (see page 17-23), and start test mode (see page 17-9).
For information about creating buttons, see Chapter 9. For detailsabout configuring the buttons, see Chapter 10.
Printing trend data
To print trend data at runtime, provide the operator with a methodfor printing the graphic display.
You can use these methods to print graphic displays at runtime:
Create a Display Print button.
Assign a tag or expression to the Remote Display Print control(in the Global Connections editor). When the value of the tag orexpression changes from 0 to a non-zero value, the currentdisplay is automatically printed.
Program the data source to trigger the change as often as youwant the data printed.
For more information about setting up remote display printing,see Chapter 19.
Everything on the screen is printed, including the current display,pop-up windows, and any visible background applications.
For information about specifying the printer to use at runtime, seeChapter 23.
Improving clarity of the trend printout
Depending on what type of printer you use, pen lines with a widthof 1 pixel might not appear in the printout. Choose high-contrastcolors and wider line widths to ensure that the trend data printsclearly.

� 17-27Configuring trends
Runtime errors for the trend
If data for the trend is not available at runtime due tocommunication errors, a message is sent to the activity log.
See the Help for information on solving common trend problems.

� 18-1Setting up security
Setting up security
This chapter describes:
what security is
how user accounts and security codes work
steps for setting up security
assigning security to graphic displays
using the User Accounts editor
setting up user accounts
changing passwords
providing a way for users to log in and log out
preventing unauthorized users from stopping the project
summary of security features in a sample startup display
About security
You can use security features to:
prevent users from opening graphic displays that you don’t wantthem to have access to
prevent unauthorized users from running the project
prevent unauthorized users from stopping the project
prevent users from seeing and using certain parts of a graphicdisplay
prevent users from switching to other applications or accessingthe desktop on the runtime computer. This feature uses theDeskLock tool, and is available for Windows 2000 runtimeprojects only. For more information about the DeskLock tool,see Chapter 22.
To limit the users who have access to the project or parts of theproject, you must set up user accounts and passwords.
18Chapter

Preface
18-2 � RSView Machine Edition User’s Guide
If you don’t set up security, anyone can use the project withoutlogging on, and view all the graphic displays.
IMPORTANT If you configure the data source to open graphicdisplays remotely (using global connections), remotedisplay changes occur whether or not the logged-inuser has security access to a given display.
For details about controlling display changesremotely, see page 19-7.
How user accounts and security codes workBy default, all users have unrestricted access to all graphic displays.When you assign a security code to a graphic display, only the userswho are assigned that security code have access to the display.
There are 16 security codes, A through P, and the asterisksymbol (*). The * represents unlimited access. You can assigncombinations of security codes to users, to allow each user access toa different set of displays.
Example: Assigning security codes to prevent access tographic displays
This example shows how to set up users with access to differentgraphic displays.
1. Assign security codes to graphic displays as follows:
To this display Assign this security code
Alarm History A
Boiler B
Furnace C
Top Secret D
2. In the User Accounts editor, assign security codes to users:
To this user Assign these security codes
ALICE A, B, C
SIMON A, B
ADMIN All
DEFAULT None

� 18-3Setting up security
The users have access to these graphic displays:
ALICE has access to the first three graphic displays.
SIMON has access to the Alarm History and Boiler displays, butnot to the Furnace or Top Secret displays.
The ADMIN user has access to every graphic display.
The DEFAULT user has access only to graphic displays to whichno security has been assigned (that is, graphic displays with thesecurity code *). In this example, the DEFAULT user does nothave access to any of the graphic displays.
In this example, you could have assigned the same security code tothe Alarm History and Boiler displays, since all users except theDEFAULT user have access to these displays.
Example: Using security codes to control the visibility of inputobjects
This example shows how to set up users so that only authorizedusers can use input objects to enter data.
This example uses the CurrentUserHasCode( ) expression securityfunction to determine whether a user is authorized to input datausing a Numeric Input Enable button.
The security code E is assigned to users who are authorized to enterdata.
1. In the User Accounts editor, assign security codes to users.

Preface
18-4 � RSView Machine Edition User’s Guide
To this user Assign these security codes
OPERATOR A, B, C
SUPERVISOR All
ADMIN All
DEFAULT None
2. Create a Numeric Input Enable button.
3. Assign visibility animation to the button using this expression:
CurrentUserHasCode( E )
For the Expression True State, click Visible.
When the graphic display containing the Numeric Input Enablebutton is open, the SUPERVISOR and ADMIN user can see thebutton. If the OPERATOR or DEFAULT user is logged in, thebutton is not visible.
Summary of steps
Follow these steps to set up security:
1. In the Graphics Display editor, assign security codes to graphicdisplays that will have limited access.
2. In the User Accounts editor, set up users and passwords, andassign security codes to users.
3. Provide users with a method for logging in and out.
4. If desired, prevent unauthorized users from stopping the project.
5. If desired, assign visibility animation to graphic objects that onlycertain users are authorized to use.
Assigning security to graphic displays
Assign security to graphic displays in the Graphic Display editor.You can:
assign security when you create the graphic display, or at anytime after creating the display

� 18-5Setting up security
assign the same security code to more than one display
assign whichever codes you want, in any order. For example, youcan choose to use only the codes D and P and you can assign Pbefore you assign D.
For more information about graphic displays, see Chapter 8.
To assign security to a graphic display:
1. In the Graphic Display editor, right-click an empty area of thedisplay, and then click Display Settings.
Select a security code.
2. In the General tab, select a security code.
To allow unlimited access to the display, select the asterisk (*).
3. Click OK to close the dialog box.
Using the User Accounts editor
Use the User Accounts editor to set up accounts for each user orgroup of users that will have access to the project at runtime.

Preface
18-6 � RSView Machine Edition User’s Guide
Form area
Spreadsheet area
Use the scroll bar or drag
the border of the editor to
see more columns.
Double-click in the security code
columns to toggle between Yes
and No.
You can use the form or spreadsheet section of the editor to enter alluser information except passwords. You must use the form area toenter passwords.
Using the View menu
Use the items on the View menu to control the appearance of theUser Accounts editor.
To do this On the View menu, click this
Show or hide the spreadsheet area Spreadsheet
Show or hide the form area Form
Change the font used in thespreadsheet area
Spreadsheet Font. In the Fontdialog box, specify the font, style,and size to use.
Restore the default font Restore Default Settings
Using the Accept and Discard buttons
When you enter information, the Prev and Next buttons change toAccept and Discard buttons. Click Accept to save user accountinformation. Click Discard to cancel changes to a user account.

� 18-7Setting up security
Using the tools
The User Accounts editor has these tools for working in the editor:
Use this tool To do this
Cut Cut the selected text and place it onthe clipboard.
Cutting a No security code settingchanges it to a Yes. You cannot cutYes security code settings.
Copy Copy the selected text.
Paste Paste the cut or copied text fromthe clipboard.
Delete Delete the selected text.
Deleting a No security code settingchanges it to a Yes. You cannotdelete Yes security code settings.
Duplicate Create a duplicate of the selecteduser, with all the same settings,including name.
Insert Row Insert a blank row above the row inwhich the cursor is located.
Fill Forward With multiple rows selected, copythe settings from the first row intothe other selected rows.
Sort With multiple cells in a columnselected, sort the user accountsalphanumerically by the selectedcells’ contents.
Undo Undo the previous operation orsequence of operations.
Redo Redo the previously undoneoperation or sequence ofoperations.

Preface
18-8 � RSView Machine Edition User’s Guide
The DEFAULT user
The first account in the editor is the DEFAULT user account. TheDEFAULT account is used when no one is logged in. TheDEFAULT user initially has access to each security code. Unlessyou want everyone to have access to all parts of the project withoutlogging on, disable the DEFAULT user’s access to the security codesyou plan to use.
You cannot delete the DEFAULT user account.
Setting up user accounts
To set up user accounts:
1. Open the User Accounts editor.
2. If the editor already contains user account definitions, click thefirst blank row in the spreadsheet, or click Next to scroll to ablank row.
3. Specify these settings:
Account ID
Type a user name or ID for the account, up to 20 charactersincluding spaces. The name is not case sensitive.
Login Macro
To run a macro when this user logs in, type the name of themacro, or click the Browse button to select from a list of macrosin the project.
Logout Macro
To run a macro when this user logs out, type the name of themacro, or click the Browse button to select from a list of macrosin the project.
Password
Type a password for the account, up to 14 characters includingspaces, and then press Enter. The password is not case sensitive.
The Password Confirmation dialog box opens. Retype thepassword, and then click OK.
Security Codes
To prevent the user from having access to a security code, clearthe check box for the code, or double-click in the code’s columnin the spreadsheet to change the setting to N.
Browse button

� 18-9Setting up security
4. Click Accept.
5. Repeat steps 2 through 4 to set up additional user accounts.
6. Click Close. When prompted to save your changes, click Yes.
Deleting user accounts
To delete a user account:
� In the spreadsheet area, click the number at the left end of therow for the user to delete, and then press Delete on yourkeyboard.
Changing passwords
Users cannot change passwords at runtime. The only way to changea password is by using the User Accounts editor.
To change a user’s password:
1. In the spreadsheet area, click the row for the user’s account.
2. In the form area, in the Password box, type the new password.
3. In the Password Confirmation box, type the new passwordagain, and then click OK.
Providing a way for users to log in and log out
Use Login and Logout buttons to provide a way for users to log inand log out. Make sure you place these buttons in graphic displaysthat all users have access to.
Logging in
When the project starts, the DEFAULT user is automatically loggedin until a new user logs in.
To provide a way for users to log in:
Create a Login button in the startup graphic display (the graphicdisplay that opens when your project starts running).
For information about creating graphic objects, see Chapter 9.For information about configuring graphic objects, seeChapter 10.

Preface
18-10 � RSView Machine Edition User’s Guide
Specify the startup display in the Startup editor, in the Initialgraphic box.
For information about using the Startup editor, see Chapter 20.
For more information about logging in, see Chapter 24.
Logging out
To best maintain your security system, users who log in should alsolog out.
When a user logs out, the DEFAULT user is automatically logged inuntil a new user logs in. Disable the DEFAULT user’s access to thesecurity codes you plan to use.
To provide a way for users to log out:
� Create a Logout button in a graphic display that all logged-inusers have access to.
For more information about logging out, see Chapter 24.
Preventing unauthorized users from stopping theproject
To prevent unauthorized users from stopping the project:
Do not use a title bar on the project window. To disable the titlebar for the project window, in the Project Settings editor, in theRuntime tab, deselect the Title bar check box.
For more information about using the Project Settings editor, seeChapter 4.
Assign visibility animation to the Shutdown button, so that thebutton is only visible when a user who is authorized to stop theproject is logged in. For an example, see page 18-13.
Or, set up security for the graphic display in which theShutdown button is located, so only users who are authorized tostop the project can open the display.
Additional step for Windows 2000 projects:
Use the DeskLock tool to prevent users from accessing thedesktop, to prevent access to operating system functions such asrestarting Windows or shutting down tasks. For moreinformation, see page 22-4.

� 18-11Setting up security
Additional steps for RAC6182 projects:
Use the Keypad Configuration Utility that ships on CD with theRAC6182 to disable the Win key and the Alt-Tab keycombinations. Otherwise, the user can press the Win key or pressAlt-Tab to open the Windows Taskbar.
For information about using the Keypad Configuration Utility,see the utility’s Help.
Hide the Windows Taskbar to make it inaccessible. To hide theTaskbar, on the Windows Start menu select Settings, and thenselect Taskbar. Clear the “Always on top” check box and selectAuto hide.
For more information about stopping the project, see Chapter 23.
Summary of security features in a sample startupdisplay
This section provides a summary of how to use all the securityfeatures in a startup graphic display called Log In.
To create a startup display that uses all the security
features in RSView:
1. Set up user accounts and passwords.
2. In the Project Settings editor, clear the Title bar check box.
3. Create a graphic display called Main Menu that containsnavigation buttons that give the operator access to the differentdisplays in the project. Assign a security code to the display sothat only authorized users can open it.
4. Create a graphic display called Log In containing these buttonobjects:
This button Does this
Login Opens the Login dialog box.
Logout Logs the current user out and logs in theDEFAULT user.
Goto Display Opens the Main Menu graphic display.
Shutdown Shuts down the project.
5. Configure the Goto Display button to open the Main Menudisplay. If desired, attach visibility animation to the GotoDisplay button, so that only authorized users can see the button.

Preface
18-12 � RSView Machine Edition User’s Guide
For more information, see Example 1 on page 18-13.
6. Attach visibility animation to the Shutdown button, so that onlyauthorized users can see (and therefore use) the button.
For more information, see Example 2 on page 18-13.
7. Specify captions for the buttons, and add explanatory text to thegraphic display. If desired, attach visibility animation to the textas well.
8. In the Display Settings dialog box, assign the security code * tothe Log In display, so that all users have access to it.
9. In the Startup Settings editor, in the Initial graphic box, select theLog In display.
Until an authorized user is logged in, further access to the project isdenied. In addition, only authorized users can stop the project.
Users who have access to the project can use the project and log out.Make sure you provide a way for users to navigate back to thisdisplay to log out.
IMPORTANT When a user logs out, the DEFAULT user isautomatically logged in. Do not give the DEFAULTuser access to the Goto Display button or Shutdownbutton.
To see what the startup Log In display looks like when differentusers are logged in, see Example 3 on page 18-14.
You can also use the Remote Display Number control to open thestartup Log In display when a user logs out. This might be useful ifusers can log out from various locations (graphic displays) withinthe project. For an example, see page 19-8.
For more information about See
Using the Project Settings editor Chapter 4
Attaching animation to graphic objects Chapter 11
Setting up display navigation Chapter 19
Using the Startup editor Chapter 20
Logging in, logging out, and stopping projects Chapter 24
� 18-13Setting up security
Example 1: Assigning visibility animation to the Goto Displaybutton
This example shows how to assign visibility animation to the GotoDisplay button so that a user must log in before seeing the button.
This example uses the security function CurrentUserName( ). Thefunction returns the string value of the Account ID (user name) forthe user who is currently logged in.
The CurrentUserName( ) function is case sensitive. All user namesuse upper case letters, so make sure that you use upper case letters inyour expression.
The DEFAULT user is the current user when the project starts, andwhen a user logs out.
To assign visibility animation to the Goto Display button:
1. Right-click the Goto Display button, select Animation, and thenclick Visibility.
2. In the Animation dialog box, in the Expression box, type this:
CurrentUserName( ) <> “DEFAULT”
3. For the Expression True State, click Visible.
4. Click Apply.
Example 2: Assigning visibility animation to the Shutdownbutton
This example shows how to assign visibility animation to theShutdown button so that only the ADMIN user can stop theproject.
To assign visibility animation to the Shutdown button:
1. Right-click the Shutdown button, select Animation, and thenclick Visibility.
2. In the Animation dialog box, in the Expression box, type this:
CurrentUserName( ) == “ADMIN”

Preface
18-14 � RSView Machine Edition User’s Guide
3. For the Expression True State, click Visible.
4. Click Apply.
Example 3: The sample Log In startup display
At runtime, this is what the display looks like when no one haslogged in:

� 18-15Setting up security
This is what the display looks like when a user who is authorized touse the project but not to stop the project has logged in:
This is what the display looks like when the ADMIN user (who hasauthority to stop the project) has logged in:


� 19-1Setting up display navigation and controlling projects at runtime
Setting up displaynavigation andcontrolling projects atruntime
This chapter describes:
what display navigation is
developing a hierarchy of displays
testing display navigation
using graphic objects to navigate
controlling display changes remotely
configuring remote display changes
what global connections are
setting up global connections
This chapter describes methods for navigating between graphicdisplays. For information about navigating between objects in agraphic display, see Chapter 9.
About display navigation
The way the operator moves between the graphic displays that makeup a project is referred to as display navigation.
Use these methods to set up display navigation for your project:
Develop a hierarchy of graphic displays, to chart how users willnavigate the project.
Determine which users will have access to which parts of theproject.
19Chapter
Preface
19-2 � RSView Machine Edition User’s Guide
Create graphic objects that the operator can use to navigate theproject.
If desired, automatically control display changes using theRemote Display Number control. The use of this control isoptional.
In the Startup editor, specify the graphic display to open whenthe project starts.
For information about specifying the startup display, seeChapter 20.
Set up security so that only authorized users have access to theproject or parts of the project.
For information about setting up security, see Chapter 18.
About global connectionsGlobal connections are controls that apply to your entire runtimeproject. Many of the global connections allow the data source tocontrol or interact with your project at runtime.
For example, the Remote Display Number control is a globalconnection that you can use to control display changes from the datasource. You can also use global connections to print graphic displaysfrom the data source, to run macros from the data source, and tocontrol the date and time displayed on the runtime terminal. Formore information about global connections, see page 19-9.
The use of each global connection is optional.
Developing a hierarchy of displaysA display hierarchy is a series of graphic displays that provideprogressively more detail as users move through them. Design yourdisplay hierarchy to meet the needs of the various users, includingmanagers, supervisors, and operators.
If you plan to use security, determine which groups of users needaccess to which displays, and decide where in the hierarchy to locateLogin, Logout, and Shutdown buttons. For information aboutsetting up security, see Chapter 18.
A display hierarchy could include:
an initial graphic display for logging in
a graphic display that serves as a menu
an overview of the plant

� 19-3Setting up display navigation and controlling projects at runtime
a comprehensive display of each process being monitored
process-specific displays that provide more detail
management summary displays
trend displays of historical and real-time data
The following illustration shows a sample display hierarchy.
Main Menu
Process
Overview
Management
Summary
System
Status
Alarm
Summary
Historical Data
Trend Display
Process
Monitoring 2
Process
Monitoring 1Process
Monitoring 3
Area 1
Trend Display
Area 2
Trend Display
Area 3
Trend Display
Log In
Testing display navigationOnce you set up display navigation for your project, test the projectto make sure that navigation flows smoothly and that you haveavoided problems like these:
A graphic display contains no buttons for moving forward orback.
When a graphic display closes, no other display is open and thereis no way to continue using the project.
For information on testing your project, see page 20-3.

Preface
19-4 � RSView Machine Edition User’s Guide
Using graphic objects to navigate
Use these graphic objects to navigate through the displays in theproject:
Use this object To
Goto Display button Open the specified graphic display.
Return to Display button Close the current display and open theprevious display.
Close Display button Close the current display.
Display List selector Provide a list of graphic displays so theoperator can select which display toopen.
Shutdown button Stop the project and close RSView MEStation.
The behavior of these graphic objects depends on which types ofgraphic displays are used. See the following sections for details.
For detailed information about configuring graphic objects, seeChapter 10.
Display type
The display type you use gives you additional control over how theoperator navigates between displays. For example, use the On Toptype to keep a graphic display on top at all times, even when anotherdisplay has focus. Or use the Replace type if you want a display toreplace all other open displays when it opens.
For information about specifying the display type, see page 8-10.
Goto Display buttons
When you configure a Goto Display button, specify the graphicdisplay to open when the operator presses the button at runtime.
The specified display doesn’t open if the operator does not havesecurity access for the display.
You can also assign a parameter file that assigns tags to tagplaceholders in the display when the display opens. For moreinformation about parameter files, see page 8-25.
� 19-5Setting up display navigation and controlling projects at runtime
How display types affect the button’s behavior
The Goto Display button’s behavior at runtime also depends onwhich types of graphic displays are already open and which type ofdisplay it is opening:
If the graphic display assigned to the button is a Replace display,it closes any open On Top or Replace displays. It does not closeany On Top displays that use the Cannot Be Replaced option.
If the display assigned to the button is already open, but does nothave focus, pressing the button gives the display focus.
The operator cannot use the Goto Display button to open Replacedisplays if display change is currently controlled remotely (usingglobal connections). But the operator can still open On Top displays.
Return to Display buttons
When the operator presses a Return to Display button at runtime,the graphic display that the button is on closes and the display thatwas previously open reopens.
The current display does not close if:
the display change is currently controlled remotely
there were no previously opened Replace displays
the operator does not have security access for the previousdisplay. This can only occur if a new user logs in using a Loginbutton in the current display.
The Return to Display button only goes back to the most recentdisplay. It doesn’t go back through a series of displays.
How display types affect the button’s behavior
Both the current display and the previous display must be Replacedisplays. When the operator presses the Return to Display button:
If the graphic display that is closing is a Replace display, thedisplay closes and the previously opened Replace display opens.Any On Top displays that were previously open with theReplace display are not reopened.
If the graphic display that is closing is an On Top display, thedisplay closes but no display is reopened.
We therefore recommend that you use Return to Display buttons inReplace displays only.

Preface
19-6 � RSView Machine Edition User’s Guide
Example: Navigating through displays
This example uses the display hierarchy illustrated on page 19-3,and shows what happens as the operator navigates through thehierarchy. The graphic displays are all Replace displays.
1. In the Main Menu display, the operator uses a Display Listselector to open the Process Overview display.
2. In the Process Overview display, the operator presses a GotoDisplay button to open the Process Monitoring 1 display.
3. After viewing the state of the process, the operator presses aReturn to Display button to close the current display and reopenthe Process Overview display.
4. In the Process Overview display, the operator presses a Return toDisplay button. Which display opens? The Process Monitoring 1display (because this was the previously opened display).
To return to the Main Menu display from the Process Overviewdisplay, the operator would have to press a Goto Display buttonthat is configured to open the Main Menu display.
Close Display buttons
When the operator presses a Close Display button at runtime, thegraphic display that the button is on closes.
If the graphic display that is closing is a Replace display, and thedisplay change is controlled remotely, the display does not close.
If the display change is controlled by the operator and the graphicdisplay that is closing is a Replace display, if there are no On Topdisplays open, an empty window is displayed. The operator will notbe able to use the project again (unless a remote display changeoccurs or an alarm, activity, or information message display opens).
We therefore recommend that you use Close Display buttons in OnTop displays only.
Display List selectors
Use the Display List selector to show a list of graphic displays thatthe operator can choose from. The operator can scroll through thelist and select the graphic display to open.

� 19-7Setting up display navigation and controlling projects at runtime
The specified display doesn’t open if the operator does not havesecurity access for the display.
How display types affect the selector’s behavior
The Display List selector’s behavior at runtime also depends onwhich types of graphic displays are already open and which type ofdisplay it is opening:
If the selected graphic display is a Replace display, it closes anyopen On Top and Replace displays. It does not close On Topdisplays that use the Cannot Be Replaced option.
If the selected display is an On Top display, it opens on top of thecurrent display. The current display does not close.
The operator cannot use the Display List selector to openReplace displays if display change is currently controlledremotely. But the operator can still open On Top displays (withor without the Cannot Be Replaced option).
Selecting the display to open
The operator can scroll through the list and select displays using theKey button graphic objects, or, if the list has the input focus, byusing the arrow keys and Enter key on a keypad or externalkeyboard.
You can link Key buttons to a specific Display List selector, orconfigure the buttons to work with whichever object is selected inthe graphic display.
For information about input focus, see page 10-8. For informationabout linking buttons to the Display List selector, see page 10-9.
Shutdown button
When the operator presses the Shutdown button at runtime, theproject stops and RSView ME Station closes.
To prevent an unauthorized user from stopping the project, assignvisibility animation to the Shutdown button. For details, seepage 18-13.
Controlling display changes remotely
To control display changes remotely, you can configure the datasource to open graphic displays.

Preface
19-8 � RSView Machine Edition User’s Guide
The data source can control display changes for Replace displaysonly. You can configure the data source to control all Replacedisplay changes, or to open displays under set conditions, allowingthe operator to change displays the rest of the time.
To use remote display changes, assign display numbers to theReplace displays you want to open, and assign a tag or expression tothe Remote Display Number control. When the data source sends adisplay’s number to the control, the specified display opens. Whenthe control’s value is 0, the operator has control of display changes.
Remote display changes and security
If you configure the data source to open graphic displays remotely,remote display changes occur whether or not the logged-in user hassecurity access to a given display.
However, you can configure the Remote Display Number control toprevent access to the project unless an authorized user is logged in.To do this, assign an expression to the control to monitor the valueof the system\User tag, as described in the following example.
For more information about setting up security for your project, seeChapter 18.
Example: Using the Remote Display Number control toprevent unauthorized users from using the project
This example shows how to configure the data source to open a LogIn display when a user logs out. The Log In display remains openuntil an authorized user logs in. Then control of display changesreverts to the operator.
1. Create a graphic display called Log In, containing a Loginbutton. In the Display Settings dialog box, assign the display thenumber 1.
2. In the Global Connections editor, assign this expression to theRemote Display Number control:
if CurrentUserName( ) == “DEFAULT” then 1 else 0
If an authorized user is logged in, the value of the expression is 0,and the operator has control of display changes. When the user logsout, the DEFAULT user is logged in, and the Log In display remainsopen until another authorized user logs in.

� 19-9Setting up display navigation and controlling projects at runtime
This method is useful if you want to allow users to log out frommultiple locations (graphic displays) in the project. However, if youuse the Remote Display Number control for this purpose, youcannot use it to control other display changes remotely.
If you only permit users to log out from a startup Log In display,you can achieve the same result as in this example, but without usingthe Remote Display Number control. For more information aboutcreating a startup display, see page 18-11.
Configuring remote display changesThis section outlines the steps for configuring remote displaychanges. For detailed information about using the GlobalConnections editor, see the next section.
To configure remote display changes:
1. In the Graphics Display editor, in the Display Settings dialogbox, assign a unique display number to each Replace display.
By default, every Replace display is assigned the number 1.Therefore, to use remote display changes you must assign aunique display number to every Replace display, even if youdon’t plan to open a particular Replace display remotely.
Another option is to avoid using the display number 1 forremote display changes. Then you only need to assign displaynumbers to the displays you want to change remotely.
For information about graphic displays, see Chapter 8.
2. In the Global Connections editor, assign an analog tag orexpression to the Remote Display Number control.
3. If you assign an analog tag to the Remote Display Numbercontrol, configure the data source to send a display’s number tothe control when you want the display to open.
If you assign an expression to the Remote Display Numbercontrol, RSView monitors the values of the tags used in theexpression, and uses the expression result to determine thedisplay to open.
About global connectionsGlobal connections are controls that apply to your entire runtimeproject. The use of each global connection is optional.

Preface
19-10 � RSView Machine Edition User’s Guide
You can use global connections to:
notify the data source of the current display number
notify the data source when a display is printed
update the date and time at the data source using the runtimeterminal’s date and time
change the display on the runtime terminal remotely (from thedata source)
print the current display from the data source
update the date and time on the runtime terminal using the datasource date and time
run up to five macros from the data source
Changing displays
Use these global connections to monitor and control displaychanges:
Display Number—notifies the data source of the number of thedisplay that’s currently open.
Remote Display Number—allows the data source to change thedisplay on the runtime computer.
For detailed information about using the data source to controldisplay changes, see page 19-7.
Printing displays
Use these global connections to monitor and control displayprinting:
Display Print Active—notifies the data source that a displayprint is in progress.
Remote Display Print—allows the data source to trigger adisplay print.
The operator can also print the current display by pressing theDisplay Print button. For information about configuring thisbutton, see Chapter 10.
When the data source or the operator prints a display, everything onthe screen is printed, including the current display, pop-up windows,and any visible background applications. The display is printed ingray-scale, even if you use a color printer.
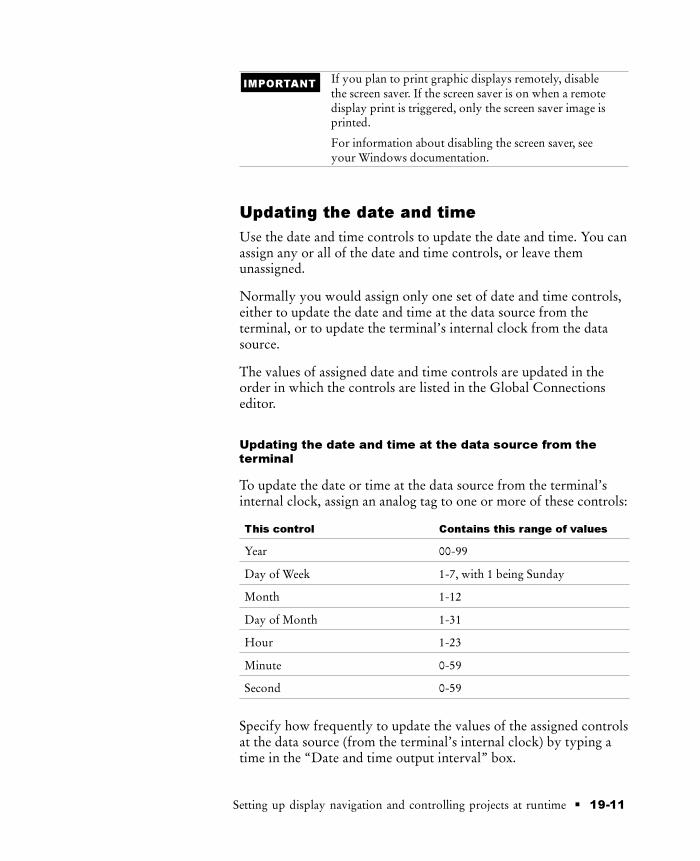
� 19-11Setting up display navigation and controlling projects at runtime
IMPORTANT If you plan to print graphic displays remotely, disablethe screen saver. If the screen saver is on when a remotedisplay print is triggered, only the screen saver image isprinted.
For information about disabling the screen saver, seeyour Windows documentation.
Updating the date and time
Use the date and time controls to update the date and time. You canassign any or all of the date and time controls, or leave themunassigned.
Normally you would assign only one set of date and time controls,either to update the date and time at the data source from theterminal, or to update the terminal’s internal clock from the datasource.
The values of assigned date and time controls are updated in theorder in which the controls are listed in the Global Connectionseditor.
Updating the date and time at the data source from the
terminal
To update the date or time at the data source from the terminal’sinternal clock, assign an analog tag to one or more of these controls:
This control Contains this range of values
Year 00-99
Day of Week 1-7, with 1 being Sunday
Month 1-12
Day of Month 1-31
Hour 1-23
Minute 0-59
Second 0-59
Specify how frequently to update the values of the assigned controlsat the data source (from the terminal’s internal clock) by typing atime in the “Date and time output interval” box.

Preface
19-12 � RSView Machine Edition User’s Guide
Updating the date and time at the terminal from the data
source
This option is especially useful if you have several terminalsconnected to the same data source. Instead of the operator resettingthe date and time manually on each terminal, the data source canreset all internal clocks at once.
To update the date or time in the terminal’s internal clock from thedata source, assign an analog or digital tag or an expression to theRemote Date and Time control. Assign an analog tag or anexpression to one or more of these controls:
This control Contains this range of values
Remote Year 00-99 or 0000-9999
Remote Month 1-12
Remote Day of Month 1-31
Remote Hour 1-23
Remote Minute 0-59
Remote Second 0-59
When the Remote Date and Time control value changes from 0 to anon-zero value, the terminal resets its internal time and date to thetime and date read from the individual remote date and timecontrols.
Running macros
Use these global connections to run macros:
This control Runs this macro
Remote Macro1 Macro1
Remote Macro2 Macro2
Remote Macro3 Macro3
Remote Macro4 Macro4
Remote Macro5 Macro5
Create the macros in the Macros editor. Make sure you name themexactly as shown in the table above (with no space in the name).
When the tag or expression assigned to one of these controls changesto a new non-zero value, RSView runs the associated macro.
For information about creating macros, see page 7-32.

� 19-13Setting up display navigation and controlling projects at runtime
Setting up global connections
To set up global connections:
1. Open the Global Connections editor.
2. In the “Date and time output interval” box, type the frequencywith which to update date and time values from the terminal tothe data source.
3. To send values from the project to the data source, assign tags tothe following controls.
For information about assigning tags, see page 7-28.
Display Number
RSView sends the number of the current graphic display to thiscontrol. Assign an analog tag.
This option applies to Replace displays only. Make sure that eachdisplay has its own unique number.
Display Print Active
Assign a digital tag to this control to notify the data source whena display is printing. RSView writes a 1 to this control whenprinting begins, and a 0 when RSView is finished printing. Whenthe value changes to 0 the printer could still be printing buffereddata.

Preface
19-14 � RSView Machine Edition User’s Guide
Year
RSView sends the value corresponding to the year in theterminal’s internal clock to this control.
Day of Week
RSView sends the value corresponding to the day of the week tothis control.
Month
RSView sends the value corresponding to the month to thiscontrol.
Day of Month
RSView sends the value corresponding to the day of the monthto this control.
Hour
RSView sends the value corresponding to the hour to thiscontrol.
Minute
RSView sends the value corresponding to the minute to thiscontrol.
Second
RSView sends the value corresponding to the second to thiscontrol.
4. To allow the data source to control the project remotely, assignanalog tags or expressions to the following controls.
For information about assigning tags and expressions, seepage 7-28.
Remote Display Number
RSView reads the value of this control and opens the graphicdisplay whose display number matches the value. If the value is 0,the operator has control of display changes. If the value does notmatch any display’s number, the application logs an error to theactivity log.
If you assign this control, remote display changes occur whetheror not the logged-in user has security access to a given display.
This option applies to Replace displays only. Make sure that eachdisplay has its own unique number.
Do not assign an expression consisting of a constant to thiscontrol. If you do, the display whose number matches theconstant opens and can never be closed or changed.

� 19-15Setting up display navigation and controlling projects at runtime
For more information about remote display changes, seepage 19-7.
Remote Display Print
Assign this control to allow the data source to trigger theprinting of graphic displays. When the value of the controlchanges from 0 to a non-zero value, RSView prints the currentlyvisible display.
You can assign an analog or digital tag or an expression to thiscontrol.
Disable the screen saver on the runtime terminal if you assignthis control.
If a display print is currently in progress, subsequent printrequests from the data source are ignored until the display printis finished.
Remote Date and Time
RSView monitors this control and, when the value changesfrom 0 to a non-zero value, updates the terminal’s internal clockwith the values in the remote date and time controls (listed next).
You can assign an analog or digital tag or an expression to thiscontrol.
Remote Year
Assign this control to send the value corresponding to the yearfrom the data source to the runtime terminal.
Remote Month
Assign this control to send the value corresponding to the monthfrom the data source to the runtime terminal.
Remote Day of Month
Assign this control to send the value corresponding to the day ofthe month from the data source to the runtime terminal.
Remote Hour
Assign this control to send the value corresponding to the hourfrom the data source to the runtime terminal.
Remote Minute
Assign this control to send the value corresponding to the minutefrom the data source to the runtime terminal.
Remote Second
Assign this control to send the value corresponding to the secondfrom the data source to the runtime terminal.

Preface
19-16 � RSView Machine Edition User’s Guide
Remote Macro1
Assign this control to allow the data source to control whenMacro1 is run.
Remote Macro2
Assign this control to allow the data source to control whenMacro2 is run.
Remote Macro3
Assign this control to allow the data source to control whenMacro3 is run.
Remote Macro4
Assign this control to allow the data source to control whenMacro4 is run.
Remote Macro5
Assign this control to allow the data source to control whenMacro5 is run.
5. Click OK to save your settings and close the editor.

� 20-1Specifying startup settings, testing projects, and creating runtime projects
Specifying startupsettings, testing projects,and creating runtimeprojects
This chapter describes:
specifying startup settings
testing your project
creating runtime project files
Specifying startup settings
Use the Startup editor to specify which project components to startwhen the project starts at runtime.
You can specify startup settings once you’ve set up all thecomponents of the project, or you can select components in theStartup editor as you create them.
20Chapter

Preface
20-2 � RSView Machine Edition User’s Guide
To specify startup settings:
1. Open the Startup editor.
2. Select the project components to use when the project starts:
Alarms
Check this box to monitor tag values for alarm conditions atruntime.
For information about configuring alarms, see Chapter 13.
Communication status
Check this box to display information about communicationerrors at runtime. When communication errors occur acommunication error banner opens to inform the operator.
If you check this box, communication information, warnings,and errors are also sent to the activity log, if you set up activitylogging to record this information.
To disable the communication error banner, clear the box.Clearing the box also means that runtime communicationinformation, warnings, and errors are not logged in the activitylog.
For information about setting up activity logging, seeChapter 15. For more information about the communicationerror banner, see page 24-15.
Information messages
Check this box to display information messages at runtime.
For information about setting up information messages, seeChapter 14.
� 20-3Specifying startup settings, testing projects, and creating runtime projects
Data logging
Check this box to start data logging when the project starts.Select the data log model to use from the list of models in theproject.
For information about setting up data logging, see Chapter 16.
Startup macro
Check this box to use a startup macro. The startup macro assignsvalues to tags when the project starts. Select the macro to usefrom the list of macros in the project.
For information about creating macros, see page 7-32.
Shutdown macro
Check this box to use a shutdown macro. The shutdown macroassigns values to tags when the project stops. Select the macro touse from the list of macros in the project.
Initial graphic
Check this box to specify the graphic display to open when theproject starts. Select the display to open from the list of displaysin the project.
If you do not select a display, an empty window is displayed atruntime.
For information about creating graphic displays, see Chapter 8.
Parameter file for the initial graphic
Check this box to use a parameter file to replace tag placeholdersin the graphic display that opens when the project starts. Selectthe parameter file from the list of parameter files in the project.
For information about creating parameter files, see page 8-29.
3. Click OK.
Once you specify the startup settings, test your project.
Testing your project
You can test your project in RSView Studio at any time during thedevelopment process, to make sure that everything works the wayyou intend.
If the development computer is connected to the data source, youcan test all functions of the project, including communications andalarm monitoring.

Preface
20-4 � RSView Machine Edition User’s Guide
An RSView ME Station emulator opens on the developmentcomputer and runs the project. This runtime version of the project isa temporary version for testing use only. You cannot run it onanother computer.
There is a two-hour time limit for test running the project inRSView Studio.
The procedure in this section shows you how to test your entireproject. For information about testing a single graphic display, seepage 8-9.
To test your project in RSView Studio:
1. On the Project menu, click Test Project, or click the Test Projecttool.
2. Test your project.
3. To stop your project, press a Shutdown button, or type X.
Make sure you provide the operator with a method for stoppingthe project at runtime. For more information about methods forstopping projects, see page 23-6.
Once you’ve tested your project to make sure everything works theway you intend, create the runtime project file and transfer the fileto the runtime computer.
Creating runtime project files
Before you can run your project, you must create a runtime version.When you create the runtime version, RSView Studio compiles all ofthe necessary project information into a single file with theextension .mer.
To create a runtime project:
1. In RSView Studio, with the project open, on the Project menuclick Create Runtime Project.
Test Project tool

� 20-5Specifying startup settings, testing projects, and creating runtime projects
2. If desired, specify a different directory in which to save theruntime project file.
The default directory is \Documents and Settings\AllUsers\Documents\RSView Enterprise\ME\Runtime.
3. If desired, in the File name box, type a different name for theruntime project file.
The default is to use the same name as the development project.
4. Click Save.
RSView creates a runtime version of the project in the directoryyou specify. If any editors are open, you are first prompted tosave any unsaved changes.
For information about transferring the runtime project to aWindows CE platform, see Chapter 21. For information abouttransferring the runtime project to a Windows 2000 platform, seeChapter 22.


� 21-1Preparing to run projects on a RAC6182
Preparing to runprojects on aRAC6182
This chapter describes:
steps for preparing to run your project on a RAC6182
specifying the time, date, and number formats to use at runtime
starting RSView ME Station
configuring the communication driver to use to transfer theproject to the RAC6182
transferring projects to the RAC6182
configuring the direct driver to use at runtime
specifying print options for graphic displays
opening and running projects on the RAC6182
other methods for starting RSView ME Station, including usingstartup parameters and starting RSView ME Stationautomatically when Windows starts
Summary of stepsFollow these steps to:
install the necessary hardware and software on the RAC6182
transfer your project to the RAC6182
prepare to run your project
For information about installing RSView ME Station, see theRSView Machine Edition Installation Guide.
Installing hardware and software on the RAC6182
1. If you will be printing displays, alarms, or activity messages,connect a printer to the RAC6182’s parallel port.
21Chapter

Preface
21-2 � RSView Machine Edition User’s Guide
The RAC6182 supports printing using the MicrosoftWindows CE PCL3 printer driver, which is already installed onthe RAC6182. Printing is supported for most laser and ink-jetprinters. If you have problems printing, check that your printeris compatible with the PCL3 printer driver.
2. If you will be transferring the project from the developmentcomputer to the RAC6182 over a DH+ network, install a PKTXcard on the RAC6182, in the PCI slot.
For installation information, see the documentation that comeswith the card.
3. If your project uses OPC communications, set up the OPCserver on the RAC6182.
For installation information, see the documentation supplied byyour OPC server vendor. For information about OPC, seeChapter 6.
4. If your project uses third-party ActiveX objects, install andregister the RAC6182 version of the objects on the runtimecomputer.
For information about ActiveX objects, see page 9-17.
5. If the runtime computer uses different time, date, or numberformats than the development computer, specify the time, date,and number formats to use at runtime.
For more information, see page 21-3.
6. If you want to store temporary files on an external PCMCIAcard to preserve internal storage space on the RAC6182, insertthe PCMCIA card.
For more information, see page 23-2.
Transferring the project
1. On the RAC6182, start RSView ME Station.
For more information, see page 21-4.
2. In RSView ME Station, specify the driver to use for the transfer.If you are using Ethernet for the transfer, you can skip this step.
For more information, see page 21-5.
3. On the development computer, configure the RSLinx driver touse for the transfer.

� 21-3Preparing to run projects on a RAC6182
For more information, see page 21-5.
4. Move the project to the RAC6182 using the Transfer Utility tool.
For more information, see page 21-6.
Preparing to run the project
1. In RSView ME Station, if you are using direct drivercommunications, configure the driver to use at runtime.
For more information, see page 21-8.
2. If desired, in RSView ME Station, specify the print options to usefor printing graphic displays.
For more information, see page 21-12.
3. In RSView ME Station, open the project you just transferred.
For more information, see page 21-12.
4. If desired, in RSView ME Station, specify the PCMCIA card onwhich to store temporary files.
For more information, see page 23-2.
Once you’ve completed these steps, you’re ready to run the project.For information about running your project, see Chapter 24.
Specifying time, date, and number formats
Time, date, and number formats are used by these graphic objects:
Numeric display
Time and Date display
Trend
If the runtime computer uses different time, date, or number formatsthan the development computer, specify the time, date, and numberformats to use at runtime.
You can also change these formats after the project is running, butyou must stop and restart the project for the changes to take effect.
To specify time, date, and number formats:
1. On the Windows Start menu, select Settings, and then clickControl Panel.

Preface
21-4 � RSView Machine Edition User’s Guide
2. Double-click Regional Settings.
3. Specify the region to use, and then select the number, time, anddate settings to use.
4. Click OK, and then close the Control Panel.
For more information, see your Windows CE documentation.
Starting RSView ME Station
Before running your project for the first time, use the RSView MEStation dialog box to:
specify the driver to use for the transfer
select the project to run
configure the direct driver to use at runtime
configure the printer for printing graphic displays
specify the PCMCIA card on which to store temporary files
To start RSView ME Station:
� On the Windows Start menu, select Programs, RockwellSoftware, RSView Enterprise, and then click RSView ME Station.
The RSView ME Station dialog box opens.

� 21-5Preparing to run projects on a RAC6182
For information about other methods of starting RSView MEStation, see page 21-13.
Specifying the driver to use for the transfer on theRAC6182
On the RAC6182, if you will be using a serial transfer (via DF1) ortransferring over a DH+ or DH-485 network, you must specify thedriver to use for the transfer before you begin the transfer. If youdon’t, the transfer will not work!
If you are using an Ethernet connection for the transfer, you canskip this step, since the Ethernet driver is already selected by default.
To specify the driver on the RAC6182:
1. In the RSView ME Station dialog box, click Configure DirectDrivers.
2. In the Configure Direct Drivers dialog box, check the Enabledbox beside the driver to use:
AB_DF1-1—use for a serial transfer.
AB_KT-1—use to transfer over a DH+ network.
AB_ETH-1—use with an ethernet connection.
3. In the Download Using box, select the driver to use.
Configuring an RSLinx driver for the transfer on thedevelopment computer
On the development computer, configure the RSLinx driver thatyou will use to download your project to the RAC6182. You canconfigure the driver directly in RSLinx, or when you set up thedownload in the Transfer Utility.

Preface
21-6 � RSView Machine Edition User’s Guide
Use one of these drivers for the transfer:
AB_DF1-1—use for a serial transfer.
AB_ETH-1—use with an ethernet connection.
AB_KT-1—use to transfer over a DH+ network.
For information about configuring drivers in RSLinx, see thedocumentation that comes with RSLinx.
For information about using the Transfer Utility, see the nextsection.
Transferring projects to the RAC6182Use the Transfer Utility to download your runtime project from thedevelopment computer to the RAC6182. Runtime projects have theextension .mer.
For information about creating the runtime project file, seeChapter 20.
IMPORTANTInstall RSView ME Station on the RAC6182 beforeyou begin the transfer. If you don’t, the transfer willnot work!
About the download
You can use a serial or Ethernet connection between thedevelopment computer and the RAC6182 destination. Or, you canuse a DH+ network for the transfer, if the runtime computer has aPKTX card installed in the PCI slot. You must use one of the driverslisted on page 21-6 for the download.
You can download while a project is running on the runtimecomputer.
You can download:
multiple projects (one at a time) to the same runtime computer
a new copy of the project currently running on the runtimecomputer, for use the next time the project is started
To transfer a project to the RAC6182:
1. On the development computer, do one of the following:
In RSView Studio, on the Tools menu click Transfer Utility.
On the Windows Start menu, select Programs, RockwellSoftware, RSView Enterprise, Tools, and then click METransfer Utility.

� 21-7Preparing to run projects on a RAC6182
2. In the Source box, type the location of the runtime project file(with the extension .mer) on the development computer.
To search for the file, click the Browse button, navigate to thefolder containing the project’s .mer file, click the file name, andthen click Open.
The default location for the runtime file is \Documents andSettings\All Users\Documents\RSView Enterprise\ME\Runtime.
3. To use a different name for the project file at runtime, check the“Download as” box and then type the new name.
4. To configure the RSLinx driver to use for the transfer, clickConfigure Drivers.
RSLinx opens. Configure the driver that’s appropriate for thetransfer method you’re using. If you’re using an Ethernetconnection, specify the IP address of the RAC6182.
When you’re finished configuring the driver, close RSLinx. Youare returned to the Transfer Utility dialog box.
For information about configuring RSLinx drivers, see theRSLinx documentation.
Browse button

Preface
21-8 � RSView Machine Edition User’s Guide
5. In the left-hand pane, click the + beside the driver to use for thedownload, and then click the RAC6182 computer to downloadthe project file to. Information about the selected computer isdisplayed in the right-hand pane.
To update the list of destinations, click Refresh or check theAutobrowse box.
To change the format of the list, click the icon and list buttons.
6. To begin the transfer, click Download.
If you selected a destination that is not a valid RAC6182computer, you are prompted to select a new destination.
If the project file already exists at the destination, you are giventhe opportunity to overwrite it.
If the terminal doesn’t respond within the timeout interval, amessage is displayed and the download is cancelled. Check thatthe drivers on the RAC6182 are enabled and configured properly,and then repeat step 6.
Configuring direct drivers on the RAC6182
If you are going to use direct driver communications, you mustconfigure a RAC6182-compatible communication driver before yourun the project for the first time.
You also need to configure the communication driver if you changethe type of communication network.
For more information about direct driver communications, seeChapter 5.
If you’re connecting to a ControlLogix processor via Ethernet, setup an OPC node. For more information, see page 6-4.
To configure the RAC6182 driver to use at runtime:
1. In the RSView ME Station dialog box, click Configure DirectDrivers.

� 21-9Preparing to run projects on a RAC6182
2. In the Configure Direct Drivers dialog box, select the driver touse:
AB_DF1-1
Click this driver if you are using a serial data link to a DH+network, or to connect directly to a controller’s serial port.Specify the driver’s settings in the dialog box that opens. Fordetails, see the next section.
AB_KT-1
Click this driver if you are using a DH+ or DH-485 network.Specify the driver’s settings in the dialog box that opens. Fordetails, see page 21-11.
AB_ETH-1
Click this driver if you are using TCP/IP (with an Ethernetconnection).
If you specified the IP address to use when you set up the nodeto communicate with, no further configuration is required.
To specify or change the IP address, use the runtime Nodeseditor. For information about using the Nodes editor, seepage 23-4.
3. Check the Enabled box beside the driver to use.
4. Click OK to confirm your changes and return to the RSViewME Station dialog box.
The enabled driver is started the next time you restart theruntime computer. When you click OK, you are given the optionof restarting the computer now.
Configuring the AB_DF1-1 driver
Use the AB_DF1-1 communication driver for serial networkconnections to DH+, or to connect directly to a controller’s serialport.

Preface
21-10 � RSView Machine Edition User’s Guide
To configure the AB_DF1-1 driver:
1. In the Configure Direct Drivers dialog box, click AB_DF1-1.
2. Specify these settings in the dialog box that opens:
Communication Port
Select the COM port to which the serial cable is attached on theruntime computer.
Baud Rate
Select the baud rate (speed) to use for serial communications.
Parity
Select the type of error checking to perform for serialcommunications.
Stop Bits
Select the amount of time between data transmissions.
Station Number (Octal)
Select the station number setting for the source DF1 device, from0 to 77 (octal).
Error Checking
Select the type of error checking the controller uses to verify thatthe data it sends is complete and correct. RSView will use thesame type of error checking when it receives the data.
Newer controllers generally use the CRC (Cyclical RedundancyCheck) method. Older controllers could use CRC or BCC(Block Character Check).
If you’re not sure which type to select, consult the controller’sdocumentation.

� 21-11Preparing to run projects on a RAC6182
3. To save your changes and return to the Configure Direct Driversdialog box, click OK.
Configuring the AB_KT-1 driver
Use the AB_KT-1 communication driver for DH+ and DH-485network connections. These network connections also require theAllen-Bradley 1784-PKTX communication device.
To configure the AB_KT-1 driver:
1. In the Configure Direct Drivers dialog box, click AB_KT-1.
2. Specify these settings in the dialog box that opens:
Network Type
Select the communication network type to use.
Station Number
Select the station number of the node the 1784-PKTX cardoccupies on the network.
For DH+, select a number in the range 0 to 77 (octal). ForDH-485, select a number in the range 0 to 31 (decimal).
Network Speed
Select the network baud rate.
Max Station
For DH-485 networks, select a Max Station number (1-31). Thissetting may speed up communications. Refer to your networkdocumentation for more information.
3. To save your changes and return to the Configure Direct Driversdialog box, click OK.
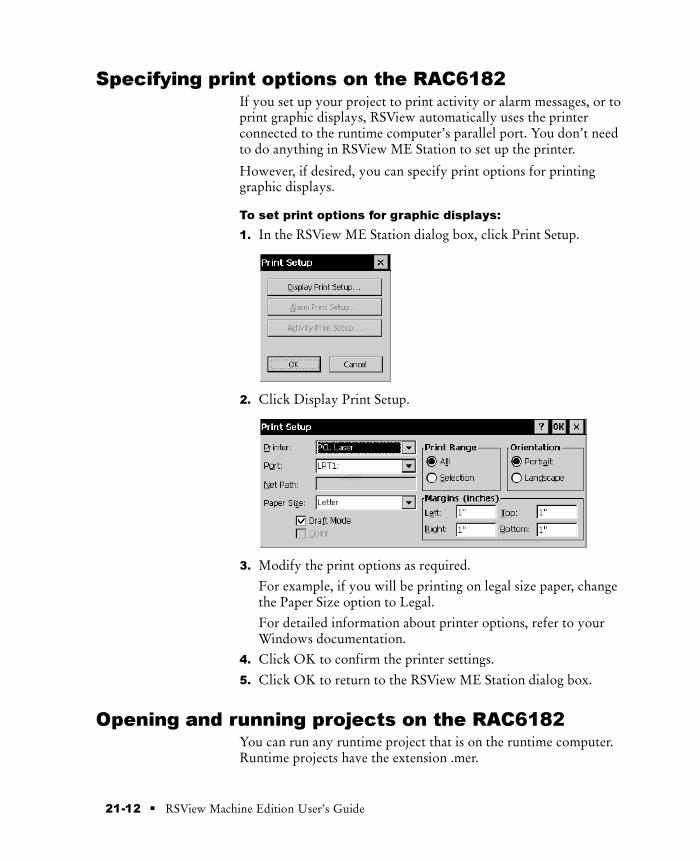
Preface
21-12 � RSView Machine Edition User’s Guide
Specifying print options on the RAC6182If you set up your project to print activity or alarm messages, or toprint graphic displays, RSView automatically uses the printerconnected to the runtime computer’s parallel port. You don’t needto do anything in RSView ME Station to set up the printer.
However, if desired, you can specify print options for printinggraphic displays.
To set print options for graphic displays:
1. In the RSView ME Station dialog box, click Print Setup.
2. Click Display Print Setup.
3. Modify the print options as required.
For example, if you will be printing on legal size paper, changethe Paper Size option to Legal.
For detailed information about printer options, refer to yourWindows documentation.
4. Click OK to confirm the printer settings.
5. Click OK to return to the RSView ME Station dialog box.
Opening and running projects on the RAC6182You can run any runtime project that is on the runtime computer.Runtime projects have the extension .mer.

� 21-13Preparing to run projects on a RAC6182
Before opening your project, you can specify an external PCMCIAcard to store temporary files on. For more information, seepage 23-2.
To open the project:
1. In the RSView ME Station dialog box, click Open.
2. Navigate to the folder containing the project’s .mer file, and thenclick the file name.
If you used the Transfer Utility to transfer the project to theRAC6182, the path is \Storage Card\Rockwell Software\RSViewME\Runtime.
3. Click Open.
The project name is displayed in the Project name box in theRSView ME Station dialog box.
4. To run the project, click Run.
Other methods for starting RSView ME StationThis section describes the various methods you can use to startRSView ME Station.
When you start RSView ME Station, you can use startup parametersto:
start running a project
automatically delete a project’s log files before running theproject
You can also configure RSView ME Station to start automaticallywhen Windows starts.

Preface
21-14 � RSView Machine Edition User’s Guide
To start RSView ME Station, do one of the following:
On the Windows Start menu, select Programs, RockwellSoftware, RSView Enterprise, and then click RSView ME Station.
On the desktop, double-click the shortcut icon RSView MEStation.
In the Windows Explorer, double-click MERuntime.exe.
This file is located in \Storage Card\Rockwell Software\RSViewME.
On the Windows Start menu, click Run. In the Open box, typethis:
“\Storage Card\Rockwell Software\RSViewME\MERuntime.exe”
To search for the file, click Browse. When you’ve specified thefile to open, click OK.
A keyboard is required to use this method.
The RSView ME Station dialog box opens.
Use the dialog box to specify the project to run, configure directdrivers, configure the printer for graphic displays, edit channels andnodes, and delete log files. For information about editing channels,editing nodes, and deleting log files, see Chapter 23.
To start RSView ME Station and start a project at the
same time:
� In Windows Explorer, double-click the project’s .mer file.
The file is located in \Storage Card\Rockwell Software\RSViewME\Runtime.
The RSView ME Station dialog box opens, with the project selected.
Using startup parameters
When you start RSView ME Station, you can use startup parametersto start running a project at the same time, and to automaticallydelete a project’s log files before running the project.
If you use startup parameters, the RSView ME Station dialog box isbypassed.
To set up startup parameters, a keyboard must be attached to theruntime computer.

� 21-15Preparing to run projects on a RAC6182
You can use these startup parameters:
/r—runs the project
/d—deletes the project’s alarm and data log files before runningthe project.
For more information about deleting data log files, see page 23-5.
You can use the /r parameter alone, or with the /d parameter. Youcannot use the /d parameter alone.
To use the startup parameters, you must specify both the path to theMERuntime.exe file and the path to the project’s .mer file.
To use startup parameters:
1. On the Windows Start menu, click Run.
2. In the Open box, type this:
“\Storage Card\Rockwell Software\RSViewME\MERuntime.exe” “\Storage Card\Rockwell Software\RSViewME\Runtime\ProjectName.mer” /r /d
If you don’t want to delete the project’s log files, omit the /dparameter.
3. Click OK.
The project starts running.
Starting RSView ME Station when Windowsstarts
If desired, you can set up RSView ME Station to start automaticallywhen Windows starts. You can also run a project automaticallywhen Windows starts.
The Storage Card directory
Storage Card is the only permanent directory on the runtimecomputer. All other directories are stored in volatile memory, andare wiped out when Windows shuts down. When you restartWindows, the terminal recreates the other directories usinginformation stored in the Storage Card directory.
This means that changes you make to the Windows desktop are notpermanent unless you store the changes in the Storage Carddirectory.

Preface
21-16 � RSView Machine Edition User’s Guide
The instructions below show you how to create a permanentshortcut in the \Storage Card\Windows\Startup directory, so thatRSView ME Station starts automatically each time Windows starts.
To create the shortcut, a keyboard must be attached to the runtimecomputer.
To start RSView ME Station automatically:
1. In the Windows Explorer, open the folder \StorageCard\Windows\Desktop.
2. Right-click RSView ME Station, and then click Copy.
3. Open the folder \Storage Card\Windows\Startup.
4. Right-click Startup, and then click Paste.
From now on, RSView ME Station starts automatically whenyou start Windows.
To start RSView ME Station and run a project
automatically:
1. Follow steps 1 through 4 in the previous procedure.
2. In the Startup folder, right-click RSView ME Station, and thenclick Properties.
3. In the Target box, type a space at the end of the existing text, andthen type this:
“\Storage Card\Rockwell Software\RSViewME\Runtime\ProjectName.mer” /r /d
If you don’t want to delete the project’s log files, omit the /dparameter.
4. Click OK.
From now on, RSView ME Station starts automatically whenyou start Windows, and the specified project starts running.
For more information about configuring settings in Windows CE,see your Windows documentation.

� 22-1Preparing to run projects in Windows 2000
Preparing to runprojects in Windows2000
This chapter describes:
steps for preparing to run your project on the runtime computer
specifying the time, date, and number formats to use at runtime
using the DeskLock tool to prevent users from switching toanother application or accessing the desktop at runtime
moving the project to another Windows 2000 computer
starting RSView ME Station
configuring direct drivers in Windows 2000
specifying the printers to use at runtime
opening and running projects in Windows 2000
other methods for starting RSView ME Station, including usingstartup parameters and starting RSView ME Stationautomatically when Windows starts
Summary of steps
Follow these steps to:
install the necessary hardware and software on the runtimecomputer
transfer your Windows 2000 project to the runtime computer
prepare to run your project
For information about installing RSView ME Station, see theRSView Machine Edition Installation Guide.
22Chapter

Preface
22-2 � RSView Machine Edition User’s Guide
Installing hardware and software on the runtime computer
1. If you will be printing displays, alarms, or activity messages, setup printer connections on the runtime computer.
For more information, see page 22-6.
2. If your project uses direct driver communications, install RSLinxon the runtime computer.
For installation information, see the documentation suppliedwith RSLinx.
3. If your project uses OPC communications, set up the OPCserver on the runtime computer or on another computer on thenetwork.
For installation information, see the documentation supplied byyour OPC server vendor. For information about OPC, seeChapter 6.
4. If your project uses third-party ActiveX objects, install andregister the Windows 2000 version of the objects on the runtimecomputer.
For information about ActiveX objects, see page 9-17.
5. If the runtime computer uses different time, date, or numberformats than the development computer, specify the time, date,and number formats to use at runtime.
For more information, see page 22-3.
6. If desired, use the DeskLock tool to prevent users fromswitching to another software application or the desktop atruntime.
For more information, see page 22-4.
Transferring the project
� Move the project to the Windows 2000 runtime computer.
For more information, see page 22-4.
Preparing to run the project
1. On the runtime computer, start RSView ME Station.
For more information, see page 22-5.
2. In RSView ME Station, if you are using direct drivercommunications, configure the driver (if you have not alreadydone so).
� 22-3Preparing to run projects in Windows 2000
For more information, see page 22-5.
3. In RSView ME Station, specify the printers to use.
For more information, see page 22-6.
4. In RSView ME Station, open the project you just transferred.
For more information, see page 22-8.
Once you’ve completed these steps, you’re ready to run the project.For information about running your project, see Chapter 24.
Specifying time, date, and number formats
Time, date, and number formats are used by these graphic objects:
Numeric display
Time and Date display
Trend
If the runtime computer uses different time, date, or number formatsthan the development computer, specify the time, date, and numberformats to use at runtime.
You can also change these formats after the project is running, butyou must stop and restart the project for the changes to take effect.
To specify time, date, and number formats:
1. On the Windows Start menu, select Settings, and then clickControl Panel.
2. Double-click Regional Options.
3. Specify the locale to use, and then select the number, time, anddate settings to use.
4. Click OK, and then close the Control Panel.
For more information, see your Windows documentation.
Preface
22-4 � RSView Machine Edition User’s Guide
Using the DeskLock toolUse the DeskLock tool to prevent users from switching to anothersoftware application or accessing the desktop at runtime.
This tool can have far-reaching effects on your operating system.The DeskLock tool replaces the standard Windows 2000non-configured desktop with a customized desktop. The customizeddesktop is intended to prevent operators from accessing otherapplications and operating system functions such as restartingWindows or shutting down tasks.
IMPORTANT Before using the tool, read the DeskLock Help filecompletely.
To open the DeskLock tool:
� On the runtime computer, on the Windows Start menu, selectPrograms, Rockwell Software, RSView Enterprise, Tools, andthen click DeskLock.
For details about using the tool, see the tool’s Help.
Moving the project to the runtime computerThe runtime project file has the extension .mer. You can use anystandard file transfer method to copy your runtime project from thedevelopment computer to the runtime computer.
You can:
copy the project file from the development computer to a floppydisk, and then from the floppy disk to the runtime computer
if the project file is too large to fit on a floppy disk, use a largerstorage device such as a Zip� disk
if the development and runtime computers are on the samenetwork, use Windows Explorer or My Computer to move thefile
For information about creating the runtime project file, seeChapter 20.
Starting RSView ME StationBefore running your project for the first time, use the RSView MEStation dialog box to:
select the project to run
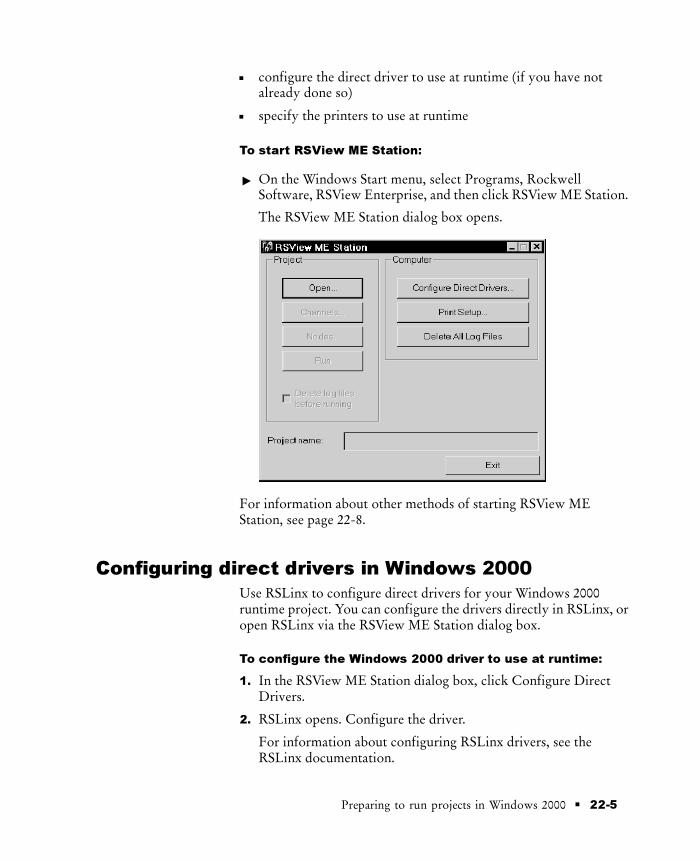
� 22-5Preparing to run projects in Windows 2000
configure the direct driver to use at runtime (if you have notalready done so)
specify the printers to use at runtime
To start RSView ME Station:
� On the Windows Start menu, select Programs, RockwellSoftware, RSView Enterprise, and then click RSView ME Station.
The RSView ME Station dialog box opens.
For information about other methods of starting RSView MEStation, see page 22-8.
Configuring direct drivers in Windows 2000
Use RSLinx to configure direct drivers for your Windows 2000runtime project. You can configure the drivers directly in RSLinx, oropen RSLinx via the RSView ME Station dialog box.
To configure the Windows 2000 driver to use at runtime:
1. In the RSView ME Station dialog box, click Configure DirectDrivers.
2. RSLinx opens. Configure the driver.
For information about configuring RSLinx drivers, see theRSLinx documentation.

Preface
22-6 � RSView Machine Edition User’s Guide
3. When you’re finished configuring the driver, close RSLinx.
You are returned to the RSView ME Station dialog box.
Once the driver is configured, RSView ME Station automaticallystarts the driver software when you run the project.
Specifying the printers to use at runtime
You can use local or network printers to print activity messages,alarm messages, and graphic displays at runtime. If desired, you canuse a different printer for each type of printing.
Printing alarm and activity messages
To print activity and alarm messages at runtime, you can use anyprinter that has an FX-80-compatible mode, but a line printer isrecommended. Configure the printer to use this mode.
Printing graphic displays
To print graphic displays, use a page printer. Displays are printed ingray-scale, even if you use a color printer.
To specify the printers to use at runtime:
1. In the RSView ME Station dialog box, click Print Setup.
2. Click the button for the type of printing to set up.

� 22-7Preparing to run projects in Windows 2000
3. To select the printer to use, click Printer.
4. In the Name box, select the local or network printer to use.
For detailed information about setting up network printers, referto your Windows documentation.
5. Click OK.
6. Modify the print options as required.
For detailed information about printer options, refer to yourWindows documentation.
7. Click OK.
8. Repeat steps 2 through 7 to set up additional printers.
9. Click OK to confirm the printer settings and return to theRSView ME Station dialog box.

Preface
22-8 � RSView Machine Edition User’s Guide
Opening and running projects in Windows 2000
You can run any runtime project that is on the runtime computer.Runtime projects have the extension .mer.
To open the project:
1. In the RSView ME Station dialog box, click Open.
2. Navigate to the folder containing the project’s .mer file, and thenclick the file name.
3. Click Open.
The project name is displayed in the Project name box in theRSView ME Station dialog box.
4. To run the project, click Run.
Other methods for starting RSView ME Station
This section describes the various methods you can use to startRSView ME Station.
When you start RSView ME Station, you can use startup parametersto:
start running a project
automatically delete a project’s log files before running theproject
You can also configure RSView ME Station to start automaticallywhen Windows starts.

� 22-9Preparing to run projects in Windows 2000
To start RSView ME Station, do one of the following:
On the Windows Start menu, select Programs, RockwellSoftware, RSView Enterprise, and then click RSView ME Station.
On the desktop, double-click the shortcut icon RSView MEStation.
In the Windows Explorer, double-click MERuntime.exe.
This file is located in C:\Program Files\Rockwell Software\RSView Enterprise.
On the Windows Start menu, click Run. In the Open box, typethe path to the MERuntime.exe file.
To search for the file, click Browse. When you’ve specified thefile to open, click OK.
The RSView ME Station dialog box opens.
Use the dialog box to configure direct drivers, edit channels andnodes, specify printers, delete log files, and specify the project torun. For information about editing channels, editing nodes, anddeleting log files, see Chapter 23.
To start RSView ME Station and start a project at the
same time:
� In Windows Explorer, double-click the project’s .mer file.
By default, this file is located in C:\Documents and Settings\AllUsers\Documents\RSView Enterprise\ME\Runtime.
The RSView ME Station dialog box opens, with the project selected.
Using startup parameters
When you start RSView ME Station, you can use startup parametersto start running a project at the same time, and to automaticallydelete a project’s log files before running the project.
If you use startup parameters, the RSView ME Station dialog box isbypassed.
You can use these startup parameters:
/r—runs the project
/d—deletes the project’s alarm and data log files before runningthe project.

Preface
22-10 � RSView Machine Edition User’s Guide
For more information about deleting data log files, see page 23-5.
You can use the /r parameter alone, or with the /d parameter. Youcannot use the /d parameter alone.
To use the startup parameters, you must specify both the path to theMERuntime.exe file and the path to the project’s .mer file.
To use startup parameters:
1. On the Windows Start menu, click Run.
2. In the Open box, type the path to the MERuntime.exe file, then aspace, then the path to the project’s .mer file, followed by thestartup parameters to use. If the paths contain spaces, enclosethem in double quotes.
If you accepted the default file locations, you would type this:
“C:\Program Files\Rockwell Software\RSView Enterprise\MERuntime.exe” “C:\Documents and Settings\AllUsers\Documents\RSView Enterprise\ME\Runtime\ProjectName.mer” /r /d
If you don’t want to delete the project’s log files, omit the /dparameter.
3. Click OK.
The project starts running.
Starting RSView ME Station when Windowsstarts
If desired, you can set up RSView ME Station to start automaticallywhen Windows starts. You can also run a project automaticallywhen Windows starts.
To start RSView ME Station automatically:
1. On the Windows Start menu, select Settings, and then clickTaskbar & Start Menu.
2. Click the Advanced tab, and then click Add.
3. Browse to the location of the MERuntime.exe file.
This file is located in C:\Program Files\Rockwell Software\RSView Enterprise.
4. Click Next.

� 22-11Preparing to run projects in Windows 2000
5. Click the Startup folder (in the Start menu\Programs folder), andthen click Next.
6. Type a name for the shortcut, such as RSView ME Station, andthen click Finish.
7. Click OK.
From now on, RSView ME Station starts automatically whenyou start Windows.
To start RSView ME Station and run a project
automatically:
1. On the Windows Start menu, select Settings, and then clickTaskbar & Start Menu.
2. Click the Advanced tab, and then click Add.
3. In the “Type the location of the item” box, type the path to theMERuntime.exe file, then a space, then the path to the project’s.mer file, followed by the startup parameters to use. If the pathscontain spaces, enclose them in double quotes.
If you accepted the default file locations, you would type this:
“C:\Program Files\Rockwell Software\RSView Enterprise\MERuntime.exe” “C:\Documents and Settings\AllUsers\Documents\RSView Enterprise\ME\Runtime\ProjectName.mer” /r /d
If you don’t want to delete the project’s log files, omit the /dparameter.
4. Click Next.
5. Click the Startup folder (in the Start menu\Programs folder), andthen click Next.
6. Type a name for the shortcut, such as the project name, and thenclick Finish.
7. Click OK.
From now on, RSView ME Station starts automatically whenyou start Windows, and the specified project starts running.
For more information about configuring settings in Windows 2000,see your Windows documentation.


� 23-1Starting, stopping, and configuring projects at runtime
Starting, stopping, andconfiguring projects atruntimeThis chapter describes:
storing temporary files on an external card (RAC6182 projectsonly)
selecting the project to configure or run
editing channels
editing nodes
deleting log files
running projects
stopping projects
Using the RSView ME Station dialog boxUse the RSView ME Station dialog box to perform the tasksdescribed in this chapter. The dialog box opens when you startRSView ME Station.
Windows 2000 RAC6182
23Chapter

Preface
23-2 � RSView Machine Edition User’s Guide
If you configure a project to open directly when Windows starts,this dialog box is bypassed. To open the dialog box, stop the projectand restart RSView ME Station.
For information about starting RSView ME Station in Windows2000, see page 22-8. For information about starting RSView MEStation on a RAC6182, see page 21-13.
Storing temporary files on an external card(RAC6182 projects only)
RSView ME Station creates temporary files when you open yourproject. If the project contains many bitmap images, the RAC6182might run out of disk space because of the size of the temporaryfiles. If desired, you can store temporary files on an externalPCMCIA card while your project is running.
Performance using external PCMCIA storage might be slightlyslower than when using the RAC6182’s internal disk space forstorage.
To store temporary files on an external card:
1. In the RSView ME Station dialog box, click Temporary Files.
2. Click the storage card to use.
If only one PCMCIA card is inserted in the RAC6182, useStorage Card2. If two cards are inserted, you can use eitherStorage Card2 or Storage Card3.
3. Click OK.
Selecting the project to configure or runYou can run any runtime project that is on the runtime computer.Runtime projects have the extension .mer.

� 23-3Starting, stopping, and configuring projects at runtime
For information about:
creating the runtime project, see Chapter 20
transferring a RAC6182 project to the runtime computer, seeChapter 21
transferring a Windows 2000 project to the runtime computer,see Chapter 22
To select the project to configure or run:
1. In the RSView ME Station dialog box, click Open.
2. Navigate to the folder containing the project’s .mer file, and thenclick the file name.
3. Click Open.
The project name is displayed in the Project name box in theRSView ME Station dialog box.
4. To run the project now, click Run.
For information about editing channels, editing nodes, ordeleting log files before running the project, see the topics in theremainder of this chapter.
Editing channels on the runtime computerTo change a channel’s configuration at runtime, use the Channelseditor in RSView ME Station. For example, if you set up a channelwithout specifying a communication driver, you must specify thedriver before you start the project at runtime.
To edit a channel on the runtime computer:
1. In the RSView ME Station dialog box, click Channels.

Preface
23-4 � RSView Machine Edition User’s Guide
2. In the Channel box, select the channel to edit.
3. Modify the settings as required.
For information about configuring channels, see page 5-11.
4. Click OK to confirm your changes and return to the RSViewME Station dialog box.
Editing nodes on the runtime computer
To change a node’s configuration at runtime, use the Nodes editor inRSView ME Station. For example, you can change the node’s IPaddress to use the project with a different processor than wasspecified during project development. To do this, stop the projectand then use the Nodes editor to specify another IP address.
To edit a node on the runtime computer:
1. In the RSView ME Station dialog box, click Nodes.
2. In the Node box, select the node to edit.
3. Modify the settings as required.

� 23-5Starting, stopping, and configuring projects at runtime
The settings that appear depend on whether the selected nodeuses the Direct Driver or OPC Server data source. Settings thatyou cannot change at runtime are dimmed.
For information about configuring direct driver nodes, seepage 5-15.
For information about configuring OPC nodes, see page 6-10.
4. Click OK to confirm your changes and return to the RSViewME Station dialog box.
Deleting log files on the runtime computerWhen you run your project, RSView ME Station stores log files foralarms and data logging (if you use these features). When you startRSView ME Station, you can delete the alarm and data log files forthe selected project, or for all the projects on the runtime computer.
Running a newer version of the project
If you run a newer version of a project, the alarm log file for theolder version is deleted automatically. The data log file for the olderversion is retained, to allow the display of historical data in trends.
For more information about the alarm log file, see page 13-5. Formore information about data log files, see page 16-2.
Deleting log files at project startup
To delete log files for the selected project:
� In the RSView ME Station dialog box, check the “Delete log filesbefore running” box.
All alarm and data log files for the selected project are deleted.
To delete log files for all projects on the runtime computer:
� In the RSView ME Station dialog box, click Delete All Log Files.
Only log files for data log models that use the default path aredeleted when you use this option. All alarm log files are deleted
If you log to a different location than the default path, use “Deletelog files before running,” or else use standard Windows filemanagement methods to delete unwanted data log files.
For more information about data log files, see page 16-2.

Preface
23-6 � RSView Machine Edition User’s Guide
Running projects
To run the selected project:
� In the RSView ME Station dialog box, click Run.
For information about other methods of running a RAC6182project, see page 21-13. For information about other methods ofrunning a Windows 2000 project, see page 22-8.
Stopping projects
To stop a project, use one of these methods:
Press a Shutdown button in a graphic display.
If the project is set up to use a title bar with a Control box, clickthe Close button at the right end of the title bar.
If the project is set up to use a title bar with a Control box, onthe Control menu at the left end of the title bar, click Close.
Control menu
Control box
Close button
For information about using a title bar in graphic displays, seepage 4-10. For information about preventing unauthorized usersfrom stopping projects, see page 18-10.
What happens when the project stops
When the project stops:
If you assigned a shutdown macro (in the Startup editor), themacro runs, assigning values to tags, and then the project stops.
For information about the Startup editor, see Chapter 20.
RSView ME Station closes.

� 24-1Running your project
Running your projectThis chapter describes:
logging in and logging out
entering numeric and string values
changing tag values
viewing tag data
viewing alarms and messages
viewing information about runtime communication errors
For information about navigating between displays, see Chapter 19.For information about navigating between and using the graphicobjects in a display, see page 10-4.
Logging in to a Windows domainTo log data to a network location, the runtime computer must belogged in to the same domain as the computer on the network. Todo this, the user must have access rights for the domain.
To log in to a domain from Windows 2000:
� When Windows starts, type a user name, password, and domainname.
To log in to a domain from the RAC6182:
1. On the Windows Start menu, select Settings, and then clickControl Panel.
2. Double-click Network.
3. Click the Identification tab.
4. Type a user name, password, and domain name.
Logging in to the projectTo log in, the user must have an account in the User Accounts editor.If security is set up, the user must also have a password.
24Chapter

Preface
24-2 � RSView Machine Edition User’s Guide
For information about setting up user accounts and passwords, seeChapter 18.
You cannot change passwords at runtime. To change a password, usethe User Accounts editor in RSView Studio. For more information,see page 18-9.
To log in:
1. Press the Login button.
The Login window opens.
2. Press the User button, or press F2 on an external keyboard.
The string pop-up keyboard opens. For information about usingthe keyboard, see page 24-7.
3. Type your user name in the string pop-up keyboard, or on anexternal keyboard, and then press Enter.
The name is not case sensitive.
4. To enter a password, press the Password button, or press F3 onan external keyboard.
5. Type the password in the string pop-up keyboard, or on anexternal keyboard, and then press Enter.

� 24-3Running your project
The password is not case sensitive.
6. To close the Login window and complete the login, press Enter.
What happens when a user logs in
When a user logs in:
If the previous user did not log out, the previous user is loggedout now. If a logout macro is set up for the previous user, thelogout macro runs, assigning values to tags.
The new user is logged in.
If a login macro is set up for the new user, the macro runs,assigning values to tags.
Problems with logging in
Login is unsuccessful under these circumstances:
If the graphic display changes remotely before the user hasfinished logging in, the login is cancelled.
If the user name or password doesn’t match the settings in theUser Accounts editor, the user is not logged in.
If the screen resolution is smaller than 280 pixels wide by84 pixels high, the Login window cannot open.
If the screen resolution is smaller than 236 pixels wide by208 pixels high, the string pop-up keyboard cannot open.
Logging outWhen the current user logs out, the DEFAULT user is logged in.
To log out:
� Press the Logout button.
Entering numeric valuesThe operator can enter numeric values at runtime using the NumericInput Enable button.
When the operator presses the button, the numeric pop-up keypador scratchpad opens, depending on how you configured the button.To use the scratchpad, a keyboard must be attached to the runtimecomputer, or the terminal must be a keypad terminal.

Preface
24-4 � RSView Machine Edition User’s Guide
For information about configuring the Numeric Input Enablebutton, see Chapter 10.
Using the numeric pop-up keypad
The keypad can accept up to 17 digits, including the decimal point,leading zero, and minus sign.
Scratchpad area
When the keypad is open, no other objects in the graphic display canaccept input.
Using the numeric pop-up scratchpad
The scratchpad can accept up to 17 digits, including the decimalpoint, leading zero, and minus sign.
Scratchpad area
The scratchpad does not contain any buttons. If the runtimecomputer does not have an external keyboard or keypad attached,the operator will be unable to enter values or close the scratchpad.
When the scratchpad is open, no other objects in the graphic displaycan accept input.
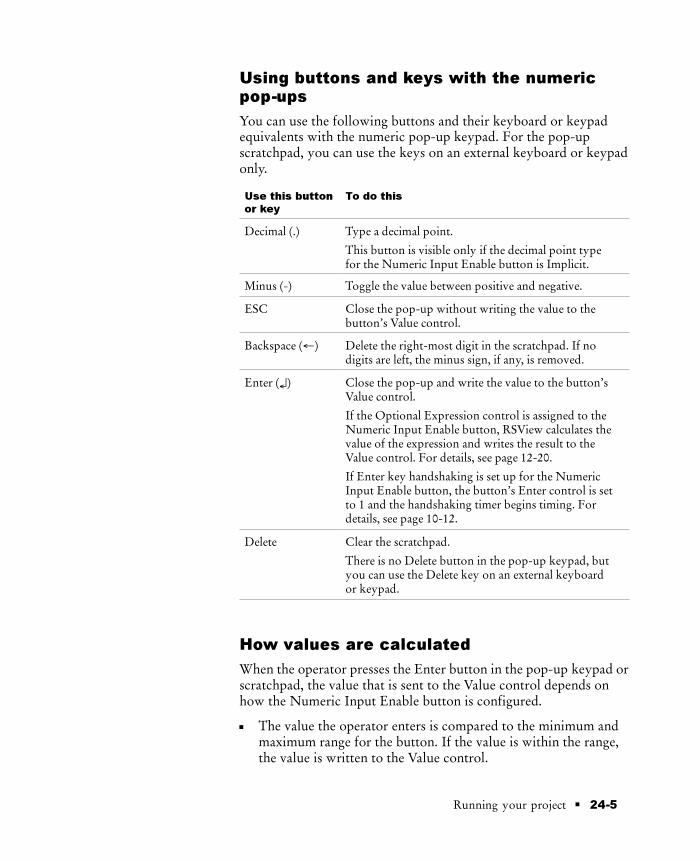
� 24-5Running your project
Using buttons and keys with the numericpop-ups
You can use the following buttons and their keyboard or keypadequivalents with the numeric pop-up keypad. For the pop-upscratchpad, you can use the keys on an external keyboard or keypadonly.
Use this button
or key
To do this
Decimal (.) Type a decimal point.
This button is visible only if the decimal point typefor the Numeric Input Enable button is Implicit.
Minus (-) Toggle the value between positive and negative.
ESC Close the pop-up without writing the value to thebutton’s Value control.
Backspace (←) Delete the right-most digit in the scratchpad. If nodigits are left, the minus sign, if any, is removed.
Enter (↵) Close the pop-up and write the value to the button’sValue control.
If the Optional Expression control is assigned to theNumeric Input Enable button, RSView calculates thevalue of the expression and writes the result to theValue control. For details, see page 12-20.
If Enter key handshaking is set up for the NumericInput Enable button, the button’s Enter control is setto 1 and the handshaking timer begins timing. Fordetails, see page 10-12.
Delete Clear the scratchpad.
There is no Delete button in the pop-up keypad, butyou can use the Delete key on an external keyboardor keypad.
How values are calculated
When the operator presses the Enter button in the pop-up keypad orscratchpad, the value that is sent to the Value control depends onhow the Numeric Input Enable button is configured.
The value the operator enters is compared to the minimum andmaximum range for the button. If the value is within the range,the value is written to the Value control.

Preface
24-6 � RSView Machine Edition User’s Guide
If the Optional Expression control is assigned, and the originalvalue is within the range but the expression result is a valueoutside the range, the value is still written to the Value control.
If the decimal point type is Fixed Position, with a “Digits afterdecimal” value that is greater than 0, the decimal point is strippedfrom the value before comparing it to the minimum andmaximum range.
For example, if the entered value is 9.25, the stripped value is 925.
If the stripped value is within the range, the stripped value is sentto the Value control (or substituted for the ? in the OptionalExpression).
If the decimal point type is Implicit, and the tag assigned to theValue control uses an integer data type, floating point values arerounded.
If the Optional Expression control is assigned, the floating pointvalue is substituted for the ? in the expression, and the expressionresult is rounded.
For information about how values are rounded, see page 7-3.
Problems with the numeric pop-ups
Problems with the numeric pop-up keypad and scratchpad occurunder these circumstances:
If the graphic display changes remotely before the user haspressed the Enter button, the pop-up closes without writing outa value.
If the screen resolution is smaller than 124 pixels wide by240 pixels high, the pop-up keypad cannot open.
If the screen resolution is smaller than 124 pixels wide by68 pixels high, the pop-up scratchpad cannot open.
If the value is too large for the data type of the tag assigned to theValue control, the pop-up remains open and the value is notwritten to the control. The scratchpad area changes to red to alertthe operator of the error.
If the value is outside the minimum and maximum rangespecified for the Numeric Input Enable button, the pop-upremains open and the value is not written to the control. Thescratchpad area changes to red to alert the operator of the error.

� 24-7Running your project
If Enter key handshaking is still in effect, the pop-up closes butthe value is not written to the control.
Entering string valuesThe operator can enter string values at runtime using the StringInput Enable button.
When the operator presses the button, the string pop-up keyboardor scratchpad opens, depending on how you configured the button.To use the scratchpad, a keyboard must be attached to the runtimecomputer.
For information about configuring the String Input Enable button,see Chapter 10.
Using the string pop-up keyboard
The string pop-up keyboard opens when the operator presses aString Input Enable button or the User or Password button in theLogin dialog box.
Scratchpad area
If the operator opens the pop-up keyboard by pressing a StringInput Enable button, the number of characters the keyboard acceptsdepends on how you configure the button.
When the keyboard is open, no other objects in the graphic displaycan accept input.
Using the string pop-up scratchpad
The number of characters the scratchpad accepts depends on howyou configure the String Input Enable button.

Preface
24-8 � RSView Machine Edition User’s Guide
Scratchpad area
The scratchpad does not contain any buttons. If the runtimecomputer does not have an external keyboard attached, the operatorwill be unable to enter characters or close the scratchpad (unless theruntime terminal is a keypad terminal). If the runtime terminal is akeypad terminal, the operator can enter numbers (not letters) in thescratchpad, and close the scratchpad.
When the scratchpad is open, no other objects in the graphic displaycan accept input.
Using buttons and keys with the stringpop-ups
You can use the following buttons and their keyboard equivalentswith the string pop-up keyboard. For the pop-up scratchpad, youcan use the keys on an external keyboard only.
Use this
pop-up
keyboard
button
Or this
keyboard
equivalent
To do this
SHF none Capitalize a single letter, or type ashifted character such as #.
CAP none Capitalize multiple letters.
INS Insert Toggle between insert andoverstrike modes.
SPACE Spacebar Insert a space.
<< Left Arrow (←) Move the cursor to the left.
>> Right Arrow (→) Move the cursor to the right.
ESC Esc Close the pop-up without writingthe string to the Login dialog boxor the String Input Enablebutton’s Value control.
CLR Delete Clear the scratchpad.

� 24-9Running your project
Use this
pop-up
keyboard
button
To do thisOr this
keyboard
equivalent
Backspace (←) Backspace Delete the character in front of thecursor.
Enter (↵) Enter Close the pop-up and write thestring to the Login dialog box orthe String Input Enable button’sValue control.
If Enter key handshaking is set upfor the String Input Enable button,the button’s Enter control is setto 1 and the handshaking timerbegins timing. For details, seepage 10-12.
What is written to the Value control
When the operator presses the Enter button in the pop-up keyboardor scratchpad, the string that is sent to the Value control depends onhow the String Input Enable button is configured.
If a fill character is configured for the button, and the operatorenters fewer than the maximum number of input characters, thefill characters are placed after the string the operator enters.
Spaces have a hex value of 20.
Zeroes have a hex value of 30.
FF characters have a hex value of FF.
Null characters have a hex value of 0. The null characterindicates the end of string input. It does not add to the actualstring length.
If the number of input characters is fewer than the number ofcharacters in the length of the string tag assigned to the Valuecontrol, the remaining spaces are padded with the null character.
When the string is written to the Value control, the first character isplaced in the high order byte of the first word at the tag address, thesecond character is placed in the low order byte of the first word,and so on.

Preface
24-10 � RSView Machine Edition User’s Guide
Problems with the string pop-ups
Problems with the string pop-up keyboard and scratchpad occurunder these circumstances:
If the graphic display changes remotely before the user haspressed the Enter button, the pop-up closes without writing outa string.
If the screen resolution is smaller than 236 pixels wide by208 pixels high, the pop-up keyboard cannot open.
If the screen resolution is smaller than 236 pixels wide by64 pixels high, the pop-up scratchpad cannot open.
If the string pop-up is configured to accept more characters thanthe Value control tag length, the pop-up remains open and thestring is not written to the control. The scratchpad area changesto red to alert the operator of the error.
If Enter key handshaking is still in effect, the pop-up closes butthe value is not written to the control.
Changing tag values
This section gives an overview of the graphic objects you can use tochange tag values. For information about configuring the objects, seeChapter 10.
The operator uses these objects to start and stop plant operations,and to control machines and processes. Choose the objects that bestsuit your process. Configure the data source to carry out the desiredactions in response to the changes in tag values.
The operator can use function keys with all of these objects exceptControl List selectors, third-party ActiveX objects, and drawingobjects with slider animation.
For information about assigning function keys to graphic objects,see page 10-5.
IMPORTANT Do not use push buttons for emergency stops.Emergency stop buttons must be hard-wired.
You can also use macros to assign values to tags. For moreinformation, see page 7-32.

� 24-11Running your project
The operator can change tag values at runtime using these graphicobjects:
Use this graphic
object
To do this
Momentary Push button Start a process or action by sending one valueto the tag when pressed, and another valuewhen released.
Maintained Push button Toggle between two values, by sending onevalue to the tag when pressed, and a secondvalue the next time the button is pressed andreleased.
This button is useful for changing a settingwithin a machine or process, but not forstarting the machine or process.
Latched Push button Start a machine or process and remain set(latched) until the process is completed, bysending a value to the tag when pressed, andretaining this value until reset (unlatched) bythe Handshake control.
Multistate Push button Cycle through a series of values. Each timethe operator presses the button, the value forthe next state is sent to the tag. When thebutton is in its last state, pressing it causesthe button to change to its first state andwrite out the first state value.
This button is useful when you want theoperator to see and select multiple options insequence, using a single button. The buttondisplays the current state of a process oroperation by showing a different color,caption, or image to reflect the differentstates.
Interlocked Push button Use a group of buttons to send values to thesame tag. When the operator presses a buttonin the group, the button’s value is sent to thetag, and the button remains highlighted aslong as the tag value is the same as thebutton’s value. Pressing a new button in thegroup releases the other button and sends anew value to the tag.

Preface
24-12 � RSView Machine Edition User’s Guide
Use this graphic
object
To do this
Ramp button Increase or decrease the value of a tag by aspecified integer or floating point value.
Use two ramp buttons together to create araise/lower control.
Numeric Input Enablebutton
Enter a numeric value and write the value toa tag.
String Input Enablebutton
Enter a string value and write the value to atag.
Drawing object withhorizontal or verticalslider animation
Control the value of a tag by dragging theslider object with a mouse. The pixel positionof the slider is translated into a value that iswritten to the tag.
If the value of the tag is changed externally,the position of the slider changes to reflectthis.
Control List selector Select from a list of states for a process oroperation. The list is highlighted to show thecurrent state, and the operator can scrollthrough the list to select a different state. Thevalue assigned to the selected state is writtento the tag.
If the value of the tag is changed externally,the position of the highlight changes toreflect this.
ActiveX object A third-party object, connected to an analog,digital, or string tag. When the object’sproperty value changes, the new value iswritten to the associated tag.
You can attach visibility animation to these graphic objects, todisplay or hide the objects based on changes in tag or expressionvalues. For information about visibility animation, see page 11-10.
For information about creating graphic objects, see Chapter 9. Forinformation about configuring graphic objects, see Chapter 10.
Viewing tag data
This section gives an overview of the graphic objects you can use todisplay tag data. For information about configuring the objects, seeChapter 10.
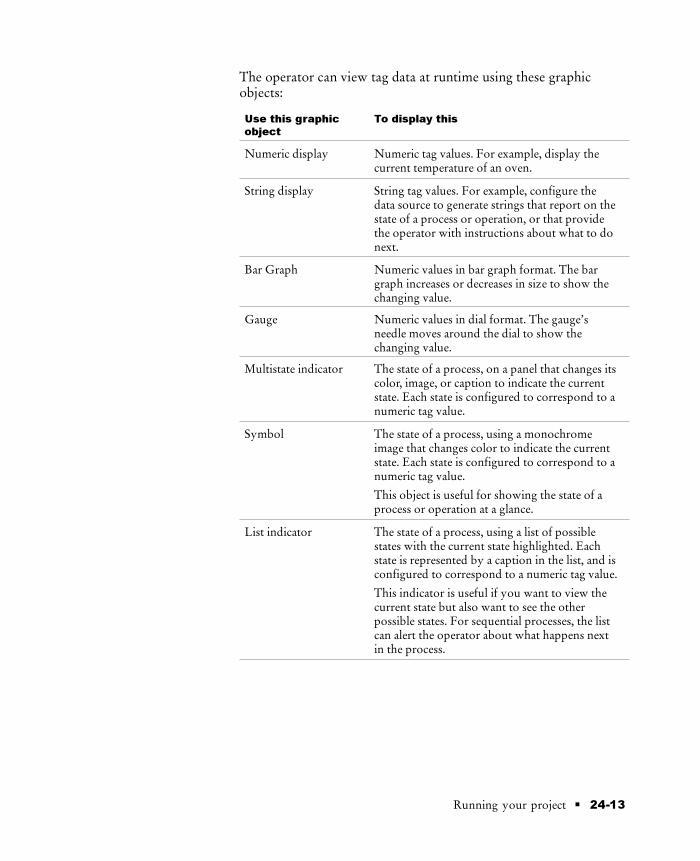
� 24-13Running your project
The operator can view tag data at runtime using these graphicobjects:
Use this graphic
object
To display this
Numeric display Numeric tag values. For example, display thecurrent temperature of an oven.
String display String tag values. For example, configure thedata source to generate strings that report on thestate of a process or operation, or that providethe operator with instructions about what to donext.
Bar Graph Numeric values in bar graph format. The bargraph increases or decreases in size to show thechanging value.
Gauge Numeric values in dial format. The gauge’sneedle moves around the dial to show thechanging value.
Multistate indicator The state of a process, on a panel that changes itscolor, image, or caption to indicate the currentstate. Each state is configured to correspond to anumeric tag value.
Symbol The state of a process, using a monochromeimage that changes color to indicate the currentstate. Each state is configured to correspond to anumeric tag value.
This object is useful for showing the state of aprocess or operation at a glance.
List indicator The state of a process, using a list of possiblestates with the current state highlighted. Eachstate is represented by a caption in the list, and isconfigured to correspond to a numeric tag value.
This indicator is useful if you want to view thecurrent state but also want to see the otherpossible states. For sequential processes, the listcan alert the operator about what happens nextin the process.

Preface
24-14 � RSView Machine Edition User’s Guide
Use this graphic
object
To display this
Trend Historical or real-time numeric tag values,plotted against time or displayed in an XY plotwhere one or more tags’ values are plottedagainst another tag’s values to show therelationship between them.
Drawing object withrotation, width, height,fill, color, orhorizontal or verticalposition animation
Display the value of a tag using a pictorialrepresentation that shows the current value inrelation to a range of possible values. Forexample, use rotation animation to show the tagvalue as a needle’s position on a dial.
For color animation, assign different colors torepresent different values.
ActiveX object A third-party object, connected to an analog,digital, or string tag. The data displayed dependson the object.
Any of these objects can be configured to manipulate tag valuesusing expressions, and display the expression result rather than theoriginal tag value. For information about expressions, seeChapter 12.
You can also attach visibility animation to these graphic objects, todisplay or hide the objects based on changes in tag or expressionvalues. For information about visibility animation, see page 11-10.
For information about creating graphic objects, see Chapter 9. Forinformation about configuring graphic objects, see Chapter 10.
Displaying the date and time
To display the current date and time, create a Time and Date display.This object uses the operating system’s date and time and thereforedoes not use tags or expressions.
Viewing alarms and messagesThe operator can view alarms and other messages at runtime usingthese graphic objects and graphic displays:
This
information
Appears in this
object
In this default
graphic display
For
details
see
Alarm messages Alarm list [ALARM] Page 13-27
System activity Activity list [ACTIVITY] Page 15-8

� 24-15Running your project
This
information
For
details
see
In this default
graphic display
Appears in this
object
Informationmessages
InformationMessage display
[INFORMATION] Page 14-12
Local messages Local Messagedisplay
No default Page 8-29
The default alarm, information, and activity displays openautomatically when the assigned tags match messages’ trigger values.If desired, you can configure your own graphic displays to openautomatically, instead of the default displays. You can also configureany of the displays to open when an operator presses a Goto Displaybutton.
The operator can acknowledge alarm and information messages. Theoperator can clear alarm and activity messages.
Viewing information about runtime communicationerrors
RSView automatically notifies the operator about runtimecommunication errors, unless you disable this feature.
The communication error banner
When a communication error occurs, a single-line banner opens atthe top of the project window, containing a message about thecommunication error.
The message remains until the error has been resolved. If a newcommunication error occurs, the newer message is displayed. Theoperator can continue to change graphic displays and perform otheroperations while the communication error banner is open.
To disable the communication error banner:
� In the Startup editor, clear the Communication status check box.
For information about the Startup editor, see Chapter 20.

Preface
24-16 � RSView Machine Edition User’s Guide
Direct driver communication errormessages
For direct driver communications, messages about communicationerrors are displayed in this format:
Channel #: (StationNumber) ErrorMessage
Examples: Direct driver communication error messages
Channel 1: (02) Cannot guarantee delivery: link layer.
Channel 1: (10.0.0.1) Unable to communicate with remote station.
OPC communication error messages
For OPC communications, messages about communication errorsare displayed in this format:
OPC: ‘(ServerName) ErrorMessage.’
Examples: OPC communication error messages
OPC: ‘(RSLinx.data.1) OPC Server not registered properly.’
OPC: ‘(RSLinx.data.1) Client: Could not connect to the OPCserver.’
Displaying communication errors in theActivity list
To display communication errors in the Activity list, configureactivity logging to log errors for the Communications category ofsystem activity.
For more information about activity logging, see Chapter 15.
Displaying communication information usingsystem tags
RSView uses system communication tags to monitorcommunications. These tags are created automatically when youcreate channels and OPC nodes.

� 24-17Running your project
To view the tag information at runtime, create Numeric display orString display objects in a graphic display. For information aboutmethods of displaying tag data, see page 24-12.
For more information about the system tags, see Appendix A. Forinformation about creating graphic objects, see Chapter 9.


� A-1System tags
System tagsThis appendix describes the system tags.
System tags are preconfigured tags created by RSView. System tagsare read-only. Display them as needed in your application.
CommunicationsThe following tags record direct driver communication information.These tags are added to the system folder when you configure achannel in the Channels editor. Each channel you configure willhave these four tags. The number on the end identifies the tags foreach channel. For example, system\ComErrorString1 is forchannel 1.
Tag Name Type Displays information about
system\ComErrorString1 String Most recent device errormessage.
system\ComErrorValue1 Analog Internal number of mostrecent device error.
system\ComStatusString1 String Current status of devicecommunications. Will be thesame as system\ComErrorString1 if the errorcondition still exists.
system\ComStatusValue1 Analog Internal number indicatingcurrent status of devicecommunications. Will be thesame as system\ComErrorValue1 if the errorcondition still exists.
The following tags record OPC communication information. Thesetags are added to the system folder when you configure an OPCnode in the Nodes editor.
Tag Name Type Displays information about
system\ComErrorStringOPC String Most recent OPC errormessage.
system\ComErrorValueOPC Analog Internal number of mostrecent OPC error.
AAppendix

Preface
A-2 � RSView Machine Edition User’s Guide
Tag Name Displays information aboutType
system\ComStatusStringOPC String Current status of OPCcommunications. Will be thesame as system\ComErrorStringOPC if theerror condition still exists.
system\ComStatusValueOPC Analog Internal number indicatingcurrent status of OPCcommunications. Will be thesame as system\ComErrorValueOPC if theerror condition still exists.
Graphics
The following tags can be used to make graphic objects appear asthough they are blinking on and off:
Tag Name Type Function
system\BlinkFast Digital Toggles on and off every 100ms (10 times per second).
system\BlinkSlow Digital Toggles on and off every 500ms (twice per second).
A more efficient way to make graphic objects blink is to use theblinking color option in color animation. For details, see page 11-12.

� A-3System tags
Time
The following tags record time and date information in variousformats:
Tag Name Type Provides this data Read or
write
system\Date String System date. Read only
system\DateAndTimeInteger
Analog Number of secondselapsed since midnight(00:00:00) January 1,1970, coordinateduniversal time (UTC).
Read only
system\DateAndTimeString
String Complete date and timedisplay.For example:
Monday, December 122001 10:47:50 AM
Read only
system\DayOfMonth Analog Day of the month(1 – 31).
Read only
system\DayOfWeek Analog Day of the week (1 – 7);Sunday = 1.
Read only
system\DayOfYear Analog Day of the year (1 – 366). Read only
system\Hour Analog Hour of the day (0 – 23). Read andwrite
system\Minute Analog Minutes (0 – 59). Read andwrite
system\Month Analog Number for month(1 - 12).
Read only
system\MonthString String Name of the month. Read only
system\Second Analog Seconds (0 – 59). Read andwrite
system\Time String System time. Read only
system\Year Analog The year (1980 – 2099). Read only

Preface
A-4 � RSView Machine Edition User’s Guide
User
The following tag contains the name of the current user:
Tag Name Type Function
system\User String Contains name of logged-in user.
We recommend that you use the expression security functionCurrentUserName( ) instead of the system\User tag, especially ifyou intend to convert the project to RSView Enterprise SupervisoryEdition. In distributed applications, system\User returns the nameof the user logged into the HMI server, not the user logged into thedisplay client.
For more information about the security functions, see page 12-17.

� B-1Addressing syntax for Allen-Bradley programmable controllers
Addressing syntax forAllen-Bradleyprogrammablecontrollers
This appendix contains:
addressing syntax for Allen-Bradley PLCs
addressing syntax for Allen-Bradley SLCs
addressing syntax for SoftLogix 5 controllers (Windows 2000projects only)
mnemonic tables
The information here is applicable only to tags that have device astheir data source. For detailed information about creating tags, seeChapter 7.
PLC addressing syntax
The following section provides addressing syntax for these types ofprogrammable controllers:
PLC-5, which includes the PLC-5/10, PLC-5/12, PLC-5/15, andPLC-5/25
PLC-5 (Enhanced), which includes the PLC-5/11, PLC-5/20,PLC-5/20C, PLC-5/20E, PLC-5/30, PLC-5/40, PLC-5/40C,PLC-5/40E, PLC-5/60, PLC-5/60C, PLC-5/80, PLC-5/80C,and PLC-5/80E
BAppendix

Preface
B-2 � RSView Machine Edition User’s Guide
PLC-5 data files
Fnnn:eee/bb
F File type:B = BinaryN = IntegerD = Decimal (BCD)F = Floating pointA = ASCII
nnn File number: 3 – 999 decimalFor direct driver communication, binary, integer,and floating point file types use the default filenumber if the file number is absent. The defaultnumbers are 3 (binary), 7 (integer), and8 (floating point).
eee Element number: 0 – 999 decimal
bb (optional) Bit offset within word: 0 – 15 decimalNot applicable to floating point file types.
Example of bit address: B3:173/15
Example of word address: N7:12
PLC-5 binary files: optional syntax
Fnnn/bbbbb
F File type:B = Binary
nnn File number: 3 – 999 decimalFor direct driver communication, the default filenumber 3 is used if the file number is absent.
bbbbb Bit offset from start of file: 0 – 15999 decimal
Example: B3/1024

� B-3Addressing syntax for Allen-Bradley programmable controllers
PLC-5 I/O and status files
F:ee/bb
F File type:O = OutputI = InputS = Status
ee Element number:For I/O files:PLC-5/10: 0 – 037 octalPLC-5/12: 0 – 037 octalPLC-5/15: 0 – 037 octalPLC-5/25: 0 – 077 octalFor status files: 0 – 31 decimal
bb (optional) Bit offset within word:For I/O files: 0 – 17 octalFor status files: 0 – 15 decimal
Example: O:64/17
PLC-5 timers, counters, and control files
Fnnn:eee.MNE/bb
F File type:C = CounterT = TimerR = Control
nnn File number: 3 – 999 decimalFor direct driver communication, timer, counterand control file types use the default file numberif the file number is absent. The default numbersare 4 (timer), 5 (counter), and 6 (control).
eee Element number: 0 – 999 decimal
MNE Member mnemonic (see mnemonic tablesstarting on page B-22)
bb (optional) Bit number: 0 – 15 decimalOnly applies to analog word members.
Example: T57:38.ACC

Preface
B-4 � RSView Machine Edition User’s Guide
PLC-5 (Enhanced) I/O and status files
F:eee/bb
F File type:I = InputO = OutputS = Status
eee Element number:For I/O files:PLC-5/11: 0 – 037 octalPLC-5/20: 0 – 037 octalPLC-5/30: 0 – 077 octalPLC-5/40: 0 – 177 octalPLC-5/60: 0 – 277 octalPLC-5/80: 0 – 277 octalFor status files:0 – 127 decimal
bb (optional) Bit offset within word:For I/O files: 0 – 17 octalFor status files: 0 – 15 decimal
Example: O:167/11

� B-5Addressing syntax for Allen-Bradley programmable controllers
PLC-5 (Enhanced) binary, BCD, integer,ASCII, float, and string files
Fnnn:eee/bborFnnn:eeee/bb
F File type:B = BinaryD = Decimal (BCD)N = IntegerF = Floating pointA = ASCIIST = String
nnn File number: 3 – 999 decimalFor direct driver communication, binary, integer,and floating point file types use the default filenumber if the file number is absent. The defaultnumbers are 3 (binary), 7 (integer), and 8 (floatingpoint).
eee Element number: 0 – 999 decimal
or
eeee Element number: 0 – 1999 decimal for PLC-5/80Series E firmware
bb (optional) Bit offset within word: 0 – 15 decimalBit offset is not supported for floating point andstring file types.
Example: B84:113/13
PLC-5 (Enhanced) binary files: optionalsyntax
Fnnn/bbbbb
F File type:B = Binary
nnn (optional) File number: 3 – 999 decimalFor direct driver communication, the default filenumber 3 is used if the file number is absent.
bbbbb Bit offset from start of file: 0 – 15999 decimal
Example: B27/248

Preface
B-6 � RSView Machine Edition User’s Guide
PLC-5 (Enhanced) timer, counter, control,SFC status, message, PID, block transfer,and token data files
FFnnn:eee.MNE[ss]/bb
FF File type:T = TimerC = CounterR = ControlSC = SFC statusMG = MessagePD = PID controlBT = Block transferTD = Token data
nnn File number: 3 – 999 decimalFor direct driver communication, timer, counter,and control file types use the default file numberif the file number is absent. The default numbersare 4 (timer), 5 (counter), and 6 (control).
eee Element number: 0 – 999 decimal
MNE Member mnemonic (see mnemonic tablesstarting on page B-22)
ss SubmemberOnly applies to .ADDR and .DATA members ofPID structure and .DATA member ofMSG structure.
bb (optional) Bit number: 0 – 15 decimalOnly applies to analog word members.
Example: MG59:33.DATA[0]/15

� B-7Addressing syntax for Allen-Bradley programmable controllers
SLC addressing syntax
The following section provides addressing syntax for these types ofprogrammable controllers:
SLC 5, which includes the fixed I/O SLC 5, SLC 5/01, SLC 5/02,and SLC 5/03 (OS300)
SLC 5 (Enhanced), which includes the SLC 5/03 (OS 301),SLC 5/04, and SLC 5/05
SLC 5 I/O files
F:ss.www/bb
F File type:I = InputO = Output
ss I/O slot number: 0 – 30 decimal
www (optional) I/O word number expansion: 0 – 255 decimal
bb (optional) Bit offset within word: 0 – 15 decimalWhen input slot is 0: 0 – 23 decimal
Example: I:22.254/13
IMPORTANT Writing to the output files of an SLC 5 is notrecommended. However, if you do, be sure the SLC isnot in RUN mode. If it is in RUN mode, the write failsand an error message is sent to the activity log.
Important information for addressing SLC 5I/O modules
The RSView I/O module addressing system differs from thecorresponding ControlView�, APS, A.I. 500, and RSLogix 5 orRSLogix 500 addressing systems. The RSView I/O data sectionaddressing does not match the physical slot of the I/O module.
In RSView, the first physical module of each type (input or output)is address slot number 0. The next module of the same type in thenext higher-numbered rack slot is address slot number 1, and so on.

Preface
B-8 � RSView Machine Edition User’s Guide
Example: SLC 5 I/O module addressing
SLC
Type
Rack
ConfigurationCV for MS-DOS�
Address or
APS Address
RSView Address
FixedL40
I/O module slot 0(fixed)
I:0.0 or I:0I:0.1O:0
I:0.0 or I:0I:0.1 or I:1O:0
I module slot 2 I:2 I:2FixedL30
I/O module slot 0(fixed)
I:0.0 or I:0I:0.1O:0
I:0.0 or I:0I:0.1 or I:1O:0
I module slot 1 I:1 I:2O module slot 2 O:2 O:1
FixedL20
I/O module slot 0(fixed)
I:0.0 or I:0O:0
I:0.0 or I:0O:0
I module slot 1 I:1 I:1I module slot 2 I:2 I:2
Modular CPU slot 0 N/A N/AO module slot 1 O:1 O:0I module slot 2 I:2 I:0O module slot 3 O:3 O:1
SLC 5 status files
F:ww/bb
F File type:S = Status
ww Word address:SLC 500: 0 – 15 decimalSLC 5/01: 0 – 15 decimalSLC 5/02: 0 – 32 decimalSLC 5/03: 0 – 68 decimal
bb (optional) Bit offset within word: 0 – 15 decimal
Example: S:15/6

� B-9Addressing syntax for Allen-Bradley programmable controllers
SLC 5 binary and integer files
Fnnn:www/bb
F File type:B = BinaryN = Integer
nnn (optional) File number:Binary: 3, 9 – 255 decimalInteger: 7, 9 – 255 decimalFor direct driver communication, binary andinteger file types use the default file number ifthe file number is absent. The default numbersare 3 (binary) and 7 (integer).
www Word address: 0 – 255 decimal
bb (optional) Bit offset within word: 0 – 15 decimal
Example: N17:129/2
SLC 5 binary files: optional syntax
Fnnn/bbbb
F File typeB = Binary
nnn (optional) File number: 3, 9 – 255 decimalFor direct driver communication, the default filenumber 3 is used if the file number is absent.
bbbb Bit offset from start of file: 0 – 4095 decimal
Example: B3/3999

Preface
B-10 � RSView Machine Edition User’s Guide
SLC 5 timer, counter, and control files
Fnnn:eee.MNE/bb
F File type:T = TimerC = CounterR = Control
nnn (optional) File number:Timer: 4, 9 – 255 decimalCounter: 5, 9 – 255 decimalControl: 6, 9 – 255 decimalFor direct driver communication, timer, counter,and control file types use the default file numberif the file number is absent. The default numbersare 4 (timer), 5 (counter), and 6 (control).
eee Element number: 0 – 255 decimal
MNE Member mnemonic (see mnemonic tablesstarting on page B-22)
bb (optional) Bit number: 0 – 15 decimalApplies to analog members only.
Example: R67:123.EN

� B-11Addressing syntax for Allen-Bradley programmable controllers
SLC 5 timer, counter, and control filesbit member addressing: optional syntax
Fnnn:eee/MNE
F File type:T = TimerC = CounterR = Control
nnn (optional) File number:Timer: 4, 9 – 255 decimalCounter: 5, 9 – 255 decimalControl: 6, 9 – 255 decimalFor direct driver communication, timer, counter,and control file types use the default file numberif the file number is absent. The default numbersare 4 (timer), 5 (counter), and 6 (control).
eee Element number: 0 – 255 decimal
MNE Bit member mnemonic (see mnemonic tablesstarting on page B-22)
Example: C77:99/OV
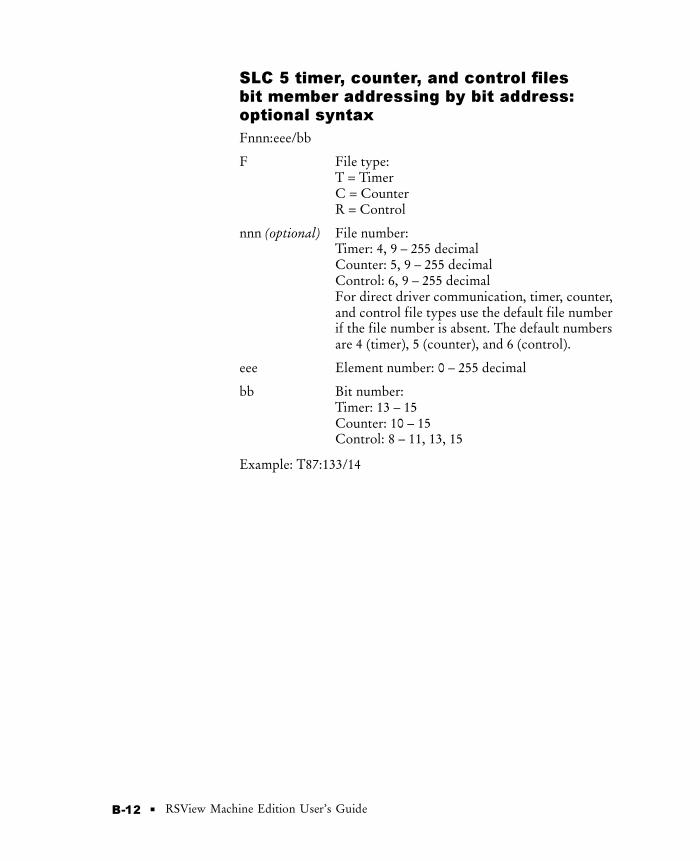
Preface
B-12 � RSView Machine Edition User’s Guide
SLC 5 timer, counter, and control filesbit member addressing by bit address:optional syntax
Fnnn:eee/bb
F File type:T = TimerC = CounterR = Control
nnn (optional) File number:Timer: 4, 9 – 255 decimalCounter: 5, 9 – 255 decimalControl: 6, 9 – 255 decimalFor direct driver communication, timer, counter,and control file types use the default file numberif the file number is absent. The default numbersare 4 (timer), 5 (counter), and 6 (control).
eee Element number: 0 – 255 decimal
bb Bit number:Timer: 13 – 15Counter: 10 – 15Control: 8 – 11, 13, 15
Example: T87:133/14
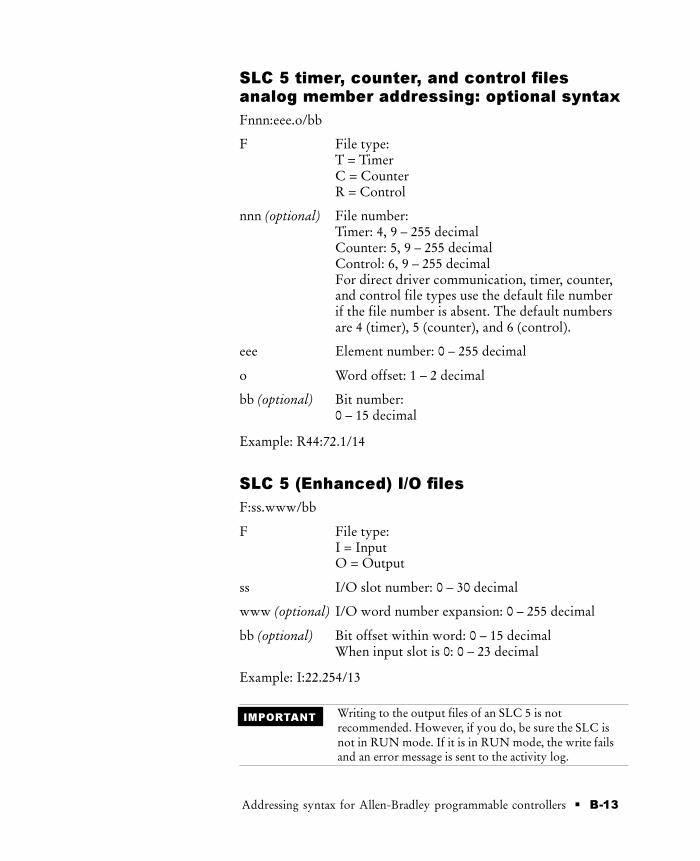
� B-13Addressing syntax for Allen-Bradley programmable controllers
SLC 5 timer, counter, and control filesanalog member addressing: optional syntax
Fnnn:eee.o/bb
F File type:T = TimerC = CounterR = Control
nnn (optional) File number:Timer: 4, 9 – 255 decimalCounter: 5, 9 – 255 decimalControl: 6, 9 – 255 decimalFor direct driver communication, timer, counter,and control file types use the default file numberif the file number is absent. The default numbersare 4 (timer), 5 (counter), and 6 (control).
eee Element number: 0 – 255 decimal
o Word offset: 1 – 2 decimal
bb (optional) Bit number:0 – 15 decimal
Example: R44:72.1/14
SLC 5 (Enhanced) I/O files
F:ss.www/bb
F File type:I = InputO = Output
ss I/O slot number: 0 – 30 decimal
www (optional) I/O word number expansion: 0 – 255 decimal
bb (optional) Bit offset within word: 0 – 15 decimalWhen input slot is 0: 0 – 23 decimal
Example: I:22.254/13
IMPORTANT Writing to the output files of an SLC 5 is notrecommended. However, if you do, be sure the SLC isnot in RUN mode. If it is in RUN mode, the write failsand an error message is sent to the activity log.

Preface
B-14 � RSView Machine Edition User’s Guide
SLC 5 (Enhanced) status files
F:ww/bb
F File type:S = Status
ww Word address:SLC 5/03: 0 – 68 decimalSLC 5/04: 0 – 96 decimal
bb (optional) Bit offset within word: 0 – 15 decimal
Example: S:15/6
SLC 5 (Enhanced) binary, integer, float,ASCII, and string files
Fnnn:www/bb
F File type:B = BinaryN = IntegerF = Floating PointA = ASCIIST = String
nnn (optional) File number:Binary: 3, 9 – 255 decimalInteger: 7, 9 – 255 decimalFloating Point: 8, 9 – 255 decimalASCII: 9 – 255 decimalString: 9 – 255 decimalFor direct driver communication, binary, integer,and floating point file types use the default filenumber if the file number is absent. The defaultnumbers are 3 (binary), 7 (integer), and8 (floating point).
www Word address: 0 – 255 decimal
bb (optional) Bit offset within word: 0 – 15 decimalBit offset is not supported for floating point andstring file types.
Example: F8:129

� B-15Addressing syntax for Allen-Bradley programmable controllers
SLC 5 (Enhanced) binary files: optionalsyntax
Fnnn/bbbb
F File typeB = Binary
nnn (optional) File number: 3, 9 – 255 decimalFor direct driver communication, the default filenumber 3 is used if the file number is absent.
bbbb Bit offset from start of file: 0 – 4095 decimal
Example: B3/3999
SLC 5 (Enhanced) timer, counter, andcontrol files
Fnnn:eee.MNE/bb
F File type:T = TimerC = CounterR = Control
nnn (optional) File number:Timer: 4, 9 – 255 decimalCounter: 5, 9 – 255 decimalControl: 6, 9 – 255 decimalFor direct driver communication, timer, counter,and control file types use the default file numberif the file number is absent. The default numbersare 4 (timer), 5 (counter), and 6 (control).
eee Element number: 0 – 255 decimal
MNE Member mnemonic (see mnemonic tablesstarting on page B-22)
bb (optional) Bit number: 0 – 15 decimalApplies to analog members only.
Example: R67:123.EN

Preface
B-16 � RSView Machine Edition User’s Guide
SLC 5 (Enhanced) timer, counter, andcontrol files bit member addressing:optional syntax
Fnnn:eee/MNE
F File type:T = TimerC = CounterR = Control
nnn (optional) File number:Timer: 4, 9 – 255 decimalCounter: 5, 9 – 255 decimalControl: 6, 9 – 255 decimalFor direct driver communication, timer, counter,and control file types use the default file numberif the file number is absent. The default numbersare 4 (timer), 5 (counter), and 6 (control).
eee Element number: 0 – 255 decimal
MNE Bit member mnemonic (see mnemonic tablesstarting on page B-22)
Example: C77:99/OV
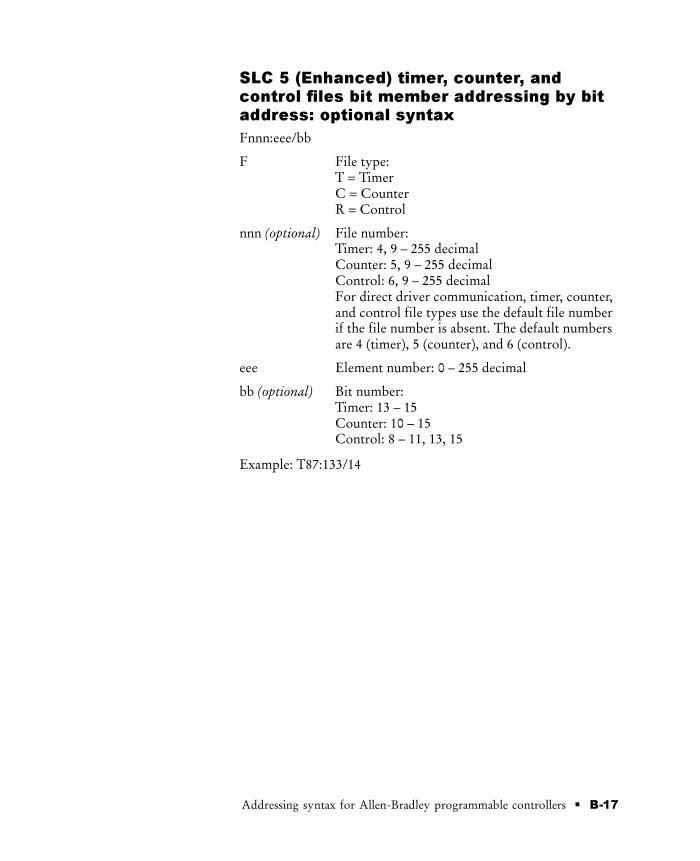
� B-17Addressing syntax for Allen-Bradley programmable controllers
SLC 5 (Enhanced) timer, counter, andcontrol files bit member addressing by bitaddress: optional syntax
Fnnn:eee/bb
F File type:T = TimerC = CounterR = Control
nnn (optional) File number:Timer: 4, 9 – 255 decimalCounter: 5, 9 – 255 decimalControl: 6, 9 – 255 decimalFor direct driver communication, timer, counter,and control file types use the default file numberif the file number is absent. The default numbersare 4 (timer), 5 (counter), and 6 (control).
eee Element number: 0 – 255 decimal
bb (optional) Bit number:Timer: 13 – 15Counter: 10 – 15Control: 8 – 11, 13, 15
Example: T87:133/14

Preface
B-18 � RSView Machine Edition User’s Guide
SLC 5 (Enhanced) timer, counter, andcontrol files analog member addressing:optional syntax
Fnnn:eee.o/bb
F File type:T = TimerC = CounterR = Control
nnn (optional) File number:Timer: 4, 9 – 255 decimalCounter: 5, 9 – 255 decimalControl: 6, 9 – 255 decimalFor direct driver communication, timer, counter,and control file types use the default file numberif the file number is absent. The default numbersare 4 (timer), 5 (counter), and 6 (control).
eee Element number: 0 – 255 decimal
o Word offset: 1 – 2 decimal
bb (optional) Bit number:0 – 15 decimal
Example: R44:72.1/14

� B-19Addressing syntax for Allen-Bradley programmable controllers
SoftLogix 5 addressing syntax
The following section provides addressing syntax for SoftLogix 5controllers. You can use SoftLogix 5 controllers with Windows 2000projects only.
SoftLogix 5 I/O and status files
F:eee/bb
F File type:I = InputO = OutputS = Status
eee Element number:For I/O files: 0 – 277 octalFor status files: 0 – 511 decimal
bb (optional) Bit offset within word:For I/O files: 0 – 17 octalFor status files: 0 – 15 decimal
Example: O:167/11

Preface
B-20 � RSView Machine Edition User’s Guide
SoftLogix 5 binary, BCD, integer, longinteger, ASCII, float, and string files
Fnnnn:eeee/bb
F File type:B = BinaryD = Decimal (BCD)N = IntegerL = Long integerA = ASCIIF = Floating pointST = String
nnnn File number: 3 – 4095 decimalFor direct driver communication, binary, integer,long integer, and floating point file types use thedefault file number if the file number is absent.The default numbers are 3 (binary), 7 (integer),and 8 (floating point).
eeee Element number: 0 – 4095 decimal
bb (optional) Bit offset within word: 0 – 15 decimalBit offset is not supported for long integer,floating point, and string file types.
Example: L4094:4090
SoftLogix 5 binary files: optional syntax
Fnnnn/bbbbb
F File type:B = Binary
nnnn (optional) File number: 3 – 4095 decimalFor direct driver communication, the default filenumber 3 is used if the file number is absent.
bbbbb Bit offset from start of file: 0 – 65535 decimal
Example: B4095/65308
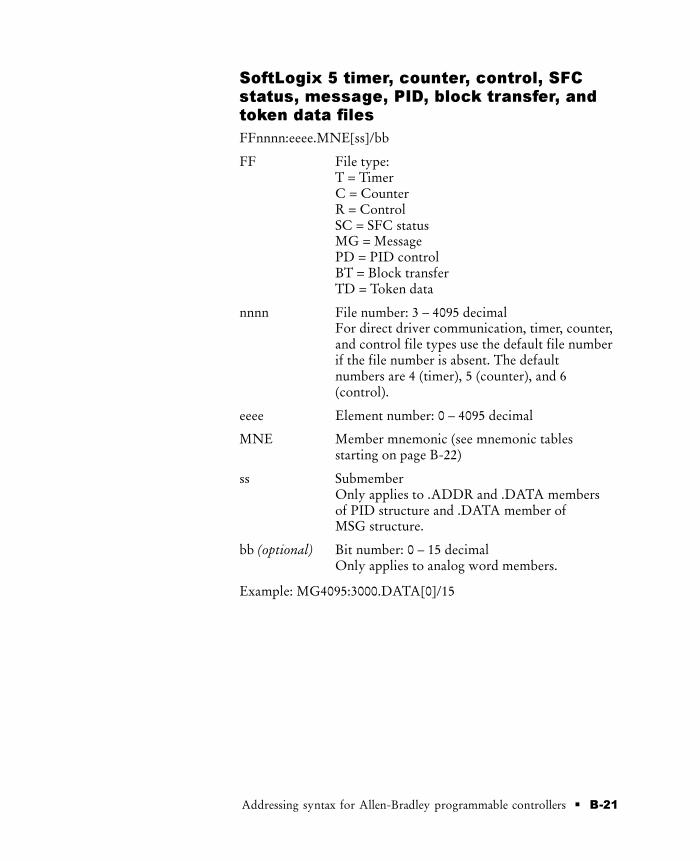
� B-21Addressing syntax for Allen-Bradley programmable controllers
SoftLogix 5 timer, counter, control, SFCstatus, message, PID, block transfer, andtoken data files
FFnnnn:eeee.MNE[ss]/bb
FF File type:T = TimerC = CounterR = ControlSC = SFC statusMG = MessagePD = PID controlBT = Block transferTD = Token data
nnnn File number: 3 – 4095 decimalFor direct driver communication, timer, counter,and control file types use the default file numberif the file number is absent. The defaultnumbers are 4 (timer), 5 (counter), and 6(control).
eeee Element number: 0 – 4095 decimal
MNE Member mnemonic (see mnemonic tablesstarting on page B-22)
ss SubmemberOnly applies to .ADDR and .DATA membersof PID structure and .DATA member ofMSG structure.
bb (optional) Bit number: 0 – 15 decimalOnly applies to analog word members.
Example: MG4095:3000.DATA[0]/15

Preface
B-22 � RSView Machine Edition User’s Guide
Mnemonic tables
Timer mnemonics
Mnemonic Instruction Type
ACC 15 Accumulator Value Analog
DN Done Digital
EN Enable Digital
PRE Preset Value Analog
TT Timing Digital
Counter mnemonics
Mnemonic Instruction Type
ACC Accumulated Value Analog
CD Count Down Enable Digital
CU Count Up Enable Digital
DN Done Digital
OV Overflow Digital
PRE Preset Value Analog
UN Underflow Digital
For fixed I/O SLC only:
UA Update AccumulatorValue
Digital

� B-23Addressing syntax for Allen-Bradley programmable controllers
Control mnemonics
Mnemonic Instruction Type
DN Done Digital
EN Enable Digital
ER Error Digital
FD Found Digital
IN Inhibit Digital
LEN Length Analog
POS Position Analog
UL Unload Digital
For all programmable controllers except the fixed I/O SLC and theSLC 5/01:
EM Empty Digital
EU Enable Unloading Digital

Preface
B-24 � RSView Machine Edition User’s Guide
PID mnemonics
Mnemonic Instruction Type Submember
range
ADDR[] Address of Master Loop%
Analog 0 – 3
BIAS Output Bias % Analog
CA Control Action Digital
CL Cascaded Loop Digital
CT Cascaded Type Digital
DATA[] Reserved / Internal Use Analog 0 – 13
DB Deadband Analog
DO Derivative Of Digital
DVDB Deviation AlarmDeadband
Analog
DVN Deviation Alarm - Analog
DVNA Deviation High Alarm Digital
DVP Deviation Alarm + Analog
DVPA Deviation Low Alarm Digital
EN Enable Digital
ERR Error Analog
EWD Error Within Deadband Digital
INI PID Initialized Digital
KD Derivative Time Analog
KI Integral Gain Analog
KP Proportional Gain Analog
MAXI Input Range Maximum Analog
MAXO Output Limit High % Analog
MAXS Setpoint Maximum Analog
MINI Input Range Minimum Analog
MINO Output Limit Low % Analog
MINS Setpoint Minimum Analog

� B-25Addressing syntax for Allen-Bradley programmable controllers
PID mnemonics (continued)
Mnemonic Instruction Type Submember
range
MO Mode Digital
OLH Output Limit High Digital
OLL Output Limit Low Digital
OUT Output Analog
PE PID Equation Digital
PV Process Variable Analog
PVDB Process Variable AlarmDeadband
Analog
PVH Process Variable AlarmHigh
Analog
PVHA Process Variable HighAlarm
Digital
PVL Process Variable AlarmLow
Analog
PVLA Process Variable LowAlarm
Digital
PVT Process VariableTracking
Digital
SO Set Output % Analog
SP Setpoint Analog
SPOR Setpoint Out of Range Digital
SWM Software A/M Mode Digital
TIE Tieback % Analog
UPD Update Time Analog

Preface
B-26 � RSView Machine Edition User’s Guide
Message mnemonics
Mnemonic Instruction Type Submember
range
AD Done Digital
AE Error Digital
CO Continuous Digital
DATA[] Reserved / Internal Use Analog 0 – 51
DLEN Done Length Analog
DN Synchronization Done Digital
EN Enable Digital
ER Synchronization Error Digital
ERR Error Code Analog
EW Enable Waiting Digital
NR No Response Digital
RLEN Request Length Analog
ST Start Transmission Digital
TO Time Out Digital

� B-27Addressing syntax for Allen-Bradley programmable controllers
Block transfer mnemonics
Mnemonic Instruction Type
CO Continue Digital
DLEN Done Length Analog
DN Done Digital
ELEM Element Number Analog
EN Enable Digital
ER Error Digital
EW Enable Waiting Digital
FILE File Number Analog
NR No Response Digital
RGS Rack Group Slot Analog
RLEN Requested Length Analog
RW Read Writes Digital
ST Start Digital
TO Time Out Digital
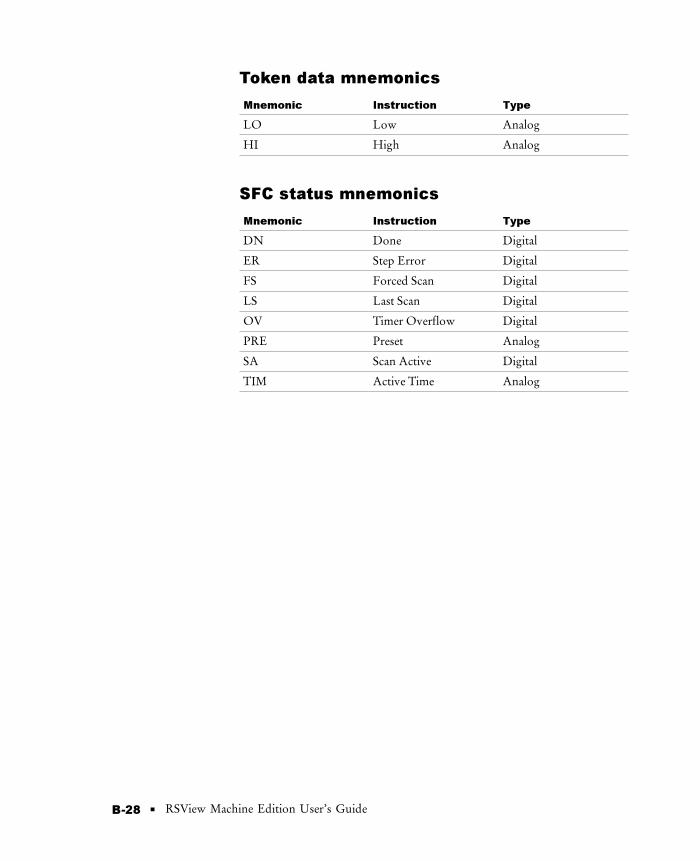
Preface
B-28 � RSView Machine Edition User’s Guide
Token data mnemonics
Mnemonic Instruction Type
LO Low Analog
HI High Analog
SFC status mnemonics
Mnemonic Instruction Type
DN Done Digital
ER Step Error Digital
FS Forced Scan Digital
LS Last Scan Digital
OV Timer Overflow Digital
PRE Preset Analog
SA Scan Active Digital
TIM Active Time Analog
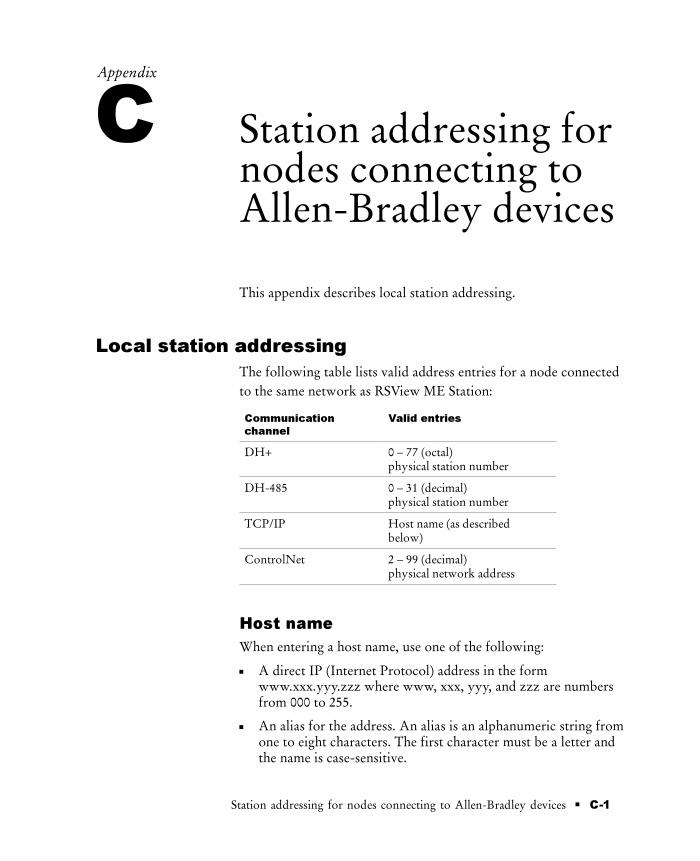
� C-1Station addressing for nodes connecting to Allen-Bradley devices
Station addressing fornodes connecting toAllen-Bradley devices
This appendix describes local station addressing.
Local station addressing
The following table lists valid address entries for a node connectedto the same network as RSView ME Station:
Communication
channel
Valid entries
DH+ 0 – 77 (octal)physical station number
DH-485 0 – 31 (decimal)physical station number
TCP/IP Host name (as describedbelow)
ControlNet 2 – 99 (decimal)physical network address
Host name
When entering a host name, use one of the following:
A direct IP (Internet Protocol) address in the formwww.xxx.yyy.zzz where www, xxx, yyy, and zzz are numbersfrom 000 to 255.
An alias for the address. An alias is an alphanumeric string fromone to eight characters. The first character must be a letter andthe name is case-sensitive.
CAppendix

� I-1Index
Index
Symbols.bmp files, 8-20
importing, 8-21location of, 8-20placing in graphic displays, 9-11tips for using, 8-24viewing, 8-22
.dxf files, 8-20
placing in graphic displays, 9-17.mea files, 4-7
.med files, 4-1
.mer files, 4-1
See also Runtime projectcreating, 20-4default location, 20-5transferring to RAC6182, 21-1, 21-6transferring to Windows 2000, 22-1, 22-4
.wmf files, 8-20
placing in graphic displays, 9-17
Numbers1784-PKTX, 5-3
AAB_DF1-1, 5-3
configuring at runtime, 21-9using to transfer projects, 21-5, 21-6
AB_ETH-1, 5-3, 5-4
configuring at runtime, 21-9using to transfer projects, 21-5, 21-6
AB_KT-1, 5-3
configuring at runtime, 21-9, 21-11using to transfer projects, 21-5, 21-6
Access path, specifying for OPC nodes,6-13
Acknowledge Alarm button graphic object,9-6, 10-23, 13-4
using with Alarm lists, 13-28Acknowledge All Alarms button graphic
object, 9-6, 10-17, 13-4
using with Alarm lists, 13-28ActiveX objects, 9-2
See also Graphic objectsanimating, 11-2at runtime, 24-12, 24-14creating, 9-17navigating to, 10-8registering, 9-18using to display tag values, 9-5, 9-7using to set tag values, 9-4, 9-7
Activity bar, 2-4, 15-2
showing and hiding, 2-5using to test displays, 8-10
Activity Clear All button graphic object,9-6, 10-17
using with Activity lists, 15-9Activity Clear button graphic object, 9-6,
10-23
using with Activity lists, 15-9Activity list graphic object, 9-7, 10-142
at runtime, 15-8, 24-14displaying communication errors in, 24-16in the [ACTIVITY] display, 15-4linking buttons to, 10-9navigating to, 10-8using buttons with, 15-9
Activity Log Setup editor, 15-5
Activity logging, 15-1
at runtime, setting up, 15-4creating your own display for, 15-7during project development, setting up, 15-3monitoring communications with, 5-19, 6-14tracking users with, 12-17types of activities, 15-2
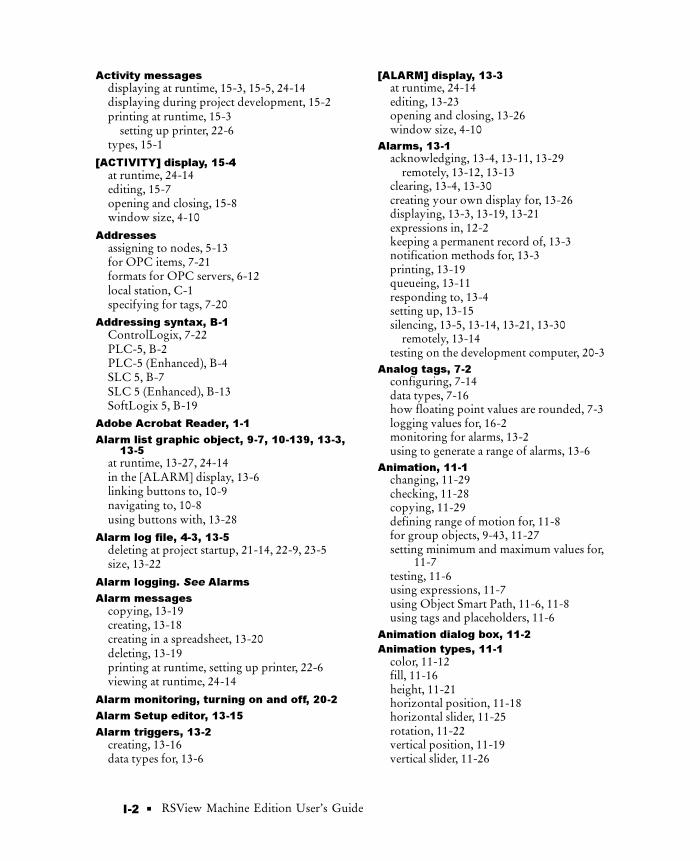
I-2 � RSView Machine Edition User’s Guide
Activity messages
displaying at runtime, 15-3, 15-5, 24-14displaying during project development, 15-2printing at runtime, 15-3
setting up printer, 22-6types, 15-1
[ACTIVITY] display, 15-4
at runtime, 24-14editing, 15-7opening and closing, 15-8window size, 4-10
Addresses
assigning to nodes, 5-13for OPC items, 7-21formats for OPC servers, 6-12local station, C-1specifying for tags, 7-20
Addressing syntax, B-1
ControlLogix, 7-22PLC-5, B-2PLC-5 (Enhanced), B-4SLC 5, B-7SLC 5 (Enhanced), B-13SoftLogix 5, B-19
Adobe Acrobat Reader, 1-1
Alarm list graphic object, 9-7, 10-139, 13-3,13-5
at runtime, 13-27, 24-14in the [ALARM] display, 13-6linking buttons to, 10-9navigating to, 10-8using buttons with, 13-28
Alarm log file, 4-3, 13-5
deleting at project startup, 21-14, 22-9, 23-5size, 13-22
Alarm logging. See Alarms
Alarm messages
copying, 13-19creating, 13-18creating in a spreadsheet, 13-20deleting, 13-19printing at runtime, setting up printer, 22-6viewing at runtime, 24-14
Alarm monitoring, turning on and off, 20-2
Alarm Setup editor, 13-15
Alarm triggers, 13-2
creating, 13-16data types for, 13-6
[ALARM] display, 13-3
at runtime, 24-14editing, 13-23opening and closing, 13-26window size, 4-10
Alarms, 13-1
acknowledging, 13-4, 13-11, 13-29remotely, 13-12, 13-13
clearing, 13-4, 13-30creating your own display for, 13-26displaying, 13-3, 13-19, 13-21expressions in, 12-2keeping a permanent record of, 13-3notification methods for, 13-3printing, 13-19queueing, 13-11responding to, 13-4setting up, 13-15silencing, 13-5, 13-14, 13-21, 13-30
remotely, 13-14testing on the development computer, 20-3
Analog tags, 7-2
configuring, 7-14data types, 7-16how floating point values are rounded, 7-3logging values for, 16-2monitoring for alarms, 13-2using to generate a range of alarms, 13-6
Animation, 11-1
changing, 11-29checking, 11-28copying, 11-29defining range of motion for, 11-8for group objects, 9-43, 11-27setting minimum and maximum values for,
11-7testing, 11-6using expressions, 11-7using Object Smart Path, 11-6, 11-8using tags and placeholders, 11-6
Animation dialog box, 11-2
Animation types, 11-1
color, 11-12fill, 11-16height, 11-21horizontal position, 11-18horizontal slider, 11-25rotation, 11-22vertical position, 11-19vertical slider, 11-26
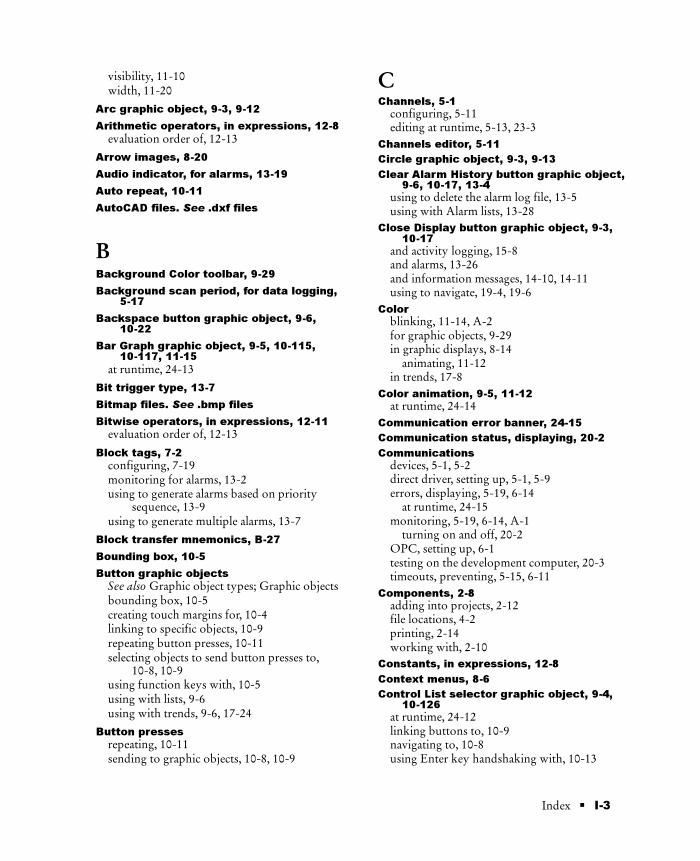
� I-3Index
visibility, 11-10width, 11-20
Arc graphic object, 9-3, 9-12
Arithmetic operators, in expressions, 12-8
evaluation order of, 12-13
Arrow images, 8-20
Audio indicator, for alarms, 13-19
Auto repeat, 10-11
AutoCAD files. See .dxf files
BBackground Color toolbar, 9-29
Background scan period, for data logging,5-17
Backspace button graphic object, 9-6,10-22
Bar Graph graphic object, 9-5, 10-115,10-117, 11-15
at runtime, 24-13
Bit trigger type, 13-7
Bitmap files. See .bmp files
Bitwise operators, in expressions, 12-11
evaluation order of, 12-13
Block tags, 7-2
configuring, 7-19monitoring for alarms, 13-2using to generate alarms based on priority
sequence, 13-9using to generate multiple alarms, 13-7
Block transfer mnemonics, B-27
Bounding box, 10-5
Button graphic objects
See also Graphic object types; Graphic objectsbounding box, 10-5creating touch margins for, 10-4linking to specific objects, 10-9repeating button presses, 10-11selecting objects to send button presses to,
10-8, 10-9using function keys with, 10-5using with lists, 9-6using with trends, 9-6, 17-24
Button presses
repeating, 10-11sending to graphic objects, 10-8, 10-9
CChannels, 5-1
configuring, 5-11editing at runtime, 5-13, 23-3
Channels editor, 5-11
Circle graphic object, 9-3, 9-13
Clear Alarm History button graphic object,9-6, 10-17, 13-4
using to delete the alarm log file, 13-5using with Alarm lists, 13-28
Close Display button graphic object, 9-3,10-17
and activity logging, 15-8and alarms, 13-26and information messages, 14-10, 14-11using to navigate, 19-4, 19-6
Color
blinking, 11-14, A-2for graphic objects, 9-29in graphic displays, 8-14
animating, 11-12in trends, 17-8
Color animation, 9-5, 11-12
at runtime, 24-14Communication error banner, 24-15
Communication status, displaying, 20-2
Communications
devices, 5-1, 5-2direct driver, setting up, 5-1, 5-9errors, displaying, 5-19, 6-14
at runtime, 24-15monitoring, 5-19, 6-14, A-1
turning on and off, 20-2OPC, setting up, 6-1testing on the development computer, 20-3timeouts, preventing, 5-15, 6-11
Components, 2-8
adding into projects, 2-12file locations, 4-2printing, 2-14working with, 2-10
Constants, in expressions, 12-8
Context menus, 8-6
Control List selector graphic object, 9-4,10-126
at runtime, 24-12linking buttons to, 10-9navigating to, 10-8using Enter key handshaking with, 10-13

I-4 � RSView Machine Edition User’s Guide
Control mnemonics, B-23
ControlLogix processors
addressing syntax for, 7-22connecting to, 5-11, 6-3
ControlNet network, 5-11
connecting to at runtime, 21-9local station addressing, C-1
Controls, 9-2
See also Expressions; Tagsassigning to graphic objects, 9-32
using the Property Panel, 9-27for alarms, 13-10, 13-14
Counter mnemonics, B-22
DData log files, 4-3, 16-2
deleting, 21-14, 22-9Data log models, 16-1
changing the model to use at runtime, 16-10creating, 16-5deleting tags from, 16-2specifying how much data to store, 16-6specifying the storage location, 16-7specifying the tags to log, 16-9specifying when to log data, 16-8using with trends, 17-23
Data Log Models editor, 16-4
Data logging, 16-1
choosing the data to log, 16-2methods, 16-2problems with, 16-11setting up, 16-4storage locations, 16-3turning on and off, 20-3
Data source
and communication channels, 5-2ensuring values are read by, 10-12for alarms, 13-2for information messages, 14-2for local messages, 8-30for tags, 7-2, 7-3, 7-20for trends, 17-2
Data types for analog tags, 7-16
Date and time. See Time and date
Default graphic displays. See [ACTIVITY]display; [ALARM] display;[INFORMATION] display
DEFAULT user, 18-8
DeskLock tool, 18-1, 22-4
Device tags, 7-4, 7-20, B-1
DH+ network, 5-3, 5-11
connecting to at runtime, 21-9local station addressing, C-1
DH-485 network, 5-3, 5-11
connecting to at runtime, 21-9local station addressing, C-1
Digital tags, 7-2
configuring, 7-17logging values for, 16-2monitoring for alarms, 13-2
DIN symbols, 8-20
Direct driver nodes, 5-4
assigning to tags, 7-20creating, 5-15editing at runtime, 5-17enabling and disabling, 5-15station addressing for, C-1
Direct drivers, 5-1
AB_DF1-1, 5-3AB_ETH-1, 5-3, 5-4AB_KT-1, 5-3communications, runtime error messages,
24-16configuring at runtime
in Windows 2000, 22-5on the RAC6182, 21-8
configuring RSLinxat runtime, 22-5for transfer to RAC6182, 21-5, 21-7
None Loaded type, 5-13setting up, 5-9SOFT5, 5-3using to connect to ControlLogix processors,
5-11Display editor. See Graphics Display editor
Display List selector graphic object, 9-3,10-96
linking buttons to, 10-9navigating to, 10-8using to navigate, 19-4, 19-6
Display number, specifying, 8-13, 19-8, 19-9
Display Print button graphic object, 8-36,9-3, 10-17, 19-10
Display Settings dialog box, 8-12
Display size. See Window size
Display types, 8-10
and navigation, 19-4default, 8-3

� I-5Index
Displays. See Graphic displays
Documentation for RSView, printing, 1-1
Drawing objects, 9-2
See also Graphic object types; Graphic objectsanimating, 11-2coloring, 9-30creating, 9-10flipping, 9-50locking into position, 9-52reshaping, 9-42rotating, 9-51
EEdit display mode, 8-9
Editor types
Activity Log Setup, 15-5Alarm Setup, 13-15Channels, 5-11Data Log Models, 16-4Expression, 12-3Global Connections, 19-13Graphics Display, 8-3Graphics Library, 8-17Images, 8-22Information Messages, 14-5Information Setup, 14-8Local Messages, 8-33Macros, 7-35Nodes, 5-13, 6-10Parameters, 8-28Project Settings, 4-12Scan Classes, 5-19Startup, 20-2Tag Database, 7-5User Accounts, 18-5
Editors
printing in, 2-14working with, 2-7
Ellipse graphic object, 9-3, 9-13
End button graphic object, 9-6, 10-22
using with Activity lists, 15-9using with Alarm lists, 13-29using with trends, 17-26
Enter button graphic object, 9-6, 10-22,13-4
and Enter key handshaking, 10-12using with Alarm lists, 13-29
Enter key handshaking, 10-12
Error messages. See Activity messages;Communication error banner;Problems at runtime
Ethernet network, 5-3, 5-11
connecting to at runtime, 21-9local station addressing, C-1
Expression editor, 12-3
Expression results
for animation, 11-5rounding, 12-1types of values, 12-2
Expressions, 12-1
See also Write expressionsand animation, 11-7assigning to controls, 7-30assigning to graphic objects, 9-32
using the Property Panel, 9-27checking syntax, 12-5constants in, 12-8copying, 12-6creating, 12-5evaluation order of operators, 12-13formatting, 12-6if-then-else logic in, 12-17math functions in, 12-16monitoring for alarms, 13-2operators in
arithmetic, 12-8bitwise, 12-11logical, 12-10relational, 12-9
security functions in, 12-17tags and placeholders in, 11-4, 12-7using in macros, 7-35
FFile names, 4-2
and spaces, 4-4maximum length of, 4-4
Files, temporary, storing externally, 23-2
Fill animation, 9-5, 11-16
at runtime, 24-14Folders, 7-4
adding tags to, 7-10creating, 7-9creating in the Tags dialog box, 7-25deleting, 7-12duplicating, 7-11

I-6 � RSView Machine Edition User’s Guide
nesting, 7-11opening, 7-10
Fonts
in graphic displays, substitution at runtime,9-10
in trends, 17-8Foreground Color toolbar, 9-29
Foreground scan period, 5-17
Freehand graphic object, 9-3, 9-14
Function keys
assigning to button graphic objects, 10-5changing, 10-7
GGauge graphic object, 9-5, 10-115, 10-120,
10-124
at runtime, 24-13Global connections, 19-2, 19-9
setting up, 19-13using to change displays remotely, 19-7, 19-9,
19-10using to print displays remotely, 19-10using to run macros, 7-34, 19-12
Global Connections editor, 8-36, 19-13
Goto Display button graphic object, 9-3,10-90
and activity logging, 15-8and alarms, 13-23, 13-26and information messages, 14-11assigning visibility animation to, 18-13positioning displays with, 8-14using parameter files with, 8-28using to navigate, 19-4
Graphic displays, 8-1
assigning tag values for, 8-14background color of, 8-14changing remotely, 19-7
security issues, 19-8setting up, 19-9using global connections, 19-10when a user logs out, 18-12, 19-8
creating, 8-3creating a background for, 8-15default. See [ACTIVITY] display; [ALARM]
display; [INFORMATION] displaydeveloping a hierarchy for, 19-2disabling input focus for, 8-13illustrating, 9-3
limiting access to, 8-13, 18-4navigating between, 19-1
objects for, 19-4testing navigation, 19-3
numbering, 8-13, 19-8, 19-9opening, 8-3planning, 3-3, 8-2positioning, 8-14printing, 8-35
at runtime, 8-36remotely, 8-36, 19-10setting up printer, 22-6
setting up, 8-10sizing, 4-8, 8-11, 8-13specifying the first display to open, 20-3testing, 8-9
animation, 11-6title bar in, 4-10types of, 8-10
default type, 8-3using parameter files with, 8-26viewing in detail, 8-9
Graphic images
importing, 8-20monochrome, 8-20removing, 8-24selecting for a graphic object, 8-23that come with RSView Studio, 8-20viewing, 8-22
Graphic libraries, 8-16
changing file location for, 8-18creating, 8-17[HISTORY] library, 13-3, 13-24opening, 8-17Sliders library, 11-25Trends library, 17-23
Graphic object types
See also Button graphic objects; Headings forindividual objects; Multistate graphicobjects
Acknowledge Alarm button, 9-6, 10-23Acknowledge All Alarms button, 9-6, 10-17ActiveX objects, 9-2, 9-4, 9-5, 9-7, 9-17
See also ActiveX objectsActivity Clear All button, 9-6, 10-17Activity Clear button, 9-6, 10-23Activity list, 9-7, 10-142Alarm list, 9-7, 10-139Backspace button, 9-6, 10-22Bar Graph, 9-5, 10-115, 10-117

� I-7Index
Clear Alarm History button, 9-6, 10-17Close Display button, 9-3, 10-17Control List selector, 9-4, 10-126Display List selector, 9-3, 10-96Display Print button, 9-3, 10-17drawing objects, 9-2
See also Drawing objectsarcs, 9-3, 9-12circles, 9-3, 9-13ellipses, 9-3, 9-13freehand objects, 9-3, 9-14images, 9-3, 9-11lines, 9-3, 9-14panels, 9-3, 9-12polygons, 9-3, 9-14polylines, 9-3, 9-14rectangles, 9-3, 9-15rounded rectangles, 9-3, 9-16squares, 9-3, 9-15text, 9-3, 9-10wedges, 9-3, 9-12
End button, 9-6, 10-22Enter button, 9-6, 10-22Gauge, 9-5, 10-115, 10-120, 10-124Goto Display button, 9-3, 10-90Home button, 9-6, 10-22Information Acknowledge button, 9-6, 10-17Information Message display, 9-7, 10-144Interlocked Push button, 9-4, 10-57Latched Push button, 9-4, 10-43List indicator, 9-5, 10-110Local Message display, 9-7, 10-133Login button, 9-3, 10-17Logout button, 9-3, 10-17Maintained Push button, 9-4, 10-37Momentary Push button, 9-4, 10-30Move Down button, 9-6, 10-22Move Left button, 9-6, 10-22Move Right button, 9-6, 10-22Move Up button, 9-6, 10-23Multistate indicator, 9-5, 10-101Multistate Push button, 9-4, 10-49Next Pen button, 9-6, 10-22Numeric display, 9-7, 10-68Numeric Input Enable button, 9-7, 10-73Page Down button, 9-6, 10-23Page Up button, 9-6, 10-23Pause button, 9-6, 10-22Ramp button, 9-4, 10-62
Return to Display button, 9-3, 10-17Shutdown button, 9-3, 10-17Silence Alarms button, 9-6, 10-17String display, 9-7, 10-80String Input Enable button, 9-7, 10-83Symbol, 9-5, 10-106Time and Date display, 9-5, 10-136Trend, 9-5
Graphic objects, 8-1, 9-1
See also Group objects; Headings forindividual objects; Help
aligning, 9-47animating, 11-2
See also Animationarranging, 9-46, 9-50assigning controls to, 9-32
using the Property Panel, 9-27coloring, 9-29configuring, 10-1
using the Properties dialog box, 9-22using the Property Panel, 9-25
converting to wallpaper, 8-15copying, 9-38creating, 9-9, 9-10
selecting tools, 9-8deleting, 9-43deselecting, 9-19duplicating, 9-40editing, 9-37grouping and ungrouping, 9-43moving, 9-37naming, 9-30navigating between, 10-8positioning, 9-46
with grid, 8-8replacing tags and expressions in, 9-34resizing, 9-40selecting, 9-19using at runtime, 10-4using keys to work with. See Special keysusing to display alarms and messages, 9-7using to display processes, 9-5using to enter and display numeric and string
values, 9-7using to illustrate displays, 9-3using to navigate, 19-4using to start and control processes, 9-4
Graphics Display editor, 8-3
undoing and redoing actions in, 8-9Graphics Library editor, 8-17

I-8 � RSView Machine Edition User’s Guide
Graphics toolbar, 8-4
Grid
in graphic displays, 8-8in trends, 17-8, 17-16, 17-18
Group objects
animating, 9-43, 11-27configuring in the Property Panel, 9-25creating, 9-43editing, 9-45naming, 9-31
HHeight animation, 9-5, 11-21
at runtime, 24-14Historical trends, 16-1, 17-2
See also Trends[HISTORY] library, 13-3
copying, 13-24Home button graphic object, 9-6, 10-22
using with Activity lists, 15-9using with Alarm lists, 13-29using with trends, 17-26
Horizontal position animation, 9-5, 11-18
at runtime, 24-14Horizontal slider animation, 9-4, 11-8, 11-25
at runtime, 24-12Host name, C-1
IIf-then-else logic
in expressions, 12-17nesting, 12-19
Image Browser dialog box, 8-22
Image graphic object, 9-3, 9-11
See also Graphic imagesImages editor, 8-22
Indicators, 10-100
Information Acknowledge button graphicobject, 9-6, 10-17
at runtime, 14-10Information Message display graphic
object, 9-7, 10-144
at runtime, 14-12, 24-15in the [INFORMATION] display, 14-4
Information message files, 14-2, 14-5
changing the file to use at runtime, 14-12
Information messages, 14-1
copying, 14-6creating, 14-5creating in a spreadsheet, 14-6creating your own display for, 14-11deleting, 14-6displaying, 14-8, 20-2setting up, 14-4viewing at runtime, 24-14
Information Messages editor, 14-5
Information Setup editor, 14-8
[INFORMATION] display, 14-4
at runtime, 24-15editing, 14-10opening and closing, 14-11window size, 4-10
Initial values for tags
See also Tag valuesassigning to memory tags, 7-21
Input focus
disabling for graphic displays, 8-13giving to graphic objects, 10-8specifying behavior of, 8-15
Interlocked Push button graphic object,9-4, 10-57
at runtime, 24-11Internet address, C-1
and SoftLogix 5, 5-3changing at runtime, 21-9specifying, 5-16
IP address. See Internet address
ISA symbols, 8-20
Keyboard button symbols, 8-20
Isolated graphing, in trends, 17-6
KKeyboard navigation, 10-8
LLatched Push button graphic object, 9-4,
10-43
at runtime, 24-11Least Significant Bit trigger type, 13-9
Libraries. See Graphic libraries
Line graphic object, 9-3, 9-14
List indicator graphic object, 9-5, 10-110
at runtime, 24-13

� I-9Index
Local Message display graphic object,8-29, 8-30, 9-7, 10-133
at runtime, 8-35, 24-15Local message files, 8-30, 8-33
Local messages, 8-29
copying, 8-34creating, 8-33creating in a spreadsheet, 8-34deleting, 8-34viewing at runtime, 24-14
Local Messages editor, 8-33
Local station, C-1
Log files. See Alarm log file; Data log files
Logical operators, in expressions, 12-10
evaluation order of, 12-13Login button graphic object, 9-3, 10-17,
18-9
locating in display hierarchy, 19-2Login window, 24-2
See also Userssize, 4-9
Logout button graphic object, 9-3, 10-17,18-9
locating in display hierarchy, 19-2LSBit trigger type. See Least Significant
Bit trigger type
MMacros
creating, 7-32login and logout, 18-8remote, running from the data source, 7-34,
19-12startup and shutdown, 20-3
for graphic displays, 8-14Macros editor, 7-35
Maintained Push button graphic object,9-4, 10-37, 12-21
at runtime, 24-11Math functions, in expressions, 12-16
Memory tags, 7-4, 7-21
Menus, in the Graphics Display editor, 8-6
Messages
See also Activity messages; Alarm messages;Information messages; Local messages
displaying, 9-7mnemonics, B-26
number of, on a channel, 5-12Microsoft Excel
using to create alarm messages, 13-20using to create information messages, 14-6using to create local messages, 8-34using to create tags, 7-23
Minimum and maximum values
for animation, 11-7for trends, 17-4, 17-17
Mnemonic tables
block transfer, B-27control, B-23counter, B-22message, B-26PID, B-24SFC status, B-28timer, B-22token data, B-28
Modicon devices, 6-1
Momentary Push button graphic object,9-4, 10-30
at runtime, 24-11Monochrome images, 8-20, 9-5
Move Down button graphic object, 9-6,10-22
setting up auto repeat for, 10-12using with Activity lists, 15-9using with Alarm lists, 13-28using with trends, 17-25
Move Left button graphic object, 9-6, 10-22
setting up auto repeat for, 10-12using with trends, 17-25
Move Right button graphic object, 9-6,10-22
setting up auto repeat for, 10-12using with trends, 17-25
Move Up button graphic object, 9-6, 10-23
setting up auto repeat for, 10-12using with Activity lists, 15-9using with Alarm lists, 13-28using with trends, 17-25
Multistate graphic objects
See also Graphic object types; Graphic objectscoloring, 9-29setting up, 10-1testing states, 9-31
Multistate indicator graphic object, 9-5,10-101
at runtime, 24-13

I-10 � RSView Machine Edition User’s Guide
Multistate Push button graphic object, 9-4,10-49
at runtime, 24-11setting up auto repeat for, 10-12
NNavigation
between graphic displays, 19-1testing, 19-3
between graphic objects in a display, 10-8
Networks, 5-1
See also OPCchoosing, 5-11DH+, 5-3DH-485, 5-3Ethernet, 5-3
Next Pen button graphic object, 9-6, 10-22
using to change trend’s vertical axis labels, 17-4,17-19
using with trends, 17-25
Nodes, 5-1
See also Direct driver nodes; OPC nodesediting at runtime, 23-4
Nodes editor, 5-13, 6-10
Normally closed push button, 10-30
Normally open push button, 10-30
Number format, at runtime, 21-3, 22-3
Numeric display graphic object, 9-7, 10-68,17-23
at runtime, 24-13displaying communication information in,
24-17specifying number format for, 21-3, 22-3
Numeric Input Enable button graphicobject, 9-7, 9-28, 10-73
at runtime, 24-3, 24-12how values are calculated, 24-5using Enter key handshaking with, 10-13using write expressions with, 12-20
Numeric pop-up keypad, window size, 4-9
Numeric pop-up scratchpad, window size,4-9
Numeric pop-ups, using at runtime, 24-4
Numeric values
See also Tag valuesusing graphic objects to display and enter, 9-7
OObject Explorer, 8-5, 9-20
opening, 9-21using to select objects, 9-22viewing objects in, 9-21
Object Smart Path, 11-6, 11-8
Objects toolbar, 8-4
On Top displays, 8-11
positioning, 8-14sizing, 4-8, 8-13using for activity logging, 15-7using for alarms, 13-26using for information messages, 14-11
OPC
and RSLinx, 6-1, 6-2and Windows 2000 projects, 6-1and Windows CE projects, 6-2communications, runtime error messages,
24-16update rate, 6-13using to connect to ControlLogix processors,
6-3, 7-22OPC nodes
assigning to tags, 7-20creating, 6-10editing at runtime, 6-13enabling and disabling, 6-11specifying an access path for, 6-13
OPC servers
address formats, 6-12assigning to nodes, 6-10items in, 7-21, 7-22
Operators. See Expressions
PPage Down button graphic object, 9-6,
10-23
setting up auto repeat for, 10-12using with Activity lists, 15-9using with Alarm lists, 13-29
Page Up button graphic object, 9-6, 10-23
setting up auto repeat for, 10-12using with Activity lists, 15-9using with Alarm lists, 13-29
Panel graphic object, 9-3, 9-12
Parameter files, 9-36
assigning to graphic displays, 8-26using Goto Display buttons, 8-28
� I-11Index
assigning to startup display, 20-3creating, 8-29
Parameters editor, 8-28
Passwords, 18-1
changing, 18-9setting up, 18-8
Pause button graphic object, 9-6, 10-22
using with trends, 17-25PCMCIA card, storing temporary files on,
23-2
PID mnemonics, B-24
Placeholders. See Tag placeholders
PLC. See Programmable controllers
PLC-5 (Enhanced) addressing syntax, B-4
PLC-5 addressing syntax, B-2
Polygon graphic object, 9-3, 9-14
Polyline graphic object, 9-3, 9-14
Preconfigured graphic displays. See[ACTIVITY] display; [ALARM] display;[INFORMATION] display
Print Display button graphic object,printing trend data with, 17-26
Printers
selecting on the development computer, 2-14specifying at runtime, 22-6
in Windows CE, 21-12Problems at runtime
data logging, 16-11logging in, 24-3running out of disk space, 23-2using the numeric pop-ups, 24-6using the string pop-ups, 24-10
Programmable controllers
address scanning, 5-17addressing syntax
PLC, B-1SLC, B-7SoftLogix 5, B-19
and network types, 5-11setting up communication with, 5-1type, selecting for direct driver node, 5-16
Project Explorer, 2-3, 2-4
showing and hiding, 2-5using, 2-6
Project files, 2-13, 4-2
viewing location of, 4-14Project properties, viewing, 4-14
Project Settings editor, 4-12
Project Transport Wizard, 4-7
Project window size, 4-7
changing, 4-8Projects, 2-1
See also Components; Runtime projectbacking up and restoring, 4-7closing, 4-6copying, deleting, and renaming, 4-7creating, 4-4downloading, using RSLinx drivers, 5-4opening, 4-5
multiple, 4-6planning, 3-1runtime, creating, 20-4sample, opening, 2-2testing on the development computer, 20-3window size, 4-8
Properties dialog box
configuring objects in, 9-22opening, 9-23using to assign controls to graphic objects,
9-32, 9-34Property Panel, 8-5
configuring objects in, 9-25opening, 9-24using to assign controls to graphic objects, 9-27
Push buttons, 10-29
RRAC6182
running out of disk space, 23-2running projects on, 21-1
Ramp button graphic object, 9-4, 9-34,10-62
at runtime, 24-12setting up auto repeat for, 10-12
Range of motion, for animation, 11-7, 11-8
Read control, 9-27
Read-write control, 9-27
Real-time trends, 16-1, 17-2
See also TrendsRectangle graphic object, 9-3, 9-15
blinking, 11-15Relational operators, in expressions, 12-9
evaluation order of, 12-13Remote macros, 7-34, 19-12
Replace displays, 8-10
sizing, 4-8

I-12 � RSView Machine Edition User’s Guide
Return to Display button graphic object,9-3, 10-17
using to navigate, 19-4, 19-5Right-click menus, 8-6
Rotation animation, 9-5, 9-51, 11-22
at runtime, 24-14Rounded rectangle graphic object, 9-3,
9-16
RSLinx, 1-1
and OPC, 6-1, 6-2and SoftLogix 5, 5-3configuring drivers in
at runtime, 22-5for transfer to RAC6182, 5-4, 21-5, 21-7
using to connect to a device, 5-4RSView Enterprise
RSView ME Station, 1-1RSView Studio, 1-1
RSView Machine Edition, 1-1
installing. See RSView Machine EditionInstallation Guide
RSView ME Station
startingin Windows 2000, 22-4, 22-8on the RAC6182, 21-4, 21-13
stopping, 23-6RSView ME Station dialog box, 23-1
bypassing, 21-14, 22-9opening, 23-2
RSView Studio
main window, 2-3opening and closing, 2-1
RSWho, using to select station addresses,5-16
Runtime
changing tag values, 24-10configuring direct drivers
in Windows 2000, 22-5on the RAC6182, 21-8
deleting log files, 23-5displaying tag values, 24-12editing channels, 5-13, 23-3editing nodes, 5-17, 6-13, 23-4entering numeric values, 24-3entering string values, 24-7font substitution, 9-10logging in and out, 24-1, 24-3
problems with logging in, 24-3printing, 2-15
printing graphic displays, 8-36project file, creating, 20-4setting up printers, 22-6time, date, and number formats, 21-3, 22-3using graphic objects, 10-4viewing alarms and messages, 24-14viewing communication errors, 24-15
Runtime project
See also .mer filesconfiguring, 23-2starting, 21-12, 22-8, 23-2, 23-6
in Windows 2000, 22-4, 22-8on the RAC6182, 21-4, 21-13
stopping, 23-6transferring to RAC6182, 21-1, 21-6transferring to Windows 2000, 22-1, 22-4
Runtime screen resolution, 4-7
SSample projects, 2-2
Scan Classes editor, 5-19
Scan rate
assigning to tags, 7-20for direct driver nodes, 5-17for OPC nodes (update rate), 6-13
Screen resolution, at runtime, 4-7
Screen size. See Window size
Security, 18-1
See also Passwordsand remote display changes, 19-8controlling who can stop the project, 18-10logging in and out, 18-9setting up, 18-4using visibility animation, 11-11, 18-10, 18-13
Security codes, 18-2
assigning to graphic displays, 8-13, 18-4assigning to user accounts, 18-8
Security functions
in expressions, 12-17using, 11-11, 18-3, 18-13
SFC status mnemonics, B-28
Shutdown button graphic object, 9-3, 10-17
assigning visibility animation to, 18-13limiting access to, 18-10locating in display hierarchy, 19-2using to navigate, 19-4, 19-7using to stop project, 20-4, 23-6
Shutdown macro. See Macros
� I-13Index
Siemens devices, 6-1
Silence Alarms button graphic object, 9-6,10-17, 13-5
using with Alarm lists, 13-28SLC 5 (Enhanced) addressing syntax, B-13
SLC 5 addressing syntax, B-7
SOFT5 driver, 5-3
SoftLogix 5 controllers, 5-3
addressing syntax, B-19specifying addresses for, 5-16
Special keys
arrows, using with graphic objects, 9-41Ctrl
copying objects with, 9-38drawing objects with, 9-13, 9-14, 9-15, 9-16resizing objects with, 9-41rotating objects with, 9-52selecting objects with, 9-20
Shift, using with graphic objects, 9-38, 9-41using to navigate at runtime, 10-8using with numeric pop-ups, 24-5using with string pop-ups, 24-8
Spreadsheets
using in the Tag Database editor, 7-12working in, 2-9
Square graphic object, 9-3, 9-15
Standard toolbar, 2-3
Startup display, specifying, 20-3
Startup editor, 20-2
Startup macro. See Macros
Startup settings, 20-1
States. See Multistate graphic objects
States toolbar, 9-31
Station address
local, C-1specifying, 5-16
Status bar, 2-4, 8-5
showing and hiding, 2-5Storage Card directory, in Windows CE,
21-15
String display graphic object, 9-7, 10-80
at runtime, 24-13displaying communication information in,
24-17String Input Enable button graphic object,
9-7, 10-83
at runtime, 24-7, 24-12how values are written, 24-9
using Enter key handshaking with, 10-13String pop-up keyboard, window size, 4-9
String pop-up scratchpad, window size, 4-9
String pop-ups, using at runtime, 24-7
String tags, 7-2
configuring, 7-18String values
See also Tag valuesusing graphic objects to display and enter, 9-7
Symbol graphic object, 9-5, 10-106
at runtime, 24-13Syntax
addressing. See Addressing syntaxexpression, checking, 12-5
System activity. See Activity logging
System tags, 7-2, A-1
for communications, 5-20, 6-14direct driver, A-1OPC, A-1
for making graphic objects blink, A-2time and date, A-3using to display communication information at
runtime, 24-16viewing in the Tag Database editor, 7-9
System time and date. See Time and date
TTag Database editor, 7-5
Tag folders, 7-8
See also FoldersTag Import and Export Wizard, 7-28
Tag placeholders, 8-25, 9-36
creating, 9-36, 11-7, 12-8using in expressions, 12-7using with animation, 11-6
Tag statistics, viewing, 7-7
Tag substitution, 7-31, 9-34
Tag values
assigningwhen a display opens or closes, 8-14when a project starts or stops, 20-3when a user logs in or out, 18-8
assigning initial values, to memory tags, 7-21changing at runtime, 24-10displaying at runtime, 24-12ensuring the data source has read, 10-12logging, 7-31, 16-2

I-14 � RSView Machine Edition User’s Guide
updating, 5-17, 6-13using graphic objects to display, 9-7using graphic objects to set, 9-4, 9-7using macros to assign, 7-32
Tags, 7-1
See also Analog tags; Block tags; Device tags;Digital tags; Memory tags; String tags;System tags
addresses, 7-20assigning to controls, 7-29assigning to graphic objects, 9-32
using the Property Panel, 9-27creating, 7-10, 7-13, 7-23
in the Tags dialog box, 7-25data sources, 7-3, 7-20deleting, 7-14duplicating, 7-13editing, 7-14, 7-25exporting, 7-28importing, 7-23, 7-26, 7-28merging databases, 7-28naming, 7-4searching for, 7-8using in expressions, 11-4, 12-7
Tags dialog box, using, 7-25
TCP/IP
See also Ethernet networkstation addressing, C-1
Test display mode, 8-9
Text graphic object, 9-3, 9-10
blinking, 11-14editing, 9-11
Time and date
at runtime, 21-3, 22-3setting using global connections, 19-11system tags, A-3updating, 19-11
Time and Date display graphic object, 9-5,10-136
at runtime, 24-14specifying time and date format for, 21-3, 22-3
Timer mnemonics, B-22
Title bar
and security, 18-10in graphic displays, 4-10in On Top displays, 8-13
Token data mnemonics, B-28
Toolbars, 2-3
Background Color toolbar, 9-29Foreground Color toolbar, 9-29Graphics toolbar, 8-4in the Graphics Display editor, 8-4, 8-6Objects toolbar, 8-4showing and hiding, 2-5Standard toolbar, 2-3States toolbar, 9-31
Tools
DeskLock, 18-1, 22-4Project Transport Wizard, 4-7Tag Import and Export Wizard, 7-28Transfer Utility, 21-6
Touch margins, using on buttons, 10-4
Touch screens, positioning objects for,10-4
Transfer Utility tool, 21-6
and RSLinx drivers, 5-4Trend data, printing at runtime, 17-26
remotely, 17-26Trend graphic object, 9-5, 17-1
and data logging, 16-1at runtime, 24-14border, 17-3chart, 17-4, 17-11
isolated graphing in, 17-6, 17-18types, 17-5XY Plot, 17-5
coloring, 17-8configuring, 17-3, 17-10creating, 17-10grid, 17-16, 17-18linking buttons to, 10-9minimum and maximum values for, 17-4, 17-17navigating to, 10-8pens, 17-5
configuring, 17-21icons, 17-5, 17-13markers, 17-5
plotting values across the chart, 17-7setting up, 17-9specifying number, time, and date format for,
21-3, 22-3specifying tags and expressions to plot data for,
17-20specifying the amount of data to store, 17-14testing, 17-9troubleshooting. See Helpwindow, 17-4

� I-15Index
X (horizontal) axis, 17-4, 17-15labels, 17-5, 17-16
Y (vertical) axis, 17-4, 17-17labels, 17-4, 17-18
Trigger values
for alarms, 13-2, 13-6, 13-18for information messages, 14-3, 14-5for local messages, 8-32
Troubleshooting. See Problems at runtime
UUpdate rate for OPC nodes, 6-13
User accounts, 18-2
DEFAULT user, 18-8deleting, 18-9displaying current user, 12-17setting up, 18-8
User Accounts editor, 18-5
Users, logging in and out, 18-9, 24-1, 24-3
VValue table, 7-1, 7-4
updating, 5-17, 6-13Value trigger type, 13-6
Vertical position animation, 9-5, 11-19
at runtime, 24-14Vertical slider animation, 9-4, 11-26
at runtime, 24-12
Visibility animation, 11-10
using to set up security, 11-11, 18-10, 18-13
WWallpaper
converting graphic objects to, 8-15unlocking, 8-16
Wedge graphic object, 9-3, 9-12
Width animation, 9-5, 11-20
at runtime, 24-14Wildcards, 7-4, 7-8
Window size
default graphic displays, 4-10project, 4-8
Windows 2000, running projects in, 22-1
Windows CE
See also RAC6182Storage Card directory, 21-15
Windows domain, logging in to, 24-1
Windows meta files. See .wmf files
Workbook Mode, 2-4
turning on and off, 2-5Write control, 9-27
Write expressions, 9-28, 12-20
XXY Plot trend, 17-5

RSView Machine Edition™
Rockwell SoftwareFor more information on the latest pricing or a demonstration of any Rockwell Software package, please contact your local Rockwell Automationsales office or Allen-Bradley distributor. For the very latest on RockwellSoftware products, visit us at:
www.software.rockwell.com
Doc ID VIEWME-UM001A-EN-E
©2001 Rockwell Software Inc. All rights reserved. Made in the United States of America. RSView Machine Edition and the Rockwell Software logo are trademarks of Rockwell Software Inc. All other trademarks are the property of their respective holders and are hereby acknowledged.