rudi hari murti - wordpress.com · tabel. 1. perform an analysis of variance to test against the...
TRANSCRIPT

Rudi Hari Murti

PERLAKUAN
KUANTITATIF KUALITATIF
• POLINOMIAL/TREND COMPARISON
• ANALISIS REGRESI
TERSTRUKTUR TIDAK TERSTRUKTUR
KONTRAS ORTOGONALPEMISAHAN
RERATA/MULTIPLE
COMPARISON

ANOVA only tells you that the groups are somehow not equal to each other
But you usually want to know whether there are differences between particular groups

Merupakan pengembangan uji t (var homogen)
2/ 2
1 1LSDij Wi i
t sn nα
= +
YXst YXhit −=−.YX
hit sYXt
−
−=
YXst YXtabel −≤−.
ni= ulangan perlakuan ke-inj=ulangan perlakuan ke-j
Jika t hit diganti t tabel

1. Perform an analysis of variance to test against the alternative
hypothesis that at least one of the means differs from the rest.
2. If there is insufficient evidence to reject using F = MSB/MSW, proceed no further.
3. If is rejected, define the least significantdifference (LSD) to be the observed difference between two sample means necessary to declare the corresponding population means different.
0 1:H µ =
0H
2 tµ µ= =
0H

4. For a specified value of the least significant difference for comparing
5. where are the respective sample sizes from population i and j, and t is the critical tvalue (Table 2 of the Appendix) for and df denoting the degrees of freedom forNote that for
,α
i jµ µto is
2/ 2
1 1LSDij Wi i
t sn nα
= +
i jn nand
/ 2a α=2 .Ws
1 2 ,tn n n n= = = =
2
/ 22LSD LSD W
ijstnα= =
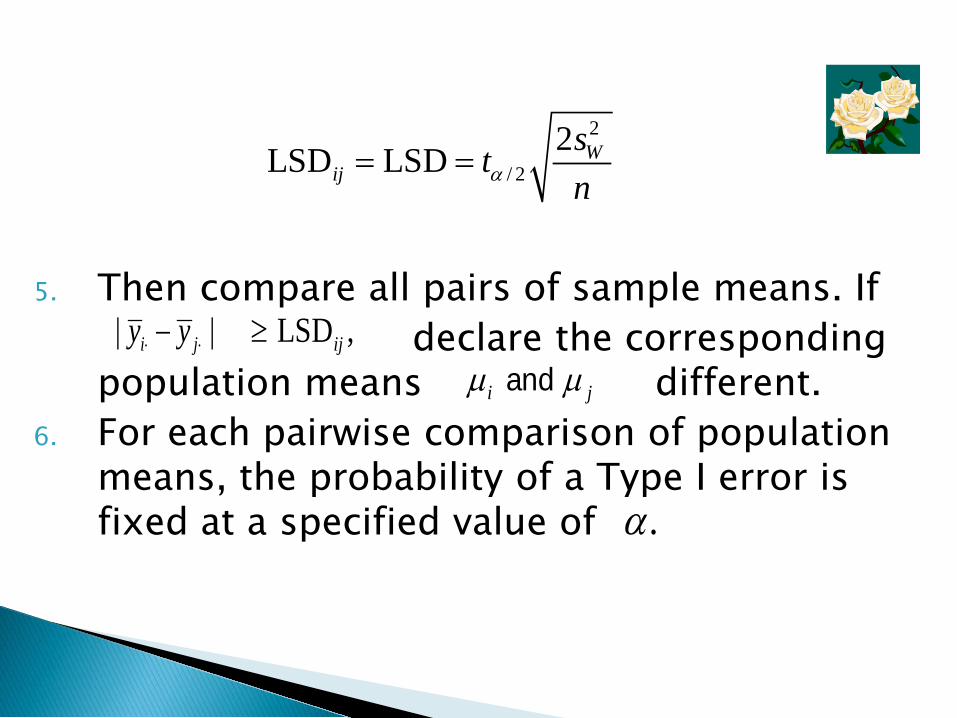
5. Then compare all pairs of sample means. Ifdeclare the corresponding
population means different.6. For each pairwise comparison of population
means, the probability of a Type I error is fixed at a specified value of
| |i jy y⋅ ⋅− LSD ,ij≥
i jµ µand
.α

Note: The LSD procedure is analogous to a two sample t-test for any two population means except that we use the pooled estimator of the population variance from all t samples, rather than the pooled sample variance from samples i and j.
Also, the degrees of freedom for the t value is from the analysis of variance,
rather than
,i jµ µand 2 ,Ws2σ
dfW = Tn t−2.i jn n+ −
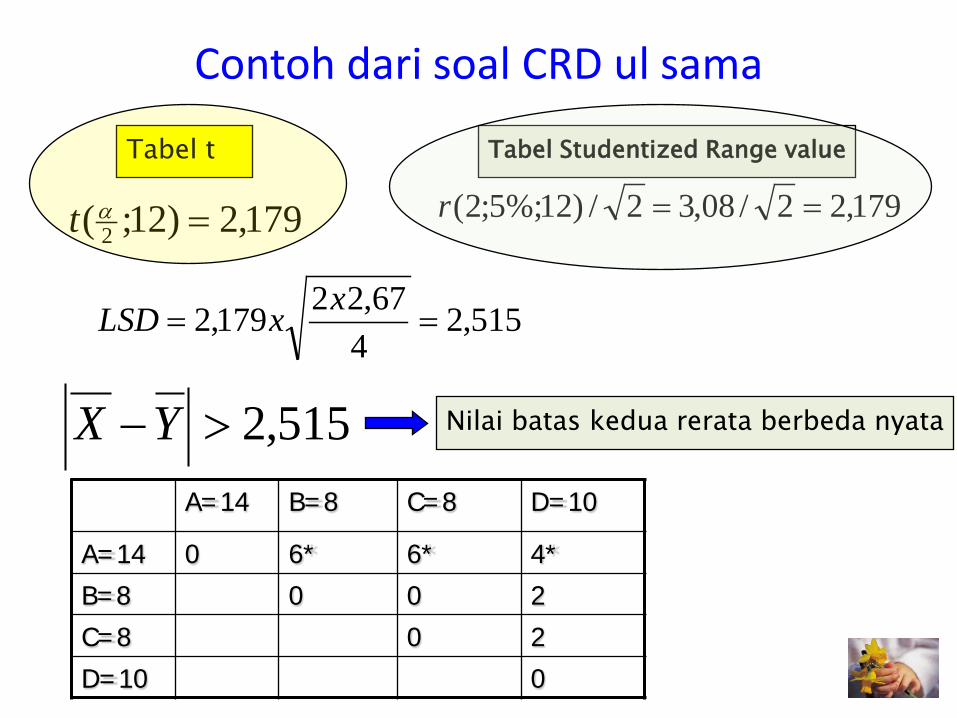
Contoh dari soal CRD ul sama
179,2)12;( 2 =αt 179,22/08,32/)12%;5;2( ==r
515,24
67,22179,2 ==xxLSD
A=14 B=8 C=8 D=10
A=14 0 6* 6* 4*B=8 0 0 2C=8 0 2D=10 0
Tabel t Tabel Studentized Range value
515,2>−YX Nilai batas kedua rerata berbeda nyata

1. Rank the t sample means.2. Two population means and are declared
different if
is the mean square within samples based on degrees of freedom, is the upper-tail critical value of the Studentized range for comparing tdifferent populations, and n is the number of observations in each sample. A discussion follows showing how to obtain values of from Table Studentized Range Value
iµ jµ
2
| |
( , )
i j
W
y y W
sW q tnα υ
⋅ ⋅− ≥
=
where
2Ws
( , )q tα υ
( , )q tα υ
υ

3. The error rate that is controlled is an experimentwise error rate. Thus, the probability of observing an experiment with one or more pairwise comparisons falsely declared to be significant is specified at α
A=14 B=8 C=8 D=10
A=14 0 6* 6* 4*B=8 0 0 2C=8 0 2D=10 0
43,3467,220,4 == xW
20,4),,(),( == dbetrvtq αα
43,3>−YX
2
| |
( , )
i j
W
y y W
sW q tnα υ
⋅ ⋅− ≥
=
where

1. Rank the t sample means from lowest to highest.2. For two means and that are r steps apart, we
declare and different if
where , n is the number of observations per sample, is the mean square within samples from the ANOVA table, is the degrees of freedom for and is the critical value of the Studentized range. Values of are given in table Tukey’s.
(Note: Use the column labeled t to locate the desired value for r.)
iy ⋅ jy ⋅
iµ jµ
| |i j ry y W⋅ ⋅− ≥2( , ) /r WW q r s nα υ=
2Ws
2 ,Ws ( , )q rα υ( , )q rα υ
υ
Wr atau SNK

3,43 3,08 2,51
A = 14 D = 10 B = 8 C = 8
C= 8 6* 2 0 0
B = 8 6* 2 0
D = 10 4* 0
A = 14 0
q(α;t;v) =q(5%;2-4;12)= 3,08 3,77 4,2Wr (SNK) = 2,516381 3,080115 3,431428
2( , ) /r WW q r s nα υ=
817,0/2 == nSS WX
a

Uji Duncan sama seperti SNK tetapi tabel yang digunakan: Duncan’s New Multiple Range Test
Batas kritis untuk dua perlakuan berjarak padalah dimana SSR α,v,p adalah nilai dari tabel Duncan, yang besarnya tergantung α,v, dan p
Xpp sSSRLSR ,,, ναα =

2,704 2,630 2,516
C = 8 B = 8 D = 10 A = 14
A = 14 6* 6* 4* 0
D = 10 2 2 0
B = 8 0 0
C= 8 0
3,08 3,22 3,31
2,516381 2,630762 2,704292
=pvSSR ,,α
Xpp sSSRLSR ,,, ναα=
817,0/2 == nSS WX
a
b

1. For a specified value of Dunnett’s D value for comparingto the control mean is
where n is the common sample size from treatment i andthe control, k = t – 1, the number of noncontrol treatments;α is the desired experimentwise error rate; is the meansquare within; is the degrees of freedom associated with
is the critical Dunnett value (Table 11 of theAppendix).
,Eαi cµ µ
22( , ) WsD d knα υ=
2Ws
2 ; ( , )Ws d kα υandυ

2. For the two-sided alternative we declare different from if
where the value of is the two-sided value in Table Dunett’s.
3. For the one-sided alternative we declaregreater than if
where the value of is the one-sided value in Table Dunet
: ,i cHα µ µ≠iµcµ
| |i cy y D− ≥( , )d kα υ
: ,a i cH µ µ>iµcµ
( , )d kα υ
| |i cy y D− ≥
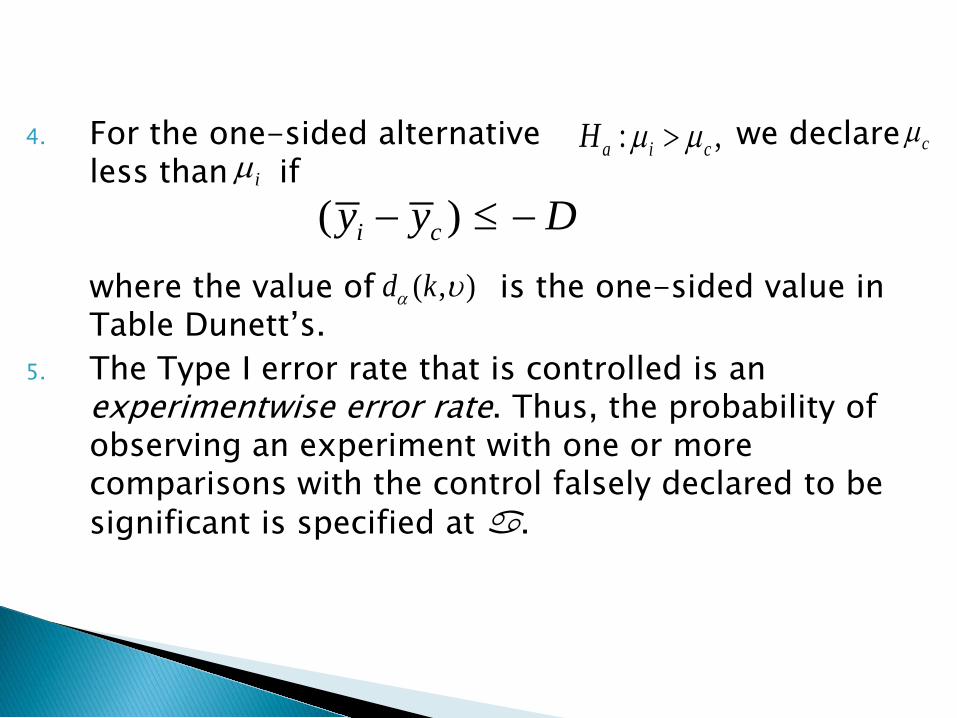
4. For the one-sided alternative we declare less than if
where the value of is the one-sided value in Table Dunett’s.
5. The Type I error rate that is controlled is an experimentwise error rate. Thus, the probability of observing an experiment with one or more comparisons with the control falsely declared to be significant is specified at .
: ,a i cH µ µ>iµ
cµ
( )i cy y D− ≤ −
( , )d kα υ

09,34
67,2268,2 ==xxD
B=8 C=8 D=10
A (kontrol)=14 6* 6* 4*
22( , ) WsD d knα υ=

1. Consider any linear comparison among the tpopulation means of the form
We wish to test the null hypothesis
against the alternative
2. The test statistic is
1 1 2 2 t tl a µ α µ α µ= + + +
0 : 0H l =
: 0aH l ≠
1 1 2 2ˆ
t tl a y y yα α⋅ ⋅ ⋅= + + +
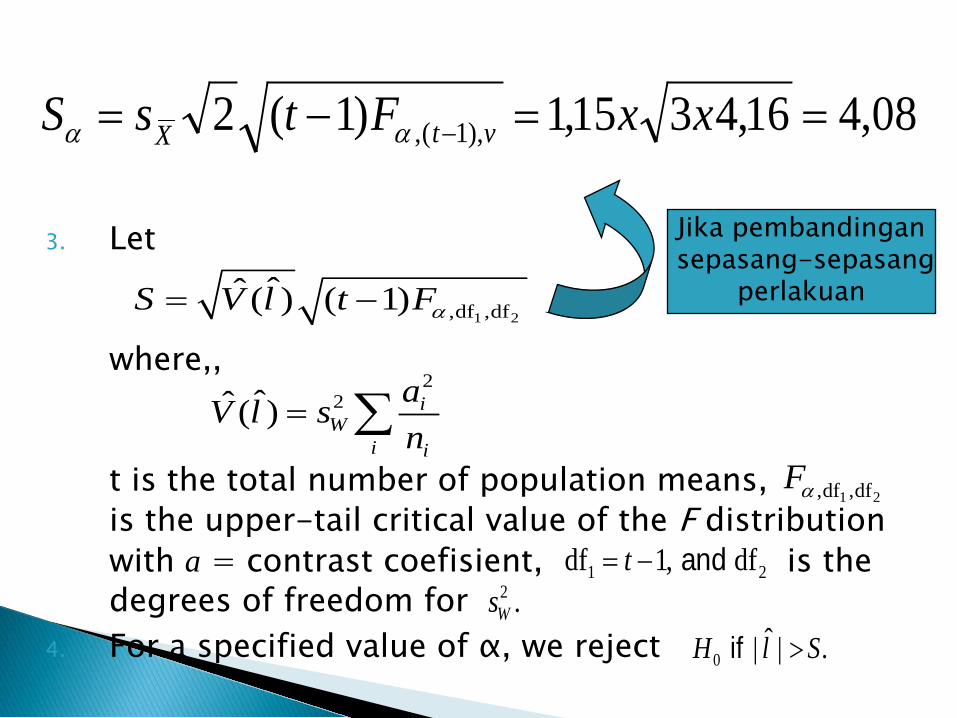
3. Let
where,,
t is the total number of population means,is the upper-tail critical value of the F distribution with a = contrast coefisient, is the degrees of freedom for
4. For a specified value of α, we reject
1 2,df ,dfˆˆ ( ) ( 1)S V l t Fα= −
22ˆˆ( ) iW
i i
aV l sn
= ∑1 2,df ,dfFα
1 2df 1, dft= − and2 .Ws
0ˆ| | .H l S>if
08,416,4315,1)1(2 ),1(, ==−= − xxFtsS vtX αα
Jika pembandingansepasang-sepasang
perlakuan

Number of Pairwise Comparisons
1 2
1 2
(2 )1 2
1 1( )α/ m E
y y y y
t MSn n
ν
ν
− >
=
and are significantly different if | | BSD where
BSD = +
and within (error) df( -1)
2k km =
α≤Experiment-wise errror rate