rule creation in a knowledge-assisted visual analytics...
TRANSCRIPT
Rule Creation in a Knowledge-assisted VisualAnalytics Prototype for Malware Analysis
Johannes Schick1, Markus Wagner2, Niklas Thur2, Christina Niederer2, Gernot Rottermanner2,Paul Tavolato2, Wolfgang Aigner2
St. Polten University of Applied Sciences, AustriaEmail: [email protected], [email protected]
Abstract—The increasing number of malicious software (mal-ware) requires domain experts to shift their analysis process to-wards more individualized approaches to acquire more informa-tion about unknown malware samples. KAMAS is a knowledge-assisted visual analytics prototype for behavioral malware analy-sis. It allows IT-security experts to categorize and store potentiallyharmful system call sequences (rules) in a knowledge database.To meet the increasing demand for individualization of analysisprocesses, analysts should be able to create individual rules.This paper is a visualization design study, which describes thedesign and implementation of a Rule Creation Area (RCA) intoKAMAS and its evaluation by domain experts. It became clearthat continuous integration of experts in interaction processesimproves the knowledge generation mechanism of KAMAS.Additionally, the outcome of the evaluation revealed that thereis a demand for adjustment and re-usage of already stored rulesin the RCA.
I. INTRODUCTION
Nowadays, domain experts have to deal with an ever in-creasing number of malicious software (malware) which inaddition is becoming more targeted, persistent and unknown.Malwares are able to disturb computer operations and gatherpersonal information of the system’s owner without raisingattention [1] [2]. When it comes to analyzing methods, thereare two approaches for the identification of malware. On theone hand, software can be analyzed without actually executingit, which is called static analysis. Obfuscation techniquesused by malware developers can render this task virtuallyimpossible [3]. Dynamic analysis observes actions performedby potential malware while it is being executed in a protectedenvironment. More precisely, analysts observe execution tracesof programs; for the sake of simplicity malware analystsoften reduce these traces to function calls, neglecting all othersimple machine instructions. Therefore, dynamic analysis isalso known as behavior-based analysis [3].
In behavior-based analysis malware analysts have to dealwith large amounts of data, which can lead to a very complexanalysis process: a trace of a malware sample may oftencomprise thousands of system calls and analysts have to findsimilar system call patterns within thousands of such traces.In order to simplify this process, analysts need automatedapproaches for finding such patterns and categorizing them aspotentially harmful or harmless. However, such identificationof patterns relies heavily on the analysts knowledge, whichmakes it impossible to automate this process completely[4]. These patterns of behaviors can be defined as a formal
language using formal grammars (syntactic pattern recognition[5], [6] or for more details [7]). The task of the analyst isthe development of a set of grammar rules incorporating theirknowledge about (malicious) behaviors of malware samples.In this context, visual analytics (VA) is needed to supportthe analysts in integrating their knowledge. VA plays anessential role in supporting data analysis, since it combinesdata processing capabilities of computer systems with theknowledge and experience of users [8].
According to Keim et al. [9], VA also connects automatedanalysis techniques with interactive visualizations in order tocombine different types of information and obtain understand-ing from complex data sets. To make reasoning out of thismassive amount of data, it is necessary to include ”implicit”[10] or ”tacit” [11] knowledge in the analysis process. Byexternalizing the implicit/tacit knowledge of domain experts,it is possible to provide explicit knowledge in form of data,which is independent from the current user of the system.This extracted knowledge can subsequently be connectedthrough interactive visualization tools [11]. In addition to thesefindings, Lee et al. [12] stated that visualization is necessaryto analyze potential malware more effectively.
This paper provides a design study [13] dealing with theimplementation and evaluation of a separate Rule CreationArea (RCA) [14] into a Knowledge-Assisted Visual MalwareAnalaysis System (KAMAS) [15]. In order to meet qualitystandards, this paper follows a problem-oriented research ap-proach. In conjunction with this prototype, this means that thevisualization and implementation of the system is performedunder consideration of specific real-world problems defined bydomain experts [13]. Thus, the main objectives of this researchare:
• Clarify, why the implementation of a separate area forrule creation is necessary and how malware analysts canbenefit from it.
• Presenting the design and implementation of the RCAinto the KAMAS system with a detailed description ofall involved components and functionalities.
• Conducting an evaluation of the implemented system incooperation with malware analysis experts to proof theeffectiveness of the deployed functionalities.
• Reflection of the implemented functionalities under con-sideration of their evaluation by real world users and theresulting future research.
116

II. RELATED WORK AND BACKGROUND
Since there were no interactive visualization tools availablewhich cover all requirements for malware analysts, Wagneret al. [15] developed the KAMAS prototype. With KAMAS,analysts are able to categorize function call traces in terms oftheir potential harmfulness and store them into a knowledgedatabase (KDB). The KDB assists them in further observationand simplifies the analyzing process. In order to expand therange of functionalities and subsequently improve the effec-tiveness of KAMAS, Wagner et al. [16] suggested an interfacedesign for the RCA [14]. The RCA allows the construction ofcompletely new rules by using single system and API calls inthe same structure as generated by the sequitur algorithm [17].These rules can subsequently be stored in the KDB.Knowledge Generation in VA: Thomas and Cook [18] defineVA as approach to gain knowledge from massive, dynamic,ambiguous, and often conflicting data. Based on the researchby Sacha et al. [19] following findings can be determined:VA uses data to draw conclusions on a specific applicationfield and gain insights into the problem domain. On the onehand, there is the combination of perceptive skills followingthe capability of drawing conclusions by humans. On theother hand, there is the computing and data storage capabilityof machines. Both of these aspects can be combined invisual representations. Interactions with VA tools provide apossibility for analysts to detect patterns in their data, thusassisting them in verifying or falsifying their initial hypothesis.By clustering and classifying the found patterns, the outcomeof their exploration can be visualized.
According to Chen et al. [10], the aim of knowledge-assisted visualization is to automate reasoning about abstractedinformation from a set of data. Additionally, they also men-tioned that the field of knowledge-assisted visualization is stillin development, since the growing amount of data requiressystems to continuously adapt to these challenges. As stated byWang et al. [11], the nature of tacit knowledge can be definedas intimate and specialized. However, by using interactivevisualization it can be connected with explicit knowledge,which is processable by computers or can be stored in adatabase [11]. Recent research has focused even more onthe role of humans in this process. In order to deal withthe increasingly ambitious challenges in the field of VA,the philosophy has to shift from a ”human in the loop”philosophy to a ”human is the loop” viewpoint [20]. This newapproach focuses on recognizing the workflow of analysts andconsequently adapting interaction processes to the needs of theanalyst.Appliance of VA Techniques to Malware Analysis: Accord-ing to Alazab et al. [21], all executable programs have the aimto perform actions using API calls. The process of malwareanalysis involves the observation of system call sequencepatterns and the actions they cause. Both Alazab et al. [21] andMohaisen et al. [22] emphasize classification and clustering ofpatterns in terms of their maliciousness or benignity as a maintask for malware analysts. AMAL, a behavior-based malware
analysis system by Mohaisen et al. [22] is an example fora program, which is capable of fulfilling this task. Just likeKAMAS, it tries to tackle shortcomings of existing systemsby combining methodologies of static and behavior-basedapproaches. By running malware samples in a virtualizedenvironment, the system collects data which is subsequentlyused for automated classifying and clustering of samples intodifferent malware families. However, AMAL does not providean interactive user interface, nor does it provide the possibilityto integrate externalized expert knowledge into the analysisprocess. Another project with similar approach to KAMAS isthe visualization tool SEEM [23], which enables analysts tocompare large sets of malware and their associated attributes.
As mentioned in Section I, supportive visualization isneeded in order to provide a more efficient approach ofanalyzing potential malware samples [12]. In their state ofthe art report on visualization systems in the field of malwareanalysis, Wagner et al. [24] concluded that future systemsshould provide a compound of classification overviews forcomparison and detail views for individual analysis.
III. METHOD
In general, this paper is a design study following thedesign principles/ideas proposed in [13], which is described asproblem-orientated research approach. This includes a problemdefinition, the design and implementation of a visualizationsystem which solves the problem, the evaluation of the proto-type as well as a reflection about lessons learned and possibleimprovements [13]. The problem was defined by Wagner etal. [16] in their design study, which addresses the need forthe implementation of a separate area for rule creation in theKAMAS prototype. All scientific publications directly relatedto KAMAS [4] [16] [15] [24] served as a basis for the generalunderstanding of the prototype and its background.Requirements & Features: The functionalities and interfacedesign of the RCA were designed according to the rule build-ing screen prototype ’CallNet’ presented in [16]. Furthermore,’CallNet’ and its desired functionalities were already reviewedby usability experts. In order to ensure compatibility with thesequitur algorithm [17], the extracted knowledge has to bestored in a rule-based interface and structure. Based on thetask definitions and the outcome of the design study, followingkey requirements (R) for the RCA can be defined:
R1 Consistency: To ensure an effective usage of the userinterface, it is necessary to provide consistent interac-tion techniques throughout the whole system. In thisspecific case, the input data for the RCA originatesfrom another interface section of the program. There-fore, the interaction visualization should be related tothe movement of data, e.g. ’Drag & Drop’ operations.
R2 Creation Support: The amount of data offered by thissystem is particularly high. Thus, additional supportin the process of rule creation is important. Bygiving the analyst additional interaction possibilities,e.g. automatically validated suggestions for singlecalls, the rule creation process can be accelerated.
Rule Creation in a Knowledge-assisted Visual Analytics Prototype for Malware Analysis
117

Moreover the interface has to provide the possibilityto switch the highlighting of these calls based onhigher or lower frequency to support creating ruleswith individual preferences.
R3 Editing Options: The process of rule creation requiresthe system to allow the editing of rules at any timeand to offer a quick way to restart the process. Asa consequence, the analyst has to be able to reorderand delete single calls of the dropped call sequenceand to reset the whole RCA to its default state.
R4 Knowledge Extraction and Extension: Finally, thenewly created rule should be used to extend thespectrum of computerized knowledge in the system.Therefore, it is necessary to offer the possibilityof moving rules from the RCA to the KDB. Byimplementing this functionality, the knowledge gen-eration loop (see Figure 2) can be expanded, whichshould subsequently improve the effectiveness of theanalysis process.
The features of the RCA were implemented according tothe defined key requirements. In general, the design andimplementation followed a user-centered design process [25].During the development process, continuous exchange withresearchers/developers of the KAMAS prototype was per-formed. Thus, it was possible to adjust requirements anddiscuss alternative solutions.Evaluation: In order to evaluate the implemented featuresof the prototype, two malware analysis experts reviewed thesystem in the course of a semi-structured, qualitative user test.During this test, both experts had to solve different tasks,which occur in the rule creation process. The results weredocumented by written notes and afterwards categorized basedon their importance. Afterwards, the results of the evaluationwere summarized and rated in a list inspired by Nielsen’sseverity rating procedure [26]. With these ratings, it waspossible to provide a clear overview of the most importantfindings as well as potentially negligible aspects.
IV. DESIGN AND IMPLEMENTATION
The design and functionalities of the RCA are based onthe ’CallNet’ prototype [16], which allows users to createrules from scratch with system and API calls. The KAMASprototype and its implemented functionalities developed byWagner et al. [15] served as a basis to expand the prototype’sspectrum of features. The implementation resulted in therealization of the RCA (see Figure 1), which was achievedusing the programming language Java.Call Exploration: The ’Call Exploration’ table (see Fig-ure 1.3) provides a list of all system and API calls of the loadedfile showing their occurrence in the file, the name and the IDof the call. In addition to the already available functionalitiesfrom [15], the possibility to drag single calls from the tableto the RCA was implemented.KDB: The KDB (see Figure 1.1) offers the possibility tosave and organize rules in tree structure based conceptsvisualized as folder structure. Furthermore, the analyst can
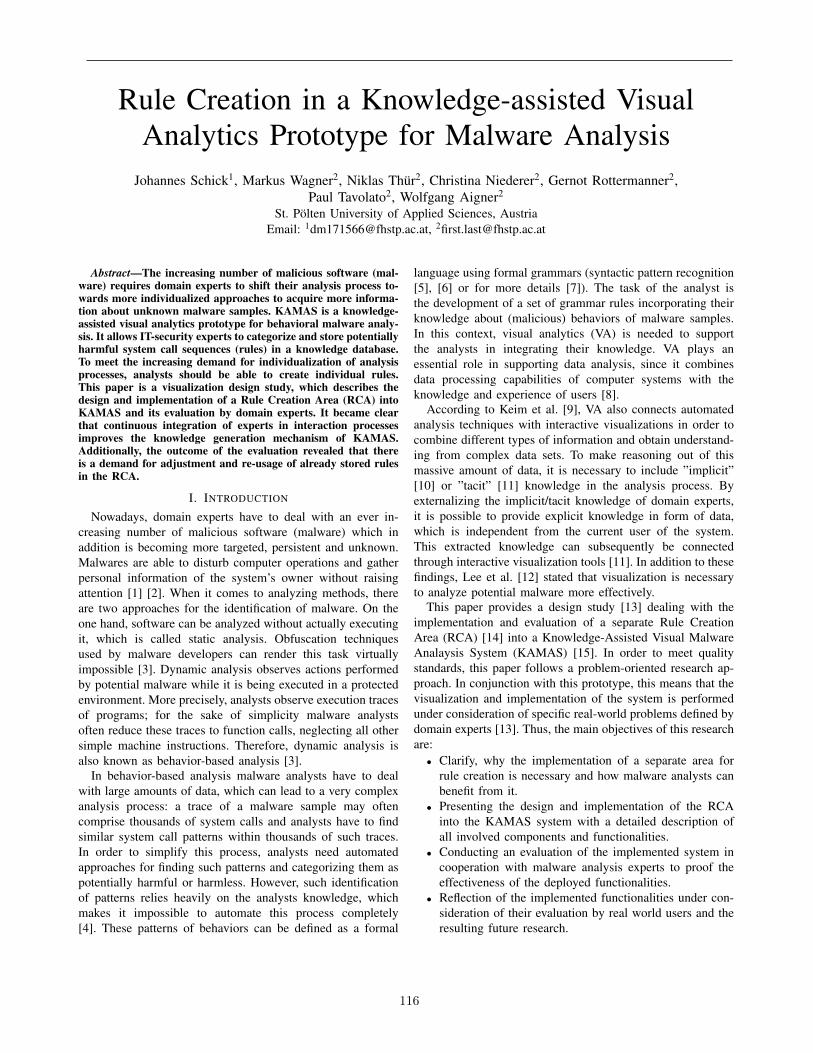
access information of already stored rules like the name, theassigned concept and the calls it consists of.RCA in General: The RCA (see Figure 1.2) generally consistsof three main areas. First, the analyst can drop single calls,which he previously selected and dragged from the ’CallExploration’ table into the Rule Creation Table (RCT) (seeFigure 1.2.b). Secondly, above and below the RCT, the inter-face provides suggestions for single calls which occur eitherbefore (see Figure 1.2.a) or after (see Figure 1.2.c) the droppedsystem call sequence. At last, on the bottom of the RCA theanalyst has the possibility to reset the whole RCA to its defaultstate (see Figure 1.2.d) and to switch the highlighting of thecall suggestions (see Figure 1.2.e).Rule Creation Table in the RCA: After adding the first callfrom the ’Call Exploration’ table to the RCT, an additionalrow gets added on the top of the table. This row makesit possible to drag the newly created rule (which containsall single calls inside the RCT) and add it to the KDB.Furthermore, the number in the second column of the RCTrepresents the occurrence of the newly created rule in theloaded file. If there is a need to reorder calls inside the RCT,this can be achieved by simply dragging a single call and moveit to the desired position. The original call from the desiredposition then switches position with the dragged call. Also,single calls can be deleted from the RCT by right clicking onthe desired call and using the ’Delete’ pop-up. It must alsobe pointed out that every interaction performed in the RCTaffects the occurrence column and call suggestions, since thesecomponents depend on the values inside the RCT. Even thougha rule usually can contain 1 to n calls, the maximum numberof calls inside the RCT was limited to eight calls in order toprovide enough space for the other areas in the RCA.Call Suggestions in the RCA: Above and below the RCT,the interface offers suggestions for calls, which can be draggedand dropped into the RCT. The suggestions above (see Fig-ure 1.2.a) represent calls from the loaded file which occurbefore system call sequences with the same structure as theone inside the RCT, whereas the calls below (see Figure 1.2.c)represent calls which occur after the currently dropped systemcall sequence. Moreover, the font size of the call suggestionsvaries depending on their occurrence. By default, more fre-quent single calls are displayed with a bigger font. If a singlecall appears in multiple system call sequences of the loadedfile, the font size increases by one for every found similarsingle call. Thus, every call suggestion displayed in the userinterface is unique and the analyst gets a better overview ofwhich single calls are more or less frequent.Control Buttons in the RCA: Provided that the RCT containsat least one single call, a ’Reset’ button (see Figure 1.2.d) isavailable at the bottom of the RCA. This button offers thepossibility to set the whole area back to its default state. Thesecond button (see Figure 1.2.e) is responsible for handling thehighlighting of the call suggestions and is only visible whenthe currently dropped system call sequence offers suggestions.With the use of this button, the analyst can switch betweenhighlighting more or less frequent call suggestions.
Rule Creation in a Knowledge-assisted Visual Analytics Prototype for Malware Analysis
118
Fig. 1. User interface of the KAMAS prototype with activated RCA. 1) The KDB where newly created rules can be stored. 2) The RCA including the callsuggestions before (2.a) and after (2.c) the currently dropped call sequence, the rule creation table (2.b), the button to reset the whole RCA (2.d) and thebutton to change the call suggestion size according to their occurrence (2.e). 3) The ’Call Exploration’ table with a list of all single calls included in thecurrently loaded file.
Filter Pipelines for Call Suggestions: Depending on thecurrently dropped system call sequence, the call suggestionsget validated through one general and two separated filteraction pipelines. The general pipeline loops through all rulesof the loaded file and eliminates every rule which does notinclude the exact same system call sequence as in the RCT.In the next step, the remaining rules serve as input data forthe call suggestion validation which is finally displayed aboveand below the RCT. The first pipeline loops through everyremaining rule and checks if there is another single call beforethe first one of the sequence. If so, this call is displayed ascall suggestion above the RCT in the user interface. The sameapplies to the second pipeline, except that it extracts the singlecall after the last one of the sequence which is subsequentlydisplayed below the RCT.Usage Scenario: First, the analyst loads a new file into thesystem and KAMAS automatically provides an overview of allincluded single calls in the ’Call Explorer’ (see Figure 1.3) aswell as all preprocessed rules in the ’Rule Explorer’. The ’RuleExplorer’ serves as a graphical summary and exploration areawith colored highlighting of all included rules depending onthe current knowledge state of the KDB. If the analyst wantsto store one of these rules in KDB, this can either be achievedby selecting the full rule or just specific parts of this rule anddrag and dropping it to the KDB. Further functionalities linkedto the ’Rule Explorer’ are described by Wagner et al. [15]. Inthe initial version of the KAMAS prototype, the rule storing
process was limited to use either preprocessed rules or theirincluded single calls. Thus, the analyst was not able to changepatterns like e.g. the order of included single calls inside arule. Following the implementation of the RCA, the analystcan now switch to the ’Rule Creation’ screen and create ownrules from scratch. In the beginning, the analyst can exploreand select specific calls from the single call table and dragthem into the RCA. After the desired calls were added to RCT,the interface offers suggestions for calls which occur beforeand after the currently dropped call sequence. These calls canalso be used in the further creation process by dragging theminto the RCT. Additionally, it is possible to highlight eithermore or less frequent call suggestions by increasing their fontsize. This can be achieved by clicking the ’Enlarge less/morefrequent calls’ button. The number next to the calls inside theRCT represents the occurrence of the currently dropped rulein the analysis file. During the whole process, the analyst canadjust the created rule by reordering calls inside the RCT viadrag and drop or deleting unnecessary calls via right clickingon the desired call and using the ’Delete’ pop-up. Finally,the rule can be dragged at the top of the RCT and movedto the KDB. Afterwards the RCA can be reset to its defaultstate by clicking the ’Reset Rule Creation Area’ button. Theanalyst can now return to the ’Rule Exploration’ screen andcontinue the analysis with an updated KDB containing thenewly created rule.
Rule Creation in a Knowledge-assisted Visual Analytics Prototype for Malware Analysis
119

Fig. 2. Comparison of the Knowledge Generation Loop before and after the implementation of the RCA. Left: Knowledge Generation Loop of the initialKAMAS prototype visualized by Wagner et al. [15]. Right: Knowledge Generation Loop including rule creation process. The range of possibilities for theanalyst has increased.
V. THE KNOWLEDGE GENERATION LOOP
Initial Knowledge Generation Loop: Wagner et al. [15]provided an overview of the knowledge generation process inthe KAMAS system (see Figure 2 on the left). It highlights theKDB, which contains all known rules and the data explorationthrough the analysts as central elements in the knowledgegeneration loop. By extending the KDB with new rules, thesystem automatically revalidates the highlighting in the ’RuleExploration’ area depending on the new knowledge state. Therules used for the extension of the KDB are automaticallygenerated and displayed in the ’Rule Exploration’ table.Extension of Knowledge Generation Loop: With the im-plementation of the RCA, the possibilities for knowledgegeneration have expanded. The usage scenario now includesthe following process (see Figure 2 on the right): The analystcan load a new file, which is going to be checked automaticallyagainst the stored data in the KDB (see Figure 2.1). After-wards, the system provides a visualization of the loaded rulesin comparison to its current knowledge state in the system(see Figure 2.2). In contrast to the initial KAMAS prototype,the analyst can now choose between two different options toexpand the KDB. The analyst can either use automaticallygenerated rules from the ’Rule Exploration’ table (see Fig-ure 2.3 and Figure 2.7), or create own rules, which can includepresently unknown sequences based on the system’s currentstate (see Figure 2.8 for the creation and Figure 2.9 for theknowledge generation). As a result, the KAMAS prototype isnot limited to rely on automatically generated rules anymore,but rather offers more flexibility by providing an opportunityto create rules from scratch based on individual needs.
VI. EVALUATION
As third step in this design study [13], it was necessary toevaluate the newly implemented functionalities with real worldusers. Therefore, a formative usability evaluation including ausability test with malware analysis experts was conducted andfinally compressed to the most important findings.
A. Method
TABLE IOVERVIEW OF THE DOMAIN EXPERTS WHO PARTICIPATED IN THE USER
TEST. (E = EXPERT)
Person Age Gender In field Experience EducationE1 30-39 male 5 years expert MScE2 60-69 male 6 years advanced PhD
Participants: For this user test, two malware analysis experts(see Table I) were invited to test and comment all function-alities of the RCA. Both experts had more than five years ofexperience in this field and were also part of previous KAMAScase studies. Therefore, both of them were familiar with thegeneral appearance and functionality of the user interface.Design and Procedure: In the beginning, the experts receiveda brief overview about the main functionalities of the RCA. Inorder to provide a realistic testing environment, an executiontrace sample was provided and loaded into the system. Then,the experts were asked to test each possible feature and tospeak out their thoughts on the user interface.Apparatus and Materials: Both case studies were performedin a seminar room. To guarantee the testing of all possiblefeatures, a questionnaire based on the functionalities of the
Rule Creation in a Knowledge-assisted Visual Analytics Prototype for Malware Analysis
120

TABLE IIOVERVIEW OF EVALUATED FEATURE REQUESTS, SEVERITIES AND EFFORT (FR: 1: = NICE TO HAVE, 2: = GOOD FEATURE, 3: = ENHANCES USABILITY;
SE: 0: = NO PROBLEM, 1: = COSMETIC PROBLEM, 2: = MINOR PROBLEM, 3: = MAJOR PROBLEM, 4: = CATASTROPHE; EFFORT: 1: = MIN, 2: = AVERAGE,3: = MAX).
Description Feature Request (FR) Severity (SE) Effort
Call Exploration: Change selection mode to single selection 2 3 1Call Exploration: Display only the last part of single call names 2 3 1RCT: Provide a clear visualization of the drop location 3 3 2RCT: Add arrow symbols to visualize the possibility of reordering 1 1 1RCT: Display only the last part of single call names 2 3 1Enlarge-Button: Change ’Enlarge’ to ’Highlight’ 1 1 1Call Suggestions: Display current highlighting status in separate label 1 1 1Call Suggestions: Change ’before/after’ to ’which appear before/after’ 1 1 1Call Suggestions: Change ’scheme’ to ’sequence’ 1 1 1KDB: Implement possibility to use known rules in the RCA 3 3 3RCA: Display name of rule if it is already stored in the KDB 2 3 2RCA: Implement a separate save button 1 2 2Connection lines: Use logical elements 1 0 2
system was provided. The comments stated by the expertswere documented by notes on the printed questionnaire.
B. Results
Moving Single Calls to the RCT: E2 mentioned that itwas difficult to find the desired calls, since the names of thedisplayed single calls were not fully readable due to lack ofspace in the ’Call Exploration’ table. He suggested to displayonly the last part of the names because this part mostlydiffers from other single call names. Both of them showeduncertainty regarding whether if it is possible to move morethan one call at the same time or not. Consequently, theywere not sure if their desired calls were correctly droppedinto the RCT. E2 suggested to change the selection mode ofthe ’Call Exploration’ table to single selection when the RCAis activated in order to avoid misconceptions.Moving Call Suggestions to the RCT: While they tried tomove the calls to the RCT, both of them were confused by thedrop location inside the RCT. They stated that they were notable to recognize a drop scheme, which led to the assumptionthat the calls get randomly added to the table.Reordering of Calls Inside the RCT: E1 did not recognizethe possibility of reordering in the first place and suggested toadd arrow symbols near the table cells of the RCT in order tomake it more clear. Furthermore, E2 mentioned that long callnames could get cropped off inside the table cells. Thus, thereordering of multiple calls with the same structure could bedifficult to recognize.Change Highlighting of Call Suggestions: Both experts hadproblems understanding the naming convention of the button.Since the word ’Enlarge’ is present in both versions of thisbutton, E2 expected the call suggestions displayed above andbelow the RCT to extend to the follow-up call. Furthermore,he suggested to change the description linked to the callsuggestions to ’Calls which appear before/after dropped callsequence’ to clarify the meaning. E1 added to show the currenthighlighting state in a separate label to provide a more clearappearance for the user.
Deletion of Single Calls and Reset of RCA: Both expertswere able to delete single calls from the RCT and reset of thewhole RCA to its default state without any uncertainty.Adding Created Rule to KDB: Both experts expressed theirwish for a possibility to drag rules from the KDB into theRCA. Additionally, the RCA should display the name in alabel when editing an already created rule. In order to providean alternative for the drag and drop approach, E1 suggestedto implement a separate save button for the storing of rulesinto the KDB.General Exploration: Both experts were pleased with thegeneral appearance of the user interface. They found the func-tionalities to be valuable and the interface easy to understand.Furthermore, the simplicity of the user interface was ratedpositively.
C. Rating
Based on the experts’ comments, the exploration resultswere combined and rated in a list of the most important issues(see Table II). The rating procedure in this list is inspiredby Nielsen’s severity ratings [26]. It includes a description ofthe issue, feature requests (FR), severities (SE) as well as theassociated effort for the solution of the issue. The conductedrating is illustrated in Table II.Summary: The conducted evaluation showed that the im-plemented functionalities were well received by the domainexperts, although there are still certain improvements to con-sider for the future. By rating found issues and suggestedimprovements (see Table II), it was possible to determinemajor areas for further development of the current prototype.
VII. LIMITATIONS
Following the evaluation by malware analysis experts, cer-tain limitations in the scope of functionalities for this prototypecan be determined:Adjustment of Stored Rules: This prototype does not providea possibility to drag already stored rules from the KDB intothe RCA. However, the workflow of malware analysts alsoincludes the manual adaption of already found rules [4]. With
Rule Creation in a Knowledge-assisted Visual Analytics Prototype for Malware Analysis
121

the implementation of this feature, it would be possible tocover all essential needs of malware analysts and subsequentlyimprove the analysis process even more.Displaying of Rule Names: The process of rule creation canalso lead to a situation, where analysts are constructing rules,which are already stored in the KDB. However, the RCA is notable to recognize already known rules and consequently doesnot provide the rule name in the user interface. By enablingthe RCA to check the currently constructed rule against theKDB and subsequently recognize known rules, the workflowof analysts can be enhanced by e.g. preventing the storage ofduplicates in the KDB.Creating Rules with More than Eight Single Calls: TheRCA offers the possibility to create rules with up to eightsingle calls. Nevertheless, rules can contain much more singlecalls in reality. Since the RCA also provides call suggestionsabove and below the RCT, the capacity of space in the RCA israther limited. To overcome this, for example Focus+Contextand/or aggregation techniques could be applied.Drop Location Visualization: As mentioned in Section VI,the RCA does not provide a visual preview of the currentlydragged single call in the RCT. Since both experts werestruggling with this issue, the implementation of a visualpreview of the dragged single call would have enormouspotential for improving the quality of the user interface.
VIII. REFLECTION AND CONCLUSION
In order to complete the methodology of Sedlmair et al.[13], this section focuses on the reflection of the combinedresults emerging from the design and implementation of theprototype and its evaluation by real world users. The require-ments (R1 - R4) described in Section III were omnipresentduring all steps in this design study and serve as point ofreference for the following reflection.R1 Consistency: In order to stick to the defined requirements,drag and drop operations served as the major interactiontechnique in this prototype. This involves the addition of singlecalls and call suggestions to the RCT, the reordering of callsinside the RCT as well as the storing of the created rule in theKDB. Both analysts were comfortable with the handling of thegiven interaction possibilities. However, the evaluation showedthat additional visualization is needed to make the outcome ofdrag and drop operations fully transparent.R2 Creation Support: As mentioned in the beginning, ana-lysts have to deal with a large amount of data during the explo-ration process. Therefore, the implemented prototype providescall suggestions to accelerate and simplify the rule creationprocess. Based on the currently dropped call sequence, thepreviously described filter pipeline (see Section IV) validatesthe displayed call suggestions automatically. Additionally, theprototype offers a possibility to highlight more or less fre-quent call suggestions, which assists analysts in their decisionmaking process.R3 Editing Options: To ensure editability during the rulecreation process, the prototype provides possibilities to deleteand reorder single calls in the RCT as well as a button to restart
the whole process from scratch. A particularly interestingoutcome of the evaluation was that both experts expressed theirwish for reusing/adjusting already stored rules in the RCA.This aspect was not taken into account during the developmentof the current prototype version. After the evaluation, it canbe considered as highly recommendable to implement thisfeature.R4 Knowledge Extraction and Extension: The possibility todrag the newly created rule and store it in the KDB was alsowell received by the experts. As mentioned in Section IV,the implementation of this feature expands the knowledgegeneration loop (see Figure 2). Analysts are now more flexiblewhen it comes to the extension of the KDB. By providingthe possibility to create individual rules based on the expertscurrent state of knowledge, the prototype shifts towards thein the beginning mentioned ”human is the loop” philosophy[20]. As a result, the overall knowledge generation process isgetting more individualized and the following analysis processcan draw upon different expertises.Lessons Learned: In the course of this design study, it becameclear that the continuous integration of domain experts ininteraction processes enhances the efficiency of the analysisprocedure. As the number of malware families is growing,higher importance has to be attached to the integration ofexpert knowledge [24]. At the same time, VA techniques haveto adapt to the need for more human integration in the analysisprocess [20]. With the implementation of the RCA based onthe interface design prototype by Wagner et al. [16], bothpreviously mentioned challenges were tackled. In cooperationwith malware analysis experts, the implemented prototype wasproven to enhance the knowledge generation process and tohandle the need for increasing focus on human interactionsin VA. However, the evaluation also revealed that interactionvisualization is a key factor for providing a satisfying solu-tion. Additionally, it showed that there are still possibilitiesto improve the knowledge generation process. Subsequently,humans could be even more integrated into the previouslymentioned knowledge generation loop. In this system, theknowledge is stored based on the same rule structure as theyare generated by sequitur [17]. But the storage of knowledgedepends on the structure of the underlying data. Thus, alsovalue ranges or process structures can be used.Future Work: The usage of already stored rules for rulecreation can be seen as the next logical step for furtherdevelopment of the presented prototype. Additionally, theenhancement of interaction visualization should round offthe overall appearance and usability of the user interface.In general, further exchange with malware analysis expertsshould be taken into account in order to stay on track with thedevelopments in the scene.
ACKNOWLEDGMENTS
This work was supported by the Austrian Science Fund(FWF) via the “KAVA-Time” project (P25489-N23). Wewould also like to thank all focus group members and testparticipants who have agreed to volunteer in this project.
Rule Creation in a Knowledge-assisted Visual Analytics Prototype for Malware Analysis
122
REFERENCES
[1] T. Micro, “Addressing big data security challenges: The right tools forsmart protection,” US: Trend Micro, 2012.
[2] E. Gandotra, D. Bansal, and S. Sofat, “Malware Analysis and Classi-fication: A Survey,” Journal of Information Security, vol. 05, no. 02,p. 56, 2014.
[3] M. Egele, T. Scholte, E. Kirda, and C. Kruegel, “A Survey on AutomatedDynamic Malware-analysis Techniques and Tools,” ACM ComputingSurveys, vol. 44, no. 2, pp. 6:1–6:42, 2008.
[4] M. Wagner, W. Aigner, A. Rind, H. Dornhackl, K. Kadletz, R. Luh,and P. Tavolato, “Problem Characterization and Abstraction for VisualAnalytics in Behavior-based Malware Pattern Analysis,” in Proceedingsof the Eleventh Workshop on Visualization for Cyber Security. ACM,2014, pp. 9–16.
[5] K. Fu, Syntactic pattern recognition and applications, ser. Prentice-Halladvanced reference series: Computer science. Prentice-Hall, 1982.
[6] R. Gonzalez and M. Thomason, Syntactic pattern recognition: an intro-duction. Addison-Wesley Publishing Company,Reading, MA, 1978.
[7] H. Dornhackl, K. Kadletz, R. Luh, and P. Tavolato, “Malicious BehaviorPatterns,” in IEEE International Symposium on Service Oriented SystemEngineering, 2014, pp. 384–389.
[8] E. Kandogan and U. Engelke, “Agile Visual Analytics in Data ScienceSystems,” in IEEE International Conference on High PerformanceComputing and Communications; IEEE International Conference onSmart City; IEEE International Conference on Data Science and Systems(HPCC/SmartCity/DSS), 2016, pp. 1512–1519.
[9] D. Keim, J. Kohlhammer, G. Ellis, and F. Mansmann, Mastering theInformation Age Solving Problems with Visual Analytics. EurographicsAssociation, 2010.
[10] M. Chen, D. Ebert, H. Hagen, R. S. Laramee, R. v. Liere, K. L. Ma,W. Ribarsky, G. Scheuermann, and D. Silver, “Data, Information, andKnowledge in Visualization,” IEEE Computer Graphics and Applica-tions, vol. 29, no. 1, pp. 12–19, 2009.
[11] X. Wang, D. H. Jeong, W. Dou, S.-W. Lee, W. Ribarsky, and R. Chang,“Defining and applying knowledge conversion processes to a visualanalytics system,” Computers & Graphics, vol. 33, no. 5, pp. 616–623,2009.
[12] D. Lee, I. S. Song, K. J. Kim, and J. h. Jeong, “A Study on MaliciousCodes Pattern Analysis Using Visualization,” in International Confer-ence on Information Science and Applications, 2011, pp. 1–5.
[13] M. Sedlmair, M. Meyer, and T. Munzner, “Design Study Methodology:Reflections from the Trenches and the Stacks,” IEEE Transactions onVisualization and Computer Graphics, vol. 18, no. 12, pp. 2431–2440,2012.
[14] J. Schick, M. Wagner, N. Thur, C. Niederer, G. Rottermanner,P. Tavolato, and W. Aigner, “Supporting knowledge-assisted rule cre-ation in a behavior-based malware analysis prototype,” in Poster of the14th Workshop on Visualization for Cyber Security (VizSec), Phoenix,Arizona, USA, 2017.
[15] M. Wagner, A. Rind, N. Thur, and W. Aigner, “A knowledge-assistedvisual malware analysis system: Design, validation, and reflection ofkamas,” Computers & Security, vol. 67, pp. 1–15, 2017.
[16] M. Wagner, A. Rind, G. Rottermanner, C. Niederer, and W. Aigner,“Knowledge-assisted rule building for malware analysis,” in Proceedingsof the 10th Forschungsforum der osterreichischen Fachhochschulen, FHdes BFI Wien. Vienna, Austria: FH des BFI Wien, 2016.
[17] R. Luh, G. Schramm, M. Wagner, and S. Schrittwieser, “Sequitur-basedinference and analysis framework for malicious system behavior,” inWorkshop for Formal Methods in Software Engineering (ForSE), 3rdInternational Conference on Information Systems Security and Privacy(ICISSP), SCITEPRESS Digital Library. Porto, Portugal: SCITEPRESSDigital Library, 2017, pp. 632–643.
[18] J. J. Thomas and K. A. Cook, “A visual analytics agenda,” IEEEComputer Graphics and Applications, vol. 26, no. 1, pp. 10–13, 2006.
[19] D. Sacha, A. Stoffel, F. Stoffel, B. C. Kwon, G. Ellis, and D. A. Keim,“Knowledge Generation Model for Visual Analytics,” IEEE Transactionson Visualization and Computer Graphics, vol. 20, no. 12, pp. 1604–1613, 2014.
[20] A. Endert, M. S. Hossain, N. Ramakrishnan, C. North, P. Fiaux,and C. Andrews, “The human is the loop: new directions for visualanalytics,” Journal of Intelligent Information Systems, vol. 43, no. 3,pp. 411–435, 2014.
[21] M. Alazab, S. Venkataraman, and P. Watters, “Towards UnderstandingMalware Behaviour by the Extraction of API Calls,” in 2010 SecondCybercrime and Trustworthy Computing Workshop, 2010, pp. 52–59.
[22] A. Mohaisen, O. Alrawi, and M. Mohaisen, “AMAL: High-fidelity,behavior-based automated malware analysis and classification,” Com-puters & Security, vol. 52, pp. 251–266, 2015.
[23] R. Gove, J. Saxe, S. Gold, A. Long, and G. Bergamo, “SEEM: AScalable Visualization for Comparing Multiple Large Sets of Attributesfor Malware Analysis,” in Proceedings of the Eleventh Workshop onVisualization for Cyber Security, ser. VizSec ’14. New York, NY,USA: ACM, 2014, pp. 72–79.
[24] M. Wagner, F. Fischer, R. Luh, A. Haberson, A. Rind, D. A. Keim, andW. Aigner, “A survey of visualization systems for malware analysis,” inEurographics Conference on Visualization (EuroVis) - STARs, R. Borgo,F. Ganovelli, and I. Viola, Eds. Cagliari (Sardinia / Italy): TheEurographics Association, 2015, pp. 105–125.
[25] H. Sharp, Y. Rogers, and J. Preece, Interaction Design: Beyond HumanComputer Interaction. John Wiley & Sons, 2007.
[26] J. Nielsen, Usability Engineering. Morgan Kaufmann Publishers Inc.,1993.
Rule Creation in a Knowledge-assisted Visual Analytics Prototype for Malware Analysis
123