running head: motor proficiency of children in the uk 1eprints.leedsbeckett.ac.uk/2455/3/influences...
TRANSCRIPT

Running Head: Motor proficiency of children in the UK 1
Title:
Influences of gender and socioeconomic status on the motor proficiency of children in
the UK
Corresponding author:
Professor David Morley
Liverpool John Moores University, IM Marsh Campus, Barkhill Road, Aigburth, Liverpool,
L17 6BD, UK. Tel.: +44 (0)151 2315201 Email: [email protected]
Authors:
(1) David Morley ([email protected])
School of Education, Leisure and Sport Studies, Liverpool John Moores University,
Liverpool, UK
(2) Kevin Till ([email protected])
School of Sport, Leeds Beckett University, Leeds, UK
(3) Paul Ogilvie ([email protected])
School of Sport, Leeds Beckett University, Leeds, UK,
(4) Graham Turner ([email protected])
Department of Sport, Health and Nutrition, Leeds Trinity University, Leeds, UK
Word count: 3690
Abstract: 197 words
No. of tables: 3

Running Head: Motor proficiency of children in the UK 2
Abstract
As the development of movement skills are so crucial to a child's involvement in lifelong
physical activity and sport, the purpose of this study was to assess the motor proficiency of
children aged 4-7 years (range= 4.3-7.2 years), while considering gender and socioeconomic
status. 369 children (176 females, 193 males, aged = 5.96±0.57 years) were assessed for Fine
Motor Precision, Fine Motor Integration, Manual Dexterity, Bilateral Co-ordination, Balance,
Speed and Agility, Upper-Limb Co-ordination and Strength. The average standard score for
all participants was 44.4 ± 8.9, classifying the participants towards the lower end of the
average score. Multivariate analysis of covariance identified significant effects for gender
(p<0.001) and socioeconomic status (p<0.001). Females outperformed males for fine motor
skills and boys outperformed girls for catch and dribble gross motor skills. High
socioeconomic status significantly outperformed middle and / or low socioeconomic status
for total, fine and gross motor proficiency. Current motor proficiency of primary children
aged 4-7 years in the UK is just below average with differences evident between gender and
socioeconomic status. Teachers and sport coaches working with primary aged children should
concentrate on the development of movement skills, while considering differences between
genders and socioeconomic status.
Keywords: motor proficiency, children, gender, socioeconomic status

Running Head: Motor proficiency of children in the UK 3
1. Introduction
Children's ability to perform movement skills develops at a prolific rate in the early
years as they begin to acquire, refine and develop a range of gross and fine movement skills
(Gallahue, Ozmun & Goodway, 2012). The appropriate development of movement skills is
regarded as a crucial platform for a child’s participation in lifelong physical activity (Barnett
et al., 2009), although the exact nature of this relationship has been contested (Lai et al.,
2014). Furthermore, Seefeldt (1980) hypothesised that failure to develop a certain level of
movement competence could result in a motor proficiency barrier, leading to a child's
exclusion from a range of physical activities.
The development of reliable and validated tools that assess motor proficiency (the
specific abilities upon which performance is built, e.g. agility, balance, co-ordination, running
speed) has formed a cornerstone of motor development research for many decades. In most
cases, motor proficiency assessment has involved the completion of tasks by participants and
assessed in comparison to norm-referenced (compared to a normative group) quantifiable
scores, or criterion-referenced against a set of pre-determined criteria (Cools et al., 2008).
Motor proficiency assessments are predominantly developed and validated for assessing
children with motor impairments, suggesting that such assessments are of motor deficiency,
rather than proficiency (Haywood & Getchell, 2005). Such assessments are also used as a
way of measuring the impact of an intervention, predominantly involving a focus on
improving children's movement competence and/or physical activity, on children's motor
proficiency (Kirk & Rhodes, 2011).
The effect of gender on motor proficiency has been raised, with studies suggesting
that girls develop fine motor skills at a faster rate than boys, and boys acquire certain gross
motor skills earlier than girls (Bala & Katic, 2009). In research using the same assessment
Running Head: Motor proficiency of children in the UK 4
methods as used in this study, South African boys demonstrated overall motor proficiency
superior to that of the girls and outperformed girls significantly in the upper limb and strength
skills sub-items (Pienaar & kemp, 2012). Paradoxically, other studies have reported no
gender differences in motor proficiency (Milanese et al., 2010), particularly in relation to
younger children (Du Toit & Pienaar, 2002; Shala, 2009; Venetsanou & Kambas, 2011).
What is less commonly reported in the research literature is the relationship between
motor proficiency and socioeconomic status (SES). A range of factors can be used to
determine the SES of children. For example, the UK uses Indices of Multiple Deprivation
(IMD) to measure SES within an area by postcode in terms of income, employment, health
and disability, education, skills and training, barriers to housing and services and the living
environment (Noble et al., 2007). Studies in Australia have used similar indices of SES to
explore FMS development of children in low-income communities, suggesting that such
children start school developmentally delayed in FMS development (Okely & Booth, 2004),
with early identification and targeted intervention seen as crucial in these environments if
children are to be given the chance to catch up (Roeber et al., 2012). Other studies in
Australia (Booth et al., 1999; Hardy et al., 2012) have also highlighted an association
between low movement competency and low SES, suggesting that Grade 2 (aged 7-8) and
Grade 4 (aged 9-10) children had not mastered FMS expected at their stage of development.
Whilst colleagues have presented some interesting findings from other Countries, this study
adds further to our understanding of the field in that participants are younger, aged 4-7 years,
and reside in a different country with its own social, political and cultural influences.
Moreover, there is a general tendency to explore the relationship between motor proficiency
and physical activity (Cohen et al., 2014) in understanding the influence of SES, rather than
motor proficiency itself. This is not without cause as SES has been identified as a determinant
Running Head: Motor proficiency of children in the UK 5
of physical activity that can predispose, enable or reinforce physical activity behavior
(Inchley et al., 2005).
There is a general shortage of research exploring motor proficiency of children in
Europe, particularly within early years environments and this leads to a lack of normative
data for cross-cultural uses of motor proficiency assessments (Cools et al., 2008).
Furthermore, an understanding of how the development of motor proficiency is different for
different children is even less understood. It is often assumed within schools that children
have the prerequisite mastery of movement skills to be able to participate in organized and
informal activities (Lubans et al., 2010). However, with findings suggesting that organized
physical activity within an institution such as a school is the most effective way to develop
movement (Logan et al., 2012), it is essential that we understand more about children's motor
proficiency within this specific environment.
In the UK, there is a paucity of research that assesses the motor proficiency of
children and determines the influences of gender and SES. Therefore, the purpose of this
study was to assess children’s motor proficiency across a number of primary schools
(children aged 4-7 years) in the UK and to subsequently compare children's motor
proficiency with gender and SES. Such findings would have serious implications for ensuring
every child has access to lifelong pathways for participation in physical activity, as well as
providing teachers and coaches appropriate information to be able to differentiate their
practice effectively.
2. Methods
The research formed part of the 'Start to Move' research project (Youth Sport Trust (YST)/
Bupa, 2014) and was funded by the YST/Bupa. The funding organizations played no role in
Running Head: Motor proficiency of children in the UK 6
any aspect of the research process and did not have the right to approve or disapprove of the
publication.
2.1 Participants
Participants consisted of children (n=369; females, n= 176; males, n= 193; aged 5.96 ±0.57
years) from 14 primary schools in the North of England. Schools were randomly invited from
a 'Start to Move' (Youth Sport Trust (YST)/ Bupa, 2014) course delegate list, with 100%
response rate. The ethics committee at Leeds Beckett University granted ethical approval.
The Head teacher, teachers and parents provided consent, with informed assent provided by
participants.
2.2 Procedure
Motor proficiency was assessed using the Bruininks-Oseretsky Test of Motor Proficiency,
Second Edition Brief Form (BOT-2 BF). All data collection was conducted during scheduled
physical education classes, providing as naturalistic a setting as possible, in each of the
participating schools. Gender, classified as male or female, and date of birth was collected for
each participant. In addition, SES was calculated for each participating school by collecting
United Kingdom's Indices of Multiple Deprivation (IMD). Each school's IMD was classified
as low = below 10,894, medium = 10,895-21,788 and high as above 21,789. Therefore, 'low'
IMD represented a lower SES than medium or high IMD. In the absence of individual
participant postcode data, the IMD of the school provided the 'next-best' source of a
participant's SES as a result of the use of 'catchment areas'. Catchment areas are determined
by a number of factors including distance from home to school and are predominantly used to
allocate places in oversubscribed schools. It can be assumed, given the existing population
explosion at this age range (Department for Education (DfE), 2014a), that the majority of
school places will be allocated to children within their catchment area (DfE, 2014b).
Running Head: Motor proficiency of children in the UK 7
2.3 Measures
The BOT-2 BF was selected for its suitability to assess children with and without motor
problems and strong test-retest reliability (Yoon et al., 2006), as well as being a validated
assessment instrument for motor proficiency for participants aged between 4-21 years of age
(Bruininks & Oseretsky, 2010). The BOT-2 BF consisted of 12 measures of motor
proficiency, which are categorized into sub-tests to assess fine motor precision, fine motor
integration, manual dexterity, bilateral co-ordination, balance, speed and agility, upper-limb
co-ordination and strength.
All the test items and sub-tests originated from the full assessment and were selected
for “clinical utility, content coverage, and ease of administration” (Bruininks & Oseretsky,
2010). Test stations were established to allow multiple participant assessments,
simultaneously. The child, guided by the examiner, determined whether a full or knee push-
up was the most appropriate assessment of strength based on the pupil's performance in other
areas, as per the BOT-2 BF manual (Bruininks & Oseretsky, 2010). A research team was
collectively trained to administer the test, primarily through jointly observing participant
performance of each element of the test. This training process was repeated until an analysis
of the inter-observer reliability produced an interclass correlation coefficient of 1.00 (n = 27;
95% CI = 0.99–0.1.00), indicating excellent agreement between the responder’s observations.
2.4 BOT-2 BF scoring
The standard score for each pupil was reached by converting the total points score (max = 72)
to the standard score, using the gender-specific norms provided (Bruininks & Oseretsky,
2010). This took the child’s age, gender and choice of strength assessment (push-up: full/
knee) into account when assessing their performance. Standard scores were classified as > 70
= well above average, 60-69 = above average, 41-59 = average, 31-40 = below average, and

Running Head: Motor proficiency of children in the UK 8
<30 = well below average. Individual fine motor proficiency (items 1-7) and sub-section
items (totals for fine motor precision/ integration (items 1-4) and bilateral co-ordination
(items 5-7)), and gross motor proficiency (items 8-12) were also calculated in relation to their
raw score.
2.5 Statistical analysis
Data are presented as means and standard deviation (SD). Initial descriptive scores were
calculated for the BOT-2 standard score and subsequent descriptive category. To compare the
motor proficiency between gender and SES, mean and standard deviation scores were
calculated for all elements of the BOT-2 motor proficiency assessment. A multivariate
analysis of covariance (MANCOVA) test, with chronological age applied as the covariate,
was used for comparisons between gender and SES. Chronological age was applied as a
covariate to control for the relationships between age and motor proficiency and progress on
the standardised scoring of the BOT-2, which doesn't class chronological age as a continuous
variable and this was included within individual and sub-section scores.
Bonferroni pairwise comparisons were conducted to examine univariate effects between
each dependent variable. All analyses were conducted with SPSS version 21.0 with
significance levels set at p<0.05. Effect sizes using partial eta squared (η2) were calculated
and interpreted as 0.01 = small, 0.06 = medium and 0.14 = large according to Cohen (1988).
3. Results
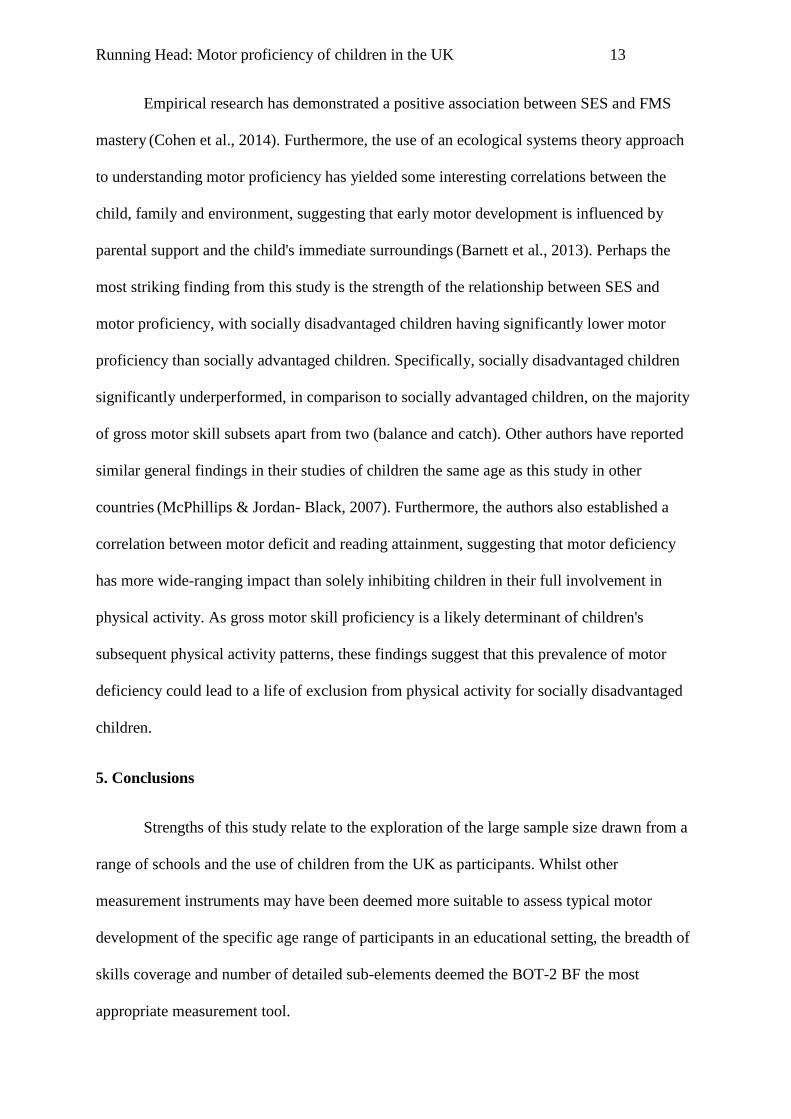
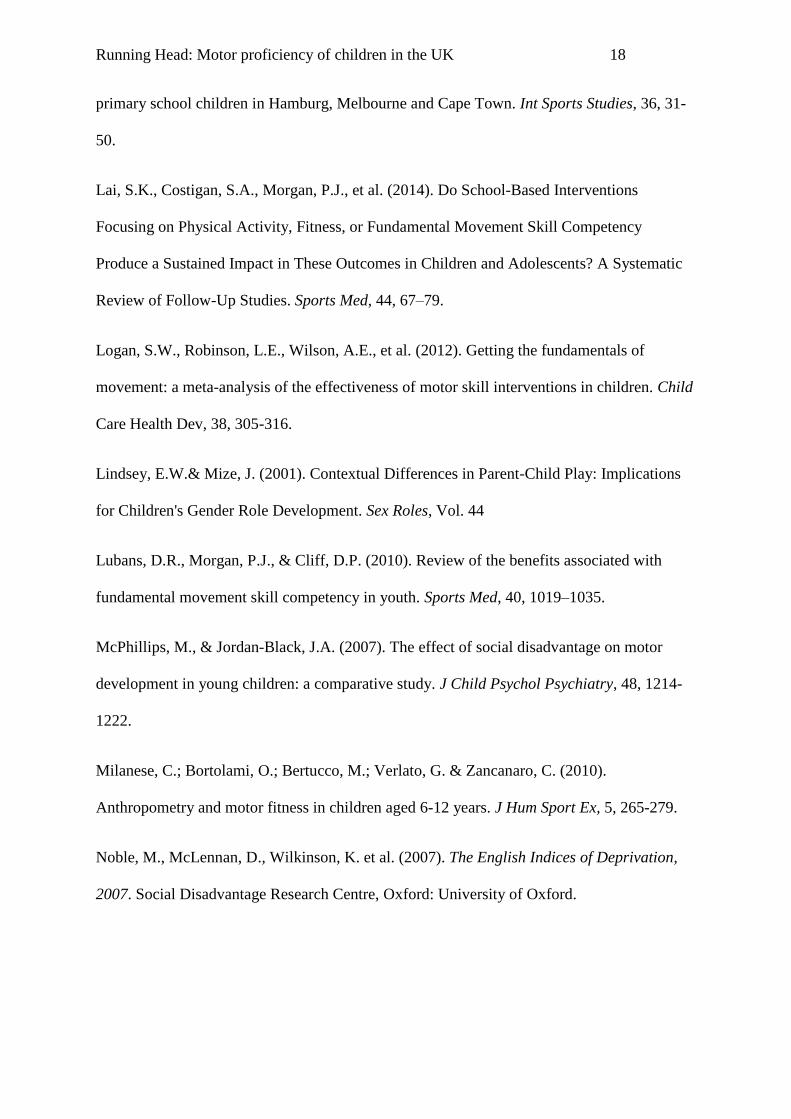
Table 1 shows the mean standard scores obtained in the BOT-2-BF and when
classified into descriptive categories by gender and SES. The standard score for all
participants was 44.4 ± 8.9 classifying the participants towards the lower end of the average
group. On an individual level, most of the participants were classified in the average (n=241;

Running Head: Motor proficiency of children in the UK 9
65.3%) or below average (n=95; 25.7%) categories. Of the remaining 33 participants, 18
scored well below average and 15 above average.
***Insert Table 1 here***
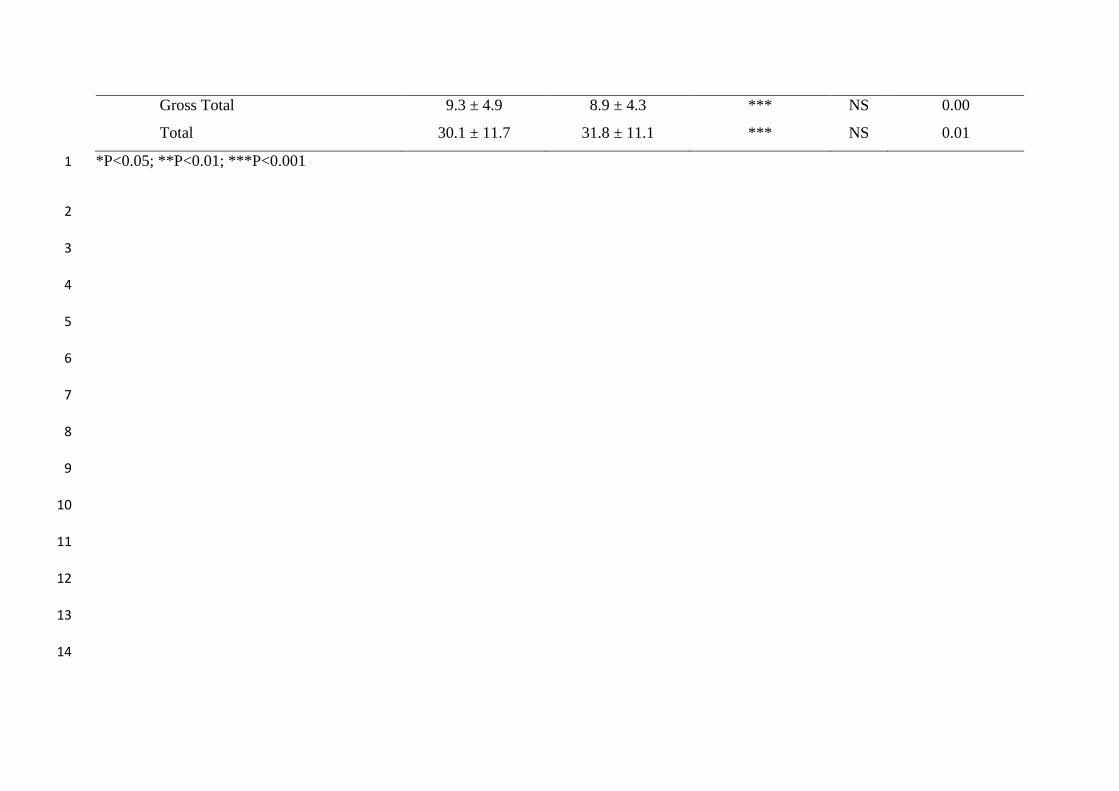
Table 2 shows the gender differences in motor proficiency. MANCOVA
demonstrated significant effects of chronological age (F 14,349 = 18.53, p<0.001, η2=0.46) and
gender (F 14,349 = 3.86, p<0.001, η2=0.14). Using chronological age as a covariate, age was
related to every element of the BOT-2 BF. When controlling for age, significant gender
differences were identified for star, line, circle, precision total, touch nose, fine motor total,
catch and dribble. Females outperformed males for all fine motor skills, while males
outperformed females for catching and dribbling ability. Effect sizes for all variables were
trivial to small except for the star, which were moderate.
***Insert Table 2 here***
Table 3 shows the differences in motor proficiency ability between high, middle and
low SES children. MANCOVA demonstrated significant effects of SES (F 30, 698 = 10.2,
p<0.001, η2=0.314). In relation to total score a significant large difference was identified with
high and middle SES outperforming low SES. For fine motor skills, when controlling for
age, significant differences between SES groups were identified for line, circle, precision
total, manual dexterity and fine motor total. High SES significantly outperformed middle and
/ or low SES for each variable where significant differences were found. Low SES only
significantly outperformed middle SES for line ability. Effect sizes demonstrated a large
effect for line and manual dexterity with a moderate effect shown for fine motor total. For
gross motor skills, when controlling for age, significant differences between high and low

Running Head: Motor proficiency of children in the UK 10
SES were identified for speed and agility, dribble, push up and gross total. High and middle
SES outperformed low SES for speed and agility, push up and gross total with high and low
outperforming middle SES for dribble performance. Large effect sizes were only identified
for speed and agility.
***Insert Table 3 here***
4. Discussion
The primary purpose of this study was to assess the motor proficiency of primary
school (4-7 years) children in the North of England, with a secondary purpose of
subsequently comparing children's motor proficiency according to gender and SES. To our
knowledge, this is the first study to assess the motor proficiency of children aged 4-7 years,
exploring the effect of gender and SES, in the UK. Overall, findings demonstrated that UK
children performed below average to average on the BOT-2 BF motor proficiency
assessment. When compared by gender, females outperformed males for fine motor skills,
while males outperformed females for the gross motor skills of catching and dribbling. When
SES was compared, high and middle SES significantly outperformed low SES for total, fine
and gross motor skills.
The average standard score of this cohort (44.9) was on the average to below average
boundary with 89.6% of participants' scores falling within this range. This potentially raises
some concern as it indicates that approximately a quarter of 4-7 year olds in the current study
score below average for motor proficiency. What is even more worrying about the low
average score of participants is that the BOT-2 BF motor proficiency assessment tool is
designed to assess motor deficiencies and therefore consists of basic tasks. These findings
coincide with previous research findings worldwide that typically demonstrate average or

Running Head: Motor proficiency of children in the UK 11
below average motor proficiency in children (Okely & Booth, 2004 and Sigmunson &
Rostoft, 2003), with few exceptions (Chow et al., 2001).
Variation in motor proficiency of children from different countries has been
previously reported (Adolph et al., 2010), with influencing factors ranging from family
expectations to the quality of stimulation at home (Hills et al., 2011). Children's decline in
motor proficiency has been supported elsewhere, although the impact of the general living
environment has been evidenced as less important than changes in lifestyle activities on the
movement behavior of children (Kretschmer, 2014). In light of the reported variations in
children's motor proficiency between different countries and evidence of the decline in the
motor proficiency of children, it is important to understand reasons that may be impacting
upon the motor proficiency of 4-7 year olds within the UK. One potential explanation for the
low level of children's motor proficiency in this study is the recent shift in government policy
with the dismantling of School Sport Partnerships and withdrawal of funding for the Physical
Education and Sport Strategy in the UK (DfES, 2003; Bardens et al., 2012). Another reason
could be the inadequate preparation of Primary school teachers to teach PE, with reports that
a lack of specialist Physical Education subject knowledge remains a major weakness
affecting the quality of Primary school provision (Ofsted, 2013). Whilst the impact of more
recently introduced initiatives (DfE/ Education Funding Agency, 2014) for Primary school
Physical Education and sport are yet to be fully understood it remains imperative that
teachers and coaches who are responsible for introducing young children to sport have an
understanding of how to provide an environment where developing movement patterns and
sequences can be nurtured and improved (Malina, 2012).
Given the limited research within this age-range of participants, previous research has
highlighted the need to identify skill-specific differences in the mastery of movement skills,
in order to adequately inform subsequent interventions and promote children's movement

Running Head: Motor proficiency of children in the UK 12
development effectively (Cools et al., 2008). In this vain, females in this study outperformed
males for all fine motor skills, whilst males outperformed females for the elements of gross
motor skills involving catching and dribbling, as reported elsewhere (Sigmundson & Rostoft,
2003; Bala & Katic, 2009) These differences could be attributed to stereotyped practices both
within the school and home environments that support physical activity and play practices
that facilitate the development of certain movement skills. This could relate, for instance, to
gender influence on the selection of toys for play (Weisgram et al., 2014), with toys
traditionally associated with boys being more likely to include sports equipment, whereas
toys traditionally associated with girls were more likely to include dolls, fictional characters,
and furniture, among other items (Pomerleau et al., 1990). Gender-biased play preferences
might also contribute to the differences in motor proficiency, with boys playing more
physical games than girls (Lindsey & Mize, 2001).
Interestingly, in the current study, effect sizes between genders demonstrated trivial to
small differences in motor proficiency with results from the vast majority of subsets
suggesting that the significant differences found in other studies were less prevalent within
this age group, most notably strength (Pienaar & Kemp, 2014). In one of the rare UK studies,
albeit with 7-10 year olds, a study by Duncan et al. (2013) reported no gender differences in
motor proficiency when considered as total scores, but girls outperformed boys on the hurdle
step and straight leg raise with boys outperforming girls on the trunk stability push-up. Other
studies have reported varying and often conflicting perspectives on the significance of gender
in motor proficiency when studying preschool children (Bala & Katic, 2009). Considering the
trivial to small significance of gender differences, our results go some way to support the
notion that the significance of the gender effect becomes more prominent as children age and
biological diversity becomes pronounced (Barnett et al., 2009).
Running Head: Motor proficiency of children in the UK 13
Empirical research has demonstrated a positive association between SES and FMS
mastery (Cohen et al., 2014). Furthermore, the use of an ecological systems theory approach
to understanding motor proficiency has yielded some interesting correlations between the
child, family and environment, suggesting that early motor development is influenced by
parental support and the child's immediate surroundings (Barnett et al., 2013). Perhaps the
most striking finding from this study is the strength of the relationship between SES and
motor proficiency, with socially disadvantaged children having significantly lower motor
proficiency than socially advantaged children. Specifically, socially disadvantaged children
significantly underperformed, in comparison to socially advantaged children, on the majority
of gross motor skill subsets apart from two (balance and catch). Other authors have reported
similar general findings in their studies of children the same age as this study in other
countries (McPhillips & Jordan- Black, 2007). Furthermore, the authors also established a
correlation between motor deficit and reading attainment, suggesting that motor deficiency
has more wide-ranging impact than solely inhibiting children in their full involvement in
physical activity. As gross motor skill proficiency is a likely determinant of children's
subsequent physical activity patterns, these findings suggest that this prevalence of motor
deficiency could lead to a life of exclusion from physical activity for socially disadvantaged
children.
5. Conclusions
Strengths of this study relate to the exploration of the large sample size drawn from a
range of schools and the use of children from the UK as participants. Whilst other
measurement instruments may have been deemed more suitable to assess typical motor
development of the specific age range of participants in an educational setting, the breadth of
skills coverage and number of detailed sub-elements deemed the BOT-2 BF the most
appropriate measurement tool.

Running Head: Motor proficiency of children in the UK 14
Whilst the relationship between the mastery of FMS and participation in physical
activity remains inconclusive (Lai et al., 2014), there is sufficient evidence from longitudinal
studies (Jaakkola & Washington, 2013) to suspect a relationship that consequently heightens
the importance of movement in children's ability to access a range of physical activity
experiences. The current findings suggest that teachers, sports coaches and physical activity
specialists need to concentrate on movement-based approaches in their delivery and
differentiate practice for different genders, particularly in the development of gross motor
skills. Those responsible for the development of interventions in related fields need to be
mindful of the motor deficits evidenced within this study and ensure they provide targeted
and differentiated programs for socially disadvantaged children and female participants.
Researchers have also suggested the need to further understand the movement ability of
children in the wider constructs of the assessment of physical literacy within schools (Gublin
et al., 2014) and involve teachers in the assessment of children's motor proficiency (Cools et
al., 2008). Although this study has started to do this with UK primary school children, future
developments are crucial if motor proficiency assessment is going to have a subsequent
positive affect on the appropriate development of children's movement, over and beyond the
relatively small-scale, cross-sectional, studies that currently exist.
Acknowledgements
Thank you to the staff and students responsible for the data capture and other members of the
Start to Move project team for their thoughts and comments on initial thoughts around this
manuscript. The Youth Sport Trust and Bupa funded this research.

Running Head: Motor proficiency of children in the UK 15
References
Adolph, K.E., Karasik, L.B., & Tamis-LeMonda, C.S. (2010). Motor skills. In H. Marc, & T.
Bornstein (Eds.) Handbook of cross-cultural developmental science (pp.61-88). New York:
Taylor & Francis.
Bala, G., & Katic, R. (2009). Sex Differences in Anthropometric Characteristics, Motor and
Cognitive Functioning in Preschool Children at the Time of School Enrolment. Coll
Antropol, 33, 1071–1078.
Barnett, L., Hinkley, T., Okely, A., et al. (2013). Child, family and environmental correlates
of children’s motor skill proficiency. J Sci Med Sport, 16, 332–336.
Barnett, L.M., Van Beurden, E., Morgan, P.J., et al. (2009). Childhood Motor Skill
Proficiency as a Predictor of Adolescent Physical Activity. J Adolesc Health, 44, 252–259.
Booth, M. L., Okely, T., McLellan, L., Phongsavan, P., Macaskill, P., Patterson, J., Wright,
J., & Holland, B. (1999). Mastery of Fundamental Motor Skills among New South Wales
School Students: Prevalence and Sociodemographic Distribution. J Sci Med Sport, 2, 93-105.
Bruininks, R.H., & Oseretsky, B.D. (2010). Bruininks-Oseretsky Test of Motor Proficiency,
Second Edition, Brief Form. Bloomington: PsychCorp.
Chow, S.M.K., Henderson, S.E., & Barnett, A.L. (2001). The movement assessment battery
for children: A Comparison of 4-year-old to 6-year-old children from Hong Kong and the
United States. Am J Occup Ther, 55, 55–61.
Cohen, J. (1988). Statistical power analysis for the behavioural sciences, 2nd ed. Hillsdale,
NJ: Erlbaum.

Running Head: Motor proficiency of children in the UK 16
Cohen, K.E., Morgan, P., Plotnikoff, R.C., et al. (2014). Fundamental movement skills and
physical activity among children living in low-income communities: a cross-sectional study.
Int J Behav Nutr Phys Act, 11, 58-74.
Cools, W., De Martelaer, K., Samaey, C., et al. (2008). Movement skill assessment of
typically developing preschool children: A review of seven movement skill assessment tools.
J Sports Sci Med, 8, 154-168.
Department for Education/ Education Funding Agency. (2014). Guidance: PE and sport
premium for primary schools. London: Department for Education.
Department for Education. (2014a). National Pupil Projections - Future Trends in Pupil
Numbers: July 2014. London: Department for Education.
Department for Education. (2014b). School Admissions Code: Statutory guidance for
admission authorities, governing bodies, local authorities, schools adjudicators and
admission appeals panels. London: Department for Education.
Du Toit, D., & Pienaar, A.E. (2002). Gender differences in gross motor skills of 3-6-year-old
children in Potchefstroom, South Africa. African Journal for Physical, Health Education,
Recreation and Dance, 8, 346-358.
Duncan, M., Stanley, J M., & Leddington-Wright, S. (2013). The association between
functional movement and overweight and obesity in British primary school children. Sports
Sci Med Rehab, 15, 11.
Gallahue, D.L., Ozmun, J.C., Goodway, J. (2012) Understanding Motor Development:
Infants, Children, Adolescents, Adults (7th ed.). Boston: Mass McGraw-Hill.

Running Head: Motor proficiency of children in the UK 17
Goodway, J.D., & Branta, C.F. (2003). Influence of a motor skill intervention on fundamental
motor skill development of disadvantaged preschool children. Res Q Exerc Sport, 74, 36–46.
Gublin, S., Collins, D. & Button, C. (2014). Physical Literacy: Importance, Assessment and
Future Directions. Sport Med, 44, 1177–1184.
Hardy, L., Reinten-Reynolds,T., Espinel,P., Zask, A., & Okely, A. D. (2012). Prevalence and
Correlates of Low Fundamental Movement Skill Competency in Children. Pediatrics, 130,
390-398.
Haywood, K.M., & Getchell, N. (2005). Life span motor development, 4th edition.
Champaign, IL: Human Kinetics.
Hills, A.P., Anderson L.B., & Byrne, N.M. (2011). Physical activity and obesity. Br J Sports
Med, 45, 866-870.
Inchley, J.C., Currie, D.B., Todd, J.M., et al. (2005). Persistent socio-demographic
differences in physical activity among Scottish schoolchildren 1990-2002. Eur J Public
Health, 15, 386-388.
Jaakkola, T., & Washington, T. (2013). The relationship between fundamental movement
skills and self-reported physical activity during Finnish junior high school. Phys Educ Sport
Pedagog, 18, 492-505.
Kirk, M.A., & Rhodes, R.E. (2011). Motor Skill Interventions to Improve Fundamental
Movement Skills of Preschoolers With Developmental Delay, Adapt Phys Activ Q, 28, 210-
232.
Kretschmer, J., Saunders, J., Bressan, E., et al. (2014). The relationship of motor ability to
some selected 'living and moving' variables: Findings from a case study of 8 and 9 Year old
Running Head: Motor proficiency of children in the UK 18
primary school children in Hamburg, Melbourne and Cape Town. Int Sports Studies, 36, 31-
50.
Lai, S.K., Costigan, S.A., Morgan, P.J., et al. (2014). Do School-Based Interventions
Focusing on Physical Activity, Fitness, or Fundamental Movement Skill Competency
Produce a Sustained Impact in These Outcomes in Children and Adolescents? A Systematic
Review of Follow-Up Studies. Sports Med, 44, 67–79.
Logan, S.W., Robinson, L.E., Wilson, A.E., et al. (2012). Getting the fundamentals of
movement: a meta-analysis of the effectiveness of motor skill interventions in children. Child
Care Health Dev, 38, 305-316.
Lindsey, E.W.& Mize, J. (2001). Contextual Differences in Parent-Child Play: Implications
for Children's Gender Role Development. Sex Roles, Vol. 44
Lubans, D.R., Morgan, P.J., & Cliff, D.P. (2010). Review of the benefits associated with
fundamental movement skill competency in youth. Sports Med, 40, 1019–1035.
McPhillips, M., & Jordan-Black, J.A. (2007). The effect of social disadvantage on motor
development in young children: a comparative study. J Child Psychol Psychiatry, 48, 1214-
1222.
Milanese, C.; Bortolami, O.; Bertucco, M.; Verlato, G. & Zancanaro, C. (2010).
Anthropometry and motor fitness in children aged 6-12 years. J Hum Sport Ex, 5, 265-279.
Noble, M., McLennan, D., Wilkinson, K. et al. (2007). The English Indices of Deprivation,
2007. Social Disadvantage Research Centre, Oxford: University of Oxford.

Running Head: Motor proficiency of children in the UK 19
Okely, A.D., & Booth, M.L. (2004). Mastery of fundamental movement skills among
children in New South Wales: prevalence and sociodemographic distribution. J Sci Med
Sport, 7, 358–72.
Pomerleau, A., Bolduc, D., Malcuit, G., & Cossette, L. (1990). Pink or blue: Environmental
gender stereotypes in the first two years of life. Sex Roles, 22, 359–367.
Pienaar AE, Kemp C. (2014). South African Journal for Research in Sport, Phys Ed Rec, 36,
167-182.
Roeber, B.J., Tober, C.L., Bolt, D.M., et al. (2012). Gross motor development in children
adopted from orphanage settings. Dev Med Child Neurol, 54, 527-531.
Seefeldt, V. (1980). Developmental motor patterns: Implications for elementary school
physical education. In C. Nadeau, W Holliwell, K. Newell, et al. (Eds.). Pscyhology of motor
behavior and sport. Champaign, IL: Human Kinetics.
Shala, M. (2009). Assessing gross motor skills of Kosovar preschool children. Early Child
Development and Care, 179, 969-976.
Sigmundsson, H., & Rostoft, M.S. (2003). Motor Development: exploring the motor
competence of 4-year-old Norwegian children. Scand J Educ Res, 47, 451-459.
Venetsanou, F. & Kambas, A. (2011). The effects of age and gender on balance skills in
preschool children. Phys Ed Sport, 9, 81-90.
Weisgram, E.S., Fulcher, M., & Dinella, L.M. (2014). Pink gives girls permission: Exploring
the roles of explicit gender labels and gender-typed colors on preschool children's toy
preferences. Journal of Applied Developmental Psychology, 35, 401–409.

Running Head: Motor proficiency of children in the UK 20
Youth Sport Trust / Bupa (2014). Bupa Start to Move: a new approach to teaching PE to 4-7
year olds, to help them stay active for life. Available at: http://www.starttomovezone.com
[Accessed Mar 2015]
Yoon. D., Scott, K., & Hill, M. (2006). Review of three tests of motor proficiency in children.
Percept Mot Skills, 102, 543- 551.

Table 1. Standard Score for BOT-2-BF According to Gender and SES 1
Well above Average
>70
(%)
Above Avg 60-
69 (%)
Average 41-59
(%)
Below Avg 31-40
(%)
Well below Average
<30 (%)
Gender
Males 193 44.9 ± 9.2 0
(0)
10
(5.2)
130 (67.4) 43
(22.2)
10
(5.2)
Females 176 43.8 ± 8.6 0
(0)
5
(2.8)
111
(63.0)
52
(29.6)
8
(4.6)
SES
Low 108 43.4 ±
10.7
0
(0)
3
(2.8)
60
(55.6)
41
(40.0)
4
(3.6)
Medium 134 46.4 ± 7.4 0
(0)
4
(3.0)
102
(76.1)
26
(19.4)
2
(1.5)
High 127 43.1 ± 8.3 0
(0)
8
(6.3)
79
(62.2)
28
(22.0)
12
(9.4)
2
3
4

Table 2. Differences in Motor Proficiency by Gender 1
Male
Mean ± SD
Female
Mean ± SD
Covariate
Age
P η2
Fine Motor
Star 1.9 ± 0.5 2.1 ± 0.4 * *** 0.06
Line 1.7 ± 1.5 2.1 ± 1.7 *** * 0.01
Circle 4.0 ± 1.7 4.5 ± 1.5 ** ** 0.02
Diamond 3.1 ± 1.7 3.0 ± 1.9 *** NS 0.00
Precision Total 10.7 ± 3.6 11.7 ± 3.6 *** ** 0.02
Manual Dexterity 2.7 ± 1.3 2.9 ± 1.2 *** NS 0.01
Touch Nose 3.2 ± 1.2 3.5 ± 1.0 *** * 0.01
Thumbs & Finger 1.4 ± 1.2 1.6 ± 1.3 *** NS 0.00
Bilateral Dexterity Total 4.8 ± 1.8 5.1 ± 1.8 *** NS 0.01
Fine Motor Total 18.2 ± 5.0 19.8 ± 5.0 ** ** 0.03
Gross Motor
Balance 2.5 ± 1.6 2.7 ± 1.5 *** NS 0.01
Speed & Agility 2.3 ± 1.8 2.5 ± 1.8 *** NS 0.00
Catch 0.5 ± 1.0 0.2 ± 0.6 ** ** 0.02
Dribble 1.9 ± 1.4 1.6 ± 1.4 *** ** 0.02
Strength 2.2 ± 1.9 2.0 ± 1.9 *** NS 0.00
Gross Total 9.3 ± 4.9 8.9 ± 4.3 *** NS 0.00
Total 30.1 ± 11.7 31.8 ± 11.1 *** NS 0.01
*P<0.05; **P<0.01; ***P<0.001 1
2
3
4
5
6
7
8
9
10
11
12
13
14

1
Table 3. Differences in Motor Proficiency by SES 2
High
(n=106)
Middle
(n=127)
Low
(n=134)
P η2 Pairwise
Fine Motor
Star 2.0 ± 0.4 2.0 ± 0.4 1.9 ± 0.6 NS 0.01
Line 2.6 ± 1.6 1.1 ± 1.2 2.0 ± 1.8 *** 0.10 H>L>M
Circle 4.5 ± 1.5 4.4 ± 1.8 4.0 ± 1.6 * 0.02 H>L
Diamond 3.2 ± 1.7 3.1 ± 2.0 2.9 ± 1.5 NS 0.01
Precision Total 12.4 ± 3.6 10.6 ± 3.4 10.8 ± 3.7 ** 0.03 H>M,L
Manual Dexterity 3.5 ± 1.2 2.8 ± 1.1 2.3 ± 1.1 *** 0.16 H>M>L
Touch Nose 3.3 ± 1.0 3.2 ± 1.2 3.4 ± 1.2 NS 0.01
Thumbs & Finger 1.6 ± 1.2 1.6 ± 1.3 1.4 ± 1.3 NS 0.01
Bilateral Dexterity Total 4.9 ± 1.6 5.2 ± 1.9 4.8 ± 1.8 NS 0.02
Fine Motor Total 20.8 ± 5.0 18.6 ± 4.6 17.9 ± 5.1 *** 0.06 H>L
Gross Motor
Balance 2.7 ± 1.5 2.6 ± 1.5 2.5 ± 1.5 NS 0.01
Speed & Agility 2.7 ± 2.0 2.9 ± 1.7 1.7 ± 1.5 *** 0.13 H,M>L
Catch 0.4 ± 0.9 0.4 ± 0.8 0.3 ± 0.8 NS 0.00
Dribble 2.0 ± 1.7 1.3 ± 1.0 2.0 ± 1.6 ** 0.03 H,L>M

Strength 2.3 ± 1.8 2.2 ± 2.0 1.8 ± 1.6 ** 0.02 H,M>L
Gross Total 10.0 ± 5.0 9.4 ± 4.4 8.3 ± 4.4 ** 0.04 H,M>L
Total 34.8 ± 13.8 32.7 ± 10.5 26.2 ± 8.2 *** 0.16 H,M>L
*P<0.05; ** P<0.01; ***P<0.001 1
2
3