running head: positive activities at work 1 · running head: positive activities at work 1...
TRANSCRIPT

Running head: POSITIVE ACTIVITIES AT WORK 1
Recalling Positive Events at Work Makes Employees
Feel Happier, Move More, but Interact Less:
A 6-Week Randomized Controlled Intervention at a Japanese Workplace
Joseph Chancellor Kristin Layous
Sonja Lyubomirsky University of California, Riverside
Word Count: 5245
in press, Journal of Happiness Studies Please address correspondence to: Joseph Chancellor 900 University Avenue Department of Psychology University of California Riverside, CA [email protected]

POSITIVE ACTIVITIES AT WORK 2
Abstract
Simple self-administered activities, such as practicing gratitude or kindness, have been
shown to increase happiness, yet only self-report measures have been used so far. Our study,
conducted with a Japanese workplace sample, incorporated a novel technology to gather precise
behavioral data reflecting participant movement and social interactions. Employees were
randomly assigned to either recount three positive events at work (a positive activity) or list work
tasks they completed (control) weekly for 6 weeks; furthermore, they reported their happiness
levels and wore sociometric badges that recorded their behavior. Relative to controls,
participants who considered good things at work not only reported relatively greater happiness
over time but moved more upon arriving to work, engaged in less social interaction, and left the
office earlier. Most of the findings were moderated by participant effort, such that those who put
more effort into the positive activity also showed greater changes.
Keywords: happiness, subjective well-being, positive activities, positive activity
interventions, sociometric data, behavioral data

POSITIVE ACTIVITIES AT WORK 3
Recalling Positive Events at Work Makes Employees
Feel Happier, Move More, but Interact Less:
A 6-Week Randomized Controlled Intervention at a Japanese Workplace
Introduction
People around the globe acknowledge that the pursuit of happiness, or subjective well-
being, is a high-priority life goal (Diener, 2000). Given the many benefits of happiness, this
preoccupation is not unwarranted. Positive emotions—a core component of well-being—are
associated with desirable outcomes across a number of life domains, such as work, relationships,
and physical health (Lyubomirsky, King, & Diener, 2005). Fortunately, research over the past
decade has established that engaging in positive activities—for example, performing acts of
kindness (Layous, Nelson, Oberle, Schonert-Reichl, & Lyubomirsky, 2012) or expressing
gratitude (Emmons & McCullough, 2003; Lyubomirsky, Dickerhoof, Boehm, & Sheldon, 2011)
—can sustainably increase happiness in practitioners (see Layous & Lyubomirsky, 2014;
Lyubomirsky & Layous, 2013, for reviews). Broadly, positive activities are simple, intentional,
and regular practices meant to mimic the myriad healthy thoughts and behaviors (e.g., prosocial
behavior, grateful and optimistic thinking; Lyubomirsky & Layous, 2013) that happy people
naturally engage in. However, the research on positive activities to date has suffered from several
significant limitations. First, experimental interventions to test the efficacy and boundary
conditions of positive activities are predominantly conducted in the West. Second, they neglect
the workplace. Third, and perhaps most important, they fail to measure actual human behavior.
Our study sought to remedy each of these shortcomings by experimentally testing a positive
activity in a Japanese workplace sample and collecting behavioral data.

POSITIVE ACTIVITIES AT WORK 4
Expanding Outcome Variables: Sociometric and Ambulatory Behavioral Measurement
A primary aim of our study was to examine whether a specific positive activity—a
grateful thinking exercise involving recalling three good things that occurred each week at
work—can lead to increases in happiness over time. In addition to collecting self-reports of
happiness, however, we also examined how the positive activity might change the employees’
actual behavior—specifically, their physical movements and social interactions—over time. A
frequent criticism leveled against social and personality psychology is that it overlooks actual
behavioral variables (Baumeister, Vohs, & Funder, 2007). Psychologists often instead rely on
self-report surveys, which are subject to numerous cognitive and memory biases (e.g., Kahneman,
Krueger, Schkade, Schwarz, & Stone, 2004). That behavioral variables are usually excluded
from studies is testament to the difficulties and hassles associated with observing, recording, and
coding participants’ behavior.
Fortunately, recent technological developments, such as computer miniaturization, long-
lasting batteries, and wireless communication, are facilitating a new approach to behavioral
monitoring that is more robust and less laborious than traditional methods. Also, because
miniaturized devices can be worn unobtrusively, researchers can monitor participants in
naturalistic locations, such as schools or workplaces, rather than confining them to artificial
laboratory environments. In this study, we used a custom-built ambulatory assessment device
with sociometric instruments (measuring face-to-face interactions), which resembles an
employee badge or name tag. Specifically, this sociometric badge, the Hitachi Business
Microscope®, allowed us to measure levels of physical activity throughout the day, as well as
amount of time spent in social interactions. The badge has been used in studies of flow,
knowledge transfer, and interoffice communication (for more information about the device and

POSITIVE ACTIVITIES AT WORK 5
corresponding research, see Yano, Chancellor, & Lyubomirsky, 2012). For example, researchers
have found that participants’ consistency in ambulatory movement correlates with the likelihood
of being in a state of flow or engagement (Ara et al., 2009). Hitachi has used such data to offer
feedback to employees to help them balance knowledge sharing (i.e., interacting with other
employees) and knowledge creation (i.e., time alone concentrating; Sato et al., 2009; Tsuji et al.,
2009).
This new technology gave us an opportunity to employ ambulatory and sociometric
measurements to validate that the practice of a positive activity would not only produce changes
in our participants’ self-reports, but also in their actual behaviors, as well as to explore the ways
such behavioral changes would be manifested. Would individuals who regularly engage in a
positive activity become more or less social, and how would their levels of physical activity shift
throughout the course of the study?
Expanding the Generalizability of Positive Activities: A Japanese Workplace Sample
Despite the advances made in cross-cultural correlational well-being research (Diener &
Diener, 1995; Uchida, Norasakkunkit, & Kitayama, 2004), randomized controlled positive
activity interventions still primarily rely on samples from North America and Europe (for
exceptions, see Layous, Lee, Choi, & Lyubomirsky, 2013; Otake et al., 2006). This over-reliance
on Western samples limits the conclusions that can be made, as one’s culture may impact one’s
pursuit of happiness (Diener & Diener, 1995; Diener & Suh, 1999). Foreign-born Asian-
Americans, for example, have been found to derive less benefit from expressing optimism and
conveying gratitude than Anglo-Americans (Boehm, Sheldon, & Lyubomirsky, 2011), possibly
due to cultural differences in the value ascribed to self-improvement and individual goals

POSITIVE ACTIVITIES AT WORK 6
(Triandis, 1995). In this study, we aimed to validate the efficacy of a positive activity
intervention in a population residing in a non-Western, collectivist country—specifically, Japan.
Another limitation of prior research is that, to our knowledge, randomized controlled
positive activity interventions (i.e., actual experiments) are not often, if ever, conducted in
occupational settings, prompting organizational psychologists (e.g., Fisher, 2010) to recommend
that researchers conduct experiments in the workplace using well-being and occupationally-
relevant variables as outcomes. Given that most employed adults spend the majority of their
waking hours at work and that work is often a source of chronic stress, workplaces are an
important setting in which to help individuals flourish. Indeed, growing evidence demonstrates
that happiness characterizes effective, high-performing employees (see Boehm & Lyubomirsky,
2008, for a review, and Piccolo, Judge, Takahashi, Watanabe, & Locke, 2005, for studies using
East Asian populations). For example, in correlational studies, happiness and positive affect
predicts several work-related outcomes, such as superior performance ratings, high job
satisfaction, and low absenteeism (Connolly & Viswesvaran, 2000; Cropanzano & Wright, 1999;
Pelled & Xin, 1999). Furthermore, in experimental lab studies, people induced to experience
positive affect persist at difficult tasks longer (Sarason, Potter, & Sarason, 1986) and set higher
goals for themselves (Baron, 1990) than those induced to experience neutral affect.
Cross-cultural research on well-being in occupational settings identifies Japan as having a
particularly challenging work environment (Kawakami & Haratani, 1999), placing near the
bottom in national rankings of job satisfaction and occupational measures such as workday hours,
opportunities for advancement, performing interesting work, working independently, helping
coworkers, performing work useful to society, and good relationships with colleagues (Sousa-
Poza & Sousa-Poza, 2000). Furthermore, the Japanese Ministry of Health, Labour, and Welfare

POSITIVE ACTIVITIES AT WORK 7
(2009) cited over 300 deaths due to “karoshi” (death by overworking) between 2002 and 2005
(Iwasaki, Takahashi, & Nakata, 2006), and, in 2007, launched a work-life balance campaign to
address such issues. Furthermore, the Japanese economy has been stagnating for over a decade
(Kuttner & Posen, 2001), and unfavorable macroeconomic conditions coincide with decrements
in workers’ well-being over time (in the U.S.; Hurd & Rohwedder, 2010) and increases in
mortality (in the U.S. and Japan; Veenhoven, & Hagenaars, 1989). The current research was
conducted at a Hitachi engineering office in Tokyo, Japan. Because Hitachi is a global
powerhouse—ranked 38th in revenue on Fortune magazine’s Global 500 list—the pressure for
employees to achieve is presumably high (Fortune Global 500, 2012). In addition, because nine
out of ten Japanese citizens live in urban environments (91.3% urbanized; CIA, 2011), we expect
employees at a major company in Tokyo to be representative of a large portion of the Japanese
workforce. Although researchers have conducted workplace interventions in Japan, these have
primarily been non-randomized stress-reduction programs (see Kawakami & Haratani, 1999, for
a review).
In sum, substantial research demonstrates that happiness has important work-related
outcomes and suggests that enhancing the well-being of employees, especially in Japanese
workplaces, is a worthwhile endeavor. Therefore, we sought to explore whether a positive
activity tailored to the workplace could effectively raise happiness in employees.
Expanding Understanding of Key Moderators: Effort
Multiple factors have been found to affect the degree to which positive activities work to
increase well-being (Layous & Lyubomirsky, 2014; Lyubomirsky & Layous, 2013). These
factors include variety in how a positive activity is practiced, the practitioner’s levels of social
support, and—most relevant to the present experiment—effort. For example, one study showed
POSITIVE ACTIVITIES AT WORK 8
that becoming happier requires both a “way” (i.e., an efficacious strategy) and a “will” (i.e., the
motivation and effort to carry it through; Lyubomirsky et al., 2011). Specifically, effort mustered
for an assigned activity was found to pay dividends, but only for participants who practiced an
activity that was happiness-inducing. In another study, self-reported effort on a positive activity
increased its effectiveness for U.S. and South Korean participants (Layous et al., 2013), possibly
because those who exerted effort were relatively more likely to believe in the activity and to feel
intrinsically motivated to perform it. Accordingly, in the current study, we also sought to
examine whether the amount of effort put forth by participants towards their assigned activity
was positively related to gains in happiness.
The Current Study
To sum up, we adapted a previously-tested positive activity intervention—recalling three
weekly positive events (see Seligman, Steen, Park, & Peterson, 2005)—to explore the well-being
and hedonic consequences of positive activities in a Japanese engineering firm. Participants were
randomly assigned to practice either the positive activity or a neutral task over a 6-week period;
they were assessed during the intervention period and after a 1-month follow-up.
Replicating previous research, we hypothesized that employees who performed the
positive activity—and particularly those who put relatively more effort into it— would show
greater increases in well-being than controls. However, due to the relative novelty of ambulatory
and sociometric measurements, we did not make specific predictions regarding how practicing
the positive activity might influence participants’ behavior. Notably, our descriptive approach to
these behavioral measures is the norm in the natural sciences, where researchers approach a new
domain without hypotheses, seeking only to explain phenomena as accurately as possible (Rozin,
2009).
POSITIVE ACTIVITIES AT WORK 9
Were we to formulate specific hypotheses, several plausible, but opposing outcomes
could be proposed on the basis of prior research. For example, with respect to movement, clinical
levels of depressive symptoms (often viewed as “low” well-being) are associated with both
motor retardation and agitation (Hamilton, 1960). Happiness, too, might be associated with
higher levels of movement, as it is positively and strongly correlated with extraversion (Costa &
McCrae, 1980), suggesting that people may become more active and social as they become
happier. Popular culture seems to support this link between activity level and happiness. For
example, the beloved children’s series, Winnie-the-Pooh, has associated a lethargic, depressed
Eeyore with slow, labored movements and the happy-go-lucky Tigger with a “bouncy,” active
gait.
On the other hand, because the activity we used in the current study is a cognitive
gratitude exercise, it might relax participants and reduce stress (Emmons & Mishra, 2011),
therefore decreasing jittery movements such as trembling and restless pacing. Finally, because
positive emotions are associated with a number of positive occupational outcomes (e.g.,
persisting at tasks; Sarason et al., 1986), workers may become more task-focused, productive,
and prone to flow (Csikszentmihalyi, 1990) as they become happier, leading to more consistent
movement (Ara et al., 2009) and less social interaction among coworkers (a potentially desirable
outcome for an engineering firm). In short, we approached our analyses of behavioral outcomes
of positive activities as exploratory.

POSITIVE ACTIVITIES AT WORK 10
Method
Participants
Thirty-two Japanese employees (27 male, 5 female) of an engineering firm, who ranged
in age from 24 to 50 years (M = 35.31, SD = 6.65), participated in this study1 Sixty-three percent
of the participants were married, with the rest single. Participants came from one of two
divisions, with five in a supervisory role. All participants were already daily wearing sociometric
badges at the company for at least 3 months before the study began as part of an ongoing
company project. Participants were recruited for our study via email and completed our online
measures in addition to their usual work-related activities. Participants were told that
participation in our study was completely voluntary and confidential and would not affect their
standing at work in any way.
Design and Procedure
As part of a 6-week intervention, participants were randomly assigned to either a positive
activity (n = 15) or neutral condition (n = 17). There were no significant differences in the
number of supervisors or members of either work division in each group (ps > .41). The study
was conducted entirely online in Japanese using a secure website. Upon their initial visit to the
study website, participants created an account with a unique username and password that they
used to enter the website during each subsequent visit. Participants reported their happiness at
the beginning, middle, and end of the intervention period, as well as at follow-up. They
1In a simulation of samples ranging from 10 to 100 at the highest level of analysis in a multilevel model (the most important level for power issues), Maas and Hox (2005) found that the parameter estimates and standard errors of parameter estimates were not biased, even when only 10 sampling units were included. Bias was only introduced with smaller sample sizes when estimating the variance components for the highest level of analysis and their corresponding standard errors. Because our effects of interest are the parameter estimates (not biased at smaller sample sizes), and their corresponding significance values, which are dependent on the standard errors of the parameter estimates (also not biased at smaller sample sizes), we do not deem our sample size to be a problem in our interpretation of significant effects.
POSITIVE ACTIVITIES AT WORK 11
performed their first activity after they had completed all baseline measures (Time 1). For
subsequent weeks of the intervention (Times 2 – 6), participants performed their assigned
activity before completing survey instruments.
In the positive activity condition, participants spent 10 min per week writing about three
things that went well at work during the previous week. They were told to list the positive events,
explain why the events “went well,” and describe their feelings—both while the event was
unfolding and at the present moment. In the neutral activity condition, participants spent 10 min
per week outlining work tasks completed over the past week. Control participants were told to be
detail-oriented and factual in “listing” their work activities and to avoid writing down emotions,
feelings, or opinions. This activity was presented as an organizational task that could plausibly
boost happiness. Furthermore, we instructed participants not to just perform the activity “only in
their heads,” but actually type their responses.
Happiness. The Subjective Happiness Scale (SHS; Lyubomirsky & Lepper, 1999) asks
respondents to rate how happy they are in general (1 = not a very happy person, 7 = a very happy
person) and relative to their peers (1 = less happy, 7 = more happy). Next, participants indicate
the extent to which a description of a “very happy” person characterizes them (1 = not at all, 7 =
a great deal). Excellent Cronbach’s αs (ranging from .90 to .95) were observed for these three
SHS items at all time points.
Flow. Participants recorded their degree of flow with a 3-item measure (Csikszentmihalyi,
1990). They rated their level of agreement with each item on 7-point Likert-type scales (1 = not
at all, 4 = somewhat, 5 = very much). Across all relevant time periods, good to excellent αs were
observed (ranging from .91 to .95).
POSITIVE ACTIVITIES AT WORK 12
Sociometric and ambulatory behavioral measures. Because our participants had
already been wearing the sociometric badges at work (see Figure 1), behavioral monitoring data
were available throughout the experiment.
These badges provided 1) continual monitoring of behavioral activity level (i.e.,
behavioral rhythm, a measure of how the body oscillates in three dimensions, which is
conceptually similar to ambulatory assessment; Fahrenberg, Myrtek, Pawlik, & Perrez, 2007)
and 2) interpersonal interactions. Behavioral activity level was assessed once per minute and
reported in a single score expressed in hertz. Higher values indicate more movement (e.g.,
walking quickly or running) and lower values indicate less movement (e.g., sitting or standing
still). The badge could distinguish between states when the wearer was not moving (but the
badge was still being worn) and states when the badge was not being worn (for more information
about the badge technology, see Yano et al., 2012). Thus, the total amount of time employees
were present at work could also be calculated from the behavioral activity level collected by the
badges.
Notably, the sociometric badges also contained embedded infrared sensors that had the
ability to gauge whether individuals were within a zone designed to be indicative of face-to-face
interaction2. The badges were worn on a lanyard and hung in the middle of the chest area facing
out. Their infrared sensors had a 60° conic viewing space and a range of up to 2 meters, which
was designed to measure when two or more individuals are within a close, interpersonal distance
from one another, where they are presumably communicating with one another nonverbally and
2Hitachi designed these sociometric badges to measure real-world face-to-face social interaction, and although “badge sightings” do not prove that people are actually talking, the badges only register the presence of other badges when individuals are facing each other (the badges are worn on the front of the chest) in very close proximity (i.e., less than 2 meters). Throughout the manuscript, we refer to this time as minutes of face-to-face social interaction, because individuals who are standing within this zone are presumed to be interacting either one-on-one or in a group (e.g., meeting). In work environments, it is implausible that individuals would be within this interpersonal zone and not actually interacting either verbally or nonverbally, even if it that activity were a simple “staring contest.”

POSITIVE ACTIVITIES AT WORK 13
verbally (although no conversations were recorded). Several times per minute, the badges “woke
up” and scanned the viewable area for other badges. Then, at 1-min intervals, each badge
reported the other devices it had identified. Thus, we were able to aggregate from the raw
sociometric data the total amount of time each participant spent in close interpersonal proximity
to other participants and other badge-wearing employees in the company (which included 145
other individuals).
Altogether, the complete set of behavioral data for the participants in our study was
voluminous. The activity level data consisted of 77,706 entries (up to 1,440 entries per day per
participant) spanning 179 days, and the social interaction data consisted of 7,307 entries
spanning 180 days. Data for the present study were aggregated at the day level for ambulatory
measures and the week level for sociometric measures. In all analyses, we used as many
measurement points as were available for each participant.
Given the enormity of the behavioral data, we extracted three measurements that we
believed might be amenable to change.
Social interaction For each week, we aggregated the total number of minutes of face-to-
face interaction per week.
Initial daily activity level. We averaged individuals’ earliest daily behavioral activity
level scores over the week. Such a value indicates how active individuals are when they first
arrive at work.
Workday duration. We also used behavioral activity level values to determine how long
participants were physically present at the office. However, this value merely indicates that one
is present at work—not necessarily that one is productively working. Also, badges do not work

POSITIVE ACTIVITIES AT WORK 14
outside of the office building because they require a wireless networking infrastructure to take
measurements.
Effort. Because we specifically instructed participants not to do the activity “in their
heads,” but actually type their responses into our survey, a character count of participants’
assigned written narrative served as a proxy for the amount of effort put into their weekly
assignment (e.g., Eisenberger, Masterson, & McDermitt, 1982). For example, someone who just
listed “coffee,” “good boss,” and “flexibility” would not receive as high of an effort score as
someone who wrote “my coworkers had coffee ready for me in the morning and that made me
feel ready to start the work day,” “my boss really supported my new idea at the meeting
yesterday,” and “because this job gives me the freedom to spend time with my family, I was able
to leave early to catch my daughter’s violin recital.” The total number of characters written was
summed for each week, averaged across time points (Cronbach’s α=.84), and z-scored by group
to account for the likelihood that the two activities differed in average levels of characters.
Analytic Approach
To account for within-person and between person changes in outcome variables, we used
multilevel modeling (MLM) techniques estimated with using HLM software (Raudenbush, Bryk,
Cheong, & Congdon, 2000). We compared baseline unconditional growth models to the
hypothesis-testing models (Singer & Willett, 2003) and found our hypothesis-testing models to
be a better fit. Thus, only parameter estimates and effect sizes for our hypothesis testing models
are included in Table 1. Group membership was effects-coded as -1 for the neutral activity group
and +1 for the positive activity group. We entered each variable as an outcome of the Level-1
equation. In analyses of happiness scores, measurement occasion (i.e., Time ) was entered as a
within-person predictor at Level-1. In analyses of the behavioral outcomes, because we had

POSITIVE ACTIVITIES AT WORK 15
much more baseline information for all participants, our models included two time variables as
Level-1 predictors: measurement occasion ( AllTime ), which models the base growth rate, and
time since the positive activity intervention began ( ExpTime ), which reflects an increment or
decrement to the base growth rate (Raudenbush & Bryk, 2002). With one exception, in all
analyses, we specified time predictors as fixed effects. In analyses of workday duration, however,
a model with time variables specified as random effects fit significantly better than one with time
as fixed effects and was therefore used to estimate coefficients.
In analyses of happiness, variables representing group, effort, and the Group X Effort
interaction were entered as between-persons predictors of the slope of time at Level-2. In the
behavioral data, Level-2 variables were used to predict slopes of ExpTime (the time since the
intervention began). As our interest lay in individuals’ change over time and not their baseline
levels, no Level-2 predictors were entered to predict changes in the intercept of each level one
equation. The combined MLM equation for self-report data analyses was the following:
00 10 11 12
13 0
( ) ( )( ) ( )( )
( )( )( )ij
ij
Outcome Time Group Time Effort Time
Group Effort Time r u
γ γ γ γ
γ
= + + + +
+ + +
The combined MLM equation for behavioral data analyses with time as a fixed effect (weekly
time in face-to-face interactions and daily starting activity level was the following:
00 10 20 21
22 23 0
( ) ( ) ( )( )
( )( ) ( )( )( )ij All Exp Exp
Exp Exp ij
Outcome Time Time Group Time
Effort Time Group Effort Time r u
γ γ γ γ
γ γ
= + + +
+ + + +
The combined MLM equation for behavioral data analyses with time as a random effect
(workday duration) was the following:
POSITIVE ACTIVITIES AT WORK 16
00 10 20 21
22 23
0 1 2
( ) ( ) ( )( )
( )( ) ( )( )( )
( ) ( )
ij All Exp Exp
Exp Exp
ij All Exp
Outcome Time Time Group Time
Effort Time Group Effort Timer u u Time u Time
γ γ γ γ
γ γ
= + + +
+ +
+ + + +
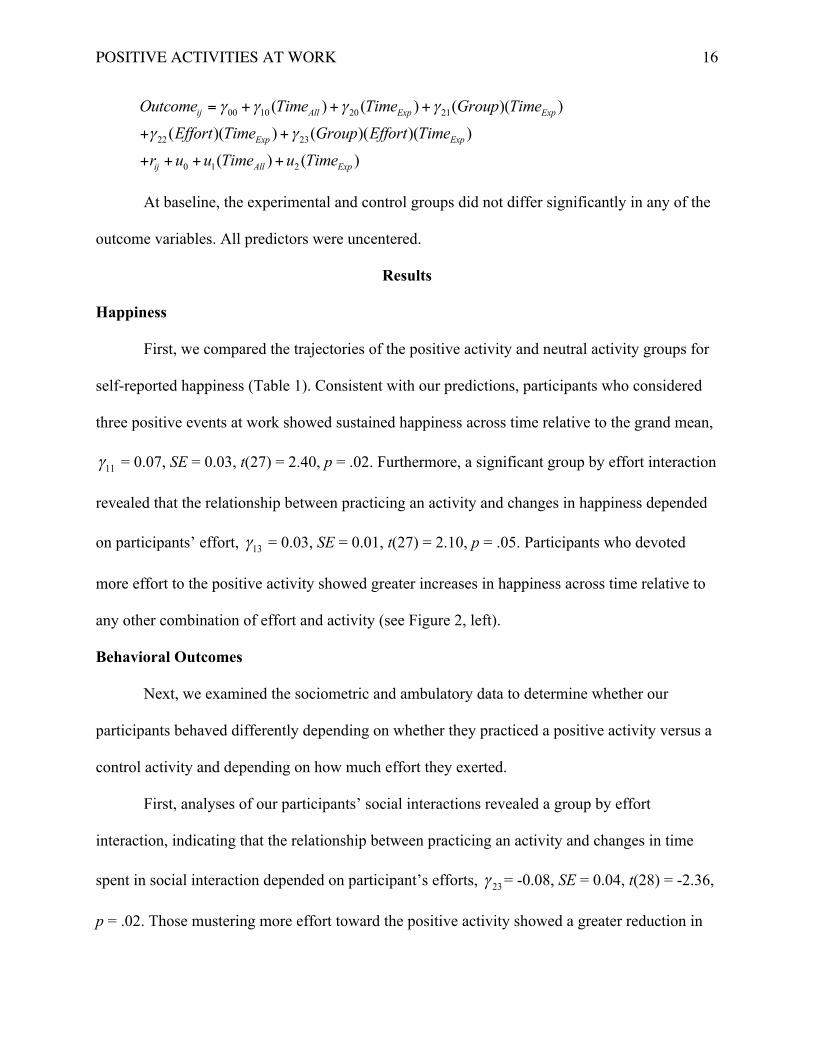
At baseline, the experimental and control groups did not differ significantly in any of the
outcome variables. All predictors were uncentered.
Results
Happiness
First, we compared the trajectories of the positive activity and neutral activity groups for
self-reported happiness (Table 1). Consistent with our predictions, participants who considered
three positive events at work showed sustained happiness across time relative to the grand mean,
11γ = 0.07, SE = 0.03, t(27) = 2.40, p = .02. Furthermore, a significant group by effort interaction
revealed that the relationship between practicing an activity and changes in happiness depended
on participants’ effort, 13γ = 0.03, SE = 0.01, t(27) = 2.10, p = .05. Participants who devoted
more effort to the positive activity showed greater increases in happiness across time relative to
any other combination of effort and activity (see Figure 2, left).
Behavioral Outcomes
Next, we examined the sociometric and ambulatory data to determine whether our
participants behaved differently depending on whether they practiced a positive activity versus a
control activity and depending on how much effort they exerted.
First, analyses of our participants’ social interactions revealed a group by effort
interaction, indicating that the relationship between practicing an activity and changes in time
spent in social interaction depended on participant’s efforts, 23γ = -0.08, SE = 0.04, t(28) = -2.36,
p = .02. Those mustering more effort toward the positive activity showed a greater reduction in

POSITIVE ACTIVITIES AT WORK 17
time spent in social interaction with peers compared with those mustering less effort toward the
positive activity. Altogether, the social interaction analyses suggest that devoting high effort to
the positive activity in particular, relative to the neutral activity, appeared to curtail social
interaction.
Second, we examined group and effort differences in ambulatory behavior. Participants
who considered three good things showed higher behavioral activity level scores at the beginning
of each work day compared with those who considered tasks they had completed, 21γ = 0.36, SE
= 0.17, t(28) = 2.06, p = .04. Additionally, those who mustered more effort across both groups
showed higher behavioral activity level scores at the beginning of each work day compared with
those who devoted less effort, 22γ = 0.11, SE = 0.03, t(28) = 3.20, p = .002 (see Figure 2, right).
Finally, we examined the time participants spent at work. On average, our participants
spent 10.61 hrs each day at the office. However, controlling for baseline work patterns, they
tended to spend less time at work as the intervention progressed. Although no significant main
effects emerged for experimental group or participants’ effort, we found an interaction between
these two variables, such that the relationship between practicing an activity and changes in time
at work depended on participants’ effort, 23γ = -0.14, SE = 0.06, t(28) = -2.39, p = .02. More
effort predicted shorter workdays, but only for those writing about three things that went well
each week.
The reduction in social interaction and time spent at work for people who put more effort
into the positive activity could be at least partially explained by our finding that those in the
positive activity condition reported marginally higher levels of flow than controls, 21γ = 0.07, SE
= 0.04, t(28) = 1.83, p = .08. Possibly people who wrote about three positive work-related events

POSITIVE ACTIVITIES AT WORK 18
felt more engaged with their work throughout the day and thus were less likely to interact with
coworkers and more likely to finish their work quickly and return home.
Discussion
Our study sought to test whether recalling three good things at work would not only raise
the happiness of employees in a non-Western workplace, but actually shift the employees’
behavior, as reflected in sociometric and ambulatory measures. In addition, we examined
whether greater effort in performing the positive activity would predict larger increases in
employee well-being.
Consistent with prior work on positive activities, participants who recalled positive
events each week became happier over time than those who outlined tasks they had completed.
Our findings build on previous theory and research indicating that intentional activities can boost
well-being for extended periods. In our case, the benefit persisted for as long as 10 weeks (see
Figure 2, left). In addition, by conducting this study in a Japanese workplace, we have shown
that positive activity interventions may be generalizable to other cultures and settings. Increasing
positive emotions in the workplace might be especially important, as research suggests that
happy employees are more productive and exhibit more prosocial behavior toward coworkers
(Boehm & Lyubomirsky, 2008).
Furthermore, consistent with our hypotheses, those who invested more effort into the
positive activity demonstrated significantly larger gains in happiness across time. Previous
research supports the idea that commitment to a goal or positive activity impacts the benefits one
derives from attaining or practicing it (Brunstein, 1993; Lyubomirsky et al., 2011). Along this
line of thinking, we speculate that participants who devoted less effort to the positive activity
may have been those who felt forced or compelled to perform it, which could have undermined

POSITIVE ACTIVITIES AT WORK 19
their sense of self-determination (Ryan & Deci, 2000). Therefore, imposing positive activities on
people (albeit with good intentions) could backfire. However, we cannot be confident of causal
interpretations, because effort was not manipulated in this study.
Notably, we found behavioral differences in participants’ social interactions and
movement patterns as a result of their participation in the study. Employees who wrote about
three good things at work each week arrived at the office with higher levels of activity (i.e.,
moving more) than those who wrote about the work tasks they completed. Although our
behavioral data has no inherent emotional valence in isolation, these findings potentially suggest
that recalling work-related positive events may lead employees to become more energetic and
work-oriented over time. Consistent with this “diligent worker” explanation is the finding that
high-effort participants (regardless of experimental group) also fit this pattern of results—that is,
they arrived at work with more energy. These results are also consistent with a recent finding
that older adults’ gait speed on a walking test is positively associated with enjoyment of life
(Steptoe, de Oliveira, Demakakos, & Zaninotto, 2014).
With respect to social behavior, writing about positive events (versus work tasks)
appeared to reduce participants’ social interactions, as evidenced by significant decreases in time
in face-to-face interactions for participants devoting high effort to the positive activity (e.g.,
taking it seriously). This finding may be surprising given the robust association between social
relationships and happiness (Lyubomirsky et al., 2005), but we contend that having supportive
friends and family does not necessitate that one continuously interacts with them. Possibly
happier people report having strong social relationships, but are also able to focus when the
situation requires it (e.g., at work). Indeed, research has shown that relatively happier people are
also more productive (Wright, Cropanzano, Denney, & Moline, 2002), more persistent at tasks

POSITIVE ACTIVITIES AT WORK 20
(Sarason et al., 1986), and engage in more substantive conversations (rather than small talk;
Mehl, Vazire, Holleran, & Clark). Assuming that reduction in social interaction is a beneficial
outcome (see Limitations), we speculate that recalling personal, work-related triumphs may
inspire and motivate workers to focus and work harder—an interpretation also consistent with
these participants’ marginal increases in flow. Further supporting the link between positive
activities and productivity, a randomized controlled study in a Spanish workplace found that
participants who practiced kindness over a month significantly increased flow compared with a
control group (Chancellor, Jacobs Bao, Lyubomirsky, 2013).
Significant differences also emerged in the amount of time participants spent at work.
Participants in the positive activity condition—and especially those who mustered great effort—
tended to spend less time at work throughout the study. Of course, cultural differences in East
Asia are worth mentioning, as the typical workday in Japan is longer than that of most other
nations (Iwasaki et al., 2006). One interpretation is that employees could be social loafing at
work (George, 1992). Alternatively, given our earlier finding suggesting that the positive activity
led workers to become more active earlier in the day, we speculate that employees may simply
be completing their necessary tasks and leaving work early. Alternatively, considering all their
successes at work may have made employees simply feel that they have worked hard enough.
Altogether, the behavioral measures used in our study are noteworthy in that they reflect
changes in the way participants actually acted as a result of recalling positive events. Whereas
self-report measures represent subjective evaluations of internal feelings and thoughts, measures
of body movements and social interactions represent objective differences in the way employees
behave at work. As such, our findings offer persuasive evidence to support the thesis that even
POSITIVE ACTIVITIES AT WORK 21
brief intentional positive activities can bring about “real” measurable behavioral differences in
practitioners.
Limitations
Our study’s most salient limitation was the sample size. Indeed, the present study’s
sociometric badges require a great deal of additional computing infrastructure to capture and
store real-time sociometric measurements (e.g., servers, wireless networks, and charging
stations). Despite the small sample size, however, we were still able to detect significant
differences between groups. Also, as we mentioned earlier (p. 8), fewer Level-2 sampling units
primarily bias variance estimates of random effects more so than the regression coefficients
(Maas & Hox, 2005).
We used the number of characters typed as a proxy for the amount of effort participants
devoted (see Eisenberger et al., 1982, for evidence linking text length to effort). Participants who
volunteer one-word responses are likely to be trying less hard than those providing detailed
descriptions of their weekly events. Unfortunately, character-counting may lose validity when
the responses of low-effort participants are voluminous but flippant and those of high-effort
participants are concise but pensive. Future alternative approaches include obtaining third-party
ratings of participants’ written responses or using self-reported effort, seriousness, or
commitment (Lyubomirsky et al., 2011). In support of our approach’s validity, however,
participants were specifically instructed to spend 10 min on each activity and write down their
thoughts rather than perform the activity “in their heads.” Overall, character counts should
indicate how seriously participants treated the activity, by reading instructions and devoting
effort to it in accordance with those instructions.
POSITIVE ACTIVITIES AT WORK 22
To the best of our knowledge, participants were already accustomed to wearing their
sociometric monitoring badges, which resemble identification badges or smart cards that workers
carry in secure corporate environments. Even when behavioral monitoring takes place in an
artificial environment (such as a laboratory), or is obvious (e.g., visible video cameras) and
intrusive (e.g., 24-hour monitoring), such methods can still have ecological validity and analyses
may only underestimate the actual effect sizes (e.g., Fincham, 2003). In contrast, the present
study’s sociometric badges were worn in workers’ normal working environments over months
and are relatively small and unobtrusive.
As discussed earlier, changes in behavior (i.e., activity patterns, time spent in face-to-face
interaction, and time spent at work) are not necessarily positive or negative. Because the
participants who practiced recalling positive events at work did become happier and reported
marginally more flow, we interpreted their subsequent behavioral shifts with that emotional
context in mind. However, given the robust association between social interaction and happiness,
our social interaction finding (and its interpretation) may seem at odds with prior literature.
We contend that context can help illuminate the valence of behavioral patterns. For
example, suppose Dan practiced recalling positive events, while Tom practiced a neutral activity.
Relative to Tom, Dan became happier and then drove his car more miles over the next week.
Although ample evidence links commuting with reduced happiness, we would speculate that as
Dan felt happier, he felt more energetic and chose to actively engage in more activities—
including driving. However, as evident in this analogy, the results obtained could be highly
dependent on context (i.e., American car culture) and the level and type of driving involved (e.g.,
whether Dan’s extra driving compounded his daily commute or marked a simple pleasure).
Similarly, we argue that, although our results may be highly dependent on the context of the

POSITIVE ACTIVITIES AT WORK 23
study and the sample of participants, the behavioral differences observed could be indicative of
broader patterns of positive changes and are worth investigating and reporting.
Finally, given the small sample size, we were unable to compare participants on
demographic factors that may have affected the success of the intervention (e.g., gender, work
roles). Although most individual difference concerns are eliminated due to random assignment to
groups, others factors might not be fully represented in our sample. For example, our sample was
entirely composed of employees at a single Japanese engineering firm, so the generalizability to
other Japanese workers may be limited. Additionally, our sample was predominately male. The
nature of the workplace (i.e., engineering firm) and the fact that participants were male could
mean that our results are dependent on this context—especially in regard to decreased social
interaction. Furthermore, researchers posit that individual characteristics should moderate the
effectiveness of happiness-promoting interventions (Layous & Lyubomirsky, 2014), and active
research continues in this area. In sum, although our study represents an important first step in
understanding positive activities within a Japanese workplace, the small sample size of
employees from one firm does not allow for broad generalizations. In the future, researchers
should ensure that participants’ sex is balanced and recruit workers from a variety of industries.
Concluding Remarks and Future Questions
Although the systematic investigation of happiness-boosting activities has blossomed in
the past decade, investigators are still accumulating evidence that sustainable happiness is
possible and identifying the specific mechanisms that bring it about. First and foremost, our
study presents more evidence that brief positive activities can produce changes that persist over
several months. Positive activity interventions conducted over longer time periods, such as one

POSITIVE ACTIVITIES AT WORK 24
or more years, would provide even more compelling evidence for the durability of well-being
and behavioral boosts.
New technology now offers an array of objective behavioral variables to complement
self-reports. The present study offers an imperfect, but notable contribution to psychological
research (see Rozin, 2009) by integrating unobtrusive behavioral measures rather than relying
exclusively on self-reports (Baumeister, Vohs, & Funder, 2007). We believe that researchers
need both behavioral and subjective measures to fully understand their participants’ experiences.
Behavioral measures do not, however, by themselves, indicate valence: Changes in social
interaction and movement could reflect shifts that are advantageous, counterproductive, or
neutral. For example, the manner by which we measured our participants’ time at work—using
behavioral activity level—does not necessarily indicate that the time was productive. Future
researchers may wish to replicate our findings with more nuanced measures of devotion to work
or quality of work time, as well as with additional subjective reports, which may help decipher,
for example, whether employees’ high levels of movement reflect their “jumping for joy” or
being “hopping mad.”
Notably, we employed a Japanese sample, bolstering the generalizability of previous
studies that relied primarily on Western samples. Of course, to more fully understand cultural
differences in practicing positive activities, future studies need to use multiple cross-cultural
samples practicing the same activity (for example, Boehm et al., 2011; Layous et al., 2013). In
addition, our study was conducted in an occupational setting, a relatively new and important
frontier in research involving the effects of targeted interventions on sustainable well-being. Our
findings show that even short-term positive activities can help employees be happier and
potentially more productive and more engaged at work. As happiness promotes career success
POSITIVE ACTIVITIES AT WORK 25
(see Boehm & Lyubomirsky, 2008, for a review), we believe employers should view boosting
workers’ well-being and productivity as complementary goals. Because employed adults spend
many of their waking hours at work, psychologists looking to design practices and environments
that foster well-being should make research in occupational settings a high priority.
Simple, inexpensive, efficacious interventions, like the one used in the present study, can
boost employees’ happiness, mental health, and productivity. As a contrast, occupational or
personal interventions guided by a coach, therapist, or consultant are typically costly and time
consuming. Positive activities, however, represent self-administered interventions that are
relatively convenient and hassle-free, can be delivered through the Internet for a relatively trivial
cost, are brief and non-stigmatizing, and scale exponentially to service a large number of people
(i.e., without the need of adding more trained personnel). Although brief intentional activities
such as recalling positive events—or writing gratitude letters or doing acts of kindness—
sometimes seem trivial, such activities stand the best chance of fostering substantial positive
changes in not just individuals, but entire communities and workplaces.

POSITIVE ACTIVITIES AT WORK 26
References
Ara, K., Sato, N., Tsuji, S., Wakisaka, Y., Ohkubo, N., Horry, Y.,…Hayakawa, M. (2009).
Predicting flow state in daily work through continuous sensing of motion rhythm. Paper
presented at the Sixth International Conference on Networked Sensing Systems, Carnegie
Mellon University.
Baron, R. A. (1990). Environmentally induced positive affect: Its impact on self-efficacy, task
performance, negotiation, and conflict. Journal of Applied Social Psychology, 20, 368-
384.
Baumeister, R. F., Vohs, K. D., & Funder, D. C. (2007). Psychology as the science of self-
reports and finger movements. Whatever happened to actual behavior? Perspectives on
Psychological Science, 2, 396-403.
Boehm, J. K., Lyubomirsky, S., & Sheldon, K. M. (2011). A longitudinal experimental study
comparing the effectiveness of happiness-enhancing strategies in Anglo Americans and
Asian Americans. Cognition & Emotion, 25, 1263-1272.
Brunstein, J. C. (1993). Personal goals and subjective well-being: A longitudinal study. Journal
of Personality and Social Psychology, 5, 1061-1070.
Central Intelligence Agency. (2011). The world factbook: Japan. Retrieved from
https://www.cia.gov/library/publications/the-world-factbook/geos/ja.html.
Chancellor, J., Bao, K. J., & Lyubomirsky, S. (2013). Ripples of generosity in the workplace:
The benefits of giving, getting, and glimpsing. Manuscript under review.
Connolly, J. J., & Viswesvaran, C. (2000). The role of affectivity in job satisfaction: A meta-
analysis. Personality and Individual Differences, 29, 265–281.

POSITIVE ACTIVITIES AT WORK 27
Costa, P. T., Jr., & McCrae, R. R. (1980). Influence of extraversion and neuroticism on
subjective well-being: Happy and unhappy people. Journal of Personality and Social
Psychology, 38, 668-678.
Cropanzano, R., & Wright, T. A. (1999). A 5-year study of change in the relationship between
well-being and job performance. Consulting Psychology Journal: Practice and Research,
51, 252-265.
Csikszentmihalyi, M. (1990). Flow: The psychology of optimal experience. New York: Harper &
Row.
Diener, E. (2000). Subjective well-being: The science of happiness and a proposal for a national
index. American Psychologist, 55, 34-43.
Diener, E., & Diener, M. (1995). Cross-cultural correlates of life satisfaction and self-esteem.
Journal of Personality and Social Psychology, 68, 653-663.
Diener, E., & Suh, E. (1999). National differences in subjective well-being. In D. Kahneman, E.
Diener, & N. Schwarz (Eds.), Well-being: The foundations of hedonic psychology (pp.
434-452). New York: Russell Sage Foundation.
Eisenberger, R., Masterson, F. A., & McDermitt, M. (1982). Effects of task variety on
generalized effort. Journal of Educational Psychology, 74, 499-505.
Emmons, R. A., & McCullough, M. E. (2003). Counting blessings versus burdens: An
experimental investigation of gratitude and subjective well-being in daily life. Journal of
Personality and Social Psychology, 84, 377-389.
Emmons, R. A., & Mishra, A. (2011). Why gratitude enhances well-being: What we know, what
we need to know. In K. M. Sheldon, T. B. Kashdan, & M. F. Steger (Eds.), Designing
POSITIVE ACTIVITIES AT WORK 28
positive psychology: Taking stock and moving forward (pp. 248-264). New York: Oxford
University Press.
Fahrenberg, J., Myrtek, M., Pawlik, K., & Perrez, M. (2007). Ambulatory assessment-monitoring
behavior in daily life settings. European Journal of Psychological Assessment, 23, 206-
213.
Feingold, A. (2009). Effect sizes for growth-modeling analysis for controlled clinical trials in the
same metric as for classical analysis. Psychological Methods, 14, 14-53.
Fincham, F. D. (2003). Marital conflict correlates, structure, and context. Current Directions in
Psychological Science, 12, 23-27.
Fortune Global 500 (2012). Retrieved from
http://money.cnn.com/magazines/fortune/global500/2012/full_list/.
George, J. M. (1992). Extrinsic and intrinsic origins of perceived social loafing in organizations.
Academy of Management Journal, 35, 191-202.
Hamilton, M. (1960). A rating scale for depression. Journal of Neurology, Neurosurgery, and
Psychiatry, 23, 56.
Hurd, M., & Rohwedder, S. (2010). Effects of the financial crisis and great recession on
American households (Rand Working Paper WR-810). Retrieved from
http://130.154.3.8/content/dam/rand/pubs/working_papers/2010/RAND_WR810.pdf.
Iwasaki, K., Takahashi, M., & Nakata, A. (2006). Health problems due to long working hours in
Japan: Working hours, workers’ compensation (karoshi), and preventive measures.
Industrial Health, 44, 537-540.
POSITIVE ACTIVITIES AT WORK 29
Kahneman, D., Krueger, A. B., Schkade, D. A., Schwarz, N., & Stone, A. A. (2004). A survey
method for characterizing daily life experience: The day reconstruction method. Science,
306, 1776-1780.
Kawakami, N., & Haratani, T. (1999). Epidemiology of job stress and health in Japan: Review of
current evidence and future direction. Industrial health, 37, 174.
Kuttner, K. N., & Posen, A. S. (2001). The great recession: Lessons for macroeconomic policy
from Japan. Brookings Papers on Economic Activity, 2001(2), 93-185.
Layous, K., Lee., H. C., Choi, I, & Lyubomirsky, S. (2013). Culture matters when designing a
successful positive activity: A comparison of the United States and South Korea. Journal
of Cross-Cultural Psychology, 44, 1294-1303.
Layous, K., & Lyubomirsky, S. (2014). The how, why, what, when, and who of happiness:
Mechanisms underlying the success of positive activity interventions. In J. Gruber & J.
Moscowitz (Eds.), Positive emotion: Integrating the light sides and dark sides (pp. 473-
495). New York: Oxford University Press.
Layous, K., Nelson, S. K., Oberle, E., Schonert-Reichl, K., & Lyubomirsky, S. (2012). Kindness
counts: Prompting prosocial behavior in preadolescents boosts peer acceptance and well-
being. PLOS ONE, 7, e51380.
Lyubomirsky, S., Dickerhoof, R., Boehm, J. K., & Sheldon, K. M. (2011). Becoming happier
takes both a will and a proper way: An experimental longitudinal intervention to boost
well-being. Emotion, 11, 391-402.
Lyubomirsky, S., King, L. A., & Diener, E. (2005). The benefits of frequent positive affect: Does
happiness lead to success? Psychological Bulletin, 131, 803-855.
Lyubomirsky, S., & Layous, K. (2013). How do simple positive activities increase well-being?
POSITIVE ACTIVITIES AT WORK 30
Current Directions in Psychological Science, 22, 57-62.
Lyubomirsky, S., & Lepper, H. S. (1999). A measure of subjective happiness: Preliminary
reliability and construct validation. Social Indicators Research, 46, 137-155.
Maas, C. J. M., & Hox, J. J. (2005). Sufficient sample sizes for multilevel modeling.
Methodology, 1, 86-92.
Mehl, M. R., Vazire, S., Holleran, S. E., & Clark, C. S. (2010). Eavesdropping on happiness:
Well-being is related to less small talk and more substantive conversations. Psychological
Science, 21, 539-541.
Ministry of Health, Labour, and Welfare (2009). Annual health, labour, and welfare (Part 1,
Chapter 3: Realizing of work-life balance and fair and diverse work styles). Japan.
Retrieved from http://www.mhlw.go.jp/english/wp.
Otake, K., Shimai, S., Tanaka-Matsumi, J., Otsui, K., & Fredrickson, B. L. (2006). Happy people
become happier through kindness: A counting kindness intervention. Journal of
Happiness Studies, 7, 361-375.
Pelled, L. H., & Xin, K. R. (1999). Down and out: An investigation of the relationship between
mood and employee withdrawal behavior. Journal of Management, 25, 875-895.
Piccolo, R. F., Judge, T. A., Takahashi, K., Watanabe, N., & Locke, E. A. (2005). Core
self!evaluations in Japan: Relative effects on job satisfaction, life satisfaction, and
happiness. Journal of Organizational Behavior, 26, 965-984.
Raudenbush, S. W., & Bryk, A. S. (2002). Hierarchical linear models: Applications and data
analysis methods (2nd ed.). Newbury Park, CA: Sage.
Raudenbush, S. W., Bryk, A. S., Cheong, Y. F., & Congdon, R. T. (2000). HLM5: Hierarchical
linear and nonlinear modeling. Lincolnwood, IL: Scientific Software International.

POSITIVE ACTIVITIES AT WORK 31
Rozin, P. (2009). What kind of empirical research should we publish, fund, and reward?: A
different perspective. Perspectives on Psychological Science, 4, 435-439.
Ryan, R. M., & Deci, E. L. (2000). Self-determination theory and the facilitation of intrinsic
motivation, social development, and well-being. American Psychologist, 55, 68-78.
Sarason, I. G., Potter, E. H., & Sarason, B. R. (1986). Recording and recall of personal events:
Effects on cognitions and behavior. Journal of Personality and Social Psychology, 2,
347-356.
Sato, N., Tsuji, S., Yano, K., Otsuka, R., Moriwaki, N., Ara, K.,…Horry, Y. (2009). Knowledge-
creating behavior index for improving knowledge workers' productivity. Paper presented
at the Sixth International Conference on Networked Sensing Systems, Carnegie Mellon
University.
Seligman, M. E. P., Steen, T. A., Park, N., & Peterson, C. (2005). Positive psychology progress:
Empirical validation of interventions. American Psychologist, 60, 410-421.
Sin, N. L., & Lyubomirsky, S. (2009). Enhancing well-being and alleviating depressive
symptoms with positive psychology interventions: A practice-friendly meta-analysis.
Journal of Clinical Psychology, 65, 467-487.
Singer, J. D., & Willett, J. B. (2003). Applied longitudinal data analysis: Modeling change and
event occurrence. Oxford: Oxford University Press.
Sousa-Poza, A., & Sousa-Poza, A. A. (2000). Well-being at work: A cross-national analysis of
the levels and determinants of job satisfaction. Journal of Socio-Economics, 29, 517-538.
Steptoe, A., de Oliveira, C., Demakakos, P., & Zaninotto, P. (2014). Enjoyment of life and
declining physical function at older ages: A longitudinal cohort study, 186, E150-E156.
Canadian Medical Association Journal. doi: 10.1503/cmaj.13115.

POSITIVE ACTIVITIES AT WORK 32
Swami, V., Steiger, S., Voracek, M., Dressler, S. G., Eisma, L., & Furnham, A. (2009).
Psychometric evaluation of the Tagalog and German Subjective Happiness Scales and a
cross-cultural comparison. Social Indicators Research, 93, 394-406.
Triandis, H. C. (1995). Individualism and collectivism. Boulder, CO: Westview Press.
Tsuji, S., Sato, N., Yano, K., Otsuka, R., Moriwaki, N., Ara, K.,…Horry, Y. (2009).
Visualization of knowledge-creation process using face-to-face communication data.
Paper presented at the Sixth International Conference on Networked Sensing Systems,
Carnegie Mellon University.
Uchida, Y., Norasakkunkit, V., & Kitayama, S. (2004). Cultural constructions of happiness:
Theory and empirical evidence. Journal of Happiness Studies, 5, 223-239.
Veenhoven, R. & Hagenaars, A. (1989). Did the crisis really hurt? Effects of the 1980-82
economic recession on satisfaction, mental health and mortality. Rotterdam: University
Press.
Wright, T. A., Cropanzano, R., Denney, P. J., & Moline, G. L. (2002). When a happy worker is a
productive worker: A preliminary examination of three models. Canadian Journal of
Behavioural Science, 34, 146-150.
Yano, K., Lyubomirsky, S., & Chancellor, J. (2012). Sensing happiness. IEEE Spectrum, 40, 26-
31.

POSITIVE ACTIVITIES AT WORK 33
Table 1
Multilevel Modeling Analyses of Happiness and Behavioral Outcomes
Self-Report Sociometric Ambulatory SHS Flow Weekly Time in
Face-to-Face Interactions Daily Initial
Activity Level Time Spent at Work
Predictor b SE t d b SE t d b SE t d b SE t d b SE t d Intercept 4.77 0.26 18.67** 3.60 0.28 12.69 22.98 1.32 16.60** 216.06 8.15 26.50** 605.66 17.94 33.71** Time -0.02 0.01 -1.35 -0.31 0.03 0.05 .51 .41 -0.79 0.18 -4.30** -1.08 0.39 0.30 1.28 0.27 -2.08 0.74 -3.31** -1.02 Group 0.04 0.02 2.41* 0.62 0.07 0.04 1.83† 1.04 -0.05 0.14 -0.34 -0.07 0.36 0.17 2.06* 0.25 -0.04 0.30 -0.12 -0.02 Effort 0.01 0.01 1.26 0.15 0.01 0.02 0.56 .20 0.05 0.03 1.35 0.07 0.11 0.03 3.20** 0.08 0.03 0.059 0.58 0.02 Group × Effort 0.02 0.01 2.14* 0.31 0.02 0.02 0.88 .29 -0.08 0.04 -2.36* -0.11 -0.03 0.03 -0.96 -0.02 -0.14 0.059 -2.39** -0.07 Note. All effects are unstandardized regression coefficients. In the model predicting happiness, measurement occasion (Time) is a level 1 predictor. All level 2 variables were only included in the equation predicting the slope of time. The sociometric and ambulatory models included two time variables as level 1 predictors: measurement occasion and time since the intervention began. All level 2 variables were only included in the equation predicting slopes of experimental time (depicted here as “Time”). In all models, group is coded as -1 for control and +1 for experimental. With the exception of workday duration, time variables were fixed effects. Cohen’s ds were calculated with the following formula: d = 2b(time)/SDraw where b is the unstandardized regression coefficient of interest, time is the amount of time included in the model analyses (for SHS it was 10 weeks, for weekly time in interaction it was 6 weeks, and for daily behavioral indicators it was 42 days), and SDraw is the standard deviation of the dependent variable across groups at baseline (Feingold, 2009). The coefficient is initially multiplied by two to account for our coding scheme. Baseline standard deviations were as follows: SHS = 1.30, Flow = 1.30. Weekly Time in Face-To-Face Interactions = 8.76, Daily Initial Activity Level = 120.42, Time Spent at Work = 170.59. Confidence intervals around each parameter estimate can be calculated using the following equation: b ± 1.96[SE(b)] (Singer & Willett, 2003). †p < .10.*p < .05. **p < .01.

POSITIVE ACTIVITIES AT WORK 34
Figure 1. The present study’s sociometric badges from the Hitachi Research Lab.

POSITIVE ACTIVITIES AT WORK 35
Figure 2. Changes in happiness by group and effort (left) and changes in initial behavioral activity level by group and effort (right).