running head: the happiness of millionaires … files/donnelly zheng... · running head: the...
TRANSCRIPT
Running Head: THE HAPPINESS OF MILLIONAIRES
The Amount and Source of Millionaires’ Wealth (Moderately) Predicts Their Happiness
Grant E. Donnelly
Harvard Business School
Tianyi Zheng
University of Mannheim
Emily Haisley
BlackRock
Michael I. Norton
Harvard Business School
Word count = 8,709
The Happiness of Millionaires 2
Abstract
Two samples of more than four thousand millionaires reveal two primary findings. First,
only at high levels of wealth – in excess of $8 million (Study 1) and $10 million (Study
2) – are wealthier millionaires happier than millionaires with lower levels of wealth,
though these differences are modest in magnitude. Second, controlling for total wealth,
millionaires who have earned their wealth are moderately happier than those who
inherited it. Taken together, these results suggest that, among millionaires, wealth may be
likely to pay off in greater happiness only at very high levels of wealth, and when that
wealth was earned rather than inherited.
Keywords: happiness, income, money, wealth, well-being
The Happiness of Millionaires 3 The Amount and Source of Millionaires’ Wealth (Moderately) Predicts Their Happiness
Many people aspire to great wealth, and becoming a millionaire is a commonly
used reference for financial success (Kasser & Ryan, 1993); moreover, people tend to
think that more money is related to more happiness (Aknin, Norton, & Dunn, 2009;
Myers, 2000a). But does great wealth bring great happiness? If so, how much wealth is
required? And, does the manner in which that wealth is accrued – whether you earned it
yourself, or inherited it – predict the amount of happiness experienced? We use two large
and unique samples of millionaires to shed novel light on these fundamental questions
about the relationship between money and happiness.
A large body of cross-sectional survey research demonstrates that overall life
satisfaction continues to rise with income, though typically with diminishing marginal
return (e.g., Aknin et al., 2009; Kahneman & Deaton, 2010; Myers, 2000b; Stevenson &
Wolfers, 2008). However, the vast majority of the data informing our understanding of
this relationship is derived from samples that have relied heavily on average earners (e.g.,
Cummings, 2000) and the poor (Biswas-Diener & Diener, 2006). For instance,
Cummings (2000) meta-analytically reviewed effect sizes from 31 studies that
investigated the relation between subjective wellbeing and income. Only one of these
samples included individuals who made more than $150,000 annually. Additionally,
many studies investigating the influence of wealth on happiness have utilized large panel
data sets (e.g., Diener, Ng, Harter, & Arora, 2010; Kahneman & Deaton, 2010; Ng &
Diener, 2014). These datasets, while large, are also typically representative of the sample
populations and only identify a small number of “wealthy” participants as making over
$150,000 a year. Further, many convenience samples (e.g., Aknin et al., 2009; Diener &
The Happiness of Millionaires 4 Diener, 2009; Diener, Tay, & Oishi, 2013; Johnson & Krueger, 2006) are also missing
data from wealthy individuals – likely because they are less likely to respond to requests
to complete surveys (see Page, Bartels, & Seawright, 2013).
Compounding this issue, comparisons of well-being at the individual level have
relied primarily on personal or household annual income (e.g., Blanchflower & Oswald,
2004; Di Tella, Haisken-De New, & MacCulloch, 2010; Diener & Diener, 2009;
Kahneman & Deaton, 2010), which typically has a more restricted range than people’s
net worth – which can be accumulated over time and includes all assets in addition to
income (Headey & Wooden, 2004). A number of large panel data sets include a small
proportion of participants who report a relatively high annual household income (datasets
and proportion of sample with annual household income exceeding the top value listed in
parentheses: the United States General Social Survey [12.6% over $110,000], the German
Socio-Economic Panel [.67% over $120,000], the National Longitudinal Survey [.84%
over $150,000], the United States National Survey of Midlife Development [6.07% over
$150,000], and the Taiwan Social Change Survey [7.68% over $150,000]). These top
income levels are much lower than the wealth levels in our samples, and these surveys do
not break down these high income respondents into even smaller buckets of very high
income respondents, such that there are not sufficient numbers of high net worth
individuals to compare to our samples. In sum, previous analyses of the relationship
between money and happiness have typically been subject to a restricted range problem –
at the higher end in particular.
One approach towards understanding the relationship between wealth and
wellbeing among the wealthy has been to evaluate lottery winners. However, research on
The Happiness of Millionaires 5 lottery wins has also failed to evaluate large samples of wealthy individuals, typically
focusing on individuals who won small sums, with just a handful of “big winners.” For
instance Brickman, Coates and Janoff-Bulman (1978) compared 22 lottery winners (with
average winnings of ~$480,000) to non-winners from the same geographical areas.
Lottery winners were not found to be any happier than control participants, but did report
taking less pleasure in ordinary activities (e.g., socializing with friends, watching
television). When Gardner and Oswald (2007) compared 137 lottery winners (average
winnings ~$200,000) to both non-winners and individuals who won smaller sums, the
larger winners experienced greater mental stress that year, and a small improvement in
psychological wellbeing after two years. Taken together these studies suggest that
medium-sized windfalls may have a small impact toward improving wellbeing.
Insight into the happiness of millionaires is limited to a single, sample from the
1983 Forbes list of wealthiest Americans (Diener, Horwitz, & Emmons, 1985). In this
study, 49 wealthy individuals (each with a net worth over $125M) were compared to
average earners from the same geographical areas. The very rich were, on average,
somewhat happier than the average earners and reported moderately more satisfaction
with life. The authors concluded that wealthier people are found to be happier than
relatively poorer people, but the effects are small. However, this relative lack of data
raises the question: does even more money bring even more happiness?
In addition to the relationship between happiness and the sheer amount of wealth,
we also investigate whether the source of that wealth predicts the happiness associated
with it. Certainly, the manner in which people spend their money has been shown to
influence happiness, with spending on experiences (Gilovich & Kumar, 2015; Van Boven
The Happiness of Millionaires 6 & Gilovich, 2003) and spending on others and giving to charity (Dunn, Aknin, & Norton,
2008; 2014) typically associated with greater happiness than spending on material goods
for the self. In addition, research has explored how the source of money affects
subsequent spending of that money: framing money as a windfall versus an anticipated
gain (Arkes et al., 1994), describing tax refunds as rebates versus bonuses (Epley &
Gneezy, 2007), and making the source of a monetary gift as a relative versus an ill
relative (Levav & McGraw, 2009) have all been shown to influence future spending.
Building on this previous research, we explore whether the manner in which
wealth is acquired – the source of wealth – is a predictor not of spending, but of
happiness. Andrew Carnegie opined that a parent leaving their child “enormous wealth
generally deadens the talents and energies of the child, leading to a less useful and less
worthy life than they otherwise would” (Carnegie, 1962). Indeed, receiving a large
inheritance significantly decreases people’s labor force participation, offering some
supporting evidence for this “Carnegie Conjecture” that inherited wealth leads to a
decreased desire to work (Elinder, Erixson, & Ohlsson, 2012; Holtz-Eakin, Joulfaian, &
Rosen, 1992). We explore whether Carnegie’s words also apply to the well-being that
people derive from their wealth – as a function of whether they earned or inherited it.
Overview of the Studies
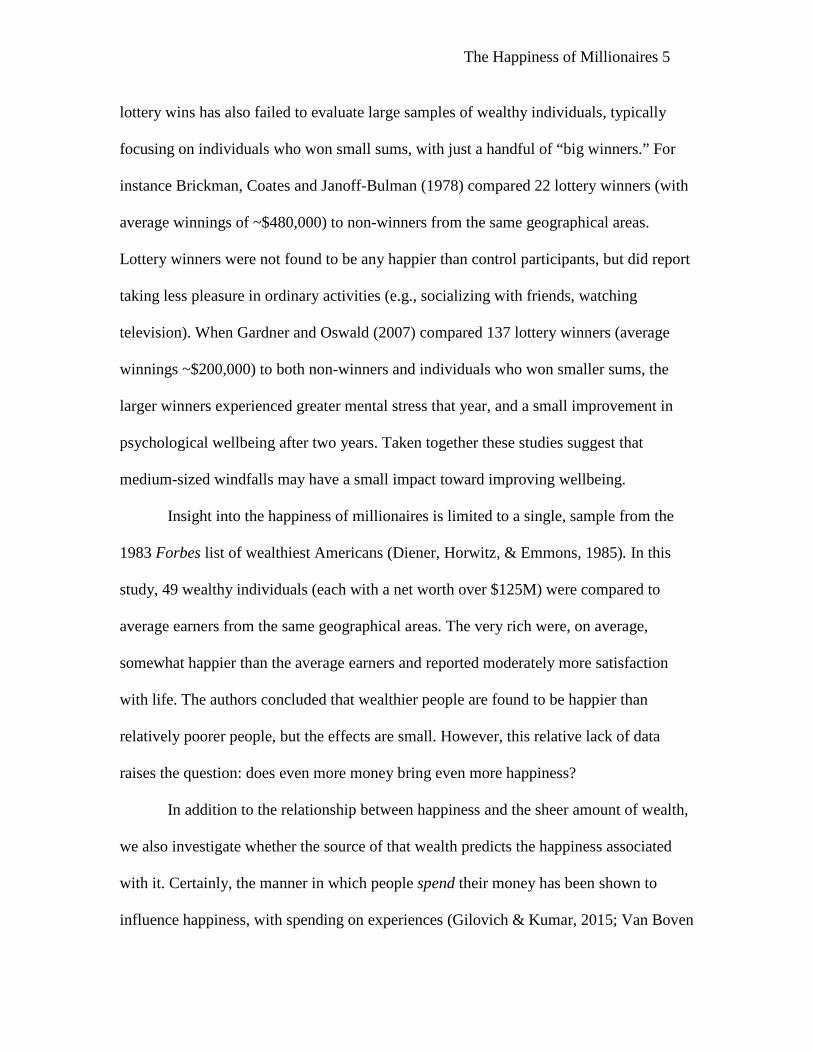
We utilize data from two large samples of high-net-worth respondents. In Study 1,
all respondents (N = 2,129, 70.4% male, median age = 45-54 years, sampled in 17
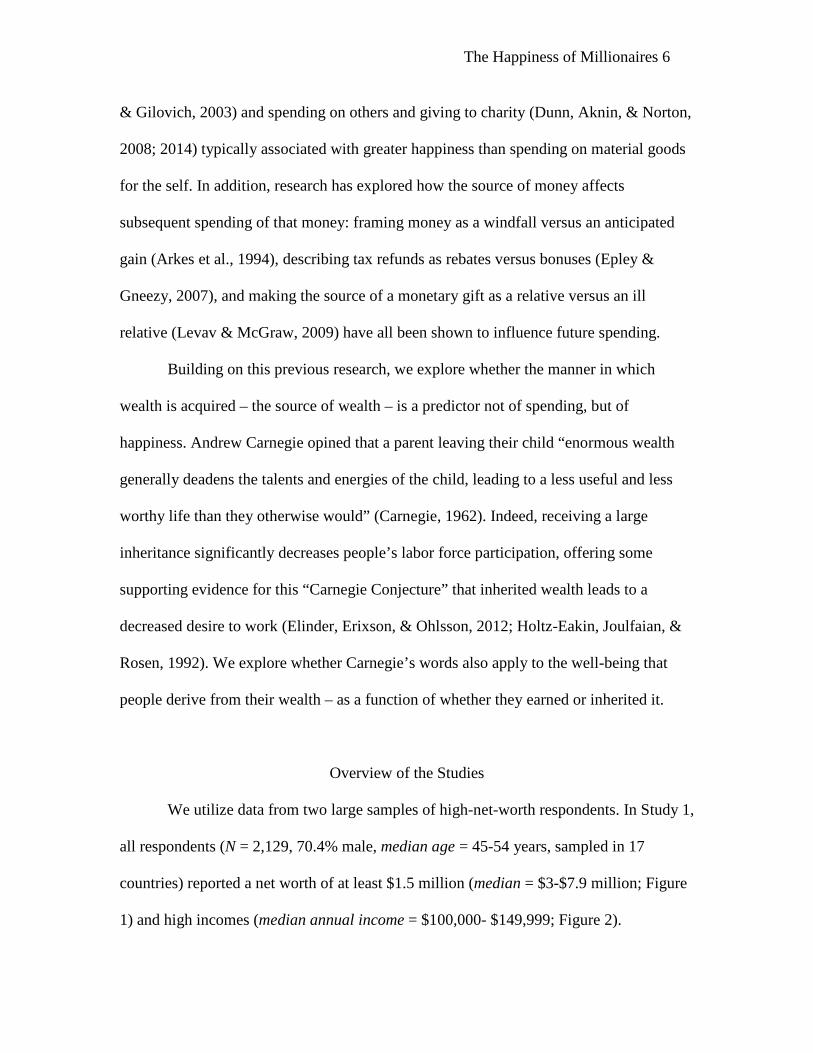
countries) reported a net worth of at least $1.5 million (median = $3-$7.9 million; Figure
1) and high incomes (median annual income = $100,000- $149,999; Figure 2).
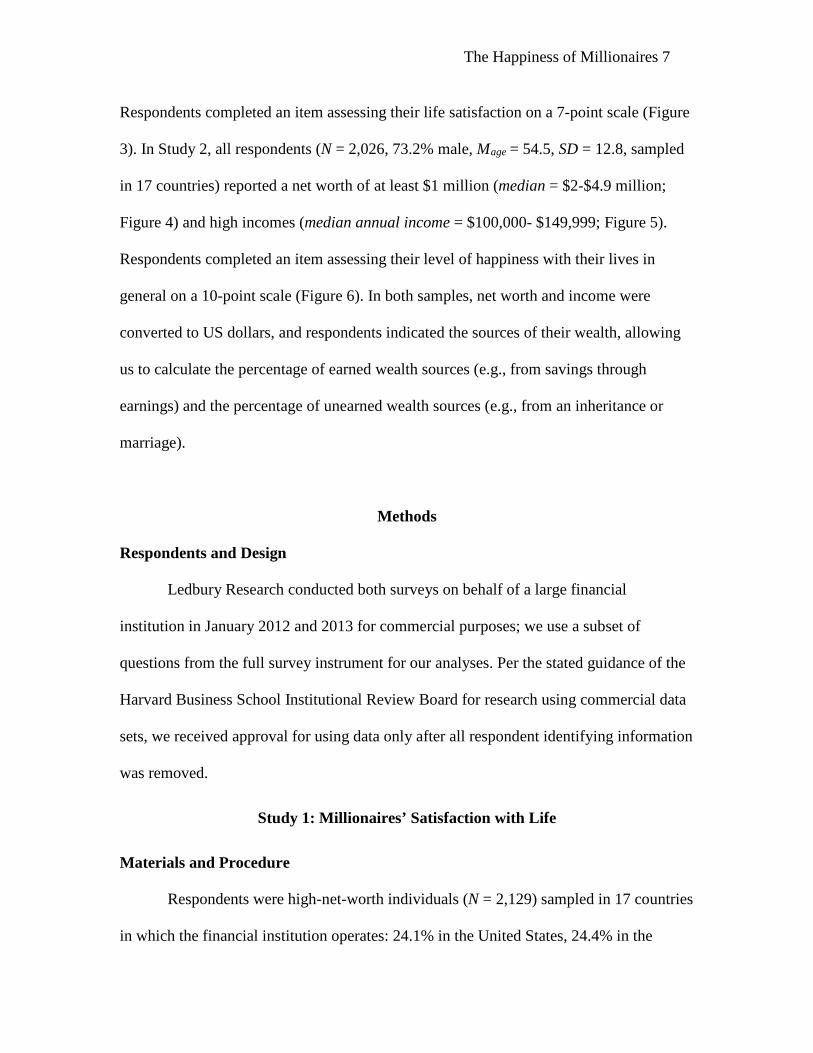
The Happiness of Millionaires 7 Respondents completed an item assessing their life satisfaction on a 7-point scale (Figure
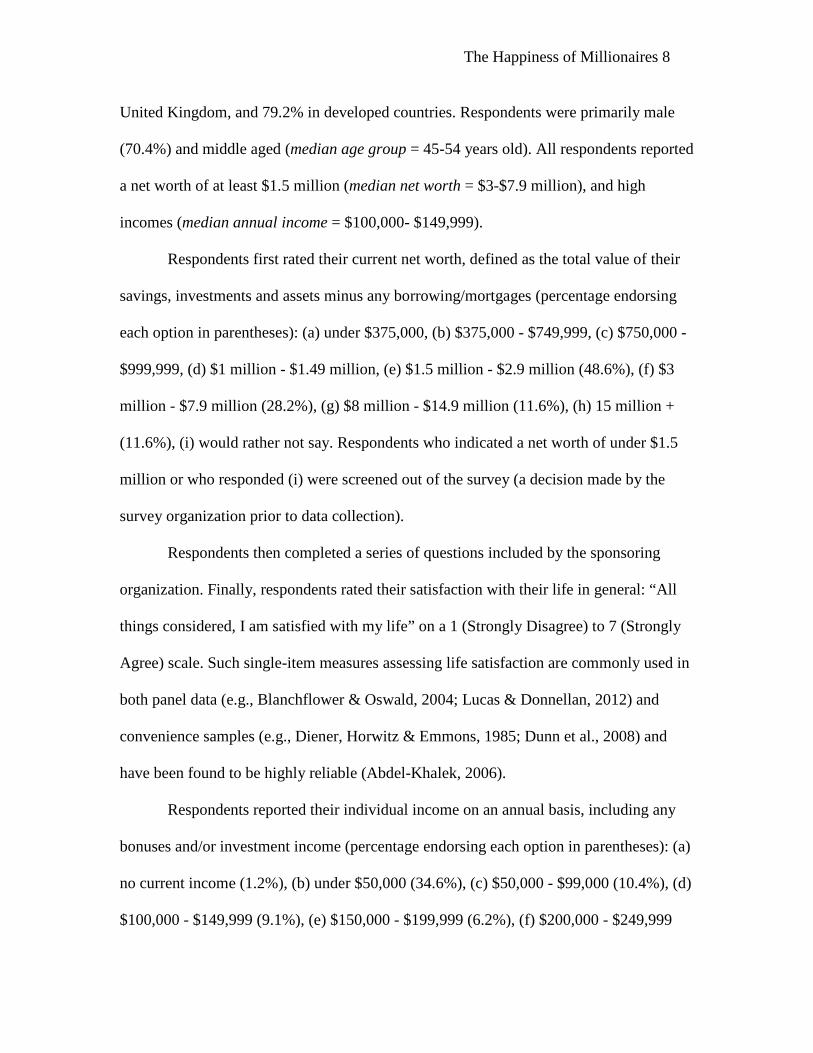
3). In Study 2, all respondents (N = 2,026, 73.2% male, Mage = 54.5, SD = 12.8, sampled
in 17 countries) reported a net worth of at least $1 million (median = $2-$4.9 million;
Figure 4) and high incomes (median annual income = $100,000- $149,999; Figure 5).
Respondents completed an item assessing their level of happiness with their lives in
general on a 10-point scale (Figure 6). In both samples, net worth and income were
converted to US dollars, and respondents indicated the sources of their wealth, allowing
us to calculate the percentage of earned wealth sources (e.g., from savings through
earnings) and the percentage of unearned wealth sources (e.g., from an inheritance or
marriage).
Methods
Respondents and Design
Ledbury Research conducted both surveys on behalf of a large financial
institution in January 2012 and 2013 for commercial purposes; we use a subset of
questions from the full survey instrument for our analyses. Per the stated guidance of the
Harvard Business School Institutional Review Board for research using commercial data
sets, we received approval for using data only after all respondent identifying information
was removed.
Study 1: Millionaires’ Satisfaction with Life
Materials and Procedure
Respondents were high-net-worth individuals (N = 2,129) sampled in 17 countries
in which the financial institution operates: 24.1% in the United States, 24.4% in the
The Happiness of Millionaires 8 United Kingdom, and 79.2% in developed countries. Respondents were primarily male
(70.4%) and middle aged (median age group = 45-54 years old). All respondents reported
a net worth of at least $1.5 million (median net worth = $3-$7.9 million), and high
incomes (median annual income = $100,000- $149,999).
Respondents first rated their current net worth, defined as the total value of their
savings, investments and assets minus any borrowing/mortgages (percentage endorsing
each option in parentheses): (a) under $375,000, (b) $375,000 - $749,999, (c) $750,000 -
$999,999, (d) $1 million - $1.49 million, (e) $1.5 million - $2.9 million (48.6%), (f) $3
million - $7.9 million (28.2%), (g) $8 million - $14.9 million (11.6%), (h) 15 million +
(11.6%), (i) would rather not say. Respondents who indicated a net worth of under $1.5
million or who responded (i) were screened out of the survey (a decision made by the
survey organization prior to data collection).
Respondents then completed a series of questions included by the sponsoring
organization. Finally, respondents rated their satisfaction with their life in general: “All
things considered, I am satisfied with my life” on a 1 (Strongly Disagree) to 7 (Strongly
Agree) scale. Such single-item measures assessing life satisfaction are commonly used in
both panel data (e.g., Blanchflower & Oswald, 2004; Lucas & Donnellan, 2012) and
convenience samples (e.g., Diener, Horwitz & Emmons, 1985; Dunn et al., 2008) and
have been found to be highly reliable (Abdel-Khalek, 2006).
Respondents reported their individual income on an annual basis, including any
bonuses and/or investment income (percentage endorsing each option in parentheses): (a)
no current income (1.2%), (b) under $50,000 (34.6%), (c) $50,000 - $99,000 (10.4%), (d)
$100,000 - $149,999 (9.1%), (e) $150,000 - $199,999 (6.2%), (f) $200,000 - $249,999
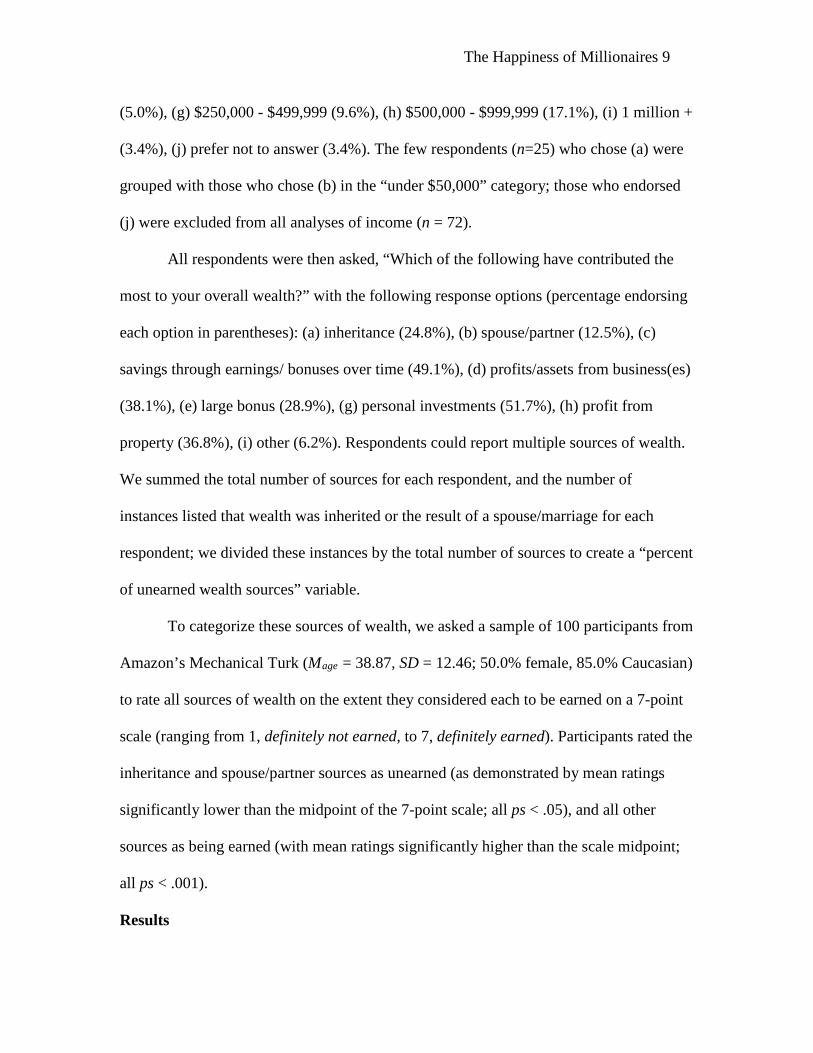
The Happiness of Millionaires 9 (5.0%), (g) $250,000 - $499,999 (9.6%), (h) $500,000 - $999,999 (17.1%), (i) 1 million +
(3.4%), (j) prefer not to answer (3.4%). The few respondents (n=25) who chose (a) were
grouped with those who chose (b) in the “under $50,000” category; those who endorsed
(j) were excluded from all analyses of income (n = 72).
All respondents were then asked, “Which of the following have contributed the
most to your overall wealth?” with the following response options (percentage endorsing
each option in parentheses): (a) inheritance (24.8%), (b) spouse/partner (12.5%), (c)
savings through earnings/ bonuses over time (49.1%), (d) profits/assets from business(es)
(38.1%), (e) large bonus (28.9%), (g) personal investments (51.7%), (h) profit from
property (36.8%), (i) other (6.2%). Respondents could report multiple sources of wealth.
We summed the total number of sources for each respondent, and the number of
instances listed that wealth was inherited or the result of a spouse/marriage for each
respondent; we divided these instances by the total number of sources to create a “percent
of unearned wealth sources” variable.
To categorize these sources of wealth, we asked a sample of 100 participants from
Amazon’s Mechanical Turk (Mage = 38.87, SD = 12.46; 50.0% female, 85.0% Caucasian)
to rate all sources of wealth on the extent they considered each to be earned on a 7-point
scale (ranging from 1, definitely not earned, to 7, definitely earned). Participants rated the
inheritance and spouse/partner sources as unearned (as demonstrated by mean ratings
significantly lower than the midpoint of the 7-point scale; all ps < .05), and all other
sources as being earned (with mean ratings significantly higher than the scale midpoint;
all ps < .001).
Results
The Happiness of Millionaires 10
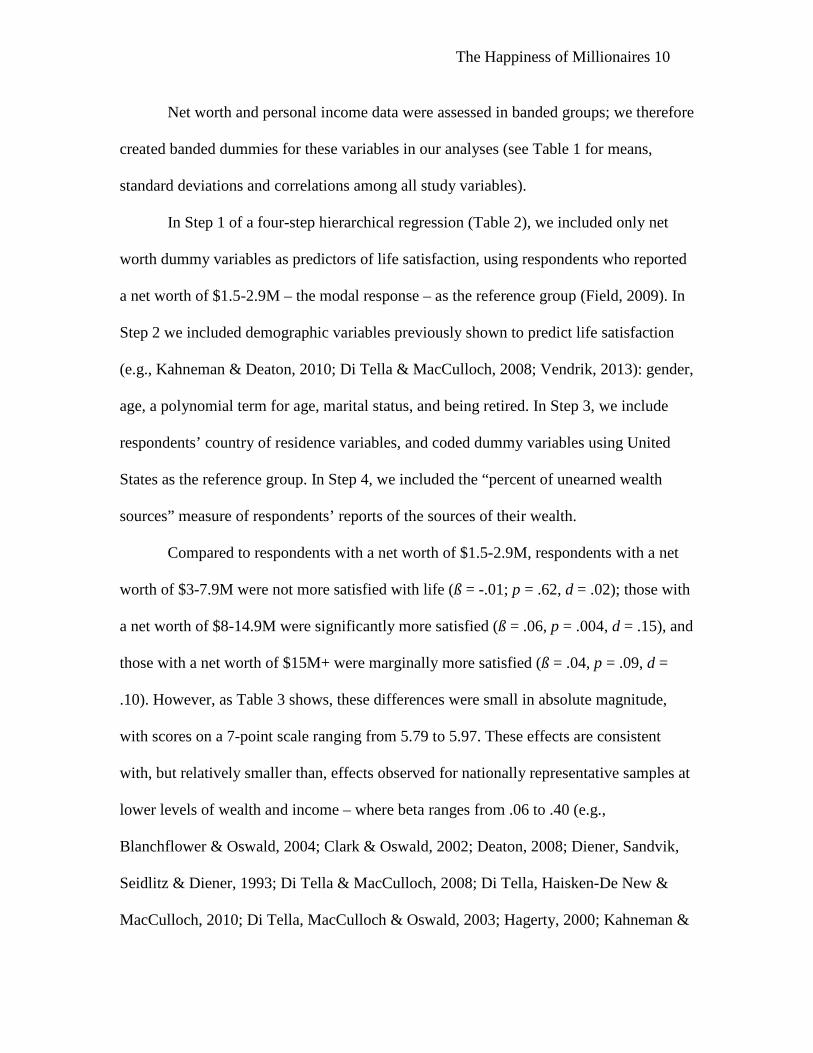
Net worth and personal income data were assessed in banded groups; we therefore
created banded dummies for these variables in our analyses (see Table 1 for means,
standard deviations and correlations among all study variables).
In Step 1 of a four-step hierarchical regression (Table 2), we included only net
worth dummy variables as predictors of life satisfaction, using respondents who reported
a net worth of $1.5-2.9M – the modal response – as the reference group (Field, 2009). In
Step 2 we included demographic variables previously shown to predict life satisfaction
(e.g., Kahneman & Deaton, 2010; Di Tella & MacCulloch, 2008; Vendrik, 2013): gender,
age, a polynomial term for age, marital status, and being retired. In Step 3, we include
respondents’ country of residence variables, and coded dummy variables using United
States as the reference group. In Step 4, we included the “percent of unearned wealth
sources” measure of respondents’ reports of the sources of their wealth.
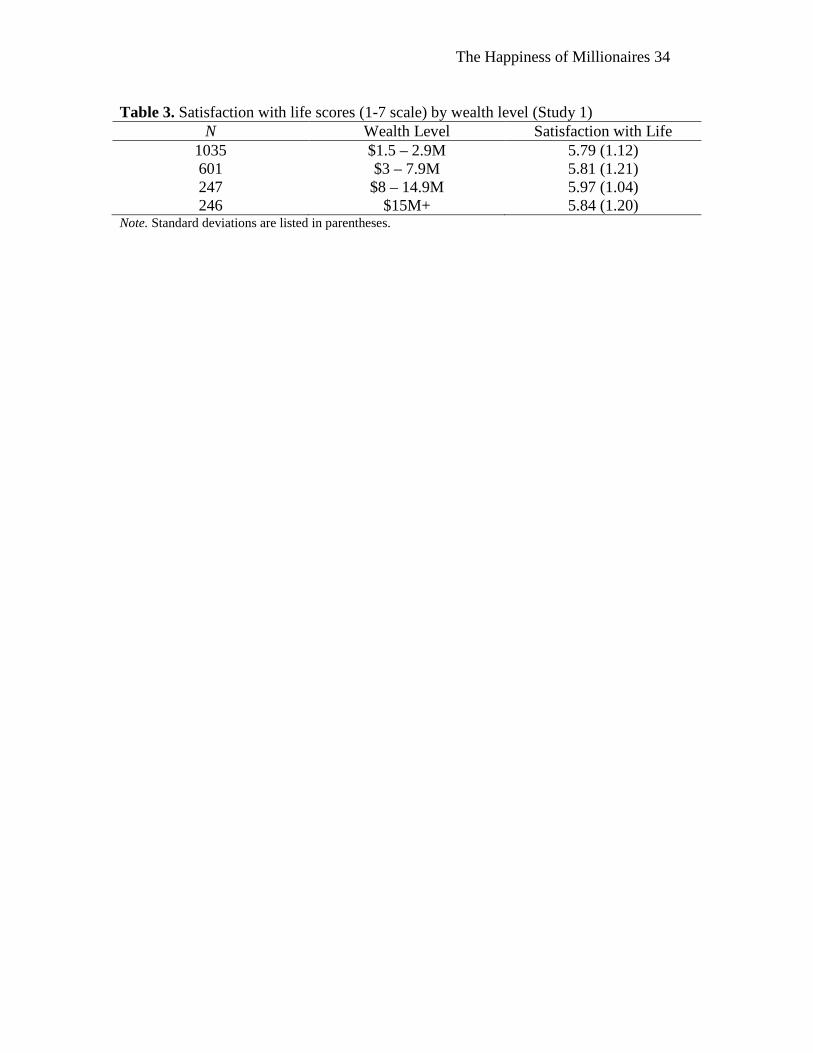
Compared to respondents with a net worth of $1.5-2.9M, respondents with a net
worth of $3-7.9M were not more satisfied with life (ß = -.01; p = .62, d = .02); those with
a net worth of $8-14.9M were significantly more satisfied (ß = .06, p = .004, d = .15), and
those with a net worth of $15M+ were marginally more satisfied (ß = .04, p = .09, d =
.10). However, as Table 3 shows, these differences were small in absolute magnitude,
with scores on a 7-point scale ranging from 5.79 to 5.97. These effects are consistent
with, but relatively smaller than, effects observed for nationally representative samples at
lower levels of wealth and income – where beta ranges from .06 to .40 (e.g.,
Blanchflower & Oswald, 2004; Clark & Oswald, 2002; Deaton, 2008; Diener, Sandvik,
Seidlitz & Diener, 1993; Di Tella & MacCulloch, 2008; Di Tella, Haisken-De New &
MacCulloch, 2010; Di Tella, MacCulloch & Oswald, 2003; Hagerty, 2000; Kahneman &
The Happiness of Millionaires 11 Deaton, 2010; Stevenson & Wolfers, 2008; Vendrik, 2013) – perhaps demonstrating the
marginal utility of wealth on well-being.
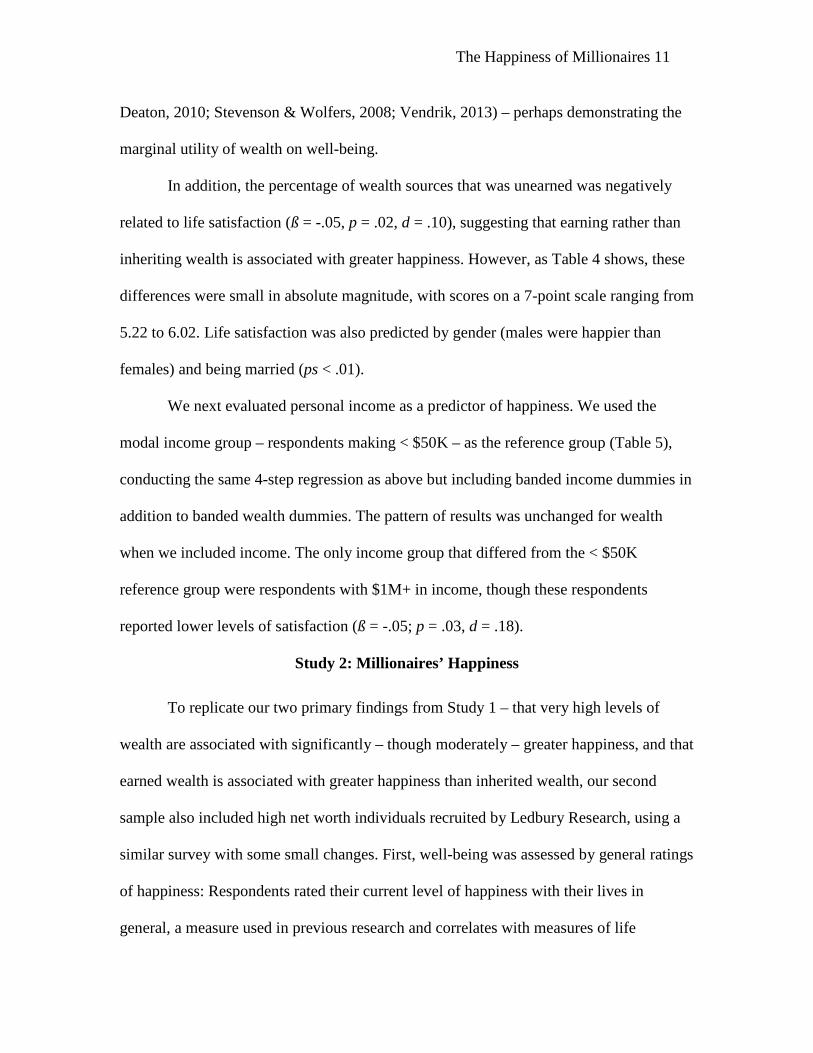
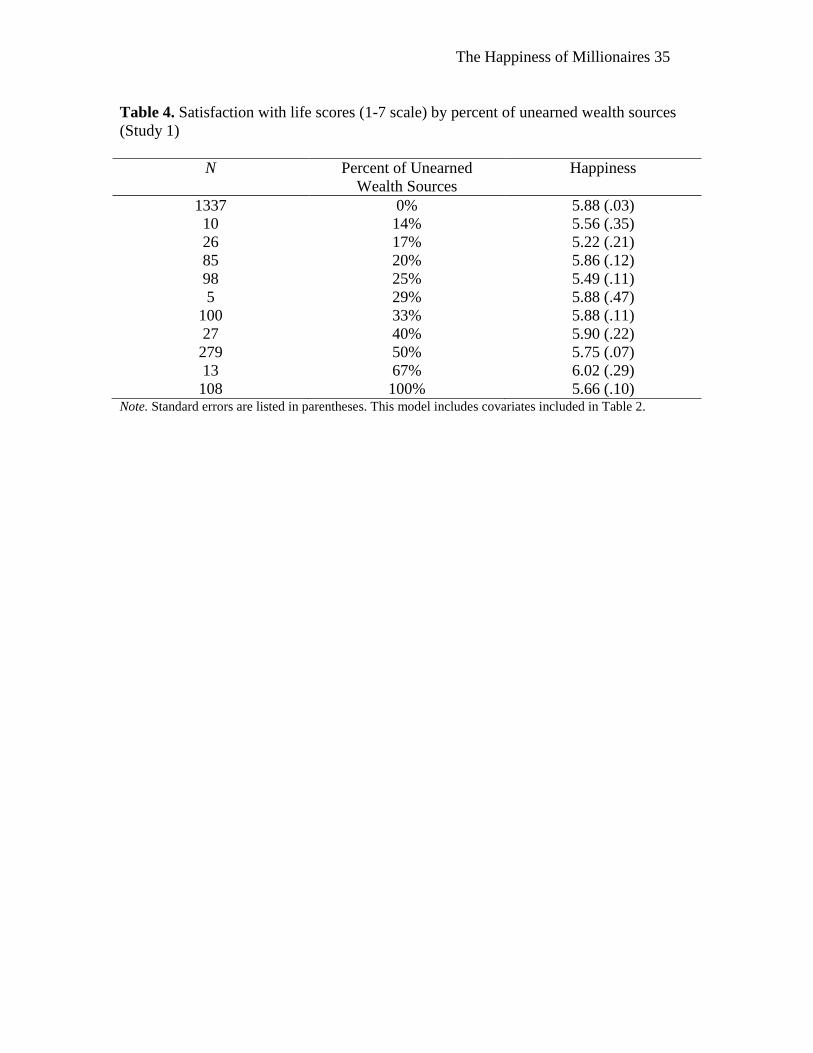
In addition, the percentage of wealth sources that was unearned was negatively
related to life satisfaction (ß = -.05, p = .02, d = .10), suggesting that earning rather than
inheriting wealth is associated with greater happiness. However, as Table 4 shows, these
differences were small in absolute magnitude, with scores on a 7-point scale ranging from
5.22 to 6.02. Life satisfaction was also predicted by gender (males were happier than
females) and being married (ps < .01).
We next evaluated personal income as a predictor of happiness. We used the
modal income group – respondents making < $50K – as the reference group (Table 5),
conducting the same 4-step regression as above but including banded income dummies in
addition to banded wealth dummies. The pattern of results was unchanged for wealth
when we included income. The only income group that differed from the < $50K
reference group were respondents with $1M+ in income, though these respondents
reported lower levels of satisfaction (ß = -.05; p = .03, d = .18).
Study 2: Millionaires’ Happiness
To replicate our two primary findings from Study 1 – that very high levels of
wealth are associated with significantly – though moderately – greater happiness, and that
earned wealth is associated with greater happiness than inherited wealth, our second
sample also included high net worth individuals recruited by Ledbury Research, using a
similar survey with some small changes. First, well-being was assessed by general ratings
of happiness: Respondents rated their current level of happiness with their lives in
general, a measure used in previous research and correlates with measures of life
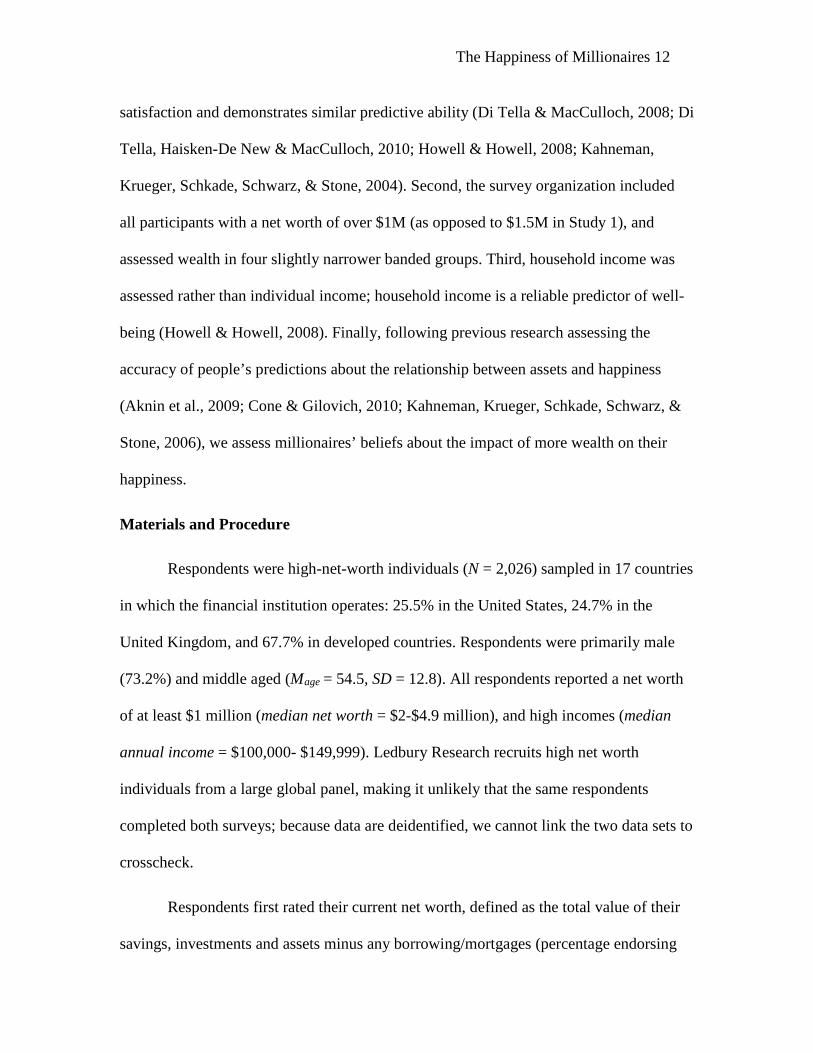
The Happiness of Millionaires 12 satisfaction and demonstrates similar predictive ability (Di Tella & MacCulloch, 2008; Di
Tella, Haisken-De New & MacCulloch, 2010; Howell & Howell, 2008; Kahneman,
Krueger, Schkade, Schwarz, & Stone, 2004). Second, the survey organization included
all participants with a net worth of over $1M (as opposed to $1.5M in Study 1), and
assessed wealth in four slightly narrower banded groups. Third, household income was
assessed rather than individual income; household income is a reliable predictor of well-
being (Howell & Howell, 2008). Finally, following previous research assessing the
accuracy of people’s predictions about the relationship between assets and happiness
(Aknin et al., 2009; Cone & Gilovich, 2010; Kahneman, Krueger, Schkade, Schwarz, &
Stone, 2006), we assess millionaires’ beliefs about the impact of more wealth on their
happiness.
Materials and Procedure
Respondents were high-net-worth individuals (N = 2,026) sampled in 17 countries
in which the financial institution operates: 25.5% in the United States, 24.7% in the
United Kingdom, and 67.7% in developed countries. Respondents were primarily male
(73.2%) and middle aged (Mage = 54.5, SD = 12.8). All respondents reported a net worth
of at least $1 million (median net worth = $2-$4.9 million), and high incomes (median
annual income = $100,000- $149,999). Ledbury Research recruits high net worth
individuals from a large global panel, making it unlikely that the same respondents
completed both surveys; because data are deidentified, we cannot link the two data sets to
crosscheck.
Respondents first rated their current net worth, defined as the total value of their
savings, investments and assets minus any borrowing/mortgages (percentage endorsing
The Happiness of Millionaires 13 each option in parentheses): (a) under $250,000, (b) $250,000 - $499,999, (c) $500,000 -
$749,999, (d) $750,000 - $999,999, (e) $1 million - $1.9 million (49.0%), (f) $2 million -
$4.9 million (32.4%), (g) $5 million - $9.9 million (8.7%), (h) $10 million + (9.9%), (i)
would rather not say. Respondents who indicated a net worth of under $1 million or who
responded (i) were screened out of the survey (a decision made by the survey
organization prior to data collection).
Respondents then completed a series of questions included by the sponsoring
organization. Finally, respondents rated their general happiness: “How would you rate
your current level of happiness with your life in general on a 1 to 10 scale, where 1
equals ‘Extremely Unhappy’ and 10 equals ‘Extremely Happy’?”
Respondents who did not answer “10” to the happiness question were then asked,
“What increase in your wealth do you think would move you one point higher on the
scale?” and given six options: (a) no increase would change my happiness, (b) a 10%
increase in your current wealth, (c) a 50% increase in your current wealth, (d) double
your current wealth, (e) 5 times your current wealth, and (f) 10 times your current wealth.
Only respondents who had not answered “no increase would change my happiness” to the
1-point increase question and had not reported a “9” or “10” to the happiness question,
then answered “What increase in your wealth do you think would move you to a 10 on
the scale (extremely happy)?” using the same six response options.
Respondents reported their household income on an annual basis, including any
bonuses and/or investment income (percentage endorsing each option in parentheses): (a)
no current income (0.2%), (b) under $50,000 (3.8%), (c) $50,000 - $99,999 (21.6%), (d)
$100,000 - $149,999 (22.0%), (e) $150,000 - $199,999 (11.9%), (f) $200,000 - $249,999
The Happiness of Millionaires 14 (8.7%), (g) $250,000 - $499,999 (13.2%), (h) $500,000 - $999,999 (5.1%), (i) 1 million +
(6.7%), (j) prefer not to answer (6.8%). The few respondents (n=4) who chose (a) were
grouped with those who chose (b) in the “under $50,000” category; those who endorsed
(j) were excluded from all analyses of income (n = 138).
All respondents were then asked, “Which of the following have contributed the
most to your overall wealth?” with the following response options (percentage endorsing
each option in parentheses): (a) inheritance (25.4%), (b) spouse/partner (18.4%), (c)
savings through earnings/ bonuses over time (55.5%), (d) profits/assets from business(es)
(32.9%), (e) profits/assets from business(es) (15.5%), (f) large bonus (12.9%), (g)
personal investments (55.2%), (h) profit from property (33.6%), (i) other (1.1%).
Respondents could report multiple sources of wealth. We summed the total number of
sources for each respondent, and the number of instances listed that wealth was inherited
or the result of a spouse/marriage for each respondent; we divided these instances by the
total number of sources to create a “percent of unearned wealth sources” variable.
Results
Net worth and household income data were assessed in banded groups, albeit in
different bands than the previous sample; we again created banded dummies for these
variables in our analyses (see Table 6 for means, standard deviations and correlations
among all study variables). We used the same four-step hierarchical regression as Study 1
(Table 7), including the same variables as before in each step.
Compared to respondents with a net worth of $1-1.9M, respondents with a net
worth of either $2-4.9M or $5-9.9M were not happier (ßs = .01 and -.02, ps = .57 and .40,
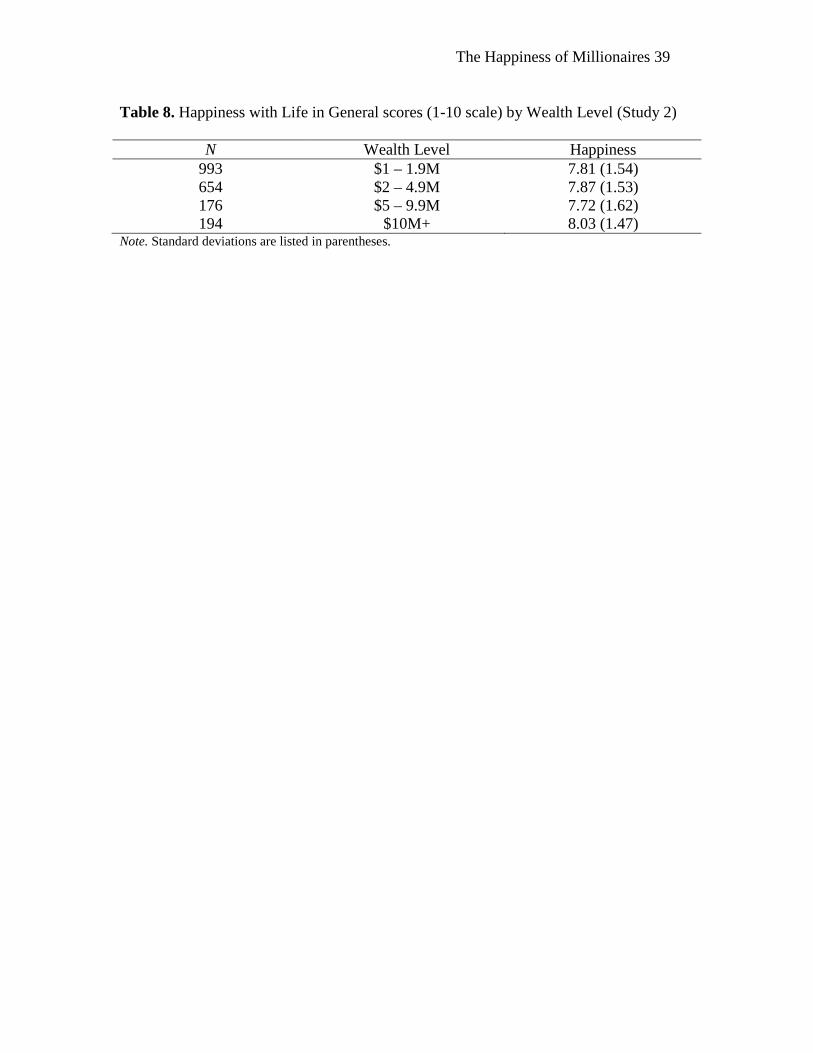
ds = .02 and .06); those with a net worth of $10M+, however, were significantly happier
The Happiness of Millionaires 15 (ß = .06, p = .02, d = .16). However, as Table 8 shows, these differences were again small
in absolute magnitude, with scores on a 10-point scale ranging from 7.72 to 8.03. As in
Sample 1, these effects were also consistent with, but relatively smaller than, effects
observed in nationally representative samples at lower levels of wealth and income.
Also as in Sample 1, the percentage of wealth that was unearned was negatively
related to happiness (ß = -.05, p = .04, d = .09). However, as Table 9 shows, these
differences were again small in absolute magnitude, with scores on a 10-point scale
ranging from 7.38 to 8.05. Happiness was also significantly predicted by being married,
and being retired (ps < .007).
Predictions of the amount of wealth needed to increase happiness were similar
across wealth levels. The most common response for a 1-point increase in happiness was
“no increase” (36.8%), followed by “100% more” (22.3%), and “50% more” (18.4%);
this pattern did not differ by wealth, χ2 (15) = 7.43, p = .95, d = .01 (see Table 10). The
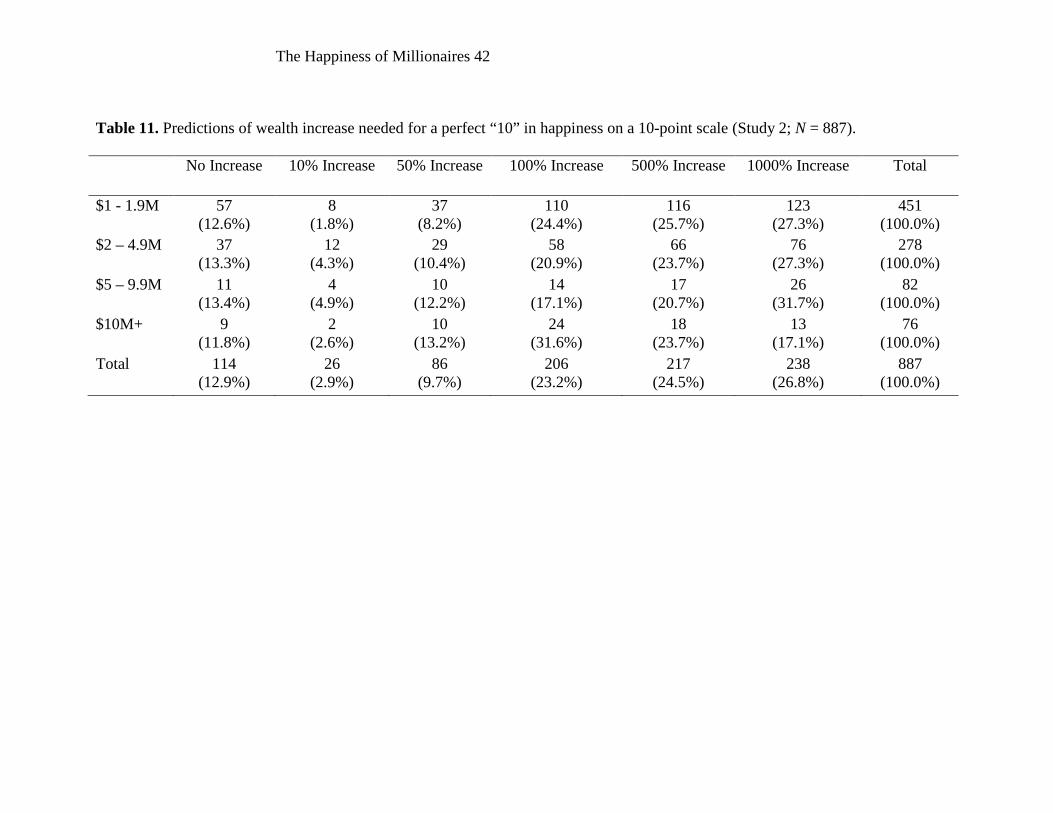
percentage increase needed was larger for an increase in happiness to a “perfect 10,” with
“1,000% more” the most frequent (26.8%) followed by “500% more” (24.5%), and
“100% more” (23.2%); this pattern again did not differ by wealth, χ2 (15) = 16.62, p =
.34, d = .04 (see Table 11). We note that “no increase would change my happiness” item
is ambiguous, such that endorsing this item could either indicate that respondents were
happy with the wealth they had (such that no change would affect their happiness), or that
the level of wealth needed to change their happiness was unrealistically large (such that
no increase exists that would affect their happiness). Despite this ambiguity, we note that
for both questions, the majority of respondents reported a specific numerical change in
wealth that they believed would change their happiness.
The Happiness of Millionaires 16
We evaluated household income as a predictor of happiness, including all banded
net worth and banded income variables in the same regression (Table 12), which did not
change the pattern of results for net worth: again, only respondents worth $10M+ were
significantly happier than those worth $1-1.9M (ß = .05, p = .04, d = .13). No income
groups differed from the < $50K reference group. Thus while both samples show
converging evidence that high levels of wealth are associated with greater happiness,
results for income are more mixed, with higher incomes in Study 1 negatively associated
with life satisfaction but in Study 2 not associated with happiness. While we can only
speculate, Study 1 assessed personal income and Study 2 household income, and these
two metrics may relate to different aspects of well-being.
Discussion
Is greater wealth associated with greater well-being? Overall, using two large
samples of millionaires with two measures of well-being (happiness in general and life
satisfaction), we find consistent evidence that somewhat higher levels of wealth are not
associated with higher well-being, but substantially higher levels (greater than $8M in
Sample 1, greater than $10M in Sample 2) are linked to modestly greater well-being.
Augmenting some models of the money-happiness link that suggest a “flattening
out” of the curve once an income threshold has been reached – for example, $75,000
(Kahneman & Deaton, 2010) – our results suggest that the curve does not fully flatten
out: great wealth does predict greater happiness. Research suggests that wealth can have
mixed effects on happiness: while the wealthy are more likely to engage in some
behaviors associated with increased well-being – such as volunteering at non-profit
The Happiness of Millionaires 17 organizations (Dury et al., 2015; Tang et al., 2008), giving money to those in need
(Smeets, Bauer, & Gneezy, 2015), and donating their used items for reuse (Granzin &
Olsen, 1991) – they are less likely to engage in other behaviors linked to well-being –
such as behaving charitably toward others (Piff, Kraus, Cote, Cheng, & Keltner, 2010).
Our results suggest that despite these conflicting effects of wealth on the pursuit of
happiness-inducing activities, sufficiently high wealth does indeed predict modestly
greater happiness.
Why might greater wealth lead to greater happiness among millionaires? Diener,
Horwitz and Emmon’s (1985) study of millionaires shows that the wealthy believe that
money increases their happiness when used to help others and the world, and that money
provides increased freedom to choose leisure activities and friends. Indeed, wealth
enables people to take greater control of their lives, by giving the wealthy greater
autonomy over how they choose to spend their time (Gallo & Matthews, 2003; Kraus,
Piff, Mendoza-Denton, Rheinschmidt, & Keltner, 2012), and such feelings have been
associated with higher life satisfaction (Howell & Howell, 2008). While a number of
researchers have cited need theory to explain the diminishing marginal effect of wealth
and well-being (e.g., Howell & Howell, 2008), perhaps at the higher end, wealth
increases millionaires’ sense of efficacy in carrying out goals (Lachman & Weaver,
1998). In addition, it is possible that wealth helps millionaires’ to achieve the
fundamental human goal of high status (Anderson, Hildreth, & Howland, 2015). While
our datasets do not allow us to examine these potential mediating processes, we hope that
future research explores these issues in more depth.
The Happiness of Millionaires 18
In addition, both samples document a novel factor determining the wealth-
happiness link: whether millionaires earned or inherited their wealth. While previous
research has focused on the effect of spending money in different ways (Dunn et al.,
2014; Gilovich & Kumar, 2015), we focus instead on the effects on well-being of the
manner in which money was acquired. Whereas previous research demonstrates that
inheriting wealth can decrease desire for employment, we show that inheriting wealth has
a psychological effect as well: the percentage of wealth that people earned serves as a
positive predictor of general happiness. While we found the percentage of unearned
wealth sources to negatively predict happiness, our data does not allow us to calculate the
actual proportion of wealth that was earned or unearned. While a convenience sample
evaluated receiving an inheritance and acquiring money through marriage as an unearned
source of wealth, we cannot be certain that recipients of inheritances and wealth through
marriage would evaluate these sources of wealth as being unearned. Future research
should evaluate how perceptions of earning wealth impact well-being; one possibility is
that the effort of earning leads people to value their wealth more, in the same way that
effort leads people to more highly value social groups, consumer products, and even
psychotherapy (Aronson & Mills, 1959; Axsom & Cooper, 1965; Norton, Mochon, &
Ariely, 2012). In sum, we show that, in addition to microeconomic factors that determine
the relationship between money and happiness – such as economic inequality (Oishi,
Kesebir, & Diener, 2011) – a novel microeconomic factor shapes happiness: whether
wealth was inherited or earned.
We note that, as in all cross-sectional data assessing the money-happiness link,
our results are correlational: we can say neither that very high levels of wealth cause
The Happiness of Millionaires 19 greater happiness, nor that earning wealth causes greater happiness than inheriting it. For
example, causation may run in the opposite direction, with higher well-being leading to
higher wealth (Lyubomirsky, King, & Diener, 2005); indeed, happier people are more
likely to obtain a college degree, to get promoted in their jobs, and to earn greater wealth
(De Neve & Oswald, 2012). We are also unable to assess whether inheritors and earners
differ on other variables such as intelligence or conscientiousness, which may account for
the differences in happiness we observe; for instance, our effects may vary as a function
of the extent to which millionaires measure their self-worth on their financial success
(Park, Ward, & Naragon-Gainey, 2017). In addition, because the two samples assessed
wealth using different banded groups, we are unable to identify a common “tipping
point” in which happiness should be greatest, though the two samples do suggest that this
tipping point occurs only at high levels of wealth compared to lower levels of wealth.
And finally, while the sample sizes of our study are relatively large for this population –
millionaires – we cannot be certain that they are representative of millionaires in general
(though of course, millionaires are by definition an unrepresentative group).
Still, taken together, these results suggest that millionaires’ belief that increased
wealth is associated with increased happiness is more likely to be realized at high levels
of wealth, and when they have earned it.

The Happiness of Millionaires 20
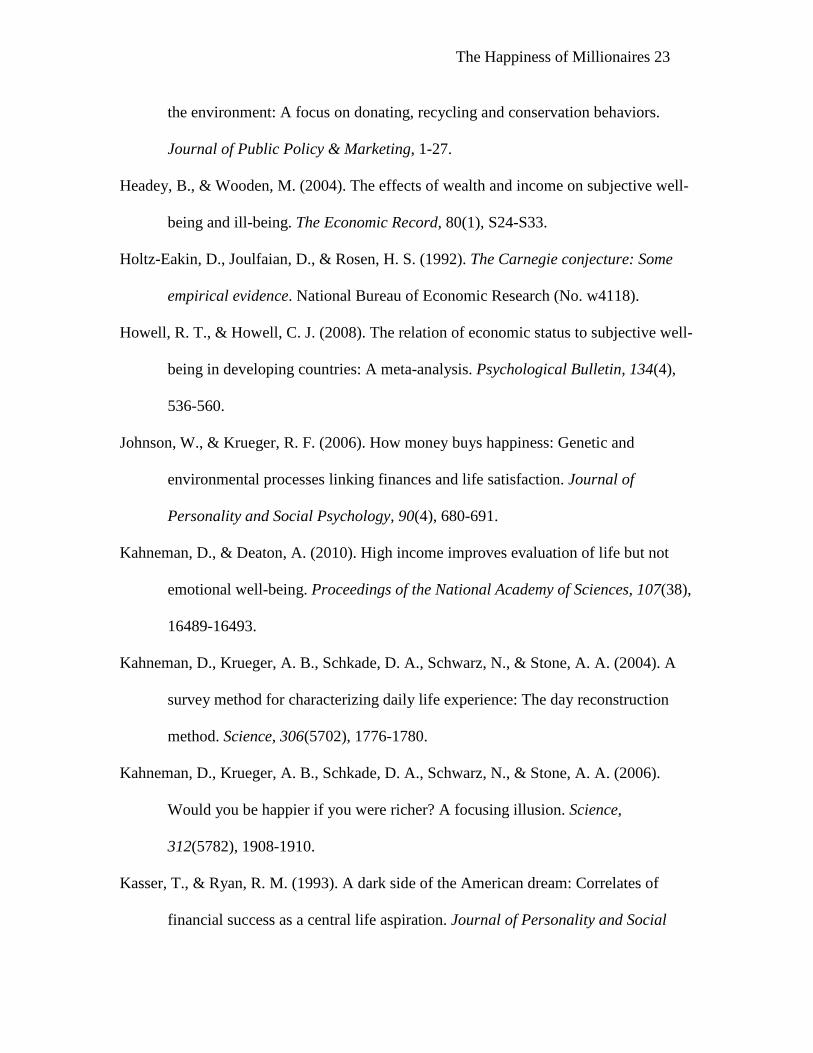
References
Abdel-Khalek, A. M. (2006). Measuring happiness with a single-item scale. Social
Behavior and Personality: An International Journal, 34(2), 139-150.
Aknin, L. B., Norton, M. I., & Dunn, E. W. (2009). From wealth to well-being? Money
matters, but less than people think. Journal of Positive Psychology, 4(6), 523-527.
Anderson, C., Hildreth, J. A. D., & Howland, L. (2015). Is the desire for status a
fundamental human motive? A review of the empirical literature. Psychological
Bulletin, 141(3), 574-601.
Arkes, H. R., Joyner, C. A., Pezzo, M. V., Gradwohl-Nash, J., Siegel-Jacobs, K., &
Stone, E. (1994). The psychology of windfall gains. Organizational Behavior &
Human Decision Processes, 59, 331-347.
Biswas-Diener, R., & Diener, E. (2006). The subjective well-being of the homeless, and
lessons for happiness. Social Indicators Research, 76(2), 185-205.
Blanchflower, D. G., & Oswald, A. J. (2004). Well-being over time in Britain and the
USA. Journal of Public Economics, 88(7), 1359-1386.
Brickman, P., Coates, D., & Janoff-Bulman, R. (1978). Lottery winners and accident
victims: Is happiness relative? Journal of Personality and Social Psychology,
36(8), 917-927.
Carnegie, A. (1962). The advantages of poverty. In Edward C. Kirkland (Ed.), The gospel
of wealth and other timely essays. Cambridge, MA: The Belknap Press of Harvard
University Press: 50-77.
Cone, J., & Gilovich, T. (2010). Understanding money’s limits: People’s beliefs about the
income-happiness correlation. Journal of Positive Psychology, 5(4), 294-301.

The Happiness of Millionaires 21 Cummings, R. A. (2000). Personal income and subjective well-being: A review. Journal
of Happiness Studies, 1(2), 133-158.
De Neve, J., & Oswald, A. J. (2012). Estimating the influence of life satisfaction and
positive affect on later income using sibling fixed-effects. Proceedings of the
National Academy of Sciences, 109(49), 19953-19958.
Diener, E., Diener, M. (2009). Cross-cultural correlates of life satisfaction and self-
esteem. Journal of Personality and Social Psychology, 68, 653-663.
Diener, E., Horwitz, J., & Emmons, R. A. (1985). Happiness of the very wealthy. Social
Indicators Research, 16(3), 263-274.
Diener, E., Ng, W., Harter, J., & Arora, R. (2010). Wealth and happiness across the
world: Material prosperity predicts life evaluation, whereas psychosocial
prosperity predicts positive feeling. Journal of Personality and Social
Psychology, 99(1), 52-61.
Diener, E., Tay, L., & Oishi, S. (2013). Rising income and the subjective well-being of
nations. Journal of Personality and Social Psychology, 104(2), 267-305.
Di Tella, R., Haisken-De New, J., & MacCulloch, R. (2010). Happiness adaptation to
income and to status in an individual panel. Journal of Economic Behavior &
Organization, 76(3), 834-852.
Di Tella, R., & MacCulloch, R. (2008). Gross national happiness as an answer to the
Easterlin Paradox? Journal of Development Economics, 86(1), 22-42.
Dunn, E.W., Aknin, L.B., & Norton, M.I. (2008). Spending money on others promotes
happiness. Science, 319, 1687-1688.
Dunn, E.W., Aknin, L.B., & Norton, M.I. (2014). Prosocial spending and happiness:
The Happiness of Millionaires 22
Using money to benefit others pays off. Current Directions in Psychological
Science, 23, 41-47.
Dury, S., De Donder, L., De Witte, N., Buffel, T., Jacquet, W., & Verte, D. (2015). To
volunteer or not: The influence of individual characteristics, resources, and social
factors on the likelihood of volunteering by older adults. Nonprofit and Voluntary
Sector Quarterly, 44(6), 1107-1128.
Elinder, M., Erixson, O., & Ohlsson, H. (2012). The impact of inheritances on heirs’
labor and capital income. The BE Journal of Economic Analysis & Policy, 12(1),
1953-1982.
Epley, N., & Gneezy, A. (2007). The framing of financial windfalls and implications for
public policy. Journal of Socio-economics, 36, 36-47.
Field, A. (2009). Discovering statistics using SPSS. Sage Publications.
Gallo, L. C. & Matthews, K. A. (2003). Understanding the association between
socioeconomic status and physical health: Do negative emotions play a role?
Psychological Bulletin, 129(1), 10-51.
Gardner, J. & Oswald, A. J. (2007). Money and mental wellbeing: A longitudinal study
of medium-sized lottery wins. Journal of Health Economics, 26(1), 49-60.
Gilovich, T., & Kumar, A. (2015). We’ll always have Paris: The Hedonic Payoff from
Experiential and Material Investments. In M.P. Zanna and J.M. Olson (Eds.),
Advances in experimental social psychology, Vol. 51, AESP, UK: Academic
Press.
Granzin, K. L., & Olsen, J. E. (1991). Characterizing participants in activities protecting
The Happiness of Millionaires 23
the environment: A focus on donating, recycling and conservation behaviors.
Journal of Public Policy & Marketing, 1-27.
Headey, B., & Wooden, M. (2004). The effects of wealth and income on subjective well-
being and ill-being. The Economic Record, 80(1), S24-S33.
Holtz-Eakin, D., Joulfaian, D., & Rosen, H. S. (1992). The Carnegie conjecture: Some
empirical evidence. National Bureau of Economic Research (No. w4118).
Howell, R. T., & Howell, C. J. (2008). The relation of economic status to subjective well-
being in developing countries: A meta-analysis. Psychological Bulletin, 134(4),
536-560.
Johnson, W., & Krueger, R. F. (2006). How money buys happiness: Genetic and
environmental processes linking finances and life satisfaction. Journal of
Personality and Social Psychology, 90(4), 680-691.
Kahneman, D., & Deaton, A. (2010). High income improves evaluation of life but not
emotional well-being. Proceedings of the National Academy of Sciences, 107(38),
16489-16493.
Kahneman, D., Krueger, A. B., Schkade, D. A., Schwarz, N., & Stone, A. A. (2004). A
survey method for characterizing daily life experience: The day reconstruction
method. Science, 306(5702), 1776-1780.
Kahneman, D., Krueger, A. B., Schkade, D. A., Schwarz, N., & Stone, A. A. (2006).
Would you be happier if you were richer? A focusing illusion. Science,
312(5782), 1908-1910.
Kasser, T., & Ryan, R. M. (1993). A dark side of the American dream: Correlates of
financial success as a central life aspiration. Journal of Personality and Social
The Happiness of Millionaires 24
Psychology, 65(2), 410-422.
Kraus, M., Piff, P. K., Mendoza-Denton, R., Rheinschmidt, M. L., & Keltner, D. (2012).
Social class, solipsism, and contextualism: How the rich are different from the
poor. Psychological Review, 119(3), 546-72.
Lachman, M. E., & Weaver, S. L. (1998). The sense of control as a moderator of social
class differences in health and well-being. Journal of Personality and Social
Psychology, 74(3), 763-73.
Levav, J., & McGraw, A.P. (2009). Emotional accounting: How feelings about money
influence consumer choice. Journal of Marketing Research, 46, 66-80.
Lyubomirsky, S., King, L. A., & Diener, E. (2005). The benefits of frequent positive
affect. Does happiness lead to success?. Psychological Bulletin, 131(1), 803-55.
Myers, D. G. (2000a). Wealth and well-being. In R. Stannard (Ed.), God for the 21st
Century, Randor, PA: Templeton Foundation.
Myers, D. G. (2000b). The funds, friends and faith of happy people. American
Psychologist, 55(1), 56-67.
Ng, W., & Diener, E. (2014). What matters to the rich and the poor? Subjective well-
being, financial satisfaction, and postmaterialist needs across the world. Journal
of Personality and Social Psychology, 107(2), 326-338.
Oishi, S., Kesebir, S., & Diener, E. (2011). Income inequality and happiness.
Psychological Science, 22, 1095-1100.
Page, B. I., Bartels, L. M., & Seawright, J. (2013). Democracy and the policy preferences
of wealthy Americans. Perspectives on Politics, 11(1), 51-73.
Park, L. E., Ward, D. E., & Naragon-Gainey, K. (2017). It’s all about the money (for
The Happiness of Millionaires 25
some): Consequences of financially self-worth. Personality and Social
Psychology Bulletin, 43(5), 601-22.
Piff, P. K., Kraus, M. W., Cote, S., Cheng, B. H., & Keltner, D. (2010). Having less,
giving more: The influence of social class on prosocial behavior. Journal of
Personality and Social Psychology, 99(5), 771-784.
Smeets, P., Bauer, R., & Gneezy, U. (2015). The giving behavior of millionaires.
Proceedings of the National Academy of Sciences, 34, 10641-10644.
Stevenson, B., & Wolfers, J. (2008). Economic growth and subjective well-being:
Reassessing the Easterlin paradox. National Bureau of Economic Research (No.
w14282).
Tang, T. L. P., Sutarso, T., Davis, G. M. T. W., Dolinski, D., Ibrahim, A. H. S., &
Wagner, S. L. (2008). To help or not to help? The Good Samaritan Effect and the
love of money on helping behavior. Journal of Business Ethics, 82(4), 865-887.
Van Boven, L., & Gilovich, T. (2003). To do or to have: That is the question. Journal of
Personality and Social Psychology, 85, 1193-1202.
Vendrik, M. C. (2013). Adaptation, anticipation and social interaction in happiness: An
integrated error-correction approach. Journal of Public Economics, 105, 131-149.

The Happiness of Millionaires 26 Figure 1. Net Worth (N = 2,129; Study 1)
0
200
400
600
800
1000
1200
$1.5 - 2.9M $3 - 7.9M $8 - 14.9M $15M+
Num
ber o
f Par
ticip
ants
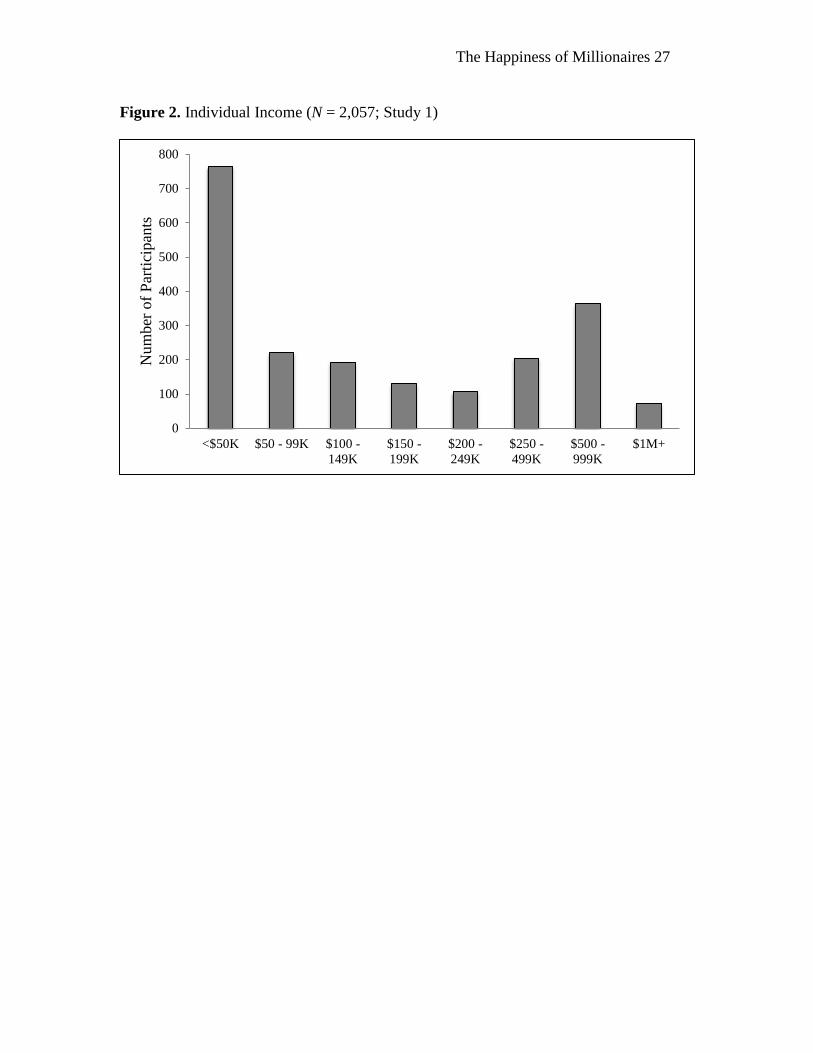
The Happiness of Millionaires 27 Figure 2. Individual Income (N = 2,057; Study 1)
0
100
200
300
400
500
600
700
800
<$50K $50 - 99K $100 -149K
$150 -199K
$200 -249K
$250 -499K
$500 -999K
$1M+
Num
ber o
f Par
ticip
ants
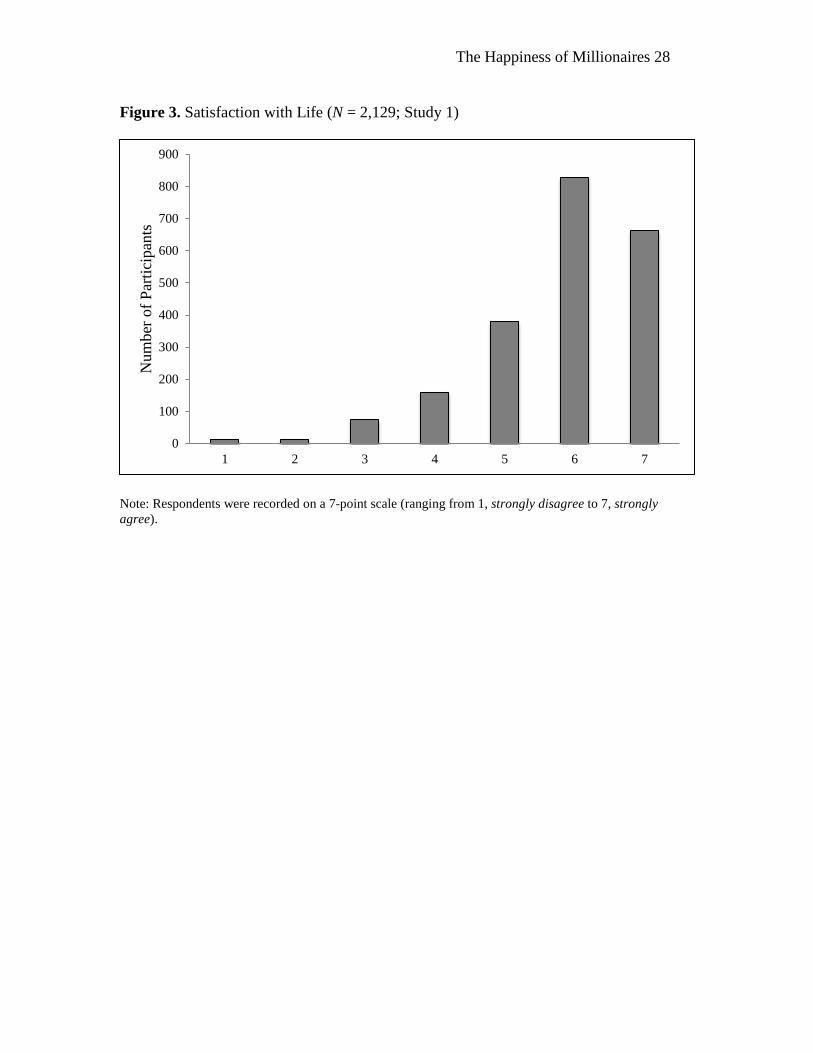
The Happiness of Millionaires 28 Figure 3. Satisfaction with Life (N = 2,129; Study 1)
Note: Respondents were recorded on a 7-point scale (ranging from 1, strongly disagree to 7, strongly agree).
0
100
200
300
400
500
600
700
800
900
1 2 3 4 5 6 7
Num
ber o
f Par
ticip
ants
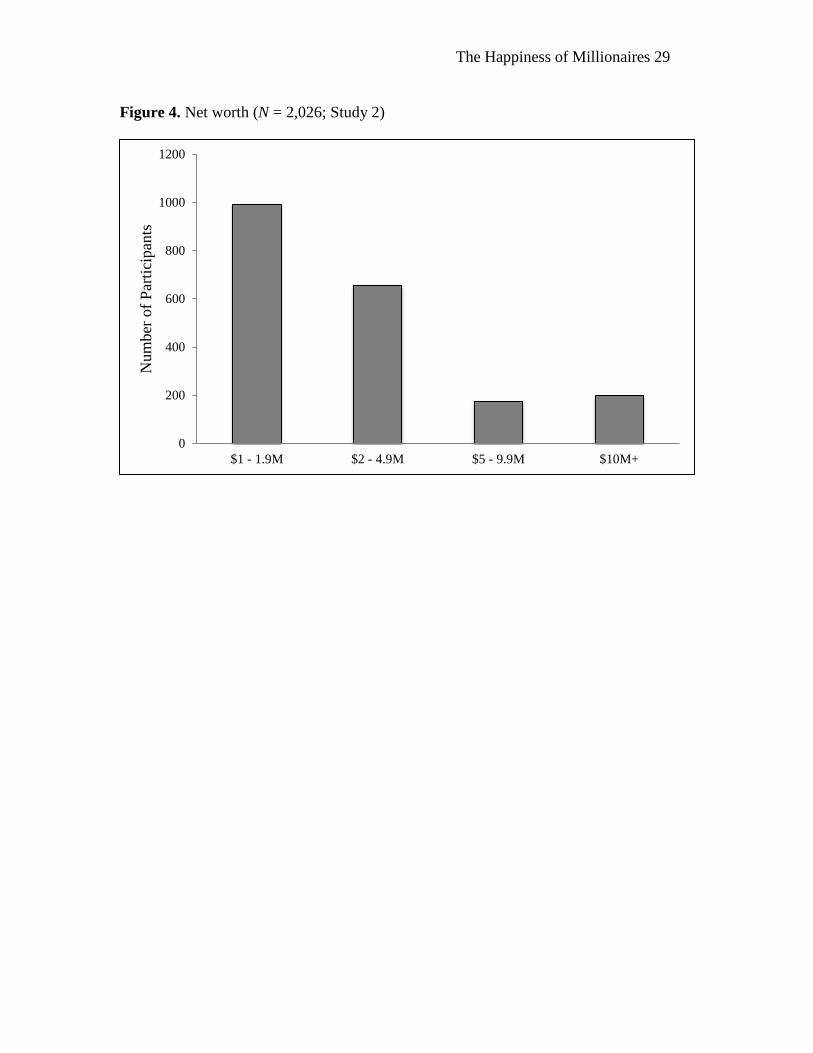
The Happiness of Millionaires 29 Figure 4. Net worth (N = 2,026; Study 2)
0
200
400
600
800
1000
1200
$1 - 1.9M $2 - 4.9M $5 - 9.9M $10M+
Num
ber o
f Par
ticip
ants
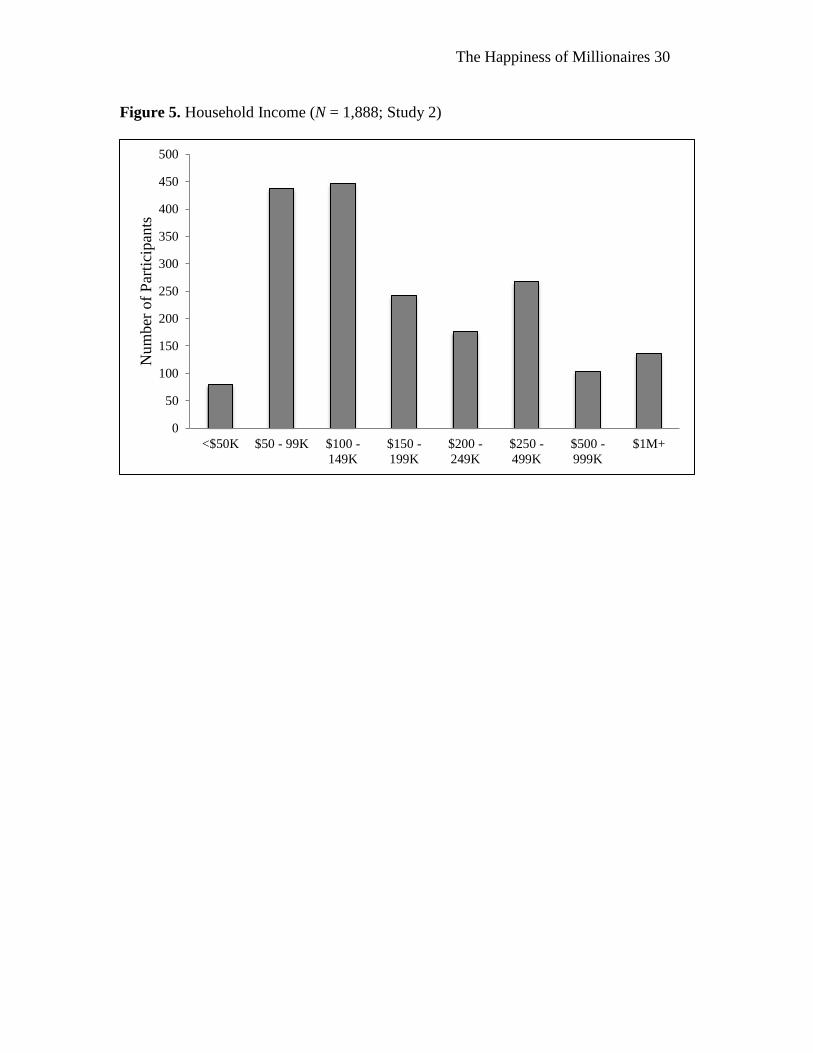
The Happiness of Millionaires 30 Figure 5. Household Income (N = 1,888; Study 2)
0
50
100
150
200
250
300
350
400
450
500
<$50K $50 - 99K $100 -149K
$150 -199K
$200 -249K
$250 -499K
$500 -999K
$1M+
Num
ber o
f Par
ticip
ants
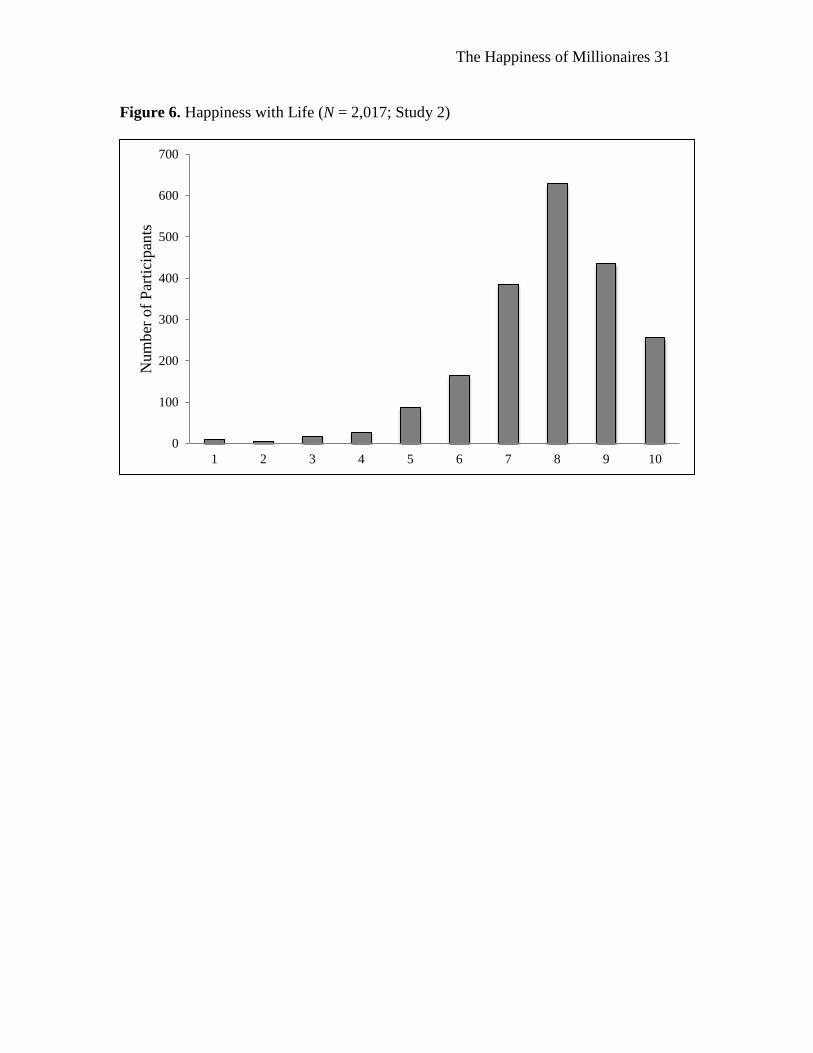
The Happiness of Millionaires 31 Figure 6. Happiness with Life (N = 2,017; Study 2)
0
100
200
300
400
500
600
700
1 2 3 4 5 6 7 8 9 10
Num
ber o
f Par
ticip
ants
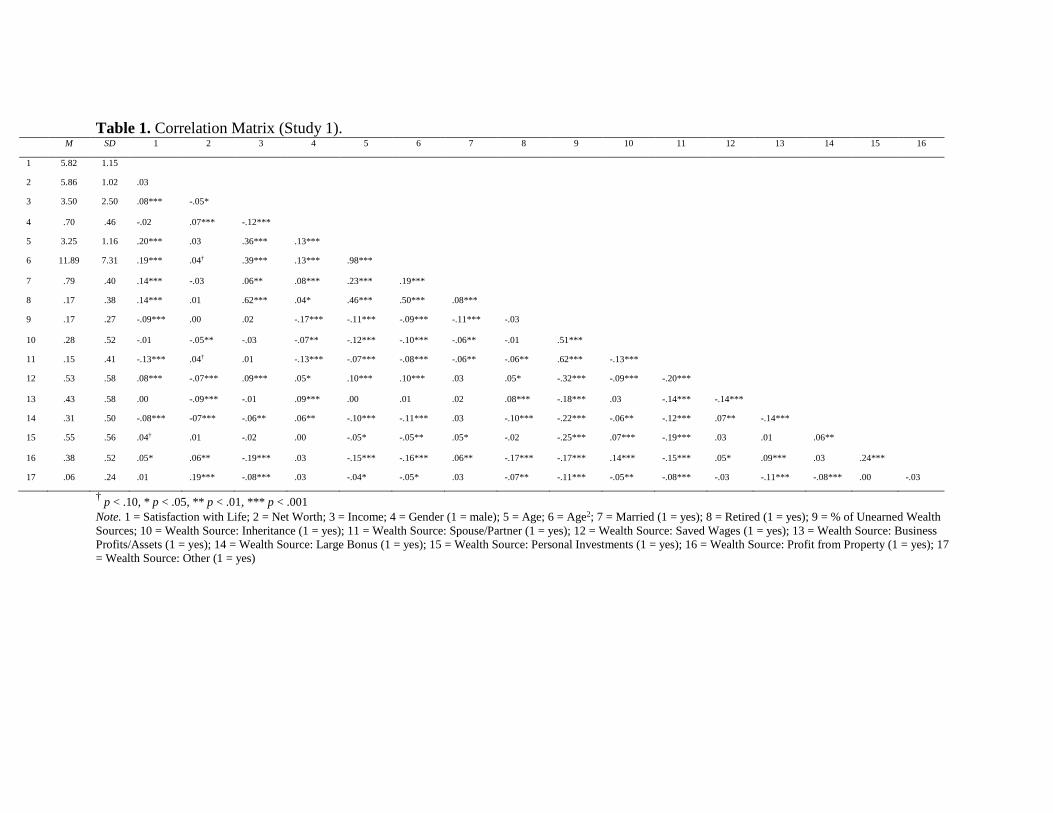
Table 1. Correlation Matrix (Study 1). M SD 1 2 3 4 5 6 7 8 9 10 11 12 13 14 15 16
1 5.82 1.15
2 5.86 1.02 .03
3 3.50 2.50 .08*** -.05*
4 .70 .46 -.02 .07*** -.12***
5 3.25 1.16 .20*** .03 .36*** .13***
6 11.89 7.31 .19*** .04† .39*** .13*** .98***
7 .79 .40 .14*** -.03 .06** .08*** .23*** .19***
8 .17 .38 .14*** .01 .62*** .04* .46*** .50*** .08***
9 .17 .27 -.09*** .00 .02 -.17*** -.11*** -.09*** -.11*** -.03
10 .28 .52 -.01 -.05** -.03 -.07** -.12*** -.10*** -.06** -.01 .51***
11 .15 .41 -.13*** .04† .01 -.13*** -.07*** -.08*** -.06** -.06** .62*** -.13***
12 .53 .58 .08*** -.07*** .09*** .05* .10*** .10*** .03 .05* -.32*** -.09*** -.20***
13 .43 .58 .00 -.09*** -.01 .09*** .00 .01 .02 .08*** -.18*** .03 -.14*** -.14***
14 .31 .50 -.08*** -07*** -.06** .06** -.10*** -.11*** .03 -.10*** -.22*** -.06** -.12*** .07** -.14***
15 .55 .56 .04† .01 -.02 .00 -.05* -.05** .05* -.02 -.25*** .07*** -.19*** .03 .01 .06**
16 .38 .52 .05* .06** -.19*** .03 -.15*** -.16*** .06** -.17*** -.17*** .14*** -.15*** .05* .09*** .03 .24***
17 .06 .24 .01 .19*** -.08*** .03 -.04* -.05* .03 -.07** -.11*** -.05** -.08*** -.03 -.11*** -.08*** .00 -.03
† p < .10, * p < .05, ** p < .01, *** p < .001 Note. 1 = Satisfaction with Life; 2 = Net Worth; 3 = Income; 4 = Gender (1 = male); 5 = Age; 6 = Age2; 7 = Married (1 = yes); 8 = Retired (1 = yes); 9 = % of Unearned Wealth Sources; 10 = Wealth Source: Inheritance (1 = yes); 11 = Wealth Source: Spouse/Partner (1 = yes); 12 = Wealth Source: Saved Wages (1 = yes); 13 = Wealth Source: Business Profits/Assets (1 = yes); 14 = Wealth Source: Large Bonus (1 = yes); 15 = Wealth Source: Personal Investments (1 = yes); 16 = Wealth Source: Profit from Property (1 = yes); 17 = Wealth Source: Other (1 = yes)
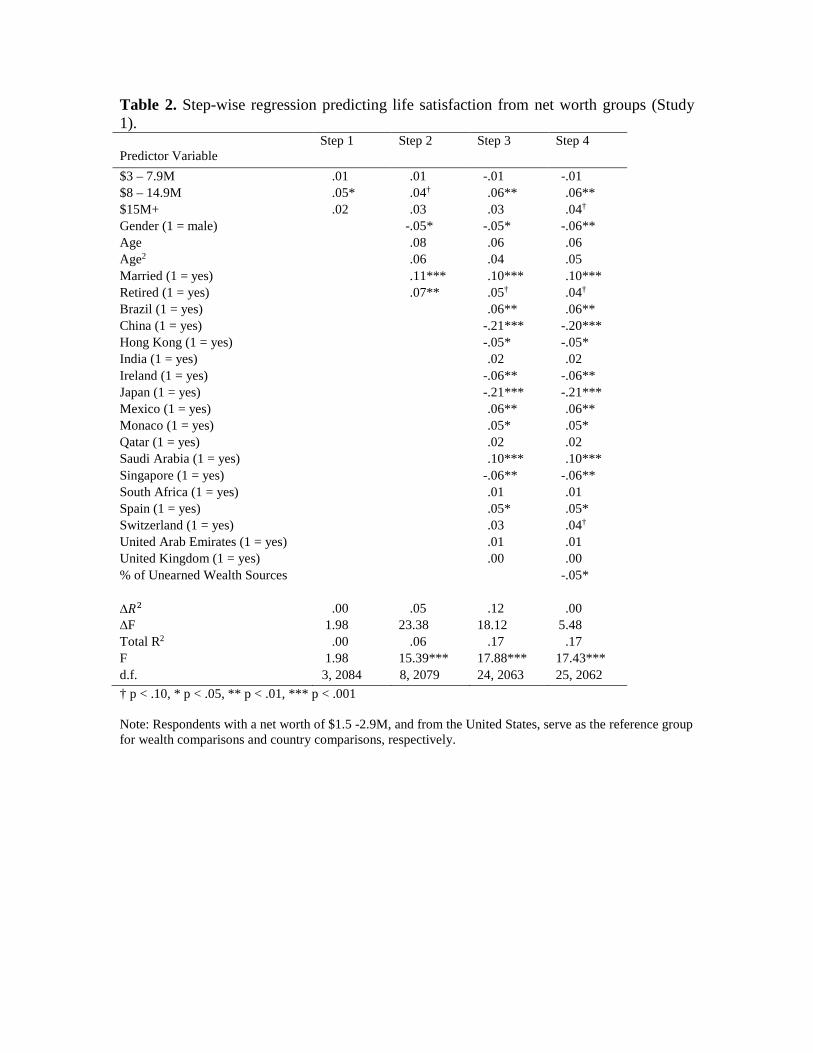
Table 2. Step-wise regression predicting life satisfaction from net worth groups (Study 1). Predictor Variable
Step 1 Step 2 Step 3 Step 4
$3 – 7.9M .01 .01 -.01 -.01 $8 – 14.9M .05* .04† .06** .06** $15M+ .02 .03 .03 .04† Gender (1 = male) -.05* -.05* -.06** Age .08 .06 .06 Age2 .06 .04 .05 Married (1 = yes) .11*** .10*** .10*** Retired (1 = yes) .07** .05† .04† Brazil (1 = yes) .06** .06** China (1 = yes) -.21*** -.20*** Hong Kong (1 = yes) -.05* -.05* India (1 = yes) .02 .02 Ireland (1 = yes) -.06** -.06** Japan (1 = yes) -.21*** -.21*** Mexico (1 = yes) .06** .06** Monaco (1 = yes) .05* .05* Qatar (1 = yes) .02 .02 Saudi Arabia (1 = yes) .10*** .10*** Singapore (1 = yes) -.06** -.06** South Africa (1 = yes) .01 .01 Spain (1 = yes) .05* .05* Switzerland (1 = yes) .03 .04† United Arab Emirates (1 = yes) .01 .01 United Kingdom (1 = yes) .00 .00 % of Unearned Wealth Sources -.05* ∆𝑅𝑅2 .00 .05 .12 .00 ∆F 1.98 23.38 18.12 5.48 Total R2 .00 .06 .17 .17 F 1.98 15.39*** 17.88*** 17.43*** d.f. 3, 2084 8, 2079 24, 2063 25, 2062 † p < .10, * p < .05, ** p < .01, *** p < .001 Note: Respondents with a net worth of $1.5 -2.9M, and from the United States, serve as the reference group for wealth comparisons and country comparisons, respectively.
The Happiness of Millionaires 34 Table 3. Satisfaction with life scores (1-7 scale) by wealth level (Study 1)
N Wealth Level Satisfaction with Life 1035 $1.5 – 2.9M 5.79 (1.12) 601 $3 – 7.9M 5.81 (1.21) 247 $8 – 14.9M 5.97 (1.04) 246 $15M+ 5.84 (1.20)
Note. Standard deviations are listed in parentheses.
The Happiness of Millionaires 35 Table 4. Satisfaction with life scores (1-7 scale) by percent of unearned wealth sources (Study 1)
N Percent of Unearned
Wealth Sources Happiness
1337 0% 5.88 (.03) 10 14% 5.56 (.35) 26 17% 5.22 (.21) 85 20% 5.86 (.12) 98 25% 5.49 (.11) 5 29% 5.88 (.47)
100 33% 5.88 (.11) 27 40% 5.90 (.22) 279 50% 5.75 (.07) 13 67% 6.02 (.29) 108 100% 5.66 (.10)
Note. Standard errors are listed in parentheses. This model includes covariates included in Table 2.
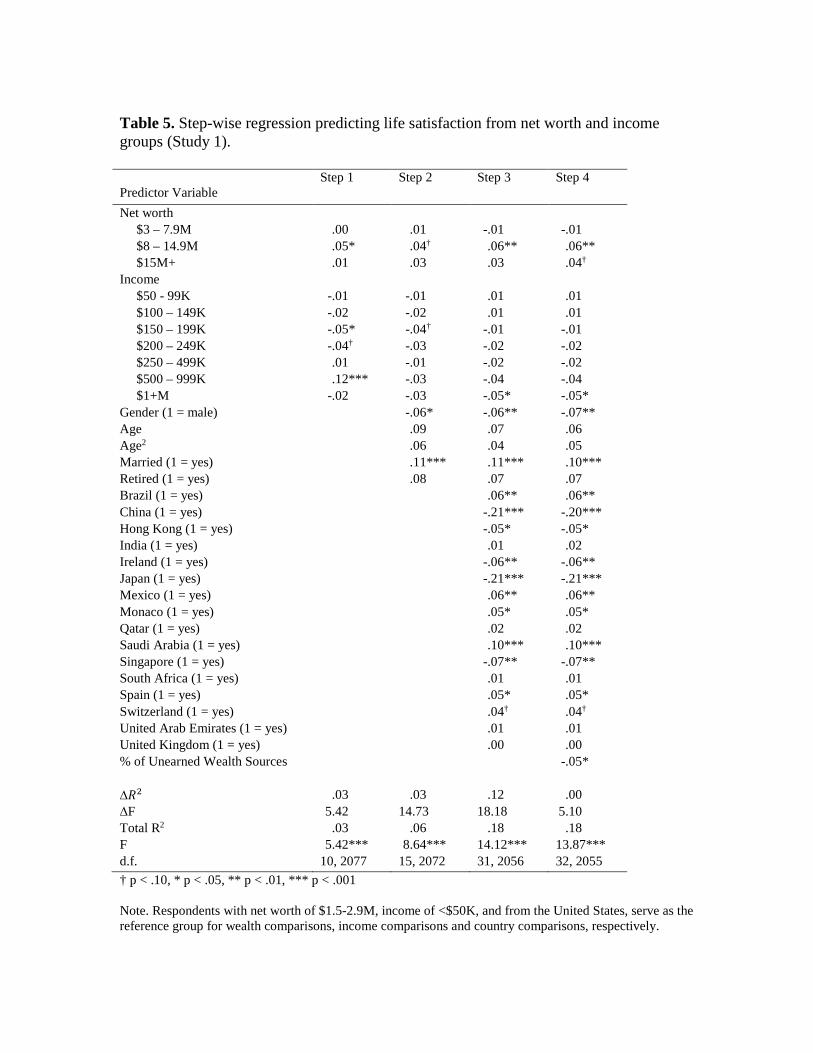
Table 5. Step-wise regression predicting life satisfaction from net worth and income groups (Study 1). Predictor Variable
Step 1 Step 2 Step 3 Step 4
Net worth $3 – 7.9M .00 .01 -.01 -.01 $8 – 14.9M .05* .04† .06** .06** $15M+ .01 .03 .03 .04† Income $50 - 99K -.01 -.01 .01 .01 $100 – 149K -.02 -.02 .01 .01 $150 – 199K -.05* -.04† -.01 -.01 $200 – 249K -.04† -.03 -.02 -.02 $250 – 499K .01 -.01 -.02 -.02 $500 – 999K .12*** -.03 -.04 -.04 $1+M -.02 -.03 -.05* -.05* Gender (1 = male) -.06* -.06** -.07** Age .09 .07 .06 Age2 .06 .04 .05 Married (1 = yes) .11*** .11*** .10*** Retired (1 = yes) .08 .07 .07 Brazil (1 = yes) .06** .06** China (1 = yes) -.21*** -.20*** Hong Kong (1 = yes) -.05* -.05* India (1 = yes) .01 .02 Ireland (1 = yes) -.06** -.06** Japan (1 = yes) -.21*** -.21*** Mexico (1 = yes) .06** .06** Monaco (1 = yes) .05* .05* Qatar (1 = yes) .02 .02 Saudi Arabia (1 = yes) .10*** .10*** Singapore (1 = yes) -.07** -.07** South Africa (1 = yes) .01 .01 Spain (1 = yes) .05* .05* Switzerland (1 = yes) .04† .04† United Arab Emirates (1 = yes) .01 .01 United Kingdom (1 = yes) .00 .00 % of Unearned Wealth Sources -.05* ∆𝑅𝑅2 .03 .03 .12 .00 ∆F 5.42 14.73 18.18 5.10 Total R2 .03 .06 .18 .18 F 5.42*** 8.64*** 14.12*** 13.87*** d.f. 10, 2077 15, 2072 31, 2056 32, 2055 † p < .10, * p < .05, ** p < .01, *** p < .001 Note. Respondents with net worth of $1.5-2.9M, income of <$50K, and from the United States, serve as the reference group for wealth comparisons, income comparisons and country comparisons, respectively.
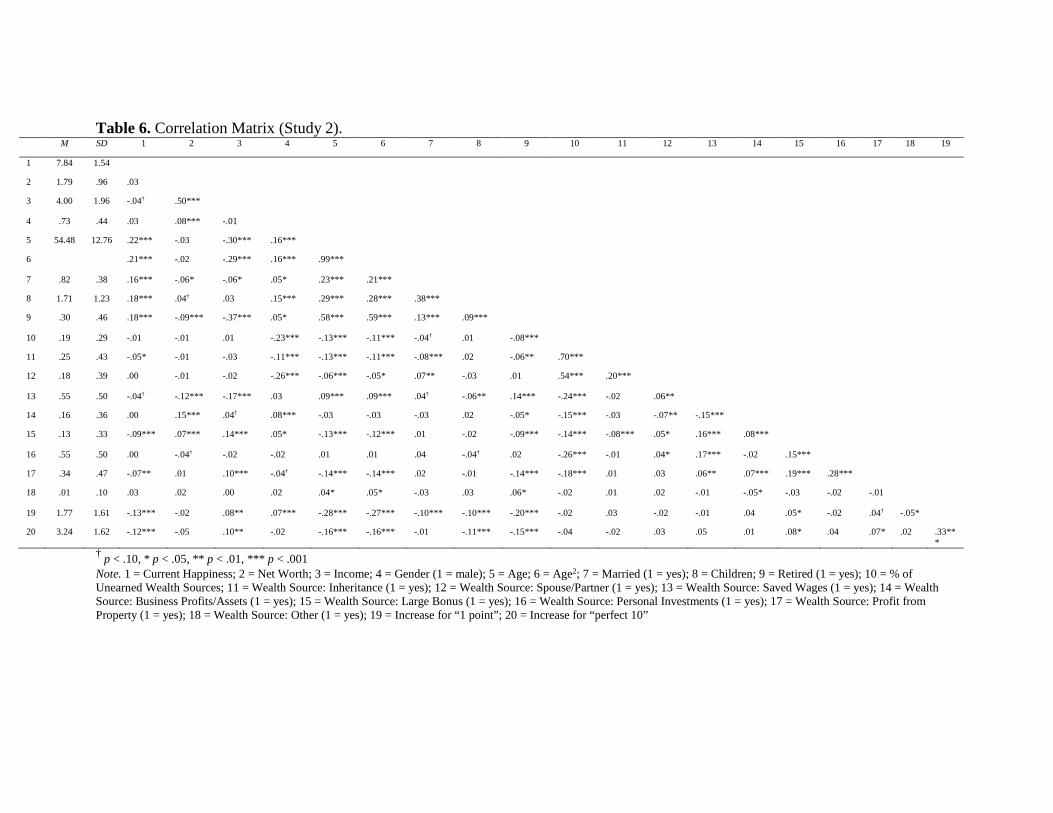
Table 6. Correlation Matrix (Study 2). M SD 1 2 3 4 5 6 7 8 9 10 11 12 13 14 15 16 17 18 19
1 7.84 1.54
2 1.79 .96 .03
3 4.00 1.96 -.04† .50***
4 .73 .44 .03 .08*** -.01
5 54.48 12.76 .22*** -.03 -.30*** .16***
6 .21*** -.02 -.29*** .16*** .99***
7 .82 .38 .16*** -.06* -.06* .05* .23*** .21***
8 1.71 1.23 .18*** .04† .03 .15*** .29*** .28*** .38***
9 .30 .46 .18*** -.09*** -.37*** .05* .58*** .59*** .13*** .09***
10 .19 .29 -.01 -.01 .01 -.23*** -.13*** -.11*** -.04† .01 -.08***
11 .25 .43 -.05* -.01 -.03 -.11*** -.13*** -.11*** -.08*** .02 -.06** .70***
12 .18 .39 .00 -.01 -.02 -.26*** -.06*** -.05* .07** -.03 .01 .54*** .20***
13 .55 .50 -.04† -.12*** -.17*** .03 .09*** .09*** .04† -.06** .14*** -.24*** -.02 .06**
14 .16 .36 .00 .15*** .04† .08*** -.03 -.03 -.03 .02 -.05* -.15*** -.03 -.07** -.15***
15 .13 .33 -.09*** .07*** .14*** .05* -.13*** -.12*** .01 -.02 -.09*** -.14*** -.08*** .05* .16*** .08***
16 .55 .50 .00 -.04† -.02 -.02 .01 .01 .04 -.04† .02 -.26*** -.01 .04* .17*** -.02 .15***
17 .34 .47 -.07** .01 .10*** -.04† -.14*** -.14*** .02 -.01 -.14*** -.18*** .01 .03 .06** .07*** .19*** .28***
18 .01 .10 .03 .02 .00 .02 .04* .05* -.03 .03 .06* -.02 .01 .02 -.01 -.05* -.03 -.02 -.01
19 1.77 1.61 -.13*** -.02 .08** .07*** -.28*** -.27*** -.10*** -.10*** -.20*** -.02 .03 -.02 -.01 .04 .05* -.02 .04† -.05*
20 3.24 1.62 -.12*** -.05 .10** -.02 -.16*** -.16*** -.01 -.11*** -.15*** -.04 -.02 .03 .05 .01 .08* .04 .07* .02 .33***
† p < .10, * p < .05, ** p < .01, *** p < .001 Note. 1 = Current Happiness; 2 = Net Worth; 3 = Income; 4 = Gender (1 = male); 5 = Age; 6 = Age2; 7 = Married (1 = yes); 8 = Children; 9 = Retired (1 = yes); 10 = % of Unearned Wealth Sources; 11 = Wealth Source: Inheritance (1 = yes); 12 = Wealth Source: Spouse/Partner (1 = yes); 13 = Wealth Source: Saved Wages (1 = yes); 14 = Wealth Source: Business Profits/Assets (1 = yes); 15 = Wealth Source: Large Bonus (1 = yes); 16 = Wealth Source: Personal Investments (1 = yes); 17 = Wealth Source: Profit from Property (1 = yes); 18 = Wealth Source: Other (1 = yes); 19 = Increase for “1 point”; 20 = Increase for “perfect 10”
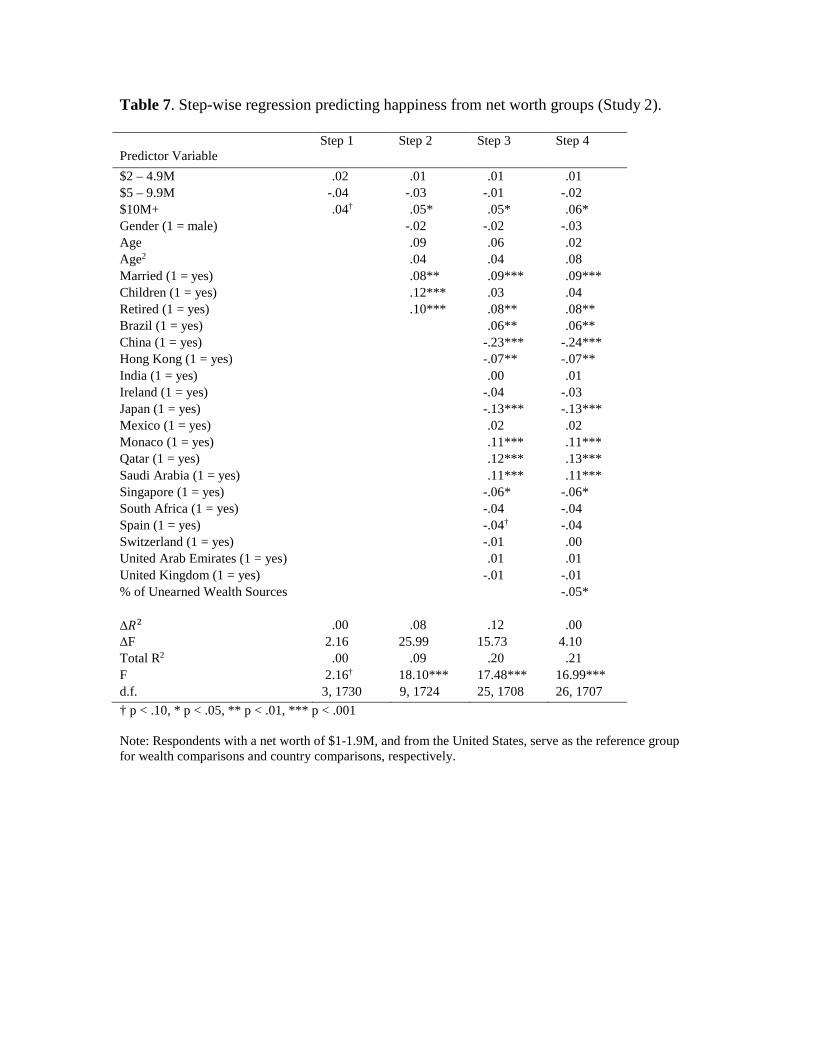
Table 7. Step-wise regression predicting happiness from net worth groups (Study 2). Predictor Variable
Step 1 Step 2 Step 3 Step 4
$2 – 4.9M .02 .01 .01 .01 $5 – 9.9M -.04 -.03 -.01 -.02 $10M+ .04† .05* .05* .06* Gender (1 = male) -.02 -.02 -.03 Age .09 .06 .02 Age2 .04 .04 .08 Married (1 = yes) .08** .09*** .09*** Children (1 = yes) .12*** .03 .04 Retired (1 = yes) .10*** .08** .08** Brazil (1 = yes) .06** .06** China (1 = yes) -.23*** -.24*** Hong Kong (1 = yes) -.07** -.07** India (1 = yes) .00 .01 Ireland (1 = yes) -.04 -.03 Japan (1 = yes) -.13*** -.13*** Mexico (1 = yes) .02 .02 Monaco (1 = yes) .11*** .11*** Qatar (1 = yes) .12*** .13*** Saudi Arabia (1 = yes) .11*** .11*** Singapore (1 = yes) -.06* -.06* South Africa (1 = yes) -.04 -.04 Spain (1 = yes) -.04† -.04 Switzerland (1 = yes) -.01 .00 United Arab Emirates (1 = yes) .01 .01 United Kingdom (1 = yes) -.01 -.01 % of Unearned Wealth Sources -.05* ∆𝑅𝑅2 .00 .08 .12 .00 ∆F 2.16 25.99 15.73 4.10 Total R2 .00 .09 .20 .21 F 2.16† 18.10*** 17.48*** 16.99*** d.f. 3, 1730 9, 1724 25, 1708 26, 1707 † p < .10, * p < .05, ** p < .01, *** p < .001 Note: Respondents with a net worth of $1-1.9M, and from the United States, serve as the reference group for wealth comparisons and country comparisons, respectively.
The Happiness of Millionaires 39 Table 8. Happiness with Life in General scores (1-10 scale) by Wealth Level (Study 2)
N Wealth Level Happiness
993 $1 – 1.9M 7.81 (1.54) 654 $2 – 4.9M 7.87 (1.53) 176 $5 – 9.9M 7.72 (1.62) 194 $10M+ 8.03 (1.47)
Note. Standard deviations are listed in parentheses.
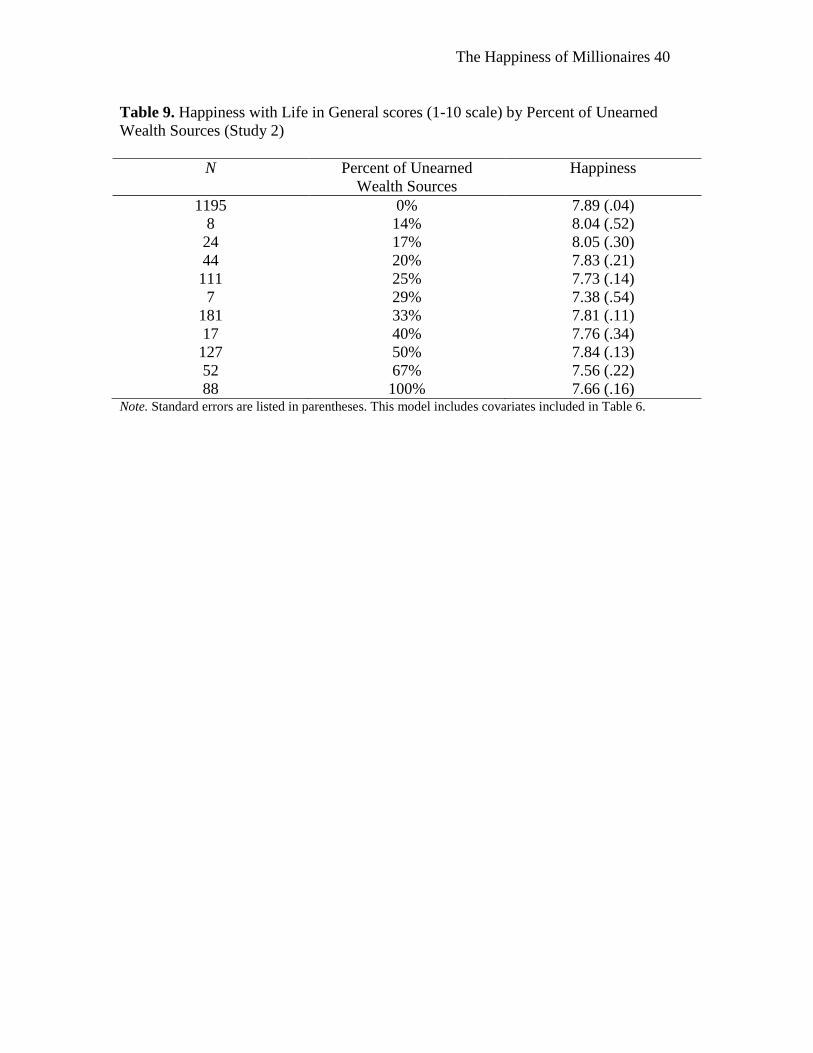
The Happiness of Millionaires 40 Table 9. Happiness with Life in General scores (1-10 scale) by Percent of Unearned Wealth Sources (Study 2)
N Percent of Unearned
Wealth Sources Happiness
1195 0% 7.89 (.04) 8 14% 8.04 (.52) 24 17% 8.05 (.30) 44 20% 7.83 (.21) 111 25% 7.73 (.14) 7 29% 7.38 (.54)
181 33% 7.81 (.11) 17 40% 7.76 (.34) 127 50% 7.84 (.13) 52 67% 7.56 (.22) 88 100% 7.66 (.16)
Note. Standard errors are listed in parentheses. This model includes covariates included in Table 6.
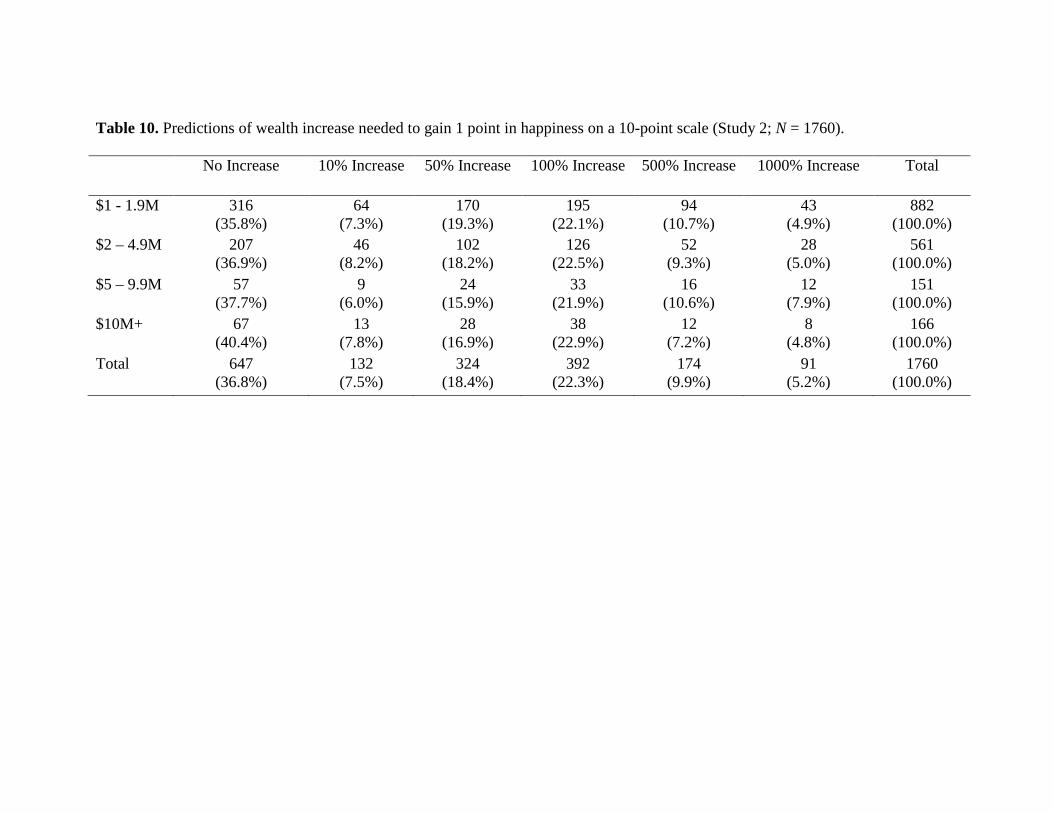
Table 10. Predictions of wealth increase needed to gain 1 point in happiness on a 10-point scale (Study 2; N = 1760).
No Increase 10% Increase 50% Increase 100% Increase 500% Increase 1000% Increase Total
$1 - 1.9M 316 (35.8%)
64 (7.3%)
170 (19.3%)
195 (22.1%)
94 (10.7%)
43 (4.9%)
882 (100.0%)
$2 – 4.9M 207 (36.9%)
46 (8.2%)
102 (18.2%)
126 (22.5%)
52 (9.3%)
28 (5.0%)
561 (100.0%)
$5 – 9.9M 57 (37.7%)
9 (6.0%)
24 (15.9%)
33 (21.9%)
16 (10.6%)
12 (7.9%)
151 (100.0%)
$10M+ 67 (40.4%)
13 (7.8%)
28 (16.9%)
38 (22.9%)
12 (7.2%)
8 (4.8%)
166 (100.0%)
Total 647 (36.8%)
132 (7.5%)
324 (18.4%)
392 (22.3%)
174 (9.9%)
91 (5.2%)
1760 (100.0%)
The Happiness of Millionaires 42
Table 11. Predictions of wealth increase needed for a perfect “10” in happiness on a 10-point scale (Study 2; N = 887).
No Increase 10% Increase 50% Increase 100% Increase 500% Increase 1000% Increase Total
$1 - 1.9M 57 (12.6%)
8 (1.8%)
37 (8.2%)
110 (24.4%)
116 (25.7%)
123 (27.3%)
451 (100.0%)
$2 – 4.9M 37 (13.3%)
12 (4.3%)
29 (10.4%)
58 (20.9%)
66 (23.7%)
76 (27.3%)
278 (100.0%)
$5 – 9.9M 11 (13.4%)
4 (4.9%)
10 (12.2%)
14 (17.1%)
17 (20.7%)
26 (31.7%)
82 (100.0%)
$10M+ 9 (11.8%)
2 (2.6%)
10 (13.2%)
24 (31.6%)
18 (23.7%)
13 (17.1%)
76 (100.0%)
Total 114 (12.9%)
26 (2.9%)
86 (9.7%)
206 (23.2%)
217 (24.5%)
238 (26.8%)
887 (100.0%)
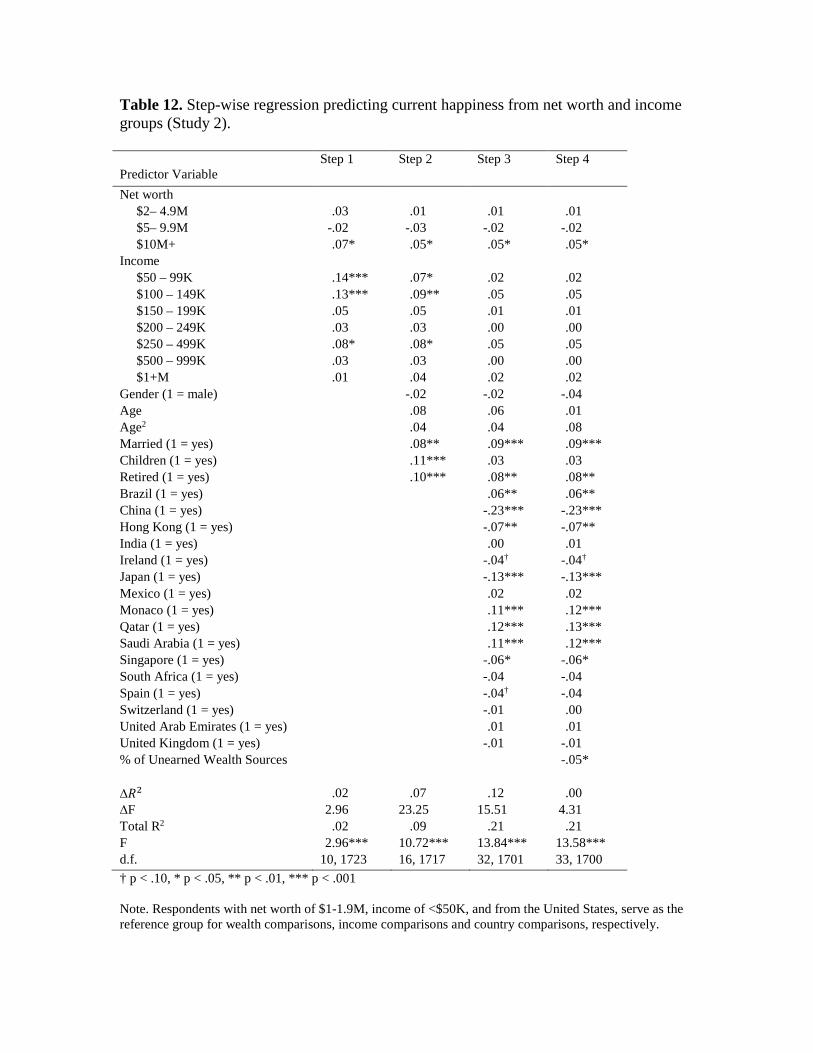
Table 12. Step-wise regression predicting current happiness from net worth and income groups (Study 2). Predictor Variable
Step 1 Step 2 Step 3 Step 4
Net worth $2– 4.9M .03 .01 .01 .01 $5– 9.9M -.02 -.03 -.02 -.02 $10M+ .07* .05* .05* .05* Income $50 – 99K .14*** .07* .02 .02 $100 – 149K .13*** .09** .05 .05 $150 – 199K .05 .05 .01 .01 $200 – 249K .03 .03 .00 .00 $250 – 499K .08* .08* .05 .05 $500 – 999K .03 .03 .00 .00 $1+M .01 .04 .02 .02 Gender (1 = male) -.02 -.02 -.04 Age .08 .06 .01 Age2 .04 .04 .08 Married (1 = yes) .08** .09*** .09*** Children (1 = yes) .11*** .03 .03 Retired (1 = yes) .10*** .08** .08** Brazil (1 = yes) .06** .06** China (1 = yes) -.23*** -.23*** Hong Kong (1 = yes) -.07** -.07** India (1 = yes) .00 .01 Ireland (1 = yes) -.04† -.04† Japan (1 = yes) -.13*** -.13*** Mexico (1 = yes) .02 .02 Monaco (1 = yes) .11*** .12*** Qatar (1 = yes) .12*** .13*** Saudi Arabia (1 = yes) .11*** .12*** Singapore (1 = yes) -.06* -.06* South Africa (1 = yes) -.04 -.04 Spain (1 = yes) -.04† -.04 Switzerland (1 = yes) -.01 .00 United Arab Emirates (1 = yes) .01 .01 United Kingdom (1 = yes) -.01 -.01 % of Unearned Wealth Sources -.05* ∆𝑅𝑅2 .02 .07 .12 .00 ∆F 2.96 23.25 15.51 4.31 Total R2 .02 .09 .21 .21 F 2.96*** 10.72*** 13.84*** 13.58*** d.f. 10, 1723 16, 1717 32, 1701 33, 1700 † p < .10, * p < .05, ** p < .01, *** p < .001 Note. Respondents with net worth of $1-1.9M, income of <$50K, and from the United States, serve as the reference group for wealth comparisons, income comparisons and country comparisons, respectively.