running head: why and when nice guys finish last 1 nice
TRANSCRIPT
RUNNING HEAD: Why and When Nice Guys Finish Last 1
Nice Guys Finish Last: When and Why Agreeableness is Associated with Financial Hardship
Datasets and R scripts are made available on OSF through the following link:
https://osf.io/e3j9v/

RUNNING HEAD: Why and When Nice Guys Finish Last 2
Abstract
Recent research suggests that agreeable individuals experience greater financial hardship than their
less agreeable peers. We explore the psychological mechanisms underlying this relationship and
provide evidence that it is driven by agreeable individuals considering money to be less important,
but not (as previously suggested) by agreeable individuals pursuing more cooperative negotiating
styles. Taking an interactionist perspective, we further hypothesize that placing little importance
on money – a risk factor for money mismanagement – is more detrimental to the financial health
of those agreeable individuals who lack the economic means to compensate for their
predisposition. Supporting this proposition, we show that agreeableness is more strongly (and
sometimes exclusively) related to financial hardship among low-income individuals. We present
evidence from diverse data sources, including two online panels (n1=636, n2=3,155), a nationally-
representative survey (n3=4,170), objective bank account data (n4=549), a longitudinal cohort
study (n5=2,429), and geographically aggregated insolvency and personality measures
(n6=332,951, n7=2,468,897).
Keywords: Agreeableness, Financial Health, Income, Negotiation style, Money attitudes.

RUNNING HEAD: Why and When Nice Guys Finish Last 3
Nice Guys Finish Last: When and Why Agreeableness Is Associated with Financial Hardship
Economists and policy makers have long been puzzled by the frequency with which people engage
in financial behaviors that run counter to their long-term well-being. Research suggests that people
save too little (Madrian & Shea, 2001) spend too much (Sussman & Alter, 2012), and fall behind
on their financial commitments (Stango & Zinman, 2014). As a result, they regularly struggle to
make ends meet (Lusardi, Schneider, & Tufano, 2011). While financial hardship is widespread,
psychological research suggests that specific traits may lead some individuals to be at greater risk
of experiencing this than others. For example, studies have linked adverse financial outcomes to
the widely established Five Factor Model of personality (Goldberg 1999, McCrae and John 1992).
These studies find that Neuroticism predicts higher debt rates (Webley and Nyhus 2001) and an
increase in instances of compulsive buying (e.g., Brougham et al. 2011, Mowen and Spears 1999).
Conscientiousness has been linked to increased savings (Brandstatter, 1996 and Warneryd, 1996),
more positive attitudes towards saving (Brandstatter, 2005), and the avoidance of debt (Webley
and Nyhus 2001). One interpretation of these studies, taken together, is that socially undesirable
psychological traits go hand-in-hand with undesirable financial behaviors – and vice versa.
However, contrary to this perception, recent research has found a relationship between
Agreeableness – a personality trait associated with positive attributes (McCrae & John, 1992) –
and negative financial outcomes such as lower credit scores (Judge, Livingston, & Hurst, 2012)
and reduced earnings (Bernerth, Taylor, Walker, & Whitman, 2012). A common explanation for
why agreeableness might contribute to impaired financial circumstances focuses on the trusting
and accommodating tendencies of agreeable individuals. These characteristics may leave them
more prone to sacrifice personal resources for others (Judge et al., 2012) and more vulnerable to

RUNNING HEAD: Why and When Nice Guys Finish Last 4
commit to promises that they might later be unable to keep (e.g. following the request of a salesman
to take up a new credit or signing a new loan for a friend or family member; Bernerth et al., 2012).
However, no empirical research has tested these explanations.
One way to conceptualize and test this proposition empirically is by looking at differences in
negotiating styles. Negotiating styles represent people’s tendencies to deal with interpersonal
situations of conflict and cooperation (Rahim, 1983; Thomas, 1992; Thomas & Kilmann, 1978).
Given that agreeableness reflects prosocial dispositions as opposed to a narrower focus on one’s
self-interest (Messick & McClintock, 1968), it is likely to affect the way in which individuals
negotiate. For example, individuals with a prosocial orientation make fewer demands and more
concessions than their more competitive peers (De Dreu & Van Lange, 1995) and are more likely
to adopt a cooperative negotiation style that benefits the other party (Antonioni, 1998; Moberg,
2001). As a result, agreeable individuals end up with poorer economic outcomes from negotiations
than do their disagreeable counterparts (Barry & Friedman, 1998). Thus, while there are many
contexts in which being trusting and cooperative might produce positive outcomes, agreeableness
also has the potential to undermine the pursuit of self-interest in situations of conflict and
negotiation. Building on the outlined reasoning we test the following hypothesis:
Hypothesis 1a: The relationship between agreeableness and negative financial outcomes
can be explained by highly agreeable people pursuing more cooperative negotiation styles.
However, there are alternative explanations which could explain the role of agreeableness in
financial health. We propose that agreeable people experience greater financial hardship because
they care less about money. Studies show that people who place a high value on money score

RUNNING HEAD: Why and When Nice Guys Finish Last 5
higher on competitiveness, an indicator of low agreeableness (Kirkcaldy & Furnham, 1993;
Richins & Rudmin, 1994; Wong & Carducci, 1991), and that agreeable individuals care less about
material possessions (Watson, 2014). We reason that placing a low value on money means less
cognitive attention and resources will be allocated to keeping track of personal finances, resulting
in financial mismanagement. Building on the outlined reasoning we test the following hypothesis:
Hypothesis 1b: The relationship between agreeableness and negative financial outcomes
can be explained by highly agreeable people placing less subjective value on money.
Caring less about money is unlikely to impact the financial health of everyone equally. For
example, it seems reasonable to expect the effect of caring less about money –and therefore the
effect of agreeableness– on financial health to be dependent on people’s economic circumstances
(e.g., their income). Agreeable individuals with a sufficiently high income should have the
financial resources to protect themselves from the risks of money mismanagement that may arise
from their negative (or indifferent) attitude towards money. Conversely, agreeable individuals with
low income might not have a sufficient financial safety net to compensate for their economically
disadvantageous attitudes. Hence, we argue that people’s agreeable predisposition makes them
more prone to experiencing negative financial outcomes, but that this predisposition posits a
greater threat to the financial health of only those with limited financial resources. More
specifically, we test the following hypothesis:
Hypothesis 2: Income moderates the relationships between agreeableness and negative
financial outcomes, such that agreeableness is more strongly associated with these
outcomes for low-income individuals.

RUNNING HEAD: Why and When Nice Guys Finish Last 6
Our conceptualization of financial health is broad, and while previous work has focused purely on
wages and credit scores, we would expect agreeableness to be related to a wide range of financial
indicators. Therefore, in addition to testing our hypotheses, we use multiple dependent variables
across studies to test whether more agreeable people take on more debt, hold less in savings, and
are more likely to fall delinquent or even default on their financial commitments. Table 1 presents
an overview of the six studies presented in this paper, outlining (1) the hypothesis tested, (2) the
outcome variables used to capture financial health, and (3) the characteristics of the sample.
Insert Table 1 here
Ethics Approval
Study 1 received ethical approval (exemption) from the UCL School of Management, Director of
Research. No protocol number is supplied as a result of this process, but confirmation of approval
is available upon request. Study 4 received ethical approval from University of Cambridge Judge
Business School (protocol number: 15-016). Studies 2-3 and 5-7 are based on secondary datasets,
and therefore do not require ethical approval. Datasets and scripts are made available on OSF
(https://osf.io/e3j9v/).
Studies 1-2: Mediation effects
Studies 1-2 are aimed at investigating the mediating mechanisms underlying the relationships
between agreeableness and negative financial outcomes. We test two potential mediators:
cooperative negotiation style (Hypothesis 1a) and importance of money (Hypothesis 1b).
Study 1

RUNNING HEAD: Why and When Nice Guys Finish Last 7
Study 1 tested whether agreeable individuals’ more cooperative negotiation style (Hypothesis 1a),
and/or the lower value they assign to money (Hypothesis 1b), mediates the association between
agreeableness with savings and debt.
Method
Participants. We used Prolific Academic1 – a UK-based recruitment service similar to Amazon
Mechanical Turk – to recruit participants. To increase the reliability of our findings, we aimed to
collect a convenience sample of approximately 600 participants, which exceeds the sample size
recommended for mediation analysis (Wolf et al. 2013). We collected a slightly larger sample of
662 participants to allow us to exclude inattentive participants. As the study aimed to measure
behavior of those who are in control of their financial life we only recruited participants aged 30
years and older. Participants were excluded if they failed to pass at least one of the two attention
checks incorporated in the survey. This left us with 636 participants (61% female; �̅� (age) = 44.10
years, SD = 9.77).
Measures. Agreeableness. Agreeableness was measured with the nine items of the agreeableness
scale included in the BFI-44 measure of personality (John & Srivastava, 1999). With a Cronbach’s
α of 0.81 the scale reliability was good.
Savings. Savings were measured by asking: “Overall, what is the total amount of your savings, in
GBP”. Responses were recorded in an open text field. Reported savings were highly positively
skewed, with an average of £17,300 and a median of £4,000. We identified and excluded extreme
outliers using the standard definition (> outer upper fence = Q3 + 3*IQR).
1 Prolific academic workers were found to be more diverse and honest than their counterparts on Amazon
Mechanical Turk, and to produce data quality comparable to that of Amazon Mechanical Turk workers (Peer et al.,
2017)

RUNNING HEAD: Why and When Nice Guys Finish Last 8
Debt. Debt was measured by asking: “What is the total outstanding balance of your personal loans
and/or credit cards, in GBP?”. Responses were recorded in an open text field. Similar to savings,
reported debt was highly positively skewed, with an average of £3,330 and a median of £0.
Extreme outliers (> outer upper fence = Q3 + 3*IQR) were excluded.
Negotiation Styles. The Rahim Organizational Conflict Inventory-II (ROCI-II; Rahim, 1983) was
developed to measure five styles of handling interpersonal conflict in the workplace. We adapted
the ROCI-II scale to reflect “others” rather than one’s boss (e.g., “I usually accommodate the
wishes of others”). Given the high correlations between cooperation-oriented conflict styles
“compromising,” “obliging,” and “integrating” (�̅� = 0.58), we averaged the scores across these
three conflict styles to obtain a composite measure of “cooperative negotiation style” (our results
were stable when using any of the individual styles as mediators instead).
Importance of Money. The subjective importance of money was measured using 16 items in the
Money Attitudes Scale (Furnham, Wilson, & Telford, 2012), which measures people’s attitudes
towards money. Items include statements such as “There are very few things money can’t buy,”
“You can never have enough money,” or “Money can help you be accepted by others”. While the
original scale measures the importance of money along four different facets (e.g., power or
security), we aggregated the scores across all items to obtain a comprehensive measure of the
overall importance people assign to money. With a Cronbach’s α of 0.76 the scale reliability was
acceptable.
Controls. We included as covariates participants’ self-reported age, gender (0 = male, 1 = female),
education level (1 = no educational qualifications, 2 = Secondary School, 3 = Sixth Form College,
4 = University degree, 5 = Masters degree, and 6 = Doctoral degree), and 12 categories of income
(1 = Less than £10,000, 2 = £10,001 to £15,000, 3 = £15,001 to £20,000, 4 = £20,001 to £30,000,

RUNNING HEAD: Why and When Nice Guys Finish Last 9
5 = £30,001 to £40,000, 6 = £40,001 to £50,000, 7 = £50,001 to £60,000, 8 = £60,001 to £80,000,
9 = £80,001 to £100,000, 10 = £100,001 to £120,000, 11 = £120,001 to £140,000, 12 = More than
£140,000).
Analysis. To test for main effects of agreeableness on savings and debt – a prerequisite for the
subsequent mediation analysis – we ran two regression models, including all controls. We
employed poisson models, with Huber-White robust standard errors, to account for the positive
skew in our outcome variables. An inspection of the variance inflation factors (VIF) for the two
regression models suggests multi-collinearity was not a cause for concern (Hair et al., 1995). To
test Hypotheses 1a and 1b, we ran a path analysis with bootstrapping and MLR estimation for non-
normal continuous data, again with Huber-White robust standard errors, using the lavaan package
in R (Rosseel et al., 2017). The models tested whether the relationships between agreeableness and
savings, as well as debt, were mediated by (a) the negotiation style of participants and (b) the
subjective importance participants placed on money. All models controlled for the effects of age,
gender, education, and income on the outcome variables.
Results
The results of the two poisson regression analyses partly support the proposition that agreeable
people experience greater financial hardship than their disagreeable counterparts (see Table S1 for
univariate correlations and Table S2 for a full model output). Corresponding to Hypothesis 1,
agreeableness was negatively related to savings (= -0.17, SE = 0.060, z = -2.83, IRR = 0.84, p =
0.005). However, there was no significant relationship between agreeableness and debt (=
0.09, SE = 0.081, z = 1.58, IRR = 1.10, p = 0.247). Given that a significant relationship between
the predictor and the outcome variable is a prerequisite for mediation analyses (Baron & Kenny,

RUNNING HEAD: Why and When Nice Guys Finish Last 10
1986), we only report the mediation results on savings. Figure 1 illustrates the results of the
mediation model using standardized regression coefficients.
Insert Figure 1 here
The hypothesized path model for savings provided a good fit to the data (χ2= 20.87, df = 8, p =
0.007, CFI = 0.95, TLI = 0.88, RMSEA = 0.052 [0.026;0.080]). We do not find support for our
first mediation hypothesis (Hypothesis 1a), with no indirect effect of compromising negotiation
style (a2*b2: B = 0.007, SE = 0.018, β = 0.007, p = 0.619). While agreeableness was found to have
a highly significant effect on cooperative negotiation style (a2: B = 0.38, SE = 0.045, β = 0.38, p
< 0.001), there was no significant effect of cooperative negotiation style on savings (b2: B = 0.019,
SE = 0.039, β = 0.019, p = 0.499). In contrast, the evidence does provide support for our second
mediation hypothesis, finding a significant indirect effect of importance of money (a1*b1: B = -
0.024, SE = 0.009, β = -0.024, p = 0.007), which accounted for 22% percent of the variance in the
direct effect. Agreeableness was found to have a highly significant direct effect on the subjective
importance of money (a1: B = -0.14, SE = 0.042, β = -0.14, p = 0.001), which in turn had a highly
significant direct effect on savings (b1: B = 0.18, SE = 0.036, β = 0.18, p < 0.001). The direct
effect of agreeableness on savings remained significant (c’; B = -0.090, SE = 0.042, β = -0.090, p
= 0.034) but decreased in size compared the direct effect of savings in a model that did not include
the mediators (c; B = -0.11, SE = 0.041, β = -0.11, p = 0.010). Overall, the results suggest that the
subjective importance of money, but not a more compromising negotiation style, partially mediates
the negative relationship between agreeableness and savings.
Taken together, the results of Study 1 suggest that agreeableness is related to financial hardship,
as measured by lower savings. However, we do not find support for an association with increased

RUNNING HEAD: Why and When Nice Guys Finish Last 11
debts. Debt and savings provide different signals of a person’s financial health; while increased
savings is almost always a sign of better financial health, some debt is inevitable and even useful
when used judiciously (for example, most people simply could never buy substantial assets like
houses and cars without taking on debt). This distinction might explain the fact that agreeableness
was significantly related to savings, but not debt. In addition, the results of the mediation analysis
provide correlational evidence consistent with the hypothesis that the relationship can be explained
in part by agreeable people assigning less value to money than their disagreeable counterparts, but
not by the fact that they are predisposed to less favorable negotiation styles.
Study 2
Study 2 was aimed at replicating the findings of Study 1 on a larger and more diverse sample of
participants. More specifically, we test whether the effect of agreeableness on savings is
mediated by the value individuals assign to money.
Methods
Participants.
We use data collected through two online surveys in collaboration with the BBC television public
broadcaster in the UK in 2011. The surveys were conducted as part of two projects - the ‘Big
Money Test’ and the ‘BBC Big Personality Test’ – designed to measure personality and money
attitudes in the UK population. While these data collection efforts were independent, we use a
combined dataset containing matched respondents who completed both (held at the UK Data
Archive under SN 7656). The dataset contains responses from 3,869 participants in total (68.2%
female; �̅� (age) = 35.31 years, SD = .20). We excluded participants with missing data on our
variables of interest, leaving a total sample of 3,155.

RUNNING HEAD: Why and When Nice Guys Finish Last 12
Measures. Savings. Savings was measured with the following question: “If you have any savings
and other financial investments, what do you think is the value of these savings and investments?”.
Participants responded using one of eight categories (1 = £0, 2 = £0-£500, 3 = “£500-£1,000”, 4 =
“More than £1,000 but less than £5,000” 5 = “More than £5,000 but less than £10,000”, 6 = “More
than £10,000 but less than £20,000”, 7 = “More than £20,000 but less than £50,000”, 8 = “£50,000
or more”.
Agreeableness. Agreeableness, along with the other Big 5 traits, was measured using the BFI-44
measure of personality (John & Srivastava, 1999). With a Cronbach’s α of 0.77 for Agreeableness,
the scale reliability for this nine-item measure was acceptable.
Importance of Money. As in Study 1, the subjective importance of money was measured using
the 16-item Money Attitudes Scale (Furnham, Wilson, & Telford, 2012). Scores were aggregated
across all items to calculate a measure of the overall importance people assign to money. With a
Cronbach’s alpha of α = 0.76, the scale reliability was found to be acceptable.
Controls. We included the following demographic control variables: Self-reported age and gender
(0 = male, 1 = female), highest education qualification (six categories, 1 = not completed GCSE
(secondary school certificate) or equivalent, 2 = completed GCSE or equivalent, 3 = completed
post-16 vocational course or equivalent, 4 = completed A-levels or equivalent, 5 = completed
undergraduate studies or equivalent, 6 = completed postgraduate studies or equivalent),
employment status (1 = employed full-time, 2 = employed part-time, 3 = retired, 4 = student, 5 =
unemployed), the remaining Big Five traits as measured by the BFI-44, and income per annum
(eight categories, 1 = up to £9999, 2 = £10,000 to £19,999, 3 = £20,000 to £29,999, 4 = £30,000
to £39,999, 5 = £40,000 to £49,999, 6 = £50,000 to £74,999, 7 = £75,000 to £149,999, 8 = £150,000
or more).

RUNNING HEAD: Why and When Nice Guys Finish Last 13
Analysis. To assess whether there was a main effect of agreeableness on savings – a prerequisite
for the subsequent mediation analysis (Baron & Kenny, 1986) – we ran an ordered logistic
regression analysis, including all controls. An inspection of the variance inflation factors (VIF) for
the regression model suggests multi-collinearity was not a cause for concern (Hair et al., 1995).
We tested Hypothesis 1b by running a path analysis with bootstrapping and WLSMV estimation,
using the lavaan package in R (Rosseel et al., 2017). The models tested whether the relationship
between agreeableness and savings was mediated by the degree to which participants considered
money important. All models included the effects of all controls on savings.
Results
The results of the ordered logistic regression analyses replicate the findings presented in Study 1
by showing that agreeableness is negatively associated with savings (= -.14, t(3131) = -4.10, OR
= .87[0.81,0.93], p < 0.001; see Table S3 for univariate correlations and Table S4 for a full model
output). Figure 2 illustrates the results of the mediation models for savings, using standardized
regression coefficients.
Insert Figure 2 here
The hypothesized model provided a good fit to the data (χ2= 109.57, df = 9, p < 0.001, CFI = 0.89,
TLI = 0.73, RMSEA = 0.060 [0.050;0.070]). Replicating the findings of Study 1, there was a
significant indirect effect of importance of money (a*b: B = -0.013, SE = 0.003, β = -0.011, p <
0.001; Hypothesis 1b), which accounted for 17% percent of the variance in the direct effect.
Agreeableness was found to have a highly significant negative effect on the subjective importance
of money (a: B = -0.12, SE = 0.018, β = -0.12, p < 0.001), which in turn had a highly significant
positive effect on savings (b: B = 0.11, SE = 0.019, β = 0.10, p < 0.001). The direct effect of

RUNNING HEAD: Why and When Nice Guys Finish Last 14
agreeableness on savings remained significant (c’: B = -0.063, SE = 0.20, β = -0.054, p = 0.002)
but decreased in size compared the direct effect of savings in a model that does not include the
mediators (c; B = -0.076, SE = 0.020, β = -0.066, p < 0.001).
Taken together, the results of Study 2 replicated the findings of Study 1, showing that (1)
agreeableness is negatively related to savings and that (2) this relationship might be partly
mediated by the fact that agreeable people assign less value to money than do their disagreeable
counterparts.
Studies 3-6: Moderation effects
Studies 1 and 2 show that the importance people place on money, or the lack thereof, mediates the
relationship between agreeableness and financial health. As outlined in the introduction, we
hypothesize that the impact agreeableness has on financial health will vary based on people’s
economic circumstances. We expect the effect to be stronger for lower-income individuals, who
lack the financial ‘safety net’ to compensate for their inattention towards their personal finances.
Studies 3-7 are therefore aimed at investigating the moderating effect of people’s financial
resources – their income – on the relationship between agreeableness and financial health
(Hypothesis 2).
Study 3
Method
Participants. We investigated the interaction effect of agreeableness and income on negative
financial outcomes by analyzing survey responses from a nationally representative sample of UK
residents. The survey was commissioned in 2013 by a UK-based charity in collaboration with one

RUNNING HEAD: Why and When Nice Guys Finish Last 15
of the study authors and investigated the financial behaviors of 4,170 UK households. It included
questions covering financial behavior, as well as several demographic and socio-economic
variables, including age, gender, education level, and employment status.
Measures. Agreeableness. Agreeableness was measured using three items taken from the British
Household Panel Survey (BHPS; Brice, Buck, & Prentice-Lane, 2002). Participants were asked to
indicate their agreement with the statements “I see myself as someone who is sometimes rude to
others” (reverse coded), “I see myself as someone who has a forgiving nature” and “I see myself
as someone who is considerate and kind to almost everyone”. With a Cronbach’s alpha of α = 0.57
the reliability was below the recommended threshold for acceptable consistency (P. Kline, 2013),
yet comparable to other well-established, short measures of agreeableness such as the BFI-10
(Rammstedt & John, 2007) or the TIPI (Gosling, Rentfrow, & Swann, 2003). Given that
Cronbach’s alpha is a function of both the mean inter-item correlation and the number of items,
short scales like the one used in this Study often don’t yield acceptable alphas but nevertheless
display acceptable inter-item correlations (MIC = 0.33).
Total Savings. Savings were measured by asking: “Which of the following best describes the total
amount of savings your household has at the moment?” Responses were recorded in 16 bands (1
= Nothing, 2 = Less than £100, 3 = £100 - £250, 4 = £251 - £500, 5 = £501 - £1,000, 6 = £1,001 -
£2,000, 7 = £2,001 - £4,000, 8 = £4,001 - £6,000, 9 = £6,001 - £8,000, 10 = £8,001 - £10,000, 11
= £10,001 - £15,000, 12 = £15,001 - £20,000, 13 = £20,001 - £30,000, 14 = £30,001 – £40,000,
15 = £40,001 - £50,000, 16 = £50,001+).
Debt. Debt was measured by asking: “Which of the following best describes the total amount of
debt your household owes at the moment? By debt we mean any loans, overdrafts, credit card/store
card debts etc. that you pay interest on. Please do not include any mortgage debt or student debt”.

RUNNING HEAD: Why and When Nice Guys Finish Last 16
Responses were recorded using the same 16 bands used for savings, ranging from ‘Nothing’ to
‘£50,000+.’
Indicators of Insolvency. Negative financial behaviors were measured by asking: “Which of the
following events, if any, has your household experienced in the last month?”. There were 10 events
which participants could indicate ‘yes’ or ‘no’ to. These were: (1) Defaulted on a rent payment,
(2) Defaulted on a mortgage payment, (3) Defaulted on a bank loan, (4) Defaulted on a different
type of loan, (5) Taken out a payday loan, (6) Used an unauthorized overdraft, (7) Taken out a new
credit card, (8) Defaulted on a bill, (9) Borrowed money from friends or family, (10) Used an
authorized overdraft. Responses were recorded in a ‘check all that apply’ format. Based on the
dichotomous responses we created an ordinal scale ranging from 0 = ‘No default behavior’ to 10
= ‘All possible default behaviors’.
Income. Income was recorded using a list of 13 categories (1 = Up to £7,000, 2 = £7,001 to
£14,000, 3 = £14,001 to £21,000, 4 = £21,001 to £28,000, 5 = £28,001 to £34,000, 6 = £34,001 to
£41,000, 7 = £41,001 to £48,000, 8 = £48,001 to £55,000, 9 = £55,001 to £62,000, 10 = £62,001
to £69,000, 11 = £69,001 to £76,000, 12 = £76,001 to £83,000, 13 = £83,001 or more). The modal
response (18.64%) was ‘£14,001 to £21,000’.
Control Variables. We used participants’ self-reported age, gender (0 = male, 1 = female), whether
they had children (0 = no, 1 = at least one child), education level (1 = no education/primary
education, 2 = high school, 3 = university, 4 = higher degree), employment status (1 = not in
employment, 2 = full time, 30 hours or more per week, 3 = part time, 8-29 hours per week, 4 =
retired), and the remaining four traits in the Five Factor Model as controls. Due to a mistake in the
coding of the study, one of the items measuring conscientiousness was omitted, resulting in only
two questions measuring this trait.

RUNNING HEAD: Why and When Nice Guys Finish Last 17
Analysis. We used the polr function in the MASS package in R (Ripley et al., 2013) to run ordered
logistic regressions for each of the three outcome variables. All continuous variables were z-
standardized before being submitted to the analyses. Given that not all participants responded to
all questions, the sample size varies marginally by outcome. Model 1 includes agreeableness,
income and controls as predictors. Model 2 adds the interaction between agreeableness and
income. An inspection of the variance inflation factors (VIF) for the three regression models
suggested multi-collinearity was not a cause for concern (Hair et al., 1995).
Results
The main effects of agreeableness in Model 1 were found to be significant across all outcome
variables, including savings (B = -0.15, SE = 0.03, t(3279) = -4.40, OR = 0.86[0.80,0.92], p <
0.001), debt (B = 0.10 , SE = 0.04, t(3279) = 2.74, OR = 1.10[1.03,1.18], p = 0.006), and default
behavior (B = 0.09, SE = 0.04, t(3279) = 2.00, OR = 1.09[1.00,1.19], p = 0.045). The results of
Model 3, including the interactions with income, are displayed in Table 2.
Insert Table 2 here
Supporting Hypothesis 2, the interaction between agreeableness and income was significant for all
three outcome variables, such that agreeableness was more strongly associated with negative
financial outcomes among those with low-incomes than those with high-incomes (see Table S5
for univariate correlations). Given that adding covariates in the form of control variables can alter
the focal effect due to multicollinearity or suppression effects (Giner-Sorolla, 2016), we tested the
robustness of our effects by adding only the main effects for agreeableness and income, as well as
their interaction, into a separate model. While we found the interaction to remain significant for

RUNNING HEAD: Why and When Nice Guys Finish Last 18
savings (B = 0.060, SE = 0.030, t(3284) = 2.01, OR = 1.06[1.00,1.13], p = 0.044), and default
behavior (B = -0.078, SE = 0.039, t(3577) = 2.00, OR = 0.92[0.86,1.00], p = 0.046), it no longer
reached significance for debt (B = -0.042, SE = 0.032, t(3284) = -1.28, OR = 0.96[0.90,1.02], p =
0.202). However, given that the controls we added are important confounds of the effect we are
testing, this should be taken as a note of caution rather than evidence against the interaction effect.
Figure 3 illustrates the interaction effects between agreeableness and income on the three outcome
variables savings, debt, and default.
Insert Figure 3 here
The results of Study 3 suggest that more agreeable people have, on average, worse financial health
as measured by savings, debt, and default behaviors. In accordance with hypothesis 2, this
relationship is stronger for those individuals with lower incomes.
Study 4
A disadvantage of using participant self-reports is that they may not always be accurate (Podsakoff
& Organ, 1986). In addition to response biases (e.g., consistency motive), the accuracy of a
participant’s answers may be influenced by personality traits. For example, it is possible that
agreeable people are more transparent and honest in their responses to questions about their
financial affairs, providing an alternative explanation for our effect. Therefore, in Study 4 we
aimed to replicate the results of Study 3 by using objective behavioral data collected from
participants’ bank accounts.
Method

RUNNING HEAD: Why and When Nice Guys Finish Last 19
Participants. The dataset used in Study 4 was collected in collaboration with a UK-based
multinational bank in late 2014. Customers of the bank were sent a survey link by email asking
them to take part in a study. No incentives were offered for completing the survey. We only
included participants with complete datasets (on the variables of interest) who had indicated that
the account was their main account. This left us with 549 participants (50% female; �̅� (age) = 37.56
years, SD = 14.24).
Measures. Agreeableness. Agreeableness was measured using the BFI-10 (Rammstedt & John,
2007), an established short measure of the Five Factor Model of personality. Participants were
asked to indicate their agreement with the statements “I see myself as someone who is generally
trusting” and “I see myself as someone who tends to find fault with others” (reversed). With a
Cronbach’s alpha of α = 0.77 the scale showed acceptable reliability.
Indicators of insolvency. As part of the survey, participants were asked to consent to their
responses being matched with their account information held by the bank for research purposes.
This information included the number of times the customer’s account had registered one of the
following events: (1) A late payment fee on a credit card, (2) exceeding an agreed overdraft limit,
(3) a returned transaction fee (payment made with insufficient funds), (4) taking out a payday loan,
or (5) taking cash out on a credit card. Given the low frequencies for these individual events, we
calculated a single comprehensive measure of negative financial outcomes. Similar to Study 3, we
used the dichotomous responses to create an ordinal scale ranging from 0 = ‘No default behavior’
to 5 = ‘All possible default behaviors’.
Income. Income was measured as one of 15 categories, ranging from £0-4,999, to £150,000+ (1 =
£0-4,999, 2 = £5,000-9,999, 3 = £10,000-14,999, 4 = £15,000-19,999, 5 = £20,000-24,999, 6 =
£25,000-29,999, 7 = £30,000-34,999, 8 = 35,000-39,999, 9 = £40,000-44,999, 10 = £45,000-

RUNNING HEAD: Why and When Nice Guys Finish Last 20
49,999, 11 = £50,000-59,999, 12 = £60,000-69,999, 13 = £70,000-99,999, 14 = £100,000-149,999,
15 = £150,000+).
Control Variables. We included self-reported responses about participants’ age, gender (0 = male,
1 = female), whether they had children under 18 (coded as 0 = no children and 1 = at least 1 child),
employment status (1 = unemployed, 2= full/part time employed, 3 = retired, 4 = student), and the
four remaining traits in the Five Factor Model as controls.
Analysis. We used the polr function in the MASS package in R (Ripley et al., 2013) to run ordered
logistic regressions for each of the three outcome variables. Model 1 included agreeableness,
income and controls as predictors. Model 2 added the interaction between agreeableness and
income. All continuous variables were z-standardized. An inspection of the variance inflation
factors (VIF) for the regression models suggested multi-collinearity was not a cause for concern
(Hair et al., 1995).
Results
The main effect of agreeableness in Model 1 was found to be significant (B = 0.24, SE = 0.10,
t(538) = 2.45, OR = 1.27[1.05,1.55], p = 0.014). The results of Model 2 are displayed in Table 3.
Insert Table 3 here
Consistent with hypothesis 2, the significant interaction between agreeableness and income
suggests that higher levels of agreeableness lead to a more pronounced increase in the likelihood
of experiencing negative financial outcomes among those with low incomes than those with high-
incomes (B = -0.23, SE = 0.10, t(537) = -2.42 , OR = 0.79[0.65,0.96], p = 0.016). Similar to Study

RUNNING HEAD: Why and When Nice Guys Finish Last 21
3, we tested the robustness of the interaction effect by excluding all covariates from Model 2. The
interaction effect remained marginally significant (B = -0.17, SE = 0.092, t(557) = -1.84, OR =
0.84[0.70,1.01] p = 0.067). Figure 4 illustrates the interaction effect between agreeableness and
income on the insolvency indicator.
Insert Figure 4 here
Study 5
The use of cross-sectional data in Studies 1-4 means that any claims about the directionality of the
effects remain speculative. In Study 5 we therefore utilized data from a longitudinal cohort study
where participants’ agreeableness was measured at age 16-17. This measure is then used to predict
financial outcomes 25 years later, at age 42.
Method
Participants. To test the relationship between adolescent personality and adult savings and debt
rates, we use data from the British Cohort Study (BCS), a nationally representative study of
children born in Britain in a single week in 1970. The BCS contains a self-reported personality
measures at age 16–17 (collected in 1986). Complications in data collection during the survey
wave (a teacher’s strike meant the survey needed to be sent to student’s homes), resulted in only a
sub-sample of participants (4,947 from 11,622 cohort members) completing this measure2. The
survey captures participants at nine points across their life, with different questions asked in each
2 The significant portion of missing data in this analysis means the results from this study should not be interpreted
as providing a representative sample of the UK population.

RUNNING HEAD: Why and When Nice Guys Finish Last 22
wave. The most recent data available is for the 2012 survey, when cohort members were 42 years
old. As this is also the only wave in which both savings and debt are measured, we focus our
analysis on savings and debt in the 2012 wave. Of the 4,947 participants, 2,429 had completed all
independent measures as well as providing self-reported savings and/or debt.
Measures. Agreeableness. A measure of agreeableness has previously been derived using a factor
analysis of various attitude items in the 1986 BCS wave (Lenton, 2014). Self-reported
agreeableness was measured in 1986 when the cohort members were aged 16 –17. Participants
rated the three items “I am friendly”, “I am helpful”, and “I am obedient” on a scale of 1 (Does
not apply), 2 (Applies somewhat), and 3 (Applies very much). Previous work has demonstrated
the validity of this measure (Egan, Daly, Delaney, Boyce, & Wood, 2017) by showing that it
correlates highly (r = 0.70) with the standard 50-item version of the International Personality Item
Pool (IPIP; Goldberg, 1999). With a Cronbach’s alpha of 0.45, the scale reliability for our sample
was poor, however, comparable to other short measures of agreeableness such as the BFI-10
(Rammstedt & John, 2007) or the TIPI (Gosling et al., 2003). Similar to Study 3, the short three-
item scale makes the interpretation of alpha problematic as Cronbach’s alpha is a function of both
the number of items and the mean inter-item correlation, which was found to be acceptable (MIC
= 0.21)
Demographics. Participants’ gender (0 = male, 1 = female; 57% female), the age at which they
left full-time education (Mean = 18.84, SD = 3.20), information on whether they had children in
their household (0 = no, 1 = yes) and their employment status (1 = unemployed, 2 = full time, 3 =
part time, and 4 = student) were added as controls. The sample represents a cohort born in the same
week, therefore age was not included in the analysis.

RUNNING HEAD: Why and When Nice Guys Finish Last 23
Savings and Debt. Our dependent variables were savings and debt rates at age 42 (collected in
2012). These were measured using open response self-reports of total savings and debt. Reported
savings and debt were highly positively skewed, with an average of £30,620 and a median of
£6,000 for savings, and an average of £5,146 and a median of £500 for debt. Similar to Study 1,
we excluded extreme outliers using the standard definition (> outer upper fence = Q3 + 3*IQR).
Analysis. We ran two poisson regression models (with Huber-White robust standard errors),
predicting savings and debt at age 42 from agreeableness measured in adolescence. We use poisson
models because they account for the positive skew in our outcome variables. Model 1 included
agreeableness, income and controls as predictors. Model 2 added the interaction between
agreeableness and income. All continuous variables were z-standardized. An inspection of the
variance inflation factors (VIF) for the two regression models suggested multi-collinearity was not
a cause for concern (Hair et al., 1995).
Results
The main effects of agreeableness in Model 1 were found to be non-significant for savings (B = -
0.028, SE = 0.033, z = 0-0.85, p = 0.395), and debt (B = -0.021, SE = 0.038, z = -0.56, p = 0.573).
The results of Model 2 are displayed in Table 4 (see Table S7 for univariate correlations).
Insert Table 4 here
Supporting Hypothesis 2, we found a significant interaction effect between agreeableness and
income on participants’ savings, suggesting that an agreeable personality was associated with
lower savings among those with low-incomes but not necessarily those with high-incomes (B =

RUNNING HEAD: Why and When Nice Guys Finish Last 24
0.096, SE = 0.034, z = 2.81, p = 0.005). Following the approach used in Studies 3-4, we tested the
robustness of the interaction effect by excluding all covariates from Model 2. The interaction effect
remained statistically significant (B = 0.099, SE = 0.036, z = 2.77, p = 0.006). We did not find a
significant interaction effect between agreeableness and income on debt, suggesting lower levels
of agreeableness in adolescence are not related to increased debt in later life at any level of income.
Figure 5 illustrates the interaction effects between agreeableness and income on savings.
Insert Figure 5 here
The results of Study 5 provide some preliminary evidence that the relationship between
agreeableness and negative financial outcomes may follow a causal path. For low income
participants’, the level of agreeableness at the age of 16 was related to significantly lower levels
of savings 25 years later at the age of 42. Although this design cannot establish causality directly,
the ability to observe the temporal order of events makes it more powerful than purely cross-
sectional designs (see discussion): Notably, the effects were smaller in magnitude than those found
in Studies 1-4. However, given that the predictor of agreeableness was far removed in terms of
time from the outcomes (25 years), this is not surprising. Hence, the fact that the effect of
agreeableness on savings is still detectable after 25 years supports – rather than undermines – its
robustness.
Study 6
Study 6 was aimed at testing whether the results from Studies 3-5 hold when investigated at an
aggregated macro level rather than individual micro level.

RUNNING HEAD: Why and When Nice Guys Finish Last 25
Method
Procedure.
The research design is based on recent findings suggesting that personality traits are unevenly
distributed geographically, with specific traits being more prevalent in some areas compared to
others (Jokela, Bleidorn, Lamb, Gosling, & Rentfrow, 2015; Rentfrow, Gosling, & Potter, 2008;
Rentfrow, Jokela, & Lamb, 2015). These geographical distributions of personality have been
associated with important societal outcomes, including crime rates, political values, employment,
health, and mortality (Rentfrow et al., 2008). Using this approach, we tested whether
agreeableness, when aggregated across geographic units, was predictive of insolvency rates (e.g.,
bankruptcy) in that area. Our analysis investigates this relationship across 324 Local Authority
Districts (LAD), which are subnational divisions of the UK for the purposes of local government.
In our previous studies, the measures we used captured behaviors indicative of financial hardship
on the individual or household level. In study 6, by using publicly available data on insolvency
rates on the LAD level, we measure the rate of bankruptcies for each of these populations. The
study is based on the following logic: Geographic regions with a higher proportion of agreeable
people will have a higher geographically-aggregated agreeableness score. Based on the hypothesis
that agreeable people will be more likely to engage in negative financial behaviors, when living
on a low-income, these higher regional agreeableness scores will be associated with poorer
aggregate financial outcomes for poorer geographic areas, as measured by insolvency rates.
Measures and Participants. Agreeableness. The agreeableness level of LADs was calculated
based on the responses of 332,951 British respondents from 324 LADs (Rentfrow et al., 2015).

RUNNING HEAD: Why and When Nice Guys Finish Last 26
The data were collected as part of the ‘BBC Big Personality Test’, the same large survey dataset
we used a small subset from in Study 2. The mean age of respondents was 36.09 years (SD = 13.93
years) and 64% of respondents reported to be female. As part of the Survey, participants completed
the Big Five Inventory (BFI, John & Srivastava, 1999) which measures agreeableness with nine
statements such as “I see myself as someone who has a forgiving nature”. Using a 5-point Likert-
type rating scale with endpoints at 1 (Disagree strongly) and 5 (Agree strongly), respondents
indicated the extent to which they agreed with each statement. The scale revealed acceptable
internal reliability (α= 0.77). For each respondent, we determined which LAD they lived in based
on their self-reported postcodes, provided as part of the survey. The sample size of individual
LAD’s varied across geographic areas (SD = 709.23), ranging from 167 in Ribble Valley to 5,588
in Leeds. To calculate LAD-level agreeableness scores we first calculated the agreeableness score
of each participant in the dataset by averaging the responses to the nine questions. We subsequently
averaged the agreeableness scores of all participants associated with a particular LAD and z-
standardized across the 324 LADs.
Insolvency Rates. We collected LAD-level insolvency data from the 2010 statistical release issued
by the UK Government insolvencies service, which includes the total number of insolvencies by
geographic unit. There are three forms of insolvency recorded: bankruptcies, Debt Relief Orders
(DROs), and Individual Voluntary Arrangements (IVAs). These are summarized by the UK
Government data release under a comprehensive insolvency measure, which we use as our
dependent variable. Our measure of the insolvency rate for each LAD was calculated as the number
of total insolvencies per 10,000 adults. The average number of insolvencies per 10,000 adults
across the LADs was 30.31 (SD = 8.15). Given the slight positive skew in the distribution of
insolvency rates, we used the square root of this variable in our models.

RUNNING HEAD: Why and When Nice Guys Finish Last 27
Gross Income. To calculate the average Annual Gross income for each LAD, we used data from
the Annual Survey of Hours and Earnings (ASHE; Office for National Statistics, 2011). ASHE is
the most comprehensive source of earnings information in the United Kingdom, based on a 1%
sample of employee jobs taken from official government tax records. Data are weighted to UK
population totals based on classes defined by occupation, region, age and gender. The average
gross annual income for the 324 LADs was £26,609 (SD = £4,149). Given the slight positive skew
in the distribution of gross annual income, we used the square root of this variable in our models.
Control variables. Previous research suggests insolvency rates are influenced by socio-
demographic variables such as employment status, age, gender and education (Bishop & Gripaios,
2010). To control for these additional variables, we used UK government Census data, collected
in 2011 (Office for National Statistics, 2011). For each LAD, we extracted the employment rate
(defined as the percentage of economically active residents), the average age, the percentage of
female citizens, as well as the population density for that area. We additionally calculated an
education index by taking a population-weighted average for the five education levels measured
through the census, ranging from 1, representing no formal qualifications, to 5, representing a
university degree or higher (e.g., BSc, MA, PhD). See Table S8 for a full description of the
education levels. Higher scores indicate a higher overall education level of the population in that
LAD. We also calculated a deprivation index using data provided by the Carstairs Index (Carstairs
and Morris, 1991), an established measure of deprivation used in spatial epidemiology in the UK
(Morgan and Butler, 2006). The index is based on four dimensions measured through the national
census: 1) low social class, 2) lack of car ownership, 3) household overcrowding and 4) male
unemployment. The data give the relative number of people in one of five deprivation categories
(1 = not deprived in any dimension, 5 = deprived on all four dimensions). For each LAD, we

RUNNING HEAD: Why and When Nice Guys Finish Last 28
calculated a Deprivation Index as the weighted average of people in the five different categories.
Finally, we controlled for the aggregated scores on the remaining four personality traits in the Five
Factor Model.
Analysis. An important distinction in the analysis of geographic data, as opposed to individual-
level data, is the need to account for spatial dependencies between regions that are geographically
close to one another (e.g. neighboring LADs; Arbia, 2014). Neighboring LADs will be more
similar in terms of demographic population characteristics and socioeconomic factors, and
therefore are also likely to be more similar in their aggregate-level of agreeableness and their
insolvency rates. A failure to account for existing dependencies results in spatially autocorrelated
error terms, which violate the assumption of independent residuals (Arbia, 2014). Neighboring
LADs were defined as those which shared borders. The Isle of White, a small island off the south
coast of England, did not share a physical border with any of the remaining LADs, and therefore
we used the closest mainland LAD (New Forest) as the nearest neighbor. We tested for spatial
autocorrelations using Moran’s I test (Moran, 1950). This was conducted using the residuals of a
linear regression analysis with LAD insolvency rate as the outcome, and the interaction between
LAD level agreeableness and gross income, as well as control variables as predictors. The Moran’s
I test indicated significant autocorrelations (R = 0.17; p < 0.001). To account for the spatial
dependencies in our data we therefore repeated the analysis using a spatial lag model provided by
the spdep package in R (Bivand et al., 2005). Spatial lag models include “lagged” values of the
outcome variable in the regression, that are comparable to autoregressive terms in longitudinal
analyses (Anselin, Bera, Florax, & Yoon, 1996). Applying the spatial lag model resulted in a non-
significant Moran’s I test (R = 0.03; p = 0.460), indicating that the results are no longer biased by

RUNNING HEAD: Why and When Nice Guys Finish Last 29
spatial autocorrelations and can therefore be interpreted meaningfully. Similar to the previous
studies, Model 1 included agreeableness, income and controls as predictors. Model 2 added the
interaction between agreeableness and income. The variance inflation factors (VIFs) for the
regression model suggested multi-collinearity may be a cause for concern (Hair et al., 1995). Both
our measures of LAD-level education (VIF = 12.68) and deprivation (VIF = 17.50) were highly
correlated with other predictors in the model. We re-ran the spatial lag model excluding
deprivation, and our focal results remain unchanged (i.e. the interaction between agreeableness
and income remained highly significant). An inspection of the VIF statistics, after removing
deprivation from the model, showed they were now all within an acceptable range of VIF < 5.
Results
The main effect of LAD-level agreeableness on insolvency rates in Model 1 was found to be non-
significant (B = 0.011, SE = 0.034, z = 0.34, p = 0.734). The results of Model 2 are displayed in
Table 5 (see Table S9 for univariate correlations). Consistent with Hypothesis 2, we found a
significant interaction effect of LAD-level agreeableness and gross income on insolvency rates (B
= -0.075, SE = 0.025, z = -3.02, p = 0.003). This suggests that, at the geographic level, higher
levels of agreeableness are more strongly associated with higher bankruptcy rates for those living
in areas with lower average incomes, compared to those areas populated by wealthier individuals.
Similar to Studies 3-5, we tested the robustness of the interaction effect by excluding all covariates
from Model 2. While the direction of interaction remained the same, the effect no longer reached
significance (B = -0.03, SE = 0.02, z = -1.41, p = 0.160). However, given that the controls we
added are important confounds of the effect we are testing, this should be taken as a note of caution
rather than evidence against the interaction effect.

RUNNING HEAD: Why and When Nice Guys Finish Last 30
Insert Table 5 here
To provide context to these results, we compared two areas with the same low gross annual income
of £20,572 (approximately one SD below the mean), but different levels of agreeableness:
Middleborough scored about 2.5SDs lower on agreeableness (-1.05) compared to North Devon
(1.42). The total number of insolvencies per 10,000 adults in North Devon (38.66) is 50% higher
than the insolvency rate of Middleborough (25.69). While this comparison serves as an illustrative
example, our regression model predicts a 4% increase in insolvency rates in areas that are one SD
higher in agreeableness, and one SD lower in income. Figure 6 illustrates the interaction effect
visually.
Insert Figure 6 here
Study 7
The goal of study 7 was to replicate the analysis of study 6 using a different geographic region.
We chose to replicate the results in the USA, using county-level data as the unit of analysis. An
advantage of the larger number of counties in the U.S. (n = 2,488), compared to local authority
districts in the U.K., is that this provides higher statistical power and allows for a more robust test
of our hypotheses.
Method

RUNNING HEAD: Why and When Nice Guys Finish Last 31
Measures and Participants. Agreeableness. The agreeableness level of counties was taken from
work published by Obschonka and colleagues (Obschonka, Stuetzer, Rentfrow, Lee, Potter, &
Gosling, 2018), who made the aggregate level estimates of personality available to us for the
purposes of this study. To guarantee the validity of personality estimates, we only included
counties in the analysis for which more than 50 participants had completed the 44-item BFI (John
& Srivastava, 1999), resulting in a sample of n = 2,468,897 responses across 2,488 counties.
Insolvency Rates. We collected county-level bankruptcy data from the 2015 statistical release
issued by the US Courts service, which includes the total number of insolvencies by county. Our
measure of the insolvency rate for each county was calculated as the number of insolvencies per
10,000 adults (including chapter 7, 11, 12 and 13 insolvencies). The average number of
insolvencies per 10,000 adults across the counties was 24.91 (SD = 19.22). Given the slight
positive skew in the distribution of insolvency rates, we used the square root of this variable in our
models.
Income. To calculate the average income for each county in 2015, we used data from the United
States Department of Agriculture. The average gross annual income for the 2,488 counties was
$50,399 (SD = $13,293). Given the slight positive skew in the distribution of gross annual income,
we used the square root of this variable in our models.
Control variables. We use data for 2015 derived from the US Census to extract the same control
variables – or close proxies – as in Study 6 (U.S. Census Bureau, 2010). For each county, we
extracted the employment rate (defined as the percentage of economically active residents), the
average age and the percentage of female citizens. We additionally calculated an education index

RUNNING HEAD: Why and When Nice Guys Finish Last 32
by taking a population-weighted average for the four education levels measured through the census
(1 = less than high school diploma, 2 = high school diploma, 3 = college or associates degree, 4 =
bachelor’s degree or higher), such that higher scores indicate a higher overall education level of
the population in that county. As a proxy for our deprivation measure used in Study 6, we include
the percentage of people living below the poverty line. Population density was approximated by
using the percentage of people living in rural areas (reversed density). Finally, we controlled for
the aggregated scores on the remaining four personality traits in the Five Factor Model.
Analysis. Following the approach used in Study 6, we first applied Moran’s I test to detect spatial
dependencies in the most comprehensive model which included agreeableness, income, their two-
way interaction and controls. Given that a number of counties were missing, and spatial lag models
cannot operate with missing data, it was not possible to define neighbouring counties by shared
borders, as we did in Study 6. Instead, we followed an approach suggested by Obschonka and
colleagues (Obschonka, Lee, Rodríguez-Pose, Eichstaedt & Ebert, 2018), which defined
neighbouring counties as those for which the county centroids are less than 100km apart. For the
59 counties (mostly islands) that were more than 100km away from the next county centroid, we
used the closest county as the nearest neighbour. Moran’s I test indicated marginally significant
autocorrelations (R = 0.02; p = 0.061). To account for the spatial dependencies in our data we
therefore used spatial lag models provided by the spdep package in R (Bivand et al., 2005) instead
of normal linear regressions (see Methods section of Study 6 for a description of spatial lag
models). Applying the spatial lag model resulted in a non-significant Moran’s I test (R = 0.006; p
= 0.495), indicating that the results are no longer biased by spatial autocorrelations and can
therefore be interpreted meaningfully. Similar to the previous studies, Model 1 included

RUNNING HEAD: Why and When Nice Guys Finish Last 33
agreeableness, income and controls as predictors. Model 2 added the interaction between
agreeableness and income. The variance inflation factors (VIFs) were all within acceptable ranges,
meaning multi-collinearity was not a cause for concern in the model (Hair et al., 1995).
Results
The main effect of county-level agreeableness on insolvency rates in Model 1 was found to be
highly significant (B = 0.17, SE = 0.045, z = 3.77, p < 0.001). The results of Model 2 are displayed
in Table 5 (see Table S10 for univariate correlations). Consistent with Hypothesis 2, we found an
interaction effect of county-level agreeableness and gross income on insolvency rates that was
marginally significant at alpha = 0.10 (B = -0.060, SE = 0.035, z = -1.72, p = 0.096). This suggests
that, at the geographic level, higher levels of agreeableness are more strongly associated with
higher insolvency rates for those living in areas with lower average incomes, compared to those
areas populated by wealthier individuals. The interaction effect remained stable when excluding
the covariates from Model 2 (B = -0.067, SE = 0.035, z = -1.93, p = 0.054).
Insert Table 6 here
General Discussion
Our findings contribute to the growing empirical literature investigating the psychological
determinants of financial hardship. Supporting the results of previous research showing a positive
association between agreeableness and lower credit scores (Judge, Livingston, & Hurst, 2012), our
findings show that this association holds across a wide range of indicators of financial hardship,
including savings, debt and insolvency. Our findings further contribute to a better understanding

RUNNING HEAD: Why and When Nice Guys Finish Last 34
of this relationship by providing evidence consistent with the hypothesis that this relationship can
be explained in part by agreeable people perceiving money to be less important (Hypothesis 1b),
but not because they pursue more cooperative negotiation styles (Hypothesis 1a). Finally, our
findings also highlight an important boundary condition to this effect. The relationship between
agreeableness and negative financial outcomes is more pronounced among low-income individuals
(Hypothesis 2).
The outlined results replicate across different samples, measures, and methodologies; including
nationally representative survey responses, digital records collected from customer bank accounts,
online panels, and government-recorded insolvency rates across geographical areas in both the
United States and United Kingdom. While each individual method has specific limitations (e.g.,
self-reports suffer from response biases, customer bank account records are not representative,
aggregated geographical data limit inferences about individual behavior), the consistency of
findings across samples provides strong evidence for the robustness of our effects. It is important
to note that the personality trait of agreeableness was the only Big Five trait that was consistently
related to financial hardship across all seven studies (see Table S11 in the supplementary materials
for an overview of the regression coefficients for the remaining traits across studies).
Our findings make contributions to the existing literature in two important ways. We provide what
we believe to be the first empirical evidence for the theoretical mechanisms underlying the link
between agreeableness and negative financial outcomes (Bernerth et al., 2012; Judge et al., 2012).
It has previously been suggested that the trusting and relationship-focused character of more
agreeable people will lead them to be poor negotiators and more vulnerable to being exploited by

RUNNING HEAD: Why and When Nice Guys Finish Last 35
others. We do not find support for this proposition. Instead, we provide correlational evidence
consistent with the hypothesis that the relationship can be explained in part by agreeable people
assigning a lower subjective value to money. The precise underlying mechanisms and processes
which link agreeableness to a person’s subjective evaluation of money and their financial
behaviors require further study to elucidate. Future research should include different measures of
the subjective value people place on money, such as by using real-choice tasks (e.g., Hardisty,
Thompson, & Krantz, 2013), and establish the importance of those mechanisms in an experimental
set-up that allows for tests of causality.
In addition, our results also contribute to the growing body of research investigating the interplay
of psychological traits and economic characteristics in influencing financial outcomes (Cobb-
Clark et al., 2016). Most research on the macro conditions of deprivation tends to neglect the
science of the individual, with personality psychology often remaining largely unconnected to the
broader body of knowledge studying conditions of economic resources. By following an
interactionist perspective that situates the personality of the individual within broader social and
economic conditions, we were able to show that an individual’s economic circumstances moderate
the extent to which psychological traits predict financial health. This finding is in line with
previous research showing that more conscientious individuals, for example, accumulate more
wealth only when they fall into the lower end of the wealth distribution (Mosca and McCroy,
2016). Similar to the interaction effects between agreeableness and income in our studies, a
conscientious predisposition hence had a diminished impact on the financial health of wealthier
individuals. As higher-income individuals are likely to receive more generous pension

RUNNING HEAD: Why and When Nice Guys Finish Last 36
contributions from their employer, wealth accumulation may become less dependent on active
choices for these individuals, which could explain the weaker association with personality.
Our findings are limited by the fact that the majority of the data analyzed were cross-sectional (and
exclusively non-experimental). It is therefore difficult to draw conclusions about causality. Our
hypotheses suggest that the combination of agreeableness and income leads to negative financial
outcomes, but it is also possible that negative financial outcomes in combination with a generally
low socio-economic status influence a person’s level of agreeableness. Indeed, research suggests
that individuals from lower socio-economic categories tend to prioritize community and focus on
social relationships when facing a potentially threatening situation (Piff et al., 2012). Low-income
individuals who experience financial hardship may feel more dependent on others and change their
behavior in a way that makes them more likely to receive support. Study 5 provides some initial
support for the direction of the effect through a longitudinal analysis across the lifecycle. Given
that participants’ financial situation at the age of 42 cannot have influenced their agreeableness
level at the age of 16/17, any effects we find cannot be explained by reverse causality. However,
as it is still possible that there are confounding variables that influence both participants’
personality at the age of 16/17 and their financial situation at the age of 42, the analysis only
provides preliminary evidence for the direction of the effect.
An understanding of the psychological and economic predictors of negative financial outcomes is
crucial in attempting to protect vulnerable individuals through the design and implementation of
targeted interventions and policies. Given that complex psychological phenomena such as
financial health are unlikely to be determined by a small number of strong predictors (Matz,

RUNNING HEAD: Why and When Nice Guys Finish Last 37
Gladstone & Stillwell, 2017), it is important to identify a variety of contributing factors that
together help inform the debate about who to focus on and how to change behaviour most
effectively. While the effects reported in this paper are relatively small on the individual level (e.g.
a 1SD increase in agreeableness was associated with a decrease of about £1,600 ($2,200) in savings
in Study 1), the results of Studies 6 and 7 demonstrate that seemingly small effects can have sizable
societal consequences when considered at scale. For example, in Study 7 a 1SD increase in county-
level agreeableness was associated with a 9% increase in insolvencies. Taken together, the results
we report provide a deeper understanding of the antecedents of financial hardship, which can have
serious implications for the well-being of individuals, as well as society at large. Our findings
suggest that being kind and trusting has financial costs, especially for those who do not have the
financial means to compensate for their personality predispositions and the attitudes to money
associated with it.

RUNNING HEAD: Why and When Nice Guys Finish Last 38
References
Anselin, L., Bera, A. K., Florax, R., & Yoon, M. J. (1996). Simple diagnostic tests for spatial
dependence. Regional Science and Urban Economics, 26(1), 77–104. doi: 10.1016/0166-
0462(95)02111-6
Antonioni, D. (1998). Relationship between the big five personality factors and conflict
management styles. International Journal of Conflict Management, 9(4), 336–355. doi:
10.1108/eb022814
Arbia, G. (2014). A primer for spatial econometrics: with applications in R. London: Palgrave
Mcmillan
Baron, R. M., & Kenny, D. A. (1986). The moderator-mediator variable distinction in social
psychological research: Conceptual, strategic, and statistical considerations. Journal of
Personality and Social Psychology, 51, 1173-1182.
Barry, B., & Friedman, R. A. (1998). Bargainer characteristics in distributive and integrative
negotiation. Journal of Personality and Social Psychology, 74(2), 345. doi: 10.1037//0022-
3514.74.2.345
Bernerth, J. B., Taylor, S. G., Walker, H. J., & Whitman, D. S. (2012). An empirical
investigation of dispositional antecedents and performance-related outcomes of credit
scores. Journal of Applied Psychology, 97(2), 469. doi: 10.1037/a0026055
Bishop, P., & Gripaios, P. (2010). Personal insolvency in England and Wales: a spatial analysis.
Urban Studies, 47(8), 1687–1702. doi: 10.1177/0042098009356119
Bivand, R., Bernat, A., Carvalho, M., Chun, Y., Dormann, C., Dray, S., … Millo, G. (2005). The
spdep package. Comprehensive R Archive Network, Version, 5–83. doi:
10.3886/ICPSR07913.v
Brice, J., Buck, N., & Prentice-Lane, E. (2002). British Household Panel Survey User Manual

RUNNING HEAD: Why and When Nice Guys Finish Last 39
Volume A: Introduction, Technical Report and Appendices. GEN, Colchester: University of
Essex.
Cobb-Clark, D. A., Kassenboehmer, S. C., & Sinning, M. G. (2016). Locus of control and
savings. Journal of Banking & Finance, 73, 113–130. doi: 10.4419/86788514
De Dreu, C. K. W., & Van Lange, P. A. M. (1995). The impact of social value orientations on
negotiator cognition and behavior. Personality and Social Psychology Bulletin, 21(11),
1178–1188. doi: 10.1177/01461672952111006
Egan, M., Daly, M., Delaney, L., Boyce, C. J., & Wood, A. M. (2017). Adolescent
conscientiousness predicts lower lifetime unemployment. Journal of Applied Psychology,
102(4), 700. doi: 10.1037/apl0000167
Furnham, A., Wilson, E., & Telford, K. (2012). The meaning of money : The validation of a
short money-types measure. Personality and Individual Differences, 52(6), 707–711. doi:
10.1016/j.paid.2011.12.020
Giner-Sorolla, R. (2016). Approaching a fair deal for significance and other concerns. Journal of
Experimental Social Psychology, 65, 1-6.
Goldberg, L. R. (1999). A broad-bandwidth, public domain, personality inventory measuring the
lower-level facets of several five-factor models. Personality Psychology in Europe, 7, 7-28.
Gosling, S. D., Rentfrow, P. J., & Swann, W. B. (2003). A very brief measure of the Big-Five
personality domains. Journal of Research in Personality, 37(6), 504–528. doi:
10.1016/S0092-6566(03)00046-1
Hair, J. F. Jr., Anderson, R. E., Tatham, R. L. & Black, W. C. (1995). Multivariate Data Analysis
(3rd ed). New York: Macmillan.
Hardisty, D. J., Thompson, K. F., & Krantz, D. H. (2013). How to measure time preferences: An
RUNNING HEAD: Why and When Nice Guys Finish Last 40
experimental comparison of three methods. Judgment and Decision Making, 8(3), 236.
John, O. P., & Srivastava, S. (1999). The Big-Five trait taxonomy: History, measurement, and
theoretical perspectives. In L. A. Pervin & O. P. John (Eds.), Handbook of personality:
Theory and research (Vol. 2, pp. 102–138). New York: Guilford Press.
Jokela, M., Bleidorn, W., Lamb, M. E., Gosling, S. D., & Rentfrow, P. J. (2015). Geographically
varying associations between personality and life satisfaction in the London metropolitan
area. Proceedings of the National Academy of Sciences, 112(3), 725–730. doi:
10.1073/pnas.1415800112
Judge, T. A., Livingston, B. A., & Hurst, C. (2012). Do nice guys—and gals—really finish last?
The joint effects of sex and agreeableness on income. Journal of Personality and Social
Psychology, 102(2), 390. doi: 10.1037/a0026021
Kirkcaldy, B., & Furnham, A. (1993). Predictors of beliefs about money. Psychological Reports,
73(3), 1079–1082. doi: 10.2466/pr0.1993.73.3f.1079
Kline, P. (2013). Handbook of psychological testing. Routledge.
Lusardi, A., Schneider, D. J., & Tufano, P. (2011). Financially fragile households: Evidence and
implications (RPRT). National Bureau of Economic Research.
Madrian, B. C., & Shea, D. F. (2001). The power of suggestion: Inertia in 401 (k) participation
and savings behavior. The Quarterly Journal of Economics, 116(4), 1149–1187. doi:
10.1162/003355301753265543
Matz, S. C., Gladstone, J. J., & Stillwell, D. (2017). In a world of big data, small effects can still
matter: a reply to Boyce, Daly, Hounkpatin, and Wood (2017). Psychological
Science, 28(4), 547-550.
McCrae, R. R., & John, O. P. (1992). An introduction to the five-factor model and its

RUNNING HEAD: Why and When Nice Guys Finish Last 41
applications. Journal of Personality, 60(2), 175–215. Doi: 10.1111/j.1467-
6494.1992.tb00970.x
Messick, D. M., & McClintock, C. G. (1968). Motivational bases of choice in experimental
games. Journal of Experimental Social Psychology, 4(1), 1–25. doi: 10.1016/0022-
1031(68)90046-2
Mitchell, T. R., & Mickel, A. E. (1999). The meaning of money: An individual-difference
perspective. Academy of Management Review, 24(3), 568–578. doi: 10.2307/259143
Moberg, P. J. (2001). Linking conflict strategy to the five-factor model: Theoretical and
empirical foundations. International Journal of Conflict Management, 12(1), 47–68. doi:
10.1108/eb022849
Moran, P. A. P. (1950). Notes on continuous stochastic phenomena. Biometrika, 37(1/2), 17–23.
doi: 10.1093.
Mosca, I., & McCrory, C. (2016). Personality and wealth accumulation among older couples: Do
dispositional characteristics pay dividends? Journal of Economic Psychology, 56, 1–19. doi:
10.1016/j.joep.2016.04.006
Obschonka, M., Lee, N., Rodríguez-Pose, A., Eichstaedt, J. C., & Ebert, T. (2018). Big Data,
artificial intelligence and the geography of entrepreneurship in the United States. CEPR
Discussion Paper. http://doi.org/10.17605/OSF.IO/C62TN
Obschonka, M., Stuetzer, M., Rentfrow, P. J., Lee, N., Potter, J., & Gosling, S. D. (2018). Fear,
populism, and the geopolitical landscape: The “sleeper effect” of neurotic personality traits
on regional voting behavior in the 2016 Brexit and Trump elections. Social Psychological
and Personality Science, 9(3), 285-298. doi: 10.1177/1948550618755874
Peer, E., Brandimarte, L., Samat, S., & Acquisti, A. (2017). Beyond the Turk: alternative
RUNNING HEAD: Why and When Nice Guys Finish Last 42
platforms for crowdsourcing behavioral research. Journal of Experimental Social
Psychology, 70, 153–163. doi: 10.1016/j.jesp.2017.01.006
Piff, P. K., Stancato, D. M., Martinez, A. G., Kraus, M. W., & Keltner, D. (2012). Class, chaos,
and the construction of community. Journal of Personality and Social Psychology, 103(6),
949. doi: 10.1037/a0029673
Podsakoff, P. M., & Organ, D. W. (1986). Self-reports in organizational research: Problems and
prospects. Journal of Management, 12(4), 531–544. doi: 10.1177/014920638601200408
Rahim, M. A. (1983). A measure of styles of handling interpersonal conflict. Academy of
Management Journal, 26(2), 368–376. doi: 10.2307/255985
Rammstedt, B., & John, O. P. (2007). Measuring personality in one minute or less: A 10-item
short version of the Big Five Inventory in English and German. Journal of Research in
Personality, 41(1), 203–212. doi: 10.1016/j.jrp.2006.02.001
Rentfrow, P. J., Gosling, S. D., & Potter, J. (2008). A theory of the emergence, persistence, and
expression of geographic variation in psychological characteristics. Perspectives on
Psychological Science, 3(5), 339–369. doi: 10.1111/j.1745-6924.2008.00084.x.
Rentfrow, P. J., Jokela, M., & Lamb, M. E. (2015). Regional personality differences in Great
Britain. PloS One, 10(3), e0122245. doi: 10.1371
Richins, M. L., & Rudmin, F. W. (1994). Materialism and economic psychology. Journal of
Economic Psychology, 15(2), 217–231. doi: 10.1016/0167-4870(94)90001-9
Ripley, B., Venables, B., Bates, D. M., Hornik, K., Gebhart, A., & Firth, D. (2013). Package
“MASS.” Vienna, Austria: R Foundation for Statistical Computing.
Rosseel, Y., Oberski, D., Byrnes, J., Vanbrabant, L., Savalei, V., Merkle, E., … Barendse, M.
(2017). Package “lavaan.” Vienna, Austria: R Foundation for Statistical Computing.

RUNNING HEAD: Why and When Nice Guys Finish Last 43
Stango, V., & Zinman, J. (2014). Limited and varying consumer attention: Evidence from shocks
to the salience of bank overdraft fees. Review of Financial Studies, 27(4), 990–doi:
10.1093/rfs/hhu008
Sussman, A. B., & Alter, A. L. (2012). The Exception Is the Rule: Underestimating and
Overspending on Exceptional Expenses. Journal of Consumer Research, 39(4), 800-814.
doi: 10.1086/665833
Tang, T. L. (1992). The meaning of money revisited. Journal of Organizational Behavior, 13(2),
197–202. doi: 10.1002/job.4030130209
Thomas, K. W. (1992). Conflict and conflict management: Reflections and update. Journal of
Organizational Behavior, 13(3), 265–274. doi: 10.1002/job.4030130307
Thomas, K. W., & Kilmann, R. H. (1978). Comparison of four instruments measuring conflict
behavior. Psychological Reports, 42(3), 1139–1145. doi: 10.2466/pr0.1978.42.3c.1139
U.S. Census Bureau. (2010). American FactFinder. Retrieved May 2018 from
http://factfinder.census.gov/
Watson, D. C. (2014). Materialism : Profiles of agreeableness and neuroticism. Personality and
Individual Differences, 56, 197–200. doi: 10.1016/j.paid.2013.09.014
Wong, A., & Carducci, B. J. (1991). Sensation seeking and financial risk taking in everyday
money matters. Journal of Business and Psychology, 5(4), 525–530. doi:
10.1007/BF01014500

RUNNING HEAD: Why and When Nice Guys Finish Last 44
Tables
Table 1. Overview of studies.
# Hypotheses tested Outcomes Sample
1 Mediation (H1a/H1b) Savings, Debt Online panel (N=636)
2 Mediation (H1b) Savings Online panel (N=3,155)
3 Moderation (H2) Savings, Debt, Default Representative panel (N=4,170)
4 Moderation (H2) Default Objective bank data (N=549)
5 Moderation (H2) Savings, Debt Longitudinal cohort study (N=2,429)
6 Moderation (H2) Default Aggregated geographic data (N=332,951)
7 Moderation (H2) –
Replication of Study 6
Default Aggregated geographic data
(N=2,468,897)

RUNNING HEAD: Why and When Nice Guys Finish Last 45
Table 2. Results of three ordered logistic regression models predicting savings (left), debt (middle) and default (right) in Study 3. * p < 0.05, ** p
< 0.01, *** p < 0.001.
Savings (df = 3,168) Debt (df = 3,596) Default (df = 3,442)
B SE(B) t OR B SE(B) t OR B SE(B) t OR
Predictors
AGR -
0.15*** 0.035 -4.46 0.86[0.80,0.92]
0.093** 0.036 2.59 1.10[1.02,1.18]
0.072 0.044 1.62 1.07[0.99,1.17]
Income 0.82*** 0.040 20.60 2.27[2.10,2.46] -0.031 0.039 -0.80 0.97[0.90,1.05] -0.42*** 0.051 -8.26 0.65[0.59,0.72]
AGR× Income 0.12*** 0.032 3.65 1.12[1.05,1.19] -0.086* 0.034 -2.52 0.92[0.86,0.98] -0.13** 0.043 -2.92 0.88[0.81,0.96]
Controls
Age 0.45*** 0.051 8.91 1.57[1.42,1.73] -0.052 0.051 -1.03 0.95[0.86,1.05] -0.45*** 0.060 -7.47 0.64[0.57,0.72]
Gender -0.15* 0.070 -2.21 0.86[0.75,0.98] -0.15* 0.073 -2.08 0.86[0.74,0.99] 0.038 0.089 0.43 1.04[0.87,1.24]
Children
Yes 0.50*** 0.078 6.51 1.66[1.42,1.93]
-
0.60*** 0.079 -7.60 0.55[0.47,0.64]
-0.48*** 0.089 -5.39 0.62[0.52,0.74]
Education
High School 0.27 0.24 1.09 1.31[0.81,2.11] -0.018 0.23 -0.08 0.98[0.63,1.54] -0.042 0.25 -0.17 0.96[0.58,1.57]
University 0.63* 0.25 2.55 1.88[1.16,3.05] -0.18 0.23 -0.76 0.84[0.53,1.32] -0.21 0.26 -0.82 0.81[0.49,1.34]
Higher
degree 0.85** 0.26 3.28 2.34[1.41,3.88]
-0.43 0.25 -1.75 0.65[0.40,1.05]
-0.26 0.28 -0.95 0.77[0.45,1.32]
Work Status
Full-time 0.27** 0.10 2.61 1.31[1.07,1.61] 0.57*** 0.10 5.43 1.77[1.44,2.17] 0.10 0.12 0.82 1.10[0.87,1.39]
Part-time 0.73*** 0.11 6.52 2.08[1.67,2.59] 0.12 0.11 1.10 1.13[0.91,1.41] -0.15 0.13 -1.19 0.86[0.67,1.10]
Retired 1.46*** 0.13 11.63 4.31[3.37,5.51] -0.41** 0.13 -3.26 0.66[0.52,0.85] -0.64*** 0.16 -3.96 0.53[0.38,0.72]
Openness 0.048 0.034 1.43 1.05[0.98,1.12] 0.023 0.035 0.66 1.02[0.96,1.10] 0.11* 0.043 2.51 1.11[1.02,1.21]
Conscientious. 0.038 0.035 1.08 1.04[0.97,1.11] -0.11** 0.036 -3.11 0.89[0.83,0.96] -0.11* 0.044 -2.57 0.89[0.82,0.97]
Extroversion -0.11** 0.035 -3.19 0.89[0.83,0.96] 0.09* 0.037 2.51 1.1[1.02,1.18] 0.15** 0.046 3.39 1.17[1.07,1.28]
Neuroticism -0.11** 0.035 -3.03 0.90[0.84,0.96] 0.18*** 0.037 4.79 1.19[1.11,1.28] 0.21*** 0.045 4.61 1.23[1.13,1.35]
Note. AGR = Agreeableness. Note. OR = Odds Ratios. The reference category for gender is ‘Male’. The reference category for education is ‘No
education/Primary education’. The reference category for work status is ‘Unemployed’.

RUNNING HEAD: Why and When Nice Guys Finish Last 46
Table 3. Results of ordered logistic regression analyses predicting the presence of negative
financial outcomes from agreeableness and control variables in Study 4. * p < 0.05, ** p < 0.01,
*** p < 0.001.
Insolvency Indicator (df = 539)
B SE(B) t OR
Predictors
Agreeableness 0.24* 0.10 2.45 1.27[1.05,1.55]
Income -0.035 0.10 -0.35 0.97[0.80,1.17]
Agreeableness ×
Income
-0.23* 0.10 -2.42 0.79[0.65,0.96]
Controls
Age 0.036 0.12 0.31 1.04 [0.82,1.31]
Gender 0.16 0.20 0.83 1.18 [0.80,1.73]
Children -0.08 0.09 -0.83 0.93[0.76,1.10]
Work Status
Employed -0.11 0.31 -0.37 0.89[0.49,1.65]
Retired -1.74** 0.60 -2.89 0.18[0.05,0.54]
Student -1.54* 0.71 -2.16 0.21[0.04,0.78]
Openness -0.10 0.10 -1.00 0.91[0.75,1.10]
Conscientiousness 0.14 0.10 1.35 1.15[0.94,1.41]
Extroversion -0.09 0.10 -0.90 0.91[0.75,1.11]
Neuroticism 0.048 0.10 0.46 1.05[0.85,1.29]
Note. The reference Category for Gender is Male. The Reference
Category for employment categories is “Unemployed”.

RUNNING HEAD: Why and When Nice Guys Finish Last 47
Table 4. Results of two poisson regression analyses (with Huber-White robust standard errors)
predicting savings (left), and debt (right) in Study 5. ꝉ p < 0.1, * p < 0.05, ** p < 0.01, *** p <
0.001.
Savings (df = 1,973) Debt (df = 2,251)
B SE(B) t IRR B SE(B) t IRR
Predictors
Agreeableness 0.054 0.034 -1.60 0.95 -0.023 0.038 -0.60 0.98
Income 0.37*** 0.041 9.16 1.45 0.058 0.035 1.66 1.06
Agreeableness ×
Income 0.096** 0.034 2.81 1.10 0.023 0.033 0.71
1.02
Controls
Gender -0.11 0.071 -1.59 0.89 0.052 0.075 0.69 1.05
Children
Yes -0.41*** 0.072 -5.65 0.66 0.17 0.091 1.83 1.18
Education 0.18*** 0.028 6.28 1.19 -0.079* 0.037 -2.14 0.92
Work Status
Full-time -0.23 0.12 -1.88 0.79 0.47** 0.15 3.14 1.60
Part-time -0.027 0.13 -0.21 0.97 -0.11 0.16 -0.73 0.89
Student -1.41** 0.46 -3.08 0.24 0.79* 0.35 2.27 2.21
Conscientiousness -0.020 0.033 -0.60 0.98 -0.009 0.037 -0.23 0.99
Extroversion 0.045 0.031 1.49 1.05 -0.046 0.033 -1.41 0.95
Neuroticism 0.042 0.030 1.43 1.04 -0.006 0.034 -0.18 0.99
Note. The reference Category for Gender is Male. The Reference Category for employment
categories is “Not currently employed”. IRR = Incident Rate Ratio (= EXP(B)).
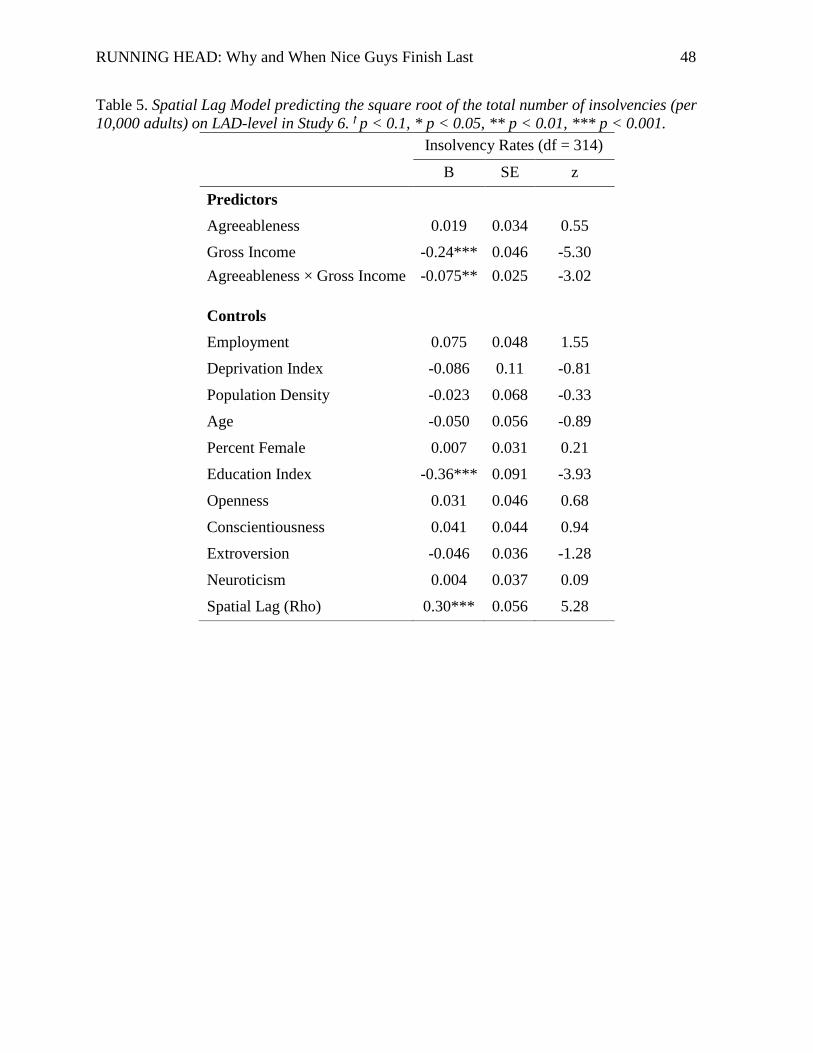
RUNNING HEAD: Why and When Nice Guys Finish Last 48
Table 5. Spatial Lag Model predicting the square root of the total number of insolvencies (per
10,000 adults) on LAD-level in Study 6. ꝉ p < 0.1, * p < 0.05, ** p < 0.01, *** p < 0.001.
Insolvency Rates (df = 314)
B SE z
Predictors
Agreeableness 0.019 0.034 0.55
Gross Income -0.24*** 0.046 -5.30
Agreeableness × Gross Income -0.075** 0.025 -3.02
Controls
Employment 0.075 0.048 1.55
Deprivation Index -0.086 0.11 -0.81
Population Density -0.023 0.068 -0.33
Age -0.050 0.056 -0.89
Percent Female 0.007 0.031 0.21
Education Index -0.36*** 0.091 -3.93
Openness 0.031 0.046 0.68
Conscientiousness 0.041 0.044 0.94
Extroversion -0.046 0.036 -1.28
Neuroticism 0.004 0.037 0.09
Spatial Lag (Rho) 0.30*** 0.056 5.28

RUNNING HEAD: Why and When Nice Guys Finish Last 49
Table 6. Spatial Lag Model predicting the square root of the total number of insolvencies (per
10,000 adults) on county-level in Study 7. ꝉ p < 0.1, * p < 0.05, ** p < 0.01, *** p < 0.001.
Insolvency Rates (df = 2,473)
B SE z
Predictors
Agreeableness 0.15** 0.047 3.09
Gross Income 0.05 0.069 -0.79
Agreeableness × Gross Income -0.60 ꝉ 0.035 -1.72
Controls
Employment -0.32*** 0.059 -5.50
Poverty Rate -0.22** 0.073 -3.00
Percent Rural -0.059 0.041 -1.41
Age -0.15** 0.045 -3.26
Percent Female 0.34*** 0.035 9.60
Education Index -0.27*** 0.053 -5.16
Openness -0.076* 0.037 -2.07
Conscientiousness 0.28*** 0.042 6.73
Extroversion 0.058 ꝉ 0.034 1.71
Neuroticism 0.13** 0.040 3.26
Spatial Lag (Rho) 0.050 0.038 1.31

RUNNING HEAD: Why and When Nice Guys Finish Last 50
Figures
Figure 1. Results of a path model testing the mediating effect of “Importance of Money” and
“Cooperative Negotiation Style” on the relationship between agreeableness and savings in Study
1.
Figure 2. Results of path model testing the mediating effect of “Importance of Money” on the
relationship between agreeableness and savings in Study 2.

RUNNING HEAD: Why and When Nice Guys Finish Last 51
Figure 3. Interaction effects of Agreeableness and Income on savings (top), debt (middle) and
default (bottom) in Study 3.

RUNNING HEAD: Why and When Nice Guys Finish Last 52
Figure 4. Interaction effects of Agreeableness and Income on the Insolvency Indicator in Study
4.
Figure 5. Interaction effects of Agreeableness and Income on Savings in Study 5.

RUNNING HEAD: Why and When Nice Guys Finish Last 53
Figure 6. Interaction of Agreeableness and Gross Annual Household Income in Study 6.
Figure 7. Interaction of Agreeableness and Gross Annual Household Income in Study 7.