running title: exploring disease association from the nhanes data...
TRANSCRIPT

Exploring Disease Association 1
Running Title: Exploring Disease Association from the NHANES Data
Exploring Disease Association from the NHANES Data:
Data Mining, Pattern Summarization, and Visual Analytics
Zhengzheng Xing
School of Computing Science
Simon Fraser University, Burnaby, BC, Canada
Jian Pei
School of Computing Science
Simon Fraser University, Burnaby, BC, Canada

Exploring Disease Association 2
Abstract
Finding associations among different diseases is an important task in medical data mining.
The NHANES data is a valuable source to explore disease associations. However, the existing
studies on analyzing the NHANES data focus on using statistical techniques to test a small
number of hypotheses. To the best of our knowledge, the NHANES data has not been
systematically explored for mining disease association patterns. In this paper, we propose a
direct disease pattern mining method and an interactive disease pattern mining method to explore
the NHANES data. The results on the latest NHANES data demonstrate that our methods can
mine meaningful disease associations consistent with the existing knowledge and literatures.
Furthermore, our methods provide interesting summarization of the data set via a disease
influence graph and a disease hierarchical tree.
Keywords: Data mining, Association patterns, Interactive data mining, Clustering, Medical
informatics.

Exploring Disease Association 3
INTRODUCTION
The National Health and Nutrition Examination Survey (NHANES) is a nationwide survey
conducted by the National Center for Health Statistics and some other health agencies since 1971
(CDC, n.d.). It aims at providing nationally representative information on the health and
nutritional status of the population and tracking changes over time.
NHANES data has been used to evaluate the prevalence and risk factors of diseases in the
population and to provide health guidelines. The prevalence of a disease is the percentage of
population having the disease. For example, in (Beuther, 2007; Saydah et al., 2007), the
NHANES data is used to study the prevalence of obesity and chronic kidney diseases over time
and in different demographics groups (e.g., age, ethnicity and gender). A risk factor of a disease
is a characteristic, condition or behavior that increases a person's chance of developing the
disease. The NHANES data has been used to verify the hypotheses of risk factors of chronic
kidney (Saydah et al., 2007), obesity (Gangwisch et al., 2005), congestive heart failure (He et al.,
2001) and some other diseases. The analysis results from the NHANES data have been used in
the development of health related guidelines and public policies. For example, the early
NHANES data revealed that the blood levels of lead among Americans were too high. The
findings led to the federal regulations on reducing the amount of lead in gasoline, paint and
soldered cans (Pirkle et al. 1998).
The NAHNES data contains a questionnaire component in which selected people are
interviewed for their medical conditions and disease histories. It is a valuable data source for
discovering disease associations among dozens of diseases. Disease associations can provide
useful information in disease prevention, diagnosis and treatment.

Exploring Disease Association 4
There are some studies on evaluating correlated diseases by using statistical methods (He et
al., 2001; Manjunath et al., 2003; Spence et al., 2003). The statistical methods focus on
evaluating a number of pre-defined hypotheses of a set of risk factors or some associated
diseases with respect to a particular disease. In contrast to the statistical methods, data mining
methods aim at discovering the knowledge of associated diseases among a large number of
diseases without any hypotheses. However, to the best of our knowledge, the NHANES data has
not been systematically explored for mining associations among extensive diseases.
Is mining disease association patterns straightforward? One may think that association rule
mining or association pattern mining (Agrawal et al., 2003) can provide an immediate solution.
In an association rule about diseases 𝐴 ⇒ 𝐵, where A and B are two diseases, the probability that
disease A appears in the population is called the support of the rule, and the probability that
disease B appears in the condition of disease A appearing is called the confidence of the rule.
Some other correlation measurements such as lift (Han et al., 2006), all-confidence (Omiecinski
et al., 2003) and cosine (Han et al., 2006; Tan et al., 2002) are also proposed.
Since the number of people with diseases is usually much smaller than the number of healthy
people, to mine association patterns of diseases, the support threshold often has to be set very
low. Furthermore, diseases are very complex mechanisms. Different sub-types of a disease or
people with different health conditions may have very different disease association patterns.
Therefore, disease association patterns usually are not very strong. Consequently, a low
confidence threshold has to be used in order to find many meaningful disease association
patterns. Many other interestingness measures on association rules also meet some difficulties.
For example, the lift for the patterns on high prevalence diseases is very different from the lift for
patterns on low prevalence diseases.

Exploring Disease Association 5
Due to the complexity and diversity in disease association patterns, it is very difficult for a
user to choose an appropriate threshold for a quality measure in the mining. If a user picks a low
threshold in order to avoid missing some interesting patterns, the user may often be
overwhelmed by a large number of rules and patterns which are hard to be analyzed and used.
To make disease association pattern mining practical and useful for health industry users, two
problems need to be solved. First, to help users to understand the results, summarization of
patterns and mining results should be provided. Second, a user should be able to interactively
explore patterns interesting to the user.
In this paper, we tackle the problem of mining disease association patterns in the context of
mining NHANES data. We develop a disease association pattern mining tool and present a
detailed case study. The tool is publicly available at http://www.cs.sfu.ca/~zxing/personal/. We
make the following contributions.
First, we give a direct pattern mining method to mine disease patterns and discuss the
selection of measurements to rank the patterns. We propose a novel disease influence graph to
summarize the top correlated patterns. The graph visualizes interactions among diseases and
prevalence of diseases in the population.
Second, we develop an interactive disease pattern mining method by hierarchical clustering. It
clusters the population based on disease similarities and generates candidate disease association
patterns. It also comes with a cluster visualization module. The hierarchical clustering structure
groups related disease patterns together. The interactive disease pattern mining method enables
users to browse the hierarchical clustering structure and interactively explore interesting sub-
trees for the related disease association patterns. The hierarchical clustering structure also

Exploring Disease Association 6
provides interesting insights on the relationships among diseases and disease sub-groups/sub-
types.
Third, we present a detailed case study on the latest NHANES data, which demonstrates that
our methods can mine meaningful disease association patterns consistent with existing
knowledge and literatures.
The rest of the paper is organized as follows. In the second section of, the direct pattern
mining method is presented. In the third section, the interactive pattern mining method is
described. An empirical study of the NHANES data is reported in the fourth section. The Fifth
section reviews the related work. The paper is concluded in the last section.
DIRECT PATTERN MINING
The NHANES data contains four components, namely demographic data, examination data,
laboratory data and questionnaire data. The demographic component contains information such
as age, gender and ethnic group. The disease status data is contained in the questionnaire
component. To find disease association patterns, we use the demographic component and the
questionnaire. The details of data preprocessing and feature selection will be described in the
Section of Experiments.
After the preprocessing of the raw data set, the population in the survey is presented as a
relational table T. Each tuple in the table represents a person. Each column represents a disease.
Using diseases as features, a person t is represented as a tuple 𝑡 =< 𝑡1 ,𝑡2 , … , 𝑡𝑛 >, where
𝑡𝑖 = 1 if t had or has disease 𝑑𝑖 , 𝑡𝑖 = 2 if t never has the disease, and 𝑡𝑖 = 0 if whether the
person t has that disease is unknown.

Exploring Disease Association 7
To mine disease patterns, we do not consider patterns involving disease absence. A disease
association pattern 𝐷 =< 𝑑𝑖1 ,𝑑𝑖2 , … ,𝑑𝑖𝑚 > represents that diseases 𝑑𝑖1 ,𝑑𝑖2 , … ,𝑑𝑖𝑚 occur
together.
To evaluate a disease association pattern, we consider two aspects. One is the prevalence of
the pattern in the population, and one is the correlations among diseases in the pattern.
Given a population T of size N, the prevalence of a pattern 𝐷 =< 𝑑𝑖1 ,𝑑𝑖2 , … ,𝑑𝑖𝑚 > ,
denoted by 𝑃(< 𝑑𝑖1 ,𝑑𝑖2 , … ,𝑑𝑖𝑚 >) is the percentage of people who have all the diseases in 𝐷 .
Formally, we have 𝑃(< 𝑑𝑖1 ,𝑑𝑖2 , … ,𝑑𝑖𝑚 >) = |{𝑡 ∈ 𝑇|𝑡𝑖1 = 1, 𝑡𝑖2 = 1, … , 𝑡𝑖𝑚 = 1}| 𝑁⁄ .
To evaluate the correlation among diseases in a disease association pattern, we need to choose
a proper measurement. In (Tan et al. , 2002), they compared 21 interestingness measures for
association patterns, including support, confidence, odds ratio, lift, cosine, mutual information
and some others. The comparison shows that no single measurement is consistently better than
the others in all application domains.
The number of people with diseases is much smaller than the number of healthy people.
Moreover, we consider disease co-presence more important than co-absence. Therefore, the
disease data is sparse. (Han et al., 2006; Tan et al., 2002) suggest that the correlation
measurements with the null-invariance property are suitable for applications with sparse data.
In our application setting, a correlation measure is null-invariant means for a disease pattern D,
that the value of the correlation measure is not affected by the number of people who do not have
diseases in pattern D.
For example, measure cosine is null-invariant and measurement lift is not. The measurement
cosine and lift (Han et al., 2006; Tan et al., 2002) for a disease pattern of two diseases are
defined as follow,

Exploring Disease Association 8
𝑐𝑜𝑠𝑖𝑛𝑒(< 𝐴,𝐵 >) =𝑃(< 𝐴,𝐵 >)
�𝑃(< 𝐴 >)𝑃(< 𝐵 >)
𝑙𝑖𝑓𝑡(< 𝐴,𝐵 >) =𝑃(< 𝐴,𝐵 >)
𝑃(< 𝐴 >)𝑃(< 𝐵 >)
Given a population, suppose disease A has prevalence 0.03, disease B has prevalence 0.02,
and a pattern < A, B > has prevalence 0.01. We have 𝑐𝑜𝑠𝑖𝑛𝑒(< 𝐴,𝐵 >) = 𝑃(<𝐴,𝐵>)�𝑃(<𝐴>)𝑃(<𝐵>)
=
0.408 and 𝑙𝑖𝑓𝑡(< 𝐴,𝐵 >) = 𝑃(<𝐴,𝐵>)𝑃(<𝐴>)𝑃(<𝐵>)
= 16.67 . Suppose we remove 90% of the
population that do not have diseases A or B from consideration. Then, the prevalence of disease
A increases to 0.3 and that of disease B becomes 0.2. The prevalence of pattern <A, B> is
upgraded to 0.1. We have 𝑐𝑜𝑠𝑖𝑛𝑒(< 𝐴,𝐵 >) = (𝑃(<𝐴′, 𝐵′>))
�𝑃�<𝐴′>�𝑃( < 𝐵′>)=0.408, remained unchanged.
This elaborates that cosine is null-invariant. On the other hand,
𝑙𝑖𝑓𝑡(< 𝐴′,𝐵′ >) = 𝑃(<𝐴′,𝐵′>)𝑃�<𝐴′>�𝑃(<𝐵′>)
= 1.67. Thus, lift is not null-invariant.
As shown in this example, a measure which is not null-invariant may give a higher score to
patterns involving low prevalent diseases. If a user picks the top-k patterns, those patterns may
mainly involve diseases with low prevalence.
Two null-invariant correlation measures, cosine and Jaccard distance, are discussed in (Tan et
al., 2002). However, they are not effective in guiding disease association pattern mining since
they are only applicable to patterns involving two diseases. Therefore, we want to find a null-
invariant correlation measure that can handle multiple diseases in a pattern.
One possible measure in the literature is all-confidence (Omiecinski, 2003). A disease
association pattern D can induce a set 𝑅(𝐷) of 𝑥𝑚 − 2 association rules in the form of 𝑋
Exploring Disease Association 9
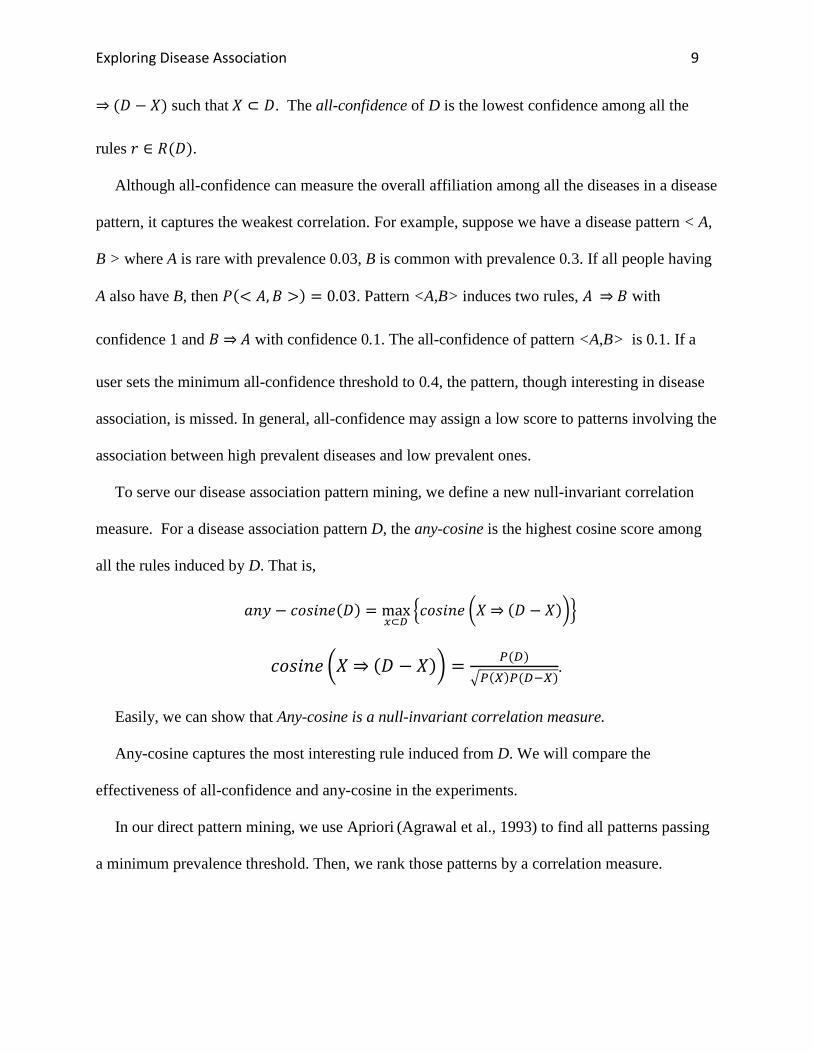
⇒ (𝐷 − 𝑋) such that 𝑋 ⊂ 𝐷. The all-confidence of D is the lowest confidence among all the
rules 𝑟 ∈ 𝑅(𝐷).
Although all-confidence can measure the overall affiliation among all the diseases in a disease
pattern, it captures the weakest correlation. For example, suppose we have a disease pattern < A,
B > where A is rare with prevalence 0.03, B is common with prevalence 0.3. If all people having
A also have B, then 𝑃(< 𝐴,𝐵 >) = 0.03. Pattern <A,B> induces two rules, 𝐴 ⇒𝐵 with
confidence 1 and 𝐵 ⇒ 𝐴 with confidence 0.1. The all-confidence of pattern <A,B> is 0.1. If a
user sets the minimum all-confidence threshold to 0.4, the pattern, though interesting in disease
association, is missed. In general, all-confidence may assign a low score to patterns involving the
association between high prevalent diseases and low prevalent ones.
To serve our disease association pattern mining, we define a new null-invariant correlation
measure. For a disease association pattern D, the any-cosine is the highest cosine score among
all the rules induced by D. That is,
𝑎𝑛𝑦 − 𝑐𝑜𝑠𝑖𝑛𝑒(𝐷) = max𝑥⊂𝐷
�𝑐𝑜𝑠𝑖𝑛𝑒 �𝑋 ⇒ (𝐷 − 𝑋)��
𝑐𝑜𝑠𝑖𝑛𝑒 �𝑋 ⇒ (𝐷 − 𝑋)� = 𝑃(𝐷)�𝑃(𝑋)𝑃(𝐷−𝑋)
.
Easily, we can show that Any-cosine is a null-invariant correlation measure.
Any-cosine captures the most interesting rule induced from D. We will compare the
effectiveness of all-confidence and any-cosine in the experiments.
In our direct pattern mining, we use Apriori (Agrawal et al., 1993) to find all patterns passing
a minimum prevalence threshold. Then, we rank those patterns by a correlation measure.

Exploring Disease Association 10
There may be many patterns passing the minimum support threshold. As discussed before,
summarization of patterns is highly desirable. We summarize the top ranked patterns by a
disease influence graph.
[Figure 1 goes here] Figure 1: The disease influence graph of people of age at least 20.
Figure 1 shows an example. The nodes in the graph are the diseases, and the size of each
node is proportional to the prevalence of the corresponding disease. Two diseases are linked by
an edge if they appear in a pattern. The thickness of the edge is proportional to the correlation
score of the pattern. If two diseases appear in multiple top-ranked patterns, the thickness of the
edge between them takes the highest correlation score in those patterns.
The visualization in a disease influence graph is intuitive. A disease influence graph provides
an overview of the prevalence and the interactions among the diseases in a population. Moreover,
in a disease influence graph, the hubs and the dense connected areas can be viewed as the
influential diseases in association patterns. We will discuss more details in the Section of
Experiments.
INTERACTIVE PATTERN MINING
More often than not, a user may only be interested in the disease patterns involving some certain
diseases. For example, a clinical specialist may only be interested in the patterns involving
diabetes. Can we provide an effective way to let the user interactively browse the disease
patterns according to his/her own interests? In this section, we propose an interactive disease
pattern mining method based on agglomerative hierarchical clustering (Murtagh, 1983).
Disease associations are sophisticated. People having different subtypes of a disease or people
in different health conditions may have different disease co-occurrences. This motivates us to

Exploring Disease Association 11
cluster people based on the similarity of their disease patterns. Intuitively, people in a cluster
share some common diseases, such as a cluster of people with a kidney disease or a cluster of
people with a heart disease.
There are many different clustering methods, such as partitioning based clustering and
hierarchical clustering. In disease association pattern analysis, it is highly desirable to organize
disease associations in a hierarchical structure. For example, people having diabetes form a big
cluster. Among those people, some may only have diabetes, and the others may have diabetes
and some other complications. Therefore, we employ hierarchical clustering instead of
partitioning based clustering.
Clustering is useful beyond pattern exploration. A cluster can be used to generate hypotheses
of disease associations by summarizing its semantic meaning. For example, if we find a cluster
of people with the characteristics of high blood pressure and high blood cholesterol level, a
hypothesis of disease associations, < High blood pressure, High blood cholesterol > can be
generated.
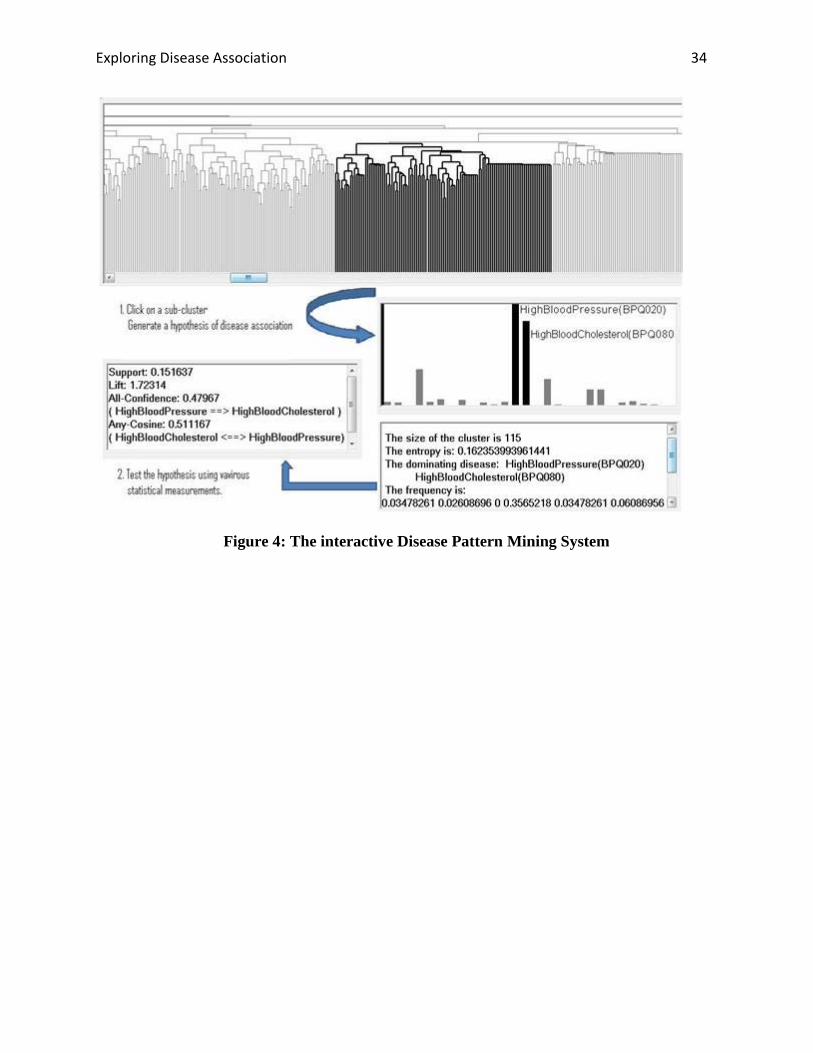
[Figure 2 goes here]
Figure 2: The interactive Disease Pattern Mining System
Figure 2 demonstrates our interactive disease pattern mining system. Starting from the whole
hierarchical clustering structure of the population, a user can click on a sub-cluster. The detailed
distribution of the diseases in the selected sub-cluster will be visualized. Moreover, using the
dominating diseases in the sub-cluster, a hypothesis disease association pattern is generated. If
the user is interested in such a pattern, he/she can further test the pattern against the whole
population using various statistical measures. The analysis can be conducted recursively in the
hierarchical structure.
Exploring Disease Association 12
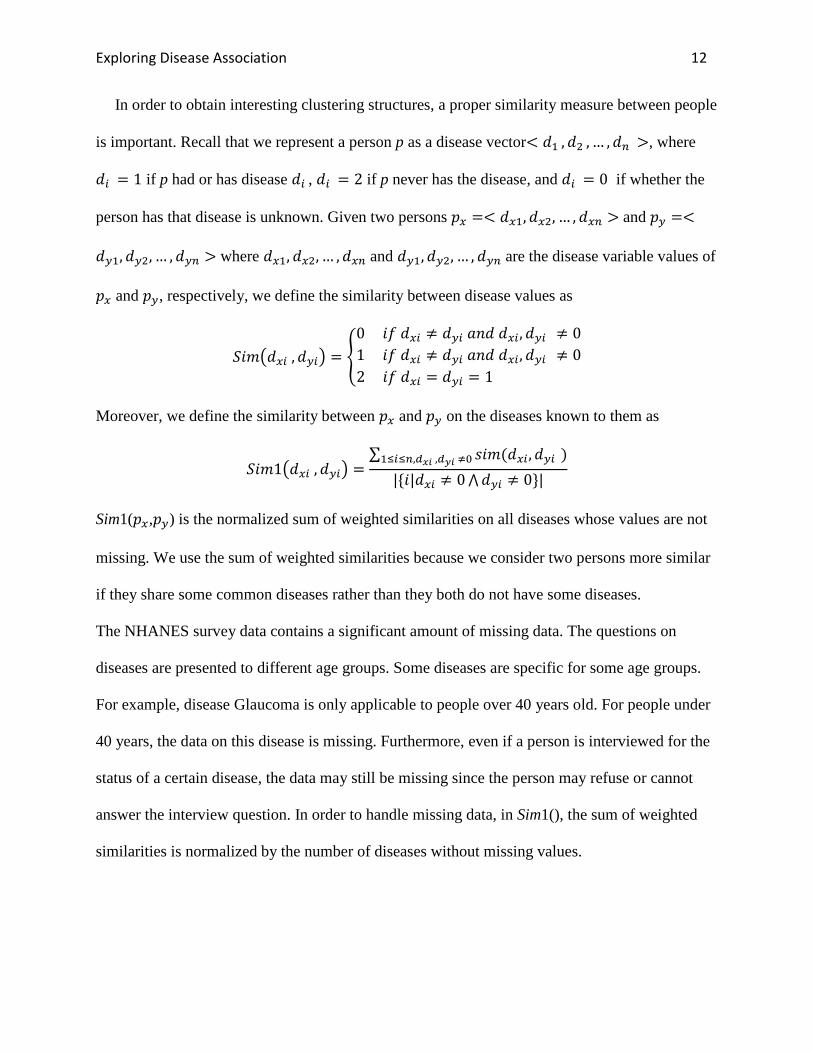
In order to obtain interesting clustering structures, a proper similarity measure between people
is important. Recall that we represent a person p as a disease vector< 𝑑1 ,𝑑2 , … ,𝑑𝑛 >, where
𝑑𝑖 = 1 if p had or has disease 𝑑𝑖 , 𝑑𝑖 = 2 if p never has the disease, and 𝑑𝑖 = 0 if whether the
person has that disease is unknown. Given two persons 𝑝𝑥 =< 𝑑𝑥1,𝑑𝑥2, … , 𝑑𝑥𝑛 > and 𝑝𝑦 =<
𝑑𝑦1,𝑑𝑦2, … ,𝑑𝑦𝑛 > where 𝑑𝑥1, 𝑑𝑥2, … ,𝑑𝑥𝑛 and 𝑑𝑦1,𝑑𝑦2, … , 𝑑𝑦𝑛 are the disease variable values of
𝑝𝑥 and 𝑝𝑦, respectively, we define the similarity between disease values as
𝑆𝑖𝑚�𝑑𝑥𝑖 ,𝑑𝑦𝑖� = �0 𝑖𝑓 𝑑𝑥𝑖 ≠ 𝑑𝑦𝑖 𝑎𝑛𝑑 𝑑𝑥𝑖,𝑑𝑦𝑖 ≠ 01 𝑖𝑓 𝑑𝑥𝑖 ≠ 𝑑𝑦𝑖 𝑎𝑛𝑑 𝑑𝑥𝑖,𝑑𝑦𝑖 ≠ 02 𝑖𝑓 𝑑𝑥𝑖 = 𝑑𝑦𝑖 = 1
�
Moreover, we define the similarity between 𝑝𝑥 and 𝑝𝑦 on the diseases known to them as
𝑆𝑖𝑚1�𝑑𝑥𝑖 ,𝑑𝑦𝑖� =∑ 𝑠𝑖𝑚(𝑑𝑥𝑖,𝑑𝑦𝑖 )1≤𝑖≤𝑛,𝑑𝑥𝑖 ,𝑑𝑦𝑖 ≠0
|{𝑖|𝑑𝑥𝑖 ≠ 0⋀𝑑𝑦𝑖 ≠ 0}|
Sim1(𝑝𝑥,𝑝𝑦) is the normalized sum of weighted similarities on all diseases whose values are not
missing. We use the sum of weighted similarities because we consider two persons more similar
if they share some common diseases rather than they both do not have some diseases.
The NHANES survey data contains a significant amount of missing data. The questions on
diseases are presented to different age groups. Some diseases are specific for some age groups.
For example, disease Glaucoma is only applicable to people over 40 years old. For people under
40 years, the data on this disease is missing. Furthermore, even if a person is interviewed for the
status of a certain disease, the data may still be missing since the person may refuse or cannot
answer the interview question. In order to handle missing data, in Sim1(), the sum of weighted
similarities is normalized by the number of diseases without missing values.
Exploring Disease Association 13
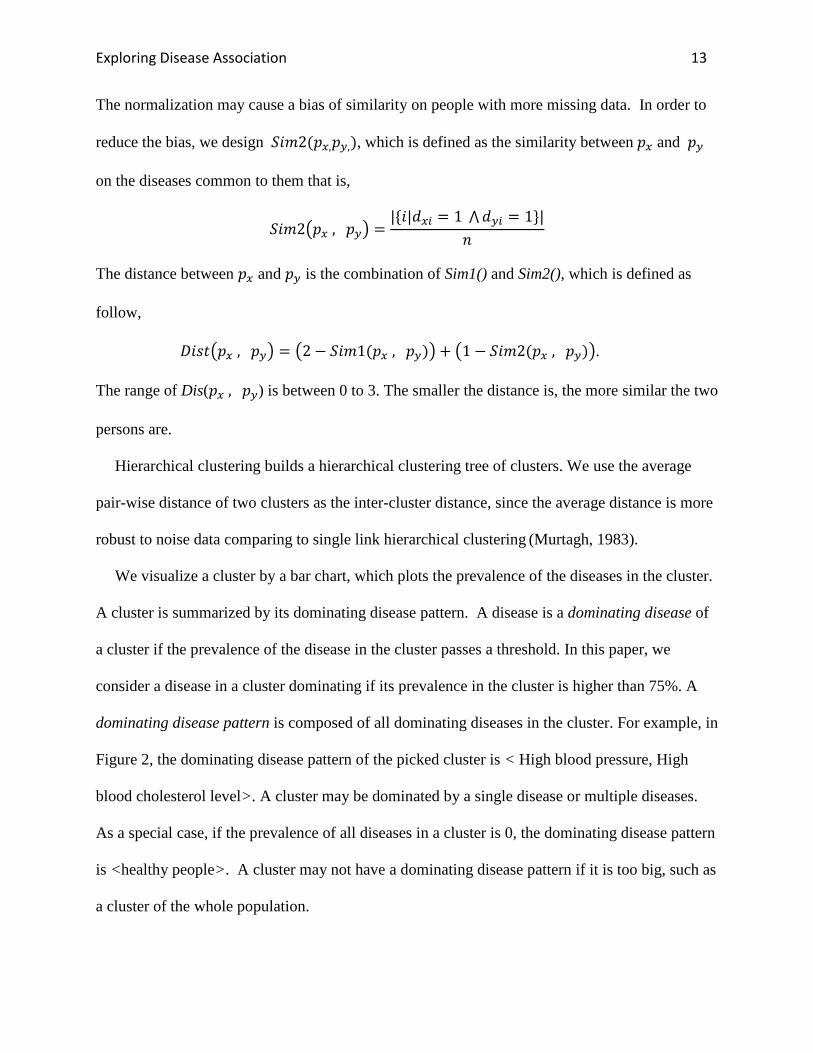
The normalization may cause a bias of similarity on people with more missing data. In order to
reduce the bias, we design 𝑆𝑖𝑚2(𝑝𝑥,𝑝𝑦,), which is defined as the similarity between 𝑝𝑥 and 𝑝𝑦
on the diseases common to them that is,
𝑆𝑖𝑚2�𝑝𝑥 , 𝑝𝑦� =|{𝑖|𝑑𝑥𝑖 = 1 ⋀𝑑𝑦𝑖 = 1}|
𝑛
The distance between 𝑝𝑥 and 𝑝𝑦 is the combination of Sim1() and Sim2(), which is defined as
follow,
𝐷𝑖𝑠𝑡�𝑝𝑥 , 𝑝𝑦� = �2 − 𝑆𝑖𝑚1(𝑝𝑥 , 𝑝𝑦)� + �1 − 𝑆𝑖𝑚2(𝑝𝑥 , 𝑝𝑦)�.
The range of Dis(𝑝𝑥 , 𝑝𝑦) is between 0 to 3. The smaller the distance is, the more similar the two
persons are.
Hierarchical clustering builds a hierarchical clustering tree of clusters. We use the average
pair-wise distance of two clusters as the inter-cluster distance, since the average distance is more
robust to noise data comparing to single link hierarchical clustering (Murtagh, 1983).
We visualize a cluster by a bar chart, which plots the prevalence of the diseases in the cluster.
A cluster is summarized by its dominating disease pattern. A disease is a dominating disease of
a cluster if the prevalence of the disease in the cluster passes a threshold. In this paper, we
consider a disease in a cluster dominating if its prevalence in the cluster is higher than 75%. A
dominating disease pattern is composed of all dominating diseases in the cluster. For example, in
Figure 2, the dominating disease pattern of the picked cluster is < High blood pressure, High
blood cholesterol level>. A cluster may be dominated by a single disease or multiple diseases.
As a special case, if the prevalence of all diseases in a cluster is 0, the dominating disease pattern
is <healthy people>. A cluster may not have a dominating disease pattern if it is too big, such as
a cluster of the whole population.

Exploring Disease Association 14
At this point, the advantage of hierarchical clustering against partitioning based clustering in
interactive mining of disease association patterns becomes clear. The partitioning-based
clustering methods, such as k-mean, need the number of clusters as a parameter. Setting the
number of clusters improperly may produce a messy clustering result. Hierarchical clustering
does not require a user to specify the number of clusters. By summarizing the clusters,
hierarchical clustering automatically provides a natural partitioning of the population. When a
user browses down the hierarchical clustering tree from the root, at the top levels, the clusters
may not have dominating disease patterns. The descendant clusters closest to the root which have
dominating disease patterns form a natural partitioning of the population. We call those clusters
the natural clusters. Importantly, in a natural cluster, most of the dominating disease patterns
contained in its sub-clusters are the extended patterns of the dominating disease pattern in the
natural cluster. When browsing the hierarchical clustering tree by clicking the sub-trees, a user
can view how the related dominating disease patterns change in a hierarchical structure.
A user may also be interested in extracting all dominating disease patterns in a hierarchical
cluster tree. We can output all patterns by recursively traversing the hierarchical cluster tree from
the root. We use two parameters, a size threshold and an entropy threshold of a cluster, as the
stopping conditions for the recursive traversing to select only significant dominating disease
patterns.
A very small cluster is statistically insignificant. The dominating disease patterns extracted
from such small clusters are not interesting in statistical analysis. Therefore, we can use a size
threshold to filter out small clusters.
Consider a cluster C with m diseases, denoted by 𝐹𝑟𝑒(𝐶) =< 𝑓(𝑑1),𝑓(𝑑2), … ,𝑓(𝑑𝑚) >.
We define the entropy of a disease 𝑑𝑖 (1 ≤ 𝑖 ≤ 𝑚) as
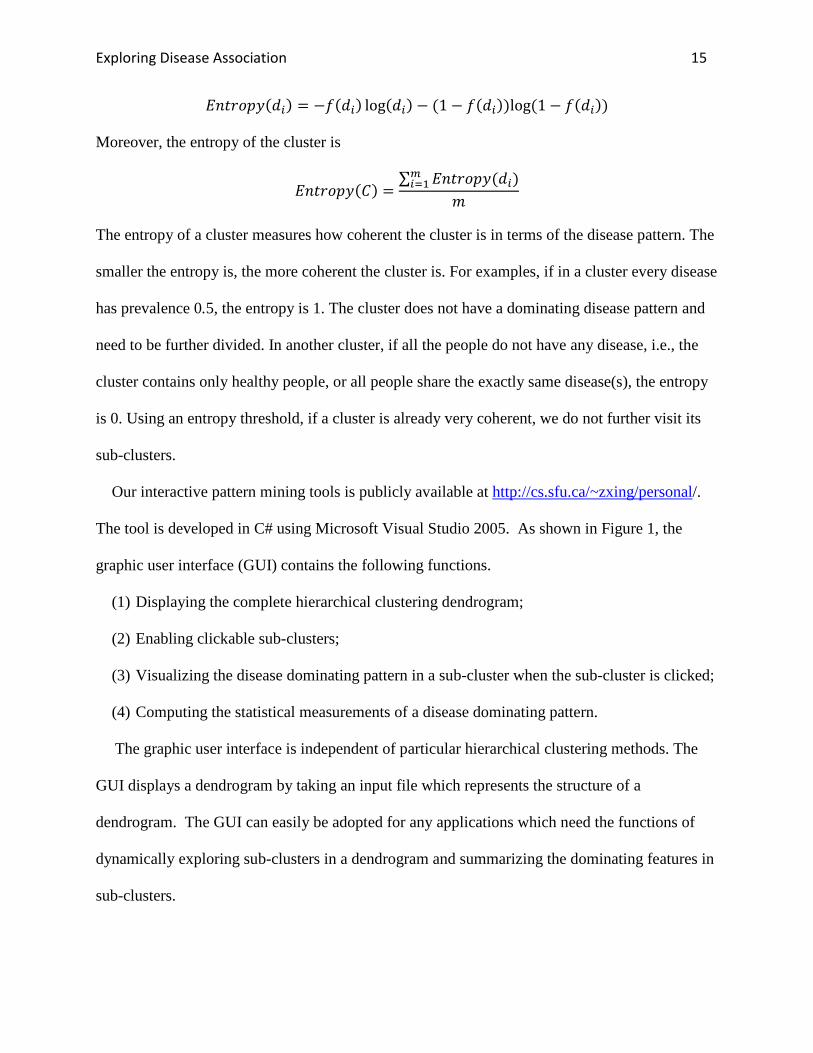
Exploring Disease Association 15
𝐸𝑛𝑡𝑟𝑜𝑝𝑦(𝑑𝑖) = −𝑓(𝑑𝑖) log(𝑑𝑖) − (1 − 𝑓(𝑑𝑖))log(1− 𝑓(𝑑𝑖))
Moreover, the entropy of the cluster is
𝐸𝑛𝑡𝑟𝑜𝑝𝑦(𝐶) =∑ 𝐸𝑛𝑡𝑟𝑜𝑝𝑦(𝑑𝑖)𝑚𝑖=1
𝑚
The entropy of a cluster measures how coherent the cluster is in terms of the disease pattern. The
smaller the entropy is, the more coherent the cluster is. For examples, if in a cluster every disease
has prevalence 0.5, the entropy is 1. The cluster does not have a dominating disease pattern and
need to be further divided. In another cluster, if all the people do not have any disease, i.e., the
cluster contains only healthy people, or all people share the exactly same disease(s), the entropy
is 0. Using an entropy threshold, if a cluster is already very coherent, we do not further visit its
sub-clusters.
Our interactive pattern mining tools is publicly available at http://cs.sfu.ca/~zxing/personal/.
The tool is developed in C# using Microsoft Visual Studio 2005. As shown in Figure 1, the
graphic user interface (GUI) contains the following functions.
(1) Displaying the complete hierarchical clustering dendrogram;
(2) Enabling clickable sub-clusters;
(3) Visualizing the disease dominating pattern in a sub-cluster when the sub-cluster is clicked;
(4) Computing the statistical measurements of a disease dominating pattern.
The graphic user interface is independent of particular hierarchical clustering methods. The
GUI displays a dendrogram by taking an input file which represents the structure of a
dendrogram. The GUI can easily be adopted for any applications which need the functions of
dynamically exploring sub-clusters in a dendrogram and summarizing the dominating features in
sub-clusters.

Exploring Disease Association 16
EXPERIMENTS
In this paper, we use the NHANES data of year 2005-2006. The data set contains in total 10,348
people. In the questionnaire component, interviewees are asked about the histories on a
collection of diseases, such as allergies, cardiovascular diseases, kidney diseases, and diabetes.
The disease statuses are obtained from the self reported answers in the following questions, “Has
a doctor or other health professional ever told you/SP (for spouse) that you have/s/he/SP
have . . . ?". We include the disease statuses obtained by the above questions. In total, the
Exploring Disease Association 17
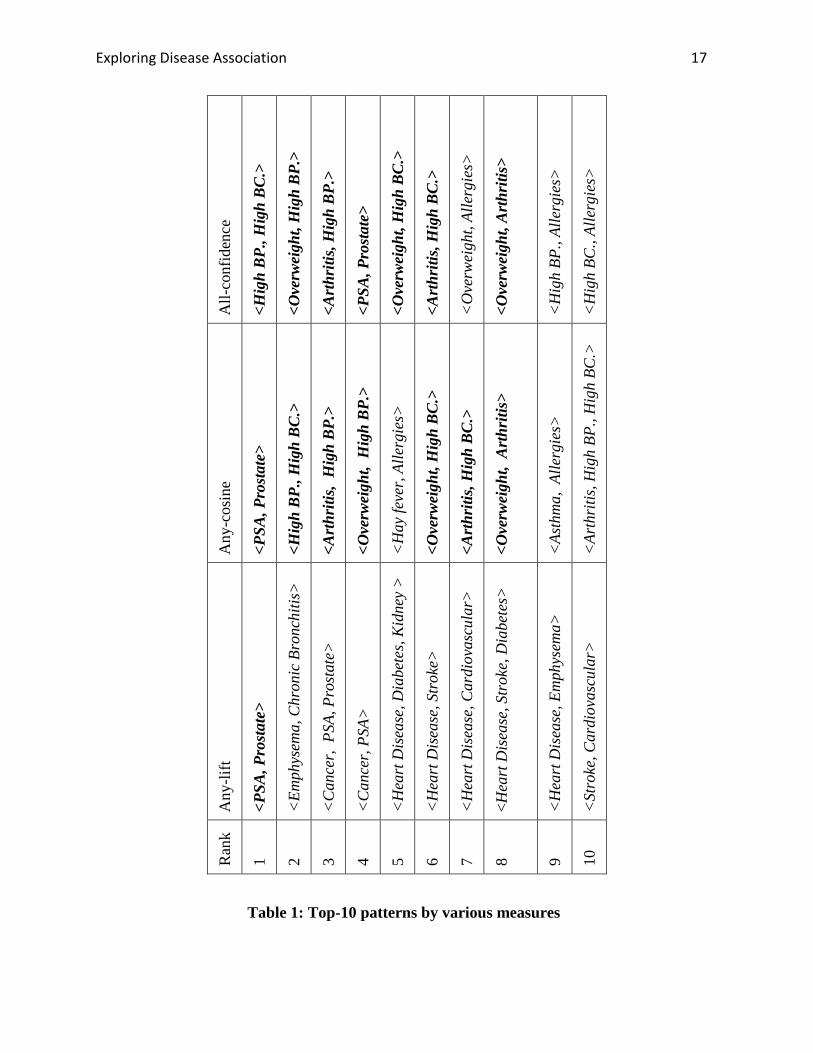
Table 1: Top-10 patterns by various measures
All-
conf
iden
ce
<Hig
h B
P., H
igh
BC
.>
<Ove
rwei
ght,
Hig
h B
P.>
<Art
hriti
s, H
igh
BP.
>
<PSA
, Pro
stat
e>
<Ove
rwei
ght,
Hig
h B
C.>
<Art
hriti
s, H
igh
BC
.>
<O
verw
eigh
t, Al
lerg
ies>
<Ove
rwei
ght,
Art
hriti
s>
<H
igh
BP.,
Alle
rgie
s>
<H
igh
BC.,
Alle
rgie
s>
Any
-cos
ine
<PSA
, Pro
stat
e>
<Hig
h B
P., H
igh
BC
.>
<Art
hriti
s, H
igh
BP.
>
<Ove
rwei
ght,
Hig
h B
P.>
<H
ay fe
ver,
Alle
rgie
s>
<Ove
rwei
ght,
Hig
h B
C.>
<Art
hriti
s, H
igh
BC
.>
<Ove
rwei
ght,
Art
hriti
s>
<As
thm
a, A
llerg
ies>
<Ar
thri
tis, H
igh
BP.,
Hig
h BC
.>
Any
-lift
<PSA
, Pro
stat
e>
<Em
phys
ema,
Chr
onic
Bro
nchi
tis>
<C
ance
r, P
SA, P
rost
ate>
<C
ance
r, PS
A>
<H
eart
Dis
ease
, Dia
bete
s, K
idne
y >
<H
eart
Dis
ease
, Str
oke>
<H
eart
Dis
ease
, Car
diov
ascu
lar>
<Hea
rt D
isea
se, S
trok
e, D
iabe
tes>
<H
eart
Dis
ease
, Em
phys
ema>
<St
roke
, Car
diov
ascu
lar>
Ran
k
1 2 3 4 5 6 7 8 9 10

Exploring Disease Association 18
questionnaire covers 26 disease statuses/medical conditions. Some diseases such as heart disease
are combined from several subtypes of appearing in the raw data such as congestive heart failure
and coronary heart disease. We do not include any diseases about emotional health such as
depression. The questions on diseases are presented to different age groups. For people of age 40
and older, all the 26 diseases are interviewed. To people of age between 20 and 40, 23 diseases
are presented. To people younger than 20, only 9 diseases are presented.
In this report, we analyze the data on the people of age 20 and older. There are in total 4,979
people in this age group.
The Result of Direct Pattern Mining
The direct data mining method obtains 1, 639 disease association patterns by setting the
minimal support threshold to 0.5%.
To compare the effectiveness of various correlation measures, Table 1 lists the top-10 patterns
in three measures, all-confidence, any-cosine and any-lift. For a disease pattern, Any-lift is the
highest lift among all the rules induced from the patterns using all the item. From Table 1, we
can see that the top-10 patterns ranked by all-confidence are similar to the top-10 patterns ranked
by any-cosine: 7 out of the 10 patterns are in common, as highlighted in the table. Any-lift only
finds one pattern common with the top-10 patterns in all-confidence and any-cosine. Each of the
top 10 patterns in any-lift involves at least one disease of low prevalence, such as chronic
bronchitis and kidney diseases. As analyzed in the Section of Background, this is because lift is
not null-invariant.
Among all the patterns in the top 10 lists in all-confidence and any-cosine, <Arthritis, High
BP., High BC.> is the only long pattern involving 3 diseases which is ranked high by any-cosine,

Exploring Disease Association 19
but low by all-confidence. By examining the ranked lists in any-cosine and all-confidence, we
find that the major difference between the two measures is that any-cosine ranks some long
patterns high, while all-confidence always ranks short patterns high. For example, among the top
50 patterns ranked by any-confidence, there are only 7 long patterns and there are 12 long
patterns in the top-50 list of any-confidence. This clearly shows that any-cosine can promote
long patterns which induce interesting rules, while all-confidence cannot.
The top-ranked disease association patterns in Table 1 can be well explained by the existing
medical knowledge. For example, pattern < High BP., High BC. > is consistent with the well
known fact that high blood pressure and high blood cholesterol level have a high chance to
happen together. Pattern < Arthritis, High BP. > is supported by (Biomedical.Org , n.d.; Forman
et al. 2007), which showed that some pain reliever drugs used frequently by people of arthritis
increase the risk of high blood pressure. Pattern < Arthritis, Overweight > is consistent with the
finding in (Gill et al., 2005), which showed that overweight and obesity are strongly related to
arthritis.
In addition to viewing the top patterns one by one, a user may also see an overall picture of
the disease interactions on the population. In Figure 1 (the graphics is generated by the
TouchGraph Navigator package http://www.touchgraph.com/navigator.html), the top 50 patterns
ranked by any-cosine are visualized using a disease influence graph defined in Section 2. From
the graph we can see that Hb (High blood pressure), Al (Allergies), Ov (Overweight), Hc (High
blood cholesterol), Ar (Arthritis), Tr (Trouble seeing even with glasses) are the top six high
prevalent diseases, and they influence each other intensively by forming a clique in the graph.
There are another 8 diseases which are directly connected with the clique through one or
multiple edges. In other words, those diseases are 1 edge away from the clique. For example, Di
Exploring Disease Association 20
(Diabetes) interacts with live diseases in the clique except for Al (Allergies). He (Heart disease)
is linked with Di (Diabetes), Hb (High blood pressure), Ar (Arthritis), and Hc (High blood
cholesterol) in the clique. There are several branches extending from the clique. For example,
there is a branch of As (asthma) and Ch (Chronic bronchitis), which is a branch of allergy related
diseases. There is also a branch of Cn (Cancer), Pr (Prostate diseases) and Ps (PSA test
abnormal), which can be regarded as a cancer branch. Some diseases, such as Li (Liver condition)
and Ki (Kidney diseases), are isolated in the graph. From this example, we can see that the
disease influence graph provides an overview of the prevalence of diseases and their interactions
measured by any-cosine.
The Result of Interactive Pattern Mining
Our interactive pattern mining method generates 23 natural clusters. In 22 of them, each is
dominated by a single disease. The remaining natural cluster contains 905 healthy people who do
not have histories on any diseases. There are in total 908 healthy people in the data set. 3 of them
are merged into other clusters due to some missing data. This clearly shows that the hierarchical
clustering method can naturally identify groups of people sharing similar disease patterns.
The largest natural cluster contains 1,392 people and is dominated by disease high blood
pressure. The second largest cluster is the one of 905 healthy people.
Some diseases such as asthma do not dominate a natural cluster. The people with asthma are
mainly within the cluster of high blood pressure and the cluster of allergies.
The sub-clusters as descendants of a natural cluster lead to disease dominating patterns
closely related to the pattern of the natural cluster. For example, within the natural cluster of high
blood pressure, the three biggest sub-clusters dominated by two diseases are the sub-cluster

Exploring Disease Association 21
dominated by <Overweight, High BP. >, the sub-cluster dominated by <High BP., High BC.>,
and the sub-cluster dominated by <Arthritis, High BP.>. The hierarchical clustering tree groups
related disease association patterns together, and helps a user to browse the tree according to her
interests.
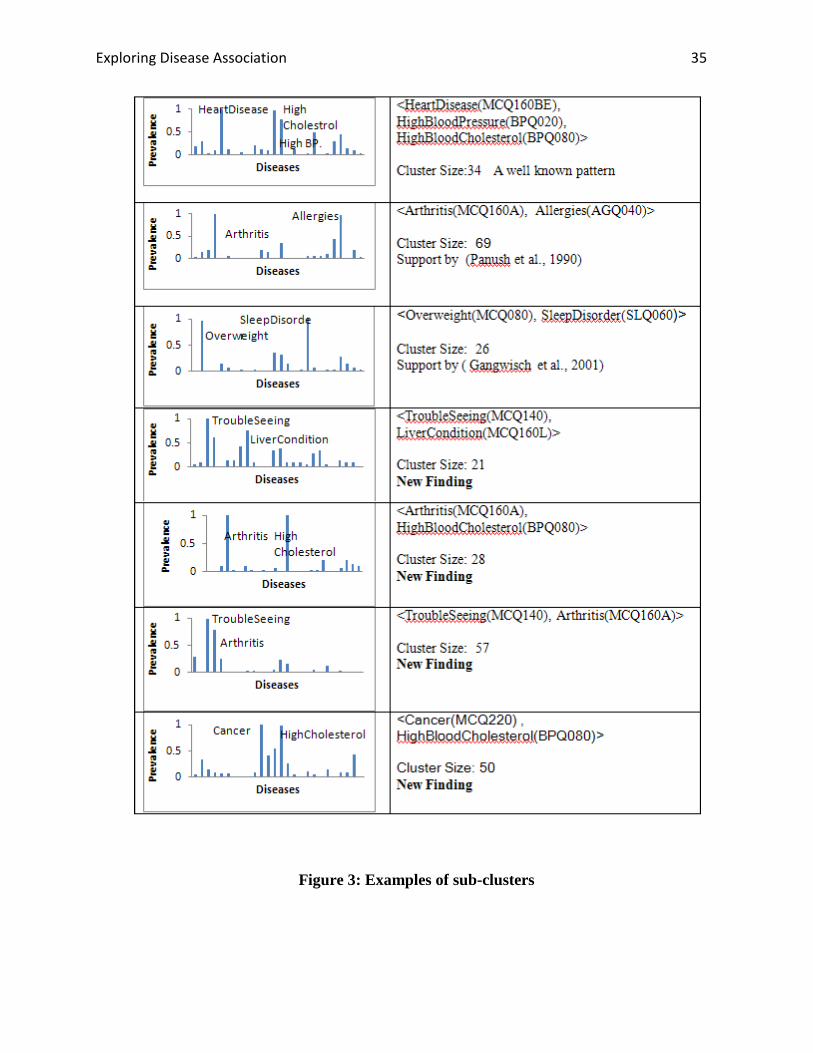
[Figure 3 goes here]
Figure 3: Examples of sub-clusters
Figure 3 shows more examples of interesting sub-clusters. Among those examples, some
disease association patterns in the clusters are consistent with the existing medical knowledge or
literatures. For example, the cluster dominated by pattern < Arthritis, Allergies > is supported by
(Panush et al., 1990) that some cases of arthritis are triggered by food allergies. Moreover, a
cluster of people dominated by overweight and sleep disorder verifies the association between
sleeping disorder and overweight reported in (Gangwisch et al., 2001).
Furthermore, some disease patterns captured by the clusters reveal new findings. In Figure 3,
we list four clusters with dominating disease patterns of <TroubleSeeing(MCQ140),
LiverCondition(MCQ160L)>, <Arthritis(MCQ160A), HighBloodCholesterol(BPQ080)>,
<TroubleSeeing(MCQ140), Arthritis(MCQ160A)> and <Cancer(MCQ220),
HighBloodCholesterol(BPQ080)> . To the best of our awareness, those patterns are not well
discussed by existing medical literatures. Interestingly, by searching those patterns on the
internet, we found the associations of diseases in those patterns have already attracted attentions
by people. For example, on an online discussion board
(http://www.healthcentral.com/rheumatoid-arthritis/c/question/54342/29748), people asked “can
RA(rheumatoid arthritis) cause high cholesterol? ” On a MSN online discussion board

Exploring Disease Association 22
(http://health.msn.com/health-topics/pain-management/arthritis/articlepage.aspx?cp-
documentid=100200060), people asked “Are there vision disorders associated with rheumatoid
arthritis?” Those new findings from NHANES data invite further investigation and verifications.
[Figure 4 goes here]
Figure 4: The hierarchical structure of diabetes clusters.
The hierarchical clustering tree conveys interesting information about disease sub-groups and
disease subtypes. For example, Figure 4 shows the sub-tree rooted at the natural cluster
dominated by diabetes. The dominating diseases of some sub-clusters are tagged for easy
understanding. The whole nature cluster, cluster 1, is composed of two sub-clusters, cluster 2 and
cluster 3. Cluster 2 is dominated by heart disease and diabetes, while cluster 3 is dominated by
diabetes.
Cluster 2 is furthered divided into clusters 4 and 5. Cluster 4 is dominated by heart disease,
diabetes and stroke. This hierarchical cluster sub-tree suggests that many people with diabetes
may also have heart disease. Among the people with diabetes and heart disease, stroke may
appear. An article at the National Diabetes Information Clearinghouse website (NDIC, n.d.)
suggests, “people with diabetes are at least twice as likely as someone who does not have
diabetes to have heart disease or a stroke".
In cluster 3, a part of people form sub-cluster 7, which is dominated by diabetes, overweight
and thyroid problem. The other people in cluster 3 form cluster 7, which is a diabetes cluster.
Further dividing cluster 6, we can get cluster 8 and cluster 9. For cluster 9, the dominating
diseases are diabetes and vision problem. It is confirmed by (Klein et al., 1995), “diabetes is the
leading cause of new cases of blindness in people age 20-74 years in the United States".
Exploring Disease Association 23
Diabetes and its treatments may cause many complications. The above hierarchical clustering
sub-tree provides an insight on the sub-groups of patients with diabetes according to different
situations of complications.
Comparisons
In addition to browsing the hierarchical clustering tree, our method can also output all disease
association patterns by setting a minimum size threshold and a minimum entropy threshold.
When setting the minimum size threshold to 5 (i.e., a cluster should contain at least 5 people) and
the minimum entropy threshold to 0.01 (i.e., we do not visit sub-clusters of a cluster of entropy
less than 0.01), our method outputs 432 disease dominating patterns.
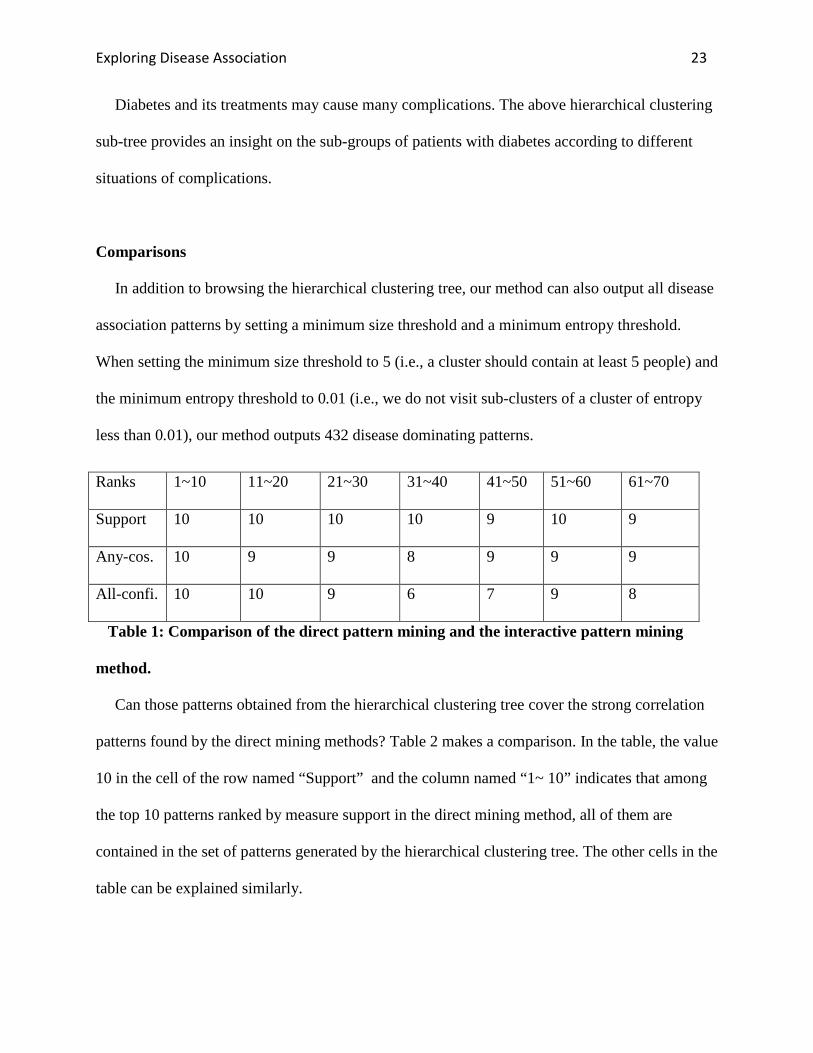
Table 1: Comparison of the direct pattern mining and the interactive pattern mining
method.
Can those patterns obtained from the hierarchical clustering tree cover the strong correlation
patterns found by the direct mining methods? Table 2 makes a comparison. In the table, the value
10 in the cell of the row named “Support” and the column named “1~ 10” indicates that among
the top 10 patterns ranked by measure support in the direct mining method, all of them are
contained in the set of patterns generated by the hierarchical clustering tree. The other cells in the
table can be explained similarly.
Ranks 1~10 11~20 21~30 31~40 41~50 51~60 61~70
Support 10 10 10 10 9 10 9
Any-cos. 10 9 9 8 9 9 9
All-confi. 10 10 9 6 7 9 8

Exploring Disease Association 24
The top 10 patterns ranked by support, any-cosine and all-confidence are all among the
patterns generated by the hierarchical clustering tree. 68 patterns of the top 70 in support can be
generated by the hierarchical clustering tree, which can be translated into a recall of 97%. 63 of
the top 70 patterns in any-cosine can be generated by the hierarchical clustering tree, that is, a
recall of 90%. Among the top 70 patterns in all-confidence, 59 can be generated by the
hierarchical clustering tree. The recall is 84.3%.
The number of patterns generated by the hierarchical clustering tree is smaller than the
number of patterns generated by the direct mining method, however, a large percentage of the
top patterns ranked in support, any-cosine and all-confidence can be generated by the
hierarchical clustering tree.
For some highly ranked patterns which are not among the patterns generated by the
hierarchical clustering tree, the descendants of those missing patterns can usually be found in the
tree. For example, pattern D =<Heart disease, Arthritis> is ranked the 17-th in any-cosine. No
cluster can be found in the hierarchical clustering tree having D as the dominating pattern.
However, we find two clusters in the hierarchical clustering tree having dominating patterns
< Heart disease, Arthritis, High BP. > and <Heart disease, Arthritis, Diabetes >,
respectively. Those descendant patterns can be used to generate hypotheses about the
associations between heart disease and arthritis.
RELATED WORK
NHANES data has been used to find associated diseases using statistical methods. For example,
by using statistical measurement population attributable risk, He et al. (2001) showed that
diabetes and overweighting are two independent risk factors for congestive heart. By using the
Exploring Disease Association 25
Chi-square test, Manjunath et al. (2003) showed that the level of kidney function is associated
with atherosclerotic cardiovascular disease. Spence et al. (2003) studied the association between
arthritis and high blood pressure.
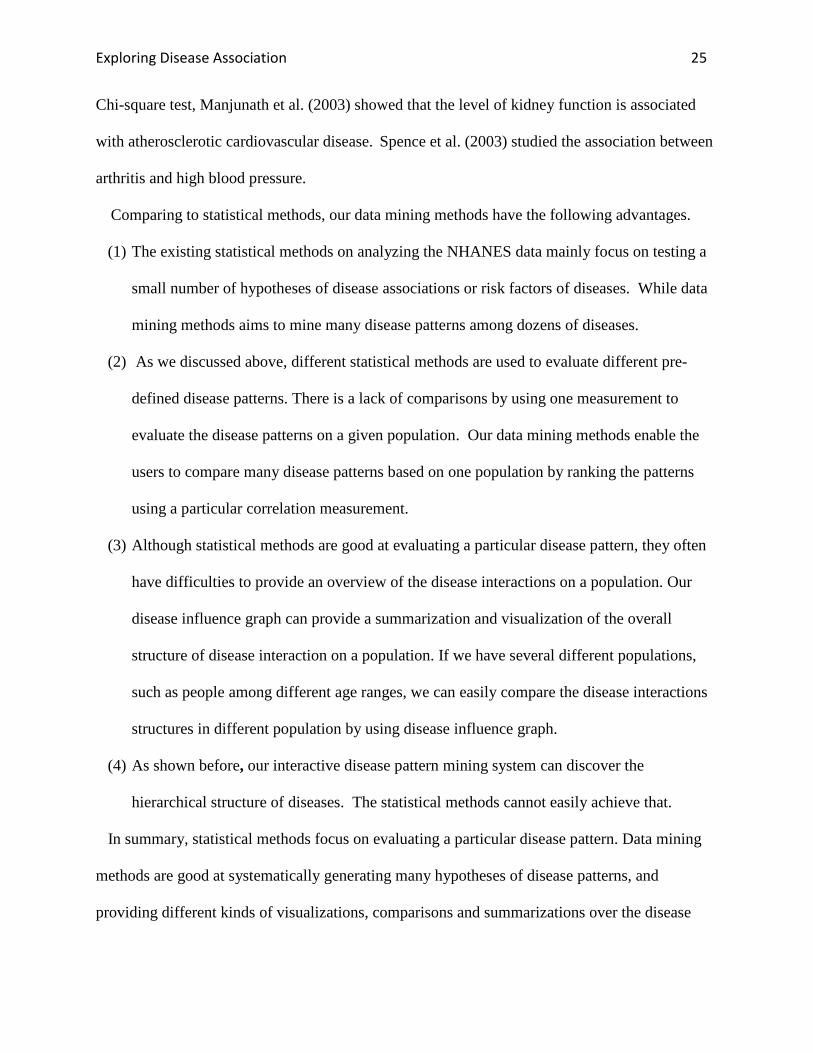
Comparing to statistical methods, our data mining methods have the following advantages.
(1) The existing statistical methods on analyzing the NHANES data mainly focus on testing a
small number of hypotheses of disease associations or risk factors of diseases. While data
mining methods aims to mine many disease patterns among dozens of diseases.
(2) As we discussed above, different statistical methods are used to evaluate different pre-
defined disease patterns. There is a lack of comparisons by using one measurement to
evaluate the disease patterns on a given population. Our data mining methods enable the
users to compare many disease patterns based on one population by ranking the patterns
using a particular correlation measurement.
(3) Although statistical methods are good at evaluating a particular disease pattern, they often
have difficulties to provide an overview of the disease interactions on a population. Our
disease influence graph can provide a summarization and visualization of the overall
structure of disease interaction on a population. If we have several different populations,
such as people among different age ranges, we can easily compare the disease interactions
structures in different population by using disease influence graph.
(4) As shown before, our interactive disease pattern mining system can discover the
hierarchical structure of diseases. The statistical methods cannot easily achieve that.
In summary, statistical methods focus on evaluating a particular disease pattern. Data mining
methods are good at systematically generating many hypotheses of disease patterns, and
providing different kinds of visualizations, comparisons and summarizations over the disease

Exploring Disease Association 26
patterns. In our data mining system, we used several correlation measurements to evaluate
disease patterns, such as all-confidence, all-cosine. Our system can also incorporate other
statistical measurements to enhance our analysis.
Recently, some data mining methods have been applied to analyze the NHANES data. Walton
et al. (2008) applied decision trees and linear regression to classify people into different
categories of health conditions (e.g., excellent, fair or bad). Lee et al. (2008) used decision trees
and association rules to find dependence among the laboratory and health condition variables in
the latest NHANS data. Different from this study, the major findings in (Lee et al., 2008) are on
the dependence between the diet behaviors or medical conditions and disease absence. In this
paper, we focus on the association among diseases.
Our direct pattern mining method uses null-invariant measures to rank disease patterns and
summarize the top ranked patterns by a disease influence graph. The principles on choosing
suitable measures to mine interesting patterns for different application domains are discussed in
(Tan et al., 2002). A method of mining risk patterns in medical data measured by relative risk is
proposed in (Li et al., 2005). Some methods of summarizing frequent patterns are proposed in
(Jin et al., 2008; Yan et al., 2005).
In the interactively pattern mining method, hierarchical clustering is used. In bioinformatics,
hierarchical clustering has been used in interactively exploring gene expression patterns, such as
in (Saldanha et al., 2004; Jiang et al., 2003 ).
DISCUSSIONS
In this paper, we tackled the problem of mining disease associations. We proposed the direct
pattern mining method and the interactively pattern mining method. We applied the proposed

Exploring Disease Association 27
methods on NHANES data. Our findings are consistent with the existing medical knowledge and
literatures. In addition, interesting summarizations through a hierarchical disease tree and a
disease influence graph provide insights into the relationships among diseases. Carrying the
success on analyzing the NHANES data, our methods can be applied to analyze other data about
disease association as well. We already made our software available for public use. In the future,
we plan to enhance our mining tool through more statistical analysis and better visualization.
ACKNOWLEDGEMENT
This work is based on a substantial extension of the author’s winning entry in the 2008
American Medical Informatics Association (AMIA) Data Mining Competition: Discover
Knowledge in NHANES data, sponsored by AMIA Knowledge Discovery and Data Mining
Working Group. We would like to thank the organizers of the competition and the judge
panelists for their suggestions. Although this winning entry was orally presented in an invited
panel in the 2008 AMIA Annual Symposium, it is not published in any formats.
REFERENCE
Agrawal, R., Imielinsk, T. & Swami, A. (1993). Mining association rules between sets of items
in large databases. In Proceedings of the 1993 ACM SIGMOD international conference on
management of data (pp. 207-216). Washington, DC: ACM Press.

Exploring Disease Association 28
Beuther, D. A. & Sutherland, E. R. (2007) Overweight, obesity, and incident asthma, a meta-
analysis of prospective epidemiologic studies. American Journal of Respiratory and Critical
Care Medicine, 1: 175(7): 661-6.
Biomedical.Org. Common pain relievers associated with high blood pressure (n.d.) Retrieved
April 29, 2009 from: http://news.bio-medicine.org/medicine-news-3/Use-of-common-pain-
relievers-associated-with-increased-risk-of-blood-pressure-in-men-1642-1/.
Chen, C.S., Roberton, D. & Hammerton, M. E. (2004) Juvenile arthritis-associated uveitis: visual
outcomes and prognosis. Canadian journal of ophthalmology. 39(6):614-20.
Forman J. P., Rimm E.B. & Curhan G. C. (2007) Frequency of analgesic use and risk of
hypertension among men. Archives of Internal Medicine, 167(4):394-9.
Gangwisch, J. E., Malaspina, D., Boden-Albala, B. & Heymsfield, S. B. (2005) Inadequate sleep
as risk factor for obesity: Analysis of the NHANES I. Sleep. 28(10):1289-96.
Gill, T., Taylor, A., Chittleborough, C., Grant, J. & Leach, G. (2002) Overweight and obesity as
risk factors for arthritis. Population Research and Outcome Studies Unit, The South Australian
Monitoring and Surveillance System (SAMSS).
Han, J. & Kamber, M. (2006) From association analysis to correlation analysis. In Data Mining:
Concepts and Techniques (pp.261-4). San Francisco, California, Morgan Kaufmann.

Exploring Disease Association 29
He, J., Ogden, L. G., Bazzano, L. A., Vupputuri, S., Loria, C., & Whelton, P. K. (2001) Risk
factors for congestive heart failure in US men and women. Archive Internal Medicine
161(7):996-1002.
Jiang, D., Pei, J. & Zhang, A . (2003) Interactive exploration of coherent patterns in time-series
gene expression data. In Proceedings of the ninth ACM SIGKDD international conference on
knowledge discovery and data mining (KDD’03) (pp. 565-570). Washington, DC, USA.
Jin, R., Abu-Ata M., Xiang , Y., & Ruan , N. (2008) Effective and efficient itemset pattern
summarization: regression-based approaches. In Proceedings of the 14th ACM
SIGKDD international conference on knowledge discovery in data mining (KDD '08:) (pages
399-407). Las Vegas, Nevada, USA.
Klein., R. & Klein E. K. (1995) Chapter 14, Diabetes in America, second edition. Retrieved
April 29, 2009, from http://diabetes.hiddk.nih.gov/dm/pubs/America/index.htm
Lee, J., Lin , Y., & Smith, M. (2008) Dependency mining on the 2005-06 national health and
nutrition examination survey data. Paper presented in American Medical Informatics Association
2008 annual symposium, knowledge discovery and data mining working group data mining
competition, Washington, DC, USA.

Exploring Disease Association 30
Li, J., Fu, A., He, H., Chen, J., Jin, H., McAullay, D., Williams , G., Sparks , R., & Kelman, C.
(2005) Mining risk patterns in medical data. In Proceedings of the eleventh ACM SIGKDD
international conference on Knowledge discovery in data mining (pp. 770-775), Chicago, IL,
USA.
Manjunath, G., Tighiouart, H., Ibrahim, H., MacLeod, B., Salem, D. N,. Griffith, J. L., Coresh, J,
Levey, A. S. & Sarnak, M. J. (2003) Level of kidney function as a risk factor for atherosclerotic
cardiovascular outcomes in the community. Journal of the American College of Cardiology.
41(1):47-55.
Murtagh, F. (1983) A survey of recent advances in hierarchical clustering algorithms. The
Computer Journal, 26(4):354-359.
Must, A., Spadano, J., Coakley, E. H., Field A. E., Colditz, G. & Dietz W. H. (1999) The disease
burden associated with overweight and obesity. Journal of the American Medical Informatics
Association, 282:1523-1529.
CDC. (n.d.) National health and nutrition examination survey. Retrieved April 29, 2009 from:
http://www. cdc.gov/nchs/nhanes.htm.
Omiecinski, E. R. (2003) Alternative interest measures for mining associations in databases.
IEEE Transactions on Knowledge and Data Engineering. 15(1):57-69.

Exploring Disease Association 31
Panush, R. S. (1990) Food induced ("allergic") arthritis: clinical and serologic studies. The
Journal of Rheumatology, 17(3):291-4.
Pirkle, J. L., Kaufmann , R. B., Brody , Hickman , D. J., Gunter , T., E. W., and Paschal , D. C.
(1998) Exposure of the U.S. population to lead, 1991-1994. Environmental Health Perspective,
106: 745-750.
Saldanha, A. J. (2004) Java treeview-extensible visualization of microarray data. Bioinformatics,
20(17): 3246-8.
Saydah, S., Eberhardt, M., Rios-Burrows, N., Williams, D., & Geiss, L. (2007) Prevalence of
chronic kidney disease and associated risk factors -United States, 1999-2004. Journal of the
American Medical Informatics Association. 297:1767-1768.
Spence, J. D. (2003) Systolic blood pressure in patients with osteoarthritis and rheumatoid
arthritis. Journal of Rheumatology. 30(4):714-9.
Tan P.N., Kumar V. & Srivastava J. Selecting the right interestingness measure for association
patterns. (2002) In Proceedings of the eighth ACM SIGKDD international conference on
Knowledge discovery and data mining.( pp. 32-41), Edmond, AB, Canada.
The National Diabetes Information Clearinghouse (NDIC) (n.d.) Retrieved April 29, 2009 from:
http://diabetes.niddk.nih.gov/dm/pubs/stroke/.
Exploring Disease Association 32
Walton, N., Knight, S., Newman, M. & Poynton, M. R. (2008) Predictions of self-reported
health status using data mining techniques. Paper presented in American Medical Informatics
Association 2008 annual symposium, knowledge discovery and data mining working group data
mining competition, Washington, DC, USA.
Yan, X., Cheng, H., Han, J., & Xin, D. (2005) Summarizing itemset patterns: a profile-based
approach. In Proceedings of the eleventh ACM SIGKDD international conference on knowledge
discovery in data mining, (pp. 314-323), Chicago, IL, USA.

Exploring Disease Association 33
Figure 3: The disease influence graph of people of age at least 20.
Exploring Disease Association 34
Figure 4: The interactive Disease Pattern Mining System
Exploring Disease Association 35
Figure 3: Examples of sub-clusters

Exploring Disease Association 36
Figure 4: The hierarchical structure of diabetes clusters.