runoff and soil loss relationships for the texas blackland
TRANSCRIPT

Journal of Hydrology (2006) 331, 471–483
ava i lab le a t www.sc iencedi rec t . com
journal homepage: www.elsevier .com/ locate / jhydrol
Runoff and soil loss relationships for theTexas Blackland Prairies ecoregion q
R.D. Harmel a,*, C.W. Richardson a, K.W. King b, P.M. Allen c
a USDA-ARS, 808 E. Blackland Road, Temple, TX 76502, United Statesb USDA-ARS, Columbus, OH, United Statesc Department of Geology Baylor University, Waco, TX, United States
Received 30 September 2005; received in revised form 18 May 2006; accepted 19 May 2006
Summary Hydrological and soil loss data have been collected since 1937 at the USDA-ARSGrassland Soil and Water Research Laboratory near Riesel, TX. Data from the site, originallynamed the Blacklands Experimental Watershed, have played a vital role in the evaluation ofconservation management practices to limit soil erosion and offsite herbicide transport andin the development of several watershed models used worldwide. The entire record of precip-itation, runoff, sediment loss, management practices, and limited meteorological informationis publicly available (http://www.ars.usda.gov/spa/hydro-data). The data represent a valuableregional resource for use in water supply modeling, rural land development, and agriculturalland management. Results of the present analyses confirmed the importance of soil–waterphases to temporal runoff patterns in the Texas Blackland Prairies ecoregion. Little runoffoccurs in the ‘‘dry’’ soil–water phase (avg. = 2–9 mm/month), but substantial surface runoffand lateral subsurface return flow occurs in the ‘‘saturated’’ phase (avg. = 19–28 mm/month).Strong linear relationships (P < 0.0001) were determined between watershed size and annualpeak flow rates for return intervals from 2 to 100 yr. Long-term data indicate a drastic reduc-tion in soil loss from small grain production compared to row crop production due to the pres-ence of soil cover in both the spring and fall high precipitation periods. Thus, utilization of awinter cover crop in row crop production or conversion from row crop to small grain productioncan be effective in reducing offsite transport of sediment and associated contaminants, whichmay be important in watersheds with substantial agricultural contribution to water qualityimpairment.Published by Elsevier B.V.
KEYWORDSAgricultural runoff;Erosion;Peak flow frequency;Trend analysis
0d
r
022-1694/$ - see front matter Published by Elsevier B.V.oi:10.1016/j.jhydrol.2006.05.033
q Mention of trade names or commercial products is solely for the purpose of providing specific information and does not implyecommendation or endorsement by the United States Department of Agriculture.* Corresponding author. Tel.: +1 254 770 6521; fax: +1 254 770 6561.E-mail address: [email protected] (R.D. Harmel).
472 R.D. Harmel et al.
Introduction
Historical hydrologic and sediment transport data are valu-able in many applications including agricultural conserva-tion practice design, urban development guidance, waterresource planning, flood control, and ecological manage-ment. In the absence of regional data, relationships oftenare used that were established for areas with differenthydrologic and climatic regimes. When extrapolated dataare used in such applications, substantial uncertainty isadded to already uncertain situations. Therefore, whenlong-term records are available they should be relied uponto guide water resource management and planning.
Baseline studies on local runoff processes are needed toguide development design and to adequately address landconversion issues and urban sprawl (Marsh and Marsh,1995). Flow data are necessary for calibration and valida-tion of water supply and water quality models, which areused to explore water resource scenarios. These data arealso needed for the optimal design of hydraulic structures(e.g. dams, culverts, and detention basins). The lack of ade-quate data has been recognized for some time as a cause forfailure of hydrologic structures but more commonly as con-tributing to unnecessarily conservative safety factors instructure design (USDA-SCS, 1942). Additionally, soil erosionand sediment transport data are valuable in estimatingdetention basin and water supply reservoir design factors.
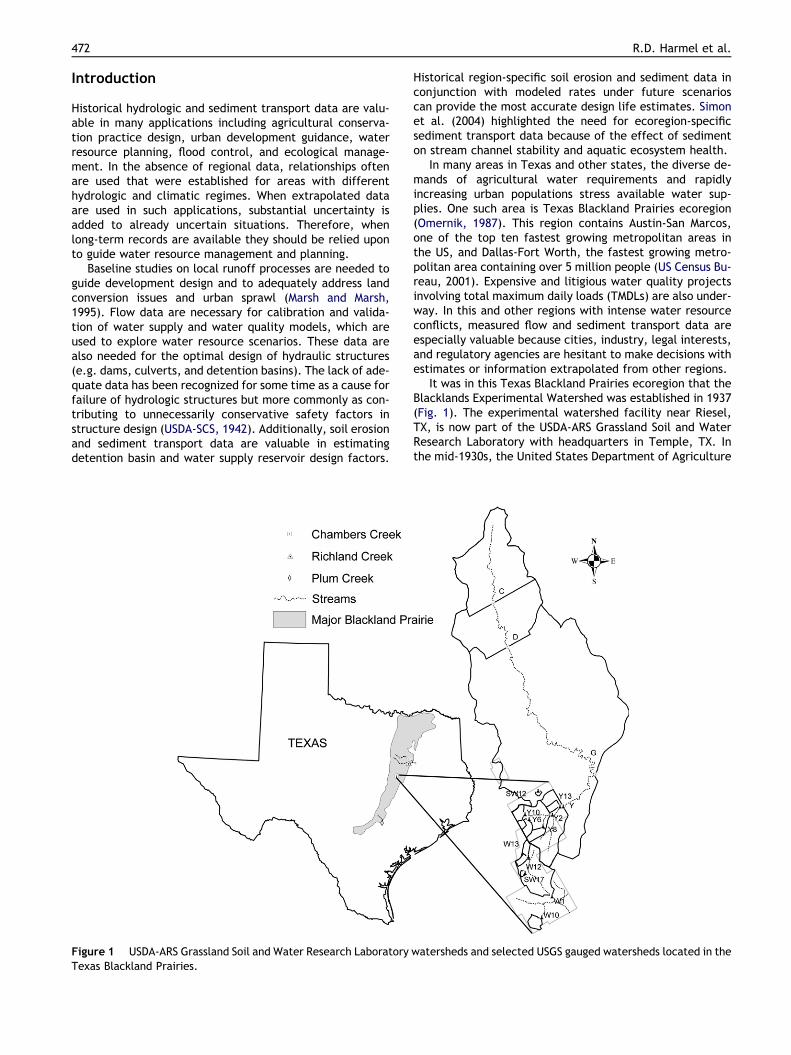
Figure 1 USDA-ARS Grassland Soil and Water Research LaboratoryTexas Blackland Prairies.
Historical region-specific soil erosion and sediment data inconjunction with modeled rates under future scenarioscan provide the most accurate design life estimates. Simonet al. (2004) highlighted the need for ecoregion-specificsediment transport data because of the effect of sedimenton stream channel stability and aquatic ecosystem health.
In many areas in Texas and other states, the diverse de-mands of agricultural water requirements and rapidlyincreasing urban populations stress available water sup-plies. One such area is Texas Blackland Prairies ecoregion(Omernik, 1987). This region contains Austin-San Marcos,one of the top ten fastest growing metropolitan areas inthe US, and Dallas-Fort Worth, the fastest growing metro-politan area containing over 5 million people (US Census Bu-reau, 2001). Expensive and litigious water quality projectsinvolving total maximum daily loads (TMDLs) are also under-way. In this and other regions with intense water resourceconflicts, measured flow and sediment transport data areespecially valuable because cities, industry, legal interests,and regulatory agencies are hesitant to make decisions withestimates or information extrapolated from other regions.
It was in this Texas Blackland Prairies ecoregion that theBlacklands Experimental Watershed was established in 1937(Fig. 1). The experimental watershed facility near Riesel,TX, is now part of the USDA-ARS Grassland Soil and WaterResearch Laboratory with headquarters in Temple, TX. Inthe mid-1930s, the United States Department of Agriculture
watersheds and selected USGS gauged watersheds located in the

Runoff and soil loss relationships for the Texas Blackland Prairies ecoregion 473
Soil Conservation Service (USDA-SCS), now the Natural Re-sources Conservation Service (NRCS), realized a need toanalyze and understand hydrologic processes on agriculturalfields and watersheds because of their impact on soil ero-sion, flood events, water resources, and the agriculturaleconomy. The research program of the Hydrologic Divisionof the SCS established a number of experimental watershedsacross the US. Riesel was one of the three original water-sheds, which were designed to collect hydrologic data (pre-cipitation, percolation, evaporation, runoff) and toevaluate the hydrologic and soil loss response as influencedby various agricultural land management practices (USDA-SCS, 1942).
Hydrologic data collection at the Riesel experimentalwatersheds began in 1937 and continues to the present. Itis one of the most intensively monitored small watershed re-search sites in the US. The continuous hydrologic recordsare particularly valuable for studies designed to identifytrends or changes caused by climate shift or other factorsand are necessary to determine the influence of extreme,rare events (Edwards and Owens, 1991). These data havebeen used for numerous purposes such as water qualitystudies (Kissel et al., 1976; Sharpley, 1995; Harmel et al.,2004), farming practice evaluations (Baird et al., 1970;Baird and Knisel, 1971; Chichester and Richardson, 1992),and natural resource model application and development(Williams et al., 1971; Arnold and Williams, 1987; Richard-son and King, 1995; King et al., 1996; Ramanarayananet al., 1998; Harmel et al., 2000).
The USDA-ARS experimental watershed databases areparticularly valuable for field- to farm-scale research anddesign because of their long-term, detailed, continuous re-cord on multiple watersheds. These small watershed dataare vital to properly evaluate runoff and sediment transportprocesses from single land use, relatively homogeneouswatersheds and to differentiate mechanisms for variousland use conditions. Sediment transport and flow data col-lected at larger scales are often influenced by dams, chan-nel processes, and variable land management, which altersediment and discharge routing and generally confoundsinterpretation of smaller-scale land management. However,small watershed data are available only for limited regionsof the US because of the resource commitment necessaryto implement and maintain such data collection networks.In contrast, the United States Geologic Survey (USGS) oper-ates a nationwide hydrologic monitoring network that hashistorically provided larger-scale data, which are neededto evaluate integrated effects and downstream routing pro-cesses. For years, the USGS hydrology database has providedvaluable information such as peak flows, return intervals,and low flow durations, which have led to knowledgeabledecisions that made without hydrologic data would have re-sulted in high costs to the US.
In a review of the importance of hydrometeorologicaldata, Slaughter (2000) points to the need for the collectionand preservation of long-term, spatially diverse data. Thesedata are vital for research and planning related to water re-sources, climate change, ecological preservation, and theglobal food supply. The value of these data should not bedisregarded in decisions made concerning budgets for mon-itoring programs. The USDA-ARS in cooperation with otherfederal agencies and programs (such as: USGS, USDA Forest
Service, and National Science Foundation) has a uniqueopportunity and responsibility to provide continuous, wa-tershed-based information to state and local governments,universities, and private organizations that will continueto need these data (Slaughter and Richardson, 2000). Withthese needs in mind, personnel at several USDA-ARS wa-tershed networks have recently published long-term dataand analyses on precipitation (Hanson, 2001; Nicholset al., 2002; Harmel et al., 2003) and discharge and sedi-ment transport (Pierson et al., 2001; Van Liew and Garbr-echt, 2003).
The specific objective of this study is to provide a sum-mary and analysis of hydrologic and sediment loss data forthe Texas Blackland Prairies ecoregion. The selected analy-ses, along with the publicly available data, should providevaluable information on water resource and erosion controlmanagement in the Texas Blackland Prairies ecoregion andin other Vertisol-dominated areas. When used in conjunc-tion with regional USGS relationships for larger watersheds(e.g. Lanning-Rush, 2000; Raines, 1998), the analyses shouldsupport policy decisions in this region with rapidly growingpopulation, increasing urban development, and intense de-bates over urban and agricultural contribution to waterquality concerns.
Methods and materials
Site description
The USDA-ARS Grassland Soil and Water Research Labora-tory experimental watershed was established near Riesel,TX, because of its central location in the Texas BlacklandPrairies. This ecoregion, which encompasses 4.45 millionha, is a productive agricultural region extending from SanAntonio 480 km north to the Red River. The area also con-tains the major metropolitan areas of Dallas-Fort Worth,Austin, and San Antonio. Houston Black clay soils (fine,smectitic, thermic, udic Haplustert), recognized throughoutthe world as the classic Vertisol, dominate the watershedsite. These highly expansive clays, which shrink and swellwith changes in moisture content, have a typical particlesize distribution of 17% sand, 28% silt, and 55% clay. This soilseries consists of very deep, moderately well-drained soilsformed from weakly consolidated calcareous clays andmarls and generally occurs on 1–3% slopes in upland areas.This soil is very slowly permeable when wet (approximatesaturated hydraulic conductivity of 1.5 mm/h); however,preferential flow associated with soil cracks contributes tohigh infiltration rates when the soil is dry (Arnold et al.,2005; Allen et al., 2005).
Long, hot summers and short, mild winters characterizethe climate in the region. The average growing season lastsfrom mid-March to mid-November. A majority of the an-nual precipitation occurs with the passage of Canadiancontinental and Pacific maritime fronts (Knisel and Baird,1971). Convective thunderstorms during the warmermonths also contribute intense, short duration rainfall.Tropical hurricanes can contribute substantial precipita-tion, but their occurrence is rare. Freezing rain, sleet,and snow occur occasionally but do not contribute signifi-cant moisture.
474 R.D. Harmel et al.
Data collection
The historical record of hydrology and soil loss from Riesel isextensive with approximately 1400, 1300, and 700 gaugeyears respectively of daily and sub-daily precipitation, run-off, and soil loss data. All data are available on the internetat: http://www.ars.usda.gov/spa/hydro-data. A descrip-tion of the rain gauge network and long-term analyses ofprecipitation appears in Harmel et al. (2003). Forty water-sheds have been used to provide runoff and soil loss dataat some time within the historical record. For the presentstudy, data were used from 12 of the 18 currently activewatersheds and three inactive watersheds (Table 1, Fig. 1).
At the outlet of each of the 18 currently active water-sheds at Riesel, a runoff structure is instrumented withthree stage recording devices: (1) pressure transducer anddatalogger; (2) float gauge with chart recorder; and (3) bub-bler associated with ISCO 6700 automated sampler. Cur-rently, bubblers are used as the primary stagemeasurement devices, and the transducers and float gaugesserve as back up devices. Historically, float gauges served asthe primary stage measurement devices. Discharge mea-surements are made by continuously recording flow levelsin a stilling well located in each calibrated flume or weirstructure. Flow depth data are converted to flow rate withestablished stage discharge relationships.
In 2001, ISCO 6700 samplers were installed at each site toautomatically collect water quality samples in each runoffevent. From the 1970s to 2001, runoff water samples weretaken with Chickasha samplers (Chichester and Richardson,1992). These automated, mechanical samplers were turnedon with a float-activated water level switch. Discrete sam-ples were taken on variable time intervals with more fre-quent samples taken on the rising limb of the hydrograph.Prior to the 1970s, runoff water samples were collectedby hand during runoff events (Knisel and Baird, 1970). On-
Table 1 Selected characteristics of study watersheds; watershe
Agency ARS ARS ARS
Watershed SW12 SW17 W12
Area (ha) 1.2 1.2 4.0Slope (%) 3.8 1.8 2.0Latitude 31�28 04800 31�27 04500 31�27 05600
Longitude 96�52 05900 96�53 01400 96�53 00700
Agency ARS ARS ARS
Watershed Y10 W10 Y8
Area (ha) 7.5 8.0 8.4Slope (%) 1.9 2.6 2.2Latitude 31�28 03100 31�27 01200 31�28 02200
Longitude 96�53 01000 96�52 04800 96�52 05400
Agency ARS ARS ARS
Watershed C D G
Area (ha) 234 449 1773Slope (%) 2.1 2.1 2.1Latitude 31�31 01200 31�31 03800 31�29 03300
Longitude 96�53 03500 96�53 02300 96�52 03700
call personnel collected discrete samples on variable timeintervals similar to the collection frequency of the auto-mated samplers. To quantify soil loss and sediment concen-trations in runoff, collected sediment was dried, weighed,and recorded with the corresponding flow rate.
Data analysis
Selected hydrologic and sediment loss analyses are pre-sented because of their broad applicability. All statisticalanalyses were conducted with Minitab statistical software(Minitab, 2000) with an a priori a = 0.05 probability leveland methods described by Helsel and Hirsch (1993) and Haan(2002). The non-parametric Mann–Whitney test was usedinstead of parametric alternatives to evaluate possible dif-ferences in median values because differences were typi-cally not normally distributed as determined by theKolmogorov–Smirnof test (Haan, 2002).
Temporal relationship between precipitation and runoffThe relationship between precipitation amount and runoffdepth was analyzed with measured data from watershedY2 for the period 1939–2002. Measured runoff for the USGSbase period, 1961–1990, was compared to annual runoffestimated by the procedure of Lanning-Rush (2000). Thetemporal (intra-annual) distributions of measured monthlyand annual precipitation, runoff, and runoff to precipitationratio (Q/P) values were also evaluated as were the differ-ences in monthly medians.
Relationship between peak discharge and watershed areaAnnual peak flows were determined for 14 Riesel water-sheds (1.2–1773 ha) and for three larger USGS gaugedwatersheds (80,000–250,000 ha) to encompass the sizerange of watersheds located entirely within the Texas Black-
d names and responsible agency are indicated
ARS ARS ARS
Y13 W13 Y6
4.6 4.6 6.62.3 1.1 3.231�28 03600 31�27 05700 31�28 02600
96�52 03900 96�53 00800 96�53 00900
ARS ARS ARS
Y2 W1 Y
53 71 1252.6 2.2 2.431�28 03000 31�27 02700 31�28 03600
96�52 04600 96�52 04800 96�52 03600
USGS USGS USGS
Plum Creek Richland Creek Chambers Creek
80032 190109 2494212.7 2.2 2.629�41 05800 31�57 00200 32�06 02900
97�36 01200 96�25 01600 96�22 01400

Runoff and soil loss relationships for the Texas Blackland Prairies ecoregion 475
land Prairies (Table 1, Fig. 1). The Riesel watersheds havecontinuous annual peak flow records in excess of 35 yr,and the USGS watersheds have records of more than 20 yr.Baird (1950) used 13 of the same watersheds to conduct asimilar analysis but with a shorter data set.
For each watershed, peak flows for 2, 5, 10, 25, 50, and100 yr return frequencies were calculated with the Weibullmethod presented in Haan (2002). For watersheds with lessthan a 50 or 100 yr record, peak flows for 50 and 100 yr re-turn intervals were determined by extrapolation with a nat-ural logarithmic trend line unless the estimated flow wasless than the highest recorded flow. As recommended byBaird (1950), the watersheds were divided into two size cat-egories (<54 ha, >54 ha). Linear regression analyses wereperformed on the log-transformed watershed area and peakflow data for each return period in the two watershed sizecategories. A SAS constrained curve fitting procedure wasutilized to insure the lines intersected at the 54 ha delinea-tion (SAS, 1999). Then, 2–100 yr peak flow estimates forRichland Creek and Chambers creek were compared for thisannual peak flow relationship based only on watershed sizeand a regional USGS peak flow relationship based on wa-tershed size and stream slope (Raines, 1998).
Relationship between land use and runoffThree small watersheds (Y8, W10, SW12) were chosen toevaluate the impact of land use on hydrologic parametersincluding annual runoff volume, peak flow rate (normalizedby area), and the runoff to precipitation ratio (Q/P). Thesethree watersheds are similar in terms of size and slope (Ta-ble 1). From 1949 to 2002, Y8 was cultivated with conserva-tion management practices such as contour terraces andgrassed waterways. From 1949 to 1963, W10 was cultivatedwith no conservation practices. In March 1963, W10 wasconverted to coastal bermuda grass pasture and has beenused for grazing and hay production since 1964. The thirdwatershed, SW12, is a native prairie reference site. Poten-tial differences in median runoff volume, Q/P, normalizedpeak flow, and precipitation for differing land uses wereevaluated. Conventional and conservation agronomic prac-tices were compared to native conditions for 1949–1963,and conservation agronomic practices were compared to na-tive and improved pasture management for 1982–2002.
Relationship between land use and soil lossMeasured monthly and annual soil loss was calculated for sixcultivated watersheds (Y6, Y8, Y10, Y13, W12, W13) withconservation practices (Table 1). Soil loss for 1982–2002was compared to historical soil loss estimates prior to conser-vation management. Also, data for two watersheds (Y6, Y13)were combined and used to analyze the intra-annual tempo-ral distribution ofmonthly soil loss in comparison to temporalpatterns in precipitation and runoff. Potential differences inmonthly median soil loss with data grouped for the six culti-vated watersheds for 1982–2002 were evaluated.
To evaluate the influence of cropping pattern on sedi-ment loss from cultivated watersheds, soil loss differenceswere analyzed for the two dominant cropping patterns. Spe-cifically, erosion rates were compared for small grain(wheat, oats) production, which typically occurs betweenOctober and June, and row crop (corn and sorghum) produc-tion, which typically occurs between February and August.
Trends in runoffPotential trends in annual and seasonal runoff volumes andannual peak flow rates were analyzed because of theirimportance to water resource planning. For the seasonalanalysis, winter was defined as January, February, andMarch; spring as April, May, and June; summer as July, Au-gust, and September; and fall as October, November, andDecember. The native prairie watershed (SW12) had consis-tent management from the beginning of its hydrologic re-cord in 1948. The mixed land use watershed (Y2), whichhas a hydrologic record dating from 1939, had minimal landuse change between 1948 and 2002. However, several sub-stantial land use changes occurred prior to 1948 (Baird,1964). Conventional management was used from 1939 to1942, and conservation management with additional areasconverted to grass occurred from 1943 to 1947. It wasimportant to selected watersheds with long periods of con-sistent land use to minimize the influence of land usechange on runoff characteristics, so only data from 1948to 2002 were analyzed. Runoff trends were also analyzedfor Y2 for 1939–1999, which is the same period that precip-itation trends were examined in Harmel et al. (2003), todetermine whether precipitation trends translated into sim-ilar runoff trends. Linear regression analysis was used to de-tect the presence of linear trends in annual and seasonalrunoff volume and annual peak flows (Haan, 2002). Analysisof residuals for runoff volume and peak flow showed thatthey are not all normally distributed; however, with theserelatively large data sets, the central limit theorem justifiesan assumption of normality, which even if violated results indecreased power of hypothesis tests (Haan, 2002; Helseland Hirsch, 1993). The non-parametric rank correlation testwas also used to evaluate potential trends in runoff (Helseland Hirsch, 1993).
Results and discussion
Temporal relationship between precipitation andrunoff
For the period 1939–2002, annual rainfall measured for wa-tershed Y2 averaged 907 mm with a median of 928 mm butwas quite variable from year to year with a standard devia-tion of 234 mm. Annual runoff was even more variable witha mean of 159 mm, median of 136 mm, and standard devia-tion of 132 mm. When applied to runoff measured at Rieselfor the USGS base period (1961–1990), the USGS regionalrelationship developed by Lanning-Rush (2000) under-pre-dicted mean annual runoff by 11%. This performance at 11Riesel watersheds (1.3–449 ha) is actually quite good con-sidering that the regional USGS relationships were devel-oped for large watersheds (6700–148,000 ha).
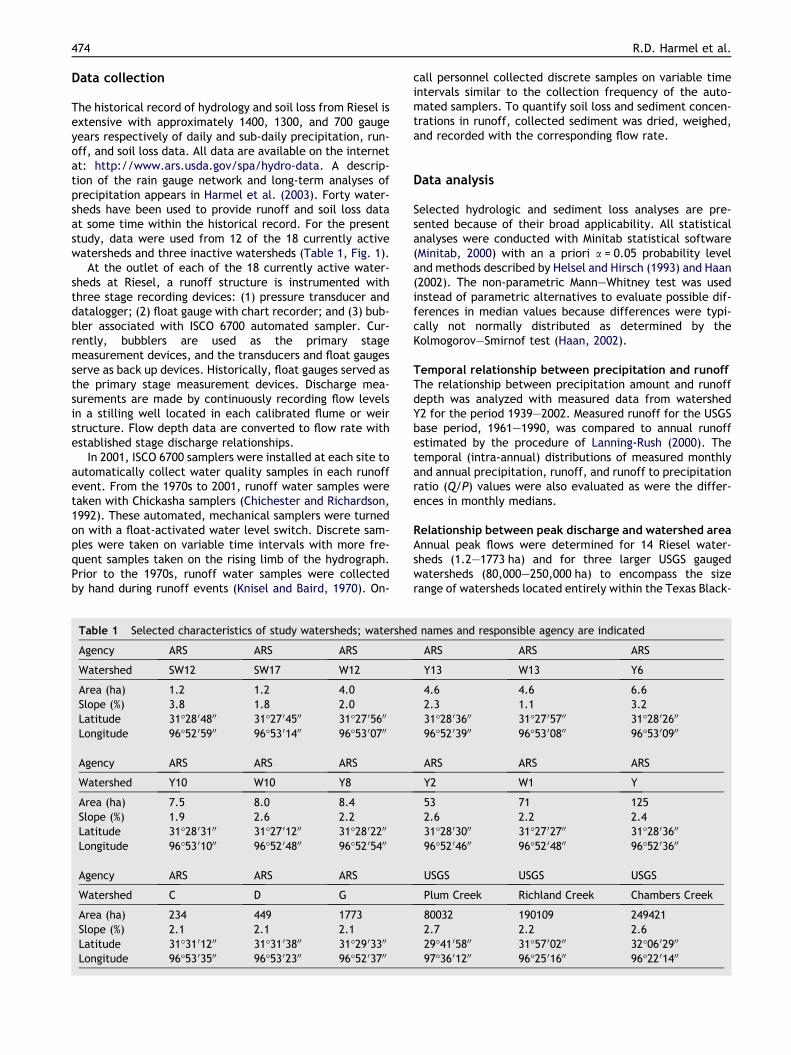
In terms of intra-annual variability, May is the wettestmonth with mean monthly precipitation of more than117 mm (median = 102 mm); April, June, and October arealso quite wet with mean monthly precipitation of 89–91 mm (medians = 76 mm). These months, however, arenot necessarily the months with the greatest amount of run-off (Figs. 2–4). April and May contribute 10% and 13% of an-nual precipitation and contribute similar amounts of annualrunoff (12% and 17%). In contrast, October contributes 10%
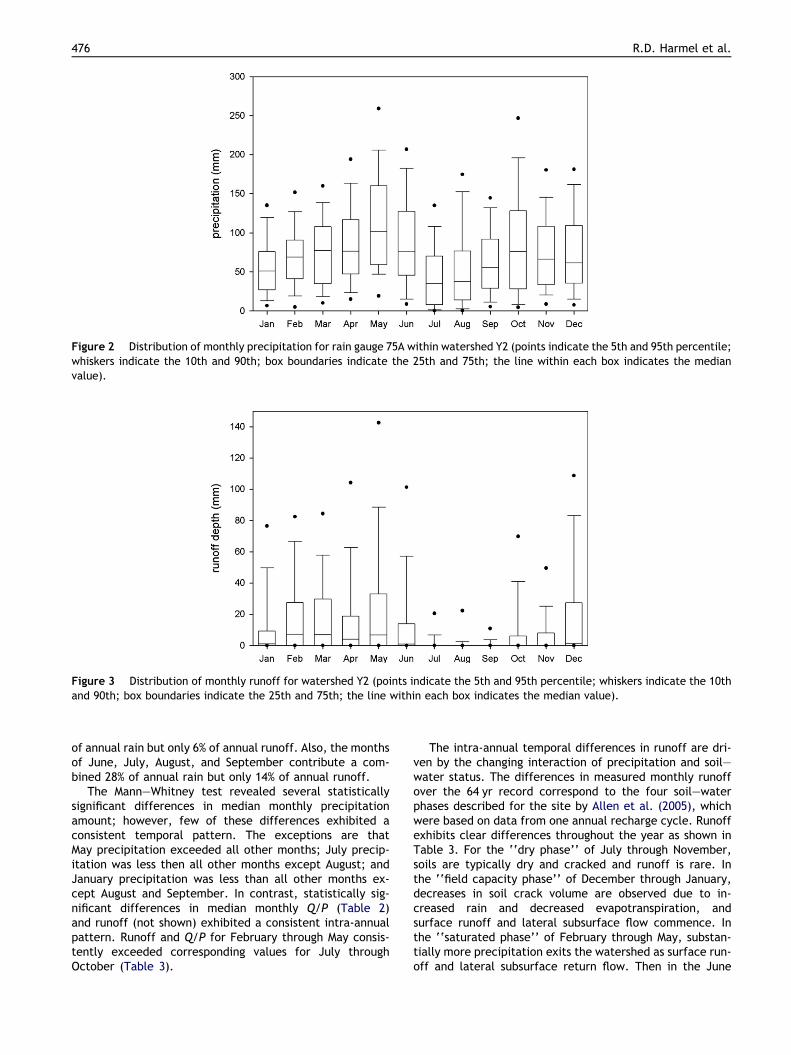
Figure 2 Distribution of monthly precipitation for rain gauge 75A within watershed Y2 (points indicate the 5th and 95th percentile;whiskers indicate the 10th and 90th; box boundaries indicate the 25th and 75th; the line within each box indicates the medianvalue).
Figure 3 Distribution of monthly runoff for watershed Y2 (points indicate the 5th and 95th percentile; whiskers indicate the 10thand 90th; box boundaries indicate the 25th and 75th; the line within each box indicates the median value).
476 R.D. Harmel et al.
of annual rain but only 6% of annual runoff. Also, the monthsof June, July, August, and September contribute a com-bined 28% of annual rain but only 14% of annual runoff.
The Mann–Whitney test revealed several statisticallysignificant differences in median monthly precipitationamount; however, few of these differences exhibited aconsistent temporal pattern. The exceptions are thatMay precipitation exceeded all other months; July precip-itation was less then all other months except August; andJanuary precipitation was less than all other months ex-cept August and September. In contrast, statistically sig-nificant differences in median monthly Q/P (Table 2)and runoff (not shown) exhibited a consistent intra-annualpattern. Runoff and Q/P for February through May consis-tently exceeded corresponding values for July throughOctober (Table 3).
The intra-annual temporal differences in runoff are dri-ven by the changing interaction of precipitation and soil–water status. The differences in measured monthly runoffover the 64 yr record correspond to the four soil–waterphases described for the site by Allen et al. (2005), whichwere based on data from one annual recharge cycle. Runoffexhibits clear differences throughout the year as shown inTable 3. For the ‘‘dry phase’’ of July through November,soils are typically dry and cracked and runoff is rare. Inthe ‘‘field capacity phase’’ of December through January,decreases in soil crack volume are observed due to in-creased rain and decreased evapotranspiration, andsurface runoff and lateral subsurface flow commence. Inthe ‘‘saturated phase’’ of February through May, substan-tially more precipitation exits the watershed as surface run-off and lateral subsurface return flow. Then in the June

Figure 4 Distribution of monthly Q/P ratio values for watershed Y2 (points indicate the 5th and 95th percentile; whiskers indicatethe 10th and 90th; box boundaries indicate the 25th and 75th; the line within each box indicates the median value).
Table 2 P values for Mann–Whitney tests of differences between median monthly Q/P ratios; statistically significant values(P < 0.05 for a = 0.05) are italicized
February March April May June July August September October November December
January 0.199 0.193 0.756 0.341 0.261 0.000 0.000 0.000 0.001 0.029 0.837February 0.988 0.220 0.649 0.014 0.000 0.000 0.000 0.000 0.001 0.347March 0.196 0.632 0.010 0.000 0.000 0.000 0.000 0.000 0.326April 0.377 0.150 0.000 0.000 0.000 0.000 0.010 0.998May 0.998 0.029 0.000 0.000 0.000 0.001 0.573June 0.000 0.000 0.000 0.022 0.264 0.173July 0.459 0.269 0.104 0.004 0.000August 0.679 0.020 0.000 0.000September 0.009 0.000 0.000October 0.211 0.001November 0.017
Table 3 Monthly runoff volumes and runoff to precipitationratios (Q/P) for corresponding soil–water phases
Month Soil–waterphase
Medianrunoff(mm)
Meanrunoff(mm)
Q/P
January Field capacity 1.0 12.3 0.04February Saturated 6.9 18.8 0.12March Saturated 6.7 19.2 0.11April Saturated 4.1 19.5 0.05May Saturated 7.4 27.6 0.09June Transition 0.7 15.2 0.01July Dry 0.0 2.5 0.00August Dry 0.0 2.0 0.00September Dry 0.0 2.6 0.00October Dry 0.0 8.9 0.00November Dry 0.0 9.1 0.00December Field capacity 1.4 21.1 0.03Annual 136.1 158.7 0.16
Runoff and soil loss relationships for the Texas Blackland Prairies ecoregion 477
‘‘transition phase,’’ evapotranspiration begins to dominateand crack volume increases, thus runoff and lateral subsur-face flow is reduced.
Relationship between peak discharge andwatershed area
The log-transformed watershed size and peak flow data for17 watersheds exhibited statistically significant relationships(P < 0.0001) with little scatter for 2, 5, 10, 25, 50, and 100 yrreturn intervals (Table 4, Fig. 5). The relationships were im-proved by dividing the watersheds into two size categories(<54 ha, >54 ha), as recommended by Baird (1950) becausepeak flows were over-predicted on small watersheds withoutthis division. Results of the constrained curve fitting proce-dure support the appropriateness of the 54 ha delineation.Baird (1950) gave two explanations of this watershed sizephenomenon. One is that lack of well-defined drainage chan-nels in small watersheds leads to a higher percentage of flowreaching the outlet after the flow peak. The other factor,

Table 4 Regression relationships between annual peak flows (Qp, m3/s) and watershed size (area, ha)
Return period (yr) Watersheds <54 ha Watersheds >54 ha P
2 log(Qp) = �1.054 + 0.918 · log(area) log(Qp) = �0.487 + 0.591 · log(area) <0.00015 log(Qp) = �0.738 + 0.916 · log(area) log(Qp) = �0.196 + 0.603 · log(area) <0.0001
10 log(Qp) = �0.601 + 0.909 · log(area) log(Qp) = �0.080 + 0.608 · log(area) <0.000125 log(Qp) = �0.410 + 0.860 · log(area) log(Qp) = 0.018 + 0.613 · log(area) <0.000150 log(Qp) = �0.293 + 0.860 · log(area) log(Qp) = 0.147 + 0.606 · log(area) <0.0001100 log(Qp) = �0.202 + 0.860 · log(area) log(Qp) = 0.258 + 0.594 · log(area) <0.0001
Figure 5 Relationship between annual peak flow andwatershed area.
478 R.D. Harmel et al.
specific to watersheds in the Texas Blackland Prairies ecosys-tem and other areas dominated by cracking clay soils, is theloss of appreciable precipitation excess to cracks. This effectis most pronounced for small watersheds (small time of con-centration) because runoff into cracks can be proportionallylarge during the short time period when cracks are open atthe soil surface. The influence of cracks on surface runoff de-creases as watershed size increases and is negligible in largerwatersheds.
In a recent USGS report, Raines (1998) emphasized thevalue of accurate estimates of the frequency and magnitudeof peak discharges and noted that regional studies shouldproduce more accurate results than statewide studies.Raines (1998) produced peak discharge frequency relation-ships with return intervals from 2 to 100 yr (r2 > 0.90) basedon watershed size and stream slope for a Blackland-domi-nated region of the Brazos River basin in Texas. It is impor-tant to note that improved estimation may result byincluding additional parameters, such as stream slopeand/or drainage density, but the present study producedstrong linear relationships for the same return intervals con-sidering only watershed size (Table 4). Peak flow frequencyestimates for Richland Creek and Chambers Creek based onthe equations in Table 4 were on average 25% larger thanestimates based on the USGS procedure (Raines, 1998).When compared with calculated peak flow frequencies, Ta-ble 4 relationships produced an average error of �5% (over-estimation). The USGS relationships produced a +22%average error (underestimation); however, either methodappears appropriate for predicting peak flow rates and re-turn frequencies in the Texas Blackland Prairie.
Relationship between land use and runoff
From 1939 to 1942, the two larger watersheds (Y2, W1) thatcontain the smaller watersheds (Y8, W10) were managedthe same to evaluate pre-treatment (conservation practice)conditions. In this period, no inherent differences weredetermined between the watersheds, but the importanceof spatial variation in precipitation was noted even in smallareas (Baird, 1950; Baird et al., 1970).
For the period 1949–1963, the hydrologic effects of con-ventional and conservation agronomic practices and nativeprairie were compared. Results of Mann–Whitney tests indi-cated that annual runoff volume, Q/P, and area-normalizedpeak flow rate were all statistically greater for the conven-tionally managed watershed than for the native prairie wa-tershed; however, no differences were observed betweenthe conservation watershed and the native prairie (Table5). The observed differences were confidently attributed
to land use effects, as no statistically significant differencesin annual precipitation existed between the watersheds.Compared with native prairie conditions, conventional man-agement increased average values of runoff (+56%), Q/P(+83%), and normalized peak flow (+100%); and conservationmanagement increased runoff (+19%), Q/P (+33%), and nor-malized peak flow (+20%). The ability of conservation prac-tices, and more recently minimum tillage, to minimize theimpact of cultivated agriculture on hydrology is an impor-tant and well-documented accomplishment (Baird, 1948,1964; Baird et al., 1970; Chichester and Richardson, 1992;Richardson and King, 1995; Smith et al., 1954). Much creditis due to early scientists, engineers, and landowners whodeveloped and utilized these practices.
From 1982 to 2002, land use effects on hydrologic char-acteristics were evaluated under native prairie, improvedpasture, and conservation management. During this period,which again had no significant difference in precipitationbetween watersheds, differences in hydrology were lessprofound. No significant difference in median annual runoffvolume or Q/P occurred between the watersheds, but thearea-normalized peak flow rate for the native prairie ex-ceeded that from the conservation management and im-proved pasture watersheds. Two possible reasons for thereduced impact of land use in this period are less drastic dif-ferences in land use management and above average precip-itation. In the period 1949–1963, drastically different land

Table 5 Hydrologic effects of land use differences measured in two periods (for each row, median values with the same letterindicate no significant difference at a = 0.05)
1949–1963 Native prairie (SW12) Conservationmanagement (Y8)
Conventionalmanagement (W10)
Mean (stdev) Median Mean (stdev) Median Mean (stdev) Median
a ab bRunoff volume (mm) 65.4 (123.1) 10.5 77.8 (122.0) 43.4 102.3 (117.3) 57.2
a ab bQ/P 0.06 (0.09) 0.02 0.08 (0.09) 0.06 0.11 (0.09) 0.08
a ab bNormalized peak Q (m3 s�1 ha�1) 0.05 (0.07) 0.02 0.06 (0.06) 0.05 0.10 (0.08) 0.10
a a aRain (mm) 779.8 (253.2) 795.3 772.6 (252.0) 791.5 788.4 (253.0) 766.8
1982–2002 Native prairie (SW12) Conservationmanagement (Y8)
Improved pasture (W10)
Mean (stdev) Median Mean (stdev) Median Mean (stdev) Median
a a aRunoff volume (mm) 166.8 (113.8) 175.3 152.0 (101.2) 162.8 138.2 (89.6) 126.3
a a aQ/P 0.16 (0.10) 0.17 0.15 (0.09) 0.17 0.14 (0.08) 0.14
a b bNormalized peak Q (m3 s�1 ha�1) 0.16 (0.12) 0.13 0.06 (0.05) 0.05 0.06 (0.06) 0.04
a a aRain (mm) 935.7 (197.3) 1005.1 956.3 (194.5) 971.8 933.5 (195.1) 978.4
Runoff and soil loss relationships for the Texas Blackland Prairies ecoregion 479
uses (from native conditions to intensive crop productionwith no conservation practices) were compared; however,the conversion of the conventionally-managed watershedto improved pasture reduced this difference. Also, mean an-nual precipitation for 1982–2002 exceeded the long-termannual average and the annual average for 1949–1963(Table 5). Baird (1948) concluded that little difference inrunoff due to land use type occurs in the Texas BlacklandPrairies during prolonged wet periods in which soil moisturedeficiencies are satisfied. Because of the differences in pre-cipitation, comparisons of land use impacts across the twoperiods were not conducted.
Relationship between land use and soil loss
In many aspects, differences in soil erosion from differingland use and management have been well established fora number of years (Smith et al., 1954; Wischmeier andSmith, 1965). For example, it is well accepted that forestedand grassed sites experience a fraction of the erosion assites disturbed by cultivation or construction and that siteswith steeper, longer slopes erode more than less steep,shorter slopes. Historical annual average erosion rates mea-sured at Riesel from 1939 to 1947 under conventional tillagewith no conservation practices ranged from 35,800 to41,700 kg/ha (Baird, 1948, 1964). Baird (1964) reported thatwatershed W1 with limited grassed areas and conventionaltillage experienced a mean annual soil loss of 22,900 kg/hafrom 1939 to 1961 compared with 2700 kg/ha for water-shed Y2 with additional grassed areas, contour tillage, andterraces. These studies formed the basis of now well-accepted relationships of tillage and conservation practices
on soil loss in the Texas Blackland Prairies. In the last 60 yr,improved ‘‘conservation’’ agronomic practices have re-placed conventional practices that did little to reduce ex-treme erosion rates. For 1982–2002, average annual soilloss ranged from 552 to 2381 kg/ha for the six cultivatedwatersheds at Riesel, which is acceptable according to NRCS‘‘t value’’ guidelines. Annual soil losses for individual fieldsranged from 0 to 13,000 kg/ha in this period.
For 1982 to 2002, the monthly pattern of soil loss (Fig. 6)represented by two selected cultivated watersheds (Y13,Y6) was similar to the temporal runoff pattern (Fig. 7).Three months with average runoff volumes greater than16 mm (March, May, December) also experienced high soilerosion (>200 kg/ha). Similarly, months with average runoffless than 1 mm (July, September) also experience little ero-sion (<22 kg/ha). However, several interesting exceptionsalso occurred due to interactions between rainfall fre-quency and intensity, crop rotations, and land management.In February, runoff averaged more than 22 mm, but soil lossaveraged only 105 kg/ha. In contrast, April and August hadlow average runoff (<7 mm) but relatively high soil loss(>115 kg/ha).
Many significant differences in median monthly soil lossfor the six small watersheds were revealed by the Mann–Whitney tests (Table 6). The most striking was that medianJuly soil loss was 0.0 kg/ha, which is significantly differentthan for all other months. The median September soil loss(22 kg/ha) was also quite low and significantly lower thaneight other months. The temporal patterns in soil lossare driven by the interaction of hydrologic and land condi-tions; however, the effect of land cover was difficult todistinguish because cropping patterns changed from year

Figure 6 Distribution of monthly soil loss; data grouped for Y6 and Y13 (points indicate the 5th and 95th percentile; whiskersindicate the 10th and 90th; box boundaries indicate the 25th and 75th; the line within each box indicates the median value).
Figure 7 Distribution of monthly runoff depth; data grouped for Y6 and Y13 (points indicate the 5th and 95th percentile; whiskersindicate the 10th and 90th; box boundaries indicate the 25th and 75th; the line within each box indicates the median value).
Table 6 P values for Mann–Whitney tests of median monthly soil loss from watersheds from 1982 to 2002; statisticallysignificant values (P < 0.05 for a = 0.05) are italicized
February March April May June July August September October November December
January 0.471 0.045 0.128 0.066 0.575 0.005 0.379 0.298 0.810 0.379 0.020February 0.810 0.471 0.298 0.174 0.005 0.810 0.005 0.575 0.045 0.379March 0.689 0.936 0.005 0.005 0.689 0.005 0.379 0.005 0.575April 0.689 0.008 0.005 0.471 0.005 0.379 0.005 0.689May 0.013 0.005 0.379 0.005 0.230 0.005 0.810June 0.005 0.174 0.128 0.810 0.575 0.005July 0.005 0.005 0.005 0.005 0.005August 0.005 0.575 0.093 0.174September 0.045 0.128 0.005October 0.471 0.279November 0.005
480 R.D. Harmel et al.

Runoff and soil loss relationships for the Texas Blackland Prairies ecoregion 481
to year. Thus, the influence of cropping system was ex-plored further.
When the two major cropping systems used in TexasBlackland Prairies were compared for 1982–2002, the dif-ference in soil loss between small grain and row crop pro-duction was striking. Under wheat or oat production, bothmean and median annual soil loss were significantly lowerthan from corn or sorghum production. This same result oc-curred in the comparison of soil loss between row crop andsmall grain production for three different scenarios: for allsix cultivated watersheds, for a watershed selected to elim-inate possible inherent differences between watersheds,and for a pair of watersheds in which cropping system alter-nated between the two. For these three scenarios, mean an-nual soil loss for small grains were only 10–48% of lossesfrom row crop production, and median losses were only8–24% of those from row crop production. These dramaticdifferences are attributed to the soil cover provided by
Figure 8 Winter season runoff depth for watershed SW12 for thethe significant trend.
Figure 9 Annual runoff depth for watershed SW12 for the periosignificant trend.
small grain production, which occurs between October andJune and does not leave the soil bare in the high runoff po-tential times of fall or spring. In contrast, row crop produc-tion provides soil coverage only in the spring season. Thisdifference may have little importance in terms of agricul-tural productivity since erosion levels under conservationmanagement are typically within acceptable NRCS ranges.However, utilizing a winter cover crop in row crop produc-tion or converting from row crop to small grain productioncan be effective in reducing offsite transport of sedimentand associated contaminants in watersheds with substantialagricultural contribution to water quality impairment.
Trends in runoff
Linear regression and rank correlation trend tests indicatedseveral statistically significant seasonal and annual trends inrunoff volumes for both the native prairie (SW12) and mixed
period 1948–2002; the linear relationship is shown to illustrate
d 1948–2002; the linear relationship is shown to illustrate the

482 R.D. Harmel et al.
land use (Y2) watersheds in the period 1948–2002, in spiteof substantial annual variability. Fall, winter, and annualrunoff volumes increased over the period. These increasingtrends in winter and annual runoff are illustrated for SW12in Figs. 8 and 9. The statistical significance of these trendsis affected by the extreme drought in the late 1940s andearly 1950s. For the native prairie, annual peak flows alsoexhibited a significant increase over the period.
When precipitation trends for the period 1938–1999were compared to runoff measured at watershed Y2, sev-eral interesting results were noted. Harmel et al. (2003) re-ported statistically significant decreases in the magnitude ofextreme rain events (75–95th percentile) especially in thefall and in the number of extreme rain events (>25.4 mm/day) in the spring. These decreases in extreme precipitationdid not translate into a significant decrease in annual peakflows for the period 1940–1999, although the regressionslope was negative indicating a possible decrease. Similarly,significant increases in October and ‘‘non-spring’’ precipita-tion did not translate into significant increases in fall or an-nual runoff for the period 1939–1999, although regressionslopes were positive.
The difference in results for trends in runoff for Y2 be-tween the two periods emphasizes some of the difficultyin using historical data to predict future patterns. The run-off record from 1948 to 2002 began with a relatively dry per-iod that strengthened the increasing runoff trends. Incontrast, data from 1939 to 1999 began with a wet periodthat dampened the increasing trend. Therefore, althoughhistorical data provide the best estimate possible of futurepatterns, it is important to remember that historical pat-terns may not adequately represent future events. Whenhistorical runoff data are used to model or predict futurewater resource availability, the variability and uncertaintyof future flow characteristics must be considered.
Conclusions
This paper provides a summary and selected analyses of run-off and sediment transport data collected from the late1930s through the present at the USDA-ARS Grassland Soiland Water Research Laboratory watersheds near Riesel,TX. Data collected from these watersheds have contributedto major milestones such as quantification of runoff anderosion control benefits of agriculture conservation prac-tices and development of watershed models currently usedworldwide in water resource management. All of these datahave been entered into a publicly available database, whichprovides comprehensive, long-term data on precipitation,runoff, sediment loss, management practices, and climaticconditions for the Texas Blackland Prairies ecosystem.
In the present analyses, several results with immediatepractical relevance for water resource management in theTexas Blackland Prairies ecosystem were evident; however,extrapolation to other regions should be performed cau-tiously, as results could vary substantially for areas with dif-ferent hydrogeologic conditions.
– The effect of both precipitation and soil–water status torunoff patterns cannot be ignored in this region. Long-term data support the four soil–water phases proposed
by Allen et al. (2005). Little surface runoff occurs evenwith substantial precipitation during in the ‘‘dry phase’’when the soils are dry and cracked, and substantial run-off and lateral subsurface return flow occurs in the ‘‘sat-urated phase.’’ These phases must be adequatelyrepresented to appropriately model the region’shydrology.
– Simplified annual peak flow relationships for 2–100 yrreturn frequencies, based solely on watershed size, weredeveloped and resulted in significant linear relationships.Measured data were also well represented by USGS regio-nal relationships for annual peak flow (Raines, 1998) andrunoff volume (Lanning-Rush, 2000). All of these rela-tionships should prove valuable for hydrologic designand planning in the region.
– The data and analyses provided an important reminder ofthe importance of runoff and erosion control practicesrelated to agriculture and urbanization. Runoff volume,peak flow rate, and soil erosion are much greater fromareas with bare soil than from areas with vegetativecover and other appropriate conservation practices.
– For cultivated agriculture, soil erosion was drasticallyreduced for small grains compared row crops due tothe presence of soil cover in both the spring and fall highprecipitation periods. Thus, conversion from row crop tosmall grain production or utilization of winter cover cropsin row crop production may be valuable managementoptions to reduce offsite transport of sediment and asso-ciated contaminants. This may be especially important inwatersheds with substantial agricultural contribution towater quality impairment.
Acknowledgments
We recognize the efforts of the many employees that havecontributed to the collection of data at Riesel. We espe-cially want to recognize current staff members Lynn Grote,Steve Grote, James Haug, and Gary Hoeft for their out-standing efforts in equipment maintenance, data collection,and record keeping. Without their service, the intensivehydrologic monitoring program at Riesel would not be possi-ble. Georgie Mitchell and Kelly Taisler also deserve creditfor preparation of hydrologic, soil loss, and land manage-ment databases. We are also grateful to Jim Bonta for hiseditorial comments and assistance with constrained curvefitting procedures and to Mike Van Liew for his thoughtfulreview and comments.
References
Allen, P.M., Harmel, R.D., Arnold, J.G., Plant, B., Yeldermann, J.,King, K.W., 2005. Field data and flow system response in clay(Vertisol) shale terrain, north central Texas, USA. Hydrol.Process. 19, 2719–2736.
Arnold, J.G., Williams, J.R., 1987. Validation of SWRRB – simula-tion for water resources in rural basins. J. Water Resour.Planning Mgmt. 113, 243–256.
Arnold, J.G., Potter, K.N., King, K.W., Allen, P.M., 2005. Estimationof soil cracking and the effect on surface runoff in a TexasBlackland Prairie watershed. Hydrol. Process. 19, 589–603.

Runoff and soil loss relationships for the Texas Blackland Prairies ecoregion 483
Baird, R.W., 1948. Runoff and soil conservation practices. Agric.Eng. 1948, 216–217.
Baird, R.W., 1950. Rates and amounts of runoff for the Blacklandsof Texas, USDA Tech. Bull. No. 1022, USDA, Washington, DC,22pp.
Baird, R.W., 1964. Sediment yields from Blackland watersheds.Trans. ASAE 7, 454–465.
Baird, R.W., Knisel, W.G., 1971. Soil conservation practices andcrop production in the Blacklands of Texas, USDA ConservationResearch Report No. 15, USDA, Washington, DC, 23pp.
Baird, R.W., Richardson, C.W., Knisel, W.G., 1970. Effects ofconservation practices on storm runoff in the Texas BlacklandPrairie, USDA Tech. Bull. No. 1406, USDA, Washington, DC, 31pp.
Chichester, F.W., Richardson, C.W., 1992. Sediment and nutrientloss from clay soils as affected by tillage. J. Environ. Qual. 21,587–590.
Edwards, W.M., Owens, L.B., 1991. Large storm effects on total soilerosion. J. Soil Water Conserv. 46, 75–78.
Haan, C.T., 2002. Statistical Methods in Hydrology, second ed. TheIowa State Press, Ames, IA.
Hanson, C.L., 2001. Long-term precipitation database, ReynoldsCreek Experimental Watershed, Idaho, United States. WaterResour. Res. 37, 2831–2834.
Harmel, R.D., Richardson, C.W., King, K.W., 2000. Hydrologicresponse of a small watershed model to generated precipitation.Trans. ASAE 43, 1483–1488.
Harmel, R.D., King, K.W., Richardson, C.W., Williams, J.R., 2003.Long-term precipitation analyses for the central Texas BlacklandPrairie. Trans. ASAE 46, 1381–1388.
Harmel, R.D., Torbert, H.A., Haggard, B.A., Haney, R., Dozier, M.,2004. Water quality impacts of converting to a poultry litterfertilization strategy. J. Environ. Qual. 33, 2229–2242.
Helsel, D.R., Hirsch, R.M., 1993. Statistical Methods in WaterResources. Elsevier, New York, 529pp.
King, K.W., Richardson, C.W., Williams, J.R., 1996. Simulation ofsediment and nitrate loss on a vertisol with conservation tillagepractices. Trans. ASAE 39, 2139–2145.
Kissel, D.W., Richardson, C.W., Burnett, E., 1976. Losses ofnitrogen in surface runoff on the Blackland Prairie of Texas. J.Environ. Qual. 5, 288–293.
Knisel, W.G., Baird, R.W., 1970. Depth-integrating and dip sam-plers. J. Hydraul. Div. ASCE 96, 497–507.
Knisel, W.G. and Baird, R.W., 1971. In: Hershfield, David M., (Ed.),Agricultural Research Service Precipitation Facilities andRelated Studies, USDA-ARS, Riesel, Tex., pp. 41–176.
Lanning-Rush, J., 2000. Regional equations for estimating meanannual and mean seasonal runoff for natural basins in Texas,base period 1961–90, USGS Water-Resources InvestigationsReport 00-4064, USGS, Austin, TX, 27pp.
Marsh, W.M., Marsh, N.L., 1995. Hydrogeomorphic considerations indevelopment planning and stormwater management, centralTexas Hill Country. Environ. Mgmt. 19, 693–702.
Minitab, 2000. MINITAB 12. Minitab Inc., State College, PA.Nichols, M.H., Renard, K.G., Osborn, H.B., 2002. Precipitation
changes from 1956 to 1996 on the Walnut Gulch Experi-
mental Watershed. J. Am. Water Resour. Assoc. 38, 161–172.
Omernik, J.M., 1987. Ecoregions of the conterminous United States.Map (scale 1:7,500,000). Ann. Assoc. Am. Geograph. 77, 118–125.
Pierson, F.B., Slaughter, C.W., Crane, Z.K., 2001. Long-termstream discharge and suspended sediment database, ReynoldsCreek Experimental Watershed, Idaho, United States. WaterResour. Res. 37, 2857–2861.
Raines, T.H., 1998. Peak-discharge frequency and potentialextreme peak discharge for natural streams in the Brazos Riverbasin, Texas. USGS Water-Resources Investigations Report 98-4178. USGS, Austin, TX, 42pp.
Ramanarayanan, T.S., Padmanabhan,M.V.,Gajanan,G.H.,Williams,J.R., 1998. Comparison of simulated and observed runoff and soilloss on three small United States watersheds. In: Boardman, J.,Favis-Mortlock, D. (Eds.), Modelling Soil Erosion by Water, NATOASI Series, vol. 155. Springer-Verlag, Berlin, pp. 75–88.
Richardson, C.W., King, K.W., 1995. Erosion and nutrient lossesfrom zero tillage on a clay soil. J. Agric. Eng. Res. 61, 81–86.
SAS, 1999. Statistical Analysis System version 8. SAS Institute, Inc.,Cary, NC.
Sharpley, A.N., 1995. Identifying sites vulnerable to phosphorus lossin agricultural runoff. J. Environ. Qual. 24, 947–951.
Simon, A., Dickerson, W., Heins, A., 2004. Suspended-sedimenttransport rates at the 1.5-year recurrence interval for ecore-gions of the United States: transport conditions at the bankfulland effective discharge. Geomorphology 58, 243–262.
Slaughter, C.W., 2000. Long-term water data. . .wanted? needed?available? Water Resour. IMPACT 2, 2–5.
Slaughter, C.W., Richardson, C.R., 2000. Long-term watershedresearch in USDA-Agricultural Research Service. Water Resour.IMPACT 2, 28–31.
Smith, R.M., Henderson, R.C., Tippit, O.J., 1954. Summary of soiland water conservation research from the Blackland Experimen-tal Station, Temple, Texas, 1942–1953. Texas AgriculturalExperiment Station Bulletin 781, Texas Agricultural ExperimentStation, College Station, TX.
United States Census Bureau, 2001. Population change and distri-bution, Census 2000 Brief, C2KBR/01-2, US Department ofCommerce, Washington, DC.
United States Department of Agriculture Soil Conservation Service,1942. The agriculture, soils, geology, and topography of theBlacklands Experimental Watershed, Waco, TX, HydrologicBulletin No. 5, USDA-SCS, Washington, DC, 38pp.
Van Liew, M.W., Garbrecht, J., 2003. Hydrologic simulation of theLittle Washita River Experimental Watershed using SWAT. J. Am.Water Resour. Assoc. 39, 413–426.
Williams, J.R., Hiler, E.A., Baird, R.W., 1971. Prediction ofsediment yields from small watersheds. Trans. ASAE 14, 1157–1162.
Wischmeier, W.H., Smith, D.D., 1965. Predicting rainfall–erosionlosses from cropland east of the Rocky Mountains: guide forselection of practices for soil and water conservation, Agricul-ture Handbook No. 282, USDA-ARS, Washington, DC.