runoff water quality index (wqiag) - usda · pdf file1 introduction getting started welcome to...
TRANSCRIPT

Runoff Water Quality Index (WQIag)


iii
Table of Contents Introduction ................................................................................................. 1
Getting Started .......................................................................................... 1
About WQIag ............................................................................................. 3
Contact Us ................................................................................................ 3
Other Resources ........................................................................................ 4
Disclaimer ................................................................................................. 6
Distribution Liability ................................................................................... 7
Using WQIag ................................................................................................ 9
Introduction .............................................................................................. 9
Site Information ...................................................................................... 10
Site Information Activities ......................................................................... 11
Site Information Overview ......................................................................... 11
Field Physical Sensitivity Factors ................................................................ 13
Activities ................................................................................................ 13
Overview ................................................................................................ 13
Field Slope Interaction .............................................................................. 20
Activities ................................................................................................ 20
Overview ................................................................................................ 20
Field Rainfall / Vegetation Interaction ......................................................... 23
Activities ................................................................................................ 23
Overview ................................................................................................ 23
Data Entry Examples ................................................................................ 24
Nutrient Management Factors .................................................................... 29
Activities ................................................................................................ 29
Overview ................................................................................................ 30
Tillage Management Factors ...................................................................... 34
Activities ................................................................................................ 34
Overview ................................................................................................ 34
Pest Management Factors ......................................................................... 35
Activities ................................................................................................ 35
Overview ................................................................................................ 36

Runoff Water Quality Index (WQIag)
iv
Irrigation / Tile Drain Management ............................................................. 37
Activities ................................................................................................ 37
Overview ................................................................................................ 37
Conservation Practices .............................................................................. 39
Activities ................................................................................................ 39
Overview ................................................................................................ 39
Definitions .............................................................................................. 40
Project Files ............................................................................................ 41
Activities ................................................................................................ 41
Overview ................................................................................................ 42
Reports ..................................................................................................... 49
Introduction ............................................................................................ 49
Overview ................................................................................................ 49

1
Introduction
Getting Started Welcome to the Water Quality Index for Runoff Water from Agricultural Fields (WQIag). This web-based software application was designed to provide a simple, convenient way to express multiple water quality parameters into a single, easy to understand value. A calculated WQIag# value is ranked from 1 to 10, where a value of 10 is assigned to the runoff water of highest quality and value of 1 to lowest water quality.
Below, an image of the WQIag main page shows where to find the following items:
Site Information Irrigation / Tile Drain Management
Field Physical Sensitivity Factors
Runoff Water Quality Index (WQIag#) calculated value
Nutrient Management Factors Conservation Practices
Tillage Management Factors WQIag# adjusted for Conservation Practices
Pest Management Factors Project file and Report
WQIag main page example screen:

Runoff Water Quality Index (WQIag)
2
( Back to Top )
To generate a single dimensionless Runoff Water Quality Index calculated value (WQIag#), a minimal amount of user information is required. The easy to use worksheet design accepts user input for the following categories:

Introduction
3
• Site Information (required; see Site Information)
• Field Physical Sensitivity Factors (required; see Field Factors)
• Nutrient Management Factors (required; see Nutrient Factors)
• Tillage Management Factors (required; see Tillage Factors)
• Pest Management Factors (required; see Pest Factors)
• Irrigation / Tile Drain Management (optional; see Irrigation / Tile Drain Management)
• Conservation Practices (optional; see Conservation Practices)
About WQIag The USDA Natural Resources Conservation Service (NRCS), West National Technology Support Center (WNTSC), Water Quality and Quantity National Technology Development Team, developed and supports the Water Quality Index for Runoff Water from Agricultural Fields (WQIag).
WQIag is a simple, convenient way to express multiple water quality parameters into a single, easy to understand value. WQIag was developed to evaluate the quality of runoff water from agricultural fields.
The US Department of Agriculture, Natural Resources Conservation Service (USDA/NRCS) provides technical assistance (TA) and financial assistance (FA) cost shares that encourage agricultural producers to be good stewards of the Nation’s soil, water, and related natural resources on private and tribal lands. One of the key goals of implementing conservation practices is to safeguard and improve water quality of the watershed.
The USDA/NRCS is always looking for approaches and techniques to evaluate the effects of its programs on the environment. For example, the CEAP Program (USDA/NRCS, 2011) is one such program that uses the APEX model for this purpose. The WQIag may serve as a simple tool in the effort to evaluate the effects of the conservation practices on improving and/or sustaining the quality of water in the watershed.
Contact Us For questions or comments regarding the Water Quality Index for Runoff from Agricultural Fields (WQIag), please contact:

Runoff Water Quality Index (WQIag)
4
Harbans Lal
Environmental Engineer West National Technology Support Center USDA-NRCS 1201 NE Lloyd Blvd., Suite 1000 Portland, OR 97232 [email protected]
Shaun McKinney
Water Quality / Quantity Team Leader West National Technology Support Center USDA-NRCS 1201 NE Lloyd Blvd., Suite 1000 Portland, OR 97232 [email protected]
Other Resources For additional information relating to the Water Quality Index for Runoff from Agricultural Fields (WQIag), please see:
Topic Description
Conservation Practices
Best Management Practices for Georgia Agriculture –Conservation Practices to Protect Water Quality. The Georgia Soil and Water Conservation Commission, P.O. BOX 8024, Athens, GA 30603 (706) 652-3065 External link:
www.gaswcc.georgia.gov
HUC Codes
Six Easy Steps to Finding Your 12-digit Hydrologic Unit Code (HUC) External link:
http://www.azdeq.gov/environ/water/watershed/download/easysteps.pdf
Integrate USDA/NRCS Integrated Pest Management (IPM) Practice

Introduction
5
d Pest Management
Standard 595 External link:
IntegratedPestManagementPracticeStandard.pdf
Nutrient Management Practice Standard
USDA/NRCS Nutrient Management Practice Standard 590 External link:
NutrientManagementPracticeStandard.pdf
RUSLE2
USDA/NRCS, undated. RUSLE2 - Revised Universal Soil Loss Equation 2 External link:
ftp://ftp-fc.sc.egov.usda.gov/IA/news/RUSLE2.pdf
WQIag Review
The Introduction to the Water Quality Index Expressing water quality information in a format that is simple and easily understood by common people. External link:
http://www.waterefficiency.net/WE/Articles/The_Introduction_to_the_Water_Quality_Index_15374.aspx
WQIag Tech Note
Water Quality Index for Runoff from Agricultural Fields Technical Note document by:
Harbans Lal and Shaun McKinney External link:
ftp://ftp.wcc.nrcs.usda.gov/wntsc/WQI/wqiTtechNote.docx
WQIag PowerPoint
Water Quality Index for Runoff from Agricultural Fields PowerPoint document by:
Harbans Lal and Shaun McKinney External link:
ftp://ftp.wcc.nrcs.usda.gov/wntsc/WQI/wqiAg.pptx

Runoff Water Quality Index (WQIag)
6
WQIag Documentation
Documentation for Water Quality Index for Runoff from Agricultural Fields (WQIag). Select either Adobe Portable Document Format (PDF) or Microsoft Word (DOC) formats. External links:
Adobe PDF: RunoffWaterQualityIndex.pdf
Microsoft Word: RunoffWaterQualityIndex.doc
Disclaimer This digital data set publication was prepared by an agency of the United States Government. Neither the United States Government nor any agency thereof, nor any of their employees, make any warranty, expressed or implied, or assumes any legal liability or responsibility for the accuracy, completeness, or misuse of the data, or for damage, transmission of viruses or computer contamination through the distribution of these data sets or for the usefulness of any information, apparatus, product, or process disclosed in this report, or represents that its use would not infringe privately owned rights. Reference therein to any specific commercial product, process, or service by trade name, trademark, manufacturer, or otherwise does not necessarily constitute or imply its endorsement, recommendation, or favoring by the United States Government or any agency thereof. Any views and opinions of authors expressed herein do not necessarily state or reflect those.
The U.S. Department of Agriculture (USDA) prohibits discrimination in all its programs and activities on the basis of race, color, national origin, age, disability, and where applicable, sex, marital status, familial status, parental status, religion, sexual orientation, genetic information, political beliefs, reprisal, or because all or a part of an individual’s income is derived from any public assistance program. (Not all prohibited bases apply to all programs.) Persons with disabilities who require alternative means for communication of program information (Braille, large print, audiotape, etc.) should contact USDA’s TARGET Center at (202) 720-2600 (voice and TDD). To file a complaint of discrimination, write to USDA, Director, Office of Civil

Introduction
7
Rights, 1400 Independence Avenue, SW., Washington, DC 20250–9410, or call (800) 795-3272 (voice) or (202) 720-6382 (TDD). USDA is an equal opportunity provider and employer.
Distribution Liability This digital data set publication was prepared by an agency of the United States Government. Neither the United States Government nor any agency thereof, nor any of their employees, make any warranty, expressed or implied, or assumes any legal liability or responsibility for the accuracy, completeness, or misuse of the data, or for damage, transmission of viruses or computer contamination through the distribution of these data sets or for the usefulness of any information, apparatus, product, or process disclosed in this report, or represents that its use would not infringe privately owned rights. Reference therein to any specific commercial product, process, or service by trade name, trademark, manufacturer, or otherwise does not necessarily constitute or imply its endorsement, recommendation, or favoring by the United States Government or any agency thereof. Any views and opinions of authors expressed herein do not necessarily state or reflect those.


9
Using WQIag
Introduction The Water Quality Index for Runoff from Agricultural Fields (WQIag) has an easy to use worksheet design.
To generate a single dimensionless Runoff Water Quality Index calculated value (WQIag#), a minimal amount of user information is required. The easy to use worksheet design accepts user input for the following categories:
1. Site Information - several user input fields are required; for details, see Site Information
2. Field Physical Sensitivity Factors - required; for details, see Field Factors
3. Nutrient Management Factors - required; for details, see Nutrient Factors
4. Tillage Management Factors - required; for details, see Tillage Factors
5. Pest Management Factors - required; for details, see Pest Factors 6. Irrigation / Tile Drain Management - optional; for details, see
Irrigation / Tile Drain Management 7. Conservation Practices - optional; for details, see Conservation
Practices
Note: Click the topic links above for additional information.
See Getting Started for more information about the location of these and other items on the WQIag main page. Also, WQIag now requires a State selection before any other user inputs. See Site Information for details.
Print a Report
After entering the required user information, use the Report button to review and print a WQIag report. See Reports Introduction for details.
Use a Project File
Using a WQIag project file is optional. A WQIag project file can be used to save / reload user inputs and WQIag values. See Project Files for details.
Some WQIag categories have more than one user input (see partially completed Example 1 below). When all of the user inputs for a category area have been entered, a WEIGHT value for the category area will be calculated (see Example 2 below). When all of the WQIag categories with

Runoff Water Quality Index (WQIag)
10
required inputs have been entered, the WQIag# (Water Quality Index value) will be calculated (see Example 3 below).
Example 1: Shows partially completed Nutrient Management Factors category inputs. The calculated category WEIGHT remains zero (0.00) in this example:
( Back to Top )
Example 2: Shows all of the Nutrient Management Factors category inputs entered. The calculated category WEIGHT is now 1.25 in this example:
( Back to Top )
Example 3: When all of the WQIag categories with required inputs have been entered, the calculated WQIag# (Water Quality Index value) will display:
( Back to Top )
Site Information

Using WQIag
11
Site Information Activities
• Review the Site Information user input requirements. • A State location selection is required before other user inputs. • Enter information into all required fields.
Site Information Overview This is the Site Information category (see Example 1 below). All required fields must have user inputs before a report can be produced.
Note: See Other Resources for additional information.
Provide user inputs for:
State: - Select the State location (required) from the list. A State location selection is required before other user inputs. Changing a State location selection will result in a complete WQIag reset and restart on the main page. Attempting user inputs without a State selection will result in the following message:
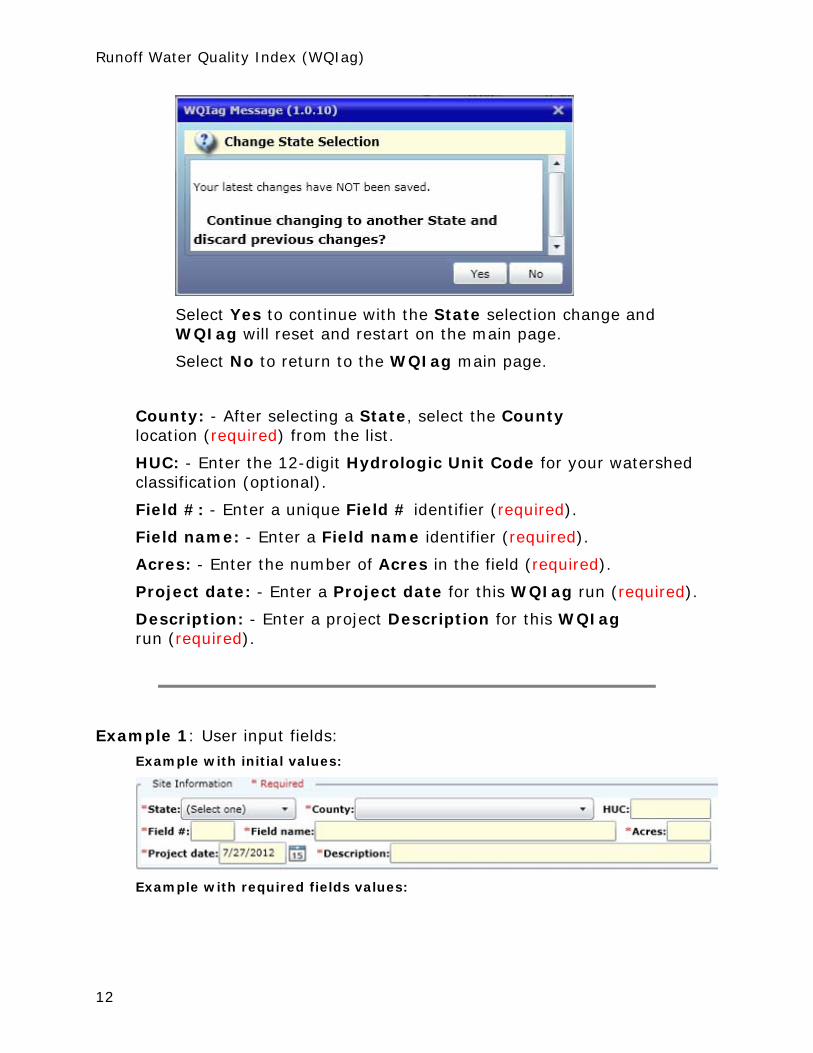
Saving user inputs to a WQIag project file is optional. Attempting to change a State location selection with previously unsaved user inputs will result in the following message:
Runoff Water Quality Index (WQIag)
12
Select Yes to continue with the State selection change and WQIag will reset and restart on the main page.
Select No to return to the WQIag main page.
County: - After selecting a State, select the County location (required) from the list.
HUC: - Enter the 12-digit Hydrologic Unit Code for your watershed classification (optional).
Field #: - Enter a unique Field # identifier (required).
Field name: - Enter a Field name identifier (required).
Acres: - Enter the number of Acres in the field (required).
Project date: - Enter a Project date for this WQIag run (required).
Description: - Enter a project Description for this WQIag run (required).
Example 1: User input fields:
Example with initial values:
Example with required fields values:

Using WQIag
13
( Back to Top )
Field Physical Sensitivity Factors
Activities
• Review the Field Physical Sensitivity Factors category selection requirements (see Example_1 below).
• Use the Get Slope Interaction button to input Slope(%), HS group (Hydrologic soil group), and K-factor (Soil erodibility factor).
• Make a selection for OM content (Organic matter) in this category. • Use the Get Rain / Vegetation Interaction button to identify
monthly rainfall and monthly vegetation cover.
Note: A State, County and Slope(%) selection is required before you can enter Rain/Vegetation information.
Overview This is the Field Physical Sensitivity Factors category. Make a selection from each of the following:
Click the Get Slope Interaction button to open a pop-up window (see Example 2 below) allowing you to select Slope(%), Hydrologic soil group, and K-factor. See Field Slope Interaction for details.
OM content - Select the field percent organic matter content from the list (see Example 3 below).
Click the Get Rain / Vegetation Interaction button to open a pop-up window (see Example_4 below) allowing you to select / enter monthly rainfall and monthly vegetation cover. See Field Rain/Veg Interaction for details.
Duration - Three buttons control the Duration selection. Changing the Duration results in a change to the Rainfall/Veg WQI Ranking value and a recalculation of the WQIag#.
The By Year button is the default selection which uses the Rainfall/Vegetation Interaction value for the entire year, January through December. The By Year default selection is shown in Example_1 below.

Runoff Water Quality Index (WQIag)
14
The By Month button allows a single month selection and uses the Rainfall/Vegetation Interaction value for the selected month (see Example 5 below).
The By Season button allows a contiguous months selection and uses the Rainfall/Vegetation Interaction value for the selected range of months (see Example 6 below).
When all of the user inputs for this category area have been entered, a WEIGHT value for the category area will be calculated (see Example_1 below).
Example 1: All category selections completed for Field Physical Sensitivity Factors:
Tooltip
Hover the mouse over the Get Rain / Vegetation Interaction button to show the Rainfall/Veg tooltip:
Source: Displays a Station name or 'Custom'.
Annual Precip: Annual precipitation in inches.
Precip/Veg: Calculated precipitation / vegetation interaction value. Note: The Precip/Veg value shown corresponds to the Duration selection: By Year, By Month or By Season.
( Back to Top )
Using WQIag
15
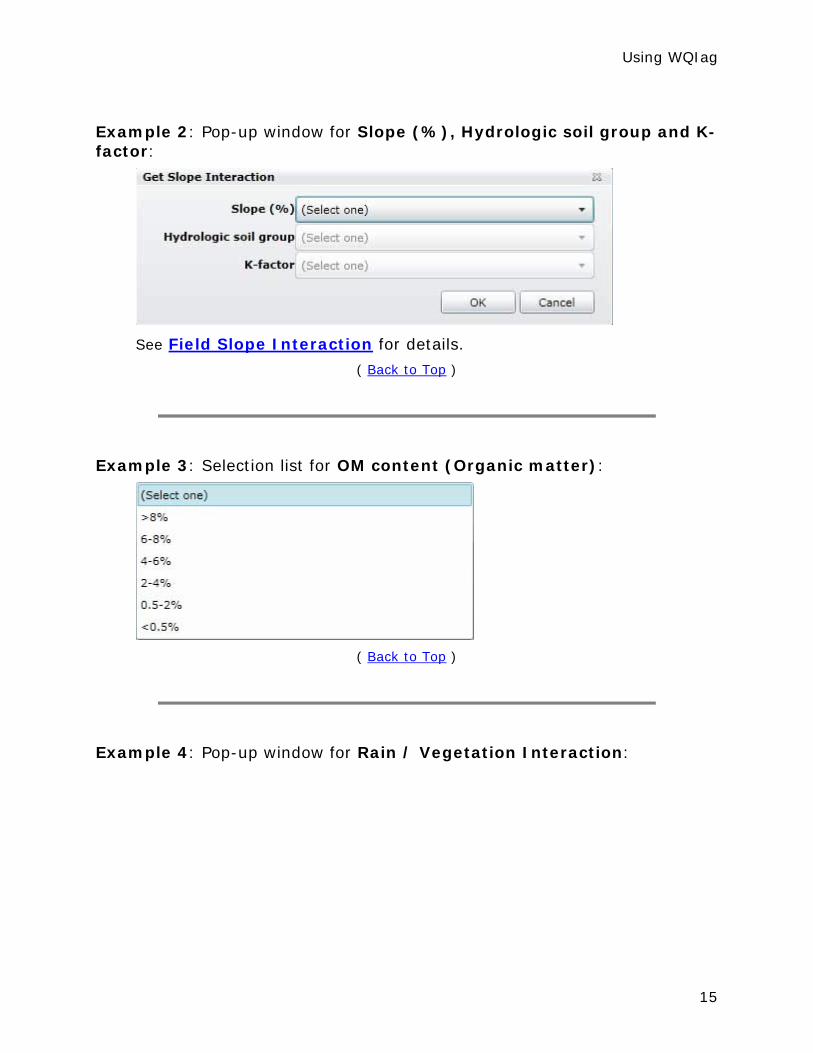
Example 2: Pop-up window for Slope (%), Hydrologic soil group and K-factor:
See Field Slope Interaction for details.
( Back to Top )
Example 3: Selection list for OM content (Organic matter):
( Back to Top )
Example 4: Pop-up window for Rain / Vegetation Interaction:

Runoff Water Quality Index (WQIag)
16
See Field Rainfall/Vegetation Interaction for details.
( Back to Top )
Example 5: Pop-up window for By Month selection:

Using WQIag
17
Click the OK button to save your selection or click the Cancel button to ignore changes.
( Back to Top )
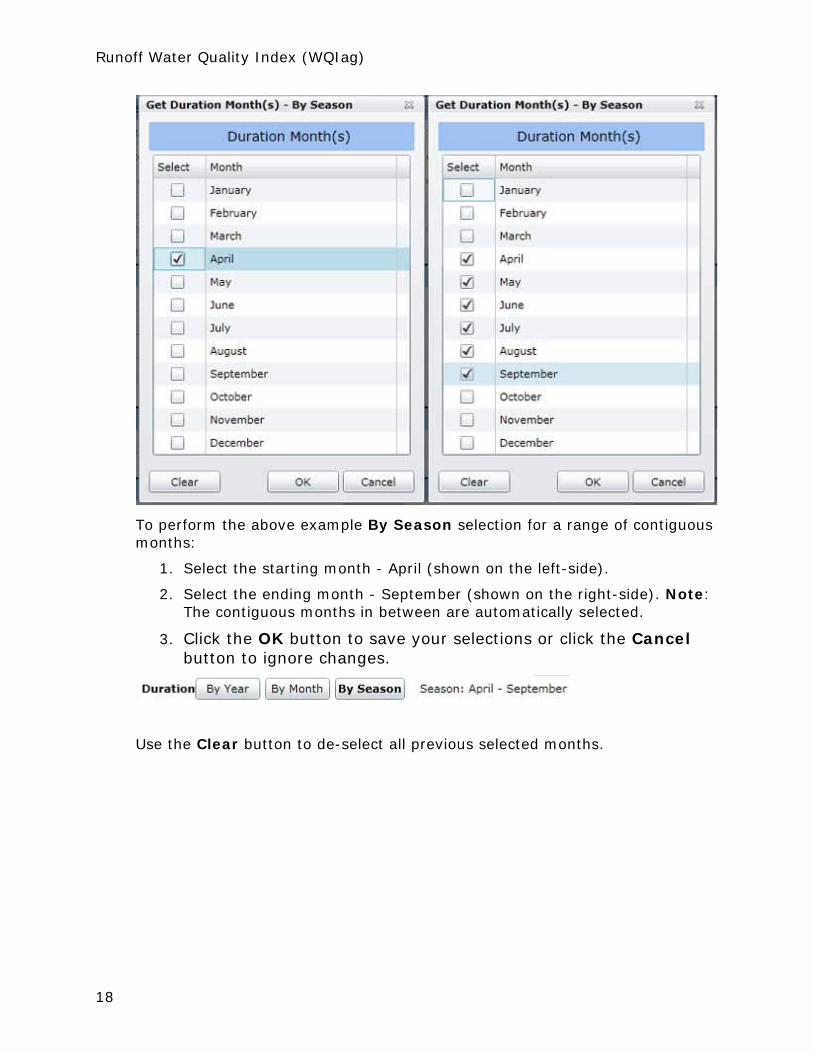
Example 6: Pop-up window for By Season selection examples:
Runoff Water Quality Index (WQIag)
18
To perform the above example By Season selection for a range of contiguous months:
1. Select the starting month - April (shown on the left-side).
2. Select the ending month - September (shown on the right-side). Note: The contiguous months in between are automatically selected.
3. Click the OK button to save your selections or click the Cancel button to ignore changes.
Use the Clear button to de-select all previous selected months.

Using WQIag
19
To de-select a single month, click any selected month to de-select it as shown for July in the example above. The above example does not contain a valid contiguous set of selected months. Clicking the OK button will result in the following error message:

Runoff Water Quality Index (WQIag)
20
To perform the above example By Season selection for a 'fall-winter-spring' range of contiguous months:
1. Select the starting month - January(shown on the left-side).
2. Select the ending month - December (shown in the middle). Note: The contiguous months in between are automatically selected.
3. Continue to de-select March through September by clicking each one (shown on the right-side).
4. Click the OK button to save your selections or click the Cancel button to ignore changes.
( Back to Top )
Field Slope Interaction
Activities
• Review the Slope Interaction selection requirements (see Example 1 below).
• Make a selection for Slope(%). • Make a selection for Hydrologic soil group. • Make a selection for K-factor.
Note: Slope(%), Hydrologic soil group and K-factor selections are required to calculate a WQIag#.
Overview

Using WQIag
21
From the main page, click the Get Slope Interaction button to open this pop-up window (see Example 1 below). The Get Slope Interaction pop-up window provides a selection from each of the following:
Slope(%) - Select the Slope(%) from the list (see Example 2 below). Field slope plays an important role in runoff generation and transport. The higher the slope value, the more susceptible it is to generate runoff and soil erosion. The field slope interacts with the site rainfall, and soil physical and erosion factors such as Hydrologic soil group and the K-factor in generating runoff.
The field Slope(%) selection also interacts with the Irrigation / Tile Drain Management, Tile Drain selection. Tile Drain selections are possible only when the field Slope(%) selection is 5% or less. If the field Slope(%) selection is greater than 5%, the Tile Drain selection will be limited to 'No Tile Drain (0%)'.
Note: A Slope(%) selection is required before you can enter Rain/Vegetation information.
Hydrologic soil group - Select the Hydrologic soil group from the list (see Example 3 below). Hydrologic soil group is a group of soils having similar runoff potential under similar storm and cover conditions. Soil map unit components are assigned a hydrologic group in the NASIS soil survey database (USDA/NRCS. 2009). Most soils are placed in hydrologic groups A, B, C, or D. Soils assigned to hydrologic group 'A' have the lowest runoff potential, whereas soils in hydrologic group 'D' have the highest runoff potential.
K-factor - Select the K-factor from the list (see Example 4 below). K-factor defines the susceptibility of a soil to sheet and rill erosion by water. It is one of the six factors used in the Universal Soil Loss Equation (USLE) and the Revised Universal Soil Loss Equation (RUSLE) that are used to predict the average annual rate of soil loss (USDA/NRCS, undated). The K-factor ranges from 0.02 to 0.69 and is based primarily on percentage of silt, sand and organic matter, the soil structure and the saturated hydraulic conductivity. The higher the K value, the more susceptible the soil is to sheet and rill erosion by water thus leading to decreasing the quality of runoff water.
Click the OK button to save your selections or click the Cancel button to ignore changes.
Note: See Other Resources for reference links.

Runoff Water Quality Index (WQIag)
22
Example 1: Initial pop-up window for Slope Interaction:
( Back to Top )
Example 2: Selection list for Slope(%):
( Back to Top )
Example 3: Selection list for Hydrologic soil group:
( Back to Top )
Example 4: Selection list for K-factor:

Using WQIag
23
( Back to Top )
Field Rainfall / Vegetation Interaction
Activities
• Review the Rainfall / Vegetation Interaction selection requirements (see Example 1 below).
• Make a selection for Precip Source (precipitation source ): Station (weather station) or Custom. You can have both Station and Custom information but the calculated WQIag# will only use selected Precip Source.
• When the Precip Source is Station, select a Station: (weather station) from the list and select a Vegetative Cover value (Low, Medium or High) for each month. For the Station: selected, each months Precip(In) (precipitation in inches) will display along with the Annual total precipitation.
• When the Precip Source is Custom, enter Precip(In) (monthly precipitation amounts in inches) for each month and select a Vegetative Cover value (Low, Medium or High) for each month. The Annual total precipitation will accumulate as the monthly Precip(In) values are entered.
• When the Precip Source is Station and a Station: is selected, you can use the Copy button to copy the selected Station: monthly precipitation amounts to Custom monthly precipitation amounts.
• When the Precip Source is Custom, you can use the Clear button to reset all of the Custom monthly precipitation amounts to zero.
Note: Either Station or Custom Rainfall/Vegetation information is required before a WQIag# can be calculated.
Overview The precipitation magnitude and its duration falling on the field becomes the primary source of runoff. The field sensitivity/physical factors such as slope,

Runoff Water Quality Index (WQIag)
24
soil texture, etc., control the quantity and rate of runoff. The runoff carries with it the sediments and other pollutants, both dissolved constituents as well as entraining particles.
The Precip(LMH) and Precip/Veg data columns are display only and do not allow user input. The values displayed for these two columns are computed values.
From the main page, click the Get Rain / Vegetation Interaction button to open this pop-up window (see Example 1 below). The Get Rainfall / Vegetation pop-up window provides a selection from each of the following:
Precip Source - Select either Station (weather station) or Custom.
Station: - When the Precip Source is Station, select a Station: (weather station) from the list. For the Station: selected, the monthly Precip(In) (precipitation in inches) values will display along with the Annual total precipitation.
Precip(In) - When the Precip Source is Custom, enter Precip(In) (monthly precipitation amounts in inches) for each month. The Annual total precipitation will accumulate as the monthly Precip(In) values are entered.
Vegetative Cover - Select a Vegetative Cover value (Low, Medium or High) for each month.
Copy button - Optionally, when the Precip Source is Station and a Station: is selected, you can use the Copy button to copy the selected Station: monthly precipitation amounts to Custom monthly precipitation amounts.
Clear button - Optionally, when the Precip Source is Custom, you can use the Clear button to reset all of the Custom monthly precipitation amounts to zero.
Click the OK button to save your updates or click the Cancel button to ignore changes.
Data Entry Examples
• Making a Precip Source - Station selection (see Example 2 below). • Making a Precip Source - Custom selection (see Example 3 below).

Using WQIag
25
• Copy precipitation amounts from a Station: selection to Custom (see Example 4 below).
• Clear precipitation amounts in Custom (see Example 5 below).
Example 1: Initial pop-up window for Rainfall / Vegetation: showing initial values (in this example Oregon and Clackamas were previously selected as the State and County):
( Back to Top )
Example 2: Making a Precip Source - Station selection:
This example shows a climate Station selection in Clackamas county Oregon.

Runoff Water Quality Index (WQIag)
26
For the climate Station selected, the following columns are automatically populated:
• Precip(In) - monthly precipitation amounts in inches.
• Precip(LMH) - Low, Med or High designation.
• Precip/Veg - Range value from 1 to 9.
Step 1: 1. Precip Source: Select Station 2. Station: Select a Station: from the list (example N Willamette
Exp Stn)
Step 2: 1. Surface Vegetation: For each month (January through
December) select the Surface Vegetation (Low, Medium or High) that most describes your conditions.
2. Vegetative cover (live or dead) and rainfall is classified into three categories (Low, Medium and High). The following categories are suggested for vegetative cover (live or dead).
• Less than 30% vegetative cover = Low Vegetation (Vl) • 31 to 80% vegetative cover = Medium Vegetation (Vm) • More than 80% vegetative cover = High Vegetation (Vh)
3. The example below shows medium and high vegetation from April
through November.

Using WQIag
27
Step 3: 1. When all of the Surface Vegetation selections have been
completed, click the OK button to save your changes or click Cancel to ignore changes.
( Back to Top )
Example 3: Making a Precip Source - Custom selection:
This example shows a Custom selection and climate entry.
For a Custom selection, the following columns are automatically populated:
• Precip(In) - all monthly precipitation amounts (in inches) are set to zero.
• Precip(LMH) - set to Low designation.
• Precip/Veg - set to 3 (no rain and Low Surface Vegetation).
Step 1: 1. Precip Source: Select Custom

Runoff Water Quality Index (WQIag)
28
Step 2: 1. Precip(in): For each month (January through December) enter
your monthly total precipitation in inches. As each monthly amount is entered, the Annual total will automatically accumulate. Also, the Precip(LMH) column may change based on the monthly amount entered. In this example below, monthly precipitation amounts have been entered from January through May and June is waiting for input.
2. Surface Vegetation: For each month (January through December) select the Surface Vegetation (Low, Medium or High) that most describes your conditions. The example below shows partial data entry for January through May.
Step 3: 1. When all of the monthly Precip(In) precipitation amounts and
Surface Vegetation selections have been completed, click the OK button to save your changes or click Cancel to ignore changes.
( Back to Top )
Using WQIag
29
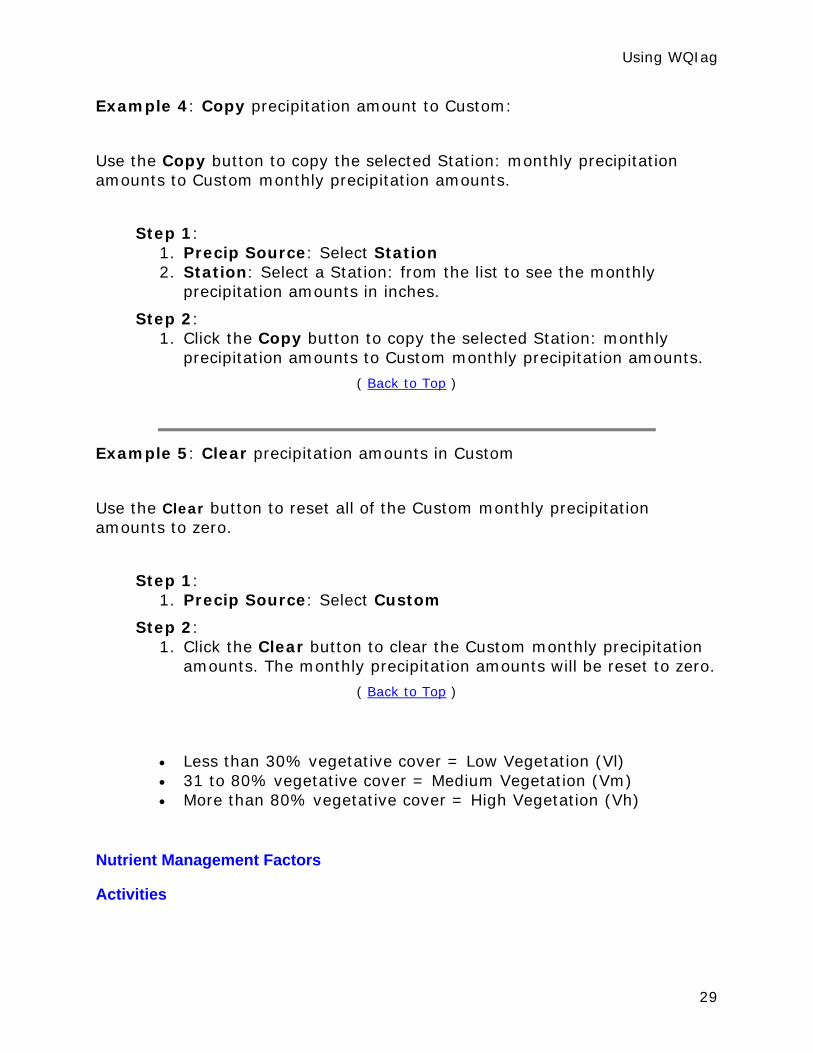
Example 4: Copy precipitation amount to Custom:
Use the Copy button to copy the selected Station: monthly precipitation amounts to Custom monthly precipitation amounts.
Step 1: 1. Precip Source: Select Station 2. Station: Select a Station: from the list to see the monthly
precipitation amounts in inches.
Step 2: 1. Click the Copy button to copy the selected Station: monthly
precipitation amounts to Custom monthly precipitation amounts.
( Back to Top )
Example 5: Clear precipitation amounts in Custom
Use the Clear button to reset all of the Custom monthly precipitation amounts to zero.
Step 1: 1. Precip Source: Select Custom
Step 2: 1. Click the Clear button to clear the Custom monthly precipitation
amounts. The monthly precipitation amounts will be reset to zero.
( Back to Top )
• Less than 30% vegetative cover = Low Vegetation (Vl) • 31 to 80% vegetative cover = Medium Vegetation (Vm) • More than 80% vegetative cover = High Vegetation (Vh)
Nutrient Management Factors
Activities

Runoff Water Quality Index (WQIag)
30
• Review the Nutrient Management Factors category selection requirements (see Example 1 below).
• Make a selection for Application rate in this category. An Application rate selection is required before the other user Nutrient Management Factors inputs.
• Make a selection for N-source and timing in this category. • Make a selection for P-source and timing in this category. • Make a selection for Soil condition / application in this category.
Overview This is the Nutrient Management Factors category. Nutrient management is composed of four inputs: the rate, timing, form, and method of fertilizer application. The primary objective of nutrient/pest management is to balance the application of nutrients and pesticides for the vegetative requirement to achieve sustainable crop yields while minimizing their off-site transport and losses.
The USDA/NRCS Practice Standards 590 (Nutrient Management Practice Standard) and 595 (Integrated Pest Management) respectively describes these practices in much greater details (USDA/NRCS, 2006 and USDA/NRCS, 2010).
Note: See Other Resources for reference links.
Make a selection from each of the following:
Application rate - Select the nutrient application rate from the list (see Example 2 below). An Application rate selection is required before the other user Nutrient Management Factors inputs. Many of the selections are based on State Land Grant University (LGU) recommendations.
Higher fertilizer application rates lead to increasing water quality concerns. Farmers generally apply fertilizers using LGU recommendations.
N-source and timing - Select the nitrogen (N) source and timing from the list (see Example 3 below).
The timing of fertilizer application plays an important role in the fate of nutrients because of the physiological effectiveness of the plant to uptake the applied nutrients. If applied at the optimum time, a large percentage of nutrients are taken up by the plants, thus minimizing negative impact on the water quality.

Using WQIag
31
P-source and timing - Select the phosphorus (P) source and timing from the list (see Example 4 below).
The timing of fertilizer application plays an important role in the fate of nutrients because of the physiological effectiveness of the plant to uptake the applied nutrients. If applied at the optimum time, a large percentage of nutrients are taken up by the plants, thus minimizing negative impact on the water quality.
Soil condition / application - Select the soil condition / nutrient application method from the list (see Example 5 below).
Application method and soil condition at the time of fertilizer application are two additional factors that play key role in plant nutrient uptake and impact on water quality. Fertilizer directly injected into dry/well drained soils is best for plant uptake and also causes minimal impact on the water quality.
Attempting to make a selection for N-source and timing, P-source and timing or Soil condition / application before an Application rate has been selected will result in the following message:
When all of the user inputs for this category area have been entered, a WEIGHT value for the category area will be calculated (see Example 1 below).
Example 1:All category selections completed for Nutrient Management Factors:

Runoff Water Quality Index (WQIag)
32
( Back to Top )
Example 2: Selection list for Application rate:
( Back to Top )
Example 3: Selection list for N-source and timing:

Using WQIag
33
( Back to Top )
Example 4: Selection list for P-source and timing:
( Back to Top )
Example 5: Selection list for Soil condition / application method:

Runoff Water Quality Index (WQIag)
34
( Back to Top )
Tillage Management Factors
Activities
• Review the Tillage Management Factors category selection requirements (see Example 1 below).
• Make a selection for Description / STIR.
Overview This is the Tillage Management Factors category.
The effect of soil tillage on soil erosion is well established. The more the soil is tilled, the more susceptible it becomes to erosion. Thus, it is an important factor in evaluating the quality of runoff water from a field. Soil Tillage Intensity Rating (STIR) is a tool that has been widely used for evaluating the soil disturbance as well as the severity of the disturbance caused by tillage operations. Specific components of STIR value include: Operational

Using WQIag
35
speed of tillage operation, tillage type, depth of tillage operation and percentage of soil surface area disturbed.
Note: See Other Resources for reference links.
Make a selection from each of the following:
Description /STIR - Select the Description / STIR from the list (see Example 2 below).
The STIR value can range between 0-200. Low STIR value reduces likelihood of sheet rill erosion. By definition, No-Till operation gets the STIR value of 30.
When all of the user inputs for this category area have been entered, a WEIGHT value for the category will be calculated (see Example 1 below).
Example 1:All category selections completed for Tillage Management Factors:
( Back to Top )
Example 2: Selection list for Description /STIR:
( Back to Top )
Pest Management Factors
Activities

Runoff Water Quality Index (WQIag)
36
• Review the Pest Management Factors category selection requirements (see Example 1 below).
• Make a selection for Description.
Overview This is the Pest Management Factors category.
Pests (weeds, insects, and diseases) are expected elements of a farming system. Considerable amount of efforts and resources are devoted on controlling and/or managing them. Modern pest management approach uses combination of practices generally referred to as Integrated Pest Management (IPM). They incorporate crop rotations, cultural practices, scouting, crop selections, and other field practices to prevent pest problems from occurring. When pest infestations do occur at damaging levels they are controlled using chemicals in the most effective way with minimum risk to environmental including water quality.
Make a selection from each of the following:
Description - Select the Description from the list (see Example 2 below). Several of the selections are based on IPM recommendations.
When all of the user inputs for this category have been entered, a WEIGHT value for the category will be calculated (see Example 1 below).
Example 1:All category selections completed for Pest Management Factors:
( Back to Top )
Example 2: Selection list for Description:

Using WQIag
37
( Back to Top )
Irrigation / Tile Drain Management
Activities
• Review the Irrigation / Tile Drain Management category selection requirements. An Irrigation / Tile Drain Management category selections are optional and the initial default selection values are 'No irrigation (0%)' and 'No Tile Drain (0%)' (see Example 1 below).
• Make a selection for Irrigation. • Make a selection for Tile Drain.
Overview This is the Irrigation / Tile Drain Management category.
Irrigation is used to supplement rainfall for successful crop production. There is no indication how irrigation could influence the overall quality of water from an agricultural field. In addition, the irrigation methods could influence the runoff and its quality differently based upon field slope and its soil physical properties such as slope, organic matter (OM) content and rain pattern. For example, surface irrigation on level basins with blocked ends will not affect to the aggregated seasonal runoff from agricultural field.
On the other hand, irrigation using wild flooding could add significantly to the seasonal runoff water quality. It is mainly due to uncertain and unpredictable rainfall patterns. At the tail end of a dry spell if the producer decides to irrigate and saturates a field; it would generate much higher runoff from a rainfall event than another adjacent field that did not get any irrigation -- thus leading to lower WQIag# value. However, the magnitude of the negative impact of irrigation on WQIag# could vary significantly depending on the method of irrigation.
Make a selection from each of the following:
Irrigation - Select the Irrigation from the list (see Example 2 below).

Runoff Water Quality Index (WQIag)
38
The magnitude of the negative impact (percentage used for reducing the WQIag# value) of irrigation on the WQIag# can vary significantly depending on the method of irrigation.
Tile Drain - Select the Tile Drain from the list (see Example 3 below).
The selection of a Tile Drain method can have an effect on the Nutrient Management Factors, Tillage Management Factors and Pest Management Factors (NTP) category calculated weight values.
The magnitude of the positive or negative impact (percentage used for increasing or reducing the NTP category calculated weight values) of a Tile Drain selection on the NTP category calculated weight values can vary significantly depending on the Tile Drain method selected.
Example 1: Category selections for Irrigation / Tile Drain Management:
( Back to Top )
Example 2: Selection list for Irrigation:
( Back to Top )

Using WQIag
39
Example 3: Selection list for Tile Drain:
( Back to Top )
Conservation Practices
Activities
• Review the optional Conservation Practices category selection requirements. Conservation Practice category selections are optional and the initial default # selected value is zero (see Example 1 below).
• Make up to 3 Conservation Practices selections.
See Definitions for an explanation of each of the Conservation Practices.
Overview This is the Conservation Practices category:
Click the Get Conservation Practice(s) button to open a pop-up window allowing you to select up to 3 Conservation Practices (see Example 2 below).
Note: See Other Resources for additional information.
Example 1: Conservation Practices and Get Conservation Practice(s) button on main page:

Runoff Water Quality Index (WQIag)
40
( Back to Top )
Example 2: Selection window for Conservation Practices:
( Back to Top )
Definitions
Practice Name NRCS Code Description
Conservation Cover
327 The establishment and maintenance of permanent vegetative cover on retired agricultural land or highly erodible land.
Contour Buffer 332 Strips of permanent vegetation

Using WQIag
41
Strip established on a field’s contour to reduce erosion, slow sediment transport and reduce runoff.
Contour Stripcropping
585
A planting system in which crops are grown in an alternating pattern with fallow strips of equal width to reduce soil erosion and water degradation.
Field Borders 386 Permanently vegetated borders established around fields and pastures to reduce soil erosion.
Field Stripcropping
586 A planting system in which crops are grown in alternating strips with grasses to reduce soil erosion and runoff.
Filter Strip 393
Strips of vegetation located between cropland, grazing land or disturbed areas and water sources to protect water quality.
Grassed Waterway
412
Natural or constructed grass channels established within a field to slow the flow of water, re-direct excess water from fields and to prevent soil erosion.
Riparian Forest Buffer
391 Use trees or shrubs to reduce sediment, organic matter, nutrients and pesticides in surface runoff alongside watercourses.
Sediment Basin 350
Water and Sediment Control Basins
638
An impoundment constructed to temporarily capture runoff, trap sediment, reduce soil erosion and improve water quality.
Tailwater Recovery System
447 A water recovery system designed to collect, store and transport tailwater for reuse in an irrigation system.
( Back to Top )
Project Files
Activities
• Open an existing WQIag project file.

Runoff Water Quality Index (WQIag)
42
• Save user inputs / selections to a new WQIag project file. The WQIag project file extension is: wqiproj (e.g. a project file named 'FieldOne' would have a complete file name of: FieldOne.wqiproj).
• Save user inputs / selections to another project file name (Save As).
Overview Using a project file in WQIag is optional. You can save user inputs / selections to a project file or open a previously saved project file to restore user inputs / selections:
Project file: - The optional Project file: value is set to '(none)' and can be found toward the bottom of the WQIag main page (see Example 1 below).
Open - Click the Open button to load a previously saved project file (see Example 2 below).
Close - Click the Close button to close an open project file (see Example 3 below). If changes were made to the open project file, a warning message will display.
Save - Making a change in WQIag will cause the Save button to appear. To save inputs / selections to a project file, click the Save button. Enter a Save in: location and a File name: (see Example 4 below).
Save As - To save inputs / selections to an existing or another project file, click the Save button. Enter a Save in: location and the existing or different File name: (see Example 4 below).
Example 1: Project file: location and initial value:
( Back to Top )
Example 2: To Open a WQIag project file:
1. Click the Open button to see the Open dialog screen.

Using WQIag
43
2. Identify a Look in: location (e.g. Temp1)
3. Select a File name: (e.g. FieldOne.wqiproj).
4. Click the Open dialog screen Open button. The Project file: value will show the now opened file name and the Close button appears.
5. You can open a project file when the Open button and Save button are present. A warning message (see below) will display allowing you to continue without saving your previous changes.

Runoff Water Quality Index (WQIag)
44
( Back to Top )
Example 3: To close a WQIag project file:
1. Click the Close button to close the opened file and return to the '(none)' value.
2. If changes were make after the project file was opened, the Close button and the Save button will appear (see below). A warning message (see below) will display when changes were made and you attempt to close an open project file.

Using WQIag
45
( Back to Top )
Example 4: To Save a project file:
1. Click the WQI Save button to see the Save As dialog screen.
2. Identify a Save in: location (e.g. Temp1)
3. Enter a File name: (e.g. FieldOne).
4. Click the Save As dialog screen Save button.
Example saving changes to a new project file or open a project file:
Example saving changes to an opened project file or close the project file:
Example saving changes to a new project file named 'FieldFour':

Runoff Water Quality Index (WQIag)
46
Example saving changes to an existing project file named 'FieldOne':
Warning message when saving to an existing project file:

Using WQIag
47
( Back to Top )


49
Reports
Introduction The Water Quality Index for Runoff from Agricultural Fields (WQIag) produces a report when all required fields have been entered and a WQIag# value has been calculated. Use the Report button at the bottom right-side of the WQIag main page to access the pop-up Report window.
Overview From the main page, click the Report button (see Example 1 below) to view the WQIag Report pop-up window.
If all required fields have not been entered or a WQIag# value has not been calculated, a message will display showing what information is still required (see Example 2 below).
When all required fields have been entered and a WQIag# value has been calculated, a WQIag Report pop-up window will show the report (see Example 3 below).
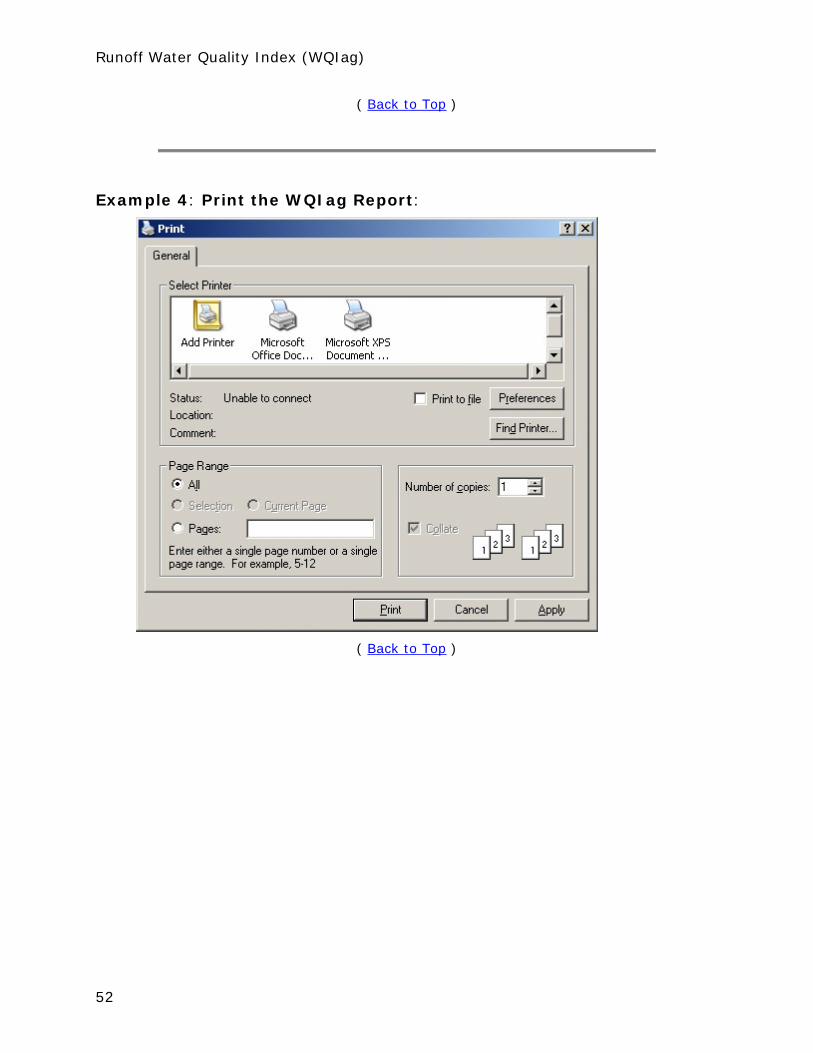
Click the Print button (bottom right-side) to select a printer and print the WQIag report (see Example 4 below).
Example 1:Report button location on main page:
( Back to Top )
Example 2: Report: button requirements message:

Runoff Water Quality Index (WQIag)
50
( Back to Top )
Example 3: WQIag Report:

Reports
51
Runoff Water Quality Index (WQIag)
52
( Back to Top )
Example 4: Print the WQIag Report:
( Back to Top )