rural manitoba youth facing barriers project: final ... manitoba youth facing barriers project:...
TRANSCRIPT

2011
Rural Manitoba Youth Facing Barriers Project: Final Research Report
Rural Manitoba Youth Facing Barriers Project: Final Research Report
Centre for Aboriginal and Rural Education Studies Page 2
Rural Manitoba Youth Facing Barriers Project: Final Research Report
Centre for Aboriginal and Rural Education Studies Page 3
Rural Manitoba Youth Facing Barriers Project:
Final Research Report
September 2011
Written by:
Karen Rempel, Ph.D. Coordinator, Centre for Aboriginal and Rural Education Studies (CARES), Faculty of Education, Brandon University
With contributions from:
Cara Ellingson, M.Ed., Research Affiliate, CARES, Brandon University George Lancaster, B.Sc. (Hons.). (graduate student), Faculty of Education, Brandon
University Alex Michalos, C.M., Ph.D., D.Litt., F.R.S.C., adjunct professor, Faculty of Arts,
Brandon University Sheryl Moose, B.A., B.Ed. (graduate student), Faculty of Education, Brandon
University Diane Novak, M.Sc., Research Affiliate, CARES, Brandon University
Rural Manitoba Youth Facing Barriers Project: Final Research Report
Centre for Aboriginal and Rural Education Studies Page 4
Acknowledgements
The CARES project team extend special thanks to following community researchers,
sponsoring organizations, and Service Canada managers and program officers (PO)
for their dedication and generous contributions to this project.
Service Canada Community researchers and sponsoring
organizations
Gina Chartier-Jacques, PO, Portage La Prairie
Gordie Crate, PO, Thompson
Michelle Dearborn, PO, Interlake
Brigitte Hebert Gosselin, PO, St. Pierre Jolys
Natalie Henderson, PO, The Pas
Jason Kurchaba, Manager, Manitoba (MB)
Rural Programs
Roderick Meade, PO, Brandon
Wendy McCannel, PO, Brandon
Velma McCombie, Senior Development
Officer, MB Rural Programs
Ashley Schrader, PO, Brandon
Elvi Shanks- Team Leader, MB Rural
Programs
Linda Theriault, PO, Steinbach
Cindy Tucker, PO, Brandon
Susan Grandbois (Res.)Dauphin Friendship
Centre, Dauphin
Renee Kastrukoff (Res.) The Pas Family
Resource Centre, The Pas
Danielle Kirton (Res.) Options Employment
Services for Youth, Interlake Region,
Steinbach
Marci Lyon (Res.), Flin Flon Friendship
Centre, Flin Flon
Tammy Lee Marche (Res.) BullMarket
Consulting, Thompson
Lori-Ann Munro (Res.) Swan River
Friendship Centre, Swan Valley
Kyla Murray (Res.), Steinbach Chamber of
Commerce, Steinbach
Yvonne Peters and Aggie Buhler (Res.)
Pembina Region Development
Corporation, Altona
Linda Phillips (Res.) Prairie Skills Inc.
Southwest Manitoba
Laura Poppel (Res.) Brandon Career and
Employment Youth Services and the
Brandon Optimist Club, Brandon
Janet Shindle (Res.) Service Ability Mobility
(SAM), Inc. Portage La Prairie
Rural Manitoba Youth Facing Barriers Project: Final Research Report
Centre for Aboriginal and Rural Education Studies Page 5
Executive Summary
According to the International Labour Organization (2006), both developing and developed
economies are faced with the task of creating decent and sustainable jobs for the large cohort of
young men and women entering the labour market every year. Closer to home, youth employment
figures prominently for many rural and northern Manitoba communities as they face the
persistence challenge of economic and social development. First Nations communities or
communities with high Aboriginal populations face additional barriers including lack of economic
opportunities, remoteness, living conditions and limited access to educational opportunities. .
Service Canada, the funder of this project, has long recognized that a failure to successfully
integrate young people into the labour market has broad consequences for health, social,
environmental well-being and economic prosperity. To this end, many of the programs supported
by Service Canada are aimed at youth. Youth facing barriers are a sub-group of the overall youth
population. This sub-group, aged 15-30, is characterized by (a) limited or no participation in the
workforce and by (b) a lack of educational achievement.
The Rural Manitoba Youth Facing Barriers Project was aimed at expanding (1) knowledge about
rural Manitoba youth facing barriers and (2) the capacity of rural and northern communities and
regions to address the needs of this sub-group. The major activities of the project included data
collection through youth and employer surveys; capacity-building through two workshop sessions
and on-going support; the involvement of local youth advisory committees; and finally,
community-based consultations that concluded with the development of 5-year action plans for
each of the 12 participating communities or regions.
This report presents an analytical starting block for youth facing barriers including the key findings
and aggregate analysis of (a) more than 1700 surveys from youth facing barriers living in 12 rural
and northern communities or regions in Manitoba and (b) approximately 500 surveys from
employers in these communities. The report begins with a presentation of the importance of youth
in the workforce and some key concepts of significance to individuals, communities and
organizations involved with these youth. These concepts are linked to the major findings from the
youth and employer surveys. These key findings include individual factors such as the lack of high
school completion, high levels of youth mobility, and the number of youth with dependent children.
They also include community factors such as inclusion in social networks and structural factors such
as youth and employer awareness of, and participation in programs and services.
There is no question that the reasons behind the lack of workforce participation or educational
achievement are complex. Even so, it is clear that youth facing barriers need the right foothold
from which to achieve incremental successes in the workforce or education. Without this foothold,
young people are less able to make choices that will improve their own job prospects and those of
their children. This report, therefore, adds urgency to the goals and objectives that have been
identified in the 5-year community and regional plans. Individually and collectively these plans are
aimed at giving youth facing barriers a chance to make the most of their productive potential
through education or sustainable employment.

Rural Manitoba Youth Facing Barriers Project: Final Research Report
Centre for Aboriginal and Rural Education Studies Page 6
Table of Contents
Scope of the Project .. . . . . . . . . . . . . . . . . . . . . . . . . . . . . . . . . . . . . . . . . . . . . . . . . . . . . . . . . . . . . . . . . . . . . . . . . . . . . . . . . . . . . . . . . . . . . . . . . . . . . . . . . . . . . . . . . . . . 9
Role of BU CARES ..................................................................................................................................................... 9
Role of the community sponsor organizations ............................................................................................ 9
Project goal ................................................................................................................................................................. 9
Objectives of the project ....................................................................................................................................... 9
Time frame of the project ................................................................................................................................... 10
Major outcomes of the project ......................................................................................................................... 10
Connecting comments ......................................................................................................................................... 11
Data Collection, Analysis and Development of Community Plans .. . . . . . . . . . . . . . . . . . . . . . . . . . . . . . . . . . . 12
Data collection......................................................................................................................................................... 12
Project definition of youth facing barriers .................................................................................................. 12
Selection of participants ..................................................................................................................................... 13
Data analysis ............................................................................................................................................................ 14
Role of the youth advisory committees ........................................................................................................ 14
Development of the 5-year community plans ............................................................................................ 15
Connecting comments ......................................................................................................................................... 15
The Importance of Youth Employment and Education ... . . . . . . . . . . . . . . . . . . . . . . . . . . . . . . . . . . . . . . . . . . . . . . . . . . . . 16
A profile of youth facing barriers .................................................................................................................... 16
The importance of youth in the workforce ................................................................................................. 16
Barriers in the labour market for youth ....................................................................................................... 18
Suggested structural supports to address supply and demand barriers ....................................... 19
Predictive factors for unemployment and lack of education ............................................................... 19
Risk level of predictive factors ......................................................................................................................... 21
Connecting comments ......................................................................................................................................... 22
Capacity-building Factors .. . . . . . . . . . . . . . . . . . . . . . . . . . . . . . . . . . . . . . . . . . . . . . . . . . . . . . . . . . . . . . . . . . . . . . . . . . . . . . . . . . . . . . . . . . . . . . . . . . . . . . . 23
Individual capacity-building factors .............................................................................................................. 23
Community-based capacity-building ............................................................................................................. 26
Structural supports ............................................................................................................................................... 27
Connecting comments ......................................................................................................................................... 30
Major Findings from the Youth and Employer Surveys .. . . . . . . . . . . . . . . . . . . . . . . . . . . . . . . . . . . . . . . . . . . . . . . . . . . . . 31
Key findings from the demographic data..................................................................................................... 31
Significant community-based factors affecting youth with barriers ................................................ 34

Rural Manitoba Youth Facing Barriers Project: Final Research Report
Centre for Aboriginal and Rural Education Studies Page 7
Main considerations for structural supports ............................................................................................. 35
Connecting comments ......................................................................................................................................... 36
Community Priorities .. . . . . . . . . . . . . . . . . . . . . . . . . . . . . . . . . . . . . . . . . . . . . . . . . . . . . . . . . . . . . . . . . . . . . . . . . . . . . . . . . . . . . . . . . . . . . . . . . . . . . . . . . . . . . . . 37
Connecting comments ......................................................................................................................................... 38
Recommendations .. . . . . . . . . . . . . . . . . . . . . . . . . . . . . . . . . . . . . . . . . . . . . . . . . . . . . . . . . . . . . . . . . . . . . . . . . . . . . . . . . . . . . . . . . . . . . . . . . . . . . . . . . . . . . . . . . . . . . 39
Expand research and knowledge .................................................................................................................... 39
Increase the effectiveness of structural supports .................................................................................... 39
Encourage the on-going involvement of stakeholders ........................................................................... 40
References .. . . . . . . . . . . . . . . . . . . . . . . . . . . . . . . . . . . . . . . . . . . . . . . . . . . . . . . . . . . . . . . . . . . . . . . . . . . . . . . . . . . . . . . . . . . . . . . . . . . . . . . . . . . . . . . . . . . . . . . . . . . . . . . . . . 41
Appendix A - Youth Survey Results .. . . . . . . . . . . . . . . . . . . . . . . . . . . . . . . . . . . . . . . . . . . . . . . . . . . . . . . . . . . . . . . . . . . . . . . . . . . . . . . . . . . . . . . 43
Demographic Information .................................................................................................................................. 43
Education and Training ....................................................................................................................................... 49
Employment Experience ..................................................................................................................................... 51
Experience with Employers .............................................................................................................................. 54
Community Involvement .................................................................................................................................... 56
Education, Training and Employment Services ........................................................................................ 58
Looking Ahead ........................................................................................................................................................ 60
Personal and Life Skills ....................................................................................................................................... 61
Appendix B - Employer Survey Results .. . . . . . . . . . . . . . . . . . . . . . . . . . . . . . . . . . . . . . . . . . . . . . . . . . . . . . . . . . . . . . . . . . . . . . . . . . . . . . . . 65
Demographics and Workplace Characteristics ......................................................................................... 65
Hiring Experiences ................................................................................................................................................ 70
Education and Workplace Skills of Employees ......................................................................................... 71
Youth Employability Services for Employers and Employees ............................................................ 74
Rural Manitoba Youth Facing Barriers Project: Final Research Report
Centre for Aboriginal and Rural Education Studies Page 8

Rural Manitoba Youth Facing Barriers Project: Final Research Report
Centre for Aboriginal and Rural Education Studies Page 9
Scope of the Project
In October 2010, a number of sponsoring organizations from communities and
regions in rural and northern Manitoba undertook a series of activities aimed at
youth with multiple barriers, a sub-population between the ages of 15-30 who face
barriers to (a) employment and/ or (b) educational achievement.
The Centre for Aboriginal and Rural Education Studies (CARES) in the Faculty of
Education at Brandon University coordinated the overall project. Service Canada
provided funding support to the sponsoring organizations and to the CARES.
Role of BU CARES
The CARES had two roles. The first was to facilitate the research activities and
support the community sponsor organizations through all stages of the project. The
second was to prepare a final research report.
Role of the community sponsor organizations
The community sponsor organizations were the administrative bodies that were
responsible for completing the surveys, consulting with community stakeholders,
and developing community-based plans. Many of these organizations hired an
individual from the community to act as the community ‘research practitioner’ or
coordinator. The coordinators participated in workshops, distributed and collected
the surveys, presented the findings to the communities and finally, facilitated the
development of the 5-year community plans.
Project goal
The overall goal of the project was to identify the strengths and needs of youth
facing barriers in order to develop community-based action plans that would assist
these youth to participate in the workforce or complete their education.
Objectives of the project
For the community sponsoring organizations, the objectives of the project were to:
administer surveys to youth facing barriers and employers in the selected
communities;
establish youth advisory committees that would provide assistance and
advice throughout the project;
consult with key stakeholders on the findings from the surveys; and,
Rural Manitoba Youth Facing Barriers Project: Final Research Report
Centre for Aboriginal and Rural Education Studies Page 10
develop community-based action plans based on the findings from the
surveys and consultations with key stakeholders.
For CARES, the objectives of the project were to:
provide a workshop and on-going consultation that would develop youth
and employer community-based surveys;
develop the capacity of community-based research practitioners to select
participants and conduct the surveys in their communities;
facilitate a workshop that would develop the capacity of community-based
research practitioners to analyze and present findings from the surveys;
develop a common template for the community-based action plans;
encourage and support the process to develop community-based action
plans; and
prepare a summary of survey data and the community-action plans.
Time frame of the project
The time frame for the project was October 2010 to May 2011.
Major outcomes of the project
The major outcomes of the project were:
increased capacity at the community level to undertake community-based
research activities and to use this information to develop community-based
action plans;
baseline of information about youth facing barriers and employers in 12
rural and Northern Manitoba communities;
a comprehensive database of survey data consisting of more than 1700
completed surveys from youth facing barriers and 500 completed surveys
from employers;
evidence-based findings on youth facing barriers;
12 community-based action plans that provide information and direction for
addressing the needs of youth facing barriers; and,
a final research report that describes the process and outcomes.
The individual community plans and the final research report are available to the
public at http://www.brandonu.ca/bu-cares/.

Rural Manitoba Youth Facing Barriers Project: Final Research Report
Centre for Aboriginal and Rural Education Studies Page 11
Connecting comments
This section described the scope of the project including the purpose, roles,
objectives, and outcomes. An underlying challenge for everyone involved in the
project was the short time frame for the data collection (including finding the
participants, the community consultations, and the development of the individual
community plans) as well as this report. The project’s highly successful outcomes
including the legacy of baseline information and 12 community and regional plans
for youth facing barriers are solid evidence of the hard work of the community
sponsor organizations and the community research practitioners.
The next section outlines:
the data collection process;
the selection of participants;
data analysis process;
the role of youth advisory committees; and,
the development of the 5-year community plans.

Rural Manitoba Youth Facing Barriers Project: Final Research Report
Centre for Aboriginal and Rural Education Studies Page 12
Data Collection, Analysis and Development of Community Plans
The Rural Manitoba Youth Facing Barriers Project was comprised of (a) data
collection and analysis based upon a youth employment survey and an employer
survey in each of the communities or regions; and (b) the development of a
community-based action plan for youth facing barriers in each of the communities
or regions.
BU CARES was responsible for the overall coordination of the research activities and
the development of the 5-year community plans. These activities included:
approval of the Brandon University Ethics Review Committee;
development of two survey instruments and the data collection process with
input from the sponsor organizations and the community research
practitioners;
establishment of timelines and targets; and,
general oversight and consultation services for the data collection, data
analysis and reporting of findings.
Data collection
A primary objective of this project was to gather information on (a) the sub-
population referred to as youth facing barriers, and (b) employers in each of the
communities or regions participating in the project.
In November 2010, BU CARES facilitated a workshop for the community sponsor
organizations, the community research practitioners and Service Canada program
officers and managers. The purpose of the workshop was to discuss the intent of the
project, review operational details of the project, and finally, refine the youth and
employer survey instruments.
In addition to these discussions, the participants also clarified (1) the definition for
population referred to as youth facing barriers and (2) processes to select
participants for the youth and employer surveys including appropriate and ethical
data collection practices.
Project definition of youth facing barriers
For the purposes of this project, there were a number of specific characteristics of
the youth facing barriers. These were youth who were:
between 15 and 30 years of age;
in need of assistance to overcome barriers to employment;
out of school;
Rural Manitoba Youth Facing Barriers Project: Final Research Report
Centre for Aboriginal and Rural Education Studies Page 13
a Canadian citizen, permanent resident or person with refugee status; and
legally entitled to work according to the relevant provincial/territorial
legislation and regulations.
Selection of participants
The community sponsoring organizations and the community research practitioners were responsible entirely for selecting the participants for each of the surveys in their community or region.
Youth participants
In general, the participants for the youth survey were youth living in the community or region between the ages of 15 and 30 who were not in school or who were not employed on a consistent basis.
Other determining criteria for youth facing barriers included:
• high school non-completion;
• disability;
• Aboriginal origin;
• visible or ethnic minority;
• health, drug and/or alcohol-related problems;
• residence in a rural or remote location;
• lone (single) parent;
• low levels of literacy and numeracy;
• language barriers;
• street involvement;
• contact with justice, child welfare or social assistance systems;
• homeless or at-risk of becoming homeless;
• lack of social supports: family, friends or community supports;
• poor self-management and/or behaviour management abilities.
Employer participants
The participants for the employer survey were employers with business or services
in the community or region.
Targets for the number of surveys
It was, and continues to be, difficult to determine the size of the total population
defined as youth with barriers. In large part, this population tends to be a hidden
population because they may not be involved in any type of social support,

Rural Manitoba Youth Facing Barriers Project: Final Research Report
Centre for Aboriginal and Rural Education Studies Page 14
employment or educational programs. In addition they may be transient with no
fixed address.
Therefore, the community sponsor organizations and the community research
practitioners were directed to collect as many surveys as possible from youth in the
community that met the above criteria. In other words, neither the CARES nor
Service Canada, as the funding organization, set targets for the number of youth
surveys.
The target for the employer survey was also not set. However, as a general
guideline, the organizations and research practitioners were asked to concentrate
their efforts primarily on identifying and locating youth participants for the survey.
Ultimately, more than 1700 youth surveys and more than 500 employer surveys were completed and analyzed.
Data analysis
The community sponsor organizations and the community research practitioners
were given about 3 months to undertake the youth and employer surveys. The
CARES prepared a codebook for data entry of the surveys. After the completion of
the data collection, each community research practitioners used the codebook to
‘clean’ and enter the results into a spreadsheet. The CARES then completed the data
analysis.
In February 2011, the CARES facilitated a second workshop. The purpose of the
second workshop was to develop the skills of the community organizations and
research practitioners to use the baseline information gathered from the surveys in
order to identify the strengths, needs and future actions aimed at youth facing
barriers. This baseline information provided critical information to the youth
advisory committees and to a variety of community stakeholders. More
importantly, the information was used as part of the community consultation
process and provided the foundation for the development of each of the 5-year
community plans.
The complete set of consolidated data is located in Appendix A and B.
Role of the youth advisory committees
As a requirement of Service Canada funding support, each community sponsor
organization established a youth advisory committee to provide guidance,
assistance with the identification of youth facing barriers in the community, and
consultation in the development of the 5-year community plans.

Rural Manitoba Youth Facing Barriers Project: Final Research Report
Centre for Aboriginal and Rural Education Studies Page 15
Development of the 5-year community plans
The CARES also helped the community sponsor organizations develop 5-year
community plans by developing and a common report template and by providing
on-going guidance on the community consultation process. Ultimately, the
development of each of the 5-year community plans fell to the community sponsor
organizations, the community research practitioner and members of the youth
advisory committee.
Connecting comments
The two main components of this project were (1) data collection and analysis
based on youth and employer surveys; and (2) the development of 5-year
community plans.
The CARES provided overall coordination of both of these components. However,
the active participation of the community sponsor organizations, the community
research practitioners, and members of the youth advisory committees was
essential for the successful completion of this project.
Prior to putting forward the major research findings that emerged from the surveys
and the main priorities from the 5-year community plans, it is important to discuss,
in general terms, the importance of youth employment and education. The next
section presents a brief profile of:
youth facing barriers;
the importance of youth in the workforce;
barriers to the labour market;
predictive factors; and,
the risk level of the predictive factors.

Rural Manitoba Youth Facing Barriers Project: Final Research Report
Centre for Aboriginal and Rural Education Studies Page 16
The Importance of Youth Employment and Education
The purpose of this section is to gain a better understanding of the importance of youth participation in the workforce or in educational achievement. It begins by a short profile of this sub-group of the working age population.
A profile of youth facing barriers
Youth facing barriers is a comprehensive term that describes a sub-group of the
working age population that are (a) between the ages of 15 and 30, (b) unable or
unwilling to participate regularly and/or fully in the workforce or in education and
training programs leading to participation in the workforce.
The notion of ‘barriers’ is based on the proposition that the individuals in this group
are unable to fully integrate into the labour market or further education without
structural supports such as capacity-building programs, financial support and social
assistance (International Labour Office, [ILO], 2006).
According to the ILO (2006), youth facing barriers also include young people who
find themselves in situations where they are under-employed or inadequately
employed. These situations are defined by a number of qualitative characteristics
such as low or ‘under the table’ wages, limited hours of work, job security, poor use
of one’s skills, unreasonable schedules of work, lack of benefits, workplace
harassment, and ineffective or inadequate job training.
As a group, youth facing barriers are particularly vulnerable in times of economic
recessions or depressions. They tend to be the most severely affected by lay-offs or
a deficit of decent work opportunities (ILO, 2010). As a result, they either stop
looking for work or simply bide their time hoping that conditions will eventually
improve.
Whether unemployed, under-employed or inadequately employed, youth facing
barriers to workforce or education participation are susceptible to poverty,
interrupted employment patterns, social alienation, and criminal activities (ILO,
2006).
The importance of youth in the workforce
For most adults, our involvement in productive work during our adult years
consumes the largest portion of our life. More importantly, the significance of work
over a lifetime is critical for our adult development, our individual identity and our
self-efficacy (Hoare, 2006).
In addition to setting the foundations for these critical human qualities, youth
unemployment and situations in which young people give up on the job search or
Rural Manitoba Youth Facing Barriers Project: Final Research Report
Centre for Aboriginal and Rural Education Studies Page 17
work under inadequate conditions incur costs to the economy, to society and to the
individual and their family (ILO, 2006). As a group, they do not contribute to the
economic welfare of a community. For example, they are not likely to accrue
savings which in turn can be aggregated to the larger society, and they often depend
on family support leaving less for others to spend or invest. In later life, they
continue to burden their families since they have not contributed to these income
support programs such as the Canada Pension Plan. Furthermore, these costs grow
exponentially from generation to generation (ILO, 2006).
In addition to costs, there are many other impacts of youth unemployment and lack
of educational achievement that extend to the broader society. For example:
A lack of decent work, if experienced at an early age, often permanently
compromises a person’s future employment prospects and frequently leads to
unsuitable labour behaviour patterns that last a lifetime (ILO, 2006).
As a result of the lack of participation in the workforce, youth facing barriers are
not only weaker as workers, but are also weaker as contributing members to
their communities (ILO, 2006). In other words, they often do not exercise their
democratic rights as citizens and they may be excluded from their rights as
workers.
Employment vulnerability among youth facing barriers also may lead to their
loss of identify, self-efficacy, social exclusion, poverty, idleness, poor health and
lifestyle choices and potential attraction to illicit activities. These youth often
develop feelings of frustration with their situation and may resort to directing
their frustration on the larger society through civic unrest and upheaval.
Overtime, these grievances build-up and vulnerable youth lose faith in the
system of governance that they feel has failed to live up to their expectations
(Hoare, 2006; ILO, 2006).
In Canada, youth participation in the workforce is needed to replace our rapidly
ageing workforce. Currently, for every five Canadians of working age, there is
one person of retirement age. Within the next 15 years there will be four
working Canadians to one person of retirement age. By 2050, Statistics Canada
(2007) predicted that there will be 2.5 working Canadians to one person of
retirement age.
As fewer, highly-skilled young people enter the workforce, the training needs of
the existing workforce changes. Workforce development thus shifts from
encouraging innovation and creativity to continuous training on essential and
immediate workplace needs. These additional training needs add a
considerable expense to business operations and diminish competitive
advantages (Statistics Canada, 2007).
Youth facing barriers do not provide a return on investment in education
funding and their lifestyle activities increase costs to the health, social services
and justice systems (ILO, 2006).

Rural Manitoba Youth Facing Barriers Project: Final Research Report
Centre for Aboriginal and Rural Education Studies Page 18
Finally, the lack of youth participation in the workforce has serious negative
consequences for the next generation - their own children. Youth facing barriers
to workforce participation and educational achievement cannot act as mentors
and role models and do not earn enough to lift themselves and their families out
of poverty.
Barriers in the labour market for youth
Firstly, the difference between workforce and labour market warrants mention. Workforce refers to the given or potential number of workers for employment purposes. The term ‘labour market’ refers to the supply of and demand for workers. The labour market takes into consideration the current conditions of the workforce and the needs of employers and of individuals looking for work.
The ILO (2010) identified four labour force supply and demand barriers that are unique to youth, as well as several interventions to address these barriers. A brief discussion of each of these follows.
Supply and demand barriers
1. BARRIERS DUE TO TECHNICAL AND NON-TECHNICAL SKILLS
On the supply side, there are barriers in technical and non-technical skills that limit the potential of youth to find employment due to adequate workplace competencies. These barriers include technical skills (such as specific training and skills) as well as non-technical skills (such as literacy, life skills, interpersonal skills and lack of initiative).
2. BARRIERS IN INFORMATION
These barriers are the gaps in information between youth seeking employment and the employers demanding employees. The gaps are generated by both sides. For example, both youth and employers may be guilty of inadequate or inappropriate job matching and poor signaling of their expectations.
3. BARRIERS DUE TO LABOUR DEMAND
According to the ILO (2010) there are a number of barriers on the demand side that work against youth. These include slow, insufficient or jobs that are not conducive to high numbers of employers. These barriers in the demand side are particularly demoralizing to youth as they become on-lookers and not participants in economic growth (ILO, 2010). These barriers are illustrative of the well-documented discrimination against youth labour based on their lack of job experience or insufficient exposure to a positive working environment. Casual, part-time and seasonal labour demands exacerbate these circumstances.
Rural Manitoba Youth Facing Barriers Project: Final Research Report
Centre for Aboriginal and Rural Education Studies Page 19
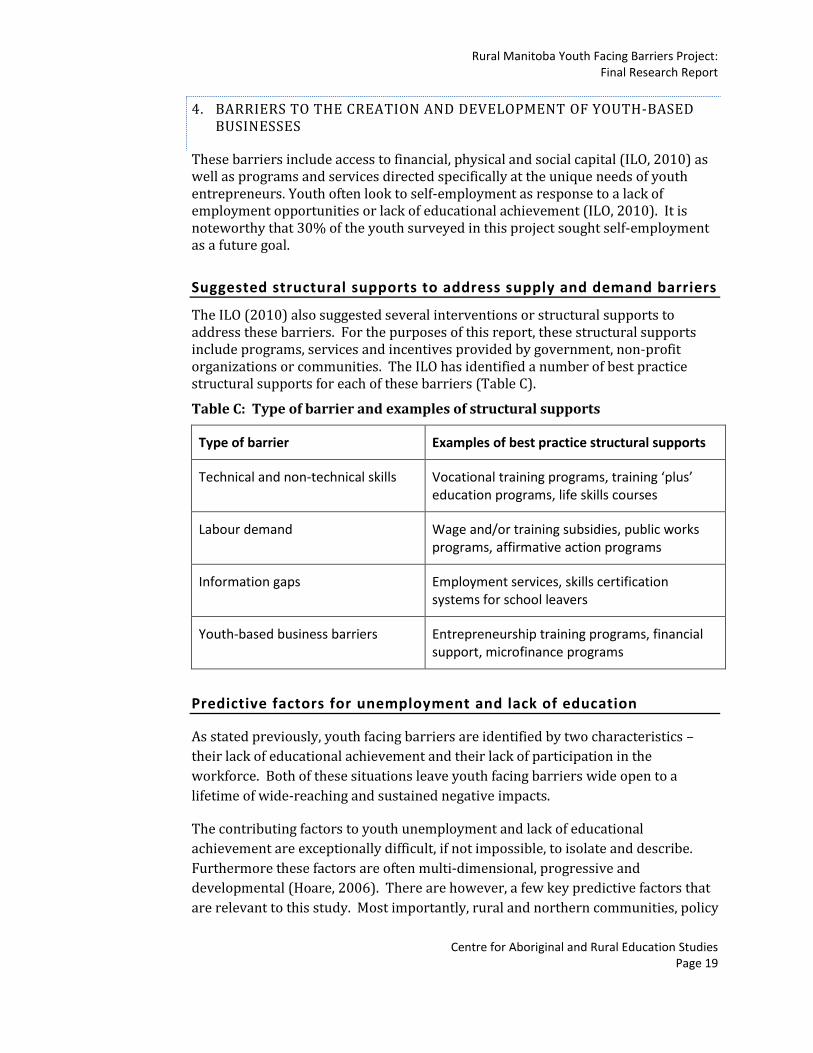
4. BARRIERS TO THE CREATION AND DEVELOPMENT OF YOUTH-BASED BUSINESSES
These barriers include access to financial, physical and social capital (ILO, 2010) as well as programs and services directed specifically at the unique needs of youth entrepreneurs. Youth often look to self-employment as response to a lack of employment opportunities or lack of educational achievement (ILO, 2010). It is noteworthy that 30% of the youth surveyed in this project sought self-employment as a future goal.
Suggested structural supports to address supply and demand barriers
The ILO (2010) also suggested several interventions or structural supports to address these barriers. For the purposes of this report, these structural supports include programs, services and incentives provided by government, non-profit organizations or communities. The ILO has identified a number of best practice structural supports for each of these barriers (Table C).
Table C: Type of barrier and examples of structural supports
Type of barrier Examples of best practice structural supports
Technical and non-technical skills Vocational training programs, training ‘plus’ education programs, life skills courses
Labour demand Wage and/or training subsidies, public works programs, affirmative action programs
Information gaps Employment services, skills certification systems for school leavers
Youth-based business barriers Entrepreneurship training programs, financial support, microfinance programs
Predictive factors for unemployment and lack of education
As stated previously, youth facing barriers are identified by two characteristics –
their lack of educational achievement and their lack of participation in the
workforce. Both of these situations leave youth facing barriers wide open to a
lifetime of wide-reaching and sustained negative impacts.
The contributing factors to youth unemployment and lack of educational
achievement are exceptionally difficult, if not impossible, to isolate and describe.
Furthermore these factors are often multi-dimensional, progressive and
developmental (Hoare, 2006). There are however, a few key predictive factors that
are relevant to this study. Most importantly, rural and northern communities, policy

Rural Manitoba Youth Facing Barriers Project: Final Research Report
Centre for Aboriginal and Rural Education Studies Page 20
makers and program providers should consider these factors as early warning flags
for interventions. .
Contributing factors to lack of educational achievement
There are a number of contributing factors that lead to youth leaving school early
(Atlantic Evaluation Group, 2010; Israel & Beaulieu, 2004). Some of these are:
clustering of low socio-economic living conditions;
lack of role models;
high proportion of Aboriginal students in classrooms;
Aboriginal males;
mobility and frequency of moves;
physical, mental, emotional and social disabilities;
availability of appropriate resources and opportunities;
family structures;
family history of education; and, in particular,
the on-going lack of educational success.
Youth unemployment includes the persistent difficulties that these youth have in (a)
fully participating in the workforce or (b) if working, being susceptible to
undesirable working conditions including wages, hours of work, workplace
harassment and workplace safety (Atlantic Evaluation Group, 2010; ILO, 2006).
The contributing factors for youth unemployment include:
lack of education;
family history of unemployment;
Aboriginal male;
child care demands;
inadequate job-skills and limited or no opportunity for meaningful workplace
training;
unsatisfactory employment conditions, as determined by the hours or work,
inadequate remuneration, poor use of one’s skills, lack of security, and lack of
benefits;
limited access to or availability of decent employment opportunities;
low-skill level, seasonal or casual employment; and
limited or no economic growth and development in the community.

Rural Manitoba Youth Facing Barriers Project: Final Research Report
Centre for Aboriginal and Rural Education Studies Page 21
Risk level of predictive factors
As stated above there are a number of reasons leading to a lack of participation in
the workforce and/or lack of educational achievement. At the same time, not all
factors have the same amount of risk to youth facing barriers.
As illustrated in Figure 1, these predictive factors vary in the extent of their impact.
The factors at the top of the list are:
lack of education;
lack of skills;
discouragement from lack of educational or employment success;
family history; and,
being an Aboriginal male (Atlantic Evaluation Group, 2010; ILO, 2006).
Figure 1: Risk level of predictive factors
High risk
level
Low risk
level
Lack of education Lack of skills Discouragement Family history Aboriginal male Minor to moderate physical disability Children or family responsibilities
Rural Manitoba Youth Facing Barriers Project: Final Research Report
Centre for Aboriginal and Rural Education Studies Page 22
Connecting comments
This section of the report draws attention to the importance of youth participation
in employment and education. For example, the current and future economic costs
expose the wider society to greater burdens of support and threaten the supply of
the future workforce. Another serious concern is the perpetuation of these patterns
into the next generation – the children of these youth.
The following section of this report describes a few key concepts or capacity-
building factors that can assist individuals, communities and service or program
providers. These capacity-building factors are presented as:
individual capacity-building factors;
community-based capacity building factors; and
capacity-building factors linked to structural supports.

Rural Manitoba Youth Facing Barriers Project: Final Research Report
Centre for Aboriginal and Rural Education Studies Page 23
Capacity-building Factors
The factors that contribute to youth unemployment and lack of educational
achievement are complex, multi-layered and place-bound within individual
community contexts. Furthermore, these factors can be limiting or can be capacity-
building factors.
Limiting factors interfere with the ability of youth facing barriers to participate in
the workforce or achieve educational success. These factors include physical and
mental disabilities, drug and alcohol addiction, risky behaviours or criminal
activities. These limiting factors - while extensive and arguably the most influential
factors on the ability of youth facing barriers to gain work or finish school – were
not collected as part of the youth surveys conducted in the 12 rural and northern
communities and regions.
In contrast, capacity-building factors are intended to increase the potential of youth
facing barriers to participate in the workforce or achieve educational success.
Communities, institutions, decision-makers and program managers use capacity-
building to develop program activities and address needs.
The Youth Facing Barriers Project was aimed at capacity-building factors. A few key
capacity-building factors emerged from the youth and employer surveys. They are
presented below and have been organized into (a) individual capacity-building
factors, (b) community-based capacity-building factor; and (c) structural supports.
Readers should note that all of these capacity-building factors can and should
interact with each other.
Individual capacity-building factors
Self-efficacy, personal identity and the exercise of free-will are three individual
capacity-building factors that have potential to address the needs of individual
youth facing barriers.
Self-efficacy
There is a great deal behind the meaning, ‘Life happens!’ Throughout our lives, we
strive to exercise control over a variety of circumstances and events that make up
our lives. By exerting influence in different areas of our thinking or actions, we can
take some control over challenging and stressful circumstances. Through our
individual self-efficacy we are better able to realize our desired futures, predict
events or misfortunes, delay undesirable outcomes or avoid mistakes (Bandura,
1997; Cervone, Artistico, & Berry, 2006).
Rural Manitoba Youth Facing Barriers Project: Final Research Report
Centre for Aboriginal and Rural Education Studies Page 24
The capacity to recognize, understand, make efforts to generate desirable outcomes,
or prevent undesirable consequences is a powerful incentive for developing and
using our self-efficacy, that is our inner strength and personal resiliency.
Self-efficacy is an overarching concept that describes an individual’s belief that he or
she has some measure of control in response to important life circumstances
(Bandura, 1997; Hammond & Feinstein, 2005). Self-efficacy is not the same thing as
self-confidence neither is it a measure of skills. Rather, it is our belief that we
possess the skills, motivation, and emotional resilience to deal with the variety of
life’s situations.
Self-efficacy has multiple benefits. For example, an individual’s self-efficacy plays a
critical role in educational and employment goals. I t also contributes to our
personal and social relationships (Bandura, 1997). For youth with barriers, self-
efficacy, and the experiences that build self-efficacy are particularly transformative.
For example, research by Hammond and Feinstein (2005) showed that real-world
experiences that exposed individuals to success-based, skill-building experiences
and knowledge acquisition made significant differences to adults who have been
chronically unemployed or who have low-levels of educational achievement.
Our capacity for individual self-efficacy is developed through the following types of
experiences (Bandura, 1997):
Knowledge and skill development: The development of knowledge, skills and
abilities (aka education achievement and skills training) make the most
significant contributions to self-efficacy. Collectively these become mastery
experiences and include setbacks, failures and errors in judgment. Knowledge,
skills and abilities are a large part of an individual’s perseverance particularly in
times of emotional, physical, financial and relational distress. Educational
achievement - no matter when in life it is achieved - is the major contributor to
individual self-efficacy.
Vicarious experiences: Observing and learning from the actions of others are
vicarious experiences. Many times these experiences are provided by
individuals whom we view as social models. These are individuals who are role
models and who are similar in terms of circumstances, life experiences and
abilities. These individuals have also succeeded by persistent effort. Bandura
(1997) asserted that our own self-efficacy is raised when we recognize
ourselves in others. Role models, mentors and Elders are extremely valuable to
building individual self-efficacy.
Social experiences: These are the situations in our lives when we are praised or
receive positive recognition by others. Far too often, youth facing barriers have
never been acknowledged with any type of positive recognition. It is no
coincidence that many students who drop out of school have negative social
experiences such as bullying or chronic academic failure. In contrast, success-

Rural Manitoba Youth Facing Barriers Project: Final Research Report
Centre for Aboriginal and Rural Education Studies Page 25
based, social and learning experiences are highly effective in contributing to
individual self-efficacy (Hammond & Feinstein, 2005).
Physical and mental well-being: These experiences are the range of activities
aimed at enhancing our physical and mental health. These experiences include
sports activities, wearing nice clothes and healthy lifestyles. They bolster
confidence and go a long way to overcome shyness or reluctance to participate
in the workforce or further education.
Identity
The second individual capacity-building factor is identity. Identity refers to the
sense of who we are as individuals and as contributors to society. Notably, identity
starts in adolescence and continues throughout our lifetime through conscious but
largely unconscious self-perception of ourselves as we try to integrate ourselves
with our social world. According to Erikson, our identity always develops and
evolves at the intersection of the personal and the social, cultural world (Erikson,
1980).
Employment or work, including parenting, consumes most of our adult life and
therefore has the most influence on how we develop our individual identity.
Without our personal identity we become inactive and invisible.
Our personal sense of identity is developed or conversely, is diminished in small bits
and pieces such as our job title, how we are addressed in public, and the treatment
we receive by others. It also includes the structures of everyday life such as
personal identification, a bank account or a mailing address.
Personal identity diminishes over time particularly for individuals who are
chronically unemployed or who have low levels of education. With the right
circumstances and incentives, individuals searching for a sense of personal identity
often seek social networks (aka gangs) engaged in undesirable or even criminal
behaviors (Sotiropoulos, 2005).
The exercise of free-will
Self-efficacy and identity can be developed and built through mastery of skills,
vicarious experiences, social recognition and physical and emotional support.
However, in spite of our best intentions to provide and build these opportunities for
groups like youth facing barriers, it ultimately remains up to the individual to
exercise his or her free-will (Hoare, 2006).
Free-will (also known as human agency) refers to the extent to which individuals
choose to use their cognitive and physical abilities to influence or control daily and
lifetime challenges. Human agency refers to power/control, actions and an
Rural Manitoba Youth Facing Barriers Project: Final Research Report
Centre for Aboriginal and Rural Education Studies Page 26
intentionality of purpose. The exercise of free-will is based upon an individual’s
personal beliefs in his or her capacity and ability (self-efficacy) and personal
attributes such as initiative, resourcefulness and persistence (Bandura, 1997).
Inasmuch as there is merit in the saying that ‘you can lead a horse to water but you
can’t make it drink!’ there is also merit in recognizing that free-will can be
manipulated through external influences. Financial rewards, quality of life
incentives, ‘sweat equity’ programs and micro-finance options can be particularly
effective with youth facing barriers (ILO, 2010).
Community-based capacity-building
As mentioned previously in this report, social exclusions is one of the most
persistent and pernicious outcomes of the lack of youth participation in the
workforce or educational opportunities. There is little doubt that social exclusion
has extensive ramifications to mental, social, physical and economic well-being to
individuals and to their families. For example, there is a proven link between youth
unemployment and the exclusion of these youth from social networks in
communities (Hoare, 2006; ILO, 2006).
The social exclusion of youth facing barriers exacerbates their sense of vulnerability,
increases marginalization and promotes idleness among youth facing barriers (ILO,
2006). In short, they become a hidden population that many times ‘fly under the
radar’ of the mainstream population. For example, in this project, the population
size of youth facing barriers in the communities and regions was unknown. The
reasons for this are that these youth are (a) inactive, and therefore not counted, as
participants in the labour force or in education programs; and (b) highly mobile and
transient. In short, many of these youth have disappeared from the statistical radar
and become hidden.
Social capital
For communities involved in this project, a major capacity-building factor that can
assist with this hidden population is development of social capital. Social capital
refers to the extent and type of an individual’s web of social relations or networks in
a community. These networks involve relationships, patterns of trust and
interaction, access to knowledge and beliefs, employment and support in times of
need and distress (Coleman, 1990).
Most importantly, the nature and strength of social capital in a community have
direct bearing on access to employment and to the educational attainment of youth
as well as in the creation of vibrant and sustainable communities (Israel & Beaulieu,
2004).
Rural Manitoba Youth Facing Barriers Project: Final Research Report
Centre for Aboriginal and Rural Education Studies Page 27
Social capital, as a community-based capacity building factor, can be of significant
benefit to youth facing barriers. For example, a community’s social networks can
add financial value to an individual and community (Coleman, 1990), enhance a
community’s cultural, political power and economic structures (Falk & Kilpatrick,
2000; Lin, 2001), and encourage civic engagement such as community governance
and volunteerism (Putnam, 2001). Social capital also contributes to an individual’s
self-efficacy and identity by supporting educational achievement and providing
access to employment opportunities (Israel & Beaulieu, 2004).
According to Tiepoh and Reimer (2004), there are four general types of networks
that appear in rural and northern communities. These are:
1. Bureaucratic relational networks that help individuals find jobs, access policies
and programs, expand trade or extend linkages.
2. Market networks that help expand trade or expose individuals to new skills and
abilities.
3. Communal and association relational networks can be of particular importance to
disadvantaged or marginalized sectors by reducing risks or by facilitating the
development of social enterprises.
4. Familial relationships or networks that help individuals with day to day living.
Communities obviously vary in the extent of their social capital particularly if they
are disadvantaged by isolation, gaps in organizational and institutional structures,
and low levels of economic activity. Nevertheless, all communities have positive
relational networks and these networks can be encouraged to include youth facing
barriers.
The benefit of including youth facing barriers in social networks is clear. For
communities, broad inclusion in social networks expands the productive value of a
skilled labour force in the same way as financial or physical assets (Lin, 2001;
Preston & Dyer, 2003; Woolcock, 2001). For individuals, their labour skills grow as
their social networks expand. The combination of increased social interaction and
growth in skills, knowledge and abilities brings has a large multiplier effect on an
individual’s self-efficacy, identity, access to employment opportunities and greater
fluidity in social relations (Lin, 2001). Thus for youth facing barriers, increased
educational achievement or skills development plus increased interaction with
social networks in the community holds significant potential to encourage active
participation in the workforce or to return to school.
Structural supports
Structural supports are the variety of planned programs aimed at youth facing
barriers. Examples of these programs include technical skills programs, soft-skills
programs, wage and training subsidies to employers, affirmative action, and skills
Rural Manitoba Youth Facing Barriers Project: Final Research Report
Centre for Aboriginal and Rural Education Studies Page 28
certification. For the purposes of this report, these programs also include on-the-
job workplace training programs provided by employers. Three dimensions of
structural supports are particularly relevant to this project. These are awareness of
and participation in programs; workplace learning and timing of supports.
Awareness of and participation in programs
The considerable financial and human resource investments in programs for youth
facing barriers and employers are intended to produce a return on investment in
terms of a skilled and available workforce. While there has been increasing interest
and spending on these programs in recent years, there appears to be relatively lows
levels of awareness and participation by both youth with barriers and by employers.
Furthermore, when there is participation there is also almost no evaluative evidence
of the efficacy of the programs.
This lack of awareness of and participation in programs can be traced back to
a) a lack of consultations with both employers and young people about their
intervention needs, and;
b) the limited amount of evidence-based evaluation on the effectiveness of
interventions (ILO, 2010l; Cunningham, et a., 2010).
For example, in a major survey of youth intervention programs, the ILO (2010)
found that world-wide, only one in four intervention programs were evaluated for
their impact on clients, and just over one in three had been evaluated for cost-
effectiveness. In short, awareness of and participation in intervention programs
requires both consultations and evaluations in order to ensure relevance of the
interventions and the effectiveness of the programs.
Workplace learning
At the risk of stating the obvious, the largest portion of our adult years (for most
individuals) is focused on some type of productive work – salaried or unsalaried. It
is therefore reasonable to expect that workplace learning would be a large portion
of an individual’s employment activities. Workplace learning refers to formalized
and intentional learning activities as well as incidental, role-related learning
activities.
Workplace learning has a high level of potential to be an integral component of
human development particularly for low-skilled workers. Given that the first and
foremost activity of the workplace is work, it is reasonable to expect that workplace
learning activities are used primarily to improve productivity. Even so, there are
numerous ways for employers to provide workplace learning activities that help
productivity as well as increase educational achievements and improve skills of

Rural Manitoba Youth Facing Barriers Project: Final Research Report
Centre for Aboriginal and Rural Education Studies Page 29
workers. Common examples are employer accreditation programs and incentives,
apprenticeships and work-based and promoted academic programs. Finally,
workplace learning has been shown to affect several personal attributes including
self-efficacy and individual identity (Hoare, 2006).
Timing of structural supports
The timing of structural supports is a critical component for both the recipients (the
youth facing barriers and/or employers) and the program delivery agency.
Specifically, integration into the labour force becomes more difficult for job seekers
as the period of unemployment lengthens. Over the course of time, job seekers may
lose skills, employers may develop biases against long-term unemployed persons
and age group peers dissipate. In summary, the likelihood of future integration of
youth facing barriers into the labour force or to return to school decreases the
longer a person is out of the workforce or out of school (Figure 2). This reality
means that (a) early identification of youth facing barriers is critical to success; and
(b) structural supports need to be readily available and accessible.
Figure 2: Timing of structural supports and the length of time away from work or school
Programs offered more than 1 year of being unemployed or out of school
Programs offered within 6 months to 1 year of being unemployed or out of school
Programs offered within 6 months of being unemployed or out of school
Probability of success
Low Moderate High
Low level of probability of entering or re-entering the workforce or returning to school without considerable assistance
Moderate level of probability of re-entering the workforce or returning to school with moderate levels of assistance
High level of probability of re-entering the workforce or returning to school with low to moderate levels of assistance

Rural Manitoba Youth Facing Barriers Project: Final Research Report
Centre for Aboriginal and Rural Education Studies Page 30
Connecting comments
The purpose of this section was to provide readers with a brief and selective
overview of the profile of youth facing barriers, their importance to the workforce
and to the economic and social well-being of the community and country, specific
barriers and best practices for structural supports and the predictive factors for
unemployment.
The overview of the importance of youth employment and education and the
selected capacity-building factors are related specifically to the major findings from
the youth and employer surveys. These findings are presented in the next section of
this report.

Rural Manitoba Youth Facing Barriers Project: Final Research Report
Centre for Aboriginal and Rural Education Studies Page 31
Major Findings from the Youth and Employer Surveys
Over the course of 4 months, the community sponsor organizations worked extremely hard
to distribute and collect youth and employer surveys. The youth survey consisted of more
than 50 questions aimed at understanding some of the needs and challenges of youth facing
barriers in rural and northern communities. The smaller employer survey focused on
gathering information on the kinds of job opportunities and the education level and skills
needed by youth facing barriers. Ultimately, more than 1700 youth respondents and just
over 500 employer respondents completed the surveys. Appendix A and B present the
consolidated data on a question by question basis for the youth and employer surveys.
The project yielded a rich amount of data on youth facing barriers in rural and northern
communities and regions in Manitoba. These data was used as the platform for discussions
and the development of each community 5-year plan.
Time and resources have limited the analysis to descriptive information that can be drawn
immediately from the data. This information includes demographic information,
employment history, as well as personal and workplace skills. While informative, this
descriptive information should be viewed as an analytical starting-block. More analysis
would yield even greater understanding of this youth population.
This section presents the major findings based on a descriptive analysis of the surveys.
These major findings have been organized into the following three themes:
1. key findings emerging from the demographic data of the youth facing barriers in the
communities and regions that participated in this project;
2. the significant community-based factors that act against access to and participation
in education and employment activities by youth facing barriers; and,
3. the main considerations for youth and employer participation structural supports,
that is education and employment programs.
Key findings from the demographic data
THE HIGH NUMBER OF RESPONDENTS
As stated previously, the population size of youth facing barriers is not known.
Even so, it is highly significant that more than 1700 youth in these selected rural and
northern Manitoba communities and regions completed the surveys.
This number, in and of itself, and regardless of its size in relation to the population
of youth facing barriers, is unquestionably a very large number.

Rural Manitoba Youth Facing Barriers Project: Final Research Report
Centre for Aboriginal and Rural Education Studies Page 32
PROFILE OF PARTICIPANTS
The profile of participants answers the question, “who are the youth involved in this
survey?” and includes such factors as age, gender, ethnicity, mobility, marital status,
dependent children and basic personal structures such as bank accounts, savings
and driver’s licenses. The data showed that overall, the average age of respondents
was 22 years and the gender split was 50/50.
Between 60% and 90% of youth respondents in all but 4 communities indicated that
they were Aboriginal ancestry. The issue of immigrant ethnicity was a factor only in
Pembina Valley and Steinbach.
YOUTH MOBILITY
The survey respondents were a highly mobile group. Overall, approximately 62% of respondents had moved at least once on the past year. Within this group more than 50% indicated that they had lived in at least two communities and 12% indicated that they had lived in 3 or more communities over the past year. While there appears to be considerable mobility between First Nations communities and the nearby communities of Dauphin, The Pas, Swan River, and the Interlake regions, there appears to be less youth mobility in the City of Thompson.
This mobility certainly affects the ability of youth to gain employment or complete an education. It also impacts family stability and is particularly detrimental for dependent children. In addition, program and service providers are continually challenged to sustain the participation of clients in employment or education programs.
PERSONAL IDENTIFICATION
All individuals of working age should have some type of identification; therefore, it
was troubling that some respondents indicated that they did not have a social
insurance number. For example, approximately 15% of the respondents in Portage
La Prairie, 30% in Thompson and 10% in Steinbach claimed that they did not have a
SIN. These findings raise questions about other types of personal identification such
as birth certificates.
LEVEL OF EDUCATION
As evidenced by the individual community and regional plans, low levels of
education achievement were serious concerns for the communities and regions
involved in this project.
High school graduation is considered by many as the minimum requirement for
employment or further education. According to Manitoba Education (2010) the
province has a high school graduation rate of 82.7%. In contrast, only 30% of all

Rural Manitoba Youth Facing Barriers Project: Final Research Report
Centre for Aboriginal and Rural Education Studies Page 33
the youth respondents had achieved a high school diploma and/or some type of
postsecondary education. Some communities such as Southwest Manitoba fared
better with more than 62.7% of respondents indicating that they had a high school
diploma. In comparison, more than 92% of the respondents in Thompson did not
have a high school diploma.
Perhaps more troubling is that the most reported level of education was Grade 9–
10, while the second most reported level of education was Grade 10 – 12. This does
not mean however that the respondents have earned credentials for these grade
levels. In reality this means that for many of these respondents, the last time they
attended school was when they were 14 or 15 years old.
Given that the average age of the respondents is around 22 years it can be assumed
that many of the respondents have been out of school for a number of years.
Furthermore, 95% of the respondents (n=1666) wanted to complete high school or
get further education. However, as described earlier in this document (p.28) , youth
who have been out of school for longer than six months need considerable
assistance to return to school and also to persist in their efforts.
Three other dimensions of low levels of education are significant. Firstly, the
mobility of this group makes attendance in school highly problematic. Secondly, it
appears that youth facing barriers have little or no awareness of, or participation in
adult literacy or adult education programs in the community. Thirdly, and most
importantly, low education levels tend to persist across generations. This means
that the dependent children of youth facing barriers are highly vulnerable as well to
low levels of educational achievement.
CYCLE OF EMPLOYMENT EXPERIENCE
Respondents were asked about their employment experience. Overall, the majority
of respondents (77%) indicated that they had some type of employment experience
in at least 2 casual or part-time jobs. However, based on the findings it appears that
the work experiences of youth facing barriers were (a) cyclical and/or were (b) low-
skilled, part-time, casual or seasonal.
The most reported barriers to employment were transportation (38.1%); lack of
education (34.8%); qualifications (27.3%); and no previous experience (21.9%).
DEPENDENT CHILDREN
Perhaps the most disconcerting individual factor is that nearly 39% of the youth
respondents indicated that they had, on average, two dependent children (Table A).

Rural Manitoba Youth Facing Barriers Project: Final Research Report
Centre for Aboriginal and Rural Education Studies Page 34
Notably, the communities differed significantly in the percentages of youth who
reported having children. For example, over half of the youth in the Swan Valley
sample reported that they had an average of two children. In contrast respondents
from Selkirk and Steinbach reported much lower rates of parenthood (17.4% and
18.2% respectively).
Table A: Percentage of youth with children and how many live with them
Community Children (% Yes) Number of Children
All communities 38.7% 1.8
Swan Valley 55.5% 2.0
Dauphin/Russell 46.3% 2.0
Brandon 46.2% 1.4
Southwest Manitoba 44.8% 1.7
Flin Flon 42.9% 2.1
Pembina Valley 40.1% 2.3
The Pas 39.0% 1.9
Thompson 31.0% 1.4
Portage La Prairie 29.7% 2.2
Minnedosa/Neepawa 28.6% 1.2
Steinbach 18.2% 1.8
Selkirk 17.4% 1.6
Significant community-based factors affecting youth with barriers
INVOLVEMENT IN THE COMMUNITY
Community engagement and participation in social networks such as recreational
activities are effective mechanisms to overcoming a lack of participation in the
workforce or educational opportunities. Overall, fewer than 1 in 4 respondents
indicated that they participated in some type of community activity.
EMPLOYMENT OPPORTUNITIES IN THE COMMUNITY
Most of the employers who responded to the survey were small business with less
than 30 employees. The most reported types of employment opportunities were
low-skilled labour such as working in grocery or retail stores (35%), restaurants or
bars (17.7%) and services (4.4%). On average, there were 16.4 full-time employees
and 12.2 part-time employees per business. There appeared to be a reasonable
distribution between full- and part-time positions. Employers surveyed also
indicated an average number of 2.8 casual positions per business. Youth on the
other had claimed that, when they do work, they are working in part-time or casual
jobs.

Rural Manitoba Youth Facing Barriers Project: Final Research Report
Centre for Aboriginal and Rural Education Studies Page 35
Finally, employers appeared to be somewhat arbitrary on the need for high school
graduation requirements for employees. Youth, on the other hand, felt that
transportation and education were the greatest barriers to working.
Ultimately, when both the youth and employer surveys are viewed together, each
community’s particular labour market (that is, supply of and demand for labour)
appeared to have the most influence on youth participation in the local workforce.
TRANSPORTATION
Access to transportation was a significant barrier to many youth and several
communities involved in this project identified accessible transportation as a
priority area. For example, 57% of respondents in Selkirk and 51% of respondents
from Portage La Prairie reported that transportation was the significant barrier to
employment. It was notable that only 38.9% of the respondents reported that they
had a driver’s license.
Main considerations for structural supports
Structural supports are the array of programs, incentives and services for youth
facing barriers and/or for employers. Generally, these structural supports are
provided by governmental agencies, non-profit organizations or educational
institutions.
YOUTH PARTICIPATION IN STRUCTURAL SUPPORTS
The range of participation in structural supports varied widely from a low in
Southwest Manitoba (28%) to a high of 72% in Pembina Valley. The most reported
services were employment services and job site training programs.
Relatively few respondents used either adult education or literacy programs or
English as a second language programs. The low level of educational achievement
among youth facing barriers, and the high demand for high school completion,
should raise a flag with providers of adult education services.
EMPLOYER PARTICIPATION IN STRUCTURAL SUPPORTS
According to the employer surveys, almost all of the respondents had used at least
one type of structural support. At first glance this was impressive. However, the
wide range and variability on a community by community basis indicated that there
was also a wide range in the awareness of employer programs. Also, many of these
programs were available to a variety of clients including youth facing barriers.
Rural Manitoba Youth Facing Barriers Project: Final Research Report
Centre for Aboriginal and Rural Education Studies Page 36
What then can be made from the youth and employer data? Firstly, the variability in
both the youth and employer surveys could be attributed to the operations and
effectiveness of the individual community delivery agencies.
Secondly, the access to and participation in adult literacy or adult education
programs was significant and concerning given the high number of participants who
do not have a high school diploma.
Finally, the cycle of employment and unemployment of youth coupled with the low
to moderate use of the programs by youth facing barriers and the high or frequent
use by employers revealed a disconnect between (a) the structural supports needed
by youth facing barriers and (b) the programs and services offered to meet these
needs. This finding is consistent with the claims from Cunningham et al., (2010)
that employment programs need more consultation with youth and employers to
develop appropriate programs and more program evaluation to determine their
effectiveness.
Connecting comments
This section presents the major findings that emerged from the youth and employer
surveys. Appendix A and B present the consolidated data on a question by question
basis for the youth and employer surveys.
The major findings identified in this section can be found in various forms in all of
the community plans and priority issues. The next section of this report presents a
summary of the major community priorities.

Rural Manitoba Youth Facing Barriers Project: Final Research Report
Centre for Aboriginal and Rural Education Studies Page 37
Community Priorities
This project consisted of two inter-related activities. The first was data collection
and analysis of the surveys. The second component was the development of
individual community plans based on the survey data and analysis for each
community.
Over the course of several months, each community sponsor organization, the
community research practitioner and the members of the youth advisory
committees held several consultation sessions in each community or region to
discuss the findings of the surveys. These consultations were used to (a) develop an
understanding of the survey results and (b) use these findings to develop 5-year
community plans.
Each community plan contains a different set of issues, priorities, goals and
objectives. Of these, a few priorities were at the top, or near the top in all of the
community or regional plans. These priorities were:
1. The lack of educational achievement for adults as well as high school aged youth
is a very high concern. Further consultation and collaboration with schools,
school boards, and adult education or literacy programs were priorities for all
communities.
2. Youth facing barriers to employment and education are very likely to have other
challenges such as affordable housing and poor health and lifestyle choices. This
will require that community groups and agencies work together to meet the
needs of these youth. The community plans that were developed as part of this
project will go a long way to provide guidance to these groups. However, the
sustainability of the efforts of the community sponsor organizations and the
youth advisory committees remained a question for most of the communities
and regions involved in this project.
3. There appeared to be an overall lack of awareness of and participation in
programs and services targeted for youth facing barriers and for the employers
who might wish to employ them. Many communities are working toward a
greater awareness of employers in particular.
4. Related to awareness and participation is the cycle of employment and
unemployment by youth facing barriers. Changing this cycle was a priority for
several communities.
5. Community supports such as transportation and childcare are significant
barriers to this group of youth. A number of communities identified strategies
to assist with these barriers.

Rural Manitoba Youth Facing Barriers Project: Final Research Report
Centre for Aboriginal and Rural Education Studies Page 38
Connecting comments
It should be recognized that the individual community plans contain priorities that
are much closer to each community’s context and selection of priorities. That said,
the above major priorities emerged as overarching themes.
The final section of this report contains three recommendations:
expand research and knowledge about youth facing barriers;
increase the effectiveness of structural supports; and
encourage the on-going involvement of stakeholders.
Rural Manitoba Youth Facing Barriers Project: Final Research Report
Centre for Aboriginal and Rural Education Studies Page 39
Recommendations
This report has reviewed (a) the importance of youth employment; (b) individual, community and structural capacity-building factors; (c) major findings from the data and (d) the top priorities of the communities and regions involved in this project.
The CARES has taken all of these into consideration and presents three overarching recommendations for further action. These are to:
1. expand research and knowledge about youth facing barriers; 2. increase effectiveness of structural supports; and, 3. encourage the on-going involvement of community stakeholders to adopt and
act upon the youth community plans.
Expand research and knowledge
As mentioned earlier in this report, the CARES provided descriptive data analysis. While insightful, additional analysis of data would refine and identify more details about youth facing barriers.
For example, the survey data could be disaggregated and analyzed for critical sub-groups of youth facing barriers for gender and ethnicity as well as variables such as dependent children and transiency.
It was also stated earlier in this report that this survey data should be considered as an analytical starting-block. There are many other important questions and information that can and should be gathered about youth facing barriers. Furthermore, this information and findings should be expanded to other communities and made widely available.
The CARES recommends that:
(a) efforts should be made to carry out further analysis of the 2010 youth and
employer surveys;
(b) more and different information should be gathered about youth facing
barriers in order to develop a comprehensive profile of these youth in rural
and northern Manitoba; and
(c) information and research products should be made widely available.
Increase the effectiveness of structural supports
This recommendation addresses the apparent disconnect between the cycle of employment and unemployment and the level and kind of participation of youth and employers in programs.
Activities could include descriptions of the key structural, community and labour market factors in the community, alignment with programs and services, and development of community capacity to implement and monitor the outcomes of these services for youth facing barriers and for employers.
Rural Manitoba Youth Facing Barriers Project: Final Research Report
Centre for Aboriginal and Rural Education Studies Page 40
Included in these services should be incentives for communities to develop, implement and evaluate alternative education, workplace learning and social inclusion activities based on the needs of youth facing barriers in the community. A necessary component of these activities should be success-based experiences and incremental skill development linked with educational attainment.
The CARES recommends that
communities and agencies develop processes to (a) regularly consult with
youth and employers to determine needs; (b) explore and develop alternative
education, workplace learning and social inclusion activities; and (c)
implement program evaluations processes to determine effectiveness of
services to meet these needs.
Encourage the on-going involvement of stakeholders
All of the communities and regions involved in this project were concerned about
the on-going involvement of stakeholders involved in the youth community plans.
This includes the fundamental need for financial support to carry out the objectives
and activities outlined in each of the plans.
Several activities will help encourage the sustainability of these community efforts. These include the establishment of a network of the community sponsor organizations and an annual forum on youth facing barriers including the opportunity for these youth to actively participate.
The CARES recommends that
the on-going involvement of stakeholders in addressing the needs of youth with
barriers be sustained by (a) the establishment of a network of the community
sponsor organizations and (b) an annual forum on youth facing barriers.
Further, these efforts should be made as soon as possible in order to sustain the
momentum created by this Rural Manitoba Youth Facing Barriers Project.

Rural Manitoba Youth Facing Barriers Project: Final Research Report
Centre for Aboriginal and Rural Education Studies Page 41
References
Bandura, A. (1997). Self-efficacy: The exercise of control. New York: W.H. Freeman
and Company.
Beaulieu, L., Israel, G., Wimberley, R. (2003). Promoting educational achievement: A
partnership of families, schools and communities. In D. Brown, L. Swanson,
A. Barton (Eds.). Challenges for rural America in the twenty first century.
(pp.273-290). University Park, PA: Pennsylvania State University Press.
Cervone, D., Artistico, D., & Berry, J. (2006) Self-efficacy and adult development. In C. Hoare. (Ed.), Handbook of adult development and learning. (pp.169-195). New York: Oxford University Press.
Coleman, J. (1990). Foundations of social theory. Cambridge, MA: The Belknap
Press of Harvard University Press.
Cunningham, W., Sanchez-Puerta, M. and Wuermil, A. (2010). Active labour market
programs for youth: A framework to guide youth employment interventions.
World Bank Employment Policy Primer, November 2010, No. 16.
Erikson, R. (1980). Identity and the life cycle. New York: Norton.
Falk, I., & Kilpatrick, S. (2000). What is social capital? A study of interaction in a
rural community. Sociologia Ruralis, 40, 87-110.
Hammond, C. & Feinstein, L. (2005). The effects of adult learning on self-efficacy.
London Review of Education, 3, 3. 265-287 .
Hoare, C. (2006). Work as the catalyst of reciprocal adult development and learning:
Identity and personality. In C. Hoare. (Ed.), Handbook of adult development
and learning. (pp.344-380). New York: Oxford University Press.
International Labour Organization (2006). Global employment trends for youth.
Geneva: International Labour Organization.
International Labour Organization. (2010). Global employment trends for youth:
August 2010. Special issue on the impact of the global economic crisis on
youth. Geneva: International Labour Organization.
Lin, N. (2001). Social capital: A theory of social structure and action. New York:
Cambridge University Press.

Rural Manitoba Youth Facing Barriers Project: Final Research Report
Centre for Aboriginal and Rural Education Studies Page 42
Manitoba Education. (2010). Manitoba’s High School Graduation Rate.
http://www.edu.gov.mb.ca/k12/docs/reports/grad_rate/grad_rate.pdf
Preston, R., & Dyer, C. (2003). Human capital, social capital and lifelong learning:
An editorial introduction. Compare, 33, 429-436.
Sotiropoulos, D. (2005). Positive and negative social capital and the uneven
development of civil society in southeastern Europe. Southeast European
and Black Sea Studies, (5), 2. 243-256. doi:10.1080/14683850500122919.
Statistics Canada. (2007). Literacy and adult learning in Canada.
http://www.statcan.gc.ca/daily-quotidien/071012/dq071012b-eng.htm
Tiepoh, M. G., & Reimer, W. (2004). Social capital, information flows, and income
creation in rural Canada: A cross-community analysis. The Journal of Socio-
Economics, 33, 427-448. doi:10.1016/j.socec.2004.04.007
Woolcock, M. (2001). The place of social capital in understanding social and
economic outcomes. In ISUMA, Canadian Journal of Policy Research, 2,1 11-
17.

Rural Manitoba Youth Facing Barriers Project: Final Research Report
Centre for Aboriginal and Rural Education Studies Page 43
Appendix A - Youth Survey Results
Demographic Information
Q1: WHAT IS YOUR AGE? (N=1744)
The ages of respondents ranged from 15 to 30 with an average age of the respondents of 21.8 years. The youngest sample of respondents was Thompson at 19.9 years, while Brandon and Pembina Valley region were the oldest samples at 22.9 years.
Q2: WHAT IS YOUR GENDER? (N=1747)
On average the gender ratio was 50/50 but varied in each community. Additional analysis of the data could correlate gender with various responses, thus highlighting relationships such as gendered paid and non-paid labour and family/child care factors. (E.g., see survey Question 26).
Table 1: The percentage of males and females in community samples
Community % Male % Female
All communities 50.0% 50.00%
Minnedosa/Neepawa 74.3% 25.7%
Thompson 59.4% 40.6%
Interlake 58.1% 41.9%
Portage La Prairie 53.9% 46.1%
Brandon 50.8% 49.2%
Flin Flon 50.5% 49.5%
The Pas 48.8% 51.2%
Steinbach 48.6% 51.4%
Swan Valley 46.7% 53.3%
Dauphin/Russell 43.9% 56.1%
Pembina 42.9% 57.1%
Southwest Manitoba 40.5% 59.5%
Q3: WHAT IS YOUR ETHNICITY? (N=1731)
Of the 1731 participants that answered this question, 61.1% identified themselves as Aboriginal. The percentage of youth that identified themselves as Aboriginal from a high of 89.5% in Thompson to a low of 14.7% in Minnedosa/Neepawa. It should be noted that self-identification is a personal choice which may include several factors such as whether there is real or perceived advantage from identifying as such.
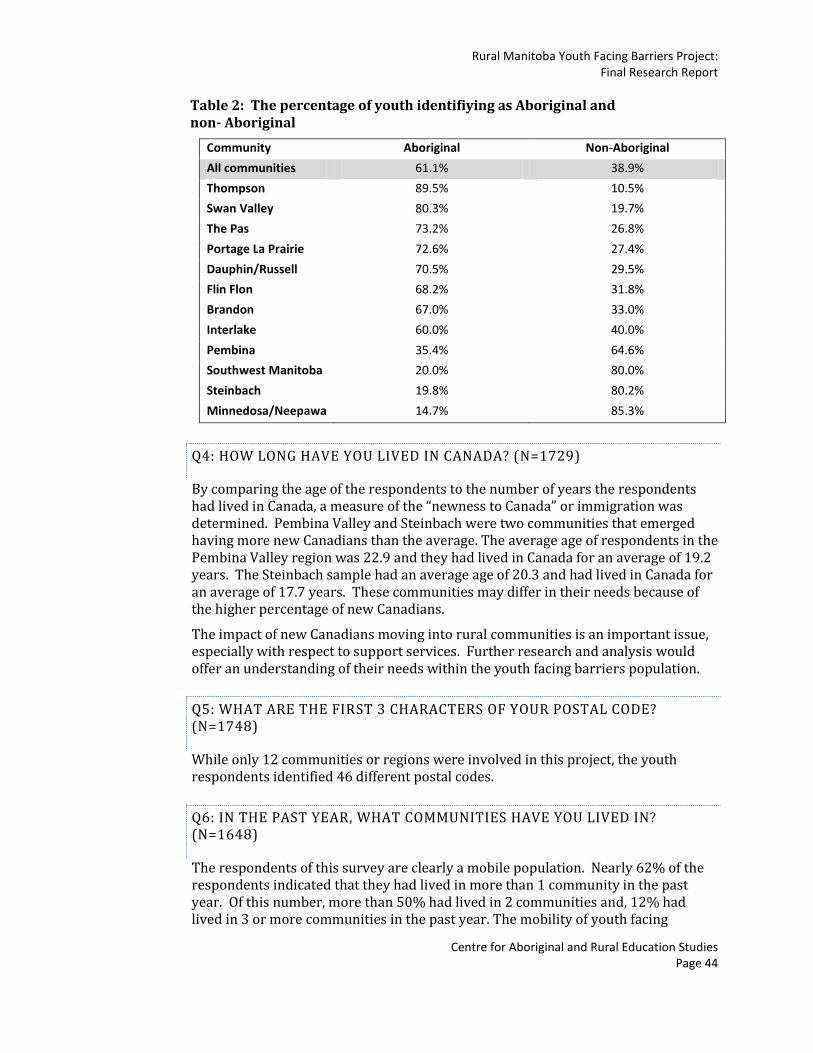
Rural Manitoba Youth Facing Barriers Project: Final Research Report
Centre for Aboriginal and Rural Education Studies Page 44
Table 2: The percentage of youth identifiying as Aboriginal and non- Aboriginal
Community Aboriginal Non-Aboriginal
All communities 61.1% 38.9%
Thompson 89.5% 10.5%
Swan Valley 80.3% 19.7%
The Pas 73.2% 26.8%
Portage La Prairie 72.6% 27.4%
Dauphin/Russell 70.5% 29.5%
Flin Flon 68.2% 31.8%
Brandon 67.0% 33.0%
Interlake 60.0% 40.0%
Pembina 35.4% 64.6%
Southwest Manitoba 20.0% 80.0%
Steinbach 19.8% 80.2%
Minnedosa/Neepawa 14.7% 85.3%
Q4: HOW LONG HAVE YOU LIVED IN CANADA? (N=1729)
By comparing the age of the respondents to the number of years the respondents had lived in Canada, a measure of the “newness to Canada” or immigration was determined. Pembina Valley and Steinbach were two communities that emerged having more new Canadians than the average. The average age of respondents in the Pembina Valley region was 22.9 and they had lived in Canada for an average of 19.2 years. The Steinbach sample had an average age of 20.3 and had lived in Canada for an average of 17.7 years. These communities may differ in their needs because of the higher percentage of new Canadians.
The impact of new Canadians moving into rural communities is an important issue, especially with respect to support services. Further research and analysis would offer an understanding of their needs within the youth facing barriers population.
Q5: WHAT ARE THE FIRST 3 CHARACTERS OF YOUR POSTAL CODE? (N=1748)
While only 12 communities or regions were involved in this project, the youth respondents identified 46 different postal codes.
Q6: IN THE PAST YEAR, WHAT COMMUNITIES HAVE YOU LIVED IN? (N=1648)
The respondents of this survey are clearly a mobile population. Nearly 62% of the respondents indicated that they had lived in more than 1 community in the past year. Of this number, more than 50% had lived in 2 communities and, 12% had lived in 3 or more communities in the past year. The mobility of youth facing
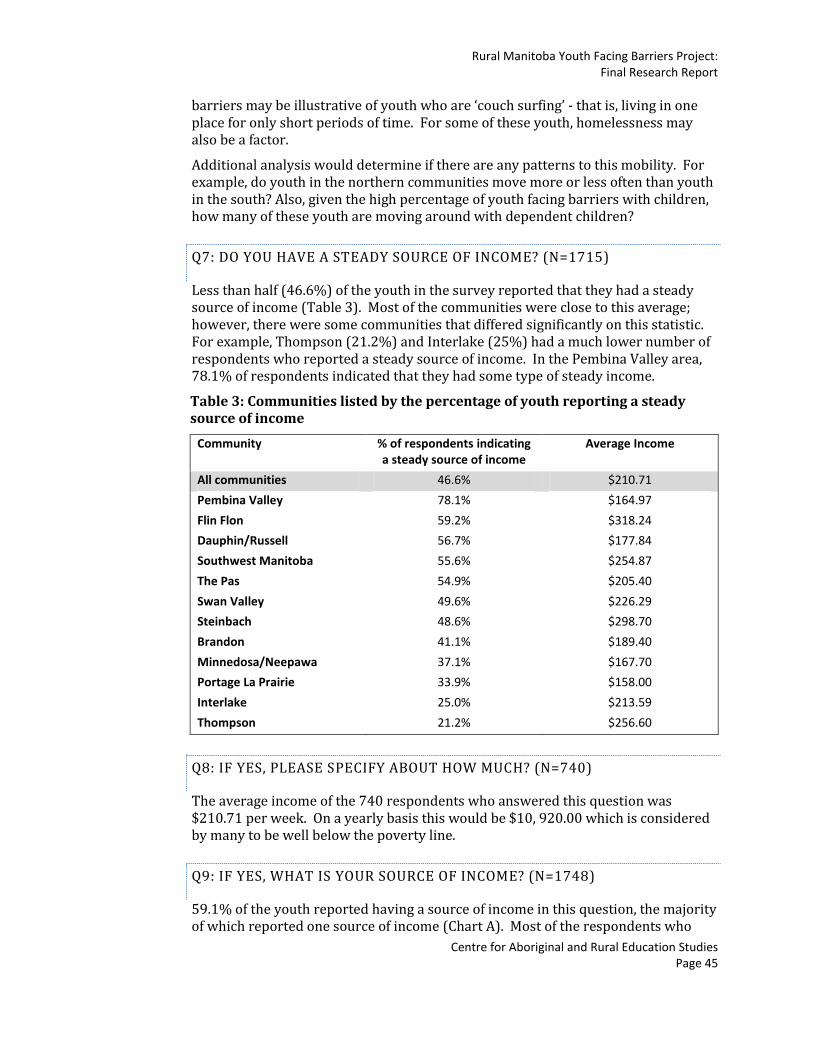
Rural Manitoba Youth Facing Barriers Project: Final Research Report
Centre for Aboriginal and Rural Education Studies Page 45
barriers may be illustrative of youth who are ‘couch surfing’ - that is, living in one place for only short periods of time. For some of these youth, homelessness may also be a factor.
Additional analysis would determine if there are any patterns to this mobility. For example, do youth in the northern communities move more or less often than youth in the south? Also, given the high percentage of youth facing barriers with children, how many of these youth are moving around with dependent children?
Q7: DO YOU HAVE A STEADY SOURCE OF INCOME? (N=1715)
Less than half (46.6%) of the youth in the survey reported that they had a steady source of income (Table 3). Most of the communities were close to this average; however, there were some communities that differed significantly on this statistic. For example, Thompson (21.2%) and Interlake (25%) had a much lower number of respondents who reported a steady source of income. In the Pembina Valley area, 78.1% of respondents indicated that they had some type of steady income.
Table 3: Communities listed by the percentage of youth reporting a steady source of income
Community % of respondents indicating a steady source of income
Average Income
All communities 46.6% $210.71
Pembina Valley 78.1% $164.97
Flin Flon 59.2% $318.24
Dauphin/Russell 56.7% $177.84
Southwest Manitoba 55.6% $254.87
The Pas 54.9% $205.40
Swan Valley 49.6% $226.29
Steinbach 48.6% $298.70
Brandon 41.1% $189.40
Minnedosa/Neepawa 37.1% $167.70
Portage La Prairie 33.9% $158.00
Interlake 25.0% $213.59
Thompson 21.2% $256.60
Q8: IF YES, PLEASE SPECIFY ABOUT HOW MUCH? (N=740)
The average income of the 740 respondents who answered this question was $210.71 per week. On a yearly basis this would be $10, 920.00 which is considered by many to be well below the poverty line.
Q9: IF YES, WHAT IS YOUR SOURCE OF INCOME? (N=1748)
59.1% of the youth reported having a source of income in this question, the majority of which reported one source of income (Chart A). Most of the respondents who
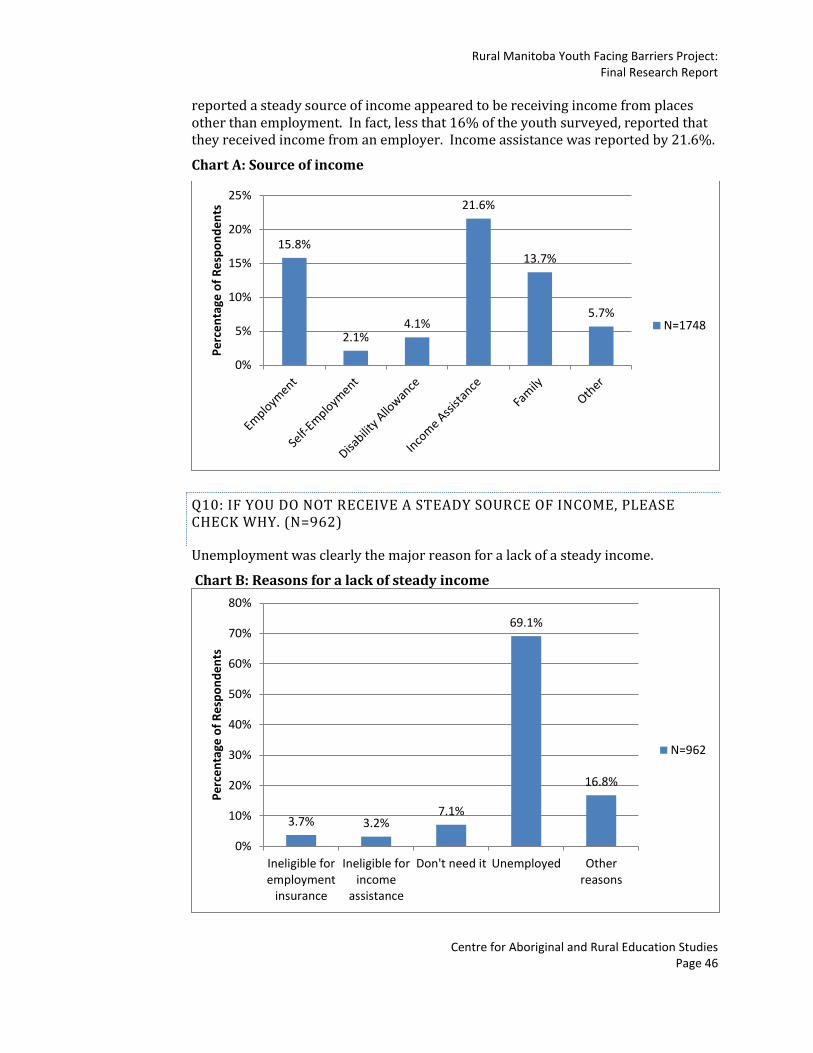
Rural Manitoba Youth Facing Barriers Project: Final Research Report
Centre for Aboriginal and Rural Education Studies Page 46
reported a steady source of income appeared to be receiving income from places other than employment. In fact, less that 16% of the youth surveyed, reported that they received income from an employer. Income assistance was reported by 21.6%.
Chart A: Source of income
Q10: IF YOU DO NOT RECEIVE A STEADY SOURCE OF INCOME, PLEASE CHECK WHY. (N=962)
Unemployment was clearly the major reason for a lack of a steady income.
Chart B: Reasons for a lack of steady income
15.8%
2.1% 4.1%
21.6%
13.7%
5.7%
0%
5%
10%
15%
20%
25%
Pe
rce
nta
ge o
f R
esp
on
de
nts
N=1748
3.7% 3.2% 7.1%
69.1%
16.8%
0%
10%
20%
30%
40%
50%
60%
70%
80%
Ineligible foremployment
insurance
Ineligible forincome
assistance
Don't need it Unemployed Otherreasons
Pe
rce
nta
ge o
f R
esp
on
de
nts
N=962

Rural Manitoba Youth Facing Barriers Project: Final Research Report
Centre for Aboriginal and Rural Education Studies Page 47
Some communities reported unemployment as a bigger problem than others (Table 4). For example, 91.6% of the respondents in Portage La Prairie indicated unemployment as the reason for a lack of income.
Table 4: The percentage of youth that reported unemployment as the reason they were not receiving steady income
Community Unemployment
All communities 69.1%
Portage La Prairie 91.6%
Interlake 82.8%
Pembina Valley 77.8%
Brandon 75.4%
Minnedosa/Neepawa 73.9%
The Pas 73.5%
Swan Valley 68.1%
Steinbach 66.8%
Dauphin/Russell 62.6%
Thompson 60.5%
Flin Flon 43.6%
Southwest Manitoba 26.8%
Q11: DO YOU HAVE A BANK ACCOUNT? (N=1740)
Overall, 3 out of 4 respondents to the survey indicated that they had a bank account. Notably, only 49% of the respondents in Thompson indicated that they had a bank account.
Q12: DO YOU HAVE ANY SAVINGS? (N=1737)
Just over 25% of all of the respondents (n=1737) indicated that they had any savings. The percentages ranged from a low in Thompson with 13.1% to a high in Southwest Manitoba with 43.7%.
Q13: WHAT IS YOUR MARITAL STATUS? (N=1738)
The great majority (78.0%) of respondents reported they were single, 6.5% were married, and 15.5% were common-law. In contrast, 48% of the respondents from Southwest Manitoba indicated that they were married (26.2%) or common-law (21.4%).
Q14: DO YOU HAVE CHILDREN? (N=1732)
Nearly 40% (38.7%) of those surveyed (n=1732) reported that they had children. On average, 1.8 children lived with those who reported they had children (Table 5).
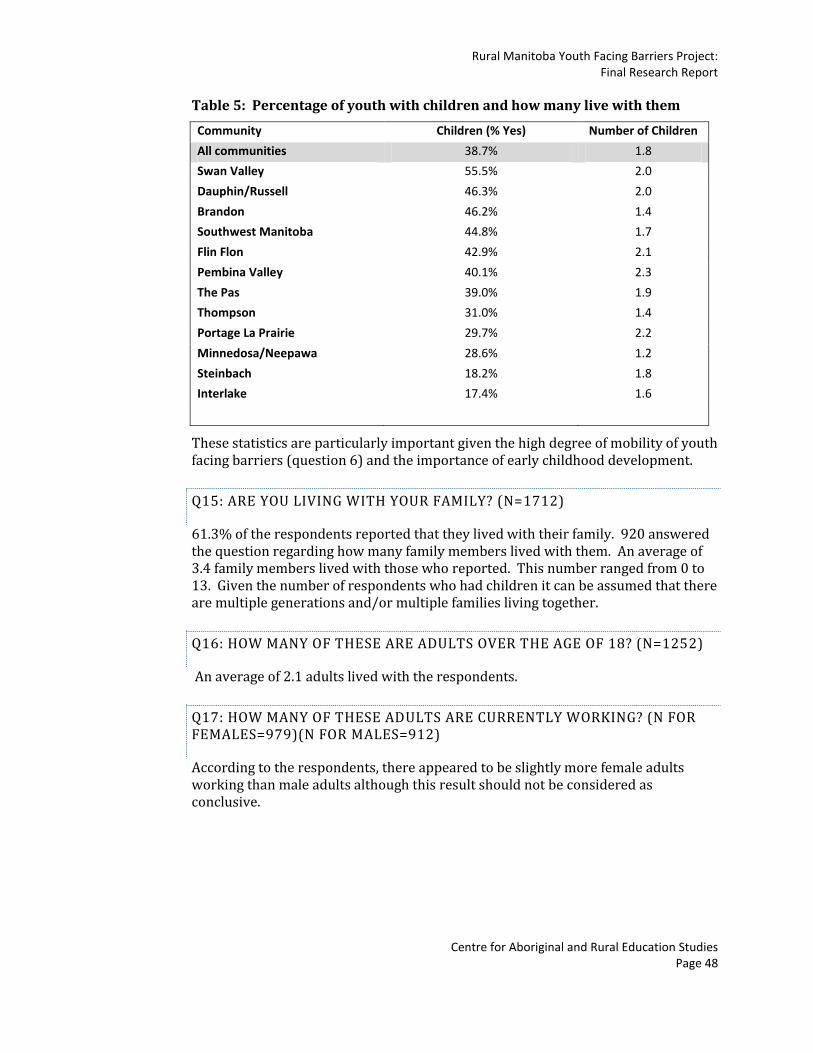
Rural Manitoba Youth Facing Barriers Project: Final Research Report
Centre for Aboriginal and Rural Education Studies Page 48
Table 5: Percentage of youth with children and how many live with them
Community Children (% Yes) Number of Children
All communities 38.7% 1.8
Swan Valley 55.5% 2.0
Dauphin/Russell 46.3% 2.0
Brandon 46.2% 1.4
Southwest Manitoba 44.8% 1.7
Flin Flon 42.9% 2.1
Pembina Valley 40.1% 2.3
The Pas 39.0% 1.9
Thompson 31.0% 1.4
Portage La Prairie 29.7% 2.2
Minnedosa/Neepawa 28.6% 1.2
Steinbach 18.2% 1.8
Interlake 17.4% 1.6
These statistics are particularly important given the high degree of mobility of youth facing barriers (question 6) and the importance of early childhood development.
Q15: ARE YOU LIVING WITH YOUR FAMILY? (N=1712)
61.3% of the respondents reported that they lived with their family. 920 answered the question regarding how many family members lived with them. An average of 3.4 family members lived with those who reported. This number ranged from 0 to 13. Given the number of respondents who had children it can be assumed that there are multiple generations and/or multiple families living together.
Q16: HOW MANY OF THESE ARE ADULTS OVER THE AGE OF 18? (N=1252)
An average of 2.1 adults lived with the respondents.
Q17: HOW MANY OF THESE ADULTS ARE CURRENTLY WORKING? (N FOR FEMALES=979)(N FOR MALES=912)
According to the respondents, there appeared to be slightly more female adults working than male adults although this result should not be considered as conclusive.
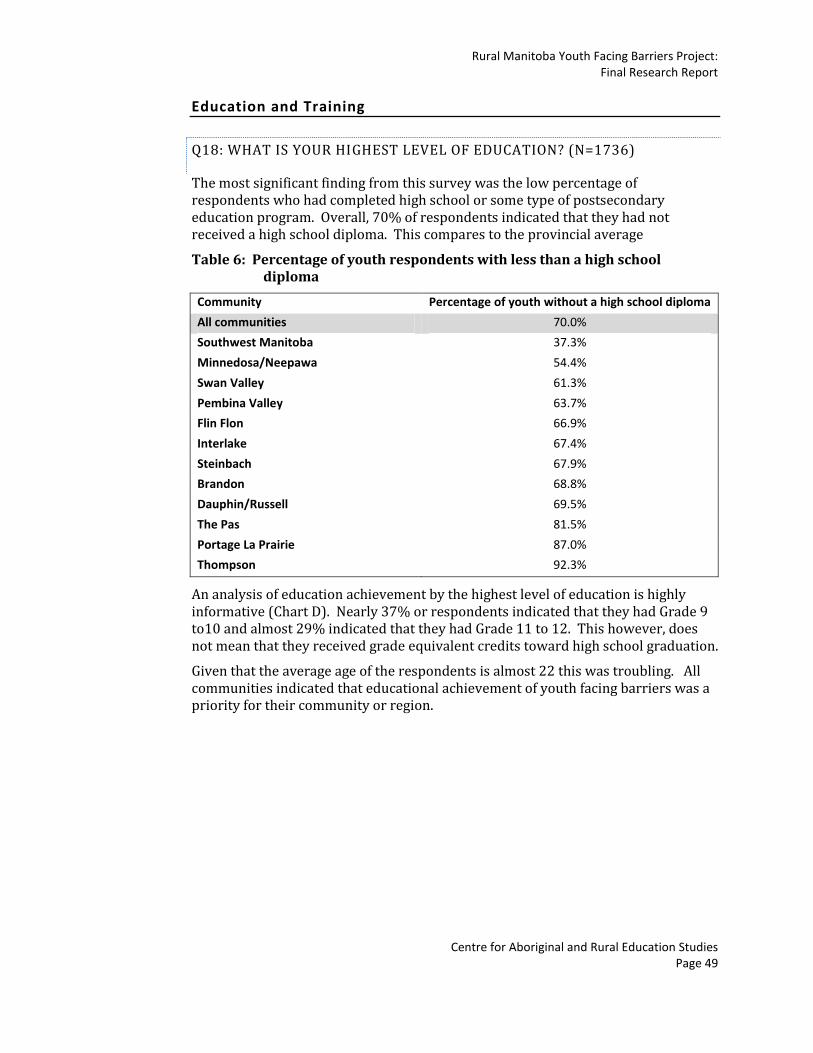
Rural Manitoba Youth Facing Barriers Project: Final Research Report
Centre for Aboriginal and Rural Education Studies Page 49
Education and Training
Q18: WHAT IS YOUR HIGHEST LEVEL OF EDUCATION? (N=1736)
The most significant finding from this survey was the low percentage of respondents who had completed high school or some type of postsecondary education program. Overall, 70% of respondents indicated that they had not received a high school diploma. This compares to the provincial average
Table 6: Percentage of youth respondents with less than a high school diploma
Community Percentage of youth without a high school diploma
All communities 70.0%
Southwest Manitoba 37.3%
Minnedosa/Neepawa 54.4%
Swan Valley 61.3%
Pembina Valley 63.7%
Flin Flon 66.9%
Interlake 67.4%
Steinbach 67.9%
Brandon 68.8%
Dauphin/Russell 69.5%
The Pas 81.5%
Portage La Prairie 87.0%
Thompson 92.3%
An analysis of education achievement by the highest level of education is highly informative (Chart D). Nearly 37% or respondents indicated that they had Grade 9 to10 and almost 29% indicated that they had Grade 11 to 12. This however, does not mean that they received grade equivalent credits toward high school graduation.
Given that the average age of the respondents is almost 22 this was troubling. All communities indicated that educational achievement of youth facing barriers was a priority for their community or region.
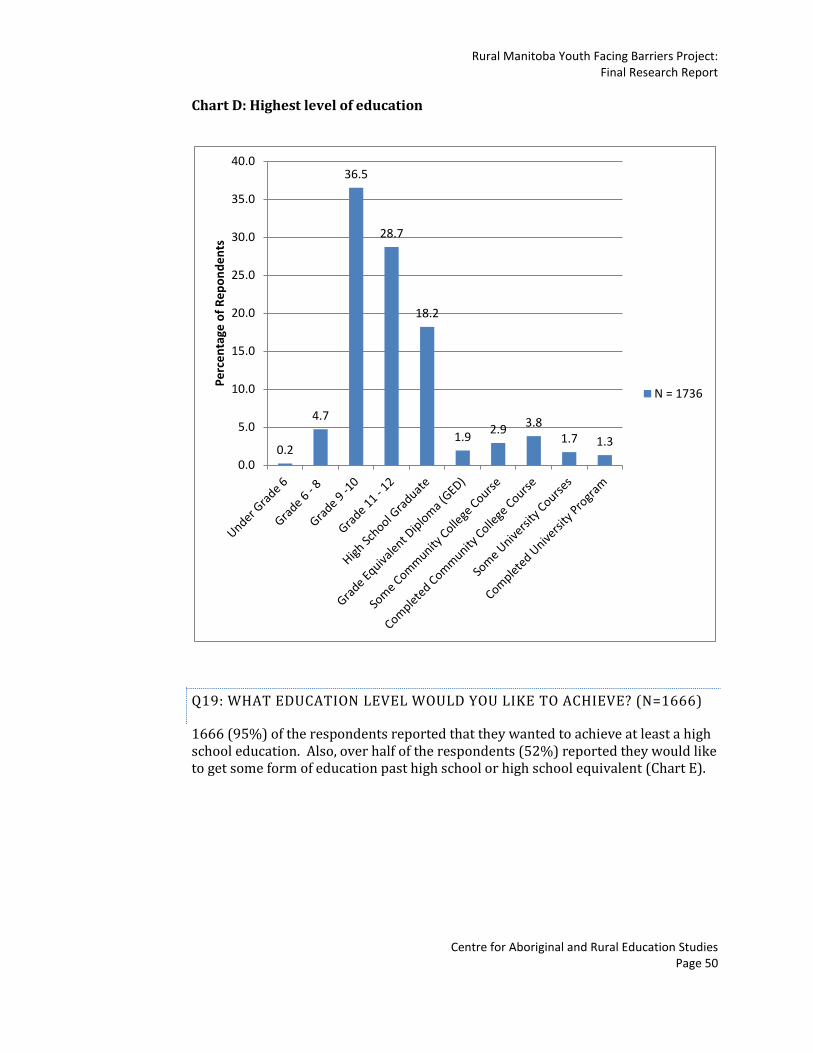
Rural Manitoba Youth Facing Barriers Project: Final Research Report
Centre for Aboriginal and Rural Education Studies Page 50
Chart D: Highest level of education
Q19: WHAT EDUCATION LEVEL WOULD YOU LIKE TO ACHIEVE? (N=1666)
1666 (95%) of the respondents reported that they wanted to achieve at least a high school education. Also, over half of the respondents (52%) reported they would like to get some form of education past high school or high school equivalent (Chart E).
0.2
4.7
36.5
28.7
18.2
1.9 2.9
3.8 1.7 1.3
0.0
5.0
10.0
15.0
20.0
25.0
30.0
35.0
40.0
Pe
rce
nta
ge o
f R
ep
on
de
nts
N = 1736
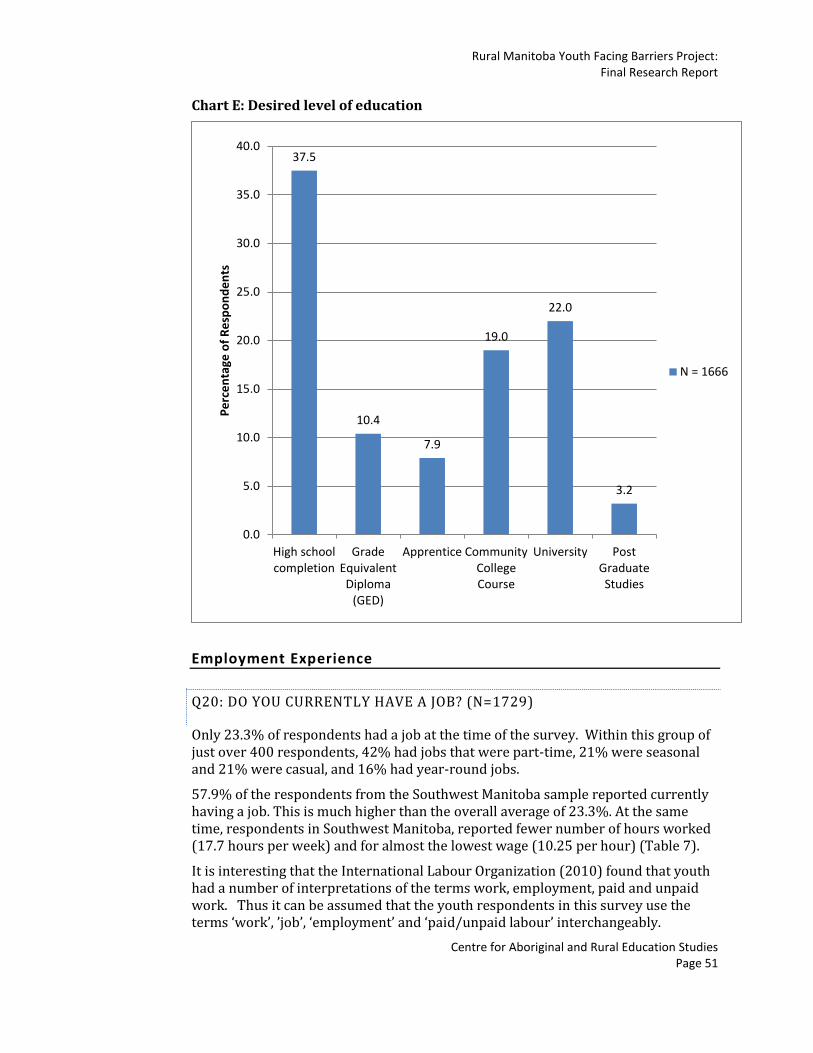
Rural Manitoba Youth Facing Barriers Project: Final Research Report
Centre for Aboriginal and Rural Education Studies Page 51
Chart E: Desired level of education
Employment Experience
Q20: DO YOU CURRENTLY HAVE A JOB? (N=1729)
Only 23.3% of respondents had a job at the time of the survey. Within this group of just over 400 respondents, 42% had jobs that were part-time, 21% were seasonal and 21% were casual, and 16% had year-round jobs.
57.9% of the respondents from the Southwest Manitoba sample reported currently having a job. This is much higher than the overall average of 23.3%. At the same time, respondents in Southwest Manitoba, reported fewer number of hours worked (17.7 hours per week) and for almost the lowest wage (10.25 per hour) (Table 7).
It is interesting that the International Labour Organization (2010) found that youth had a number of interpretations of the terms work, employment, paid and unpaid work. Thus it can be assumed that the youth respondents in this survey use the terms ‘work’, ’job’, ‘employment’ and ‘paid/unpaid labour’ interchangeably.
37.5
10.4
7.9
19.0
22.0
3.2
0.0
5.0
10.0
15.0
20.0
25.0
30.0
35.0
40.0
High schoolcompletion
GradeEquivalentDiploma
(GED)
Apprentice CommunityCollegeCourse
University PostGraduateStudies
Pe
rce
nta
ge o
f R
esp
on
de
nts
N = 1666

Rural Manitoba Youth Facing Barriers Project: Final Research Report
Centre for Aboriginal and Rural Education Studies Page 52
Table 7: The percentage of youth currently working, for how many hours, and for how much
Community Currently employed Hours horked per Week
Average hourly wage
All communities 23.3% 22.6 $11.30
Southwest Manitoba 57.9% 17.7 $10.25
Steinbach 44.0% 28.7 $12.22
Flin Flon 41.5% 24.2 $13.04
Minnedosa/Neepawa 37.1% 19.3 $12.24
Dauphin/Russell 28.1% 22.7 $10.43
Swan Valley 18.4% 24.6 $12.90
Pembina Valley 15.6% 17.7 $10.87
Thompson 14.8% 30.9 $12.07
Interlake 14.0% 38.8 $13.45
Portage La Prairie 13.7% 14.9 $10.01
The Pas 13.4% 16.5 $10.78
Brandon 12.5% 23.6 $12.89
Q21: IF YES, HOW LONG HAVE YOU BEEN WORKING AT THIS JOB? (N=391)
The average duration of current employment was just over 1.5 years.
Q22: IF YES, HOW MANY HOURS DO YOU WORK? (N=397)
The respondents who answered the question averaged 22.6 hours per week.
Q23: HOW MANY HOURS PER WEEK WOULD YOU LIKE TO WORK? (N=861)
Nearly half of the respondents indicated that they would like to work and it appears that they would like to have full-time employment of 36.7 hours per week.
Q24: DO YOU GET PAID TO WORK AT THIS JOB? (N=452)
85.4% of the respondents reported that they were paid for this job. In Brandon, only 67.8% of the respondents reported getting paid for their employment. This is much lower than the average of 85.4%.
Q25: IF YES, WHAT IS YOUR HOURLY WAGE? (N=390)
The hourly wages of those who responded ranged from $0.00 to $40.00. The average hourly wage was $11.30. For some paid work, "piece work" or performance related pay more accurately reflects the employees pay arrangements. Therefore respondents in these circumstances may have estimated their responses.

Rural Manitoba Youth Facing Barriers Project: Final Research Report
Centre for Aboriginal and Rural Education Studies Page 53
Q26: IF YOU DO NOT GET PAID, WHY NOT? (N=205)
The most reported answers were “I provide child care or household work for my family” (26%) and “I get paid in other ways for my work” (20%). These results suggest that a gendered analysis would be beneficial.
Q27: IF YOU ARE NOT WORKING, HAVE YOU HAD A JOB IN THE PAST? (N=1345)
Of the 1345 respondents who reported on this question, 82.3% reported that they had previously had a job. The respondents were asked to list how many and what type of employment (seasonal, casual or part-time) they had. Most of these jobs were part-time or seasonal. Most of respondents indicated that they had had two or more jobs that were part-time or seasonal.
Q28: WHAT FACTORS ARE PREVENTING YOU FROM WORKING OR GETTING A DIFFERENT JOB? (N=1748)
The most reported factors preventing employment were
I don’t have transportation (38.1%) lack of education (34.8%) don’t have the right qualifications (27.3%) no previous experience (21.9%).
Additionally, many youth do not have a driver's licence. This may be a factor although the lack of a driver’s licence does not appear to affect youth mobility.
Q29: WHERE HAVE YOU WORKED? (N=1748)
The most reported jobs were
restaurants or bars (43.4%) grocery or retail stores (31.4%) construction (25.1%) farms (18.4%).
The average across all communities for manufacturing was 7.6%. The exceptions were that 25% of youth in the Pembina Valley region and 28.6% in the Minnedosa/Neepawa area reported working in manufacturing.
Q30: WHERE WOULD YOU LIKE TO WORK? (N=1748)
The most reported responses were
restaurants or bars (30.6%) construction (27.3%) grocery or retail stores (25.6%) trades (22.8%).

Rural Manitoba Youth Facing Barriers Project: Final Research Report
Centre for Aboriginal and Rural Education Studies Page 54
Pembina Valley region and Minnedosa/Neepawa had high numbers of respondents (25.9% and 34.4%) who reported that they would like to work in manufacturing.
Q31: WHAT OCCUPATION OR PROFESSION WOULD YOU LIKE TO HAVE? (N=1748)
The responses were very evenly distributed among the options. Notably, 30% of the respondents indicated that they would like to be self-employed (Chart F).
A gendered analysis would be needed to suggest support for female and male youth facing barriers, especially if teaching and nursing are still perceived as feminized professions.
Chart F: Desired occupation
Experience with Employers
Q32: WHAT SHOULD EMPLOYERS DO TO ATTRACT MORE YOUTH WORKERS? (N=1748)
The most reported response was
schedule work around school (53.2%) provide childcare assistance (31.6%) schedule work around family time (29.3%) allow time for homework (26.0%).
18% 20%
14% 17%
19%
14%
30%
34%
0%
5%
10%
15%
20%
25%
30%
35%
40%
Pe
rce
nta
ge o
f R
esp
on
de
nts
N = 1748

Rural Manitoba Youth Facing Barriers Project: Final Research Report
Centre for Aboriginal and Rural Education Studies Page 55
A gendered analysis might also suggest the different needs of women and men in the youth facing barriers group.
Q33: HAVE YOU HAD BAD EXPERIENCES IN THE WORK FORCE? (N=1696)
26.4% of the respondents who answered this question reported having had bad experiences at work (Table 8).
Table 8: Percentage of youth who reported having a bad experience in the workforce
Community Bad experiences at work
All communities 26.4%
Thompson 37.8%
Steinbach 34.0%
Minnedosa/Neepawa 32.4%
Pembina Valley 32.2%
Brandon 28.4%
Interlake 28.2%
Southwest Manitoba 27.8%
The Pas 23.5%
Dauphin/Russell 23.0%
Flin Flon 22.1%
Portage La Prairie 19.2%
Swan Valley 15.3%
Q34: WHAT TRAINING OR EMPLOYMENT FLEXIBILITY WOULD MAKE OBTAINING A JOB EASIER FOR YOU? (N=1748)
‘Some weekends off ‘(53.4%) and ‘Better scheduling of hours’ (49.8%) were almost equally important to respondents.
Q35: WHERE WOULD BE THE BEST PLACE FOR EMPLOYERS TO ADVERTISE IF THEY ARE LOOKING FOR YOUTH EMPLOYEES? (N=1748)
The most reported responses were
newspaper (67.7%) Internet (62.5%) signs in window (52.4%) Employment Centre (45.6%).

Rural Manitoba Youth Facing Barriers Project: Final Research Report
Centre for Aboriginal and Rural Education Studies Page 56
Community Involvement
Q36: PLEASE CHECK THE COMMUNITY SERVICES THAT YOU CURRENTLY USE. (N=1748)
This question refers to the connection that these youth have to the community (Chart G). The most frequently used community services were
restaurants (54.0%) the library (45.1%) doctor’s office (42.6%).
The least used community services were the
alternative education programs (16.3%) transit (13.8%) adult literacy centre (12.9%).
Chart G: Community services used
45%
24%
12%
34%
18%
23%
30% 27%
54%
31%
43%
31%
16% 14%
8%
0%
10%
20%
30%
40%
50%
60%
Pe
rce
nta
ge o
f R
esp
on
de
nts
N = 1748
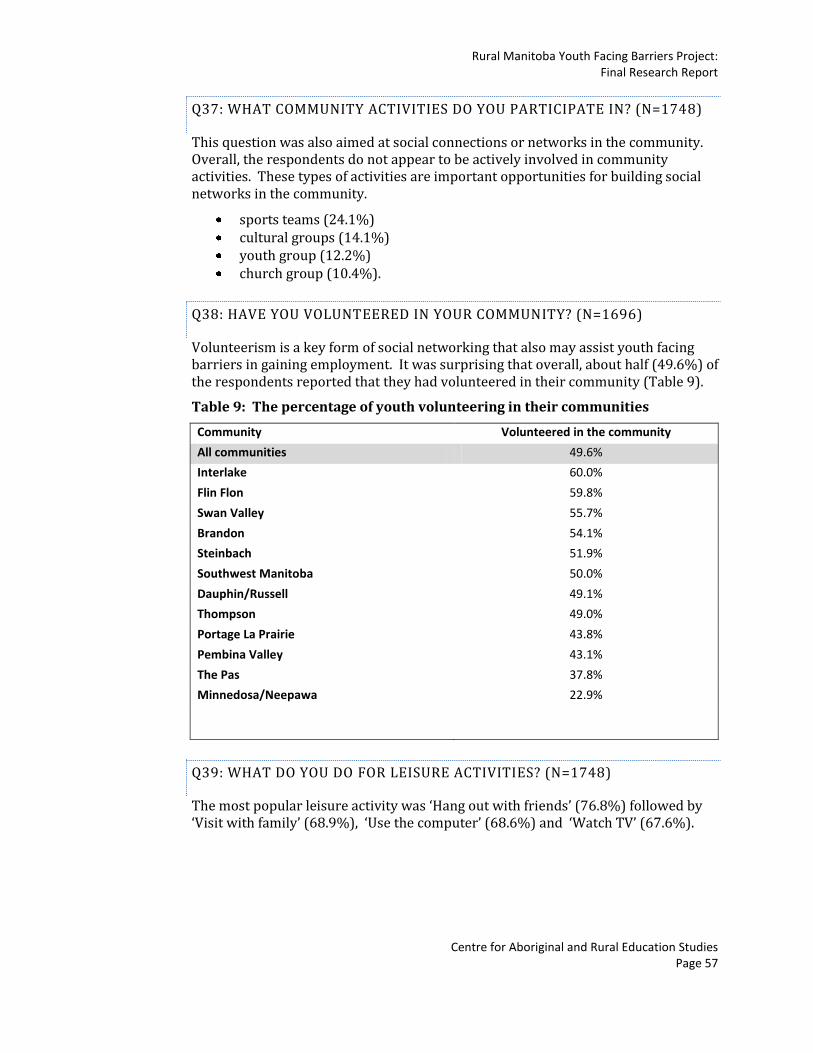
Rural Manitoba Youth Facing Barriers Project: Final Research Report
Centre for Aboriginal and Rural Education Studies Page 57
Q37: WHAT COMMUNITY ACTIVITIES DO YOU PARTICIPATE IN? (N=1748)
This question was also aimed at social connections or networks in the community. Overall, the respondents do not appear to be actively involved in community activities. These types of activities are important opportunities for building social networks in the community.
sports teams (24.1%) cultural groups (14.1%) youth group (12.2%) church group (10.4%).
Q38: HAVE YOU VOLUNTEERED IN YOUR COMMUNITY? (N=1696)
Volunteerism is a key form of social networking that also may assist youth facing barriers in gaining employment. It was surprising that overall, about half (49.6%) of the respondents reported that they had volunteered in their community (Table 9).
Table 9: The percentage of youth volunteering in their communities
Community Volunteered in the community
All communities 49.6%
Interlake 60.0%
Flin Flon 59.8%
Swan Valley 55.7%
Brandon 54.1%
Steinbach 51.9%
Southwest Manitoba 50.0%
Dauphin/Russell 49.1%
Thompson 49.0%
Portage La Prairie 43.8%
Pembina Valley 43.1%
The Pas 37.8%
Minnedosa/Neepawa 22.9%
Q39: WHAT DO YOU DO FOR LEISURE ACTIVITIES? (N=1748)
The most popular leisure activity was ‘Hang out with friends’ (76.8%) followed by ‘Visit with family’ (68.9%), ‘Use the computer’ (68.6%) and ‘Watch TV’ (67.6%).

Rural Manitoba Youth Facing Barriers Project: Final Research Report
Centre for Aboriginal and Rural Education Studies Page 58
Q40: HOW MANY HOURS/WEEK DO YOU SPEND ON LEISURE ACTIVITIES? (N=1581)
On average, the respondents reported they spent 34.7 hours per week on leisure activities. The concept of leisure activities was obviously interpreted differently by different people.
Education, Training and Employment Services
Q41: HAVE YOU USED ANY EDUCATION, TRAINING, OR EMPLOYMENT SERVICES IN YOUR COMMUNITY OTHER THAN SCHOOL? (N=1696)
Overall, 43.3% of the respondents had used education, training or employment services outside of school. This average however is influenced by the high percentage of use in the Pembina Valley region (72.1%) and the low percentage of use in Southwest Manitoba (28.8%) (Table 10). Chart H elaborates these findings.
Table 10: The percentage of youth who had used education, training, or employment services
Community Used Services
All communities 43.3%
Pembina Valley 72.1%
Minnedosa/Neepawa 51.4%
Brandon 50.8%
Flin Flon 47.5%
The Pas 41.8%
Swan Valley 41.6%
Interlake 40.7%
Thompson 40.0%
Steinbach 36.4%
Dauphin/Russell 35.9%
Portage La Prairie 34.2%
Southwest Manitoba 28.8%
Q42: IF YES, WHAT SERVICES HAVE YOU USED? (N=1748)
The most reported services were
employment services (25.1%) job site training programs (16.4%).
Notably, relatively few respondents used ‘English as a second language programs’ (3.2%) or ‘Adult literacy programs’ (9.3%) (Chart H). The exception was the Pembina Valley region where over 30% of the respondents indicated that they used adult education programs.

Rural Manitoba Youth Facing Barriers Project: Final Research Report
Centre for Aboriginal and Rural Education Studies Page 59
Chart H: Services used
Q43: IF YOU HAVE NOT USED ANY EDUCATION, TRAINING, AND EMPLOYMENT SERVICES, WHY NOT? (N=963)
The survey asked respondents to indicate why they had not used any of the education, training and employment services (Chart I). The three most reported answers were
I don’t know if we have any of these services (23.7%) I don’t have access to transportation (16.5%) I don’t need them (12.5%).
Chart I: Reasons for not using services
25.1%
9.3%
16.4%
3.2%
9.4%
0%
5%
10%
15%
20%
25%
30%
Employmentservices
Adult literacyprogram
Job site trainingprograms
English as asecond
languageprograms
Other
Pe
rce
nta
ge o
f R
esp
on
de
nts
9.4%
23.7%
16.5%
12.5%
8.5%
0.0%
5.0%
10.0%
15.0%
20.0%
25.0%
30.0%
We don't havethese services
I don't know ifwe have any ofthese services
I don’t have access to
transportation
I don't needthem
Other

Rural Manitoba Youth Facing Barriers Project: Final Research Report
Centre for Aboriginal and Rural Education Studies Page 60
This data suggests that lack of awareness was the major reason that youth are not using the services that are available to them. In fact, these findings are even more pronounced in individual communities. For example, approximately one third of the youth in Portage La Prairie (35.2%) The Pas (32.9%) Steinbach (31.5%) and Interlake (31.4%) reported that they did not know they had any of these services available to them.
Q44: DO YOU PLAN TO STAY IN YOUR COMMUNITY? IF NO, WHY NOT? (N=1668)
Nearly 70% of the respondents reported that they are planning to stay in their community. The question does not designate a time frame for remaining in the community and does not suggest factors that might influence a move, such as regional unemployment rates. No correlation of these findings was made with the mobility of youth in these communities.
Table 11: The percentage of youth who intend on staying in their community
Community Intending to staying in the community
All communities 69.6%
Brandon 78.9%
Portage La Prairie 78.3%
The Pas 75.6%
Dauphin/Russell 69.5%
Steinbach 67.0%
Pembina Valley 66.9%
Southwest Manitoba 66.7%
Interlake 65.0%
Flin Flon 61.9%
Minnedosa/Neepawa 61.8%
Swan Valley 61.8%
Thompson 58.3%
Looking Ahead
Q45: WHAT ARE YOUR PLANS FOR THE NEXT YEAR? (N=1720)
Most of the respondents reported that their plans for next year included
get a job (45.6%) go back to school (31.6%).
In Interlake, 71.8% of the youth reported that their plans for next year included ‘Get a job’ while only 16.5% reported ‘Go back to school’. The youth reported very similar numbers in Thompson. The opposite trend was present in the samples from Portage La Prairie, Brandon, and Dauphin/Russell where more youth said that they will be going back to school than getting a job (Table 12).
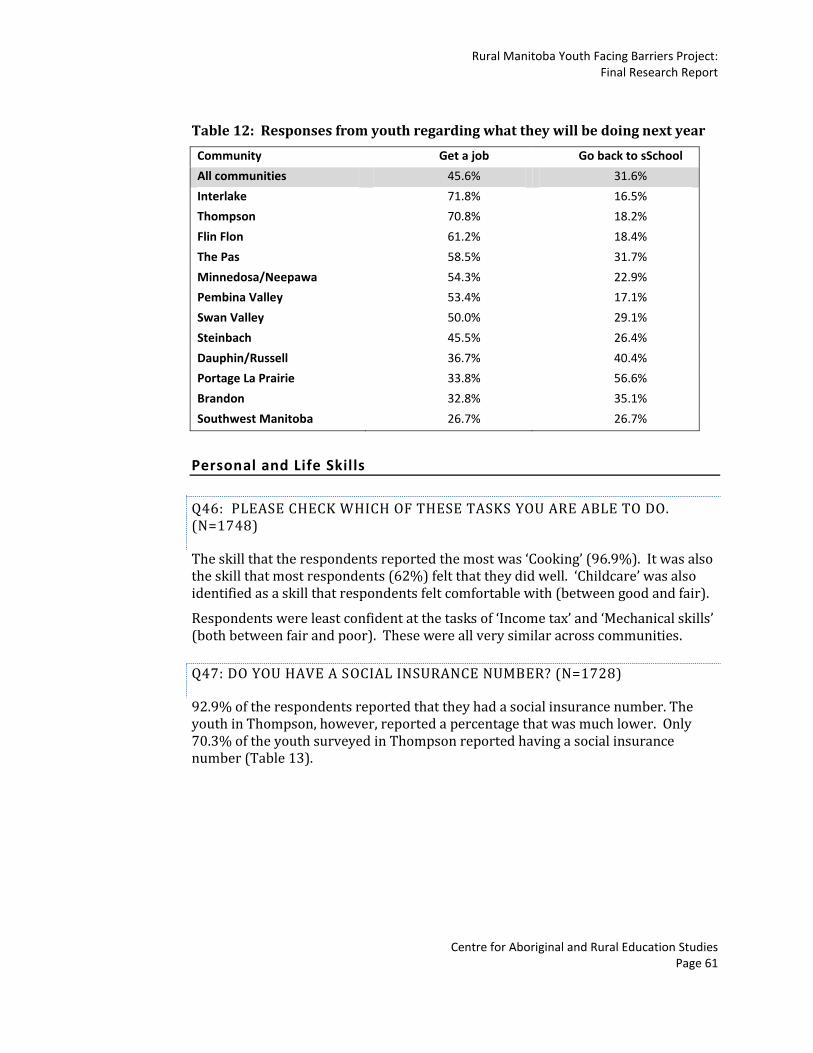
Rural Manitoba Youth Facing Barriers Project: Final Research Report
Centre for Aboriginal and Rural Education Studies Page 61
Table 12: Responses from youth regarding what they will be doing next year
Community Get a job Go back to sSchool
All communities 45.6% 31.6%
Interlake 71.8% 16.5%
Thompson 70.8% 18.2%
Flin Flon 61.2% 18.4%
The Pas 58.5% 31.7%
Minnedosa/Neepawa 54.3% 22.9%
Pembina Valley 53.4% 17.1%
Swan Valley 50.0% 29.1%
Steinbach 45.5% 26.4%
Dauphin/Russell 36.7% 40.4%
Portage La Prairie 33.8% 56.6%
Brandon 32.8% 35.1%
Southwest Manitoba 26.7% 26.7%
Personal and Life Skills
Q46: PLEASE CHECK WHICH OF THESE TASKS YOU ARE ABLE TO DO. (N=1748)
The skill that the respondents reported the most was ‘Cooking’ (96.9%). It was also the skill that most respondents (62%) felt that they did well. ‘Childcare’ was also identified as a skill that respondents felt comfortable with (between good and fair).
Respondents were least confident at the tasks of ‘Income tax’ and ‘Mechanical skills’ (both between fair and poor). These were all very similar across communities.
Q47: DO YOU HAVE A SOCIAL INSURANCE NUMBER? (N=1728)
92.9% of the respondents reported that they had a social insurance number. The youth in Thompson, however, reported a percentage that was much lower. Only 70.3% of the youth surveyed in Thompson reported having a social insurance number (Table 13).
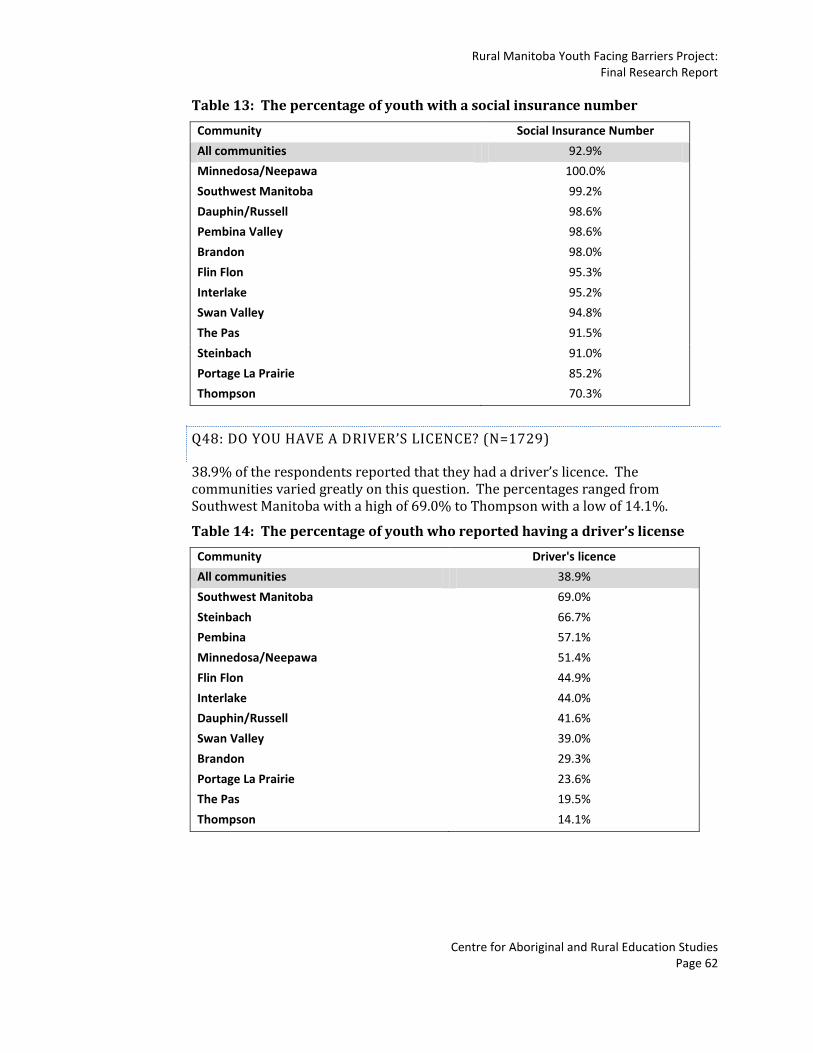
Rural Manitoba Youth Facing Barriers Project: Final Research Report
Centre for Aboriginal and Rural Education Studies Page 62
Table 13: The percentage of youth with a social insurance number
Community Social Insurance Number
All communities 92.9%
Minnedosa/Neepawa 100.0%
Southwest Manitoba 99.2%
Dauphin/Russell 98.6%
Pembina Valley 98.6%
Brandon 98.0%
Flin Flon 95.3%
Interlake 95.2%
Swan Valley 94.8%
The Pas 91.5%
Steinbach 91.0%
Portage La Prairie 85.2%
Thompson 70.3%
Q48: DO YOU HAVE A DRIVER’S LICENCE? (N=1729)
38.9% of the respondents reported that they had a driver’s licence. The communities varied greatly on this question. The percentages ranged from Southwest Manitoba with a high of 69.0% to Thompson with a low of 14.1%.
Table 14: The percentage of youth who reported having a driver’s license
Community Driver's licence
All communities 38.9%
Southwest Manitoba 69.0%
Steinbach 66.7%
Pembina 57.1%
Minnedosa/Neepawa 51.4%
Flin Flon 44.9%
Interlake 44.0%
Dauphin/Russell 41.6%
Swan Valley 39.0%
Brandon 29.3%
Portage La Prairie 23.6%
The Pas 19.5%
Thompson 14.1%
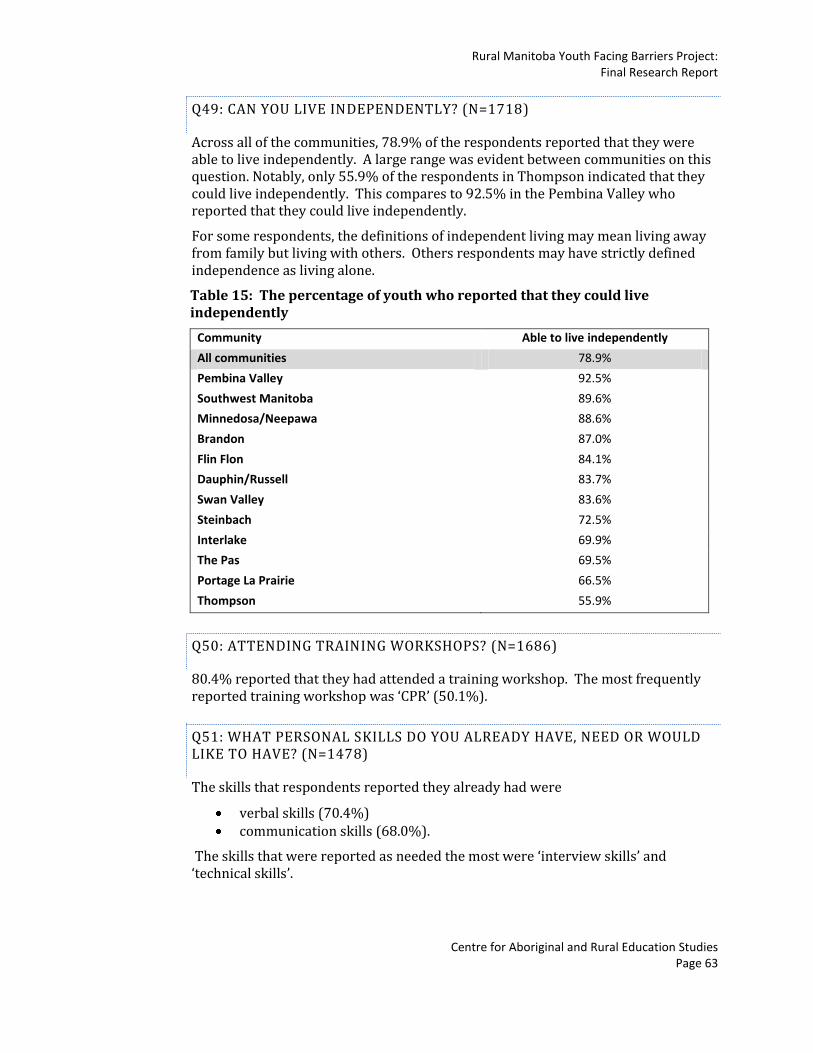
Rural Manitoba Youth Facing Barriers Project: Final Research Report
Centre for Aboriginal and Rural Education Studies Page 63
Q49: CAN YOU LIVE INDEPENDENTLY? (N=1718)
Across all of the communities, 78.9% of the respondents reported that they were able to live independently. A large range was evident between communities on this question. Notably, only 55.9% of the respondents in Thompson indicated that they could live independently. This compares to 92.5% in the Pembina Valley who reported that they could live independently.
For some respondents, the definitions of independent living may mean living away from family but living with others. Others respondents may have strictly defined independence as living alone.
Table 15: The percentage of youth who reported that they could live independently
Community Able to live independently
All communities 78.9%
Pembina Valley 92.5%
Southwest Manitoba 89.6%
Minnedosa/Neepawa 88.6%
Brandon 87.0%
Flin Flon 84.1%
Dauphin/Russell 83.7%
Swan Valley 83.6%
Steinbach 72.5%
Interlake 69.9%
The Pas 69.5%
Portage La Prairie 66.5%
Thompson 55.9%
Q50: ATTENDING TRAINING WORKSHOPS? (N=1686)
80.4% reported that they had attended a training workshop. The most frequently reported training workshop was ‘CPR’ (50.1%).
Q51: WHAT PERSONAL SKILLS DO YOU ALREADY HAVE, NEED OR WOULD LIKE TO HAVE? (N=1478)
The skills that respondents reported they already had were
verbal skills (70.4%) communication skills (68.0%).
The skills that were reported as needed the most were ‘interview skills’ and ‘technical skills’.

Rural Manitoba Youth Facing Barriers Project: Final Research Report
Centre for Aboriginal and Rural Education Studies Page 64

Rural Manitoba Youth Facing Barriers Project: Final Research Report
Centre for Aboriginal and Rural Education Studies Page 65
Appendix B - Employer Survey Results
Demographics and Workplace Characteristics
Q1: ON AVERAGE, HOW MANY EMPLOYEES DO YOU HAVE?
The respondents reported an average of 26.9 employees.
Table 16: The number of current employees per business by community
Community Total Employees
Female Male Ratio Female/Male
All communities 26.9 16.0 12.1 1.4
Pembina Valley 90.2 25.9 64.8 0.4
Steinbach 36.1 25.2 12.6 2.2
Swan Valley 30.4 20.6 10.5 2.0
Southwest Manitoba 28.0 21.7 5.3 4.1
Portage La Prairie 26.0 14.4 12.8 1.2
The Pas 25.6 16.2 9.3 1.7
Brandon 21.2 12.8 9.1 1.4
Dauphin/Russell 21.0 12.4 7.1 1.7
Flin Flon 18.3 13.4 4.9 2.7
Minnedosa/Neepawa 13.5 8.5 5.1 1.7
Thompson 12.5 8.2 4.8 1.7
Interlake 10.8 5.6 5.2 1.1
Minnedosa/Neepawa (13.5) Thompson (12.5) and Interlake (10.8) had fewer employees per business than the average. Pembina Valley region (90.2) had far more than the average, or any of the other communities. Almost all of the communities reported having more female than male employees. (The anomaly of Southwest Manitoba was attributed to the large number of employees in the health care region.) In the Pembina Valley region there were over twice as many males employed as females.
Q2: WHAT IS THE NUMBER OF FEMALE AND MALE EMPLOYEES IN YOUR BUSINESS?
On average, there were more female employees (16.0 per business) than male employees (12.1 per business). Further data analysis could reveal correlations between type of employment available and gender.
Rural Manitoba Youth Facing Barriers Project: Final Research Report
Centre for Aboriginal and Rural Education Studies Page 66
Q3: WHAT TYPE OF BUSINESS DO YOU HAVE? (N=503)
The most reported types of businesses were
grocery or retail store (35%) restaurant or bar (17.7%) producer services (4.4%).
The ‘Other’ response option was highly reported (29.8%). Pembina Valley region was somewhat different with 23.1% of the 26 respondents reporting that they were in manufacturing.
Q4: WHAT ARE THE FIRST 3 CHARACTERS OF YOUR POSTAL CODE? (N=506)
The most frequently reported postal codes were R0L (18.4%) R7A (12.3%) R0J (12.3%) R1N (9.7%) and R0M (8.9%). A total of 21 different postal codes were reported.
Q5: HOW MANY POSITIONS IN YOUR BUSINESS ARE FULL-TIME? (N=500) PART-TIME? (N=481)
On average, there were 16.4 full-time employees and 12.2 part-time employees per business.
In the Pembina Valley region there are far more full-time jobs (78.9) than part-time jobs (21.1) per employer. In Southwest Manitoba and Brandon, however, there are more part-time jobs (17.8 and 12.5) than full-time jobs (13.8 and 12.5) per business. (Chart J).
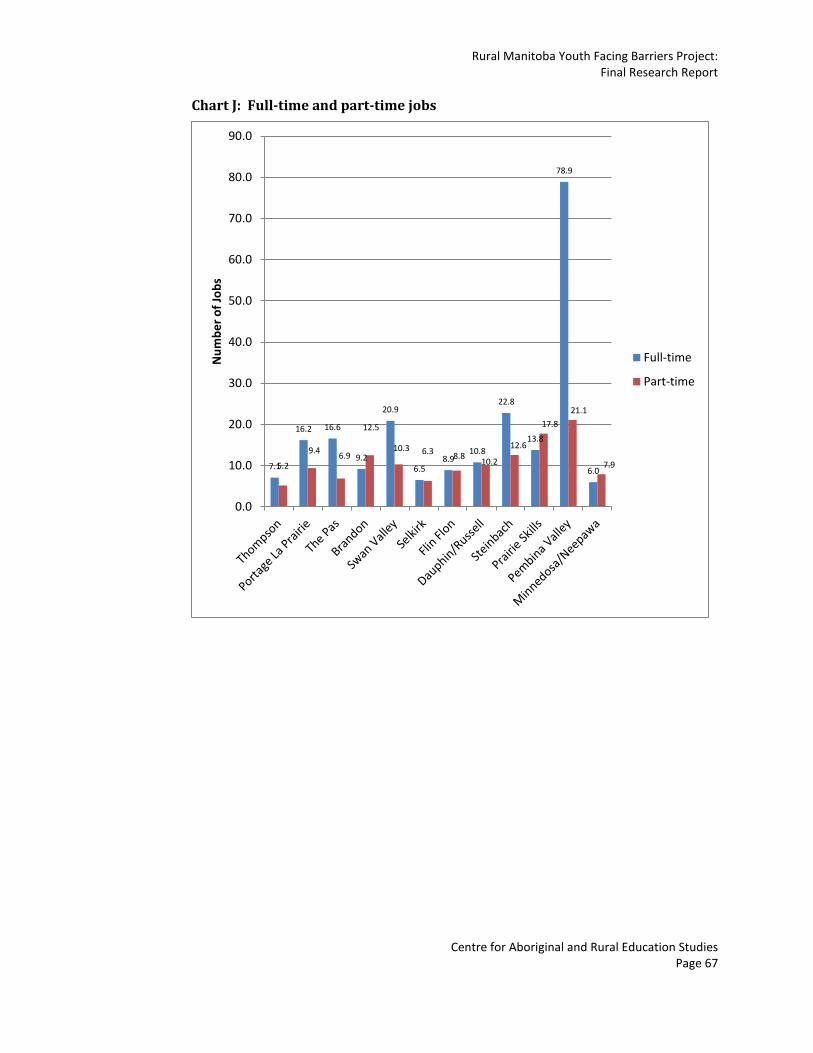
Rural Manitoba Youth Facing Barriers Project: Final Research Report
Centre for Aboriginal and Rural Education Studies Page 67
Chart J: Full-time and part-time jobs
7.1
16.2 16.6
9.2
20.9
6.5 8.9
10.8
22.8
13.8
78.9
6.0 5.2
9.4 6.9
12.5
10.3 6.3 8.8
10.2
12.6
17.8
21.1
7.9
0.0
10.0
20.0
30.0
40.0
50.0
60.0
70.0
80.0
90.0
Nu
mb
er
of
Job
s
Full-time
Part-time

Rural Manitoba Youth Facing Barriers Project: Final Research Report
Centre for Aboriginal and Rural Education Studies Page 68
Q6: Q1: HOW MANY POSITIONS IN YOUR BUSINESS ARE SEASONAL? (N=464)
On average, there were 2.4 seasonal employees reported per business (Table 17).
Table 17: The average number of seasonal employees per business by community
Community Seasonal
All communities 2.4
Southwest Manitoba 6.1
Pembina Valley 4.7
Interlake 4.0
Dauphin/Russell 3.8
Steinbach 3.5
Flin Flon 2.5
Swan Valley 2.0
Portage La Prairie 1.7
Brandon 1.1
Thompson 0.6
The Pas 0.5
Minnedosa/Neepawa 0.3
The average length of their seasonal work was 4.4 months and mainly in the summer and spring.
Q7: HOW MANY POSITIONS IN YOUR BUSINESS ARE FOR CASUAL EMPLOYEES? (N=485)
The average number of casual positions per business was 2.8 (Table 18).
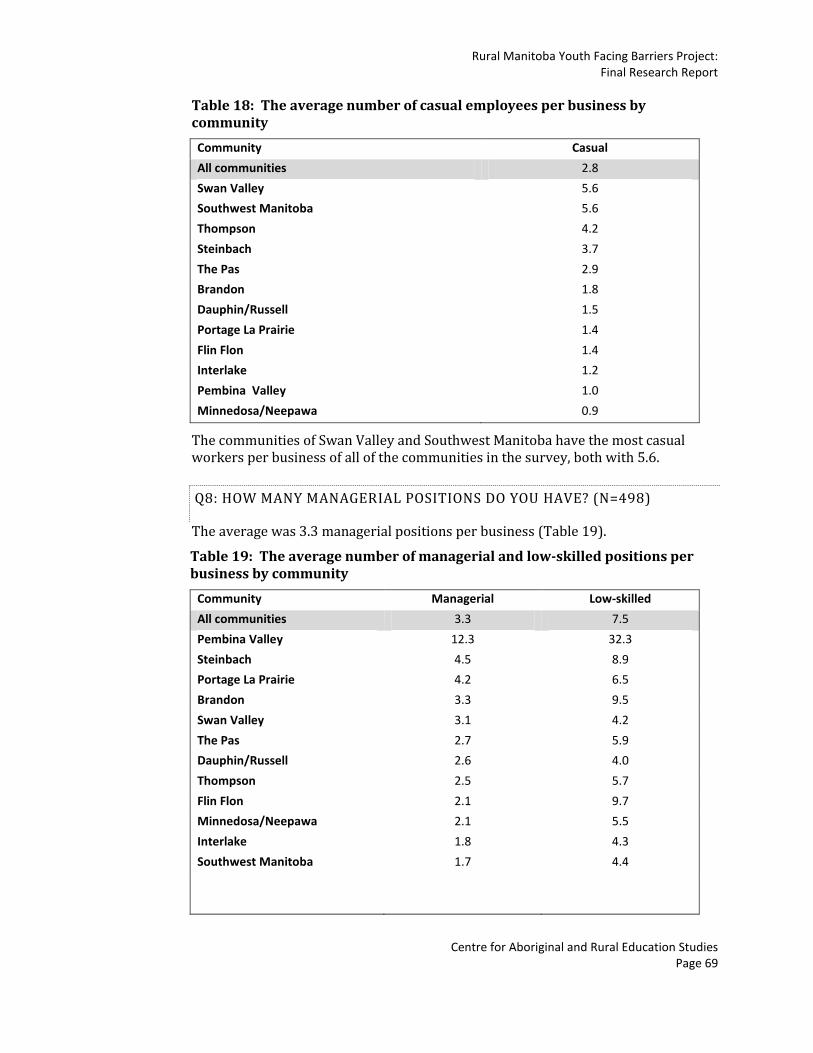
Rural Manitoba Youth Facing Barriers Project: Final Research Report
Centre for Aboriginal and Rural Education Studies Page 69
Table 18: The average number of casual employees per business by community
Community Casual
All communities 2.8
Swan Valley 5.6
Southwest Manitoba 5.6
Thompson 4.2
Steinbach 3.7
The Pas 2.9
Brandon 1.8
Dauphin/Russell 1.5
Portage La Prairie 1.4
Flin Flon 1.4
Interlake 1.2
Pembina Valley 1.0
Minnedosa/Neepawa 0.9
The communities of Swan Valley and Southwest Manitoba have the most casual workers per business of all of the communities in the survey, both with 5.6.
Q8: HOW MANY MANAGERIAL POSITIONS DO YOU HAVE? (N=498)
The average was 3.3 managerial positions per business (Table 19).
Table 19: The average number of managerial and low-skilled positions per business by community
Community Managerial Low-skilled
All communities 3.3 7.5
Pembina Valley 12.3 32.3
Steinbach 4.5 8.9
Portage La Prairie 4.2 6.5
Brandon 3.3 9.5
Swan Valley 3.1 4.2
The Pas 2.7 5.9
Dauphin/Russell 2.6 4.0
Thompson 2.5 5.7
Flin Flon 2.1 9.7
Minnedosa/Neepawa 2.1 5.5
Interlake 1.8 4.3
Southwest Manitoba 1.7 4.4

Rural Manitoba Youth Facing Barriers Project: Final Research Report
Centre for Aboriginal and Rural Education Studies Page 70
Q9: HOW MANY LOW-SKILLED POSITIONS DO YOU HAVE? (N=483)
The average number of low-skilled positions was 7.5 positions per business (Table 19). Manufacturing in the Pembina Valley region would account for the high number of low-skilled positions.
Q10: HOW MANY YEARS HAS YOUR BUSINESS BEEN LOCATED IN THIS COMMUNITY? (N=493)
The average business reported that they have been in their community for 27.1 years. The range of responses was from 0 months to 125 years.
Hiring Experiences
Q11: IN THE PAST 12 MONTHS, HAVE YOU HAD ANY DIFFICULTY FINDING QUALIFIED APPLICANTS FOR ANY OF THE JOBS THAT YOU WERE TRYING TO FILL? (N=506)
Overall, more than half (53.8%) of the respondents reported having difficulty finding qualified applicants for jobs they were trying to fill although there were wide ranges in this response (Table 20). A further correlation in youth responses would be valuable.
Table 20: The percentage of businesses that reported having difficulty filling positions
Community Yes (%)
All communities 53.8%
Thompson 73.3%
Flin Flon 73.3%
The Pas 69.7%
Portage La Prairie 61.2%
Southwest Manitoba 58.2%
Swan Valley 50.8%
Interlake 50.0%
Pembina Valley 50.0%
Steinbach 48.4%
Dauphin/Russell 47.1%
Brandon 44.7%
Minnedosa/Neepawa 42.1%
Employers in Thompson, Flin Flon, and The Pas reported having more difficulty finding qualified applicants than the other communities. 73.3% of the businesses in both Thompson and Flin Flon reported having difficulty finding qualified applicants, while 69.7% of the businesses in The Pas reported having difficulty. At the same
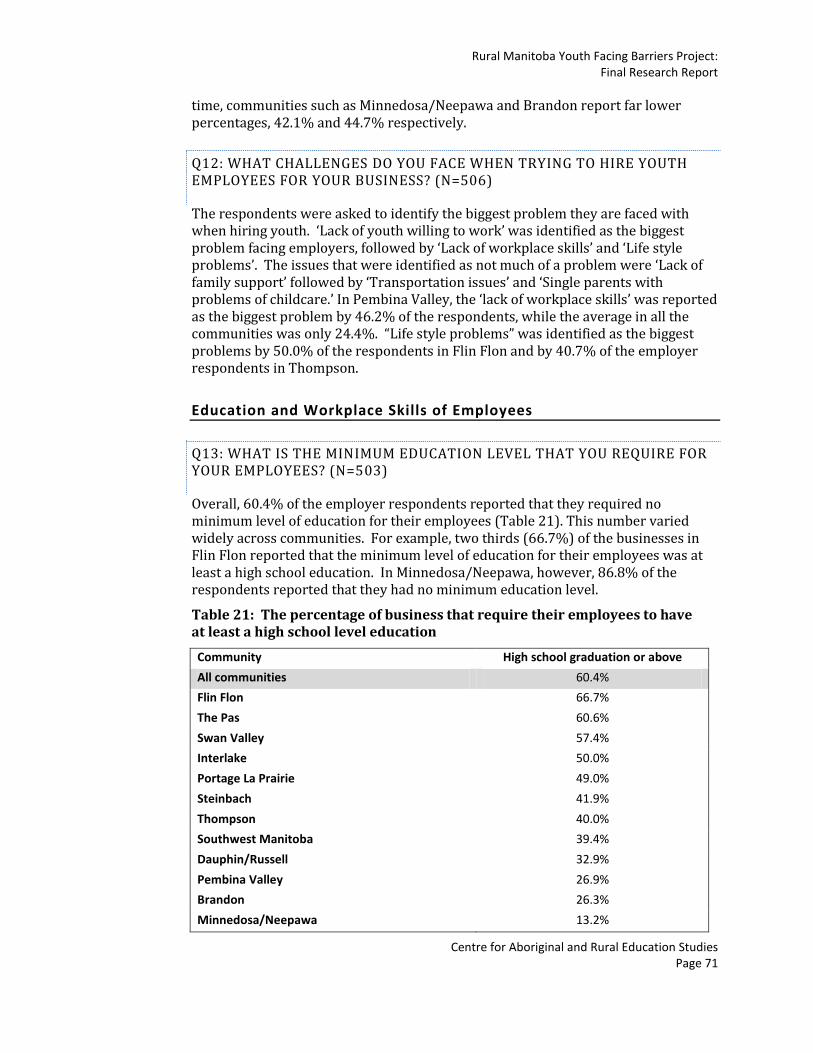
Rural Manitoba Youth Facing Barriers Project: Final Research Report
Centre for Aboriginal and Rural Education Studies Page 71
time, communities such as Minnedosa/Neepawa and Brandon report far lower percentages, 42.1% and 44.7% respectively.
Q12: WHAT CHALLENGES DO YOU FACE WHEN TRYING TO HIRE YOUTH EMPLOYEES FOR YOUR BUSINESS? (N=506)
The respondents were asked to identify the biggest problem they are faced with when hiring youth. ‘Lack of youth willing to work’ was identified as the biggest problem facing employers, followed by ‘Lack of workplace skills’ and ‘Life style problems’. The issues that were identified as not much of a problem were ‘Lack of family support’ followed by ‘Transportation issues’ and ‘Single parents with problems of childcare.’ In Pembina Valley, the ‘lack of workplace skills’ was reported as the biggest problem by 46.2% of the respondents, while the average in all the communities was only 24.4%. “Life style problems” was identified as the biggest problems by 50.0% of the respondents in Flin Flon and by 40.7% of the employer respondents in Thompson.
Education and Workplace Skills of Employees
Q13: WHAT IS THE MINIMUM EDUCATION LEVEL THAT YOU REQUIRE FOR YOUR EMPLOYEES? (N=503)
Overall, 60.4% of the employer respondents reported that they required no minimum level of education for their employees (Table 21). This number varied widely across communities. For example, two thirds (66.7%) of the businesses in Flin Flon reported that the minimum level of education for their employees was at least a high school education. In Minnedosa/Neepawa, however, 86.8% of the respondents reported that they had no minimum education level.
Table 21: The percentage of business that require their employees to have at least a high school level education
Community High school graduation or above
All communities 60.4%
Flin Flon 66.7%
The Pas 60.6%
Swan Valley 57.4%
Interlake 50.0%
Portage La Prairie 49.0%
Steinbach 41.9%
Thompson 40.0%
Southwest Manitoba 39.4%
Dauphin/Russell 32.9%
Pembina Valley 26.9%
Brandon 26.3%
Minnedosa/Neepawa 13.2%
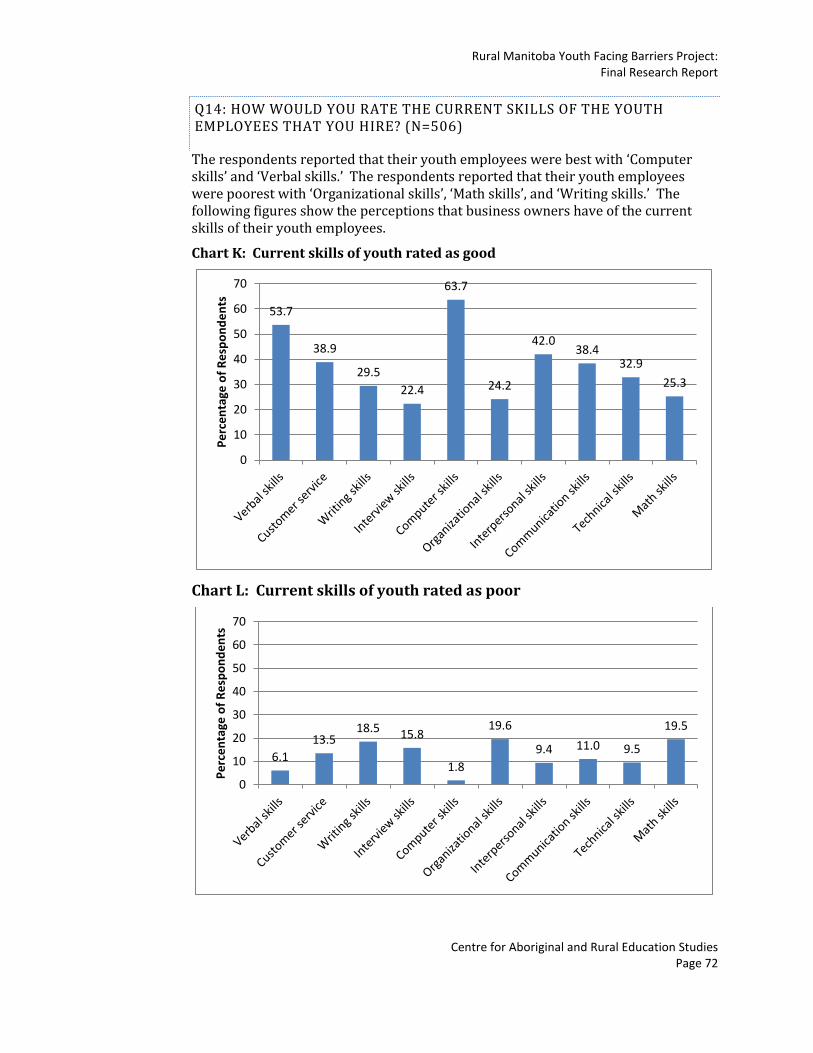
Rural Manitoba Youth Facing Barriers Project: Final Research Report
Centre for Aboriginal and Rural Education Studies Page 72
Q14: HOW WOULD YOU RATE THE CURRENT SKILLS OF THE YOUTH EMPLOYEES THAT YOU HIRE? (N=506)
The respondents reported that their youth employees were best with ‘Computer skills’ and ‘Verbal skills.’ The respondents reported that their youth employees were poorest with ‘Organizational skills’, ‘Math skills’, and ‘Writing skills.’ The following figures show the perceptions that business owners have of the current skills of their youth employees.
Chart K: Current skills of youth rated as good
Chart L: Current skills of youth rated as poor
53.7
38.9
29.5
22.4
63.7
24.2
42.0 38.4
32.9
25.3
0
10
20
30
40
50
60
70
Pe
rce
nta
ge o
f R
esp
on
de
nts
6.1
13.5 18.5 15.8
1.8
19.6
9.4 11.0 9.5
19.5
0
10
20
30
40
50
60
70
Pe
rce
nta
ge o
f R
esp
on
de
nts
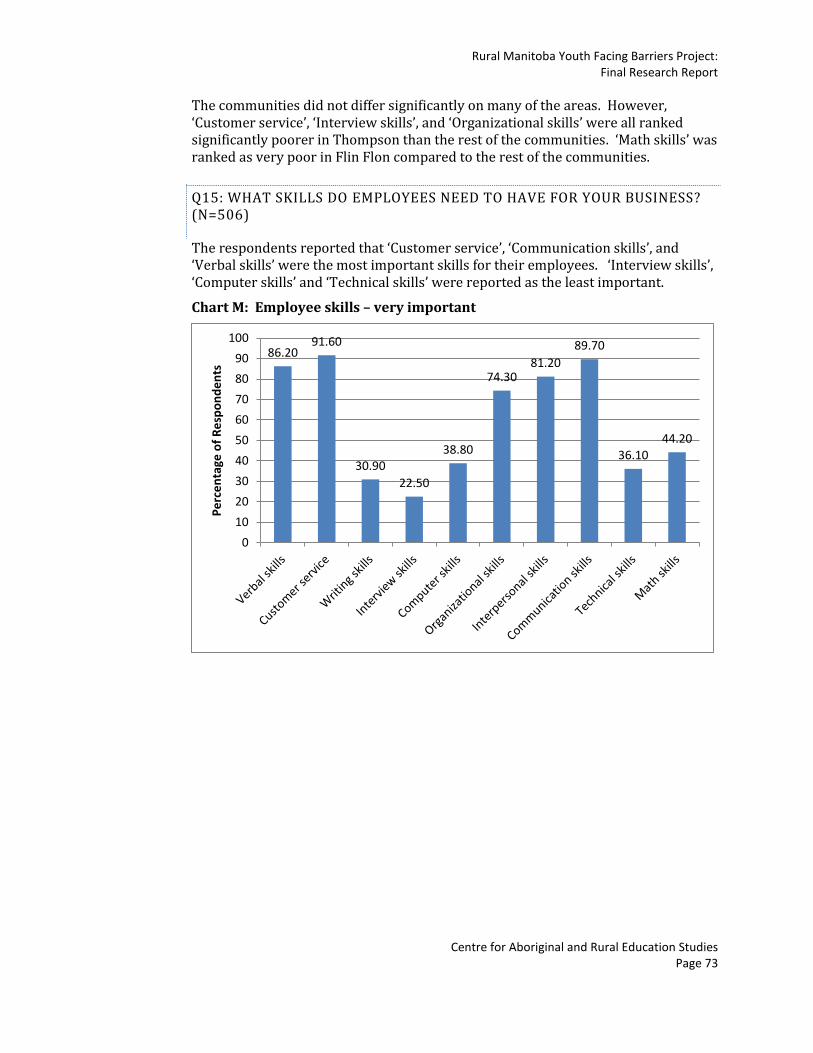
Rural Manitoba Youth Facing Barriers Project: Final Research Report
Centre for Aboriginal and Rural Education Studies Page 73
The communities did not differ significantly on many of the areas. However, ‘Customer service’, ‘Interview skills’, and ‘Organizational skills’ were all ranked significantly poorer in Thompson than the rest of the communities. ‘Math skills’ was ranked as very poor in Flin Flon compared to the rest of the communities.
Q15: WHAT SKILLS DO EMPLOYEES NEED TO HAVE FOR YOUR BUSINESS? (N=506)
The respondents reported that ‘Customer service’, ‘Communication skills’, and ‘Verbal skills’ were the most important skills for their employees. ‘Interview skills’, ‘Computer skills’ and ‘Technical skills’ were reported as the least important.
Chart M: Employee skills – very important
86.20 91.60
30.90
22.50
38.80
74.30 81.20
89.70
36.10 44.20
0
10
20
30
40
50
60
70
80
90
100
Pe
rce
nta
ge o
f R
esp
on
de
nts
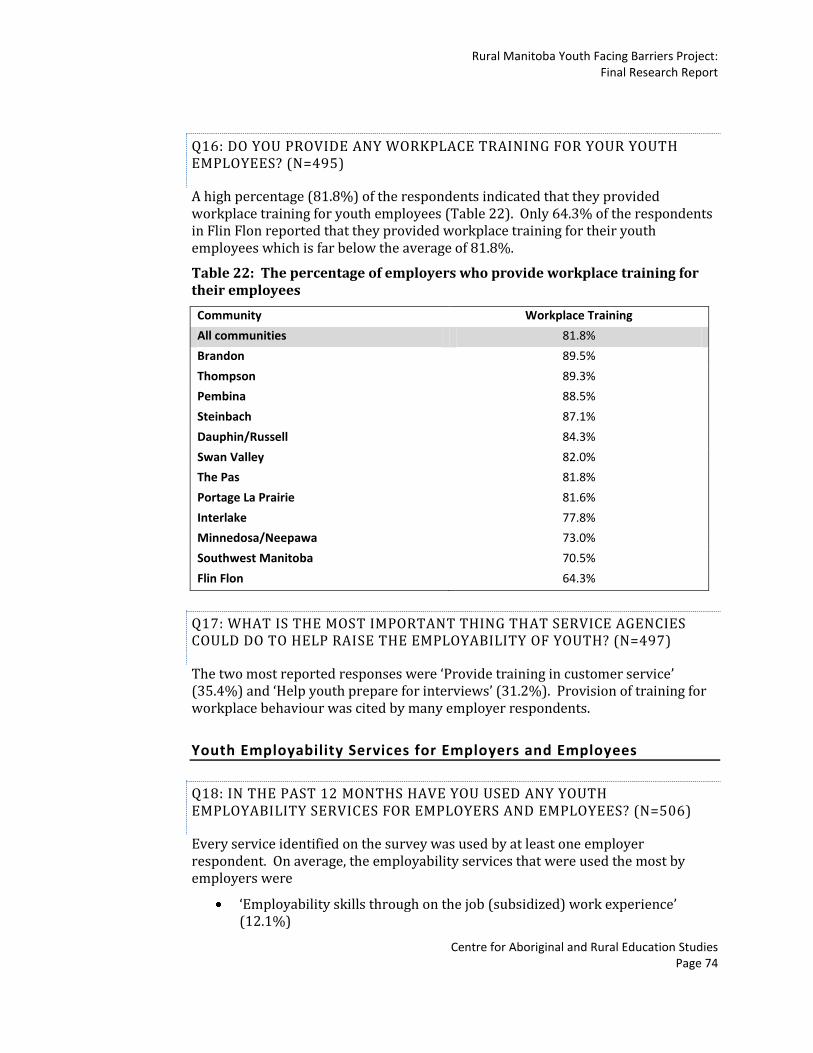
Rural Manitoba Youth Facing Barriers Project: Final Research Report
Centre for Aboriginal and Rural Education Studies Page 74
Q16: DO YOU PROVIDE ANY WORKPLACE TRAINING FOR YOUR YOUTH EMPLOYEES? (N=495)
A high percentage (81.8%) of the respondents indicated that they provided workplace training for youth employees (Table 22). Only 64.3% of the respondents in Flin Flon reported that they provided workplace training for their youth employees which is far below the average of 81.8%.
Table 22: The percentage of employers who provide workplace training for their employees
Community Workplace Training
All communities 81.8%
Brandon 89.5%
Thompson 89.3%
Pembina 88.5%
Steinbach 87.1%
Dauphin/Russell 84.3%
Swan Valley 82.0%
The Pas 81.8%
Portage La Prairie 81.6%
Interlake 77.8%
Minnedosa/Neepawa 73.0%
Southwest Manitoba 70.5%
Flin Flon 64.3%
Q17: WHAT IS THE MOST IMPORTANT THING THAT SERVICE AGENCIES COULD DO TO HELP RAISE THE EMPLOYABILITY OF YOUTH? (N=497)
The two most reported responses were ‘Provide training in customer service’ (35.4%) and ‘Help youth prepare for interviews’ (31.2%). Provision of training for workplace behaviour was cited by many employer respondents.
Youth Employability Services for Employers and Employees
Q18: IN THE PAST 12 MONTHS HAVE YOU USED ANY YOUTH EMPLOYABILITY SERVICES FOR EMPLOYERS AND EMPLOYEES? (N=506)
Every service identified on the survey was used by at least one employer respondent. On average, the employability services that were used the most by employers were
‘Employability skills through on the job (subsidized) work experience’ (12.1%)

Rural Manitoba Youth Facing Barriers Project: Final Research Report
Centre for Aboriginal and Rural Education Studies Page 75
‘Canada Summer Jobs’ (12%) ‘Apprenticeship Program’ (10.4%) ‘Province of Manitoba programs (10%).
In terms of individual communities, some of the communities used the services more frequently than others. The ‘Apprenticeship Program’ was used by 34.6% of the respondents in Pembina Valley, which was much higher than the average of 10.4%. In Interlake, the ‘Employability skills through on the job (subsidized) work experience’ was used by 30% of the respondents, which was significantly higher than the 12.1% average.
An interesting finding was that in Dauphin/Russell, approximately 30% of the respondents reported that they did not know about many of the employment services. They may need more information in this community about the services available to them.
Rural Manitoba Youth Facing Barriers Project: Final Research Report
Centre for Aboriginal and Rural Education Studies Page 76
The Centre for Aboriginal and Rural Education Studies (CARES) is an applied research institute of
the Faculty of Education at Brandon University. Its role is to promote and facilitate research
activities that are of interest to rural, northern, aboriginal and rural school divisions, communities
and related organizations. The CARES also offers research training and networking opportunities
for educational researchers actively involved in aboriginal and rural education research.