rural poverty in remote papua new guinea case - care australia
TRANSCRIPT

Rural poverty in remote Papua New Guinea Case study of Obura-Wonenara DistrictCate Rogers, Richard Bleakley, Wala Ola and CARE Integrated Community Development Project Team
DEVELOPMENT POLICY CENTRE, CRAWFORD SCHOOL OF ECONOMICS AND GOVERNMENT, ANU
© Josh Estey/CARE

2
Abstract
Papua New Guinea is home to around 6.7 million people, with approximately 87 per cent living in rural
areas. Five influential studies conducted over a 30 year period suggest a strong spatial component to
disadvantage and show relatively little change in the poorest areas over time. Isolation, lack of income
earning opportunities and geography appear to be important factors in community disadvantage. At an
individual level, poor education attainment and malnutrition are characteristics the disadvantaged have in
common. A survey of 262 families in the Obura-Wonenara district of Eastern Highlands Province provides
insight into the lives of the rural poor and shows dire levels of hardship. The lives of the villagers
surveyed are dominated by vulnerability to disasters, ill health, low cash incomes and limited income
earning potential. Improving education access and quality and reducing the isolation of communities
through the provision of infrastructure are important policy responses to address disadvantage. To
monitor changes in levels of disadvantage, the maternal mortality rate and the incidence of stunting in
children should be considered key indicators of success. More work on possible policy options to address
disadvantage in remote rural communities should emerge from the implementation of CARE’s Integrated
Community Development Project and planned research on risks and coping mechanisms of people living in
remote rural Papua New Guinea.
© Josh Estey/CARE
3
Abstract 2
Preface and Acknowledgements 4
Tables, Charts and Figures 5
Executive Summary 6
Introduction 6
Poverty in rural PNG 7
The Yelia Local-Level Government Area in Obura-Wonenara District 8
Implications for policy and research 9
Chapter 1: What do we already know about rural poverty in PNG? 11
Context 11
Sources of data on poverty in PNG 12
Research on rural poverty in PNG 14
Where are the most disadvantaged communities? 15
Characteristics of disadvantaged areas 17
Characteristics of disadvantaged populations 18
Chapter 2: CARE baseline survey /description of data collection 20
Eastern Highlands characteristics 20
Objective of baseline study 20
Methods 20
Household survey 22
Focus Groups 22
Semi-structured interviews 23
Limitations in approach 24
Chapter 3: Descriptive Data from Yelia Survey 25
Basic demographic data 25
Education Levels 27
Literacy 29
Nutrition 30
Illness 31
Maternal mortality and child health 32
Hygiene and Sanitation 33
HIV/AIDS 33
People living with a disability 33
Disasters 34
Law and order issues 35
Livelihoods and household income 36
Chapter 4: Discussion and conclusions 38
Implications for policy and research 39
Appendix A 42
References 43
© Josh Estey/CARE
4
Preface and Acknowledgements
This report is the product of a collaboration between the Development Policy Centre in the Crawford
School of Economics and Government and CARE Australia. The main author of this report is Cate Rogers.
Cate is a Research Associate with the Development Policy Centre at the Crawford School of Economics and
Government, ANU. She is also a PhD candidate at the Crawford School and has a she has over a decade’s
experience in international development, including four years evaluating development programs. The
Integrated Community Development Project team played a critical role in collecting data and contributing
to the analysis for this report. The team includes: Richard Bleakley, Wala Ola, Sewege Mao, Nancy Taget,
Stanley Nenewa, Cynthia Lahui, Inderlynn Oli, Daure Kiromat, Lisa Soso, Jocelyn Sapura, Ernest Yagrinai,
Yambata Karmani and at CARE Australia Michelle Lettie and Jenny Clement.
The authors would like to acknowledge the financial support of the Australian Agency for International
Development (AusAID) for the Integrated Community Development Project, as well as Mundango Abroad’s
contribution to this research, and CARE donors for their on-going support of CARE’s work in the Eastern
Highlands. The views expressed in this publication are the sole responsibility of the authors and under no
circumstances reflects the position of the Australian Government or any organisations referred to in the
publication.
© Josh Estey/CARE
5
TablesTable 1.1: Most recent data on key indicators of welfare in Papua New Guinea 13
Table 1.2: Comparison of most disadvantaged districts between different studies 16
Table 2.1: Data collection methods 21
Table 3.1: Summary information on surveyed households by cluster (Yelia LLG, raw data) 25
Table 3.2: Vulnerable groups as percentage of surveyed population 26
Table 3.3: Per cent of people with no schooling by region (2006 DHS) 27
Table 3.4: Years of schooling (household survey) 28
Table 3.5: Reasons children do not attend school (2006 DHS ) 29
Table 3.6: Literacy level by gender (household survey) 30
Table 3.7: Illnesses present over the last month as a proportion of those reporting illness (household survey) 31
Table 3.8: Maternal health and birth attendants (per cent of parents of children aged 0-5, n=152) 32
Table 3.9: Composition of agriculture sector earnings (per cent of income over the last month, household survey) 36
ChartsChart 3.1: Distance to health facility (household survey) 32
Chart 3.2: Steps taken to prepare for disasters (per cent of total focus group responses on disaster preparedness) 35
Chart 3.3: Reported maximum income earned in any month across 2009 (household survey) 37
FiguresFigure 1: Demographic distribution of participants in household survey (Yelia LLG) 26
© Josh Estey/CARE
6
Introduction
This report is a result of collaboration between CARE Australia and the Development Policy Centre, ANU. Its
aim is to draw attention to the issue of disadvantage in remote rural Papua New Guinea. It does this by
examining research going back almost forty years into rural poverty in Papua New Guinea to identify the
features of poor rural communities and the characteristics of people that live in them. It then presents
data from a baseline survey of a remote, disadvantaged area in Eastern Highlands Province, Yelia Local
Level Government area. Although the data from Yelia LLG should not be generalised, it is a powerful
illustration of life in rural and remote PNG for a disadvantaged community.
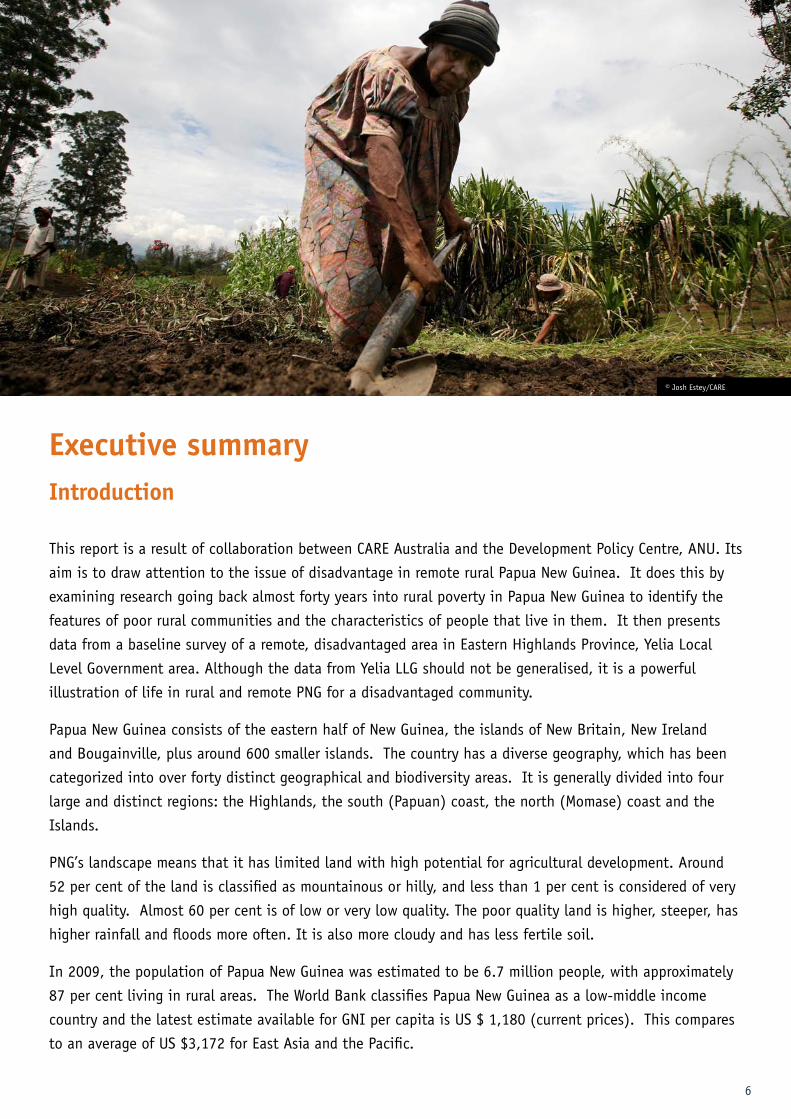
Papua New Guinea consists of the eastern half of New Guinea, the islands of New Britain, New Ireland
and Bougainville, plus around 600 smaller islands. The country has a diverse geography, which has been
categorized into over forty distinct geographical and biodiversity areas. It is generally divided into four
large and distinct regions: the Highlands, the south (Papuan) coast, the north (Momase) coast and the
Islands.
PNG’s landscape means that it has limited land with high potential for agricultural development. Around
52 per cent of the land is classified as mountainous or hilly, and less than 1 per cent is considered of very
high quality. Almost 60 per cent is of low or very low quality. The poor quality land is higher, steeper, has
higher rainfall and floods more often. It is also more cloudy and has less fertile soil.
In 2009, the population of Papua New Guinea was estimated to be 6.7 million people, with approximately
87 per cent living in rural areas. The World Bank classifies Papua New Guinea as a low-middle income
country and the latest estimate available for GNI per capita is US $ 1,180 (current prices). This compares
to an average of US $3,172 for East Asia and the Pacific.
Executive summary
© Josh Estey/CARE

7
Poverty in rural Papua New GuineaMuch of what we know about poverty in Papua New Guinea is based on a limited number of national level
surveys and data sets. The most significant of these have included census data (1980, 1990, 2000),
Demographic Health Surveys (1981, 1991, 1996 and 2006), a National Nutrition Survey (1982-83) and
a National Household Survey (1996). The PNG Resource Information System (completed 1986), which
collected geographical data on the environment and resources, has also been used in several studies to
supplement survey-based data.
The most recent analysis on poverty in PNG is based on the National Household Survey of 1996. This
estimated that overall 37.5 per cent of Papua New Guineans lived in poverty. Rural poverty was estimated
to be almost double that of urban areas (41.3 per cent compared to 16.1 per cent).
There have been five major studies of rural poverty in PNG; Wilson (1975), De Albuquerque & D’Sa
(1986), Hanson et al (2001), Gibson et al (2004) and the NEFC District Development Index (2004). The
earlier studies (pre-1986) relied mainly on administrative data whereas the latter used data collected
in large-scale national surveys such as the census, the national household survey and the PNG Resource
Information System.
The studies show that where the poor live in Papua New Guinea has changed very little since Wilson’s
1975 study. Disadvantaged districts tend to be located along the Indonesian border, including Sandaun
and Western Province. They cover many parts of the Highlands and Simbu and Morobe. Although district
boundaries have changed over the years, taking this into account, there appear to be six districts that
have consistently been found to be among the most disadvantaged. These include; Middle Ramu, Rai
Coast, Telefomin, Vanimo-Green River (incorporated in a district called Amanab), Jimi, and Goilala. Obura-
Wonenara was also considered by most of the studies to be disadvantaged.
Based on this research and the similarities between districts identified as poor over several decades, we
can make some judgements about the characteristics of poor areas. These areas are isolated, have low
levels of cash incomes and poor access to services. Factors such as isolation and limited cash earning
opportunities appear intractable. Environmental factors, which affect the productivity and reliability
of subsistence farming, mean that populations living in these areas are vulnerable to the effects of
food shortages and malnutrition in particular. Underlying each of these factors is the sometimes harsh
geography of Papua New Guinea.
Several of the studies also help to identify characteristics of individuals who live in the most
disadvantaged communities. These studies show that the most disadvantaged are likely to have low
levels of education, lower life expectancy, and poorer child nutrition than those better off. People living
in these communities are also far less likely to earn regular cash incomes, for example through waged
employment or the sale of cash crops.
8
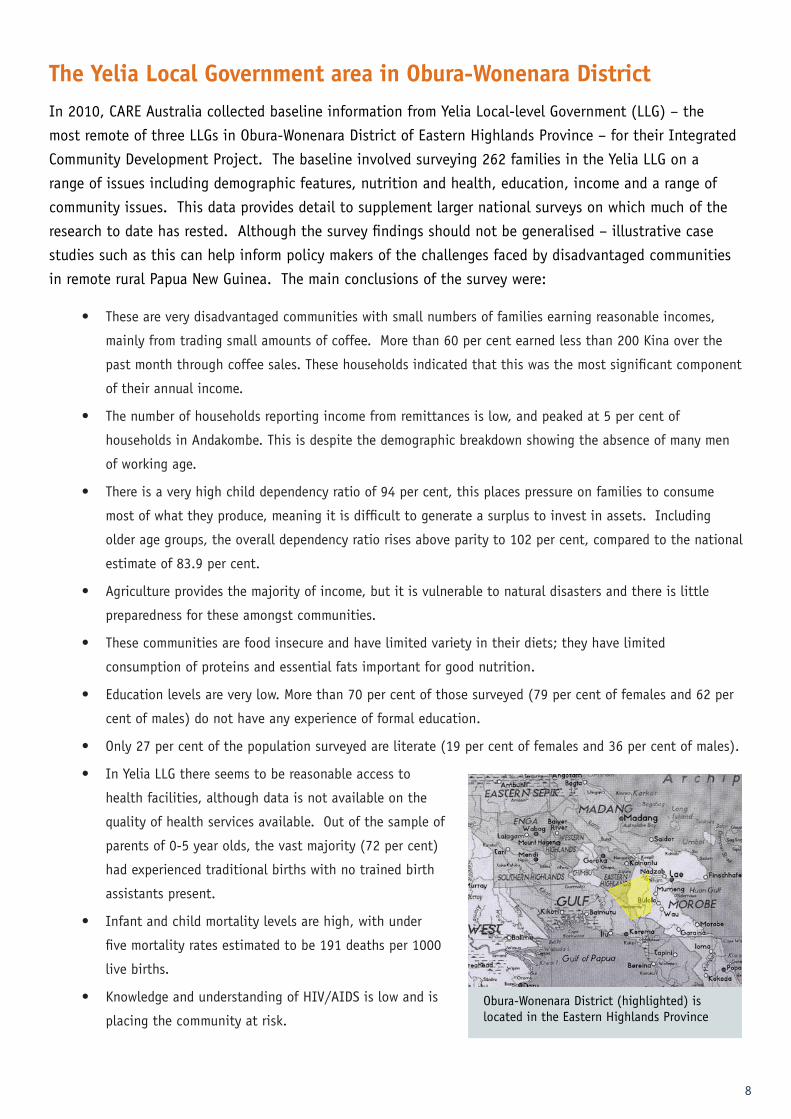
The Yelia Local Government area in Obura-Wonenara DistrictIn 2010, CARE Australia collected baseline information from Yelia Local-level Government (LLG) – the
most remote of three LLGs in Obura-Wonenara District of Eastern Highlands Province – for their Integrated
Community Development Project. The baseline involved surveying 262 families in the Yelia LLG on a
range of issues including demographic features, nutrition and health, education, income and a range of
community issues. This data provides detail to supplement larger national surveys on which much of the
research to date has rested. Although the survey findings should not be generalised – illustrative case
studies such as this can help inform policy makers of the challenges faced by disadvantaged communities
in remote rural Papua New Guinea. The main conclusions of the survey were:
• These are very disadvantaged communities with small numbers of families earning reasonable incomes,
mainly from trading small amounts of coffee. More than 60 per cent earned less than 200 Kina over the
past month through coffee sales. These households indicated that this was the most significant component
of their annual income.
• The number of households reporting income from remittances is low, and peaked at 5 per cent of
households in Andakombe. This is despite the demographic breakdown showing the absence of many men
of working age.
• There is a very high child dependency ratio of 94 per cent, this places pressure on families to consume
most of what they produce, meaning it is difficult to generate a surplus to invest in assets. Including
older age groups, the overall dependency ratio rises above parity to 102 per cent, compared to the national
estimate of 83.9 per cent.
• Agriculture provides the majority of income, but it is vulnerable to natural disasters and there is little
preparedness for these amongst communities.
• These communities are food insecure and have limited variety in their diets; they have limited
consumption of proteins and essential fats important for good nutrition.
• Education levels are very low. More than 70 per cent of those surveyed (79 per cent of females and 62 per
cent of males) do not have any experience of formal education.
• Only 27 per cent of the population surveyed are literate (19 per cent of females and 36 per cent of males).
• In Yelia LLG there seems to be reasonable access to
health facilities, although data is not available on the
quality of health services available. Out of the sample of
parents of 0-5 year olds, the vast majority (72 per cent)
had experienced traditional births with no trained birth
assistants present.
• Infant and child mortality levels are high, with under
five mortality rates estimated to be 191 deaths per 1000
live births.
• Knowledge and understanding of HIV/AIDS is low and is
placing the community at risk.Obura-Wonenara District (highlighted) is located in the Eastern Highlands Province

9
Implications for policy and researchThe policy implications that follow are not comprehensive and, given that they are largely based on several
decades of research, they are not new. However, data from the 2006 Demographic Health Survey and more
specifically, from Yelia LLG, show that they are still relevant. In the future, lessons emerging from the
implementation of the CARE Integrated Community Development Project and planned follow up research
will provide a foundation for more substantial exploration of policy options.
The major issues emerging from the research to date with implications for policy include:
• The most disadvantaged communities are likely to be those that are relatively isolated and have limited
access to infrastructure.
• The high degree of heterogeneity in conditions within provinces, and within districts, means that programs
to address disadvantage must be geographically targeted at least to the district level and in some areas to
the LLG.
• People living in these communities are likely to have lower life expectancy, be less educated, have higher
levels of illiteracy, limited access to waged employment and their children are more likely to suffer from
poor nutrition.
The research reviewed for this paper highlights the vital role that the provision of basic infrastructure can
play at the local level. The role of roads in reducing isolation and providing or maintaining (in the case of
road maintenance) access to services and markets needs to be part of any approach which aims to bring
greater development to where people live.
The high degree of heterogeneity between communities has implications for geographical targeting of
support. The work of the National Economic and Fiscal Commission to generate indicators of district
level disadvantage recognised the importance of being able to target assistance below the provincial
level. However, this work, which was completed in 2004, is now out-dated. Up to date data does not
exist which would allow programs to be targeted down to the district level on the basis of relative
disadvantage. The proposed Census of 2011 provides a good opportunity to gather reliable data on
individual characteristics associated with disadvantage. This, combined with information on services,
agriculture and environmental factors would take the government and donors some way towards being able
to employ efficient geographic targeting of anti-poverty programs.
At the level of the individual, as the Government of PNG’s revenues from natural resource exploitation
increases, opportunities could be explored to pilot cash transfers or conditional cash transfers to
disadvantaged areas. There is an increasing body of international evidence on the effectiveness of such
approaches that could be drawn on by the Government of PNG. Combined with the provision of relevant
information on what constitutes a healthy diet and how to avoid malnourishment, access to cash to
purchase fat, protein and fruit could have a significant impact on health and nutrition outcomes.
The 2006 DHS data revealed that poor school attendance was not simply about affordability. It also
raised questions about the demand for schooling and the perceived relevance of school from the parents’
perspective. Hence, there appear to be both demand and supply side issues in relation to education

10
services. From the children’s perspective, the DHS data generates questions about the ability of schools to
keep children interested and engaged. Addressing these issues of schooling quality will require investment
in an education system that is already stressed by the rapidly expanding population of school aged
children and the requirement to provide them with access to nine years of education. However, generating
demand for schooling and providing quality education is fundamental to addressing the high levels of
disadvantage experienced by some communities. In the long run it will offer people in disadvantaged
communities real choices about whether to remain in these locations and enhance their livelihoods or
seek opportunity elsewhere. Looking at the low levels of education in Yelia LLG it is clear that in this
community, choices are extremely limited.
Finally, in terms of monitoring changes in levels of disadvantage, there are two health related indicators
that could be a litmus test for this in Papua New Guinea. These are the incidence of stunting in children
(indicating malnutrition) and the maternal mortality rate. Neither of these is regularly monitored (the last
study of malnutrition in children was almost 30 years ago). Maternal mortality figures were produced in
2006 as part of the Demographic Health Survey, however, it is generally agreed that there were errors in
the sampling strategy that mean that the most recent figure is not reliable.
In terms of future research, the baseline data from Yelia LLG highlighted several areas that deserve further
investigation. These include the quality of services that were accessible to the communities, in particular
issues of whether health services were adequately equipped with appropriate medications, diagnostic tools
and staff. Given the reported high level of food insecurity, it would also be beneficial to investigate levels
of malnutrition, knowledge around dietary issues and access to supplementary foods.
The issue of the community’s vulnerability to various shocks, including climatic, agricultural and social
(e.g. crime) could also be further explored. Although many potential shocks were identified in the Yelia
LLG baseline, it is important to understand how shocks impact on communities, how they cope and how
quickly they recover. Knowing more about this will give further insights into the factors that the rural
poor must consider when making decisions such as whether or not to diversify their crops, or whether they
should send their child to school. This kind of information could be a major benefit in determining the
best ways to address disadvantage in these communities.

11
Chapter 1: What do we already know about rural poverty in Papua New Guinea?
ContextThis paper is a result of collaboration between CARE Australia and the Development Policy Centre. Its
aim is to draw attention to the issue of disadvantage in remote rural Papua New Guinea. It does this by
examining research going back almost forty years into rural poverty in Papua New Guinea, to identify the
features of poor rural communities and the characteristics of people that live in them. It then presents
data from a baseline survey of a remote, disadvantaged area in Eastern Highlands Province, Yelia Local
Level Government area. For comparison purposes data is also presented from the 2006 Demographic
Health Survey of Papua New Guinea.
Although the data from Yelia LLG should not be generalised, it is a powerful illustration of life in rural and
remote PNG for a disadvantaged community.
Papua New Guinea includes the eastern half of New Guinea, the islands of New Britain, New Ireland and
Bougainville, plus around 600 smaller islands. The country has a diverse geography, which has been
categorized into over forty distinct geographical and biodiversity areas. It is generally divided into four
large and distinct regions; the Highlands, the south (Papuan) coast, the north (Momase) coast, and the
Islands.
Papua New Guinea has a number of active volcanos and is active tectonically. It has extensive mountain
ranges, with a number of peaks over 4000 metres. There are major rivers including the Sepik River in the
North and the Fly River in the South. Average annual rainfall varies from more than a continuous 8000mm
per year in some mountainous areas to relatively low and seasonal with around 1000-1500mm in some
coastal areas. There are tropical temperatures in the lowlands and islands and milder temperatures in the
highlands.
PNG’s landscape means that it has limited land with high potential for agricultural development. Around
52 per cent of the land is classified as mountainous or hilly, and less than 1 per cent is considered of very
high quality. Almost 60 per cent is of low or very low quality. The poor quality land is higher, steeper, has
higher rainfall and floods more often. It is also more cloudy and has less fertile soil quality.
PNG is culturally diverse. Latest estimates are that there are 820 living languages (Harris 2007, p5). No
one ethnic group dominates economic or political life (Hanson et al 2001, p.11). Harris (2007) notes
that the linguistic and anthropological evidence suggests that societies in New Guinea developed to be
relatively small scale, socially and culturally isolated, with little contact with groups of any distance from
themselves. The comparative abundance of flora and fauna has allowed for relatively efficient subsistence
without the need for villagers to move over large tracts of land (Harris 2007, p.7).

12
In 2009, the population of Papua New Guinea was estimated to be 6.7 million people (UNICEF, 2011),
with approximately 87 per cent of the population living in rural areas (National Statistics Office 2009,
p.3). The World Bank classifies Papua New Guinea as a low-middle income country and the latest estimate
available for GNI per capita is US $ 1180 (current prices). This compares to US $3,172 for East Asia and
the Pacific (World Bank, 2011).
Sources of data on poverty in Papua New GuineaMuch of what we know about rural poverty in Papua New Guinea is based on a limited number of national
level surveys and data sets. The most significant of these have included:
• Census data, from 1980, 1990 and 2000
• A National Nutrition Survey in 1982-83 which was the first survey to collect anthropometric data for
children under 5 (allowing analysis of malnutrition)
• Urban Household Survey (1985-89), conducted in six provinces, covering a sample of 1093 households
(Gibson 1998, p.4)
• A National Household Survey, 1996 which was the first nation-wide survey of consumption and living
standards in PNG. It covered a random sample of 1200 households in 120 rural and urban sampling units
(Gibson and Rozelle 2002, p.3)
• Demographic Health Surveys, carried out in 1981 and 1991, 1996 and more recently in 20061.
• PNG Resource Information System (PNGRIS), completed in 1986 provides data on environmental attributes,
including altitude, landforms, slope gradient and rainfall, vegetation and soils. The Mapping Agricultural
Systems of PNG project (MASP), completed in 1998 provides information on village agriculture, agriculture
intensity, land management practices, cash incomes and rural populations (Hanson et al 2001, p.10).
1 The most recent DHS has been critiqued for having biased estimates. This is attributed to younger females (25-29) being over-sample relative to older females (45-49) year olds. (Tran et.al, n.d. p.23). The finding that the 2006 DHS had biased estimates throws into doubt the reliability of many of the statistics generated by the DHS. Importantly infant and child mortality and maternal mortality figures are likely to be compromised. These have therefore not been included in this report. Other figures from the 2006 DHS have been included but should be treated with caution.

13
Table 1.1: Most recent data on key indicators of welfare in Papua New Guinea
Indicator Year (Source) Rural Urban Total
Incidence of poverty 1996 (NHS) 41.3 16.1 37.5
Never attended school 1996 (DHS)
2006 (DHS)
50.5
42.3
24.4
23.1
46
39.6
Per cent of population aged 10 and
above who are literate
1996 (NHS)
2000 (Census)
50.5
56.2
Per cent of population aged 10 and
above who completed Grade 6
1996 (DHS)
2000 (Census)
36.9
38.3
Infant mortality (per 1000 live births) 1996 (DHS)
2000 (Census) 69 29
73
64
Under 5 mortality (per 1000 live births) 2000 (Census) 95 35 87
Maternal Mortality Rate (per 100,000 live
births)
2008, adjusted
(UNICEF)
250
Life expectancy at birth (yrs) 2000 (Census) 53 59.6 54
Incidence of stunting in children under 5
(per cent)
1996 (NHS) 43
Sources: World Bank 2004; Tables 1.4 & 1.5, pp 10-13; NSO 2009; Tables 2.42 & 2.43, pp 16-17

14
Research on rural poverty in Papua New GuineaNot only is there limited data on which to draw in understanding the incidence and nature of poverty
in Papua New Guinea, a further limitation is that much of this data is now very out-dated. Appendix A
contains a table outlining the major variables and sources of data for five major studies of rural poverty in
PNG. These studies include Wilson (1975), De Albuquerque & D’Sa (1986), Hanson et al (2001), Gibson et
al (2004) and the National Economic and Fiscal Commission (NEFC) District Development Index (2004).
Wilson (1975) compared the then 79 sub-districts on village cash crop production, hospital and health
centre beds, administrative staff, school enrolments, access to services and the grade of local government
councils. He identified that the areas with the lowest level of development tended to be isolated
and those that had effectively only recent contact outside of their villages. Wilson grouped the sub-
districts he examined into six groups. Those in the lowest group included isolated highlands (Menyamya,
Wonenara, Tabibuga, Karimui, Lake Kopiago and Telefomin) and lowlands (Nomad, Amanam, Ramu and two
coastal districts, Pomio and Saidor).
The next lowest in level of development were isolated areas of late contact, or in swampy parts of
the great river basins. Wilson noted that some areas with moderately good access in 1975 had little
development because of late contact (Wilson 1975, p.84).
De Albuquerque & D’Sa (1986) use 26 indicators to rank 87 districts by level of disadvantage. They
then clustered districts according to their status against different indicators of disadvantage. The least
developed districts were found to be low in educational status, have poor health care coverage and access
to services. These districts are largely dependent on subsistence agriculture with no urban areas and little
or no in-migration (De Albuquerque & D’Sa 1986,p.35).
De Albuquerque & D’Sa (1986) emphasise intraregional and intraprovincial inequalities and the problems
this creates for planning and resource allocation at a provincial level (p. 39). D’Sa (1987) reiterates the
point on the heterogeneous nature of districts in Papua New Guinea, adding that this raises concerns
about their comparability. They vary in terms of population size, density, topography and culture (D’Sa
1987, p.287). In his 1987 paper, D’Sa used 30 socio-economic indicators to rank 87 districts by level
of disadvantage. He notes that data was missing on income, agricultural output, transport and urban
services and suggests that were these included they may have influenced the rankings of the districts. In
particular, he notes the Highlands may improve its ranking due to the presence (at the time) of relatively
good roads and income from coffee production (D’Sa 1986, p.307).
The 2004 paper by Gibson et al, which informed the World Bank’s Poverty Assessment of that year, is the
most recent and comprehensive attempt to identify and map the poorest areas of Papua New Guinea. The
team drew on information from the 1996 Household Survey and combined it with data from the 2000
Census and resource and mapping databases with national coverage (Gibson et al 2004, p.2). The poverty
line was established by taking the nominal value of consumption per adult equivalent (children aged
0-6 counted as 0.5 of an adult in consumption terms) and deflating it by the costs of a basket of locally
consumed foods providing 2200 calories per day, and including a non-food allowance. The annual value of

15
the poverty line varied substantially across PNG, in 1996 prices it was K261 per adult equivalent in rural
Momase, K468 in the Highlands, K482 in the Islands and K552 in the Southern Region (Gibson et al 2004,
p. 5).
Gibson et al (2004) found that the highest poverty rates were in provinces bordering West Papua, along
the fringe areas besides the Central Highlands Valleys and extending along the mountainous centre to
the tip of the Island of New Guinea. Their poverty maps highlight that Provinces have LLGs from both the
highest and lowest poverty class. There is therefore great variation within provinces. Although there is
less variation if districts are examined, there are still large differences in poverty rates. As an example,
they highlight the case of Eastern Highlands Province. Here the poverty rate for Obura-Wonenara District is
five times higher than for rural households in Goroka District (Gibson et al 2004, pp 10-11).
Where are the most disadvantaged communities?It seems that the most disadvantaged communities have changed little over time. They tend to be located
along the Indonesian border including Sandaun and Western Province. They cover many parts of the
Highlands and Simbu and Morobe.
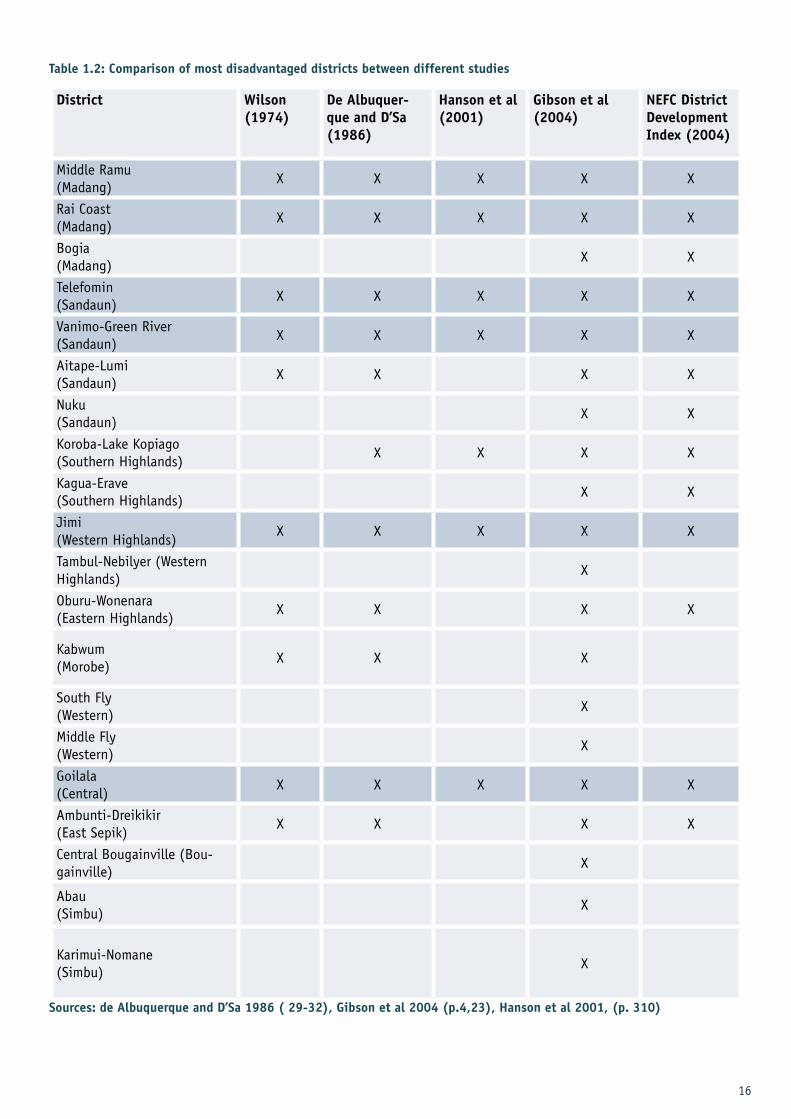
Table 1.2 compares the ranking of the 20 most disadvantaged communities in five studies. For comparison
purposes the communities selected are based on those ranked in the 20 most disadvantaged by Gibson
et al (2004). A cross indicates that the relevant study also found the community to be among the most
disadvantaged in Papua New Guinea 2. While it is difficult to compare studies directly due to different
methodology, and changes in district names, there appear to be six districts that have consistently been
found to be among the most disadvantaged. These include; Middle Ramu, Rai Coast, Telefomin, Vanimo-
Green River (incorporated in a district called Amanab), Jimi, and Goilala. Obura-Wonenara was considered
by most of the studies as disadvantaged.
Table 1.2 shows that there is significant agreement in where the poor are located, and very little change
over time. This may be a reflection of the immutable aspects of PNG’s geography. It may also reflect a
lack of interventions by successive governments or aid donors to improve the livelihoods of the poor in
these areas. In later studies (post 1996) this may also relate to the fact that much of the analysis draws
on the same data sets.
2 De Albuquerque and D’Sa (1986) caution against making direct comparisons between their and Wilson’s ranking. Wilson used sub-districts, which where possible, they mapped to their districts. Wilson also grouped his findings into clusters, hence where Wilson’s ranking coincide with others, it indicates that the district is in his lower two clusters.
16
Table 1.2: Comparison of most disadvantaged districts between different studies
District Wilson (1974)
De Albuquer-que and D’Sa (1986)
Hanson et al (2001)
Gibson et al (2004)
NEFC District Development Index (2004)
Middle Ramu (Madang)
X X X X X
Rai Coast (Madang)
X X X X X
Bogia(Madang)
X X
Telefomin(Sandaun)
X X X X X
Vanimo-Green River(Sandaun)
X X X X X
Aitape-Lumi(Sandaun)
X X X X
Nuku(Sandaun)
X X
Koroba-Lake Kopiago(Southern Highlands)
X X X X
Kagua-Erave(Southern Highlands)
X X
Jimi(Western Highlands)
X X X X X
Tambul-Nebilyer (Western Highlands)
X
Oburu-Wonenara(Eastern Highlands)
X X X X
Kabwum(Morobe)
X X X
South Fly(Western)
X
Middle Fly(Western)
X
Goilala(Central)
X X X X X
Ambunti-Dreikikir(East Sepik)
X X X X
Central Bougainville (Bou-gainville)
X
Abau(Simbu)
X
Karimui-Nomane(Simbu)
X
Sources: de Albuquerque and D’Sa 1986 ( 29-32), Gibson et al 2004 (p.4,23), Hanson et al 2001, (p. 310)
17
Characteristics of disadvantaged areasBased on the research that has been concluded so far, and the large similarities between districts
identified as poor over several decades, it is possible to draw some conclusions about the characteristics
of poor areas. These areas are isolated, have low levels of cash incomes and poor access to services.
Underlying each of these factors is geography.
Isolation (or the lack of it) has been captured in the research by measures of accessibility, including
factors such as accessibility to district headquarters (Wilson 1975) and through variables such as the
agriculture system being remote from services (Hanson et al 2001 and Gibson et al 2004). De Albuquerque
and D’Sa (1986) had an accessibility variable and considered that the presence of an urban centre would
be a plus for development.
Although cash income was only directly estimated in the more recent studies, it was captured through
variables such as smallholder cash crop production by district (Wilson 1975) and income from agriculture
(Hanson et al 2001). Albuquerque and D’Sa (1986) suggested that the lack of data on income was a
shortcoming of their study, although they did include a variable on employment which may, to an extent,
have captured some income effect given low levels of formal sector employment.
Poor service levels are reflected largely in education variables that are used in each of the studies. They
are also more directly measured by variables such as Wilson’s (1975) level of local services and Hanson et
al’s (2001) access to services.
The influence of geography is captured in each of the studies, directly (for example land potential in
Hanson et al 2001) or geographic and climatic features (Gibson et al 2004). It is also captured in many of
the variables relating to accessibility.
For Allen, Bourke & Gibson (2004), geography is the major factor behind underdevelopment in PNG. They
argue that underdevelopment and poverty in PNG is primarily the outcome of environmental conditions
that prevent people from engaging in markets (export and domestic). The environment, which includes
rugged mountains, high rainfall and large rivers and swamps, means that the transport system is
fragmented, this results in long travelling times to transport infrastructure (p. 202). Air travel, where
available, is expensive and beyond the reach of most.
Gibson and Rozelle (2002) examined the relationship between poverty and infrastructure in PNG.
They found that the incidence of poverty more than doubles for those living more than 60 minutes
from the nearest road. They regressed per capita consumption against travelling time to the nearest
transport facility and found that a one hour increase in travelling time reduced consumption by ten
per cent. Distance to transport infrastructure was also found to raise the store price of rice (a common
supplementary food) (Gibson and Rozelle 2002, p.11). They conclude therefore, that remoteness may
matter to poverty not just because of the characteristics of the people who live in remote areas (lower
human capital) but because rural infrastructure has a direct effect. Given this, reducing travel times to
the nearest road would be an effective anti-poverty strategy in the rural sector (Gibson and Rozelle 2002,
pp18-19).
18
Allen, Bourke and Gibson (2005), on the other hand, note that building roads is not a practical solution to
addressing poverty in PNG. They cite three reasons for this 1) many poor areas already have or had access
to roads due to extensive colonial road building programs, 2) those that do not have roads are located
where building roads would be expensive and technically challenging and 3) PNG does not maintain the
roads it currently has (Allen, Bourke & Gibson 2005, p.213).
Characteristics of disadvantaged populationsThe studies examined show that the districts that are most disadvantaged are more likely to be inhabited
by people with lower levels of education (de Albuquerque and D’Sa 1986, Gibson et al 2004, NEFC 2004),
lower life expectancy (NEFC 2004), and poorer child nutrition (Hanson et al 2001) than those better
off. People living in these communities are also far less likely to earn regular cash incomes, for example
through waged employment.
Allen, Bourke and Gibson (2005) examined the consequences of being poor in the PNG subsistence sector.
When PNG districts are ranked by predicted poverty rate and the upper and lower quartiles are compared,
they found statistically significant differences in indices of child growth, adult literacy and school
enrolment (p. 212).
Bourke (2001) raised the issue of a lack of food security as another dimension of rural poverty. The main
short-term threats to food security are environmental, for example excessive rainfall or drought and local
events such as fighting or disease. Longer term, the threats include low cash income, land degradation
and population pressures. Cash plays a vital role in food security in allowing villagers to buy food when
their subsistence crops fail. The main foods purchased are rice, flour, animal fat and vegetable oil (p. 10).
A lack of food security is one contributor to malnutrition levels and stunting in children. Data reveal large
differences in rates of stunting in children across Papua New Guinea. Mueller (2001) used data from the
1982-83 National Nutrition Survey to examine the spatial pattern of growth in children in PNG. Diet and
socioeconomic status were found to be the two most important single groups of variables in predicting
patterns of growth. The high prevalence of stunting in PNG children has been attributed to the low
protein and energy content of the typical PNG diet (Mueller 2001, p. 421). Root crops which made up 80
per cent of total dietary energy crowd out other foods such as those with protein and other nutritional
requirements (Mueller 2001, 419). Allen, Bourke and Gibson (2005) also focus on child nutrition, noting
that there is a significant difference in human growth across PNG (p. 202). Stunted children have IQ loss,
are less likely to finish school and suffer a range of chronic illnesses in later life. Children with mild or
moderate malnutrition are 2.5 to 4.6 times more likely to die than their healthy weight range counterparts
(Hunt 2005, p.11).
Even though acute shortages of food are rare (Mueller 2001, 419), data on food consumption provides
useful insights into the link between malnutrition and poverty. Muntwiler and Shelton (2001) report
on a survey of 73 families in Eastern Highlands Province conducted by the Salvation Army Agriculture
Development Program in June 1999. The survey sought information on families’ nutritional status.

19
They concluded that:
• Sweet potatoes and greens made up the bulk of the diet but there were some shortages in these in
dry weather;
• Because of high cost households were unable to purchase protein foods such as tinned fish on a
regular basis;
• Very few households reported eating protein in the last day. Although pigs are the most common
animal, they do not make a regular contribution to villagers diets because they are reserved for
special occasions;
• The protein contribution was often constrained by a lack of planting material and seeds for plants
such as peanuts and winged beans; and
• Just over half of the households eat only two meals a day. Although, to some extent, consumption
is supplemented by ‘snack foods’ such as avocado, sugar-cane, banana and guava. (Muntwiler and
Shelton 2001, p441)
Mueller (2001) confirms the importance of cash income for supplementing diet through research showing
that child growth significantly improved with increasing incomes from cocoa or coffee (Mueller 2001,
p.423).

20
Chapter 2:CARE baseline survey /description of data collection
The CARE Integrated Community Development Project proposes to pilot approaches to address poverty in
disadvantaged and impoverished districts in PNG. This work has started in Obura Wonenara District and
an early part of the program involved gathering baseline data on the situation of people living in Yelia
local-level government region of Obura Wonenara. Baseline data collection was also recently undertaken
in Tairora Gatsup and Lamari LLGs. However, this data is still being processed. While the primary purpose
of the baseline is to inform program interventions, it also provides a rich source of data for analysis of
poverty in PNG.
Eastern Highlands characteristicsThe Eastern Highlands is located in the centre of PNG and covers around 11,000 km2. The Provincial
capital is Goroka. The province can be divided into two areas in terms of physical and development
characteristics. The northern valleys have good rainfall and soils and access to markets in Goroka and
Lae. The south is mountainous and remote. The north of the province is relatively well serviced by the
Highlands Highway and a network of smaller roads. Whereas, there are limited roads through Lufa and
Okapa districts and limited roads in Obura Wonenara.
The Obura-Wonenara District runs the full length of the eastern boundary of Eastern Highlands Province.
It is comprised of three LLGs, Yelia in the south, Gadsup Tairora and and Lamari in the north. Most people
live within altitudes of 1400-1800 metres, however there are also communities, such as Andakombe at an
altitude of 1050m.
Objective of baseline study The aim of the baseline study was to gather data to enable CARE to make an informed and objective
selection of target areas, design specific activities under the project and identify appropriate performance
indicators. The analysis also aimed to deepen CARE’S understanding of the underlying causes of poverty,
gender power relations and service delivery – including through vulnerability and disability assessments.
The baseline exercises were carried out with district/LLG administration, with one output being an up-to-
date district LLG inventory and situation analysis.
MethodsCARE undertook primary data collection via three approaches, focus group discussions, household surveys
and key informant interviews. The methods used are summarised in Table 2.1 below:

21
Table 2.1: Data collection methods
Method Informant/s Location/Additional informationHousehold Survey 262 households, each adult member
present surveyed , covered 1726 people
Clusters (Yelia LLG)Andakombe (1)Marawaka (2)Simogu (3)Wonenara (4)
Focus Groups 37 Focus Groups, where feasible divided into:Adult femaleAdult maleYouth femaleYouth male
Key Informant interviews District AdministrationLocal Level GovernmentWard Development Committees
Airlines
Health Facilities
Schools (all community schools which go up to Grade 6)
Andakombe, Butnari,Yani, Jomuru, Kwakasilo, Ororingo, Simogu
Mission Aviation Fellowship (MAF)New Tribes Mission (NTM)Seventh Day Adventist Airlines (SDA)
Wonenara, Simogu, Andakombe, Marawaka
Yani , Wonenara, Andakombe, Marawaka
Secondary Data sources National Agriculture Research Insti-tute (NARI), various research papers, Rural Development Handbook
22
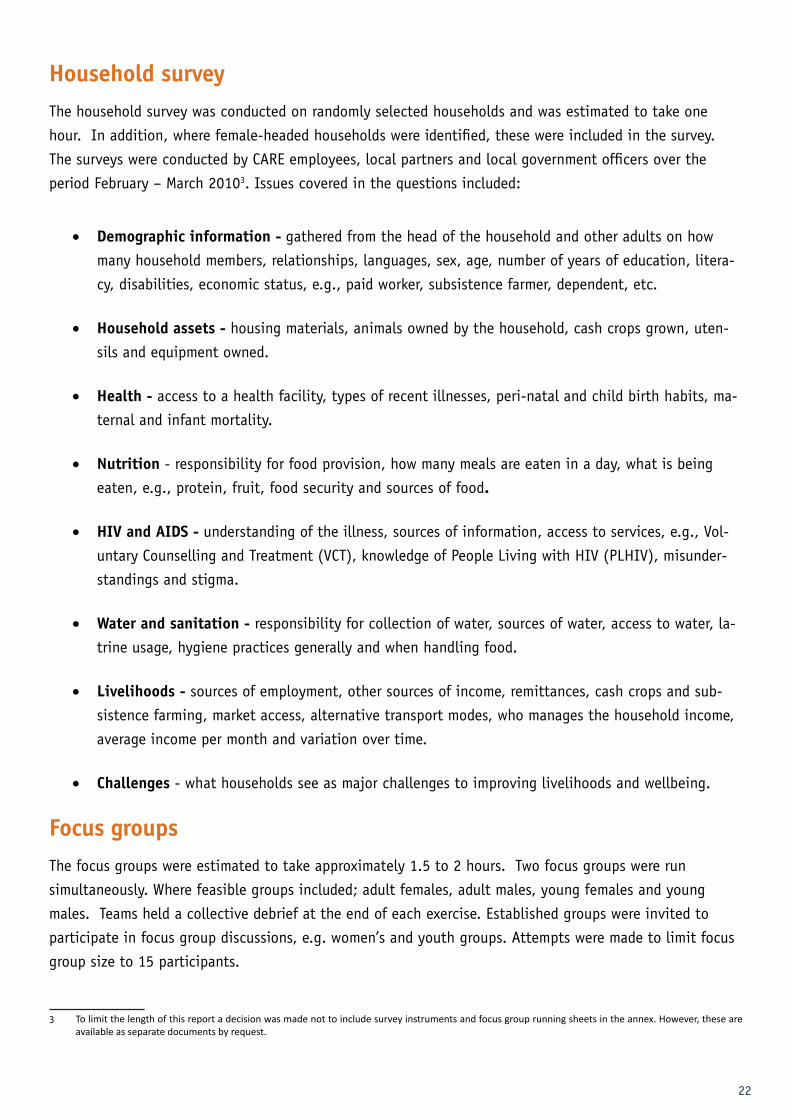
Household survey The household survey was conducted on randomly selected households and was estimated to take one
hour. In addition, where female-headed households were identified, these were included in the survey.
The surveys were conducted by CARE employees, local partners and local government officers over the
period February – March 20103. Issues covered in the questions included:
• Demographic information - gathered from the head of the household and other adults on how
many household members, relationships, languages, sex, age, number of years of education, litera-
cy, disabilities, economic status, e.g., paid worker, subsistence farmer, dependent, etc.
• Household assets - housing materials, animals owned by the household, cash crops grown, uten-
sils and equipment owned.
• Health - access to a health facility, types of recent illnesses, peri-natal and child birth habits, ma-
ternal and infant mortality.
• Nutrition - responsibility for food provision, how many meals are eaten in a day, what is being
eaten, e.g., protein, fruit, food security and sources of food.
• HIV and AIDS - understanding of the illness, sources of information, access to services, e.g., Vol-
untary Counselling and Treatment (VCT), knowledge of People Living with HIV (PLHIV), misunder-
standings and stigma.
• Water and sanitation - responsibility for collection of water, sources of water, access to water, la-
trine usage, hygiene practices generally and when handling food.
• Livelihoods - sources of employment, other sources of income, remittances, cash crops and sub-
sistence farming, market access, alternative transport modes, who manages the household income,
average income per month and variation over time.
• Challenges - what households see as major challenges to improving livelihoods and wellbeing.
Focus groupsThe focus groups were estimated to take approximately 1.5 to 2 hours. Two focus groups were run
simultaneously. Where feasible groups included; adult females, adult males, young females and young
males. Teams held a collective debrief at the end of each exercise. Established groups were invited to
participate in focus group discussions, e.g. women’s and youth groups. Attempts were made to limit focus
group size to 15 participants.
3 To limit the length of this report a decision was made not to include survey instruments and focus group running sheets in the annex. However, these are available as separate documents by request.
23
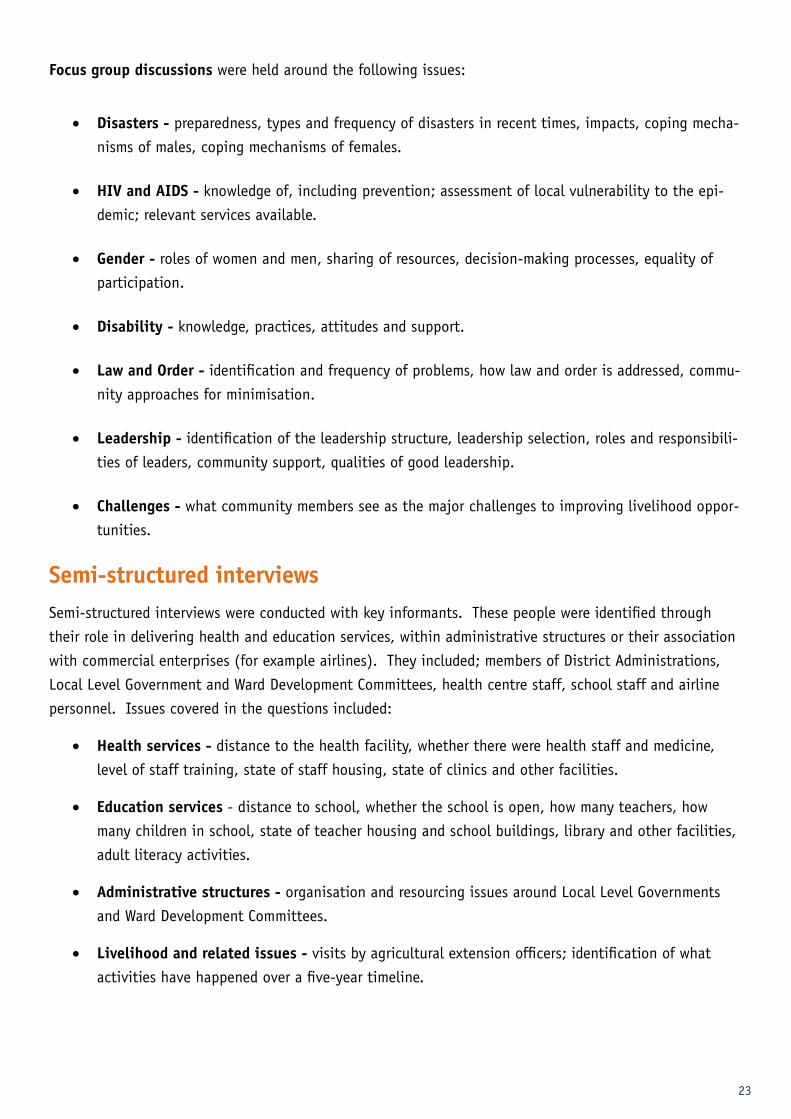
Focus group discussions were held around the following issues:
• Disasters - preparedness, types and frequency of disasters in recent times, impacts, coping mecha-
nisms of males, coping mechanisms of females.
• HIV and AIDS - knowledge of, including prevention; assessment of local vulnerability to the epi-
demic; relevant services available.
• Gender - roles of women and men, sharing of resources, decision-making processes, equality of
participation.
• Disability - knowledge, practices, attitudes and support.
• Law and Order - identification and frequency of problems, how law and order is addressed, commu-
nity approaches for minimisation.
• Leadership - identification of the leadership structure, leadership selection, roles and responsibili-
ties of leaders, community support, qualities of good leadership.
• Challenges - what community members see as the major challenges to improving livelihood oppor-
tunities.
Semi-structured interviewsSemi-structured interviews were conducted with key informants. These people were identified through
their role in delivering health and education services, within administrative structures or their association
with commercial enterprises (for example airlines). They included; members of District Administrations,
Local Level Government and Ward Development Committees, health centre staff, school staff and airline
personnel. Issues covered in the questions included:
• Health services - distance to the health facility, whether there were health staff and medicine,
level of staff training, state of staff housing, state of clinics and other facilities.
• Education services - distance to school, whether the school is open, how many teachers, how
many children in school, state of teacher housing and school buildings, library and other facilities,
adult literacy activities.
• Administrative structures - organisation and resourcing issues around Local Level Governments
and Ward Development Committees.
• Livelihood and related issues - visits by agricultural extension officers; identification of what
activities have happened over a five-year timeline.

24
Limitations in approach The baseline survey was intended to provide information to inform the development of CARE Australia’s
Integrated Community Development Project, the data collected should therefore be considered as
illustrative and should not be generalised.
The implementation of the baseline pilot was delayed due to an outbreak of severe inter-community
conflict in Gadsup Tairora LLG, one of the locations initially selected for the baseline pilot. This is an area
better served than Yelia LLG by infrastructure; it also has a higher population density and better access to
services.
The major limitation in the approach affects data on nutrition and health. On these issues, people
were asked to recall meal frequency and composition (on the day of the survey), and the type of illness
experienced in the household over the last month. In the absence of medical testing or specialised
questionnaires on these issues, the baseline data is useful for gaining information on food availability,
types of food consumed and scarcity. On issues of nutrition the data raise issues of concern, but are not
sufficient for drawing firm conclusions.
In addition to these limitations, there were specific issues that emerged during the baseline study, these
included:
• Many respondents were unclear about their age; as a result, this aspect of demographic data may
not be accurate.
• On the issue of child mortality, many were unable to distinguish between children and infants.
• The community size in Yelia LLG is very small; this meant that several of the focus groups had
fewer than 15 participants. This small sample size may mean that some of the generational
disaggregation is questionable.
• In Simogu and Wonenara the small size and remoteness of communities from each other meant that
it was not possible to form four distinct focus groups. Therefore separate male and a female focus
group were held.
25
Chapter 3:Descriptive data from Yelia survey
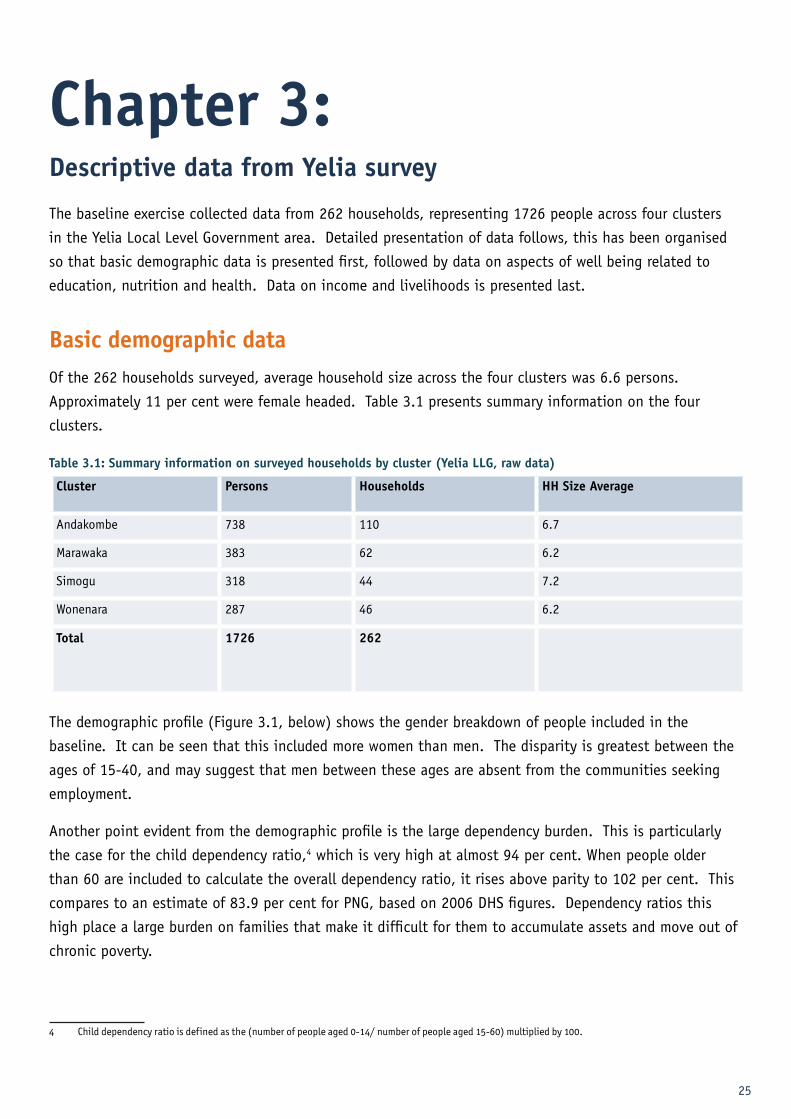
The baseline exercise collected data from 262 households, representing 1726 people across four clusters
in the Yelia Local Level Government area. Detailed presentation of data follows, this has been organised
so that basic demographic data is presented first, followed by data on aspects of well being related to
education, nutrition and health. Data on income and livelihoods is presented last.
Basic demographic dataOf the 262 households surveyed, average household size across the four clusters was 6.6 persons.
Approximately 11 per cent were female headed. Table 3.1 presents summary information on the four
clusters.
Table 3.1: Summary information on surveyed households by cluster (Yelia LLG, raw data)
Cluster Persons Households HH Size Average
Andakombe 738 110 6.7
Marawaka 383 62 6.2
Simogu 318 44 7.2
Wonenara 287 46 6.2
Total 1726 262
The demographic profile (Figure 3.1, below) shows the gender breakdown of people included in the
baseline. It can be seen that this included more women than men. The disparity is greatest between the
ages of 15-40, and may suggest that men between these ages are absent from the communities seeking
employment.
Another point evident from the demographic profile is the large dependency burden. This is particularly
the case for the child dependency ratio,4 which is very high at almost 94 per cent. When people older
than 60 are included to calculate the overall dependency ratio, it rises above parity to 102 per cent. This
compares to an estimate of 83.9 per cent for PNG, based on 2006 DHS figures. Dependency ratios this
high place a large burden on families that make it difficult for them to accumulate assets and move out of
chronic poverty.
4 Child dependency ratio is defined as the (number of people aged 0-14/ number of people aged 15-60) multiplied by 100.

26
Figure 1: Demographic distribution of participants in household survey (Yelia LLG)
Within the dependent category, there are those who are particularly vulnerable. These include children
under the age of four, people aged over 60 and people living with a disability. For those aged 0-4, it
is particularly important to have timely access to medical facilities for treatment of conditions such as
diarrhoea, which if left untreated can cause death in infants and young children relatively quickly. In
addition, this age range needs access to nutritious foods to prevent stunting and malnutrition.
For those in the older group and for people living with a disability, malnutrition is also likely to be a risk,
as is access to appropriate health services. Given the small numbers of people in these categories of
vulnerable groups, visibility and power to access resources is likely to be a particular problem.
Table 3.2: Vulnerable groups (all people aged 0-4, living with a disability and aged over 60) as percentage of surveyed population
0-4 5-9 10-14 30-34 35-39 >60 Total
Female 7.7% 0.1% 0.1% 0.1% 0.1% 2.0% 10.1%
Male 7.6% 0.0% 0.1% 0.1% 0.2% 2.0% 9.9%
Total 15.3% 0.1% 0.2% 0.2% 0.3% 3.9% 19.9%
200 150 100 50 0 50 100 150 200
0-4
5-9
10-14
15-19
20-24
25-29
30-34
35-39
40-44
45-49
50-54
55-59
60-64
65-69
70-74
75-79
80-84
85+
Male
Female

27
Education levels The 1995-2004 National Education Plan for Papua New Guinea defined primary schooling as nine years
of basic education (three years of elementary schooling followed by six years of primary schooling)
followed by four years of secondary schooling.5 However data from the 2006 DHS shows that there are
still large portions of the population who have no schooling. Table 3.3 shows changes in the percentage
of males and females with no schooling over the 10 year period 1996-2006 by region. The data show that
the Highlands is consistently the worst performing region, although it has shown the most substantial
improvement over the decade, with a 28 per cent improvement for men and a 17 per cent improvement for
women. More than half of Highlands women had no schooling in 2006.
Table 3.3: Per cent of people with no schooling by region (2006 DHS)
Males Females
Region 1996 2006 1996 2006
Southern 25.8 26.9 31.8 31.9
Highlands 57.3 41.1 67.5 56.2
Momase 39 36.7 49.6 46.8
Islands 28.7 25.5 32 25.3
Sources NSO 2009, tables 2.42 and 2.43, p16-17, World Bank 2004, Table 1.2
5 Office of Development Effectiveness (2009): Improving the Provision of Education Services to the Poor in Papua New Guinea, ODE p.6.
28
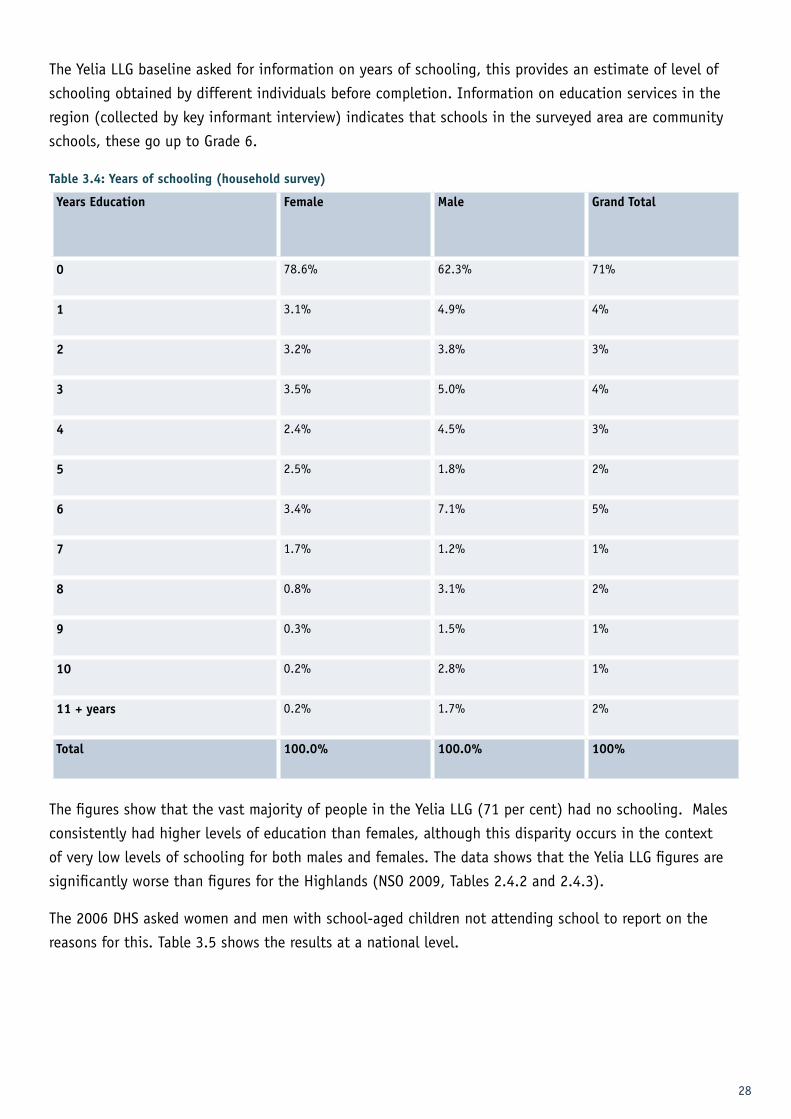
The Yelia LLG baseline asked for information on years of schooling, this provides an estimate of level of
schooling obtained by different individuals before completion. Information on education services in the
region (collected by key informant interview) indicates that schools in the surveyed area are community
schools, these go up to Grade 6.
Table 3.4: Years of schooling (household survey)
Years Education Female Male Grand Total
0 78.6% 62.3% 71%
1 3.1% 4.9% 4%
2 3.2% 3.8% 3%
3 3.5% 5.0% 4%
4 2.4% 4.5% 3%
5 2.5% 1.8% 2%
6 3.4% 7.1% 5%
7 1.7% 1.2% 1%
8 0.8% 3.1% 2%
9 0.3% 1.5% 1%
10 0.2% 2.8% 1%
11 + years 0.2% 1.7% 2%
Total 100.0% 100.0% 100%
The figures show that the vast majority of people in the Yelia LLG (71 per cent) had no schooling. Males
consistently had higher levels of education than females, although this disparity occurs in the context
of very low levels of schooling for both males and females. The data shows that the Yelia LLG figures are
significantly worse than figures for the Highlands (NSO 2009, Tables 2.4.2 and 2.4.3).
The 2006 DHS asked women and men with school-aged children not attending school to report on the
reasons for this. Table 3.5 shows the results at a national level.
29
Table 3.5: Reasons children do not attend school (2006 DHS)
Completed
grade 8/10
Completed
Grade 12
No school fees Security
reasons
School
too far
Lost in-
terest
Dis-
abled
Will get
married
Other
Male parent
Male
children
2.4 0.5 23.9 2.4 15.9 19.0 1.6 0.5 22.6
Female
children
2.4 0.2 22.4 2.9 14.3 15.0 1.1 0.4 20.3
Female parent
Male
children
3.1 0.5 21.0 1.8 14.3 21.9 1.7 0.7 22.2
Female
children
2.6 0.1 21.5 1.8 13.2 16.7 1.1 1.4 21.5
Source (NSO 2009, Table 12.3)
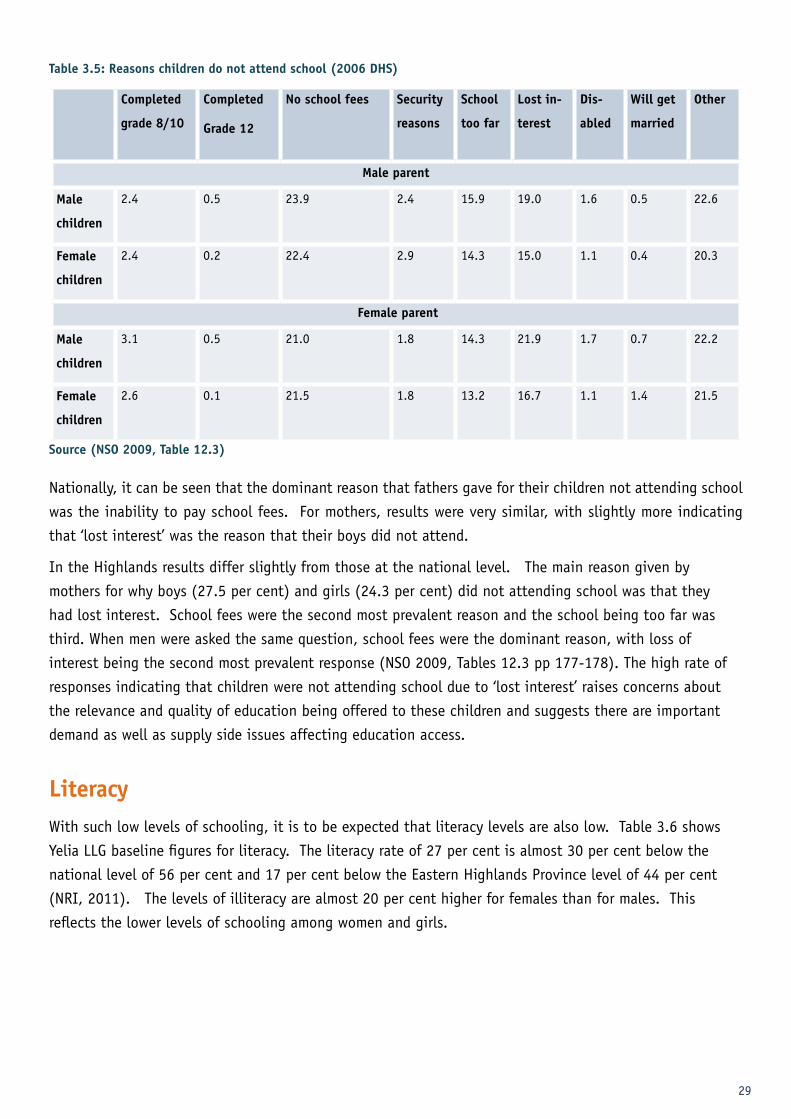
Nationally, it can be seen that the dominant reason that fathers gave for their children not attending school
was the inability to pay school fees. For mothers, results were very similar, with slightly more indicating
that ‘lost interest’ was the reason that their boys did not attend.
In the Highlands results differ slightly from those at the national level. The main reason given by
mothers for why boys (27.5 per cent) and girls (24.3 per cent) did not attending school was that they
had lost interest. School fees were the second most prevalent reason and the school being too far was
third. When men were asked the same question, school fees were the dominant reason, with loss of
interest being the second most prevalent response (NSO 2009, Tables 12.3 pp 177-178). The high rate of
responses indicating that children were not attending school due to ‘lost interest’ raises concerns about
the relevance and quality of education being offered to these children and suggests there are important
demand as well as supply side issues affecting education access.
LiteracyWith such low levels of schooling, it is to be expected that literacy levels are also low. Table 3.6 shows
Yelia LLG baseline figures for literacy. The literacy rate of 27 per cent is almost 30 per cent below the
national level of 56 per cent and 17 per cent below the Eastern Highlands Province level of 44 per cent
(NRI, 2011). The levels of illiteracy are almost 20 per cent higher for females than for males. This
reflects the lower levels of schooling among women and girls.

30
Table 3.6: Literacy level by gender (household survey)
Gender Literate Illiterate Grand Total
Female 19% 81% 100%
Male 36% 64% 100%
Grand Total 27% 73% 100%
NutritionDue to time and technical constraints, the survey was not designed to capture information on
malnutrition, stunting or wasting; participants were questioned about their food consumption on the day
of the survey. To gain a more complete picture would require replication of the survey at different points
in the year (as food availability is largely seasonal). The majority had eaten two meals in the last day (58
per cent), with a quarter having consumed one meal. The following facts emerged about food consumed
on the day of the survey:
• Sweet potato was the staple, with 92 per cent consuming it.
• Over half of households only consumed one staple (i.e. sweet potato). Bananas and taro were the
second and third most popular staples.
• Over 90 per cent of households did not consume animal protein.
• Of those that did consume animal protein, it was in the form of pig or fish.
• Nearly three quarters of households did not consume any vegetable proteins.
• One quarter of households did not consume any vegetables.
• Of those that did consume vegetables, the most common were abika, pumpkin and chocko tips. A
large variety of greenleaf vegetables were consumed but in small quantities.
• More than three quarters of households consumed no fruit.
This data is consistent with that presented by Mueller (2001) in his study of nutrition status in Eastern
Highlands Province. This suggests that diets have limited variety, are lacking in animal and vegetable
protein and in lipids (essential fats). There is also very limited consumption of fruit.
Compounding the issues around variety in the diet was the fact that 75 per cent of households mentioned
that food security was an issue for them, particularly if there was an extended dry season (June to
September) and whilst waiting for gardens to establish (December to March).
Women were the predominant group responsible for food preparation and food was mainly sourced from
domestic gardens. There was very little food traded in markets.
31
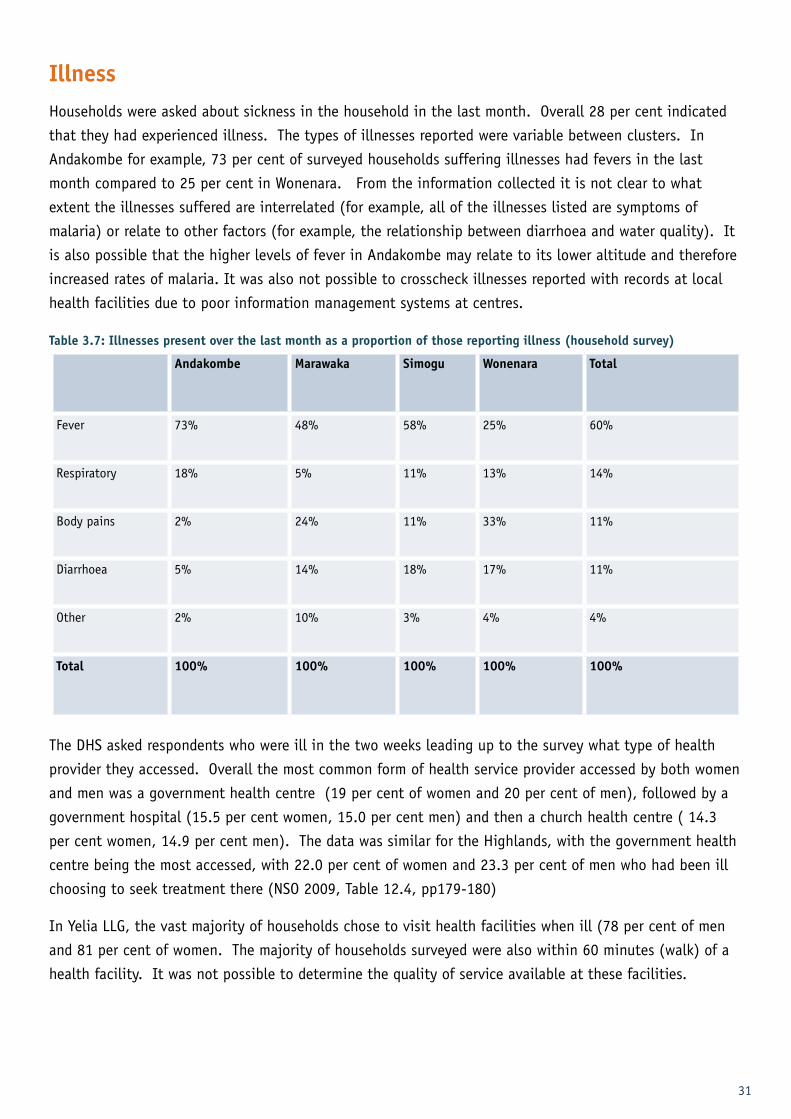
IllnessHouseholds were asked about sickness in the household in the last month. Overall 28 per cent indicated
that they had experienced illness. The types of illnesses reported were variable between clusters. In
Andakombe for example, 73 per cent of surveyed households suffering illnesses had fevers in the last
month compared to 25 per cent in Wonenara. From the information collected it is not clear to what
extent the illnesses suffered are interrelated (for example, all of the illnesses listed are symptoms of
malaria) or relate to other factors (for example, the relationship between diarrhoea and water quality). It
is also possible that the higher levels of fever in Andakombe may relate to its lower altitude and therefore
increased rates of malaria. It was also not possible to crosscheck illnesses reported with records at local
health facilities due to poor information management systems at centres.
Table 3.7: Illnesses present over the last month as a proportion of those reporting illness (household survey)
Andakombe Marawaka Simogu Wonenara Total
Fever 73% 48% 58% 25% 60%
Respiratory 18% 5% 11% 13% 14%
Body pains 2% 24% 11% 33% 11%
Diarrhoea 5% 14% 18% 17% 11%
Other 2% 10% 3% 4% 4%
Total 100% 100% 100% 100% 100%
The DHS asked respondents who were ill in the two weeks leading up to the survey what type of health
provider they accessed. Overall the most common form of health service provider accessed by both women
and men was a government health centre (19 per cent of women and 20 per cent of men), followed by a
government hospital (15.5 per cent women, 15.0 per cent men) and then a church health centre ( 14.3
per cent women, 14.9 per cent men). The data was similar for the Highlands, with the government health
centre being the most accessed, with 22.0 per cent of women and 23.3 per cent of men who had been ill
choosing to seek treatment there (NSO 2009, Table 12.4, pp179-180)
In Yelia LLG, the vast majority of households chose to visit health facilities when ill (78 per cent of men
and 81 per cent of women. The majority of households surveyed were also within 60 minutes (walk) of a
health facility. It was not possible to determine the quality of service available at these facilities.

32
Chart 3.1: Distance to health facility (household survey)
Maternal mortality and child healthIn Yelia LLG, it was not possible to gain an accurate picture of maternal mortality rates via the survey
as responses on this issue were very low. This may be due to an unwillingness of survey respondents to
discuss the issue or the small sample size (the sample size of households with children aged between 0
and 5 years was 152)
Data on where and how they gave birth was collected from parents of children aged between 0-5. This
shows that three out of the four clusters had similar access rates to ante-natal care, of between 60 and
70 per cent, but Simogu had a much lower rate at 43 per cent. It was not possible to collect data on the
quality of ante-natal care.
Most retained traditional birthing practices, with no trained mid-wife or village birth attendant. On at
least one occasion, 32 per cent of mothers had delivered in a health facility.
Table 3.8: Maternal health and birth attendants (per cent of parents of children aged 0-5, n=152)
Maternal Health Andakombe Marawaka Simogu Wonenara Total
Ante-natal clinic 69% 70% 43% 64% 64%
Traditional birth 68% 78% 71% 76% 72%
Village Birth At-
tendant
13% 4% 7% 4% 9%
Health facility 33% 30% 32% 32% 32%

33
Respondents in Yelia LLG were not able to discern between infant and child mortality rates. Given this, a
decision was made to collect data on under five mortality; the rate reported was therefore 191 deaths per
1000 live births.
Hygiene and sanitationThe survey indicated that there was good access to sanitation facilities, with every household surveyed
having access to a latrine. Only 14 per cent of those surveyed washed their hands after visiting the
latrine. Ninety per cent never or only sometimes washed their hands prior to meal preparation. These
figures suggest that this population is vulnerable to cholera and other preventable diseases.
HIV/AIDS The 2006 DHS collected information on respondents’ knowledge of AIDS. Knowledge was relatively high
for men and women aged 15-49. Ninety five per cent of men and eighty seven per cent of women had
heard of AIDS. In the Highlands the figures were higher than those at the national level, with 97.8 per
cent of men and 93.8 per cent of women knowing about AIDS.
Nationally, figures were not encouraging on knowledge of ways to avoid AIDS. Almost 27 per cent of
women and 19 per cent of men reported that they did not know how to avoid contracting AIDS (NSO 2009,
p.147).
In Yelia LLG, the sample of people responding on the issue of awareness of HIV/AIDS was relatively small
(46 responses during focus groups to the question of ‘what do you know about HIV/AIDS?’). Out of the
46 responses gathered during the focus groups, 14 were from females (30 per cent). Of the small number
of youth responses on the subject (16 in total), 3 young males responded that HIV can be transmitted by
blood and that there is no medicine available to treat HIV. Young females by contrast believed that HIV
was contracted through prostitution and sexual intercourse.
General consensus amongst focus group participants was that being faithful to one partner is the most
effective means of prevention. Less than 10 per cent of responses nominated use of condoms as a means
of prevention. An equal percentage nominated avoiding blood. The low number of responses on this topic,
together with the lack of awareness displayed by those who did respond, suggest that the community may
have had only very limited exposure to relevant messages regarding HIV/AIDS. Although prevalence rates
of HIV are unknown, if focus group knowledge of HIV is an indicator of community knowledge, then the
community is likely to be at risk.
People living with a disability
Focus groups identified the main causes of disability as birth related, followed by accidents (included
natural and man induced incidents, such as violence), and then vulnerability (taken as being the old and
orphans). The groups made no distinction between disability and vulnerability.
34
Women identified a broader range of causes of disability and focused in particular on birth related
disability. They also raised the issue of gunshots and accidents – neither of which were identified by the
men. Men’s focus tended to be on old age, fire and birth related disabilities.
Focus groups considered that the greatest needs of people living with a disability were food, clothing and
water. Food was often shared with people living with a disability at meal times. Clothing was provided to
people living with a disability only after the needs of others were met. The role of women in supporting
people living with a disability was stressed, and it was mentioned that there is sometimes support from
the community. However, it was clear from focus groups that discussing the needs of people living with
a disability was not common within communities and that this issue is largely the concern of the affected
family rather than the community at large.
The focus group discussions confirmed that people living with a disability are likely to be the most
deprived members of the community. This is likely to result from a lack of awareness in the community of
their needs, and a lack of advocacy on their behalf. This means that their needs are prioritised after those
of others in the community. In this context, improving the lives of people with a disability may well
require additional resources, as their needs are unlikely to be prioritised otherwise.
DisastersProlonged heavy rain resulting in flooding and landslides were said to be the principal causes of
destruction of assets such as food gardens, bridges and houses and other community assets. Of the
responses to focus group questions, 70 per cent nominated either landslides or floods as the most frequent
and most major kind of disaster. Yet of the responses that relate to disaster preparedness, the majority
focused on preparing for drought and water stress.
The main impact of disaster related to its effects on subsequent food security. After flooding and
landslides women were required to spend significant amounts of time in the forest searching for food,
clearing land and planting new gardens. While new gardens were maturing, female family members had
to continue searching and gathering food. This is a reflection of women’s role in sourcing food for
consumption. For young females in particular, the responsibility to secure food after a disaster could
impact on their attendance at school.
The fact that 28 per cent of responses indicated that no steps were taken to prepare for disasters
highlights the vulnerability of these communities.

35
Chart 3.2: Steps taken to prepare for disasters (per cent of total focus group responses on disaster preparedness)
Law and order issues Responses were sought on law and order issues at both a community and an individual level. At the
community level, five major law and order issues were identified, these included:
• domestic violence
• rape
• fights
• drug abuse
• ‘poisin’ (sorcery)
Domestic violence and rape had the highest responses compared to the other three issues. This is
consistent with previous research, which has established that two out of three women experience domestic
violence as a national average, and that 50 per cent of women have experienced forced sex (Office of
Development Effectiveness 2008: p.105).

36
Women in focus groups spoke about the negative impact of violence on their lives. Women and girls expe-
rienced violence primarily from either their husbands or partners. Women’s attitudes towards the violence
included acceptance because of financial dependence on husbands and partners and cultural customs, such
as payment of bride price and polygamy.
The focus groups identified that fights are mainly associated with land disputes and extra marital affairs.
The Yelia LLG is known for its drug cultivation, particularly marijuana, which is consumed mainly by young
males. Finally, ‘poisin’ refers to a range of acts formerly referred to as ‘sorcery’. Poisin is used in differ-
ent ways, for example to protect properties, or as a pay-back killing – which can be associated with tribal
fighting.
Livelihoods and household incomeAccording to the 2006 DHS, subsistence farming or fishing is the dominant economic activity for both men
and women in PNG. Thirty two per cent of men and 37 per cent of women responded that this was their
dominant economic activity. In the Highlands, almost 40 per cent of women and 36 per cent of men were
engaged in subsistence farming of fishing. There were small numbers engaged in fishing and farming for
money (3.9 per cent of men and 3.0 per cent of women). Twenty per cent of men were engaged in non-
farm work (NSO 2009, p.26).
The Yelia LLG provided very limited opportunities for formal sector employment, with only 7 per cent of
men and 1 per cent of women reporting employment in this sector. Around 14 per cent of households were
engaged in small and micro-enterprises. These primarily consisted of small retail outlets, marketing and
service enterprises.
The agricultural sector was the mainstay of the communities, and provided the sole source of income
for most households. Table 3.9 shows the breakdown of sub-sectors within reported agriculture sector
earnings.
Table 3.9: Composition of agriculture sector earnings (per cent of income over the last month, household survey)
Sector Sub-Sector Gender Andakombe
(per cent)
Marawaka
(per cent)
Simongu
(per cent)
Wonenara
(per cent)
Total
(per cent)
Agriculture Livestock Males 4 10 21 9 9
Females 7 10 10 11 9
Cash crops Males 53 66 60 71 60
Females 39 51 48 73 49
Food crops Males 25 20 29 7 21
Females 33 28 52 27 34
Fisheries Males 3 0 0 0 1
Females 2 0 0 0 1

37
Of significance was that only 9 per cent of households earned income from livestock. Coffee generated
income for 60 per cent of households during the year 2009. The cash cropping sub-sector was managed
by men. Food crops generated income for 34 per cent of households and production was predominately
managed by women.
Although Yelia LLG is a remote, rural area, the forest and bush does not contribute significantly to
household incomes. Hunting contributed income to less than 10 per cent of households.
Chart 3.3: Reported maximum income earned in the last month (household survey)
0% 5% 10% 15% 20% 25% 30% 35% 40% 45% 50% 55% 60% 65% 70% 75% 80% 85% 90% 95%100%
0-99100-199200-299300-399400-499500-599600-699700-799800-899
900-1000>1000
0-99 100-199 200-299 300-399 400-499 500-599 600-699 700-799 800-899 900-1000 >1000
Total 76% 6% 4% 4% 2% 4% 1% 1% 0% 1% 2%
Maximum income earned in last month(Kina, January 2009)
Of the households included in the survey, all were engaged in growing coffee. Of these, 45 per cent
had earned between 0-100K in the preceding month, this coincided with coffee sales for the year.
These households indicated that this was the most significant component of their annual cash income.
Statistics from the Yelia LLG indicated that over 400 tonnes of coffee was air freighted by Mission Aviation
Fellowship (MAF) in 2009. Only a small percentage of coffee was transported by foot or vehicle to market.
This may be due to access issues, with the closest market being in Menyamya– a two day walk from the
LLG. For coffee transported by air freight, depending on the point of origin and destination, transport
costs ranged from K1.60 – K 3.00 per kg parchment. The market price for coffee at the time averaged
around K 4.00 per kg parchment.
Remittances were not a significant source of income. They were most prevalent in Andakombe, but even
there only 5 per cent of respondents indicated that they received them. Given the absence of many
working aged men from the villages surveyed, it is possible that the low level of remittances reflects an
absence of employment opportunities in towns and the low saving capacity of people working in the
unskilled labour market.
38
Chapter 4: Discussion and conclusions
Research on rural poverty using a variety of data sources has consistently shown that where the rural
poor live in Papua New Guinea has changed very little over the course of almost 40 years. Based on this,
we can make some judgements about the characteristics of poor areas. These areas are isolated, have low
levels of cash incomes and poor access to services. Factors such as isolation, and limited cash earning
opportunities appear intractable. Environmental factors, which affect the productivity and reliability
of subsistence farming, mean that populations living in these areas are vulnerable to the effects of
food shortages and malnutrition in particular. Underlying each of these factors is the sometimes harsh
geography of Papua New Guinea.
The districts that are most disadvantaged are more likely to be inhabited by people with lower levels of
education (de Albuquerque and D’Sa 1986, Gibson et al 2004, NEFC 2004), lower life expectancy (NEFC
2004), and poorer child nutrition (Hanson et al 2001) than those better off. People living in these
communities are also far less likely to earn regular cash incomes, for example through waged employment.
The survey of 262 families in the Yelia LLG provides detail to supplement larger surveys on which much of
the research has rested to date. Given the heterogeneous nature of development across PNG, with large
degrees of variation within provinces and even within some districts– this level of survey information is
important for policy formulation even though it should not be generalised. The main conclusions of the
survey were:
• These are very disadvantaged communities with small numbers of families earning reasonable incomes
mainly from coffee, but the majority earning very little. The number of households reporting income from
remittances is low, despite the demographic breakdown indicating the absence of many men of working
age.
• There is a very high child dependency ratio of 94 per cent, this places pressure on families to consume
most of what they produce, meaning it is difficult to generate a surplus to invest in assets. Including
older age groups, the overall dependency ratio rises above parity to 102 per cent, compared to the national
estimate of 83.9 per cent (NSO 2009, p.13).
• Agriculture provides the majority of income, but it is vulnerable to natural disasters and there is little
preparedness amongst communities.
• These communities are food insecure and have limited variety in their diets, they have limited
consumption of meat, vegetable proteins and essential fats important for maintaining appropriate levels of
nutrition.
• Education levels are very low, more than 70 per cent of those surveyed (79 per cent of females and 62 per
cent of males) do not have any experience of formal education.

39
• Only 27 per cent of the population surveyed are literate (19 per cent of females and 36 per cent of males).
• There seems to be reasonable access to health facilities, although it was not possible to determine their
quality. Out of a sample of parents of 0-5 year olds, the vast majority (72 per cent) had experienced
traditional births with no trained birth assistants present.
• Infant and child mortality levels are high. Under five mortality rates were estimated to be 191 deaths per
1000 live births.
• Knowledge and understanding of HIV/AIDS is low and is placing the community at risk.
Implications for policy and research The issue of spatial inequality was recognised by the Government of PNG at the beginning of the 1970s
(de Albuquerque and D’Sa 1986, p.3). This work has been built on by the National Economic and Fiscal
Commission which developed indicators of district level disadvantage to help guide the distribution of
grants to the least developed districts (NEFC, 2004). The NEFC has also conducted research into the
differential costs of service delivery across Papua New Guinea and has worked to change intergovernmental
financing arrangements to allow for differences in provincial revenue raising capacity and service delivery
costs6. These are all important developments in beginning to deal with the high levels of spatial
disadvantage experienced in PNG.
While there has been significant progress at the policy level, the extent to which disadvantaged areas
have been directly targeted by government programs is not known. There is also very little data on
current conditions in many disadvantaged districts, and this makes it difficult to determine whether
living standards have improved over time. The proposed Census of 2011 therefore presents a good
opportunity to pull together and analyse data on individual characteristics associated with disadvantage.
The data presented in this report, although not being generalizable to other parts of Papua New Guinea,
nevertheless gives important, up to date, insights into a part of PNG that can be shown to have been
disadvantaged for at least 40 years.
Although each community in Papua New Guinea is unique, the research reviewed in this report shows that
many disadvantaged communities have characteristics in common with Yelia LLG. There is therefore a
strong case for geographical targeting of measures to address the individual and community characteristics
that research has shown to be prevalent in disadvantaged areas. The extreme disadvantage of people living
in areas such as Yelia LLG should become a focus for Government and donor programs.
Allen, Bourke and Gibson conclude that ‘ultimately the only practical solution open to the people who
occupy PNG’s poor places may be to move away from them’ (2005, p.214). It would appear from the
demographic data for Yelia LLG that young men are already taking this route. However, with limited
education and few jobs in urban areas, it is not clear that this option leads to improved livelihoods. The
low level of remittances back to families in Yelia LLG may also indicate that those who migrate out remain
in poverty and may simply contribute to growing problems in urban settlements.
6 The website of the National Economic and Fiscal Commission has a number of publications which describe changes to inter-governmental financing arrangements and work completed on cost of service delivery, see www.nefc.gov.pg.
40
One way to improve the future income prospects of people who migrate out of rural areas is via education.
However, both the supply and the demand side of education need to be addressed. On the demand side,
the 2006 DHS data revealed that poor school attendance was attributed to a lack of capacity to pay
school fees and a ‘lack of interest’. This may suggest issues with the relevance and quality of schooling.
Addressing these would require investment in an education system that is already stressed by the rapidly
expanding population of school aged children and the requirement to provide them with access to
nine years of education. However, improving the quality and demand for schooling is fundamental to
addressing the high levels of disadvantage experienced by some communities.
There are also more direct means of supporting the disadvantaged that could be considered. As the
Government of PNG’s revenues from natural resource exploitation increases, opportunities should be
explored to pilot cash transfers or conditional cash transfers to disadvantaged areas. Combined with the
provision of relevant information on what constitutes a healthy diet and how to avoid malnourishment,
access to cash to purchase fat, protein and fruit could have a significant impact on health and
malnutrition. The lack of community focus on disaster preparedness and risk diversification in agriculture
is also something that could be addressed through targeted community information and education
campaigns and the provision of support for poor families to adopt a broader range of crops and livestock
to enhance their diet and income potential.
The research reviewed for this paper suggests that provision of basic infrastructure is important at a local
level. Despite the problems with roads in PNG highlighted by Allen, Bourke and Gibson (2005) roads
remain fundamental to reducing isolation and either building or rehabilitating roads would need to be part
of any approach which aimed to bring greater development to where people live.
Finally, in terms of monitoring changes in levels of disadvantage, there are two health related indicators
that could be a litmus test for this in Papua New Guinea. These are the incidence of stunting in children
(indicating malnutrition) and the maternal mortality rate. Neither of these are regularly monitored, the
last comprehensive study of malnutrition in children was almost 30 years ago, and the maternal mortality
figure from the 2006 Demographic Health Survey is widely believed to be unreliable due to sampling errors.
Gaining accurate data on maternal mortality is difficult, the Yelia LLG baseline survey, for example, was not
able to obtain reliable data due to the small sample size. However, despite problems with measurement,
both stunting in children and maternal mortality are important indicators of both absolute and relative
levels of disadvantage experienced by PNG’s rural poor.
In terms of future research, the baseline data from Yelia LLG highlighted several areas that deserve further
investigation. These include the quality of services that were accessible to the communities, in particular
issues of whether health services were adequately staffed and equipped to do their jobs. Also, given high
levels of food insecurity, it would be beneficial to further investigate aspects of malnutrition, knowledge
around dietary issues and access to supplementary foods.
Finally, the issue of the community’s vulnerability to various shocks, including climatic, agricultural and
social (eg crime and other violence) could be further explored. Although many potential shocks were
identified in the Yelia LLG baseline, comprehensive data was not collected on the likelihood of these
41
shocks, their impact, coping mechanisms and how long it takes to recover from them. Knowing more
about this will give further insights into the factors that guide day to day decision making around issues
such as crop diversification, and whether to send children to school. A better understanding of these
issues can be fundamental to designing localised programs to support disadvantaged communities.
It would also provide insights that may help inform future national policies to support the most
disadvantaged communities and individuals.
© Josh Estey/CARE

42
Appendix A
Appendix A Table 1: Major studies of rural poverty in Papua New Guinea, with data sources
Wilson (1975) De Albuquerque
and D’Sa (1986)
Hanson et al
(2001)
Gibson et al (2004) NEFC District Develop-
ment Index (2004)
Small holder cash crop production by sub-district
(Government estimates for 1969-70 )
Population density
(Census 1980 and Provincial Data Sys-tem 1978-79)
Land potential
(MASP and PNGRIS database)
Size of dwelling
(PNG Household Survey 1996)
Income levels (based on World Bank estimates of share of people in dis-trict who are poor – see Gibson et al, (2004))
Hospital beds per 1000
(Administrative data)
Sex ratios
(Census 1980)
Agriculture pressure
(MASP)
Age of household mem-bers
(PNG Household Survey 1996)
Health standards - life expectancy
(Census 2000)
Enrolments in primary and secondary schools per 1000
(Administrative and Mis-sion data)
Dependency ratios
(Census 1980)
Access to services
(MASP)
Schooling of household head
(PNG Household Survey 1996)
Education standards - literacy and school at-tendance
(Census 2000)
Administration staff per 1000
(Administrative data)
Urbanisation Income from agri-culture
(MASP)
Main source of income
(PNG Household Survey 1996)
Accessibility to district headquarters
(Index constructed)
Internal Migration
(Census 1980)
Child Malnutrition
(based on 1982-83 NNS)
Geographic and climatic features
(PNGRIS database)
Level of local services
(Administrative data)
Employment
(Census 1980)
Population (es-timates for 2000 based on 1980 and 1990 census data)
Agriculture system remote from services
(MASP)
Education status
(Census 1980)
% of wages as main in-come source in LLG
(Census 2000)
Health % of betelnut as income source in LLG
(Census 2000)
Accessibility
(Provincial Data System)
Sources: de Albuquerque & D’Sa (1986), Hanson et al (2001), Gibson et al (2004), NEFC (2004)
43
ReferencesAllen, B J and Bourke, R M 1997, Poverty and agriculture in PNG: an in-depth description of six agricultural systems, De-partment of Human Geography, Research School of Pacific and Asian Studies, Australian National University 1997.
Allen, J, Bourke, R M and Gibson J 2005, Poor rural places in Papua New Guinea, Asia Pacific Viewpoint, Vol. 46, No. 2, pp 201-217
Baxter, M 2001, Enclaves or equity: The rural crisis and de-velopment choice in Papua New Guinea, International Devel-opment Issues No. 54, Australian Agency for International Development
Berry , R and Jackson, R 1981, ‘Inter-provincial inequalities and decentralisation in Papua New Guinea’ Third World Plan-ning Review, 3:1 (1981 Feb), pp 57-76
Bourke, R M 2000, ‘An Overview of Food Security in PNG’ in ‘Food Security for Papua New Guinea, paper presented Papua New Guinea’ Proceedings of the Papua New Guinea Food and Nutrition 2000 Conference, PNG University of Technology, Lae 26-30 June
D’Sa, E. R. 1986, Social Indicators and Spatial Disparities in Papua New Guinea, Social Indicators Research 18, pp 285-319
De Albuquerque, K and D’Sa, E 1986, Spatial Inequalities in Papua New Guinea: A district level analysis, IASER Discus-sion Paper No. 49, Institute of Applied Social and Economic Research, Papua New Guinea
Gibson, J 1998, Identifying the Poor for Efficient Targeting: Results for Papua New Guinea, New Zealand Economic Papers, 32(1), 1998, pp 1-18
Gibson, J, Datt, B, Allen, B, Hwang, V, Bourke, M, Parajuli, D 2004, ‘Mapping Poverty in Rural Papua New Guinea’ Pacific Economic Bulletin, pp 1-26
Gibson, J and Rozelle, S 2002 ‘ Poverty and Access to Infra-structure in Papua New Guinea’ Department of Agriculture and Resource Economics University of California Davis, Working Paper No. 02-008
Hanson, L W, Allen B J, Bourke R M, McCarthy, T J 2001, Papua New Guinea Rural Development Handbook, The Australian National University
Hunt, J M 2005, ‘The potential impact of reducing global malnutrition on poverty reduction and economic development’, Asia Pacific Journal of Clinical Nutrition, 2005, 14, pp 10-38
Mueller I 2000, ‘The Spatial Pattern of Child Growth in PNG’, in ‘Food Security for Papua New Guinea, paper presented Papua New Guinea’ Proceedings of the Papua New Guinea Food and Nutrition 2000 Conference, PNG University of Technology, Lae 26-30 June pp 414-430
Muntwile, M and Shelton, R M 2000, ‘Survey of Nutrition and Protein Intake in Rural Families in Eastern Highlands Province’, in ‘Food Security for Papua New Guinea, paper presented Papua New Guinea’ Proceedings of the Papua New Guinea Food and Nutrition 2000 Conference, PNG University of Technology, Lae 26-30 June, pp 432- 442
National Economic & Fiscal Commission 2004, Review of Inter-governmental Financing Arrangements District Development Index, National Economic and Fiscal Commission
National Research Institute 2010, PNG District and Provincial Profiles, NRI March 2010
O’Collins, M (n.d.) Isolation, Vulnerability and Governance: Reflections on Poverty Assessments in Papua New Guinea, Fiji and Vanuatu, viewed 1 March 2011 2011 Canberra, viewed 11 March 2011<http://rspas.anu.edu.au/papers/melanesia/working_papers/maev.html>
Department of Foreign Affairs and Trade 2011, Papua New Guinea Country Brief, Department of Foreign Affairs and Trade Canberra, viewed 11 March 2011<http://www.dfat.gov.au/geo/png/png_brief.html>
Wilson, R K 1975 ‘Socio-economic indicators applied to sub-districts of Papua New Guinea’ Yagi-ambu, Vol.1, pp 71-87
UNICEF 2011, At a glance: Papua New Guinea, Statistics, viewed 31 May 2011<http://www.unicef.org/infobycountry/papuang_statistics.html>