rural solar accessibility via consumer cooperative ...pdf.usaid.gov/pdf_docs/pa00kmsd.pdfi rural...
TRANSCRIPT

i
Rural Solar Accessibility via Consumer Cooperative Enhanced Society (ACCESS) Retails pilot project in Kalangala district,
Uganda
Project -end Impact Evaluation Survey Report
OCTOBER 2011
Consultant: Church Road, Christine Plaza off Entebbe Road P.0. Box 43 Entebbe Uganda; Tel: 0414-576854 E-mail: [email protected] [email protected]

ii
Acknowledgement The Consultant (Pioneer Consult and Partners) wishes to thank to all the LRUS staff, interviewers, data staff and community leaders, as well as respondents who participated in this project-end impact evaluation. We have been immensely enriched by the opportunity to engage with so many different and interesting endeavors. Finally, the Consultant on Behalf of LRUS also extends its gratitude to the USAID for funding the project.

iii
Table of contents Acknowledgement ............................................................................................................. ii Table of contents .............................................................................................................. iii List of Tables ..................................................................................................................... v List of Appendices............................................................................................................ vi List of Abbreviations ..................................................................................................... vii Executive summary........................................................................................................ viii I. Introduction............................................................................................................... 1 A. Project context.......................................................................................................... 1 B. Partnership................................................................................................................ 2 C Objectives of the Evaluation .................................................................................... 2 D. Breakdown of the Report ......................................................................................... 2 II. Approach and the research methodologies............................................................ 3
A. Research Design...................................................................................................... 3 B. Sample size determination ...................................................................................... 3 C. Sampling ................................................................................................................. 4
III. Uganda’s and Kalangala District energy context .............................................. 5
A. Uganda's energy context ......................................................................................... 5 B. Prospects of Solar lights in Uganda ........................................................................ 6 C. Energy context within Kalangala District............................................................... 6
IV. Project design and implementation..................................................................... 8
A. Enhancing capacities of Rural Solar ACCESS retails .......................................... 8 (i) Assessing need of the users................................................................................. 8 (ii) Preparation of ACCESS retails agents for maintenance.................................... 9
B. Increasing availability of solar lanterns ................................................................ 10 (i) Project Financing .............................................................................................. 10
C. Increasing Demand for the Solar Lantern............................................................ 10 D. Strengthening capacity and coordination with support institutions ..................... 10 A. SolarFlare product................................................................................................. 12 B. Other Functionality of the SolarFlare product ...................................................... 12 C. Creating support systems for maintenance ........................................................... 13 D. Address the potential problems of malfunctioning............................................... 13 E. Environment concerns .......................................................................................... 13
VI. Project outcomes ................................................................................................. 14
A. Data analysis ......................................................................................................... 14 B. Lanterns sold, and returned under warranty.......................................................... 14 C. Characteristic of Respondents............................................................................... 15 D. Lighting Source..................................................................................................... 16 E. Upfront Investment in solar lamps........................................................................ 17 F. Solar light use ....................................................................................................... 17 G. Reason for purchase of light type ......................................................................... 18

iv
H. Lighting fuel usage ............................................................................................... 18 I. Lighting expenses .............................................................................................. 19 J. Fuel expenses by type of light used ...................................................................... 19 K. Lighting expenses by gender .............................................................................. 20 L. Lighting expenses by type of business................................................................ 20 M. Fire accidents........................................................................................................ 21 N. Willingness to pay for the light............................................................................. 21 O. Client Perception of the ACCESS retails.............................................................. 21 P. Extend ended hours of work by the current light.................................................. 22
Q. Extended hours by gender..................................................................................... 22 R. Business occupation by extended hours of work................................................ 23 S. After -dark reading by extended hours of the lights ............................................. 23
VII. Strengths, Weaknesses, Opportunities and Threats........................................ 24 VIII. Conclusion and Recommendations ................................................................... 26
A. Conclusion ............................................................................................................ 26 B. Recommendations................................................................................................. 27

v
List of Tables
Table 1.1 Sample size determination .............................................................................. 4
Table 1.2: Lanterns sold, and returned under warranty ................................................. 14
Table 1.3 Characteristic of Respondents ...................................................................... 15
Table 1.4 Lighting Source............................................................................................. 16
Table 1.5 Upfront Investment in solar lamps................................................................ 17
Table 1.6 Solar light use .............................................................................................. 17
Table 1.7 Reason for purchase of light type ................................................................. 18
Table 1. 8 Lighting fuel usage ....................................................................................... 18
Table 1.9 Lighting expenses ....................................................................................... 19
Table 1.10 lighting expenses by type of light used........................................................ 19
Table 1.11 Lighting expenses by gender ..................................................................... 20
Table 1.12: Fuel expenses by type of business .............................................................. 20
Table 1.13 Fire accidents by cause ................................................................................. 21
Table 1.14 Willingness to pay for the light..................................................................... 21
Table 1.15 Client Perception of the ACCESS retails ..................................................... 22
Table 1.16 Extended hours due to use of the current lighting ........................................ 22
Table 1.17: Extended hours by gender .......................................................................... 22
Table 1.18 Business by extended hours of work ......................................................... 23
Table 1.19 After -dark reading by extended hours of the lights .................................... 23

vi
List of Appendices
Questionaire for the field survey .................................................................................... 29
Map of Uganda Showing Kalangala District ............................................................... 31
Map of Kalangala District............................................................................................... 32

vii
List of Abbreviations ACCESS Accessibility via Consumer Cooperative Enhanced Society DIV Development Innovation Ventures LRUS Lighting Rural Uganda with Solar USAID United Stated agency for international Development
viii
Executive Summary Lighting Rural Uganda with Solar (LRUS is a Ugandan non-profit agency with an aim of lighting all Rural Uganda. LRUS has been implementing a Rural Solar Accessibility via Consumer Cooperative Enhanced Society (ACCESS) Retails pilot project in Kalangala district. The project funded by the USAID Development Innovation Ventures (DIV) aims at substituting kerosene –with cheaper and environmentally sustainable solar light. The project is coming towards completion, hence need for its impact evaluation at community level. The objectives of the evaluation were;
• Provide an analysis of Uganda's energy context, including the energy context within Kalangala District
• Analyze elements of the project design and implementation, that might inform any future intervention
• Summarize the user friendliness of the solar light introduced in the project communities.
• Compare project outcomes in the project intervention area versus a comparison group without the solar light distribution intervention.
• Identifies strengths, weaknesses, opportunities and threats that may inform future interventions.
• Synthesize findings to make relevant and actionable recommendations The consultant used a mixed method approach by combining desk review, field observations, and a community survey whose summary results are as follows. The majority (above 60%) of solar users and none users were aged between 36-49 years of low education status ,and almost all (over 90%) have schooling children and were engaged in low skills occupations such as fishing and small retail trade. Among solar users, 60% were additionally using kerosene in conjunction with the solar lamp and only 13 % had bought more than one unit of solar, while among none-solar users about two thirds (67%) were using two kerosene lamps, with a touch as an additional source of lighting. The majority (60%) of solar users had made an upfront investment of between US$ 15-US$20 per lighting unit, compared an average of only between US$1-US$ 1.5- among none-solar users. Six out of ten solar clients (63%) reported using the solar for business compared to only 40 % of households using the kerosene, suggesting that the solar light was contributing to livelihood activities. In general, both solar users and none-users mentioned affordability as a key factor in their decision to purchase the lamp. The availability of the lighting product at their doorsteps also proved an added incentive to purchase the product. Four out of ten (38%) of solar light users had completely eliminated kerosene use, with three out of ten (28%) solar users additionally using less than 500 ml of kerosene compared to over three quarters (78%) of non users who were using about 2 liters of paraffin per week. The lighting expenses of 38% of solar users had completely been eliminated compared to 65% of kerosene users who stated spending US$3 per week on lighting expenses. By gender , women solar users are four times as likely as men to have
ix
eliminated the lighting expenses as result of solar light use, and by business occupation, weekly lighting expenses were eliminated mostly among the market vendors (50% ), farmers (26%) and to a small extent private medical clinics (20%). While only 20% of solar users reported a fire related accident in the last four months of which the cause was boat fuel stored in a jerican, the majority of kerosene users reported a fire related accident of which the cause was by a kerosene lamp. While 40 % of current solar users stated requiring additionally solar lights, 30% stated that they even required larger solar lights. Among the none-users, 70% preferred acquiring the lights through payment installments. While three out of the ten users stated that the ACCESS retails provided good after service, the rest of the opinions were spilt between those who believed that ACCESS retails were knowledgeable (20%) , well trained (20%) , and were easy to deal with and approachable (20%). Among the none-users, 80% do not know whether the ACCESS retails could deliver the solar lights. Seven out of ten (70%) kerosene users reported no additional extra hours beyond the normal as a result of kerosene lights, compared to half of the solar users who reported an extra hour of productive work as a result of solar use.-with more women (60%) reporting to have an extra hour of productive work as a result of solar use compared to only 40% of men – with five out of ten solar users who report an extra two hours of productive being either engaged in fish processing or school operators, and with 50 % reporting an extra fours of productive work being private clinics operators. Almost all (88%) households who stated that solar that contributed an additional two hours of after-dark light use stated it was for reading. The above results demonstrate that use of solar lamps has improved the overall wellbeing of the households. This has also been observed during interaction with the users during the field survey. Some of the benefits include:
Saving of money: In several households, the supply of kerosene which is
normally 4-8 liters a month comes from the unsubsidized retail shop. Among the exclusively solar light users, this consumption has stopped entirely or reduced drastically, helping the family save an average of US$ 8 dollars a month. There are also many livelihood enhancement opportunities in the villages as result of additional hours of productive work brought about by the solar. These includes clinics remaining open for more hours than ever, students reading after dark , and the additionally capacity of solar lights to charge cell phones creating a livelihood for the youth.
Improvement in health: The analysis also shows that women solar users are four times as likely as men to have their lighting expenses eliminated as result of solar light use. This implies that with the solar systems in place, fewer women will suffer from respiratory problems. Kerosene fumes will cease to affect the eyes of the family members. Women are affected much more severely than men since they stay at home for much longer hours. They suffer due to the rigid patriarchal structure, where suffering in silence is understood to be the order.
x
A leap towards children's education: almost all (87%) households who stated that solar that contributed to an additional two hours of light use stated it was for reading after dark . During the survey interviews, one gentleman desperately approached the office to get his equipment repaired since his daughter's school examination was coming up and his system had suddenly broken down. He was ready to do anything to get it repaired. This showed the benefit children received due to the lights.
Increasing safety for the family: The benefits go much beyond financial calculations. The small proportion of responses related to kerosene fire accidents among solar users compared to the none-users are testimony to this. However, the majority of the households continue to use kerosene lamps in the evening in addition to solar lanterns. This again emphasizes the need to distribute multiple solar lanterns per household. The potential for expansion of the solar project in Kalangala district is high since more than 90 % of the district country has no electricity. The likelihood of electricity reaching the 84 remote islands in the near future is extremely unlikely. There are however, four important aspects that need to be taken into consideration before any expansion is planned. Geography: Access to remote areas is limited therefore provision of follow-up services as part of the sale is extremely challenging. Implementation through ACCESS retails and possibly churches and other church institutions is one way to overcome this as they provide a good distribution point as well as the means to provide back-up service and repairs Affordability: In remote areas with a weaker cash economy. Keeping the price affordable to people in remote areas is a challenge. In many remote areas, the success of sales may be dependent on having a flexible payment option or purchase with goods in kind instead of cash. Follow-up Service: The ability to take the solar products to the door steps of people living in remote areas and to provide a follow up service is a key factor in increasing market access. This however may increase the price of products. Since competition in hard to reach areas would be limited, a different pricing structure may be acceptable. Disposal of disused products environmentally: The environmental impact due to the disposal of old and disused units of desk lamps should be carefully assessed before undertaking major scaling up of sales. In particular, the disposal of batteries and non-degradable plastic parts should be actively managed. This project can be scaled-up to the rest of Uganda. The same model that was applied in Kalangala District can be used in the least and scattered un-electrified rural Uganda. However, any expansion work should carefully consider the ability of the supply chain to support the scale-up of ACCESS retails to manage the business and adequately resource the activities.

1
I. Introduction Lighting Rural Uganda with Solar (LRUS is a Ugandan non-profit agency with an aim of lighting all Rural Uganda. The LRUS societal vision is “Happier and Healthier lives as a result of access to affordable, environmental friendly and superior solar light”. The organizational vision for the future is to be “a self sustaining and leading, pro-poor supplier of affordable and reliable household solar light in Uganda with national and international recognition”. Its mission is to promote use of renewable energy through information, education, communication advocacy and service delivery through cooperative concepts in order to reach the poor and most vulnerable families and households, by working with innovative global solar technology providers. LRUS has been implementing a Rural Solar Accessibility via Consumer Cooperative Enhanced Society (ACCESS) Retails pilot project in Kalangala district. The project funded by the USAID Development Innovation Ventures (DIV) aims at substituting kerosene –with cheaper and environmentally sustainable solar light. The project is coming towards completion, and LRUS would like its impact evaluated at community level. The substitution of solar for kerosene also aimed to increase household available income, and after dark reading. Funding secured from USAID was meant to incubate the idea into the communities. The immediate goal was to make solar affordable, easy and widely available in the villages. The ultimate goal was to develop a model that can be tested in a low electrified district and then rolled out across the country. The project idea was that, mobilized Solar customers will be the ones to provide capital required for purchasing the solar. The project objective over a 12-month period was to promote Rural Solar Access via Consumer Cooperatives enhanced societies (ACCESS) retails in Uganda’s least electrified district of Kalangala.
A. Project context While the Ugandan government is working to increase access to electricity, Uganda’s electrification rate is very low, with grid access of only 5%1 for the whole country and less than 2% in rural areas. While only 200,000 customers are connected to the grid, the annual growth rate estimated between 0.05 and 0.075%. Furthermore, homes with electricity suffer unreliable and inconsistent supply. It is also extremely expensive, and sometimes technically infeasible to provide electrification to the many scattered rural households. In addition, even when electricity does reach a village, potential customers may be asked to pay steep hook up fees (and possibly bribes) in order to establish services.
1 Uganda National Grid Connections Progress Report (2009)
2
The primary outcome questions of analysis were ; i) does the intervention lead to ;i) reduced kerosene fuel budget; ii) reduced kerosene lantern related fire accidents ; ii) reduced prevalence of not completing school homework associated with either lack of grid-light and/or competing and ;iv) reduced poverty due to the extension of economically productive business hours into the night; ?
B. Partnership Green light Planet is the partnership’s solar product supplier. It was founded by newly-graduated engineers from the University of Illinois, USA. Green light Planet has been recognized by the World Bank Group’s Lighting Africa Program among the five innovative suppliers able to deliver safe, reliable and cost-effective lighting to millions of people who currently rely on fuel-based lamps or other low-quality products
C. Objectives of the Evaluation Provide an analysis of Uganda's energy context, including the energy context
within Kalangala District
Analyze elements of the project design and implementation, that might inform any future intervention
Summarize the user friendliness of the solar light introduced in the project
communities.
Compare project outcomes in the project intervention area versus a comparison group without the solar light distribution intervention.
Identifies strengths, weaknesses, opportunities and weakness that may inform the
forthcoming solar lantern project.
Synthesize findings to make relevant and actionable recommendations.
D. Breakdown of the Report Section one provides an overview and lays out the objectives of this project. Section two describes our approach to the project and the research methodologies that the team relied on during their fieldwork. Section three discusses Uganda’s energy context, including the energy context within the project intervention area. Section four presents a brief of the user friendliness of the solar light introduced in the project communities, Section five compares the project outcomes in the project intervention area versus a comparison Island without the intervention, while section six synthesize findings to make relevant and actionable recommendations.

3
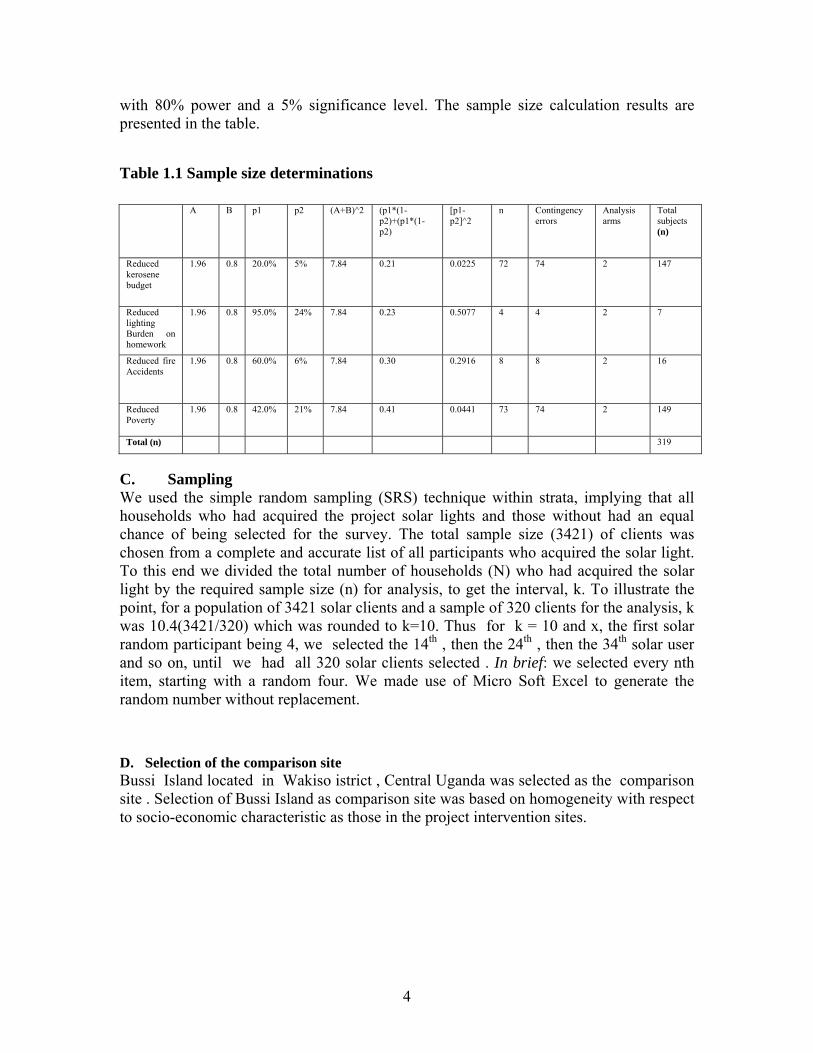
II. Approach and the research methodologies This section describes our approach to the project and the research methodologies that the team relied on during their fieldwork. A. Research Design We used a mixed method approach by combining desk review, field observations, and a community survey. The project team commenced the assignment mid September 2011 to conduct initial desk review and under stand the project implementation status . The primary purpose of the desk review was to verify the objectives of the project, and gain a better understanding of the local contexts including LRUS’s role within the communities, and project progress during the project course based on available reports. During the desk review the project team analyzed the project activities , including the type of solar technology that had been introduced in the project communities . Thereafter the project debriefed the client on preliminary findings, discussed the relevance of our initial findings and obtained feedback. We also developed the research design and the quantitative tool to be used during the October, 2011 trip to assess the impact of the pilot solar lantern project by talking with community members who had received the solar lanterns. The impact of the pilot project was assessed in October 2010 through an evaluation consisting of surveys of household members who acquired the solar lights, and those without the solar. The questionnaire for household customers was designed to determine the impact of the lamps on their lifestyle. Twenty (20) research assistants who did not participate in the sales of lamps were selected to conduct the household surveys. B. Sample size determination The sample was based on the project proposal statistical estimates of kerosene use among off-grid households (20%)2, prevalence of accidents of related to kerosene use among off-grid (80%)3, proportion of off-grid households (95%)4 as a proxy of poor academic performance due to poor lighting, poverty prevalence (42%)5 as proxy for not affording electricity to extend economically productive business hours into the night. The formula for the sample size (two–sided P<0.05) is as follows: - n = [A + B]2 * [(p1*(1-p1)) + (p2 * (1-p2))]/[p1-p2] 2 where n = the sample size required in the intervention and comparison groups, A= desired significance level(α= 0.05) ; B= desired power(1-β = 0.8), p1 = existing proportions; p2 = desired proportions;p1-p2=size of difference of project importance. It was estimated that over 12 month year follow-up period, sample size of 640 subjects (320 using solar lanterns and 320 without solar) will be sufficient to detect a 75% reduction in both household kerosene budget, 10% reduction in kerosene related accidents, 75% reduction in non-completion of school homework, and 50% reduction in poverty prevalence among business owners who work extended hours as a result of solar
2 Uganda Household budget Survey (UHBS) 2005/2006 3 National Services Delivery Survey 2005 4 UHBS, 2005/6 5 UHBs, 2005/6
4
with 80% power and a 5% significance level. The sample size calculation results are presented in the table.
Table 1.1 Sample size determinations
A B p1 p2 (A+B)^2 (p1*(1-p2)+(p1*(1-p2)
[p1-p2]^2
n Contingency errors
Analysis arms
Total subjects (n)
Reduced kerosene budget
1.96 0.8 20.0% 5% 7.84 0.21 0.0225 72 74 2 147
Reduced lighting Burden on homework
1.96 0.8 95.0% 24% 7.84 0.23 0.5077 4 4 2 7
Reduced fire Accidents
1.96 0.8 60.0% 6% 7.84 0.30 0.2916 8 8 2 16
Reduced Poverty
1.96 0.8 42.0% 21% 7.84 0.41 0.0441 73 74 2 149
Total (n) 319
C. Sampling We used the simple random sampling (SRS) technique within strata, implying that all households who had acquired the project solar lights and those without had an equal chance of being selected for the survey. The total sample size (3421) of clients was chosen from a complete and accurate list of all participants who acquired the solar light. To this end we divided the total number of households (N) who had acquired the solar light by the required sample size (n) for analysis, to get the interval, k. To illustrate the point, for a population of 3421 solar clients and a sample of 320 clients for the analysis, k was 10.4(3421/320) which was rounded to k=10. Thus for k = 10 and x, the first solar random participant being 4, we selected the 14th , then the 24th , then the 34th solar user and so on, until we had all 320 solar clients selected . In brief: we selected every nth item, starting with a random four. We made use of Micro Soft Excel to generate the random number without replacement. D. Selection of the comparison site Bussi Island located in Wakiso istrict , Central Uganda was selected as the comparison site . Selection of Bussi Island as comparison site was based on homogeneity with respect to socio-economic characteristic as those in the project intervention sites.

5
III. Uganda’s and Kalangala District energy context This section discusses Uganda's energy context, including prospects of Solar lights in Uganda as well the energy context within Kalangala District. A. Uganda's energy context Energy is a vital factor in Uganda’s continued economic development, but today the country faces many energy-related challenges that threaten to undermine this development. For a number of years, there has been significant public investment, primarily in an effort to expand the electricity supply. Nevertheless, the problems facing the energy sector still include an inadequate supply, a situation which is exacerbated by consumers’ inefficient use of the energy which is available. Outside the urban areas, access to energy services remains very poor as the appropriate mechanisms are still missing. Only 5% of the rural population is connected to an electricity supply and 93% still rely on biomass for cooking. The use of solid fuels such as firewood and charcoal remains chronically inefficient throughout most of the country, and this adds enormous environmental problems to Uganda’s energy equation. The greatest contributing factor to this is the lack of awareness about the environment and the need for energy efficiency. Consumer education measures exist but they are still inadequate to effect the changes needed. Uganda is one of the world's poorest countries, and its poverty is a key reason why less than 5% of the population has access to electricity. A World Bank study states, "No more than 7% of the total population [in Uganda] can afford unsubsidized electricity… It is unrealistic to think that more than a fraction of the rural population could be reached by a conventional, extend-the-grid approach. (Uganda Energy Assessment, ESMAP, World Bank, 1996)
Energy research jointly carried out by the World Bank and UNDP argue that Uganda cannot reach most of its population with the grid: "The prospects for Uganda Electricity Generation Board (UEB) to significantly strengthen its national coverage to non-grid areas in the next 20 years are remote. Even if all of Uganda's urban consumers were connected to the grid, it would still leave 75% of Ugandans without UEB grid electricity. The lack of generating capacity is not UEB's main problem. It is poor bill collections and lack of distribution capacity, “a report prepared for Uganda 8th Parliament states. While Uganda considers adding large, inflexible power projects to fuel its inefficient national grid, energy experts are promoting a decentralized approach to power generation, using technologies such as fuel cells, microturbines and solar roofing. According to a new report by Worldwatch Institute, this approach avoids costly investments in new power plants and grid systems, reduces price fluctuations, can be brought online more quickly, is more reliable, easier to scale up as the economy requires it, and more efficient than extending existing transmission lines. "[Developing] nations have a golden opportunity to get the rules right the first time, and set up markets that support power systems suitable for the 21st century," the report notes.
6
B. Prospects of Solar lights in Uganda Uganda is endowed with plenty of sunshine giving solar radiation of about 4-5 kWh/m2/day. This level of isolation is quite favourable for all solar technology ACCESS retails. Solar energy ACCESS retails in Uganda include solar photovoltaic (PV), water heating, cooling and crop drying. PV systems are generally required for ACCESS retails where modest power needs exist mainly in areas that are not served by the grid. They provide power for lighting, telecommunications, vaccine and blood refrigeration, and for playing radio and television in such areas. This technology has also proven to be very successful in providing energy services to very inaccessible areas such as on islands and mountainous areas where the national grid cannot be expected to extend its services in the foreseeable future. Government is currently implementing a solar PV pilot project through a financing mechanism that makes it possible for both PV consumers and vendors to obtain credit from banks for solar rural electrification. The application of solar water heating is still very limited. The Ugandan Electricity Regulatory Authority reported in 2008 that, "the Ugandan government is promoting solar photo-voltaic systems in homes and solar water heating in both homes and commercial enterprises in order to reduce on the evening peak load demand for grid electricity. A proposed 50MW solar- thermal project is under study at Namugoga, Wakiso District." Despite these recent efforts, solar remains a very minor part of Uganda's actual energy balance.
C. Energy context within Kalangala District
Located entirely within the boundaries of Lake Victoria, the district encompasses the 84 Ssese islands, 64 of which are inhabited. The population is estimated to be 40,000 though gathering census data from the transient inhabitants can be difficult. Most of the population and commercial activities are focused in small, clustered fishing communities along the shores. The main and largest island houses Kalangala town, the local government offices, and the districts secondary schools. The region is only accessible by ferry, leaving either from Entebbe or Masaka for the main island, once daily. No bridges exist between islands. Currently, the main industries are fishing- though the dwindling fish population of Lake Victoria is leaving fishermen with empty nets – and resort tourism. No centralized source of electricity exists in Kalangala. Those who have power utilize private generators – usually diesel or petroleum – or solar panels. A government sponsored large fuel generator and mini-grid was operating for some time in late 2007 but has been dormant since then. Interviews with Kalangala residents and officials revealed a unique set of impediments to electrification. Two main areas were highlighted as the culprits undermining reliable, large-scale power generation and distribution: the island district’s geography – both internally and relative to the mainland – and an indeterminable consumer base. Geographic isolation prevents both connections to the mainland grid and any implementation of traditional input-based generation without exorbitant costs. Import costs of fuel are extremely high and supply is unreliable. Connections to the main land would require marine cables, which would be both
7
expensive and potentially detrimental to the lake’s ecosystems and Kalangala’s fishing industry. Those desiring power have resorted to localized sources, either generators or photovoltaic cells, which typically produce just enough power for a single household and are only run for select hours in the evening. Resort hotels suffer specifically from this condition, since out-of-town guests often require consistent power. Geographic isolation also increases maintenance costs. Few skilled engineers reside on the island, and this situation forces power consumer to seek assistance from the mainland when generators break down. Any funds allocated for repairs must include the additional costs of transportation room and board for the engineers, and the importing of spare parts upon request. Finally, a small and uncertain consumer base hinders electrification in Kalangala. Utility providers in the district must forgo the benefits that come with large –scale distribution, making the business climate undesirable .Though sensitization and surveying about electricity has been conducted on the main island, it is still difficult to estimate consumer capacity since a large portion of the population is vagrant. Without large, consistent industrial consumers, and in the absence of government fuel subsidies, private investors have been reluctant to pursue utility projects in the district thus far.

8
IV. Project design and implementation This section examines the project design and implementation by specifically looking at the capacity building, coordination, supplies, financing, promotional and distribution model.
A. Enhancing capacities of Rural Solar ACCESS retails
(i) Assessing need of the users LRUS carried out an assessment before initiating the programme. It tried to understand the different occupations the members were involved in, along with the need and existing methods adopted by them to meet the energy needs. The intensive survey included details on expenditure incurred on electricity (since they work in areas where electricity is available, though erratic), the average fuel expenditure, time spent by women on accessing fuel, etc. The assessment also gave an idea of the affordability of solar products by the community. This assessment looked at the livelihood pattern and the links it had with other sources of dependency like kerosene, the existing use of kerosene, the expenditure incurred by the people, and their ability to pay (i) Capacity building activities The baseline survey results informed the design of training curriculum in order make the new entrepreneurs more effective when conducting business. This activity was implemented in February 2011 and involved; Village Level Situation Analysis Workshop
• A One -day situation analysis workshop conducted for 120 people • The workshop collected information through a Participatory Rural Appraisal
(PRA) on the community’s lighting needs. • The appraisal helped participants understand
the real situation of the lighting needs as well as create local ownership of the program by identifying their problems and needs
Village Level Gender Sensitive Planning Workshop
• The Half -day workshop established a partnership between local inhabitants and LRUS which in particular enabled women to review their lighting development issues and problems that arose in discussions concerning the previous situation analysis workshop
• 30 men and 30 women, both formal and informal leaders, Participated in Half -day workshop where they all agreed to roles and responsibilities for the project, the beginning activity as well as motivate them to make commitments in the local setting

9
(iii) Saving, Credit and Cooperative Training Uganda Cooperatives Savings and Credit Union Limited (UCSCU), the national apex organization for Savings and Credit Cooperative Societies (SACCOs) in Uganda conducted 4-day training for 60 members (30 men and 30 women):
• Increased knowledge and awareness of the concept of group saving • Identified the need to develop regular savings • Mobilized savings in the most effective way • Helped members to learn how to conduct group meetings and understand roles
and responsibilities within the group • Gave women the knowledge and skills to keep accurate accounting systems in
the cooperative • Produced a sufficient number of cooperative members trained to operate the
cooperatives both presently and in the future • Produced cooperative manager who will be accountable for all financial
transactions but also be supported by the management committee • Imparted knowledge and skills to keep transparent accounting systems in the
cooperative • Increased membership within the ACCESS retails in order to mobilize for
increased saving to acquire the solar products ,
(iv) Preparation of the ACCESS retails agents for maintenance LRUS intervention project had three technicians who form the core group. The team had one engineer who has undergone through training in solar hard ware repairs. They are capable of repairing any part of the home lighting system, including the most difficult part, the circuit in the battery. Paying heed to the need for decentralized aftercare services, LRUS trained ACCESS local youths as para- technicians. These youths carry out repairs and also provide maintenance services to the users of solar home lights and other products. LRUS is contemplating giving these para technicians kits and spare parts (as accessing spare parts is difficult in the remote villages, and sometimes even at the district capital of Kalangala ). The para-technicians would be able to rectify the basic problems. Battery related problems, however, will continue to be addressed by technicians from the LRUS. This set of services will be possible among the concentrated fishing community workers, where sales have reached some volumes. However, in less concentrated villages where the volumes are low at present (3-5 per Village/month), LRUS is exploring the option of tie-up with distribution channels present at the market places. It appears that this option will become dominant over a period of time.

10
B. Increasing availability of solar lanterns
(i) Project Financing The project idea was that mobilized Solar customers will be the ones to provide capital required for purchasing the solar. The project objective over a 12-month period was to promote this idea via Consumer Cooperatives enhanced societies (ACCESS) retails in the district. Under the ACCESS credit model , clients made 100 % upfront payment for solar lights but in 3-weekly installments of 40%, 40% and 20% before acquiring the solar lights. Green light Planet’s sold lights to the ACCESS retails at US$11. The ACCESS retails each marked-up the product and took 5% commission on the sale for their operations. This sort of arrangement is also a women- friendly arrangement, as a woman doesn't get a fixed amount every month from her husband and it is her flexible savings which she uses to pay for the solar products. LRUS acted as a link between Green Light Planet, and the ACCESS retails to purchase solar lights. The ACCESS model outlets have ensured reliable payment for the lights and effective advertising thus creating a community driven supply chain and reliable market. C. Increasing Demand for the Solar Lantern LRUS choose different strategies to promote and popularize the solar lighting systems. LRUS promoted the solar product through word of mouth and through the ACCESS networks residing in different villages. Meetings, leaflets, and brochures were some of the different promotional methods adopted .LRUS did the initial introduction in a meeting at a fish landing site or in a slum or rural area, where after introducing itself, discussion were carried out on the benefits of solar energy. Having identified three or four interested members from the initial meeting, individual counseling was done to convince them about the benefits of solar products. Once they agreed, demonstrations were given at their houses for about a week. This strategy has helped in generating demand for the range of products available for use. Following the capacity building, selected marketing and sales persons received accreditation or specific recognition in form of signs, posters, or stickers that identified them as accredited outlets.
D. Strengthening capacity and coordination with support institutions
The capacity of ACCESS retails has been strengthened with necessary logistics such as furniture, computes , and safe boxes, plus office rent paid for one year. The ACCESS retails have also been linked to the Microfinance Support Center (MSC) of the Uganda Ministry of Finance, which is the premier financier of SACCOs in Uganda, and has functional branches in all Ugandan regions. The MSC has asked the ACCESS retails to provide the following information in their proposals in order to be considered as a grant beneficiary of MSC.
i. Proof of registration and track record. At least a certificate of incorporation (commercial) or registration (non commercial); business plan; capability statement including key staff and relevant experience; and financial statement (audited) of the previous year should accompany the proposal.

11
ii. Level of effort or in-kind contribution. ACCESS retails should include the use of equipment, offices and level of effort by the beneficiary quantified and acknowledged as in kind contribution.
iii. Target beneficiary loan size, tenure and interest rates. Proposal should state
the proposed loan size, tenure, outstanding balance and penalty interest per given period.
iv. Fees, commission and other charges. 2% of the grant amount (minimum
$2,000) should be reserved for monitoring and evaluation of projects funded. The proposal should state the Fees, Commission and other charges to be charged to the borrower in addition to the interest rate.
v. Interest or returns on grant. ACCESS should acknowledge that any interest or
any form of return on high yielding investments from the grant will be recapitalized. Grants will not be used for equipment, salaries, vehicles, training, etc. for internal staff members of the beneficiary unless it clearly demonstrates its usefulness in implementing the fund.
vi. Geographical coverage and outreach to target group. ACCESS retails should spell out their geographical coverage and outreach to target group. Where the applicant does not have a point of presence measures to be taken including implementation partners must be given.
vii. Orientation training. Some of the ACCESS customers will be first time
borrowers. The ACCESS retails are required to specify orientation training e.g. on savings and borrowing or any other business development services they will provide to compliment access to microfinance.

12
V. Solar Technology introduced This section provides an analysis of the solar lantern technology, it maintenance and other features it provides. A. SolarFlare product The SolarFlare product below introduced in Kalangala district utilizes a military‐configuration lithiumion battery, which lasts twice as long as conventional lead‐acid, nickel‐metal‐hydride, and lithium‐ion battery technologies.
It does have focused beam “flashlight” mode, but unlike simple flashlight type solutions, the durable solar product can be easily hung, mounted, balanced on rough surfaces, carried by hand, or attached to a bicycle. The durable stand is easily detachable. The Products are modular and serve multiple functions. The Solar product line functions primarily as a home lighting platform, but additionally has the capacity to charge cell phones, portable radios, and other electronic devices. The end user needs addressed by the product are: a) more usable light in the home for reading, working and cooking; b)overcomes safety and health concerns of kerosene lighting; c) durable and reliable in extreme conditions; d) eliminates reliance on regular kerosene or battery purchases. B. Other Functionality of the SolarFlare product The SolarFlare line functions primarily as a home lighting platform, but additionally has the capacity to charge cell phones, portable radios, and other electronic devices, which will make it extremely popular in unelectrified regions of Uganda, and more especially with a cell phone charger which is a considerable value addition for rural consumers.

13
C. Creating support systems for maintenance
One of the major bottlenecks generally encountered when new products are launched is the investment the company has to make towards ensuring that services for maintenance of the product are easily available to users. This holds true for the solar lighting system as well. The absence of adequate maintenance services is likely to affect the adoption of the systems. This aspect is detailed out in the next point. We examined the tractability of the practice in the project and below are our observations :
Consumers are Educated on realistic expectations of technology appliance’s performance prior to purchase
Consumers are provided with user manual including basic training on operation, maintenance and trouble-shooting procedures at time of purchase
The Solar company provides Warranty and Money-back Guarantee Scheme Quality testing upon which manufacturers receive certification: e.g. Green light
Planet is a Lighting Africa “Associate” and its SolarFlare has passed their quality tests
D. Address the potential problems of malfunctioning To address the potential problems of malfunctioning solar lanterns, simple preventive (ex-ante) and corrective (ex-post) measures were put in place. Villagers have been informed on how to care and use their solar lanterns by introducing a training program and distributing instruction manuals to consumers at the point of purchase. Also put in place was a simple maintenance program to ensure a prolonged operational life of these lanterns and higher returns on purchase. Villagers therefore are able to send their solar lanterns for repair or exercise their warranty should their solar lanterns malfunction without the need to retire them before their estimated expiration date. E. Environment concerns The solar is ‐LED lantern designed at the University of Illinois (home of Professor Nick Holonyak, the inventor of the LED) specifically for sale to villagers. The SolarFlare product utilizes a military‐configuration lithiumion battery, which lasts twice as long as conventional lead‐acid, nickel‐metal‐hydride, and lithium‐ion battery technologies. According the United States Environmental Protection Agency, lithium ion batteries are non-hazardous waste and can be disposed in the municipal waste system. However, some customers may be able to recycle the batteries locally, as the non-hazardous metals contained do have a small amount of recycling value.

14
VI. Project outcomes The primary outcome questions of analysis were ; i) does the intervention lead to ;i) reduced kerosene fuel budget; ii) reduced kerosene lantern related fire accidents ; ii) reduced prevalence of not completing school homework associated with either lack of grid-light and/or competing and ;iv) reduced poverty due to the extension of economically productive business hours into the night; ? A. Data analysis We have used the chi-square statistics to assess the significance of the difference between the means in both intervention and comparisons communities. To assess cost effective, we compared lighting expenditures and fuel usage (solar light users/non user purchase). Crucial quantitative measurements include: Number of lanterns sold, returned under warranty, amount of kerosene (or other fuel) used (solar light users/non user purchase), number of hours per night of fuel based light (solar light users/non user purchase), hours of LED light used post purchase, hours (solar light users/non user purchase) or educational activities per night, basic demographic information about each customer.
B. Lanterns sold, and returned under warranty
During the project period (January to September 2011), the total number of solar lamps sold was 3, 421. The breakdown of the types of units sold by month is as follows:
Table 1.2: Lanterns sold, and returned under warranty Month ACCESS imports Sold Returned under
warranty January 2011 February 2011 March 2011 April 2011 500 500 May 2011 533 500 June 2011 651 500 3 July 2011 498 750 2 August 2011 574 1230 4 September 2011 665 1440 2
At the time of assessment in October 2010, 551 lights remained in transit, waiting to be distributed by ACCESS entrepreneurs.
15
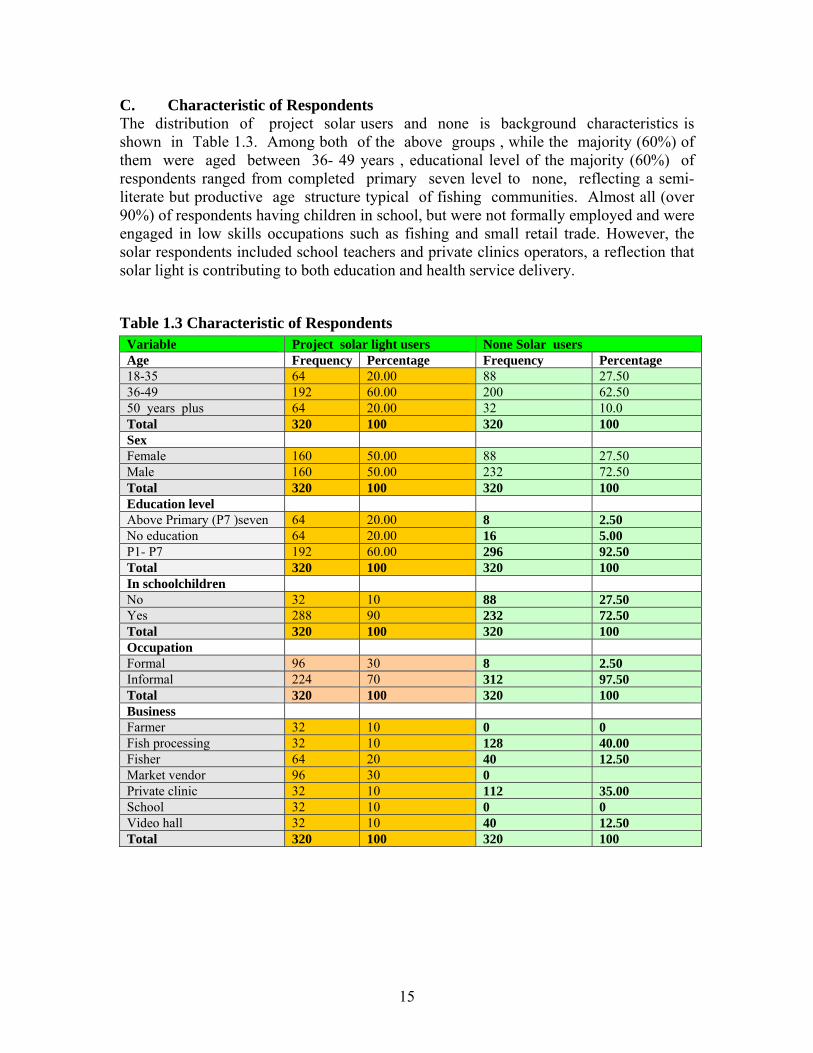
C. Characteristic of Respondents The distribution of project solar users and none is background characteristics is shown in Table 1.3. Among both of the above groups , while the majority (60%) of them were aged between 36- 49 years , educational level of the majority (60%) of respondents ranged from completed primary seven level to none, reflecting a semi-literate but productive age structure typical of fishing communities. Almost all (over 90%) of respondents having children in school, but were not formally employed and were engaged in low skills occupations such as fishing and small retail trade. However, the solar respondents included school teachers and private clinics operators, a reflection that solar light is contributing to both education and health service delivery.
Table 1.3 Characteristic of Respondents Variable Project solar light users None Solar users Age Frequency Percentage Frequency Percentage 18-35 64 20.00 88 27.50 36-49 192 60.00 200 62.50 50 years plus 64 20.00 32 10.0 Total 320 100 320 100 Sex Female 160 50.00 88 27.50 Male 160 50.00 232 72.50 Total 320 100 320 100 Education level Above Primary (P7 )seven 64 20.00 8 2.50 No education 64 20.00 16 5.00 P1- P7 192 60.00 296 92.50 Total 320 100 320 100 In schoolchildren No 32 10 88 27.50 Yes 288 90 232 72.50 Total 320 100 320 100 Occupation Formal 96 30 8 2.50 Informal 224 70 312 97.50 Total 320 100 320 100 Business Farmer 32 10 0 0 Fish processing 32 10 128 40.00 Fisher 64 20 40 12.50 Market vendor 96 30 0 Private clinic 32 10 112 35.00 School 32 10 0 0 Video hall 32 10 40 12.50 Total 320 100 320 100
16
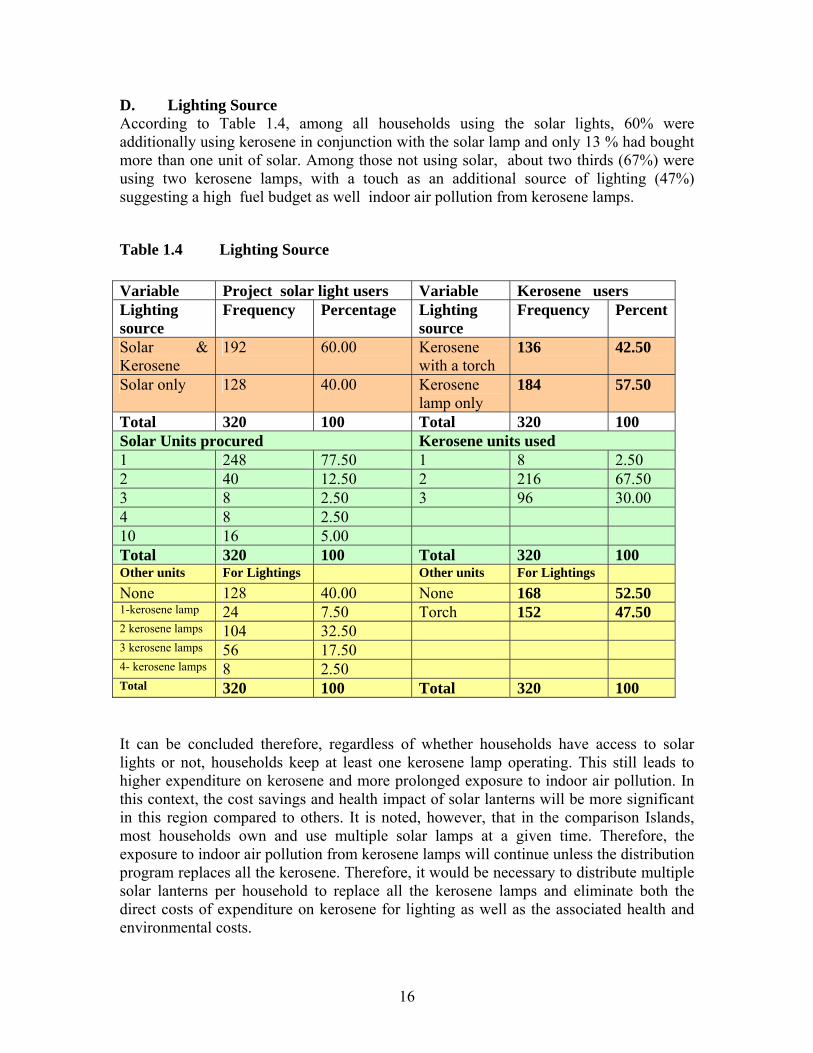
D. Lighting Source According to Table 1.4, among all households using the solar lights, 60% were additionally using kerosene in conjunction with the solar lamp and only 13 % had bought more than one unit of solar. Among those not using solar, about two thirds (67%) were using two kerosene lamps, with a touch as an additional source of lighting (47%) suggesting a high fuel budget as well indoor air pollution from kerosene lamps.
Table 1.4 Lighting Source Variable Project solar light users Variable Kerosene users Lighting source
Frequency Percentage Lighting source
Frequency Percent
Solar & Kerosene
192 60.00 Kerosene with a torch
136 42.50
Solar only 128 40.00 Kerosene lamp only
184 57.50
Total 320 100 Total 320 100 Solar Units procured Kerosene units used 1 248 77.50 1 8 2.50 2 40 12.50 2 216 67.50 3 8 2.50 3 96 30.00 4 8 2.50 10 16 5.00 Total 320 100 Total 320 100 Other units For Lightings Other units For Lightings None 128 40.00 None 168 52.50 1-kerosene lamp 24 7.50 Torch 152 47.50 2 kerosene lamps 104 32.50 3 kerosene lamps 56 17.50 4- kerosene lamps 8 2.50 Total 320 100 Total 320 100 It can be concluded therefore, regardless of whether households have access to solar lights or not, households keep at least one kerosene lamp operating. This still leads to higher expenditure on kerosene and more prolonged exposure to indoor air pollution. In this context, the cost savings and health impact of solar lanterns will be more significant in this region compared to others. It is noted, however, that in the comparison Islands, most households own and use multiple solar lamps at a given time. Therefore, the exposure to indoor air pollution from kerosene lamps will continue unless the distribution program replaces all the kerosene. Therefore, it would be necessary to distribute multiple solar lanterns per household to replace all the kerosene lamps and eliminate both the direct costs of expenditure on kerosene for lighting as well as the associated health and environmental costs.
17
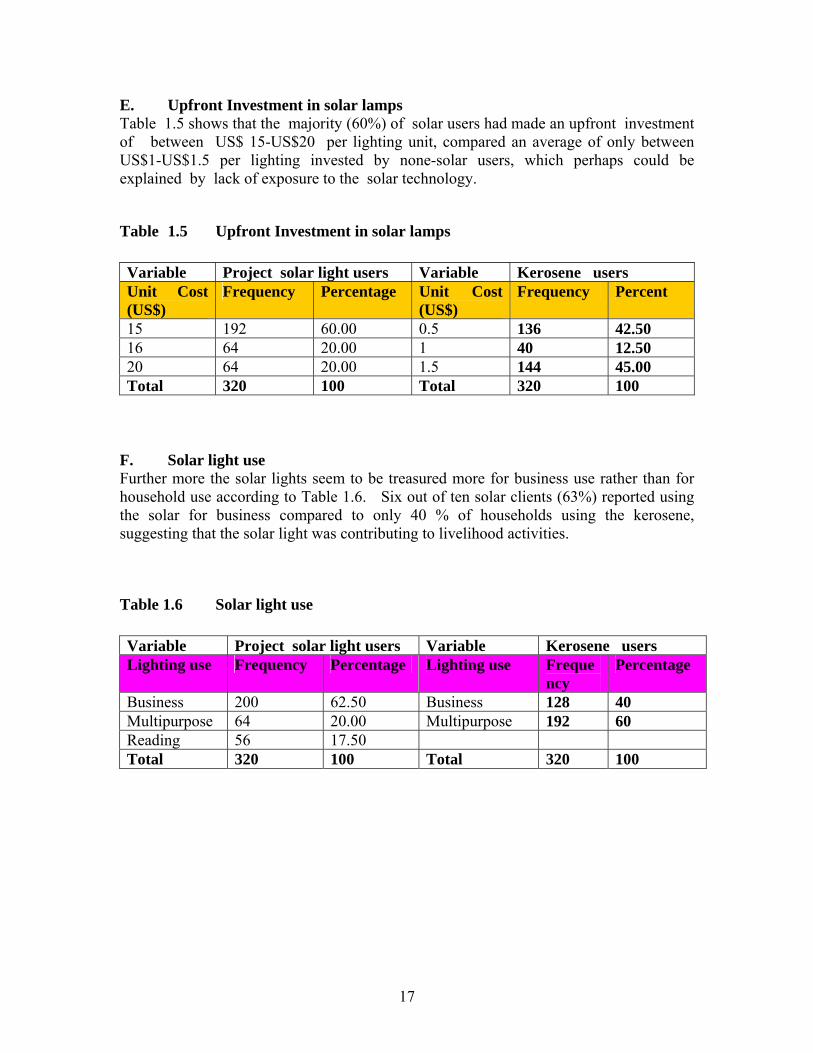
E. Upfront Investment in solar lamps Table 1.5 shows that the majority (60%) of solar users had made an upfront investment of between US$ 15-US$20 per lighting unit, compared an average of only between US$1-US$1.5 per lighting invested by none-solar users, which perhaps could be explained by lack of exposure to the solar technology.
Table 1.5 Upfront Investment in solar lamps Variable Project solar light users Variable Kerosene users Unit Cost (US$)
Frequency Percentage Unit Cost (US$)
Frequency Percent
15 192 60.00 0.5 136 42.50 16 64 20.00 1 40 12.50 20 64 20.00 1.5 144 45.00 Total 320 100 Total 320 100
F. Solar light use Further more the solar lights seem to be treasured more for business use rather than for household use according to Table 1.6. Six out of ten solar clients (63%) reported using the solar for business compared to only 40 % of households using the kerosene, suggesting that the solar light was contributing to livelihood activities.
Table 1.6 Solar light use Variable Project solar light users Variable Kerosene users Lighting use Frequency Percentage Lighting use Freque
ncy Percentage
Business 200 62.50 Business 128 40 Multipurpose 64 20.00 Multipurpose 192 60 Reading 56 17.50 Total 320 100 Total 320 100
18
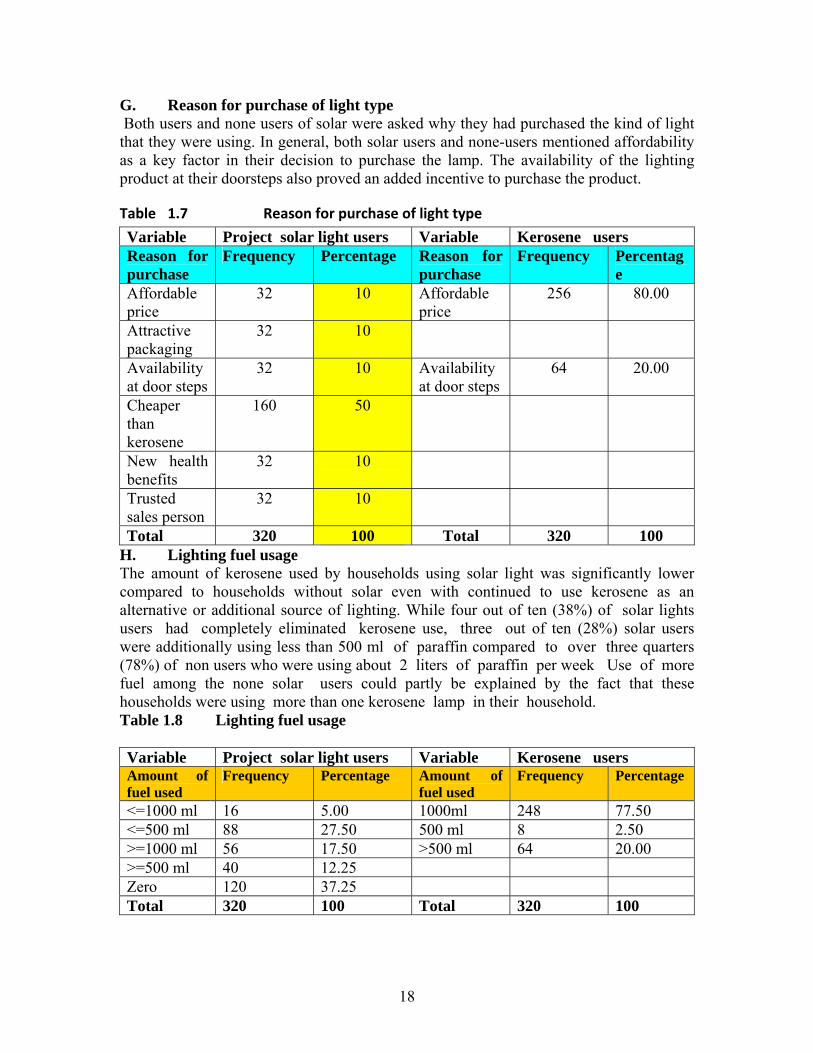
G. Reason for purchase of light type Both users and none users of solar were asked why they had purchased the kind of light that they were using. In general, both solar users and none-users mentioned affordability as a key factor in their decision to purchase the lamp. The availability of the lighting product at their doorsteps also proved an added incentive to purchase the product.
Table 1.7 Reason for purchase of light type Variable Project solar light users Variable Kerosene users Reason for purchase
Frequency Percentage Reason for purchase
Frequency Percentage
Affordable price
32 10 Affordable price
256 80.00
Attractive packaging
32 10
Availability at door steps
32 10 Availability at door steps
64 20.00
Cheaper than kerosene
160 50
New health benefits
32 10
Trusted sales person
32 10
Total 320 100 Total 320 100 H. Lighting fuel usage The amount of kerosene used by households using solar light was significantly lower compared to households without solar even with continued to use kerosene as an alternative or additional source of lighting. While four out of ten (38%) of solar lights users had completely eliminated kerosene use, three out of ten (28%) solar users were additionally using less than 500 ml of paraffin compared to over three quarters (78%) of non users who were using about 2 liters of paraffin per week Use of more fuel among the none solar users could partly be explained by the fact that these households were using more than one kerosene lamp in their household. Table 1.8 Lighting fuel usage Variable Project solar light users Variable Kerosene users Amount of fuel used
Frequency Percentage Amount of fuel used
Frequency Percentage
<=1000 ml 16 5.00 1000ml 248 77.50 <=500 ml 88 27.50 500 ml 8 2.50 >=1000 ml 56 17.50 >500 ml 64 20.00 >=500 ml 40 12.25 Zero 120 37.25 Total 320 100 Total 320 100

19
I. Lighting expenses One of the primary outcome questions of analysis were ; i) does the intervention lead to ;i) reduced kerosene fuel budget;. According to Table 1.9 the weekly lighting expenses stated by households using solar light was significantly lower compared to households without solar light even with continued use of kerosene as an alternative or additional source of lighting. The lighting expenses of 37% of solar users had completely been eliminated compared to 65% of kerosene users who stated spending US$3 per week on lighting expenses. Table 1.9 Lighting expenses Variable Project solar light users Variabl
e Kerosene users
Reported weekly lighting expenses
Frequency Percentage Lighting expenses
Frequency Percentage
0$ 120 37.50 0$ US$1 136 42.50 US$1
US$ 1.5 8 2.50 US$ 1.5 US$2 24 7.50 US$2 112 35.00
US$2.5 32 10.00 US$2.5 0 0 US$3 0 0 US$3 208 65.00
Total 320 100 Total 320 100 J. Fuel expenses by type of light used A further analysis (Table 1.10 ) indicates that the weekly lighting expenses of almost all (94%) of clients exclusively using the solar lamps for their lighting were completely eliminated compared to the majority (71%) of solar users with continued kerosene use as an alternative or additional source of lighting who stated spending one US$ dollar per week, suggesting existence of several kerosene lamps in use among none-solar users. Table 1.10 lighting expenses by type of light used
Lighting source Reported weekly lighting expenses Using both Solar and
Kerosene Using Solar only
Total
0$ 0 120 120 % 0.00 93.75 37.50
US$1 136 0 136 % 70.83 0.00 42.50
US$1.5 0 8 8 % 0.00 6.25 2.50
US$2 24 0 24 % 12.50 0.00 7.50
US$2.5 32 0 32 % 16.67 0.00 10.00
Total 192 128 320 % 100.00 100.00 100.00
Pearson chi2 (4) =320.0000 Pr=0.000
20
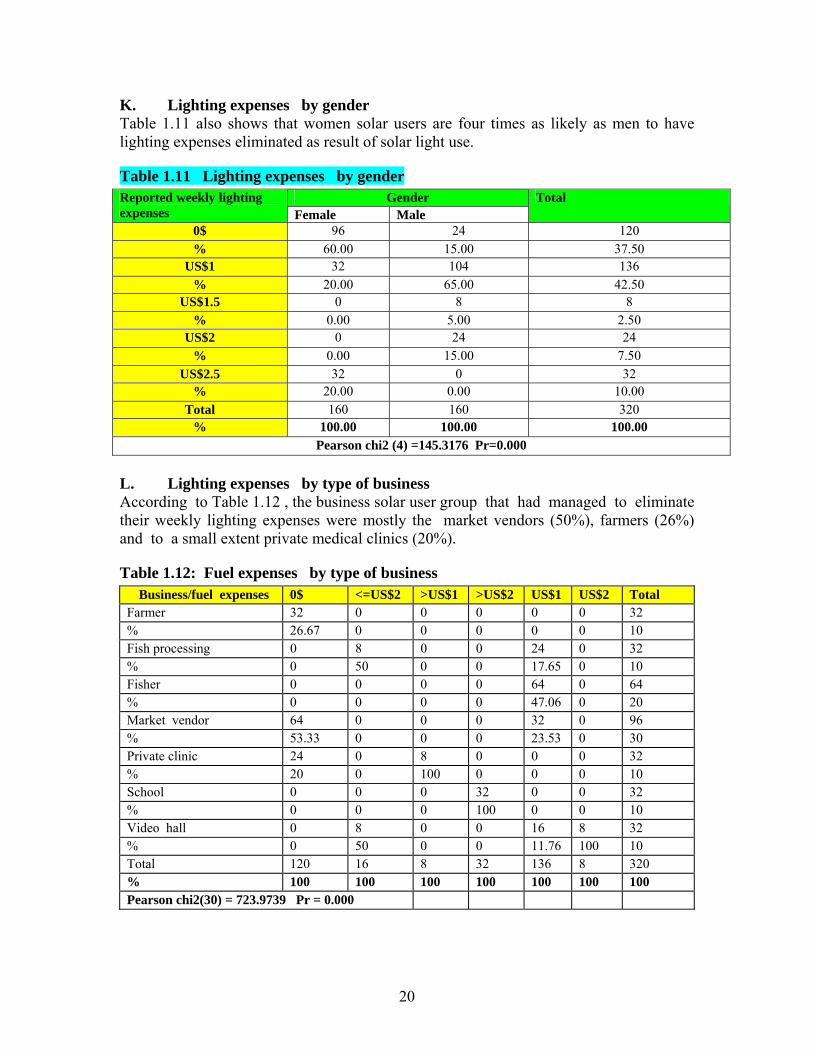
K. Lighting expenses by gender Table 1.11 also shows that women solar users are four times as likely as men to have lighting expenses eliminated as result of solar light use.
Table 1.11 Lighting expenses by gender Gender Reported weekly lighting
expenses Female Male Total
0$ 96 24 120 % 60.00 15.00 37.50
US$1 32 104 136 % 20.00 65.00 42.50
US$1.5 0 8 8 % 0.00 5.00 2.50
US$2 0 24 24 % 0.00 15.00 7.50
US$2.5 32 0 32 % 20.00 0.00 10.00
Total 160 160 320 % 100.00 100.00 100.00
Pearson chi2 (4) =145.3176 Pr=0.000 L. Lighting expenses by type of business According to Table 1.12 , the business solar user group that had managed to eliminate their weekly lighting expenses were mostly the market vendors (50%), farmers (26%) and to a small extent private medical clinics (20%).
Table 1.12: Fuel expenses by type of business Business/fuel expenses 0$ <=US$2 >US$1 >US$2 US$1 US$2 Total Farmer 32 0 0 0 0 0 32 % 26.67 0 0 0 0 0 10 Fish processing 0 8 0 0 24 0 32 % 0 50 0 0 17.65 0 10 Fisher 0 0 0 0 64 0 64 % 0 0 0 0 47.06 0 20 Market vendor 64 0 0 0 32 0 96 % 53.33 0 0 0 23.53 0 30 Private clinic 24 0 8 0 0 0 32 % 20 0 100 0 0 0 10 School 0 0 0 32 0 0 32 % 0 0 0 100 0 0 10 Video hall 0 8 0 0 16 8 32 % 0 50 0 0 11.76 100 10 Total 120 16 8 32 136 8 320 % 100 100 100 100 100 100 100 Pearson chi2(30) = 723.9739 Pr = 0.000

21
M. Fire accidents In addition, respondents were asked, whether they ever experienced or have heard of a fire related accident in the last 4 months in their villages. Table 1.13 shows that while only 20% of solar users reported a fire related accident of which the cause was boat fuel in a jerican, the majority of kerosene users reported a fire related accident of which the cause was by a kerosene lamp.
Table 1.13 Fire accidents by cause Variable Project solar light users Variable Kerosene users Heard of fire accident
Frequency Percentage Heard of fire accident
Frequency Percentage
Yes 64 80.00 Yes 200 62.50 No 256 20.00 No 120 37.50 Total 320 100 Total 320 100 Cause Cause Boat fuel in a jerican
64 100.00 Kerosene lamp
200 100.00
N. Willingness to pay for the light Clients who acquired the solar lights were asked whether there were wiling to acquire additional lights , while those clients who had not acquired the solar were asked what were their preferred mode of acquiring the solar light. According to Table 1.14, while 40 % of current solar users stated requiring additionally solar lights, 30% stated that they even required larger solar lights. Among the none-users, 70% preferred acquiring the lights through payment installments.
Table 1.14 Willingness to pay for the light Variable Project solar
light users Variable Kerosene users
Willingness Freq. Percent Willingness Freq. Percent Current lamp is enough 96 30 Installment 224 70 More lamps needed 128 40 Outright
purchase 96 30
More lamps needed including larger solar 96 30 Total 320 100 Total 320 100
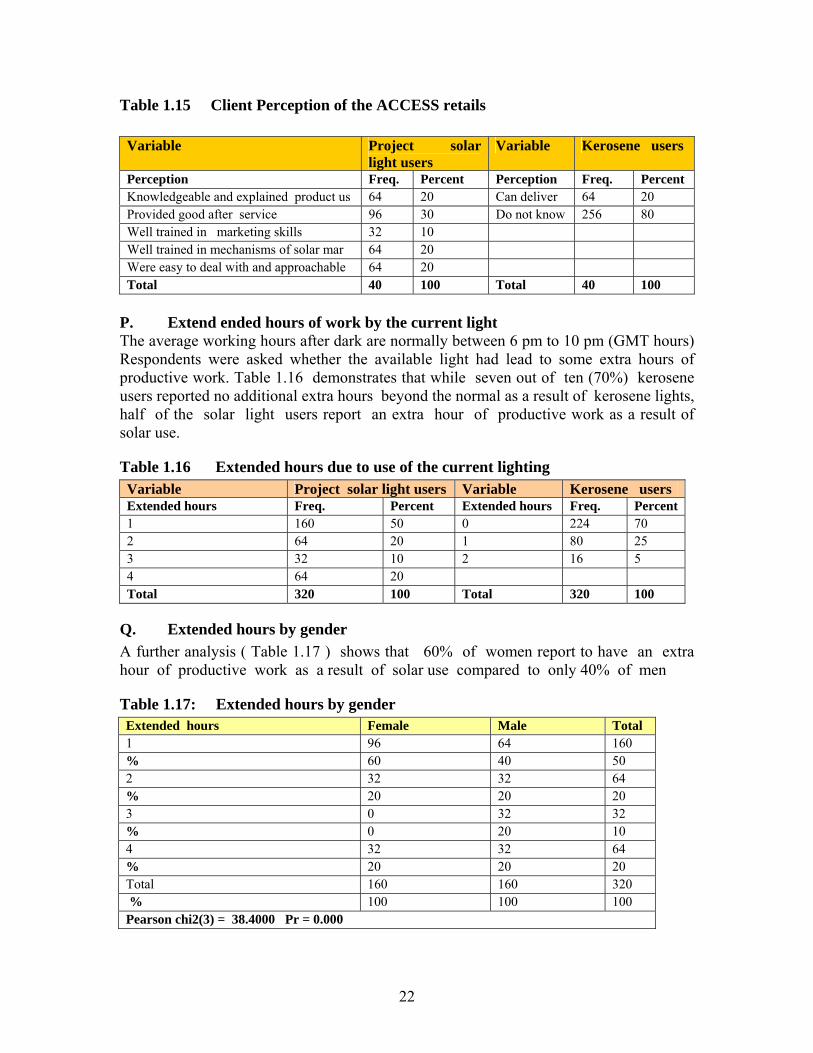
O. Client Perception of the ACCESS retails While the solar clients who acquired the solar lights were asked how they felt about the ACCESS entrepreneur who sold them the product, clients who had not acquired the solar were asked to give their view on whether they could acquire the lights through the Village Credit Cooperatives. According to Table 1.15, while three out of the ten users stated that the ACCESS retails provided good after service, the rest of the opinions were spilt between those who believed that ACCESS retails were knowledgeable (20%) well trained (20%) were easy to deal with and approachable(20%). Among the none-users, 80% do not know whether the ACCESS retails could deliver the solar lights.
22
Table 1.15 Client Perception of the ACCESS retails Variable Project solar
light users Variable Kerosene users
Perception Freq. Percent Perception Freq. Percent Knowledgeable and explained product us 64 20 Can deliver 64 20 Provided good after service 96 30 Do not know 256 80 Well trained in marketing skills 32 10 Well trained in mechanisms of solar mar 64 20 Were easy to deal with and approachable 64 20 Total 40 100 Total 40 100
P. Extend ended hours of work by the current light The average working hours after dark are normally between 6 pm to 10 pm (GMT hours) Respondents were asked whether the available light had lead to some extra hours of productive work. Table 1.16 demonstrates that while seven out of ten (70%) kerosene users reported no additional extra hours beyond the normal as a result of kerosene lights, half of the solar light users report an extra hour of productive work as a result of solar use.
Table 1.16 Extended hours due to use of the current lighting Variable Project solar light users Variable Kerosene users Extended hours Freq. Percent Extended hours Freq. Percent 1 160 50 0 224 70 2 64 20 1 80 25 3 32 10 2 16 5 4 64 20 Total 320 100 Total 320 100
Q. Extended hours by gender A further analysis ( Table 1.17 ) shows that 60% of women report to have an extra hour of productive work as a result of solar use compared to only 40% of men
Table 1.17: Extended hours by gender Extended hours Female Male Total 1 96 64 160 % 60 40 50 2 32 32 64 % 20 20 20 3 0 32 32 % 0 20 10 4 32 32 64 % 20 20 20 Total 160 160 320 % 100 100 100 Pearson chi2(3) = 38.4000 Pr = 0.000
23
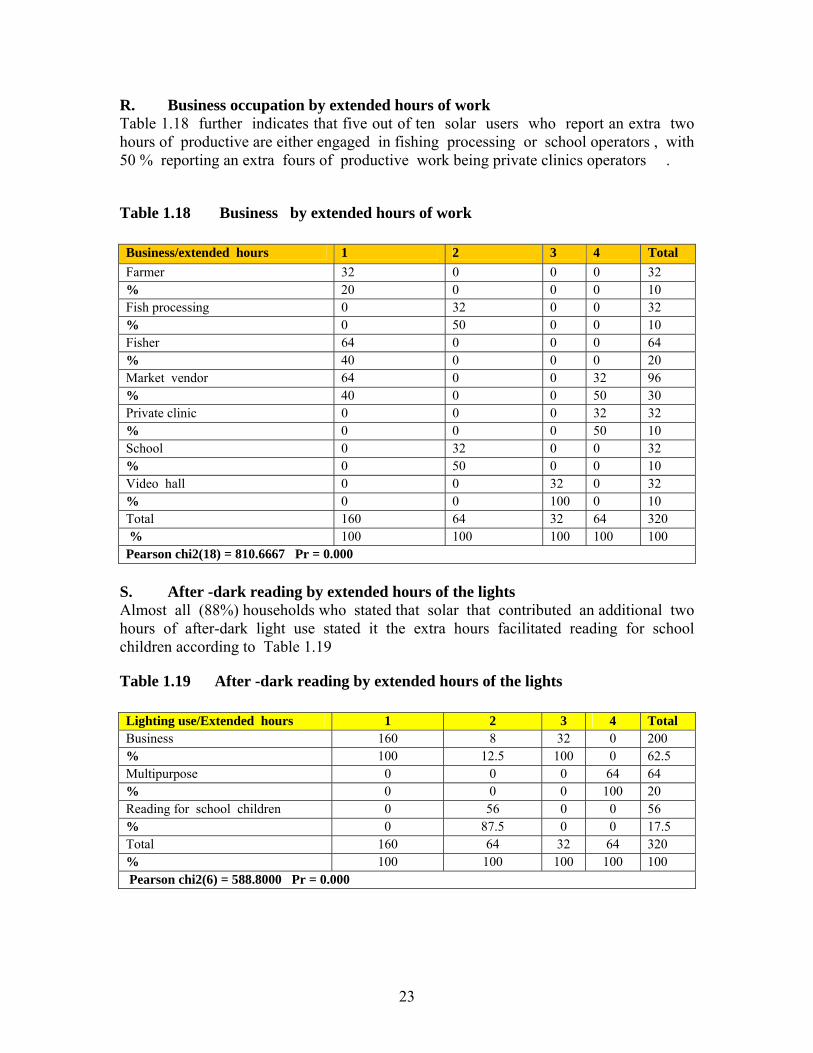
R. Business occupation by extended hours of work Table 1.18 further indicates that five out of ten solar users who report an extra two hours of productive are either engaged in fishing processing or school operators , with 50 % reporting an extra fours of productive work being private clinics operators .
Table 1.18 Business by extended hours of work Business/extended hours 1 2 3 4 Total Farmer 32 0 0 0 32 % 20 0 0 0 10 Fish processing 0 32 0 0 32 % 0 50 0 0 10 Fisher 64 0 0 0 64 % 40 0 0 0 20 Market vendor 64 0 0 32 96 % 40 0 0 50 30 Private clinic 0 0 0 32 32 % 0 0 0 50 10 School 0 32 0 0 32 % 0 50 0 0 10 Video hall 0 0 32 0 32 % 0 0 100 0 10 Total 160 64 32 64 320 % 100 100 100 100 100 Pearson chi2(18) = 810.6667 Pr = 0.000
S. After -dark reading by extended hours of the lights Almost all (88%) households who stated that solar that contributed an additional two hours of after-dark light use stated it the extra hours facilitated reading for school children according to Table 1.19
Table 1.19 After -dark reading by extended hours of the lights Lighting use/Extended hours 1 2 3 4 Total Business 160 8 32 0 200 % 100 12.5 100 0 62.5 Multipurpose 0 0 0 64 64 % 0 0 0 100 20 Reading for school children 0 56 0 0 56 % 0 87.5 0 0 17.5 Total 160 64 32 64 320 % 100 100 100 100 100 Pearson chi2(6) = 588.8000 Pr = 0.000
24
VII. Strengths, Weaknesses, Opportunities and Threats During the evaluation of the pilot project, a SWOT analysis was made based on the document reviews, interviews and observations in the project communities Strength
The households who acquired the solar lights were enjoying a higher quality source of lighting
Households saved an average of US$8 which they would have otherwise spent on lighting fuel.
The ACCESS retails who were trained in Entrepreneurship skills and salesmanship gained new skills and the confidence to conduct their own businesses whilst working to combat climate change.
Creation of training and businesses in rural areas provided alternate opportunities to youth. A key to preventing urban migration.
New technologies were made more available to rural communities. Households were more likely to purchase lamps when available at their doorsteps, rather than having to go to urban centers. Follow up service have been made available so customers can access the warranties and replacement guarantee.
The product simplicity enabled use by people with limited exposure to modern technical products.
All involved in the project were exposed to climate changes issues and potential of alternative energy sources.
The total number of solar units sold was more than originally anticipated which demonstrated the popularity of the product.
Weaknesses
Current back up service provided together with the guarantee for repair and replacement should be improved and continued as part of the sales package to maintain good will and expand sales.
The distribution chain relied too much on individual ACCESS staff member already committed to a range of responsibilities. This resulted to the delay of supply of lamps to sales people.
In some instances, the ACCESS retails failed to give a clear explanation of how the solar unit should be treated especially in the terms of charging requirements and the care of parts. Some were returned on the assumption they were faulty yet inadequate charging proved the most common reason for units being returned for repairs.
In some instances ACCESS entrepreneurs gave units on credit which delayed the payments being received and ran risks of not recouping the cost of the lamp.
During community consultations the price for solar lamps was established as affordable. However during implementation, it appeared that the cost of the lamp was prohibitive for many households particularly when the expectation was to pay the full amount up front to purchase the lamp.
25
Introduction of different types of units created some confusion in the community. Since units with mobile chargers were more popular the other units being sold were sometimes considered inferior.
Opportunities
The likely hood of an electricity grid being available to the largest population in the near future is extremely low. There is a great need for alternative energy source and solar energy has proven viable.
The recent introduction of a new mobile carrier in Kalangala District Island has meant that there is greater coverage for mobile phones at competitive prices. Mobile phones have become financially accessible. A solar product with capacity to charge mobile phones has proven an attractive proposition for people leaving in areas with no electricity.
With in shortest project period-and the deliberately chosen and limited market-customers had ready cash to purchase the lamps. They also required about more complex household lighting systems. Careful market analysis and introduction of products could gradually develop the market for larger and more complex units.
Alternative installment payment systems could be designed for the future for the households that cannot pay the full upfront price on condition that the lamp is delivered at the end of full payment being received. This could result into larger number of house holds buying the lamps.
Threats
Further investment is needed in training and re-training ACCESS retails before they are allowed to sell the units in general market place.
Existing solar products from competitors have broken down quickly and affected reputation and sales of solar products.
Due to the slow business development of ACCESS retails, other competitors may sell solar products to the same market. Having proved the viability of solar products as a replacement for kerosene through the entrepreneur training model in remote areas, other merchants could enter the market rapidly. This has two implications for ACCESS retails , the first being loss of market opportunities and the other is bad publicity due to bad practices introduced by competitors who enter the market for quick sales.

26
VIII. Conclusion and Recommendations
A. Conclusion
Benefits derived from solar home lights The benefits derived from the use of solar lamps have improved the overall wellbeing of the households. This has been observed during interaction with the users during the field surveys . Some of the benefits are listed below: 1. A leap towards children's education: almost all (87%) households who stated that solar contributed to an additional two hours of light use stated it was for reading after dark . During the survey interviews, one gentleman desperately approached the office to get his equipment repaired since his daughter's school examination was coming up and his system had suddenly broken down. He was ready to do anything to get it repaired. This showed the benefit children received due to the lights. 2. Improvement in health: The analysis also shows that women solar users are four times as likely as men to have their lighting expenses eliminated as result of solar light use. This implies that with the solar systems in place, fewer women will suffer from respiratory problems. Kerosene fumes will cease to affect the eyes of the family members. Women are affected much more severely than men since they stay at home for much longer hours. They suffer due to the rigid patriarchal structure, where suffering in silence is understood to be the order. 3. Saving of money: In several houses, the supply of kerosene, which is normally 4-8 liters a month, comes from the unsubsidized retail shop. Among the exclusively solar light users, this consumption has stopped entirely or reduced drastically, helping the family save an average of US$ 8 dollars a month. There are also many livelihood enhancement opportunities in the villages as result of additional hours of productive work as a result of the solar. 4. Increasing safety for the family: The benefits go much beyond financial calculations. The small proportion of responses related to kerosene fire accidents among solar users compared to the none-users are testimony to this. However, the majority of the households continue to use kerosene lamps in the evening in addition to solar lanterns. This again emphasizes the need to distribute multiple solar lanterns per household.
27
B. Recommendations
This section discusses strategic short and long-term recommendations for LRUS to consider for reinforcing and expanding on its operational model. Factors affecting expansion The potential for expansion of the solar project in Kalangala district is high since more than 90 % of the district country has no electricity. The likelihood of electricity reaching the 84 remote islands in the near future is extremely unlikely. There are however, four important aspects that need to be taken into consideration before any expansion is planned. Geography: Access to remote areas is limited therefore provision of follow-up services as part of the sale is extremely challenging. Implementation through ACCESS retails and possibly churches and other church institutions is one way to overcome this as they provide a good distribution point as well as the means to provide back-up service and repairs. These institutions need assistance building a sound business model and help with implementation. Courses can be structured around the aspects of the project such as repairs and maintenance of solar products as well as teaching entrepreneurship as part of their curriculum. This could then develop as a sustainable model for the institution for running a business as an adjunct activity while continuing their core business. Affordability: In remote areas with a weaker cash economy. Keeping the price affordable to people in remote areas is a challenge. In many remote areas, the success of sales may be dependent on having a flexible payment option or purchase with goods in kind instead of cash. This needs further exploration and trials. Access entrepreneurs might exchange solar lamps for goods in kind or sell at a higher profit margin in urban centers. Follow-up Service: The ability to take the solar products to the door steps of people living in remote areas and to provide a follow up service is a key factor in increasing market access. This however may increase the price of products. Since competition in hard to reach areas would be limited, a different pricing structure may be acceptable. Disposal of disused products environmentally: The environmental impact due to the disposal of old and disused units of desk lamps should be carefully assessed before undertaking major scaling up of sales. In particular, the disposal of batteries and non-degradable plastic parts should be actively managed. Immediate target areas for expansion through the ACCESS network model This project can be scaled-up to the rest of Uganda. The same model that was applied in Kalangala District can be used in the least and scattered un-electrified rural Uganda. However, any expansion work should carefully consider the ability of the supply chain to support the scale-up of ACCESS retails to manage the business and adequately resource the activities.

28
Recommended products and costing for expansion Considering levels of capacity, both within LRUS and within the community, the products introduced should be simple and require minimum maintenance. Currently all literature on product specifications are labeled in English; care should be taken to label the product and produce a simple instruction card in local language with illustrations to be distributed with the product during sales. The solar lights introduced in Kalangala District have multiple features which can easily be operated by adults and children. The ability to charge mobile phones has proven popular and is an excellent feature that adds value to the product, especially since the extension of mobile phone coverage. Based on the feedback of buyers, the cost of the product is an important factor in families buying the product. With any scale up of sales and marketing, affordability of the product needs to be taken into account and profits margins factored in realistically. It is recommended that cost recovery and profits are managed through volume of sales rather than by recovering costs through marking up individual unit sales. Capacity building of ACCESS retails in business management Continued association with ACESS retails to expand the project across other parts of Kalangala Islands would require much needed capacity building as a pre-requisite. The two areas to concentrate would be to: a) help ACCESS retails with robust business development plans; and b). assist in developing good stock control and cash management systems.
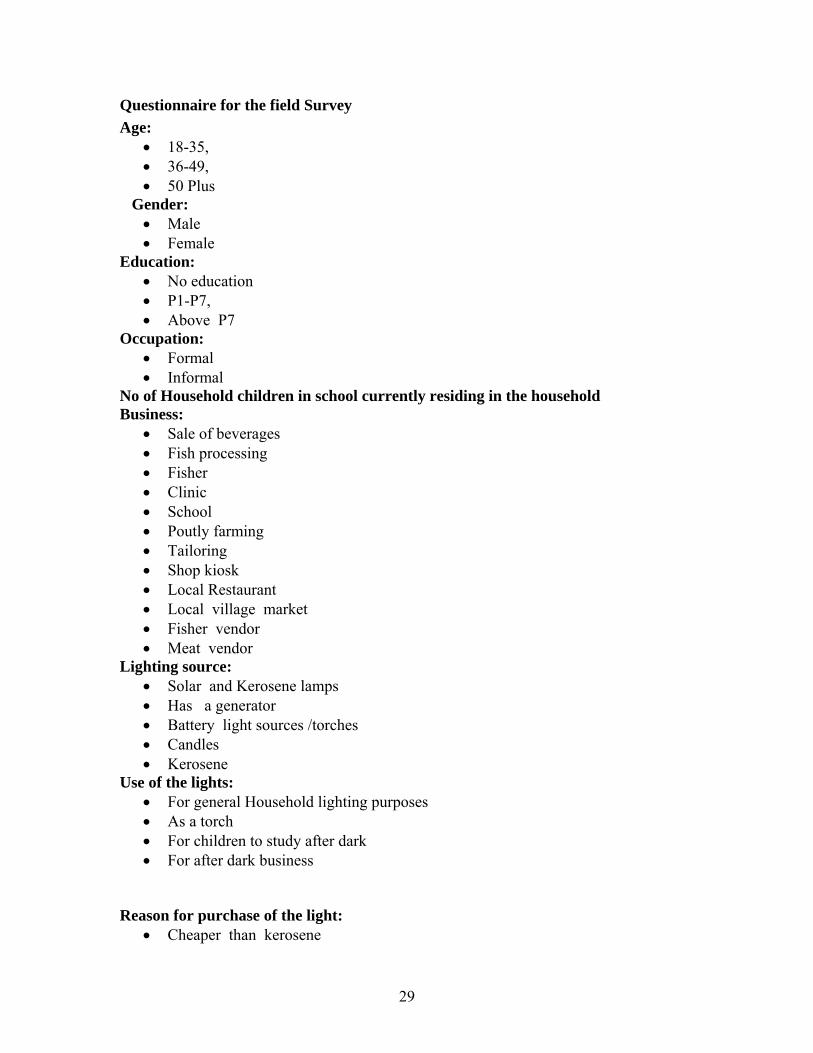
29
Questionnaire for the field Survey Age:
• 18-35, • 36-49, • 50 Plus
Gender: • Male • Female
Education: • No education • P1-P7, • Above P7
Occupation: • Formal • Informal
No of Household children in school currently residing in the household Business:
• Sale of beverages • Fish processing • Fisher • Clinic • School • Poutly farming • Tailoring • Shop kiosk • Local Restaurant • Local village market • Fisher vendor • Meat vendor
Lighting source: • Solar and Kerosene lamps • Has a generator • Battery light sources /torches • Candles • Kerosene
Use of the lights: • For general Household lighting purposes • As a torch • For children to study after dark • For after dark business
Reason for purchase of the light:
• Cheaper than kerosene

30
• Affordable • Availability at the door • Knew of benefits of solar light • Attractive packaging • Convenient to use • Knew the health benefits • Felt the sales person was trustworthy
Amount of Kerosene bought/week: Less 500 ml 500ml 1000 ml Above 1000 ml Average expenditure:
• O$ • Less than U$1 • U$2 • U$3 • Above US$4
Nature of the light: • Not bright • Bright and Pleasant • Do not know
Willingness to procure use more units of the current lighting lamps at current price • Current lamp is enough • More lamps needed • More lamps including larger one needed
In case of the comparison group Probe: willingness
Outright purchase Installments
How did you feel about ACCESS solar outlets personnel • Were knowledgeable and explained the product well • Were trained in mechanisms of the solar lamp • Were easy to deal with and approachable • Provided good after services follow up services
In case of the comparison group Probe: Potential of non users to acquire the lights Village credit groups
• Could acquire the lights via VCCs • Couldn’t acquire the lights via the VCC • I do not know
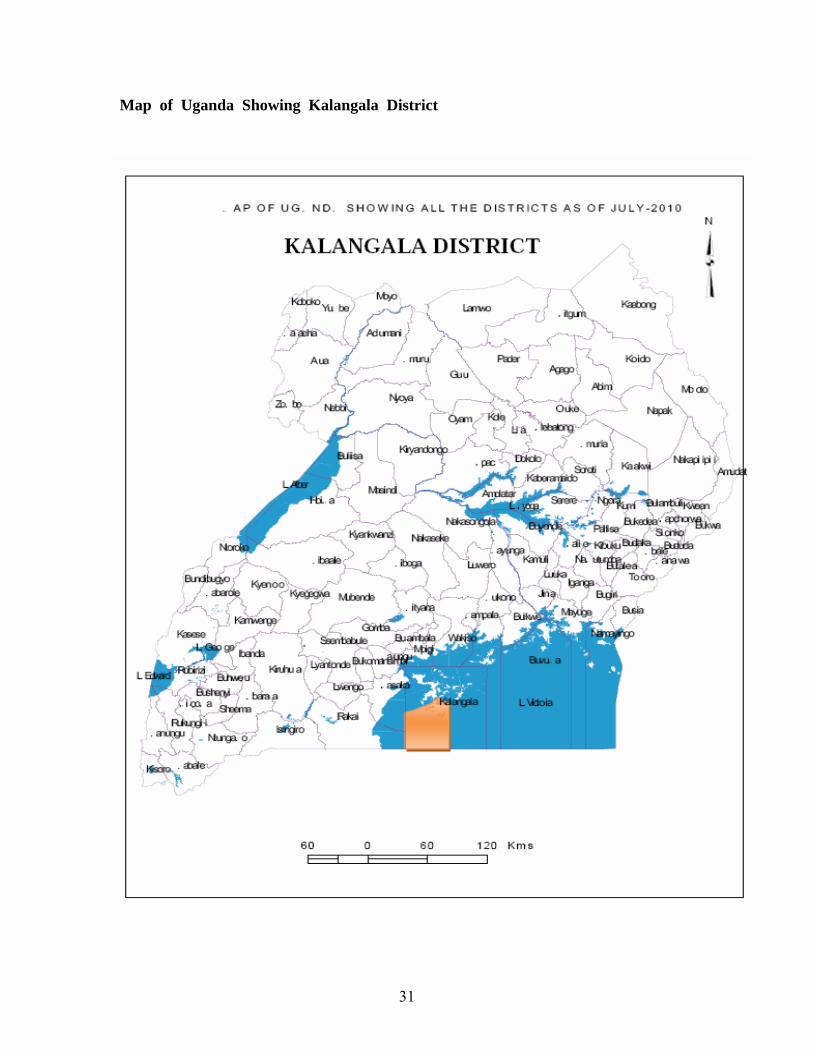
31
Map of Uganda Showing Kalangala District

32
Map of Kalangala District