rural-urban connections strategy - oecd.org€¦ · rural-urban connections strategy . forest...
TRANSCRIPT
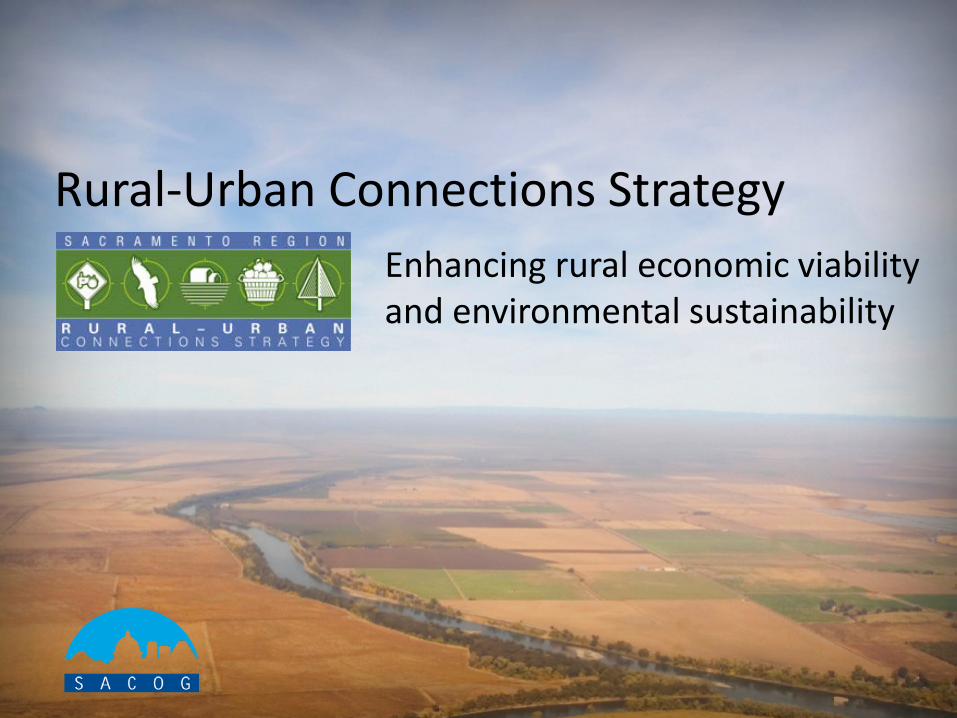
Enhancing rural economic viability and environmental sustainability
Rural-Urban Connections Strategy
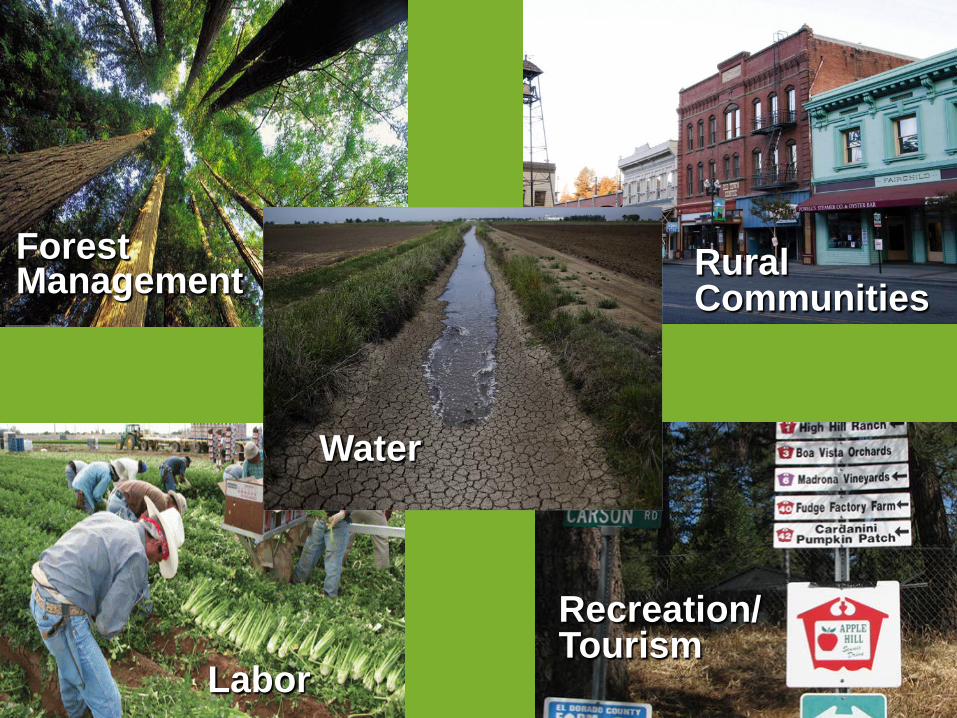
Forest Management
Labor
Rural Communities
Recreation/ Tourism
Water
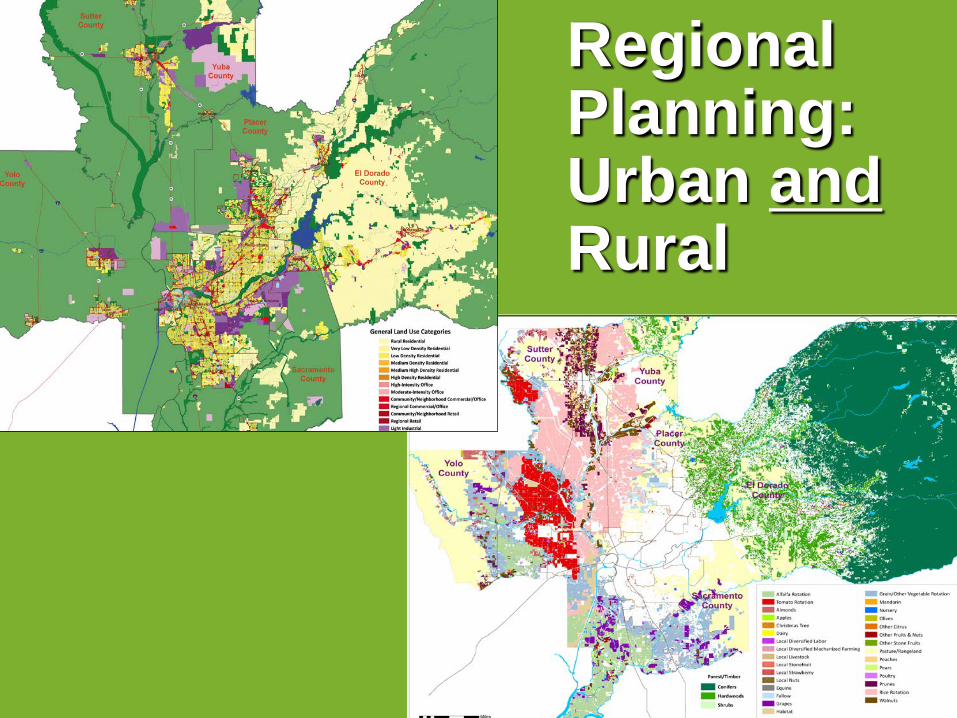
Regional Planning: Urban and Rural
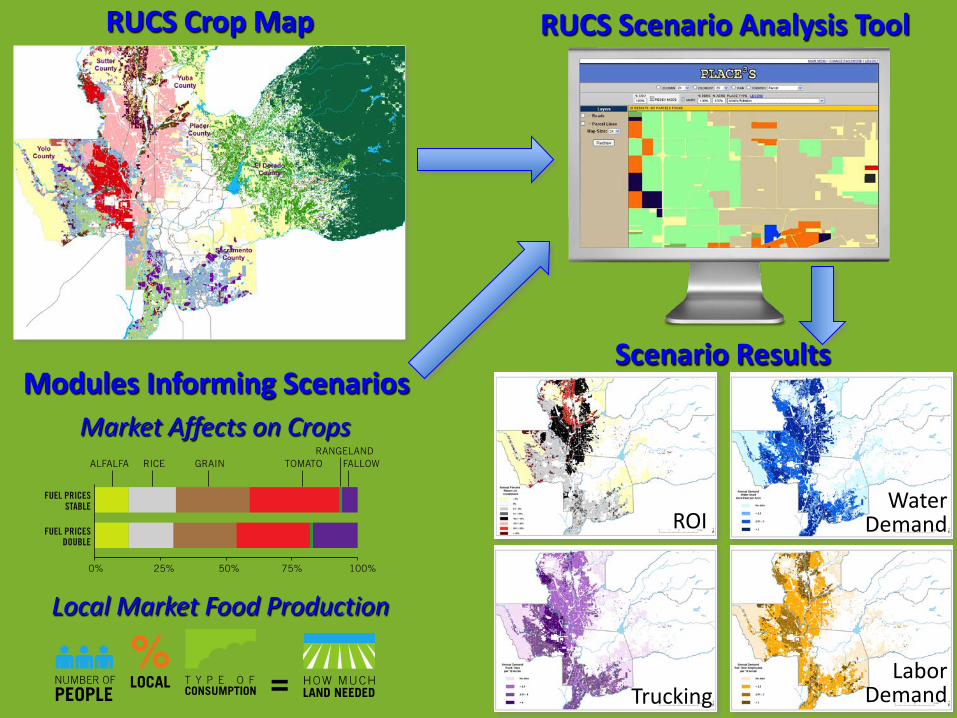
RUCS Crop Map
Market Affects on Crops
Local Market Food Production
RUCS Scenario Analysis Tool
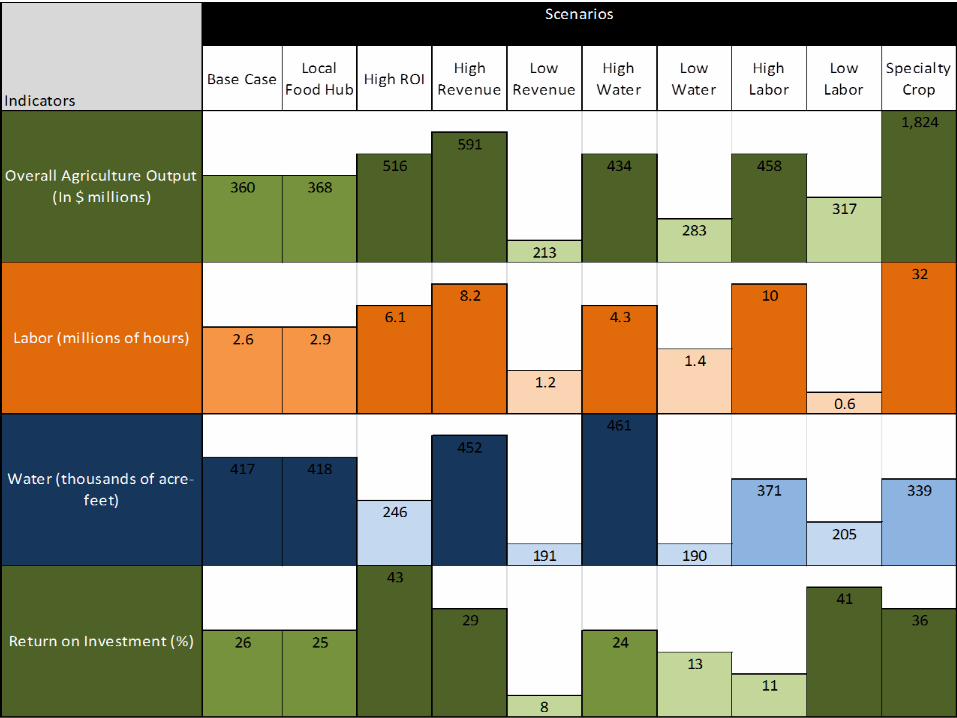
Scenario Results Modules Informing Scenarios
ROI Water
Demand
Labor Demand
Trucking

Commodity Markets
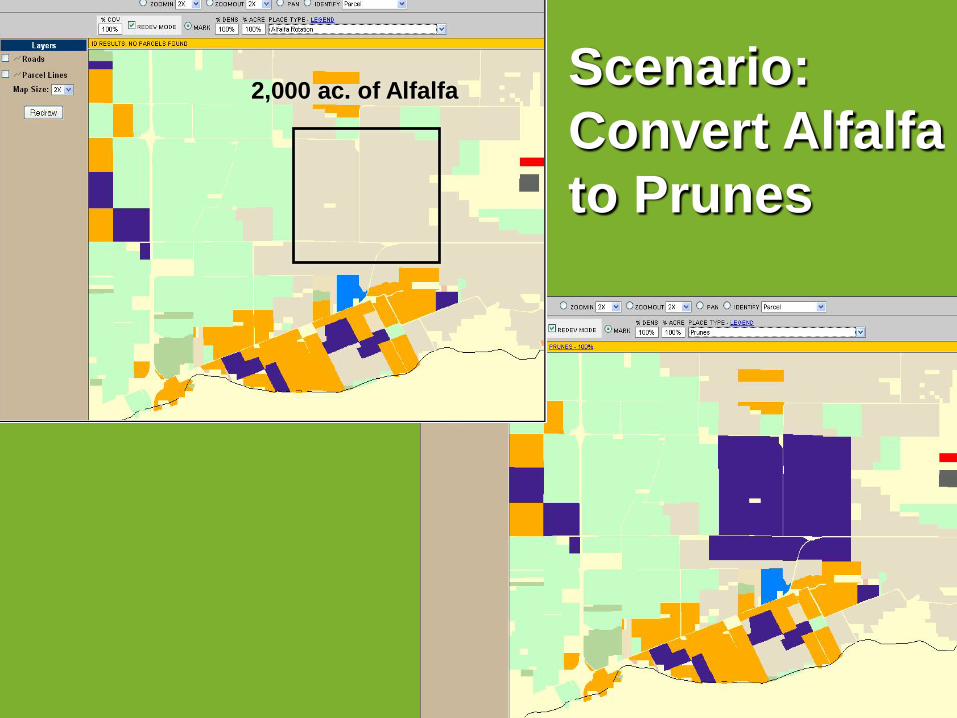
Scenario: Convert Alfalfa to Prunes
Alfalfa Converted to Prunes
2,000 ac. of Alfalfa
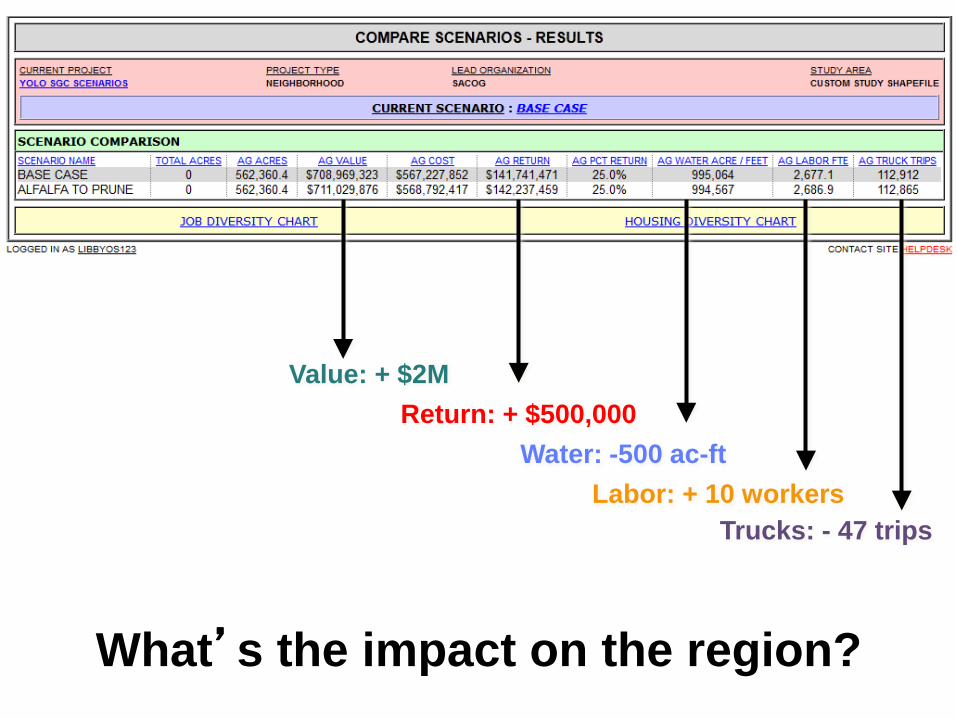
What’s the impact on the region?
Value: + $2M Return: + $500,000
Water: -500 ac-ft Labor: + 10 workers
Trucks: - 47 trips
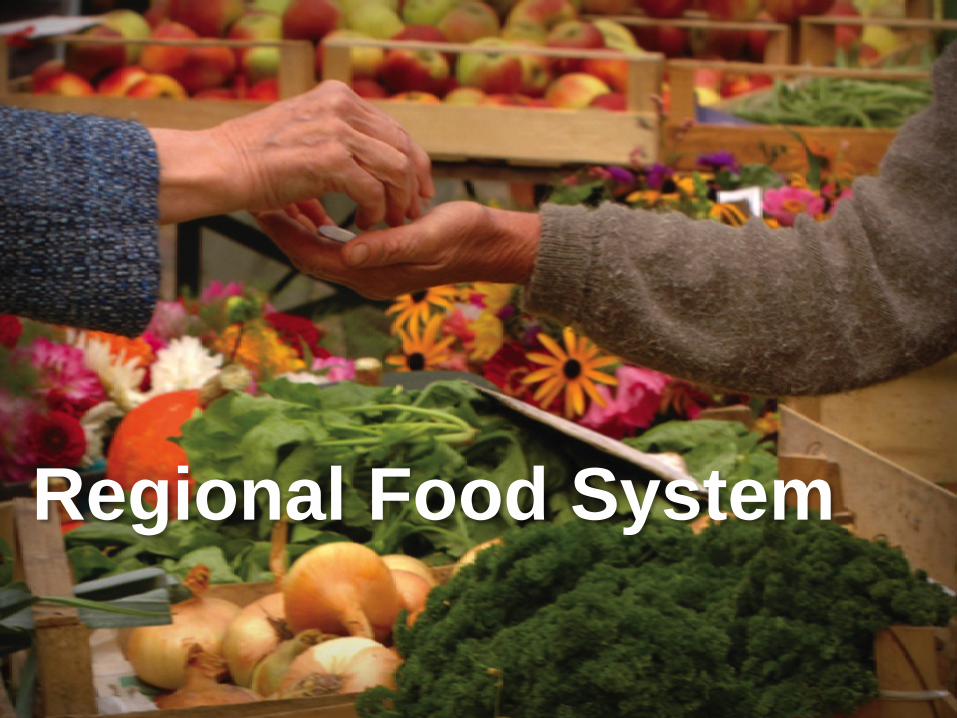
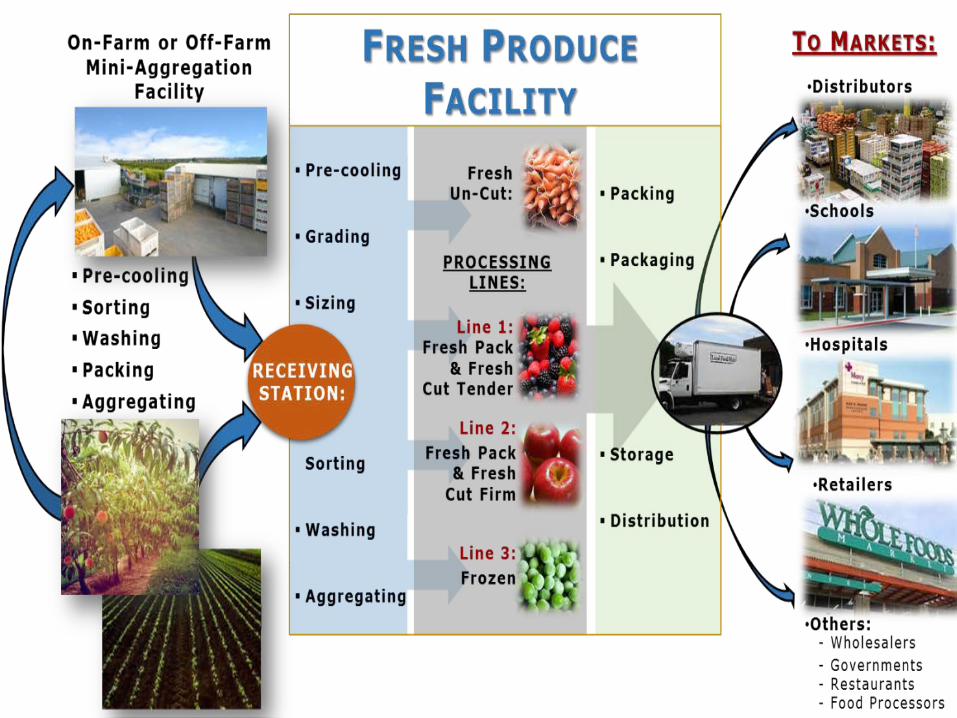
Regional Food System
Food Hub Business Plan
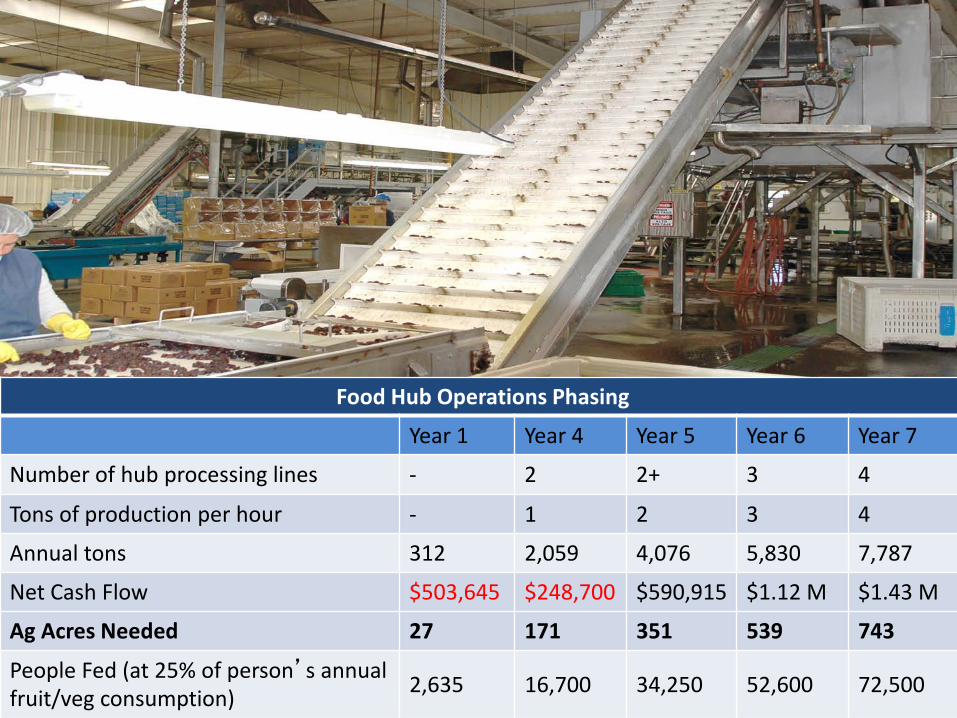
Food Hub Operations Phasing
Year 1 Year 4 Year 5 Year 6 Year 7
Number of hub processing lines - 2 2+ 3 4
Tons of production per hour - 1 2 3 4
Annual tons 312 2,059 4,076 5,830 7,787
Net Cash Flow $503,645 $248,700 $590,915 $1.12 M $1.43 M
Ag Acres Needed 27 171 351 539 743
People Fed (at 25% of person’s annual fruit/veg consumption) 2,635 16,700 34,250 52,600 72,500
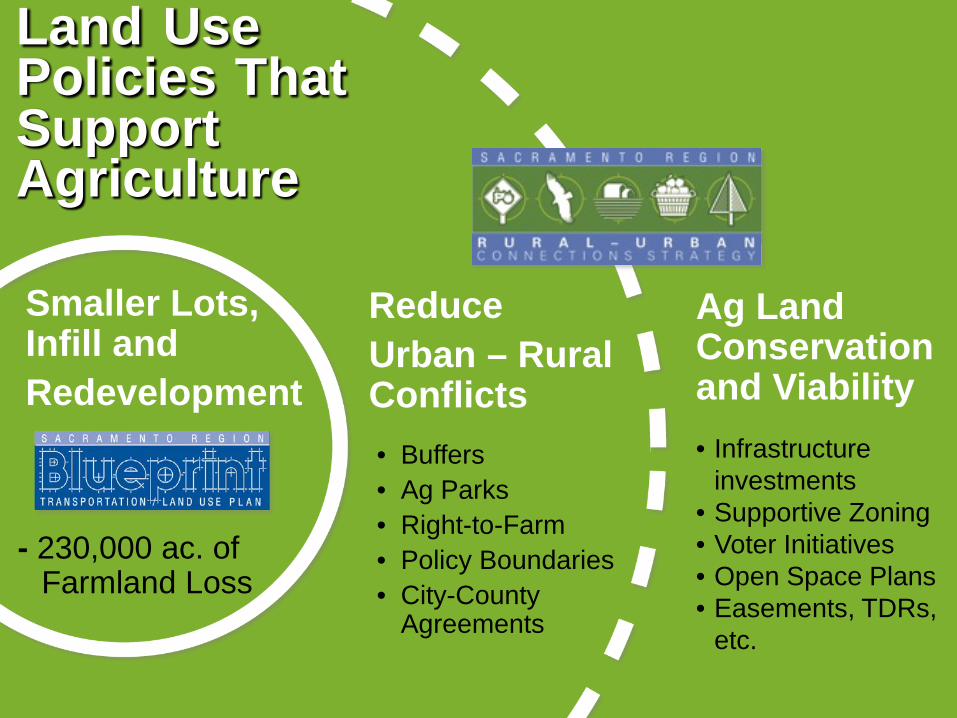
Smaller Lots, Infill and Redevelopment
Reduce Urban – Rural Conflicts • Buffers • Ag Parks • Right-to-Farm • Policy Boundaries • City-County
Agreements
Ag Land Conservation and Viability • Infrastructure
investments • Supportive Zoning • Voter Initiatives • Open Space Plans • Easements, TDRs,
etc.
- 230,000 ac. of Farmland Loss
Land Use Policies That Support Agriculture
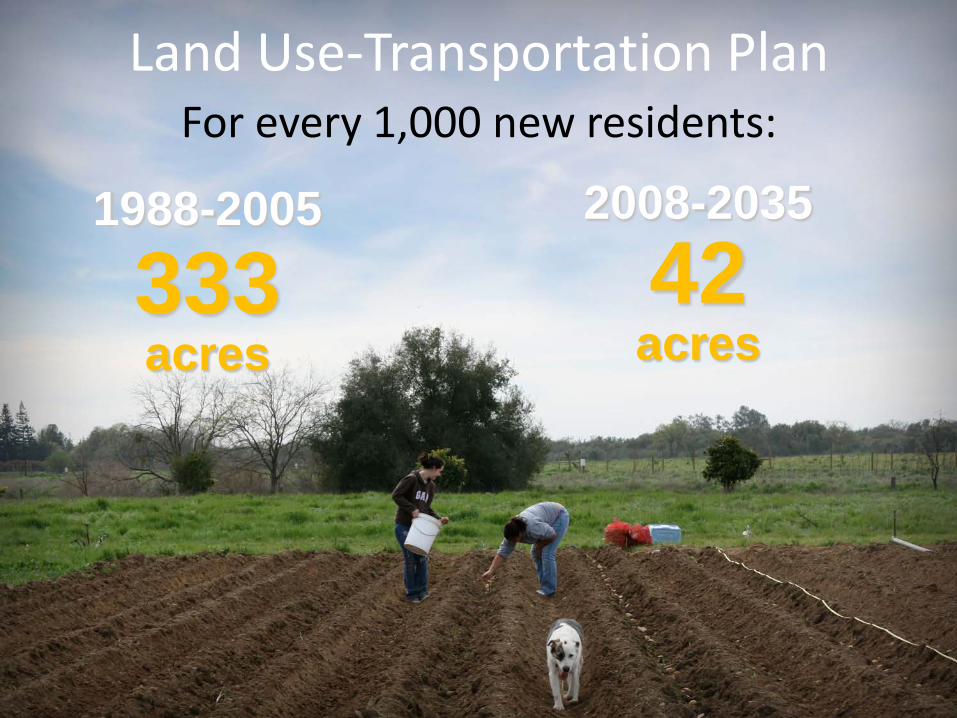
Land Use-Transportation Plan For every 1,000 new residents:
1988-2005
333 acres
2008-2035
42 acres
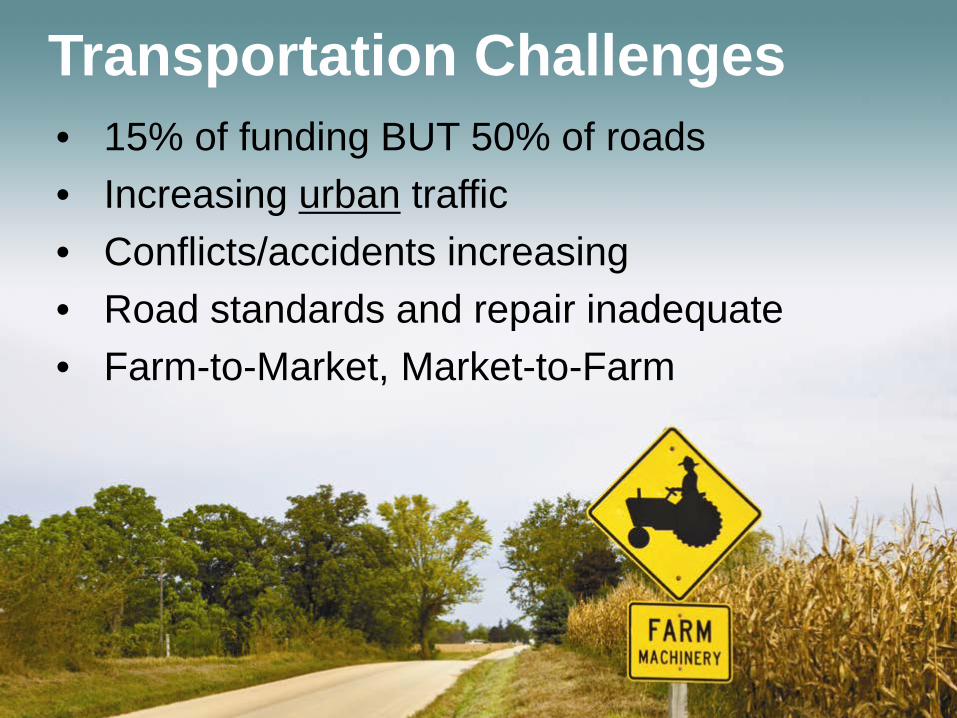
Transportation Challenges • 15% of funding BUT 50% of roads • Increasing urban traffic • Conflicts/accidents increasing • Road standards and repair inadequate • Farm-to-Market, Market-to-Farm
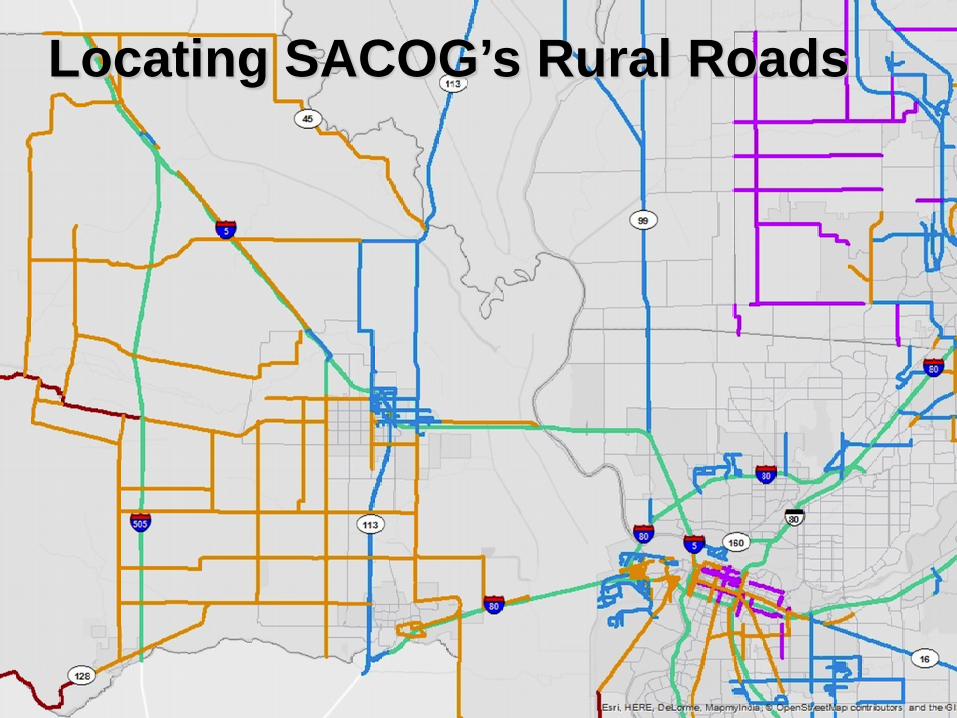
Locating SACOG’s Rural Roads
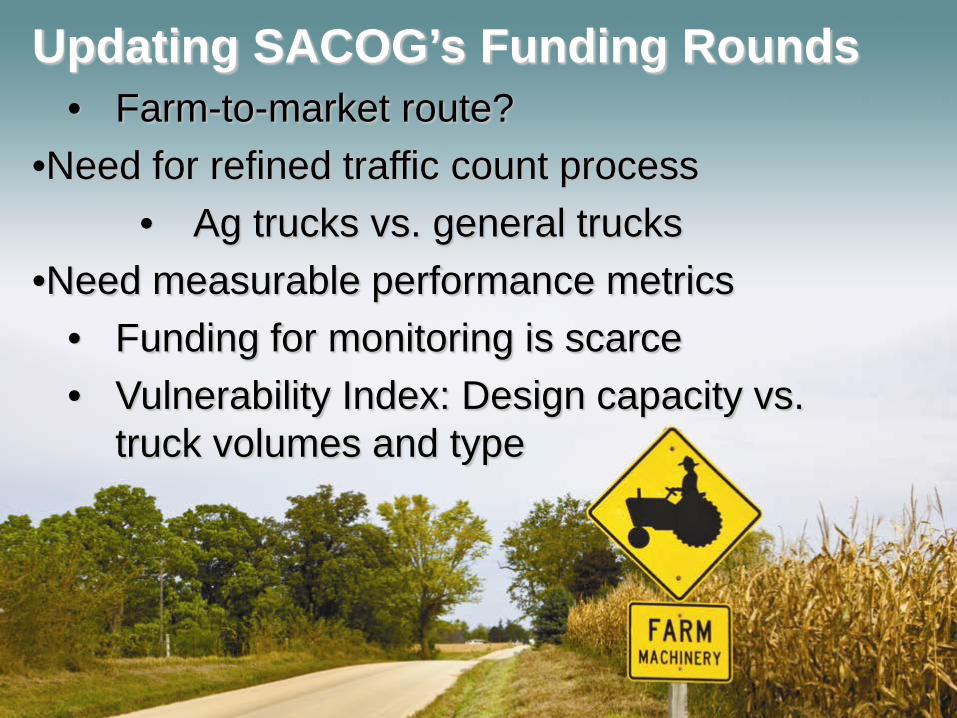
Updating SACOG’s Funding Rounds • Farm-to-market route?
•Need for refined traffic count process • Ag trucks vs. general trucks
•Need measurable performance metrics • Funding for monitoring is scarce • Vulnerability Index: Design capacity vs.
truck volumes and type
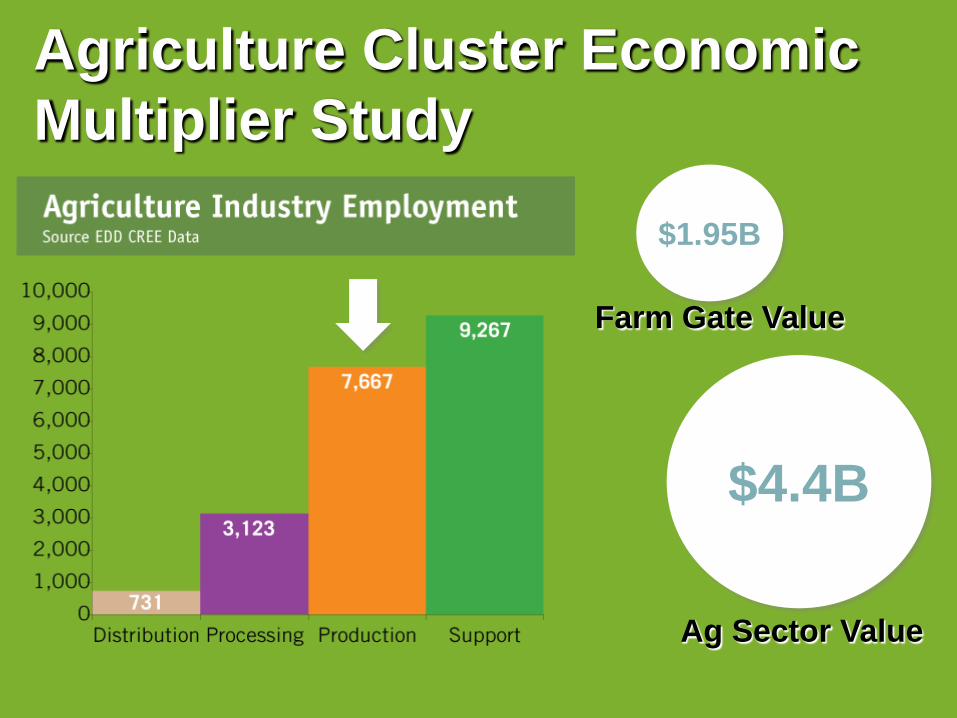
Agriculture Cluster Economic Multiplier Study
$1.95B
Farm Gate Value
$4.4B
Ag Sector Value
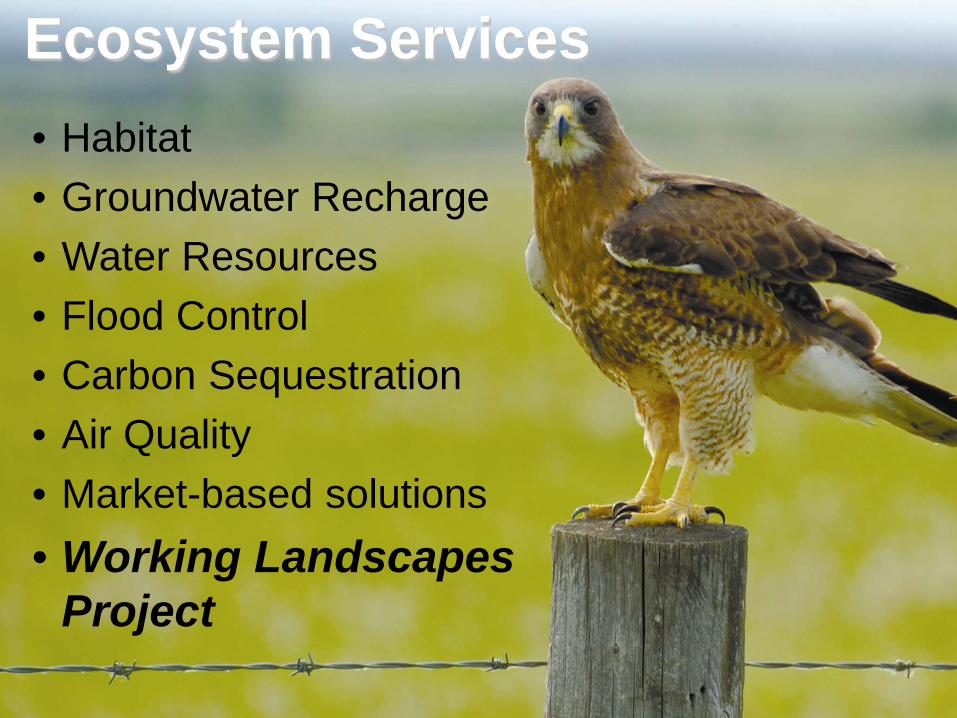
Ecosystem Services • Habitat • Groundwater Recharge • Water Resources • Flood Control • Carbon Sequestration • Air Quality • Market-based solutions • Working Landscapes
Project