russia’s oil&gas development and exports trends · 2019. 2. 1. · 32,2% 31,3% 18,6% 18,4%...
TRANSCRIPT

Alexey GROMOV,PhD, Principal Director on Energy Studies
Institute for Energy and Finance
Russia’s Oil&Gas Development and Exports Trends
The Eleventh Japan-Russia Energy and Environment Dialogue (JREED)Niigata, Japan
30th January 2019
1
Oil Industry1
Gas Industry2
Global oil market context
Russian oil production and export trends up to 2023
EU Gas market trends
Russian gas production and export trends up to 2023
R1-GROMOVEleventh Japan–Russia Energy and Environment Dialogue in Niigata
©ERINA

2
20
30
40
50
60
70
80
90
01/
15
03/
15
05/
15
07/
15
09/
15
11/
15
01/
16
03/
16
05/
16
07/
16
09/
16
11/
16
01/
17
03/
17
05/
17
07/
17
09/
17
11/
17
01/
18
03/
18
05/
18
07/
18
09/
18
11/
18
$/bblBrent WTI
OPEC+ Agreement Update (December
2018)OPEC+
Agreement (December
2016)
OECD commercial stocks reduction
Decreaseduring 2015
OPEC+ Agreement Update
(June 2018)
OPEC+ Agreement has a crucial role to stabilize the global oil market
• OPEC+ Agreement (December 2016) to cut collective oil production of 1,8 MMb/d supported global oil prices and reduced price volatility in1Q2017- 1Q2018.
• The threat of US sanctions against Iranian oil exports led to OPEC+ Agreement Update in June 2018 (increase collective oil production of 1MMb/d).
• New OPEC+ Agreement Update (December 2018) to cut collective oil production of 1,2 MMb/d has to reduce the oil market volatility in 2019
OPEC+ Agreement Update in December 2018 lead to gradually balancing the global oil market in 2019
Снижение предложения/увеличение спроса Увеличение предложения/снижение спроса
0,7
-0,4
-0,4
-0,8
-0,1
+0,2+0,2 0,35
0,75
+0,4
+0,3
-0,2 +0,3
+0,40,1
0,4
+1,2
-0,1 +0,1+0,2
-0,5
+0,2
-0,0 +0,2 +0,3-0,1
-2.0
-1.6
-1.2
-0.8
-0.4
0.0
0.4
0.8
1.2
1.6
2.0
ОПЕК Не ОПЕК*
США ОПЕК Не ОПЕК*
США ОПЕК Не ОПЕК*
США ОПЕК Не ОПЕК*
США
4Q2018
Спрос Предложение 1Q2019
Спрос Предложение 2Q2019
Спрос Предложение 3Q2019
Спрос Предложение 4Q2019
Доп. ростспроса
Changes in global liquid fuels market balance
Decrease in supply /Increase in demand Increase in supply/Decrease in demand
* Not including USSource: IEF estimates bases on EIA, МЭА, ОПЕК data
3
D D D D
Notes:
D - Demand
OPEC OPEC OPEC OPECUS US US USNonOPEC
NonOPEC
NonOPEC
NonOPEC
Supply Supply Supply Supply
Mbd
R1-GROMOVEleventh Japan–Russia Energy and Environment Dialogue in Niigata
©ERINA

4
Russiaʼs Role in the OPEC+ Agreement
Russia’s share in the collective oil production cuts planned in 2017 within OPEC+ Agreement (tbd)
Level of Russian compliance with initial OPEC+ Agreement production cut target, 2017-18
Source: IHS Markit
1Q 2017 – 1Q 2018
• Russia played central role bringing aboutOPEC and non-OPEC output reduction dealsof December 2016
• Russia pledged to gradually lower output by300,000 b/d during first half of 2017compared with October 2016 level (largestnon-OPEC reduction)
• Russia with Saudi Arabia now apparently co-determining OPEC+ policy
OPEC+ Agreement Update (June 2018)
• Russia and Saudi Arabia ensured theimplementation of ‘Vienna Alliance’ members’decision to increase the collective oilproduction of 1MMbd in coming months
• Russia exceeds October 2016 baseline forproduction cuts for first time in October 2018,setting new oil output record of 11,6 MMb/d(activating most spare capacity built upduring period of output cuts)
OPEC+ Agreement Update (December 2018)
• Russia played central role to reach new Updatefor OPEC+ Agreement (restart of collective oiloutput cuts of 1,2 MMb/d from January 2019)
5
Oil Industry1
Gas Industry2
Global oil market context
Russian oil production and export trends up to 2023
EU Gas market trends
Russian gas production and export trends up to 2023
R1-GROMOVEleventh Japan–Russia Energy and Environment Dialogue in Niigata
©ERINA

Russian oil production back to growth in 2018
Russia’ crude oil production, 1989-2018 Russian oil production cuts withinOPEC+Agreement led to oil production decreasein 2017 up to 546,2 MMt (-0,3% y-o-y), for the firsttime in last 10 years
But Russian oil production back to growth in 2018and ensured new annual oil output record of 556MMt (11,35 MMb/d) due to the activation of mostspare capacity built up during period of output cuts
After 10 years of decline the Western Siberia’ oiloutput back to growth in 2018 due to increase oilproduction in Yamalo-Nenets AO
Greenfield expansion have supported the raise of oiloutput in the Eastern Siberia (Suzun and Vankor) andon Caspian onshore (Filanovsky’ field)
Russia’ crude oil production by key oil&gas regions, 2014-17
0
100
200
300
400
500
600
1989
1990
1991
1992
1993
1994
1995
1996
1997
1998
1999
2000
2001
2002
2003
2004
2005
2006
2007
2008
2009
2010
2011
2012
2013
2014
2015
2016
2017
2018
MMt CRUDE OIL LEASE CONDENSATE
Sources: Rosstat, Russian Ministry of Energy, FIEF 6
32,2% 31,3%
18,6% 18,4%
11,4% 10,5%
0
50
100
150
200
250
300
350
2014 2017 2014 2017 2014 2017 2014 2017Western Siberia Ural-Volga Eastern Siberia and
Far EastTiman-Pechora
MMtlower 1 MMt 1-2 MMt
2-5 MMt more 5 MMt
7
Gazprom Neft is the main driver of oil productionʼ increase
Oil output by Russian Oil&Gas Majors, 2008-17
Sources: Rosstat, companies’ data, FIEF estimations
Gazprom Neft is the main driver of Russian oilproduction’ increase (+9 MMt in 2015-17)
Rosneft continue to develop Vankor oil cluster: oiloutput at the Suzun field raised by 4 times up to 4,14 MMt,at the Tagul field – by 9 times up to 0,34 MMt
Sakhalin PSAs had increased oil output in 2017 as well asindependent Russian producers including JV with Japaneseinvestors (INPEX, ITOCHU, JOGMEC)
Nevertheless, oil production by Rosneft, LUKOIL andSurgutneftegas decreased during this period due toOPEC+ cuts and oil output decline at the WesternSiberia
In 2017-18 OPEX by Russian majors have stabilized atthe level of 3-4$/bbl
Russian majors have kept their costs at such a low level dueto pressure on contractors who are forced to reduce priceseven in the face of rising world oil prices and volumes ofwork performed
OPEX/bbl in upstream by Russian Oil&Gas Majors, 2014-18
113 115 116 118 121204 202 200 222 221
90 92 90 85 84 85 86 86 83 82
62 60 60 61 61 61 61 62 62 6146 47 49 49 50 49 51 54 58 60
48 51 57 62 65 61 65 69 77 76
0
100
200
300
400
500
600
2008 2009 2010 2011 2012 2013 2014 2015 2016 2017
Others Gazprom Tatneft
Gazprom Neft Surgutneftegaz LUKOIL
Bashneft TNK-BP Rosneft
MMt
3.2
4.2
3.7
4.3
2
4
6
8
2014 2015 2016 2017 2018
Rosneft LUKOIL
Gazprom Neft Tatneft$/bbl
R1-GROMOVEleventh Japan–Russia Energy and Environment Dialogue in Niigata
©ERINA

8
Idling of wells was the main instrument to achieve 2017 OPEC+ production cuts
Change in Russian idle well count by company, October 2016-September 2018
Deactivation of (most likely marginal) wells waskey method for achieving production cuts in 2017
Russia’s idle well count jumped by over 5,000between October 2016 and January 2018
Idle well rate rose from 12,5% in October2016 to 15,2% in January 2018
Sharp drop in idle well count in 2018 coincidedwith main period of Russian oil productiongrowth in 2018
Russia’s idle well count has fallen over 3,000since January 2018
Idle well rate down to 13,2% in September2018
Tatneft and Rosneft have registered biggestreductions in idle well numbers in 2018, indicatingnew brownfield investment focus by thiscompanies
Sources: IHS Markit, FIEF
New field development activity up significantly in 2017 despite cuts
9
Oil production at new felds inRussia,2016-18Indexes for new oil field activity in Russia, 2016-18
Development drilling at new fields in Russia, 2016-18 New well completions at new fields in Russia, 2016-18
Sources: TEK Rossii
R1-GROMOVEleventh Japan–Russia Energy and Environment Dialogue in Niigata
©ERINA

10
Tax Reform ʻBig Maneuvreʼ is neutral for Russian upstream
Sources: Finance Ministry, IHS Markit
Starting from 2019 the export duty on oil will bemultiplied by a reduction factor
Starting from 2023, the export duty will be reset
Lower oil export duty will lead to higherdomestic oil prices (net back), and alignmentof domestic oil prices and world prices (lesslogistics costs)
To compensate budget losses due to the reductionof export duties on oil, a new component isintroduced into the MET (DM coefficient)- KMAN,which actually repeats the formula for calculatingthe export duty on oil
As a result, the overall tax burden on oilproduction will not change
Tax reform for mature oil fields: The Samotlor tax break
Russia’s current oil sector tax system, based on grossrevenues of production, particularly burdensome formature field producers
Samotlor oil field has obtained (2017) major tax reliefpackage in exchange of Rosneft promise to investmore heavily in this field redevelopment
• Finance Ministry agreed to annual METreduction for Samotlor oil field of 35 trillionrubles (around $0,6 billion) and set to last for10 years
Finance Minsitry of Russia promised to revisitquestion of comparable tax breaks for othermature fields in three years, after evaluatingimpact of Samotlor experiment on federal budget
Samotlor oil production and decline rate
Rosneft committed to drill about 2,400 new wells andproduce an incremental 50 MMt (365 MMbbd) at Samotlorfield during next 10 years
11
CAPEX in Upstream: from stagnation in 2016 to acceleration in 2017
CAPEX in upstream by Russian Oil&Gas Majors,2010-17
Sources: Rosstat, companies’ data, FIEF estimations
In 2017, investments in oil production increased by13% y-o-y, reaching 1.9 trillion rubles
Rosneft became the leader in the dynamics of capitalinvestments (+29% y-o-y)
LUKOIL significantly increased investments (+11%y-o-y)
Other majors reduced investments in oil production
The key areas of Rosneft's investments were themaintenance of production at the old fields of WesternSiberia and the development of the Vankor cluster
In 2017, LUKOIL continued to increase investments inold fields of Western Siberia (116.4 billion rubles, +28.4%y-o-y) and the Caspian sea shelf (55.9 billion rubles, +35% y-o-y)
Some (-9% y-o-y) decline in investment in GazpromNeft's production projects was due to the completion ofthe Novoportovskoye field infrastructure
CAPEX/bbl in upstream by Russian Oil&Gas Majors, 2014-18
188 240 276 330 350 456608
786119149
220 265328
292284
315
132178
239228
208
146166 173
187206
209
199
160 271
325
377 300
355
0
500
1,000
1,500
2,000
2010 2011 2012 2013 2014 2015 2016 2017
billions rubles
Others Tatneft Surgutneftegas Gazprom Neft
LUKOIL Bashneft TNK-BP Rosneft
7.5
7.1
7.4
3.3
2
4
6
8
10
12
14
2014 2015 2016 2017 2018
Rosneft LUKOIL
Gazprom Neft Tatneft
$/bbl
R1-GROMOVEleventh Japan–Russia Energy and Environment Dialogue in Niigata
©ERINA

12
CAPEX trends up to 2023: growth will continue
CAPEX in upstream (facts and forecast), 2013-23 In 2019-23, investments in oil production will grow by 39%
(+14% in real terms) due to the implementation of large-scale programs for the development of productioncapacities of Gazprom Neft and Rosneft
Rosneft plans to increase oil and gas condensate productionto 250 MMt by 2025 (+29 MMt by 2017) by introducing newfields in Eastern Siberia and increasing production at oldfields in Western Siberia (Samotlor)
In 2018, Gazprom Neft announced the postponement toachieve oil production of 100 MMt from 2020 to 2021-22(mainly due to the OPEC+ cuts), while production in Russiawill total 75-80 MMt. The main production gains will beensured by new projects in the Yamalo-Nenets AO (Taz,North Samburgskoe)
Capex/bbl for Russian majors remains significantlylower than that of the largest international oilcompanies, as in the portfolio of Russian majors' projectsare still dominated by traditional oil fields (Western Siberia,Eastern Siberia) with relatively low exploitation costs
Average CAPEX/bbl in upstream by companies, 2015-17
3.45.1
6.37.4
8.29.0
14.415.115.515.6
16.419.019.3
25.726.8
0 5 10 15 20 25 30
TatneftRosneft
Russia (2015-2017)LUKOIL
Russia (2023)Gazprom Neft
SinopecExxonMobilPetroChina
ENIPetrobras
StatoilBP
ChevronTotal
$/bbl
Sources: Rosstat, companies’ data, FIEF estimations
990
1,14
6
1,32
8
1,39
2
1,56
2
1,70
8
1,80
0
1,89
5
2,07
6
2,21
6
2,33
7
223283
329 291338
381406
433481
522559
0
500
1,000
1,500
2,000
2,500
3,000
2013
2014
2015
2016
2017
2018
*
2019
2020
2021
2022
2023
billion rubles Oil related services Upstream
13
Russian oil production outlook up to 2023
Crude oil production by Rosneft, MMt
Crude oil production by LUKOIL, MMt
Crude oil production by Gazprom Neft, MMt
Russian crude oil production (facts and forecast), 2013-23
6075
0
20
40
60
80
2017 2022
млн т
82 86
0
20
40
60
80
100
2017 2022
млн т
221 250
0
50
100
150
200
250
2017 2022
млн т
Sources: Rosstat, companies’ data, FIEF estimations
522 526 535 548 546 556 561 566 569 571 573
0
100
200
300
400
500
600
2013 2014 2015 2016 2017 2018 2019 2020 2021 2022 2023
MMt
R1-GROMOVEleventh Japan–Russia Energy and Environment Dialogue in Niigata
©ERINA
14
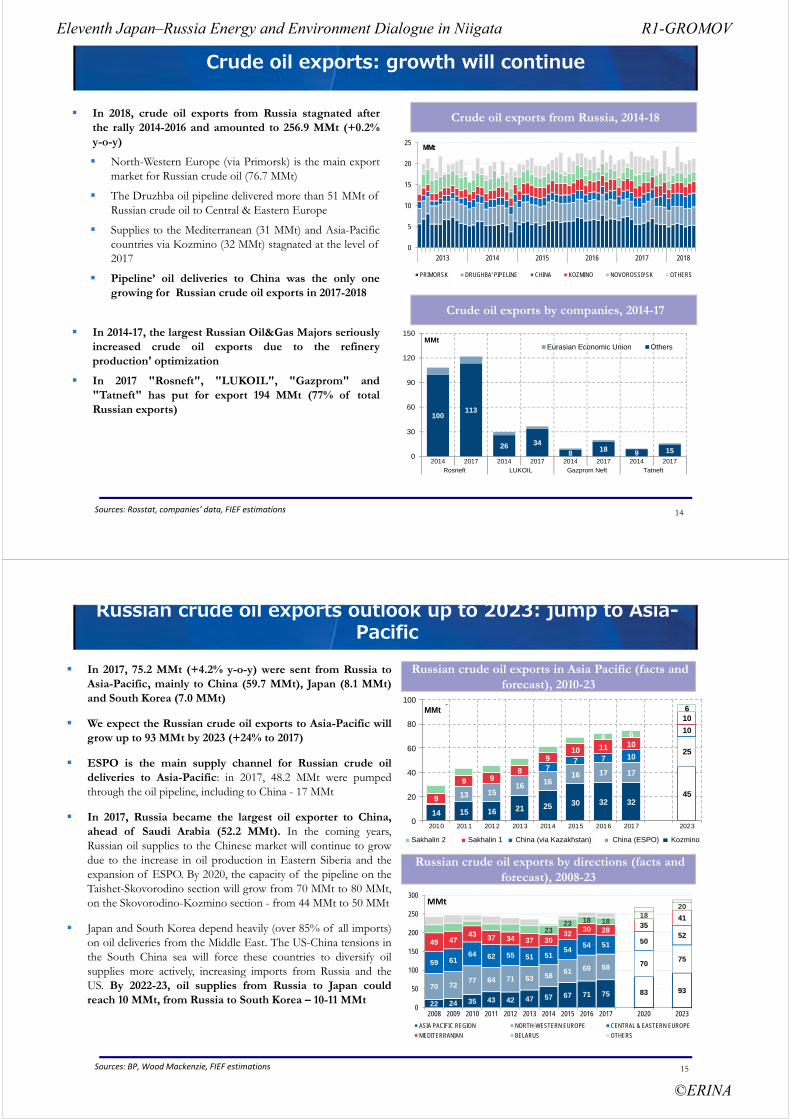
Crude oil exports: growth will continue
Crude oil exports from Russia, 2014-18 In 2018, crude oil exports from Russia stagnated afterthe rally 2014-2016 and amounted to 256.9 MMt (+0.2%y-o-y)
North-Western Europe (via Primorsk) is the main exportmarket for Russian crude oil (76.7 MMt)
The Druzhba oil pipeline delivered more than 51 MMt ofRussian crude oil to Central & Eastern Europe
Supplies to the Mediterranean (31 MMt) and Asia-Pacificcountries via Kozmino (32 MMt) stagnated at the level of2017
Pipeline’ oil deliveries to Сhina was the only onegrowing for Russian crude oil exports in 2017-2018
In 2014-17, the largest Russian Oil&Gas Majors seriouslyincreased crude oil exports due to the refineryproduction' optimization
In 2017 "Rosneft", "LUKOIL", "Gazprom" and"Tatneft" has put for export 194 MMt (77% of totalRussian exports)
Crude oil exports by companies, 2014-17
0
5
10
15
20
25
2013 2014 2015 2016 2017 2018
MMt
PRIMORSK DRUGHBA' PIPELINE CHINA KOZMINO NOVOROSSIYSK OTHERS
100113
26 34
8 18 9 150
30
60
90
120
150
2014 2017 2014 2017 2014 2017 2014 2017Rosneft LUKOIL Gazprom Neft Tatneft
MMtEurasian Economic Union Others
Sources: Rosstat, companies’ data, FIEF estimations
15
Russian crude oil exports outlook up to 2023: jump to Asia-Pacific
Russian crude oil exports in Asia Pacific (facts and forecast), 2010-23
In 2017, 75.2 MMt (+4.2% y-o-y) were sent from Russia toAsia-Pacific, mainly to China (59.7 MMt), Japan (8.1 MMt)and South Korea (7.0 MMt)
We expect the Russian crude oil exports to Asia-Pacific willgrow up to 93 MMt by 2023 (+24% to 2017)
ESPO is the main supply channel for Russian crude oildeliveries to Asia-Pacific: in 2017, 48.2 MMt were pumpedthrough the oil pipeline, including to China - 17 MMt
In 2017, Russia became the largest oil exporter to China,ahead of Saudi Arabia (52.2 MMt). In the coming years,Russian oil supplies to the Chinese market will continue to growdue to the increase in oil production in Eastern Siberia and theexpansion of ESPO. By 2020, the capacity of the pipeline on theTaishet-Skovorodino section will grow from 70 MMt to 80 MMt,on the Skovorodino-Kozmino section - from 44 MMt to 50 MMt
Japan and South Korea depend heavily (over 85% of all imports)on oil deliveries from the Middle East. The US-China tensions inthe South China sea will force these countries to diversify oilsupplies more actively, increasing imports from Russia and theUS. By 2022-23, oil supplies from Russia to Japan couldreach 10 MMt, from Russia to South Korea – 10-11 MMt
Russian crude oil exports by directions (facts and forecast), 2008-23
Sources: ВР, Wood Mackenzie, FIEF estimations
14 15 16 21 25 30 32 324513 15
16 1616 17 17
25
77 7 10
10
9
9 98
910 11 10
10
6 6
6
0
20
40
60
80
100
2010 2011 2012 2013 2014 2015 2016 2017 2023
млн т
Пригородное Де-Кастри Китай (через Казахстан) Китай (ВСТО) Козьмино
22 24 35 43 42 47 57 67 71 75 83 9370 7277 64 71 63 58
61 69 68 707559 61
64 62 55 51 5154
54 51 5052
49 4743 37 34 37 30
3230 28
3541
2323 18 18
1820
0
50
100
150
200
250
300
2008 2009 2010 2011 2012 2013 2014 2015 2016 2017 2020 2023
MMt
ASIA PACIFIC REGION NORTH-WESTERN EUROPE CENTRAL & EASTERN EUROPE
MEDITERRANIAN BELARUS OTHERS
Sakhalin 2 Sakhalin 1 China (via Kazakhstan) China (ESPO) Kozmino
MMt
R1-GROMOVEleventh Japan–Russia Energy and Environment Dialogue in Niigata
©ERINA

16
Russian petroleum products output and exports outlook up to 2023
Russian petroleum products output (facts and forexcast), 2015-23
In 2018, Russian refinery industry shifts to growth afterthree years of decline
In 2018, the primary oil refining increased to 286.9 MMt(+2.5% y-o-y)
The return to growth was facilitated by the recovery ofworld oil prices (as a result, the oil refining marginincreased)
In 2019-20, the primary oil refining will stabilize at thelevel of 290-293 MMt, but since 2020, it will again beginto fall
The main causes are high competition with refineries fromthe Middle East and oversupply of petroleum products inthe domestic market
In 2019-20, the exports of petroleum products willstabilize at the level of 150 MMt, but since 2021, theexports of petroleum products will decline following thefall of refinery production
We expect the most significant decrease in the supply offuel oil up to 36 MMt to 2023, while the exports of dieseland gasoline will grow slightly
Russian petroleum products exports (facts and forecast), 2015-23
Sources: Rosstat, FIEF estimations
39 39 38 [ЗНАЧЕНИЕ] 41 42 43 44 45
76 76 77 77 80 82 84 86 88
72 57 51 47 44 39 36 33 30
100 113 118 124 128 129 126 122 117
0
100
200
300
2015 2016 2017 2018 2019 2020 2021 2022 2023
MMt Others Fuel Oil Gasoil/Diesel Gasoline
51 49 51 54 56 57 57 58 59
8972 63 56 52 48 44 40 36
27
3130 36 38 37 35 33 28
0
50
100
150
200
2015 2016 2017 2018 2019 2020 2021 2022 2023
MMtOthers Fuel Oil Gasoil/Diesel Gasoline
17
Oil Industry1
Gas Industry2
Global market trends
Russian oil production and export trends up to 2023
EU Gas market trends
Russian gas production and export trends up to 2023
R1-GROMOVEleventh Japan–Russia Energy and Environment Dialogue in Niigata
©ERINA

18
EU gas demand outlook: the recovery will continue up to 2023
According to preliminary estimates, in 2018, the growthof gas demand in the EU continued and amounted to 494bcm (+0.6% y-o-y)
In the next 5 years, power sector will remain the maindriver of gas demand in the EU
In the longer term, the gas demand in the Europeantransport sector also will slightly increase
However, in the long term the total EU gas demand willnot increase significantly due to the continued raise ofrenewable energy use, as well as energy efficiencyimprovements
In June 2018, the EU approved legally binding targets forthe development of RES up to 2035
The main goal is to achieve the share of RES in the EUfinal energy consumption at the level of 32% by 2030
According to the European Commission, in 2016 the shareof RES in the EU final energy consumption was 17.04%
This decision may have a negative impact on the long-termprospects of gas demand in the EU
EU gas demand (facts and forecast), 2007-30
EU power industry gas demand (facts and forecast), 2010-23
Source: European Commission
542491 494 492
217
0
100
200
300
400
500
600
2010
2011
2012
2013
2014
2015
2016
2017
2018
*
2030П
Bcm
ENTSO-G (ST scenario) WEO NPS BP Energy Outlook 2018
186171
145129 121 123
147 156 151 152 164 159 161 165
0
50
100
150
200
2010
2011
2012
2013
2014
2015
2016
2017
2018
*
2019
2020
2021
2022
2023
Bcm
19
Oil Industry1
Gas Industry2
Global market trends
Russian oil production and export trends up to 2023
EU Gas market trends
Russian gas production and export trends up to 2023
R1-GROMOVEleventh Japan–Russia Energy and Environment Dialogue in Niigata
©ERINA

20
Gazprom is the leader in Russian gas production growth in 2018
In 2018, Russian gas production reached a new all-timerecord of more than 725.2 Bcm (+34 Bcm or +4.9% y-o-y)
The main increase in production was provided by Gazprom(+30 Bcm or +6,5% y-o-y)
Independent gas producers and oil companies maintained thegas production at 2017’ level
In 2018, according to our estimates, domestic gas demand(including the needs of the gas transportation system and gasinjection into UGS) increased by 4.0% y-o-y
In 2018, Gazprom's gas supplies to the domestic marketalso increased significantly, mainly due to a reduction in gassupplies from independent gas producers
After the launch of Yamal LNG project, NOVATEKreoriented the significant part of gas deliveries from thedomestic market to LNG exports
Rosneft faced difficulties in increasing production and wasforced to conclude an agreement with Gazprom for thepurchase of gas of 5 Bcm
We expect that Russian domestic gas demand will remainstable in the range of 470-480 Bcm in the forecast perspective
Russian gas production by months, 2016-18
Russian gas production by companies, 2012-18
40
45
50
55
60
65
70
Janu
ary
Febr
uary
Mar
ch
April
May
June July
Augu
st
Sept
embe
r
Oct
ober
Nov
embe
r
Dec
embe
r
Bcm 2018 2017 2016
Historical range 2011-2017
Sources: TEK Rossii, companies’ data, FIEF estimations
482 476 432 406 406 441 470
655 669 641 636 641 691725
0
150
300
450
600
750
2012
2013
2014
2015
2016
2017
2018
Bcm
Oil companies (total) GazpromNOVATEK Other producers (incl. JVs)PSA (Sakhalin 1 & Sakhalin 2)
21
Russian gas production outlook up to 2023
In 2019-2023, Russian gas production will grow slightlyfaster than predicted before and will reach the range744-755 Bcm by 2023 (+2,6-4,1% to 2018)
In the coming years, Gazprom's production in the WesternSiberia will be supported by launching the spare capacity ofNadym-Pur-Taz fields, especially Zapolyarnoye andUrengoy fields
NOVATEK plans to develop Utrennee field which will bethe resource base for the Arctic-2 LNG Project on GydanPeninsula
Rosneft gas production is likely to be stable in 2018, while Rospan full expansion planned for 2019
After 2021-2022, the main increase in gas productionwill be ensured by Eastern Siberia and the Far Eastmainly due to the commissioning of theChayandinskoye and Kovykta fields, as well asincreasing the production of APG in the oil fields
Gazprom’ current spare capacity (~100 Bcm) willfacilitate required production growth in the near tomedium term up to 2023
Russian gas production (facts & forecast), 2008-23
Russian gas production outlook by regions, 2015-23
Sources: Ministry of Economic Development of the Russian Federation, Gazprom, companies’ data, FIEF estimations
725
755
744
600
625
650
675
700
725
750
775
2012
2013
2014
2015
2016
2017
2018
2019
2020
2021
2022
2023
Bcm
FIEF forecast Ministry forecast (2017)
608 615 666 685 687 678 664 656 648
48 64 76 89 107
0
200
400
600
800
2015 2016 2017 2018 2019 2020 2021 2022 2023
Bcm
Western Siberia & European part of Russia Eastern Siberia & Far East
R1-GROMOVEleventh Japan–Russia Energy and Environment Dialogue in Niigata
©ERINA

22
Russian gas exports : facts & forecast
In 2018 Russian gas export increased up to 260 Bcm(+7,7% y-o-y)
Gazprom set a new record with pipeline exports to Europereaching more than 200 Bcm (+5,6% y-o-y)
LNG exports (26 Bcm) are expanding fast (+62,1% y-o-y)following the launch of two trains on Yamal LNG
Exports to former Soviet republics (CIS) stable, with noofficial supply to Ukraine (although deliveries continue toseparatist areas in east)
Pipeline exports to Europe have been rising since 2014setting records for three consecutive years,emphasizing Russia’s critical supply role with theadvantage of incumbency in contractual relations, low-cost gas and flexibility of supply
Offshore section of Turk Stream is finished, Nord Stream 2 isbeing constructed; but transit through Ukraine will still berequired, therefore solution for new transit arrangements mustbe found before end of 2019
In 2019-2021, we expect stabilization of exports volumesof Russian pipeline gas at the current level but after 2021the pipeline gas exports will grow again due to thecommissioning of Power of Siberia project oriented toChina
Russian gas exports, 2012-18
Russian gas exports by pipeline to Europe (non-CIS)
145167 154 159 179 192 201
6053
41 3429
30 321515
14 1515
1626
0255075
100125150175200225250275
2012 2013 2014 2015 2016 2017 2018
Bcm
Europe & Turkey by pipeline Former soviet republics & Baltic states LNG
Sources: Gazprom, IHS Markit, FIEF estimations
23
Russian gas shift to the East: both pipeline and LNG projects are progressing
Russia is pushing several options for gas exports to Asia-Pacific markets: total potential almost 200 Bcm/y(95 Bcm/y by pipe to China and South Korea and over 100 Bcm/y of LNG exports) by 2035
Gazprom’s Power of Siberia project (38 Bcm/y) is being built on budget and on time and expected to begin deliveries in late 2019, in line with agreement. Ramp-up period will depend on Chinese market
Active negotiation is ongoing about expansion of Power of Siberia and other routes including Power of Siberia 2 (Altay pipeline, 30 Bcm/y) and additional eastern route for Sakhalin gas from Dalnerechensk (6-8 Bcm/y)
Gazprom and KOGAS have revived negotiations on a new export gas pipeline. Russian gas could become the most competitive source of gas, depending on what pipeline route is selected; the most efficient one involves transit through North Korean territory
Yamal LNG has launched all three large-scale trains ahead of schedule
FID for Arctic LNG-2 expected in 2019
Russia perceives a significant opportunity in global LNG market: it has a potential to develop 100 MMtpa by 2030,capturing half of global incremental demand.
Long-term success of Russian LNG projects in Arctic targeting Asia-Pacific markets largely depends on commercial navigation of Northern Sea Route
R1-GROMOVEleventh Japan–Russia Energy and Environment Dialogue in Niigata
©ERINA