russian federation dairy and products annual improved ... gain publications/dairy and... · on...
TRANSCRIPT
THIS REPORT CONTAINS ASSESSMENTS OF COMMODITY AND TRADE ISSUES MADE BY
USDA STAFF AND NOT NECESSARILY STATEMENTS OF OFFICIAL U.S. GOVERNMENT
POLICY
Date:
GAIN Report Number:
Approved By:
Prepared By:
Report Highlights:
For the first time in at least a decade, milk production became more profitable on average than poultry
or grain production in Russia. Global high prices for milkfat, the stronger ruble, and reduced cost of
capital allowed local producers to improve margins, and encouraged greater production of dairy
products. However, soft demand at the consumer level persists. The resulting high stocks of butter,
Whole Milk Powder (WMP), and Skimmed Milk Powder (SMP) will likely limit further production
growth in 2018 until continuing economic improvement for consumers rebalances demand with supply
later in the year. Market consolidation and greater efficiency at commercial dairies increase with
investor interest in the sector, but imports remain high for now.
FAS Staff
Rachel Vanderberg
Improved Supply Awaits Recovery of Consumption
Dairy and Products Annual
Russian Federation
RS1758
12/20/2017
Required Report - public distribution

Executive Summary:
Because milk farms depended on state subsidies rather than consumer demand and did not generate
profits for decades, Russia’s milk production sector remains far less modernized and consolidated
compared to pork, poultry, sugar, and grains. The key weakness of Russia’s milk production sector is
its inefficiency, but the high cost of capital has long constrained development; over time these factors
resulted in high milk production costs in Russia compared to the countries that export processed dairy to
Russia. As a result, the markets for raw milk and processed dairy products remain strongly dependent
on the price of imports. World prices for milkfat and proteins continue to influence Russia’s market in
spite of the counter sanctions. The share of imported processed dairy from Belarus and other non-
restricted suppliers remains high because the total capacity of all Russia’s milk farms remains below the
country’s demand.
For the first time in at least a decade in Russia, milk production was more profitable than poultry or
grain production in January-September 2017. Global high prices for milkfat made milk and dairy
produced in Russia price competitive to imports. Milk remains dependent on imports so further growth
of industrial milk production is possible and could come at the expense of imports. However, world
market experts anticipate some decline of world butter prices in 2018, which would affect forecasts.
Per cow yields at commercial farms continues growing. The share of industrially processed milk is
increasing at the expense of shrinking on farm consumption of fluid milk. The top 50 biggest farms,
which currently account for 4.8 percent of total milk production, will continue to grow and increase
their share in the market. Good financial performance in the sector in 2017 may stimulate investors’
interest and market consolidation activities in the sector in 2018.
Responding to improved profitability due to high world prices, producers increased the output of butter
and milk powders January-September 2017, but the market is struggling to absorb the expensive dairy.
Processing plants accumulated high stocks of butter and milk powders by the end of Russia’s “high
milk season” in September 2017. Butter and milk powder stocks are anticipated to remain high in the
beginning of 2018, which will soften demand from processing plants. If consumer purchasing power
improves as anticipated in the macroeconomic forecasts, the milk market in Russia will stabilize in the
second half of 2018, when recovered consumption will balance with available supply from local plants
and imports. The recovery will not quite make up for the high butter and powder stocks in the first half
of 2018, and so Post forecasts a small annual decline in production of fluid milk, butter, and SMP. The
production of WMP is anticipated to increase at the expense of imports, the production of cheese is
forecasted to increase one percent because of anticipated recovery of demand for semi-hard and
specialty cheeses.
Macroeconomic indicators: Most of Russia’s key economic indicators improved in 2017 (CPI, key
rate, GDP), but the average purchasing power of Russian consumers continues to decline. Key Rate:
8.25 percent (1.75 percent decline year-on-year); Consumer Price Index: 3 percent (1.6 percent decline
year-on-year); inflation has slowed down, below the 4 percent target set by the government. Further
reduction of the key rate by the Central Bank of Russia is possible before the end of 2017. The average

nominal exchange rate of ruble to US dollar in October 2017 was 58.31 rubles per US Dollar (68.22
ruble per US dollar in October, 2016). According to Rosstat, the Accumulated Retail Sales for nine
months of 2017 increased 0.5 percent year-on-year; the Monthly Retail Sales grew 3.1 percent year-on
year in September 2017. However, the Accumulated Food Retail Sales in the third quarter of 2017
declined 0.5 percent. Accumulated Real Disposable Income in January-August 2017 continued to
decline - 1.2 percent year-on-year. The Ministry of Economic Development of the Russian Federation
(MED) reported monthly GDP growth of 2.4 percent in September 2017. In its most recent base case
scenario forecast MED anticipates annual GDP growth of 2.1 percent in 2017 and 2018.
Trade restrictions: On June 30, 2017, President Putin signed decree No. 293 extending Russia’s ban on
the import of agricultural products (including milk and dairy HS codes 0401, 0402, 0403, 0404, 0405,
and 0406, except for specialized lactose-free milk and dairy products for therapeutic dietary nutrition)
from the countries that applied economic sanctions against Russia. Please refer to GAIN report RS1741
for detailed information. These counter-sanctions will continue to influence dairy trade with a number
of countries, including United States.
Methodology change: In January 2017, Rosstat transitioned to a new national product classification
system, OKPD 2 (All-Russian Classification of Products by Economic Activities), which is harmonized
with the statistical classification of products in the European Community 2008 CPA. The transition
resulted in a discrepancy in historic statistical data series, including the monthly production and price
data for processed dairy products, in particular for cheese, and WMP. PSD production estimates are
based on the availability of the official statistical data. Annual production change 2017 to 2016 in
Supply and Distribution tables may be attributed to the transition to the new product classification. For
detailed information please refer to Table 6 “Correspondence Table PSD Dairy Product – OKPD 2007
–OKPD2” in this report.
NOTE: USDA unofficial data excludes Crimean production and exports. However, as of June 2014, the
Russian Federal State Statistics Service (Rosstat) began incorporating Crimean production and trade
data into their official estimates. Where possible, data reported by FAS/Moscow is exclusive of
information attributable to Crimea
Fluid Cow Milk (HS Code 0401)
Tab1e 1. Russia: Fluid Milk Supply and Distribution, 1,000 MT
Dairy, Milk, Fluid 2016 2017 2018
Market Begin Year Jan 2016 Jan 2017 Jan 2018
Russia USDA
Official
New
Post
USDA
Official
New
Post
USDA
Official
New
Post
Cows In Milk 7,550 7,235 7,320 7,000 0 6,800
Cows Milk
Production
30,470 30,510 30,700 30,600 0 30,550
Other Milk
Production
0 0 0 0 0 0
Total Production 30,470 30,510 30,700 30,600 0 30,550
Other Imports 326 326 300 295 0 270

Total Imports 326 326 300 295 0 270
Total Supply 30,796 30,836 31,000 30,895 0 30,820
Other Exports 48 48 50 38 0 38
Total Exports 48 48 50 38 0 38
Fluid Use Dom.
Consum.
9,150 8,960 8,900 8,600 0 8,300
Factory Use
Consum.
19,550 19,655 20,100 20,290 0 20,610
Feed Use Dom.
Consum.
2,048 2,173 1,950 1,967 0 1,872
Total Dom.
Consumption
30,748 30,788 30,950 30,857 0 30,782
Total Distribution 30,796 30,836 31,000 30,895 0 30,820
(1000 HEAD) ,(1000 MT)
NOTE: Not Official USDA data;
Official USDA data is available at http://apps.fas.usda.gov/psdonline/
Cows in Milk Inventories
FAS/Moscow forecasts a 2.8 percent decline of cows-in-milk inventories to 6.8 million head in the
beginning of 2018 from 7.0 million head (the revised January 2017estimate).1 Two separate pressures
contribute to dairy herds declining. According to Rosstat, as of October 1, 2017, cow inventories at
commercial farms decreased in 61 percent in the Russian regions year-on-year; meanwhile, 60 percent
of the regions increased milk production at commercial farms. The 25 biggest milk producing regions
have decreased commercial milking herds by 18.9 thousand head since October 1, 2016, but produced
262,000 MT more milk in nine months of 2017 than in the same period of 2016. Industrialized
commercial farms reduced their milking herds as they improved livestock genetics and collected more
milk from fewer cows. Commercial dairies have a potential for further increase of productivity
considering that the average annual per cow yield in the commercial sector remains below 5.5 MT per
cow. On the other side, non-commercial farms are gradually disappearing as fewer people live in rural
areas2. Unlike the commercial sector, backyard farms do not improve productivity, and the average
yield stays around 3.5 MT per cow per year. Both long term trends will persist in 2018, and influence
the decline of the total milking herd numbers.
On October 1, 2017, Rosstat reported 3.664 million head of cows at backyard farms, or 86 thousand
head fewer than on the same date in 2016. Agricultural organizations maintained cow inventories at
3.341 million head, a slight 0.2 percent decline by 8 thousand head from the previous year. Because
Rosstat combines beef and dairy cattle in its reporting but shows that the number of cows increased in
the regions developing beef cattle farming and declined in the major milk producing regions, Post
1 Rosstat “cows” number includes all forage cows, beef and dairy. Milking cows herd numbers in 2016 and 2017 have been
revised based on 2016 final data on and average milk yield: 2,418 MT per cow. For details on beef cattle inventories please
refer to Gain Report “Annual Livestock and Products 2017” 2 Rosstat: Official Statistics, Population, Demography, “Permanent Population Estimate as of January 1, 2017” : Rural
population decreased by 57,000 people in 2016; while urban population grew by 187,465. Over the recent decade, rural
population in Russia declined from 38.4 million to 37.7 million people.

concludes that dairy herds continue to decline. The largest growth of cow inventories was reported in
four regions where beef industry leaders implement their beef cattle projects. Simultaneously, the
biggest annual decline of commercial cow herds as of October 1, 2017, was in the largest milk
producing region – the Republic of Bashkortostan by 11.84 thousand head to 134.8 thousand head. Cow
numbers also decreased in the following milk producing regions: Orenburg oblast by 5.61 thousand
head, Penzenskaya oblast by 3.47 thousand head to 30.1 thousand head, Krasnodarskiy Krai by 3.46
thousand head to 131.1 thousand, Chelyabinskaya Oblast by 3.35 thousand head to 38.8 thousand head,
Republic of Tatarstan by 3.29 thousand head to 212.2 thousand.
On small backyard farms, cow numbers increased by 43.4 thousand head, 3 percent growth by the end of
the third quarter in 2017 and reached 1.212 million head. The trend is anticipated to continue because
authorities encourage backyard farms to register as legal, commercial entities, moving those farms into
the “small peasant farm” category. In addition, authorities implement policies that encourage pork
farmers to switch to dairy and beef cattle operations to control the spread of African Swine Fever (ASF)
in the country. Every region has its own program of ASF prevention and control, but standard practice
is to offer pork farmers a partial reimbursement of cattle purchase from the regional budget if farmers
commit to stop rearing pigs. Per Rosstat data, the biggest growth of cow inventories at small farms as of
October 1, 2017 was in Dagestan, Rostov, Altayskaya oblast, Altaiskiy Krai, Orenburg, and
Novosibirsk.

Chart. 1 Distribution of Cows Inventories by Types of Farms in Russia as of October 1st, 2017; 1,000
head
3,341
41%
1,213
15%
3,664
44%
AgriculturalOrganisatios Smallpeasantfarms Backyardfarms
Source: Rosstat
Leading commercial farms benefit from replacing the local dual purpose breeds with highly productive
modern dairy cattle. However, the existing national regulation system of breeding operations is
structurally inherited from the soviet times, and constrains the development of the industry. Poor
management of data from breeding records at national level and lack of investment in breeding farms
have resulted in constant shortage of quality replacement heifers corresponding to health and
productivity requirements of a modern farm.
The market for breeding dairy cattle is still developing and remains non-transparent in terms of tracking
and defining the fair market price for breeding cattle of local origin. Industry contacts confirm that there
is a strong demand for replacement dairy heifers, and the domestic prices for local cattle of questionable
quality are often comparable to prices for imported heifers. Leading milk producers continue importing
pedigree dairy cattle with genetic value confirmed by trustworthy certification and records.
Imports of dairy heifers are expected to continue in 2018 at levels comparable to 2017 because of
growing demand for quality cattle for leading commercial farms. In January-July 2017, Russia imported
31,093 head of cattle, with a total value of 62.2 million US dollars. On average, Russian importers paid
2,000 US dollars per head. Exporters from the European Union accounted for 94 percent of this trade in
absolute numbers and 98 percent in dollar terms. The Netherlands supplied 14,362 head of breeding
dairy heifers, Germany 8,692 head, Denmark 3,233 head, and Hungary 2,002 head. Russia also
imported cattle from Finland, Estonia, Austria, Ireland, Slovakia, and Belarus. All the above listed

exporters, except Belarus, increased shipments; imports from the EU grew 172 percent in absolute
numbers, and 143 percent in value.
Agricultural authorities recognize the need to enhance the genetics of the country’s milking herd and the
weakness of the existing pedigree certification system. The Ministry of Agriculture cooperates with
milk producers’ associations to develop new rules of breeding operations, including the modernization
of the system of breeding cattle certification and genetic evaluation.
The recently extended counter-sanctions trade restrictions on agricultural products from major western
suppliers do not restrict live cattle or genetic material. Additionally, in June 2016 President Putin signed
the Amendments to the Tax Code to exempt from VAT the payments for the purebred breeding
agricultural animals. The Amendments reduce the VAT rate from 10 to 0 percent until December 31,
2020. The zero VAT rate shall be applied to payments for domestic and imported purebred breeding
cattle, embryos, and semen of purebred breeding bulls.3 For imports, the exemption shall be granted
upon the submission of the documents to Customs in accordance with the Federal law 123 FZ –
08.03.1995 On Livestock Breeding.
According to industry experts the epizootic outlook remains challenging in terms of the following
economically significant cattle diseases4: Lumpy Skin Disease (LSD), Bovine Leucosis Virus (BLV)
5,
and Bovine Brucellosis. The risk of Foot and Mouth Disease (FMD) and Anthrax remains high due to
the unfavorable epizootic situation in neighboring geographic areas. The most recent FMD outbreak
was confirmed in October 2017 in Bashkortostan – the region with the second largest cattle population
in Russia. For the most recent update on the disease notifications and outbreak reports please refer to the
official web site of the Russian Federal Service for Veterinary and Phytosanitary Surveillance (VPSS)
and OIE.
Fluid Milk Production
The total production of fluid milk by all types of farms in 2018 is forecasted at 30.550 MMT, a 0.2
percent annual decline. Commercial dairies are expected to increase milk production in 2018, while
backyard farms continue to decrease the output. High stocks of butter and milk powders accumulated
by the end of the third quarter in 2017 will likely impact milk prices.
Compared to other macroeconomic indicators, the average Russian consumer’s purchasing power lags
behind, and the general trend has impacted the dairy market: Nielsen dairy market research6 shows
retail sales of 14 out of 16 audited dairy categories declined 4.7 percent in absolute numbers in January-
September 2017 due to average 9 percent growth of prices. As a result, stocks of butter and milk
powders accumulated, and dairy processing plants may reduce purchases of raw milk in the beginning of
3 The VAT exemption is also applicable to purebred breeding animals and genetic material of other agricultural animals
including poultry (hatching eggs), swine, sheep, goats, and horses. 4 Source in Russian: ''Agroinvestor'' Magazine #2 (9009) February, 2017 Article ''Livestock farming under threat’’
5 Per Technical Regulations of the Eurasian Economic Union (TRTS 021/2011) products of animal origin must originate
from the farms with “no leucosis cases registered at the farm during the last 12 months”; and products obtained from BLV
seropositive cattle should not enter the market. However, according to “Federal center for Animal Health (FGBI
“ARRIAH”) more than 30 percent of commercial cattle in Russia is BLV positive. 6 Source: http://www.nielsen.com/ru/ru/insights/news/2017/retail-audit-dairy-october-2017.html Note: Includes products not
reported in PSD.

2018. Such soft demand on raw milk from processors may discourage commercial farms from further
acceleration of production.
Backyards have been reducing productivity by 2.5-3 percent each year over the last decade; however,
the total supply has stabilized at the level of 30.5-30.6 MMT due to improvements in per cow yields by
commercial farms. Cows in backyard farms average 3.5 MT yield. Compare this to the average yield in
the commercial sector, which was 5.448 MT per cow in 20167, and even further to 9.204 MT per cow at
top ten farms from the RDRC (Russian Dairy Research Center) rating8. According to Rosstat, the
commercial dairies increased per cow yields by 5.2 percent during three quarters in 2017, and the
positive trend will continue in the long-term.
Despite the achievements of the leading companies, the overall level of industrialization and
consolidation remains low in milk production sector, compared to other agricultural sectors. According
to RDRC, the top 50 milk producing companies sold 1.48 million MT of milk in 2016, and accounted
for 4.8 percent of total milk production. Improved financial performance in 2017 may increase
investors’ interest in the milk production sector because commercial farms benefit from the decreased
cost of capital, a strong ruble, and comparatively high prices on raw milk. Better access to finances,
modern farm management practices, and stable sales to major dairy processors are the key advantages of
the top 50 milk producers compared to smaller farms. After launches of new mega-farm projects and
possible mergers, the largest milk-producing companies most likely will continue to increase market
share.
Chart 2. Growth of farm gate prices on cow milk in rubles compared to growth in US dollars in 2017 to
2016, comparable months, %.
16.10%
16.43%
13.99%
13.84%
15.08%
13.64%
13.78%
10.61%
11.21%
13.85%
49.37%
53.97%
41.02%
37.14%
32.17%
28.36%
22.66%
26.76%
24.53%
35.11%
0.00% 10.00% 20.00% 30.00% 40.00% 50.00% 60.00%
Jan17/Jan16
Feb17/Feb16
Mar17/Mar16
Apr17/Apr16
May17/May16
June17/Jun16
Jul17/Jul16
Aug17/Aug16
Sep17/Sep16
AverageYTDJan-Sep
USdollars Rub
Data Sources: Rosstat, CBR **(CPI index in Jan-Sep, 2017 3 percent)
7 Source: Rosstat
8 Top-50 Milk Producing Farms in Russia – 2016. Source: Russian Dairy Research Center

According to the Ministry of Agriculture, average operational margins (EBIT) in agriculture increased to
16.4 percent in 2016 from 7.3 percent in 2013, and continued to grow in the first quarter of 2017 to 16.9
percent. The National Union of Milk Producers “Souzmoloko” confirms that operational margins of
leading milk producing farms increased to 20-25 percent in 2016 from “zero” in 2013. Profitability
rating published by milknews.ru, (the informational resource associated with “Souzmoloko”) margins of
30 top companies varied from 5.3 to 53 percent in 20169.
Wholesale prices for raw milk in rubles in 2017 were on average 13.85 percent higher than on the same
months last year. If calculated in US dollars, the prices were 35.11 percent higher, due to ruble
appreciation. High world prices on milkfat were the main reason for growth of commodity prices on
raw milk in Russia.
Chart 3. Average farm-gate prices for fluid raw milk in Russia (1,000 ruble per MT compared to US
dollar per MT)
Sep'15,19.8 Jan'16,21.9 Sep'16,21.2 Jan'17,25.4 Sep''17,23.6
Sep'15,295.9 Jan'16,287.3 Sep'16,328.4 Jan'17,424.2 Sep''17,408.9
150
200
250
300
350
400
450
500
550
600
650
10
12
14
16
18
20
22
24
26
28
Jan'14
Feb'14
Mar'14
Apr'14
May'14
Jun'14
Jul'14
Aug'14
Sep'14
Oct'14
Nov'14
Dec'14
Jan'15
Feb'15
Mar'15
APR'15
May'15
June'15
July'15
Aug'15
Sep'15
Oct'15
Nov'15
Dec'15
Jan'16
Feb'16
Mar'16
Apr'16
May'16
Jun'16
July'16
Aug'16
Sep'16
Oct'16
Nov'16
Dec'16
Jan'17
Feb'17
Mar'17
Apr'17
May'17
Jun'17
Jul'17
Aug'17
Sep''17
USdollarperMT
1,000RubperMT
Priceinrubles PriceinUSdollars
Source: Rosstat; Central Bank of Russia
9 Top-30 Milk Farms by Net Profits. Source: www.milknews.ru

Chart 4. Monthly Fluid Milk Production in 2013 – Aug 2017 (1,000 MT; All producers)
19532023
2424
2608
2967
3278 3244
3054
2702
1000
1500
2000
2500
3000
3500
4000
Jan Feb Mar Apr May Jun Jul Aug Sep Oct Nov Dec
1,000M
T
2013 2014 2015 2016 2017
Source: Rosstat
Fluid Milk Consumption (Processing)
FAS/Moscow forecasts 0.2 percent decline of total milk consumption in 2018 to 30.782 MT, which is
attributed to declining consumption of fluid milk on backyard farms. Opposite long term trends are
anticipated to continue: factory use consumption will grow 1.6 percent to 20.61 MMT, while
consumption of fluid milk at backyard farms will decline 3.5 percent to 8.30 MMT. Because household
farms are excluded from the industrial supply chain, FAS/Moscow estimates that only 66.5 percent of
milk produced by all farms in 2017 will be processed industrially. Commercial dairies are anticipated to
increase production, which will result in more milk available for processors.
The dairy processing sector is more consolidated compared to milk production. According to expert
estimates, major milk processing plants are located in the ten Russian regions10
where approximately 45
percent of all industrially produced milk is processed.
“Agricultural organizations” (Rosstat terminology) produced 11.5 million MT of milk in January-
September 2017. Approximately 55 percent of this milk was used to produce fluid milk in consumer
packages and traditional fluid dairy products based on fermented milk. This product group is classified
in Russia under the “whole milk dairy products excluding tvorog” category, and includes “kefir”,
“ryazhenka”, “prostokvasha”, “smetana”, “yogurt”, and other traditional dairy. Traditional dairy
products are a “super fresh” retail category with temperature requirement below 6oC and shelve life
10
1. Krasnodar region; 2. Moscow and Moscow Region ; 3. Altayskii Krai :4. The Republic of Tatarstan 5. The Republic of
Bashkortostan; 6. St. Peterburg and Leningrad region, 7. Udmurt Republic, 8. Voronezh region, 9. Sverdlovsk region (0.656 10.
Belgorod region. For detailed information please refer to Top 50 Milk Processing Plants Source Center of Dairy Market Research
http://www.dairynews.ru/
between 3 and 30 days depending on the type of product. Post PSDs include these products in its
“Factory use consumption” number.
Milk Trade
In 2018 imports of fluid milk are anticipated at 270,000 MT, an 8.5 percent annual decline, following a
9.5 percent decline to 295,000 MT in 2017. Supply from local commercial farms is growing at the
expense of imports.
Belarus accounted for 92.3 percent of fluid milk imports to Russia in January-July 2017, and will likely
remain the only major exporter of fluid milk to Russia in 2018. Over 98 percent of Belarusian exports
of fluid milk are shipped to Russia, exporters will likely continue offering favorable prices, but the
volume of the exports of fluid milk from Belarus is anticipated to continue to decline. Russian
commercial dairies have enough capacity to maintain sufficient supplies of raw milk to dairy processing
plants, while Belarusian exporters will more likely increase shipments of value added processed dairy
products rather than raw milk.
FAS/Moscow projects 2018 milk exports from Russia at 38,000 MT, unchanged from the estimate of
exports in 2017. Exports account for approximately 0.1 percent of Russia’s milk production, and no
growth of this trade is expected in the near future due to high producer prices on raw milk inside Russia.
Policy
Amendments to State Agricultural Program
The government of Russia significantly amended the State Program for the Development of Agriculture
and Regulation of Agricultural Commodities Markets in 2013-2020, in which the GOR defined new
priorities for agricultural development. For detailed information, please refer to RS1736 Agricultural
State Program 2013-2020 Amended in 2017. The new edition of the program is designed to support the
financial system of the agro-industrial complex and give provinces more flexibility in using federal
funds according to the needs of the particular region. An important addition to the program is a new
subprogram to support development of Russian agricultural exports. The changes could have a negative
impact on mid-size and small dairy farms, in particular in the regions where milk production is not a
priority for the regional authorities. The new state agricultural policy will likely accelerate the
consolidation of milk production within the largest companies and, in the long term, will result in the
concentration of milk production in a few geographic clusters.
Per liter subsidies
The major concern of milk producers is the uncertainty with the traditional “per one liter” subsidies in
the budget for 2018. “Subsidies for increase of dairy cattle productivity” remained the only dairy sector
specific program in 2017, and replaced the “subsidies per one kg. of milk sold for processing”. The
federal government allocated 7,964 million rubles specifically for dairy sector under this program in
2017. The amended program continued to subsidize each kg. of milk sold for processing in 2017, but
the rules for the farms to qualify for the subsidies have been changed. The importance of this subsidy
decreased for leading farms because of the improved profitability of milk business in 2017. However,
the “per one liter subsidies” are very important for less efficient farms. As of the date of the report it is
unclear if the program will continue next year. The draft budget law did not allocate any funds for the
program, but 4.5 billion rubles may be added to the budget for the program after the second hearing of
the draft law in the State Duma. It’s also not clear if the new program of “Encouragement of Investment
in Agriculture”, which included CAPEX reimbursement for pre-selected projects will continue in 2018,
as there are no funds allocated for the program in draft budget in 2018.
Interventions
Commodity price volatility for raw milk resulting from major seasonal fluctuations in milk production
remains one of the key problems of the industry, which has to manage the increased supply of raw milk
during summer months, when demand for dairy products traditionally declines. The Ministry of
Agriculture issued an order defining the minimum prices at 222,000 Rub per MT of SMP; 293,000 Rub
per MT of WMP; and 340,000 Rub per MT of dairy butter. The order also defined a commodity price of
24,000 Rub per MT of raw milk for the purposes of interventions contracts. The ministry selected 11
regions11
for milk interventions according to the following criteria: total milk production in the region
was more than 300,000 MT in 2015; milk powders production was more than 1,000 MT in 2016; and the
average commodity price for raw fluid milk in July 2015 and 2016 was at least 15 percent lower than the
February price in the region. The government did not implement the interventions in 2017 because
prices were higher than declared minimums, but the instrument can be used in the future if milk prices
fall.
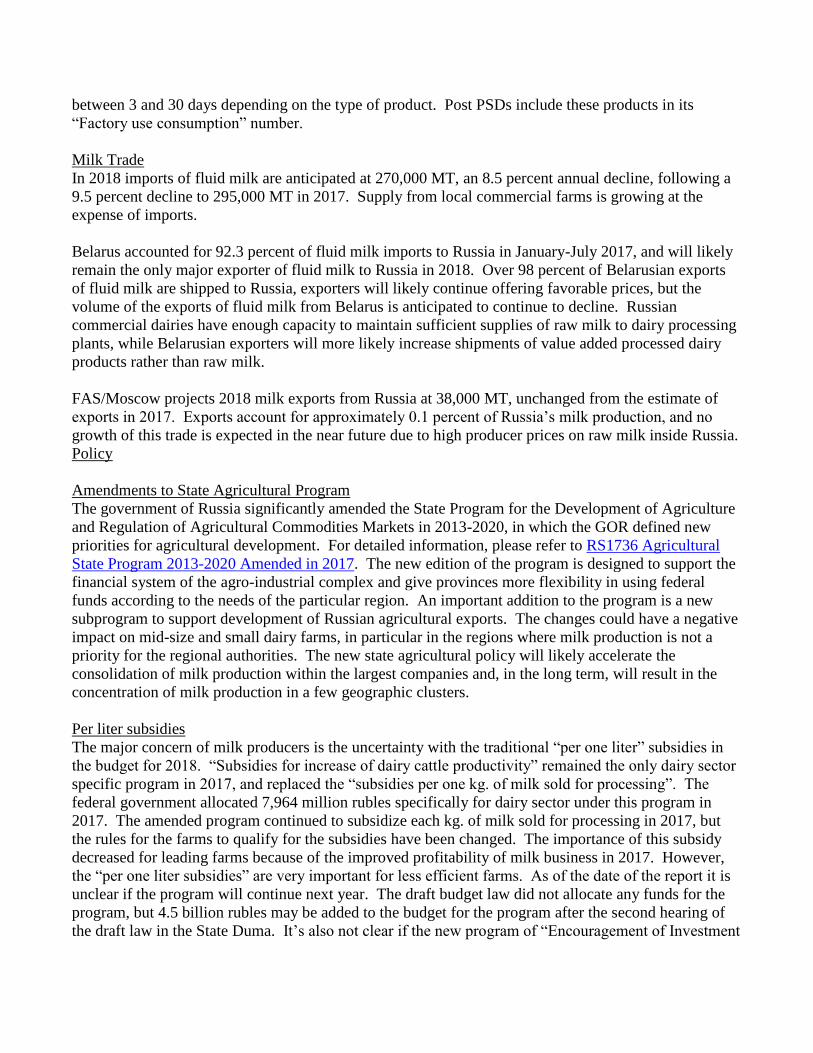
Cheese and Curd (HS Code 0406)
Table 2. Russia: Cheese and Curd Supply and Distribution, 1,000 MT
Dairy, Cheese 2016 2017 2018
Market Begin Year Jan 2016 Jan 2017 Jan 2018
Russia USDA
Official
New
Post
USDA
Official
New
Post
USDA
Official
New
Post
Beginning Stocks 35 35 29 29 0 24
Production 865 865 865 925 0 935
Other Imports 230 230 235 230 0 235
Total Imports 230 230 235 230 0 235
Total Supply 1,130 1,130 1,129 1,184 0 1,194
Other Exports 25 25 25 20 0 20
Total Exports 25 25 25 20 0 20
Human Dom.
Consumption
1,076 1,076 1,079 1,140 0 1,150
Other Use, Losses 0 0 0 0 0 0
Total Dom.
Consumption
1,076 1,076 1,079 1,140 0 1,150
Total Use 1,101 1,101 1,104 1,160 0 1,170
Ending Stocks 29 29 25 24 0 24
Total Distribution 1,130 1,130 1,129 1,184 0 1,194
(1000 MT)
11
Qualifying regions: Baskortostan, Tatarstan, Chuvashia, Altaisky Krai, Orenburgskaya Oblast, Saratovskaya Oblast,
Omskaya Oblast, Novosibirskaya Oblast, Nizhny Novgorod Oblast; Kemerov Oblast and Penza Оblast.

NOTE: Not Official USDA data; Official USDA data is available at http://apps.fas.usda.gov/psdonline/
Cheese and Curd Production
NOTE: As of the date of the report, the available official Rosstat data for production and prices of
commodities “Cheese” (OKPD 2: 10.51.40.110 ) and “Tvorog” (OKPD 2 10.51.40.300) are
inconsistent with the data series in 2010-2016. The transition to the new national product classification
system OKPD2 on January 1, 2017 had a significant impact on the estimate of Cheese supply in 2017 in
PSD. The forecast of cheese production in 2017 is based on the available Rosstat monthly production
data in January-September 2017. The annual increase of production estimate by 60,000 MT in 2017
compared to 2016 must be attributed exclusively to the change of the Rosstat methodology. Please also
refer to Table 6 for more information.
Chart 5. Russian Monthly Production of Cheese & Curd (“Tvorog”) (HS Codes 040510, 040590) in
2013–Aug 2017
50
55
60
65
70
75
80
85
90
Jan Feb Mar Apr May Jun Jul Aug Sep Oct Nov Dec
1,000M
T
2013 2014 2015 2016 2017(OKPD-2)*
Source: Rosstat. In 2013-2016 based on OKPD; in 2017 based on OKPD2
FAS/Moscow forecasts 935,000 MT of cheese and curd production in 2018, one percent growth from
the revised production estimate of 2017. Current trends, such as growing supply of raw milk for
processing from commercial dairies, and increase of butter supply in 2017 are shaping a favorable
outlook for cheese in 2018. Both trends encourage increase of cheese production, as additional raw milk
will be available for cheese. Additionally, cheese makers will benefit from the anticipated economic
recovery and better consumer demand in 2018. Cheese stocks (excluding “tvorog”) were 36,242 MT in

the end of September 2017, the 5 percent above the 5-year average, that indicates that current cheese
supply is better balanced with demand compared to the butter market. Average producer prices for hard
cheese increased 8 percent from 376,348 rubles per MT in January 2017 to 408,272 rubles per MT in
September; meanwhile butter prices declined two percent during the same period. In the beginning of
2018 milk processors will likely increase production of cheese and decrease production of butter.
Chart 6. Producer Prices for Cheese in Russia (HS Code 0406) in 2013–Sep 2017
Data Source: Rosstat
Cheese and “Tvorog” Consumption
Post forecasts minor increase of total cheese consumption to 1.15 million MT attributed to the
anticipated recovery of consumer purchasing power in 2018 and increased demand for semi-hard and
specialty cheeses.
PSD category “Cheese” covers two different Russian markets: “Cheese” with 52 percent in
consumption, and “Tvorog”, 48 percent in consumption. “Tvorog” is a very popular traditional
fermented milk product, similar to cottage cheese or quark, with a shelf-life from three to thirty days
depending on type. Prices for “Tvorog” are on average two times less than prices for other cheeses.
Consumption of tvorog has been more stable than cheese since 2014. Local products quickly replaced
the imports after the disruption of trade due to embargo in 2014. The consumption of the low-priced
traditional dairy product remained stable during the crisis years of 2015-2016. Post is not expecting any
significant changes in consumption patterns of tvorog.
Chart 7. Production of Cheese and Curd (“Tvorog”) in 2017 in Russia

40.82 40.42 42.41 41.23 43.16 40.54 39.28 38.54
13.55 13.75 14.12 14.75 16.3615.44 15.63 15.35
30.73 31.9637.83 38.19
42.1341.65 41.67 41.32
0
20
40
60
80
100
120
Jan-17 Feb-17 Mar-17 Apr-17 May-17 Jun-17 Jul-17 Aug-17
THOUSANDM
T
Tvorog10.51.40.300 Cheeseproducts10.51.40.200* Cheese10.51.40.110
Data Source: Rosstat
Cheese and Curd Trade (HS Code 0406)
FAS/Moscow forecasts 235,000 MT of cheese and curd imports in 2018, which is a 2.2 percent increase
from the 230,000 MT of HS 0406 imports anticipated in 2017. The stronger ruble, quality of imported
products, and comparatively high prices for raw milk in Russia are the factors that supported trade with
non-banned cheese exporters at the relatively stable level in 2017. The expected 5,000 MT decline in
imports in 2017 corresponds with the increased supply from domestic industry. The recovery of imports
in 2018 is attributed to the expected improvement of the macroeconomic situation and consequently,
some growth of demand for premium cheeses.
Although the tonnage of cheese imports declined by 10,454 MT in January-July 2017 compared to the
same months in 2016, the total dollar value of the imports increased by 104 million US dollars, 25
percent growth year-on-year. The spike in value correlates with the increased average cheese prices in
the global market in 2017, ruble appreciation, and the changing assortment of the imports. Shipments of
cheap cheese decline, while imports of premium cheese are growing from non-banned European
suppliers. Belarus remains the biggest supplier, but its share in imports declined from 87 percent in
2017 to 83 percent by the end of July 2017. Meanwhile, the shipments of expensive premium cheeses
from Switzerland increased 60 percent year-to-date to 1,210 MT. Serbia, recently the second largest
supplier, shipped 5,176 MT of cheese during seven months of 2017; 7.68 percent more than in the same
period of 2016.
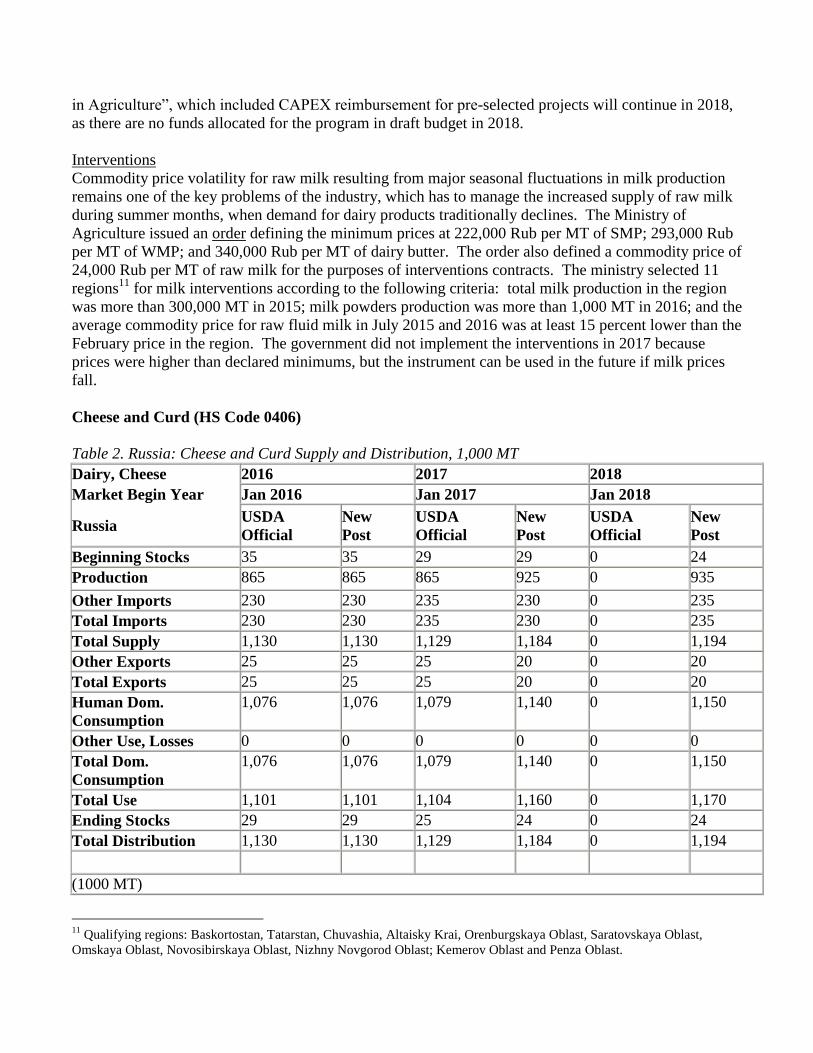
Chart 8. Russian Imports of Cheese and Curd (HS Code 0406) Annual Series: 2013 - 2016 & Year to
Date: 07/2016 & 07/2017 Quantity (MT); Major Suppliers
466
349
221 230
133 123
0
50
100
150
200
250
300
350
400
450
500
2013 2014 2015 2016 YTDJan-Jul2016 YTDJan-Jul2017
1,000MT
Belarus Argentina Serbia Armenia Ukraine Uruguay Switzerland
Chile Kazakhstan Kyrgyzstan Moldova EU-28 Others Source: Federal Customs Service of Russia; Belstat
The food embargo hit the supply of cheese harder than any other dairy category. Disrupted supplies of
cheese from the EU resulted in a spike in cheese prices and empty shelves in September-October of
2014. The Russian industry has gained sufficient capacity to fill the shelves in the economy product
category after three years of counter-sanctions trade restrictions. Local products started replacing
Belarusian imports; however, Russian products in the premium group can’t compete with quality
European cheeses. Consumer purchasing power is anticipated to recover, consequently the demand for
quality cheese will encourage imports in 2018.

Butter and Anhydrous Milkfat (HS Codes 040510, 040590)
Table 3. Russia: Butter and Anhydrous Milkfat Supply and Distribution, 1,000 MT
Butter
Dairy, Butter 2016 2017 2018
Market Begin Year Jan 2016 Jan 2017 Jan 2018
Russia USDA
Official
New
Post
USDA
Official
New
Post
USDA
Official
New
Post
Beginning Stocks 16 16 11 11 0 20
Production 246 246 250 262 0 260
Other Imports 100 103 115 115 0 115
Total Imports 100 103 115 115 0 115
Total Supply 362 365 376 388 0 395
Other Exports 4 4 3 3 0 3
Total Exports 4 4 3 3 0 3
Domestic
Consumption
347 350 363 365 0 377
Total Use 351 354 366 368 0 380
Ending Stocks 11 11 10 20 0 15
Total Distribution 362 365 376 388 0 395
(1000 MT)
NOTE: Not Official USDA data; Official USDA data is available at http://apps.fas.usda.gov/psdonline/
Butter and Anhydrous Milkfat Production
FAS/Moscow increased its 2017 butter production forecast by 12,000 MT to 262,000 MT, which is 6.5
percent annual growth, but anticipates a minor decline in production in 2018 to 260,000 MT. Russia
currently produces approximately 72 percent of the milkfat it consumes, and world prices for milkfat
continue influencing the market despite the trade restrictions. Producer margins in Russia strongly
depend on the prices of imports: expensive imports push the wholesale butter prices up, and
consequently, producer’s margins increase. Good margins encouraged producers to increase output in
2017, but now butter supply has grown to a level that the current market is struggling to absorb.
Rosstat reported 205,000 MT butter production in January-September 2017, a 7.1 percent growth year-
to-date. The market was favorable for butter producers since the last quarter of 2016, when prices for
milk fat -- and therefore the margins from butter sales -- increased after a spike in world prices. Russia’s
butter stocks were abnormally low, 14.4 thousand MT, by the end of the country’s high-milk season in
September 2016 due to weak demand and low wholesale butter prices in the first half of the year. The
production increase at the end of the year did not offset the weak start of the season, and total production
declined 5.3 in 2016 percent year-on-year. The current market outlook is opposite to the previous year.
Butter stocks were 25.7 thousand MT in September 2017, a record high at 35 percent more than the 5-
year average. Average producer prices for butter grew far above the inflation level (year-on-year),
during the three quarters of 2017, but declined month-on-month in September 2017. A decline in the

price of butter in the end of the “high milk season” is unusual for Russia, and indicates that the market is
saturated. The average producer price was 310,271 Rub per MT in September 2017, which is down 2
percent from the beginning of the year. The dynamics of wholesale prices and accumulated stocks in the
third quarter of the year indicate that market is not absorbing the additional 25,000 MT of butter supply
anticipated in 2017. Production most likely will slow in the last quarter of 2017, but stocks will likely
remain high by the beginning of 2018. High stocks will press on the market and constrain production
growth in the next season.
Chart 9. Producer Prices for Butter in Russia (HS Code 040510) in 2013–Sep 2017
174,111 172,671
179,568183,266
180,051177,360
179,937185,366
196,421201,072 202,424
207,686212,389
214,846 216,123220,119
216,355 216,146 214,048 215,735 217,049
223,934 221,682 220,171
251,086254,853 254,520
249,749246,393
242,290 244,096241,618 242,342 244,435
248,984252,440
263,074 263,202 263,061 261,152257,668 256,129
262,844268,225
277,013
292,757
307,898
314,986319,519
311,467306,675
312,669307,210 308,869
311,317 311,101 310,271
150,000
170,000
190,000
210,000
230,000
250,000
270,000
290,000
310,000
330,000
Jan Feb Mar Apr May Jun Jul Aug Sep Oct Nov Dec
RUBLEPERM
T
2013 2014 2015 2016 2017
Source: Rosstat
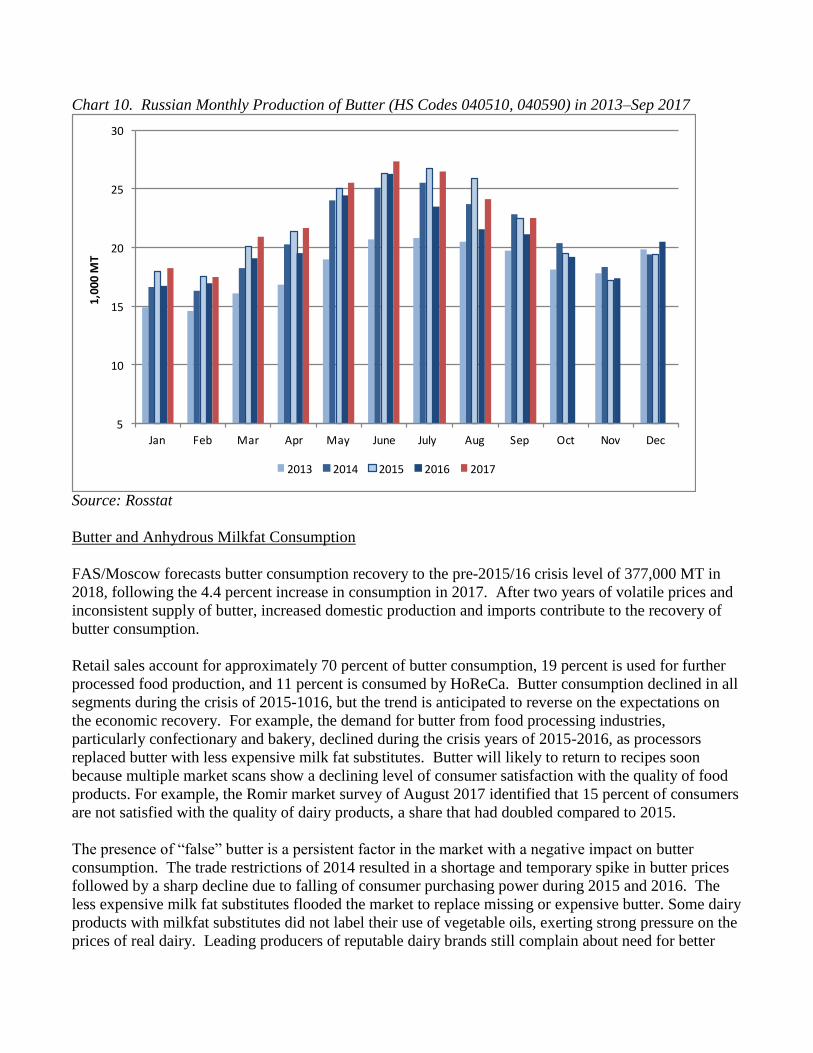
Chart 10. Russian Monthly Production of Butter (HS Codes 040510, 040590) in 2013–Sep 2017
5
10
15
20
25
30
Jan Feb Mar Apr May June July Aug Sep Oct Nov Dec
1,000M
T
2013 2014 2015 2016 2017
Source: Rosstat
Butter and Anhydrous Milkfat Consumption
FAS/Moscow forecasts butter consumption recovery to the pre-2015/16 crisis level of 377,000 MT in
2018, following the 4.4 percent increase in consumption in 2017. After two years of volatile prices and
inconsistent supply of butter, increased domestic production and imports contribute to the recovery of
butter consumption.
Retail sales account for approximately 70 percent of butter consumption, 19 percent is used for further
processed food production, and 11 percent is consumed by HoReCa. Butter consumption declined in all
segments during the crisis of 2015-1016, but the trend is anticipated to reverse on the expectations on
the economic recovery. For example, the demand for butter from food processing industries,
particularly confectionary and bakery, declined during the crisis years of 2015-2016, as processors
replaced butter with less expensive milk fat substitutes. Butter will likely to return to recipes soon
because multiple market scans show a declining level of consumer satisfaction with the quality of food
products. For example, the Romir market survey of August 2017 identified that 15 percent of consumers
are not satisfied with the quality of dairy products, a share that had doubled compared to 2015.
The presence of “false” butter is a persistent factor in the market with a negative impact on butter
consumption. The trade restrictions of 2014 resulted in a shortage and temporary spike in butter prices
followed by a sharp decline due to falling of consumer purchasing power during 2015 and 2016. The
less expensive milk fat substitutes flooded the market to replace missing or expensive butter. Some dairy
products with milkfat substitutes did not label their use of vegetable oils, exerting strong pressure on the
prices of real dairy. Leading producers of reputable dairy brands still complain about need for better

enforcement of existing labeling regulations despite the official reports of the decline in the number of
the detected falsifications. According to a recent report on the results of food quality audits in the first
half of 2017, published by the Federal Service for Surveillance on Consumer Rights Protection and
Human Wellbeing (Rospotrebnadzor), the share of falsified dairy products in the tested samples dropped
to 3.8 percent from 4.6 percent in 2016 (and from 10-11 percent in 2015). Butter remains the most
frequently falsified dairy product. Rospotrebnadzor reports that “more than half” of falsifications were
detected in dairy butter.12
Butter and Anhydrous Milkfat Trade
Note: All the below tonnages are expressed in butter equivalents.
FAS/Moscow forecasts butter and anhydrous milkfat imports at 115,000 MT, unchanged from the
imports expected in 2017. The Ruble has appreciated 14.5 percent against the US Dollar between
January and September 2017; the stronger ruble became the key factor in the 15 percent growth of butter
imports anticipated this year. Imports currently account for approximately one third of the milk fat
consumed in the country, and the share will not likely change in 2018 because domestic industry can’t
produce sufficient milkfat to satisfy the current demand. However, any growth of imports in 2018 is
also unlikely, because local production is becoming competitive with imports in terms of price.
Imports of butter and milkfat grew to 67,340 MT in January-July 2017, a 22.4 percent increase in
absolute numbers from the same months of 2016. The value of these imports increased 91 percent to
350.2 million US dollars13
. The average contract price for butter in July 2017 was 5,287 US dollars per
MT, which is on average 62 percent higher than the price in the same months of 2016. New Zealand
and Belarus account for 90 percent of Russia’s butter imports in seven months of 2017, and will remain
the dominating suppliers in the mid-term.
Belarus remains the major supplier with 65.5 percent share in butter trade. Belstat reported 43,062 MT
of butter exports to Russia in seven months of 2017, a minor 1.5 percent decline in absolute numbers
year-to-date, but 60 percent growth in value, reflecting the increased prices in the world market and
appreciated Russian ruble. The government of Belarus controls the export prices for dairy products, and
declares “the recommended export prices” in Russian rubles. Belarus Ministry of Agriculture and Food
changes the export prices for butter to reflect the changes of the Global Dairy Trade (GDT) index. For
example, Belarus changed the recommended export price for butter with 82.5 percent fat content to
350,000 ruble per MT or 6,024 US dollars per MT on September, 20 2017, that equals precisely to GDT
Average butter price as of September 19, 2017. This pricing tactics allows Belarus to maintain its share
in Russian butter market despite of currency and price volatility. HS Code 040510 “Butter” accounts for
100 percent of Belarusian milkfat shipments to its major export market.
According to Belstat, exports to Russia accounted for 89.5 percent of the total value of Belarus butter
exports year-to-date in 2017. Although Belarus is actively seeking new export markets, Russia will
remain its strategic export market due to proximity, trade preferences within the EAEU, and quality
12
Article in Russian: “Not much milk in milk. Officials say that falsification declines, but producers do not believe.”
Published in Agroinvestor Magazine N10(9917) in October 2017. http://www.agroinvestor.ru/markets/article/28691-v-
moloke-malo-moloka/ 13
Sources: Federal Customs Service of Russia, Belstat.

standards harmonized with Russia’s requirements. Post anticipates that share of butter from Belarus in
total Russian imports will remain above 60 percent in the midterm.
New Zealand is the second largest butter supplier to Russia with 25 percent share in January-July 2017.
New Zealand increased its butter shipments to Russia by 261 percent in seven months of 2017: HS Code
040510 “Butter” grew 526 percent to 10,781 MT and HS Code 040590 “Anhydrous Milkfat” increased
113 percent to 6,885 MT. As Russia’s Federal Custom Service reports, the average contract price per
metric ton of butter from New Zealand was 4,619 US dollars, approximately 15 percent less than the
average contract price of butter imports from Belarus.
Russia also imported butter from Kyrgyzstan (1,562 MT; new exporter), Argentina (1,512 MT; 15
percent growth), and Uruguay (1,475 MT; 65.5 percent decrease year-to-date).
Chart 5. Russian Imports of Dairy Butter (HS Codes 040510, 040590) Annual Series: 2013 – 2016 and
Jan-Jul 2017 Quantity (MT, Butter equivalent); Major Suppliers
143138
91
103
55
67
0
20
40
60
80
100
120
140
160
2013 2014 2015 2016 Jan-Jul2016 Jan-Jul2017
1,000MT
Belarus* NewZealand Uruguay Argentina Kyrgyzstan Brazil Kazakhstan Moldova Chile Australia EU-28 Others
Source: Federal Customs Service of Russia; Belstat
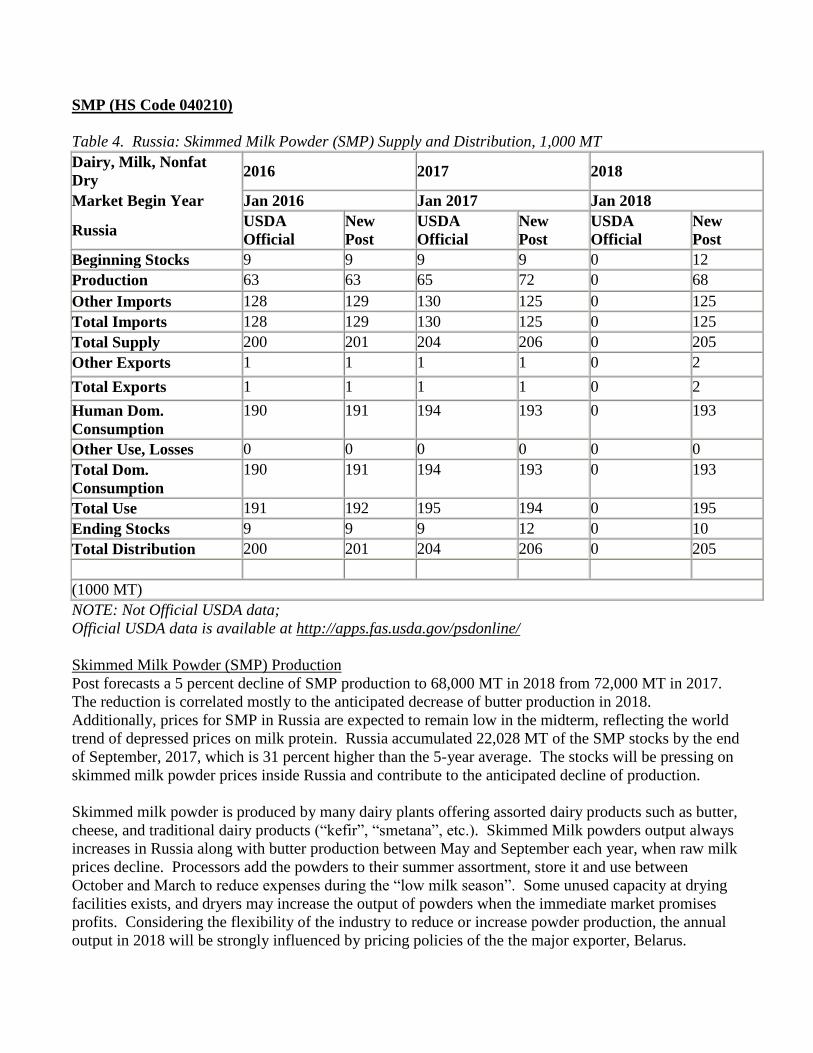
SMP (HS Code 040210)
Table 4. Russia: Skimmed Milk Powder (SMP) Supply and Distribution, 1,000 MT
Dairy, Milk, Nonfat
Dry 2016 2017 2018
Market Begin Year Jan 2016 Jan 2017 Jan 2018
Russia USDA
Official
New
Post
USDA
Official
New
Post
USDA
Official
New
Post
Beginning Stocks 9 9 9 9 0 12
Production 63 63 65 72 0 68
Other Imports 128 129 130 125 0 125
Total Imports 128 129 130 125 0 125
Total Supply 200 201 204 206 0 205
Other Exports 1 1 1 1 0 2
Total Exports 1 1 1 1 0 2
Human Dom.
Consumption
190 191 194 193 0 193
Other Use, Losses 0 0 0 0 0 0
Total Dom.
Consumption
190 191 194 193 0 193
Total Use 191 192 195 194 0 195
Ending Stocks 9 9 9 12 0 10
Total Distribution 200 201 204 206 0 205
(1000 MT)
NOTE: Not Official USDA data;
Official USDA data is available at http://apps.fas.usda.gov/psdonline/
Skimmed Milk Powder (SMP) Production
Post forecasts a 5 percent decline of SMP production to 68,000 MT in 2018 from 72,000 MT in 2017.
The reduction is correlated mostly to the anticipated decrease of butter production in 2018.
Additionally, prices for SMP in Russia are expected to remain low in the midterm, reflecting the world
trend of depressed prices on milk protein. Russia accumulated 22,028 MT of the SMP stocks by the end
of September, 2017, which is 31 percent higher than the 5-year average. The stocks will be pressing on
skimmed milk powder prices inside Russia and contribute to the anticipated decline of production.
Skimmed milk powder is produced by many dairy plants offering assorted dairy products such as butter,
cheese, and traditional dairy products (“kefir”, “smetana”, etc.). Skimmed Milk powders output always
increases in Russia along with butter production between May and September each year, when raw milk
prices decline. Processors add the powders to their summer assortment, store it and use between
October and March to reduce expenses during the “low milk season”. Some unused capacity at drying
facilities exists, and dryers may increase the output of powders when the immediate market promises
profits. Considering the flexibility of the industry to reduce or increase powder production, the annual
output in 2018 will be strongly influenced by pricing policies of the the major exporter, Belarus.

Chart 10. Russian Monthly Production of SMP (HS Code 040210) in 2013 – Aug 2017
0
2
4
6
8
10
12
14
Jan Feb Mar Apr May June July Aug Sep Oct Nov Dec
1,000M
T
2013 2014 2015 2016 2017
Source: Rosstat
14
SMP Consumption
Skimmed milk powder is used in Russia in industrial food processing as an ingredient for “Whole Milk
Dairy Products”15
. The use of SMP for traditional non fat kefirs and popular modern yogurts supports
steady demand for SMP. Post anticipates 193,000 MT SMP consumption in 2018, the same level as
expected in 2017.
SMP Trade
Anticipating the decline of SMP prices in Belarus, FAS/Moscow forecasts 125,000 SMP imports in
Russia in 2018, unchanged from the tonnage in 2017. Russia has imported on average 65 percent of its
annual SMP consumption since 201016
because of the high cost of domestic raw milk. The total share of
imports is estimated at 64.7 percent in 2017, and is anticipated to remain at the same level in the next
season. Declining world prices on SMP and high stocks of milk powders accumulated in Belarus
discourage internal SMP production in Russia, and support stable flow of imports. Russia’s SMP
exports will remain insignificant due to the comparatively high price and inconsistent quality of SMP
produced in Russia.
15
Please refer to “Fluid milk consumption” part of the report for details. 16
Source: http://apps.fas.usda.gov/psdonline/

Chart 11. Comparison of Producer prices for SMP in Russia with Recommended Export Prices in
Belarus and GTD in Jan-Sep 2017 (US dollars per MT).
1,890
1,7621,802
1,727
1,658
1,901 1,927
2,028
2,224 2,209
2,329
2,621 2,6122,574
1,948
2,0441,998
2,218
2,0241,968
1,920
1,797
2,0982,150
2,2792,344
2,391
2,4962,527 2,548
2,565 2,5872,599
2,765
3,0852,958
2,636
2,233
2,414 2,415 2,405 2,398 2,401
1300
1500
1700
1900
2100
2300
2500
2700
2900
3100
Jan Feb Mar Apr May Jun Jul Aug Sep Oct Nov Dec Jan Feb Mar Apr May Jun Jul Aug Sep Oct
2016 2017
USDollar
Russia:AverageProducersPriceforSMP GDT(USD/MTFAS) Belarus:AverageRecommendedExportPriceforSMPUSD/MT(FCA)
Data Sources: Central Bank of Russia, Rosstat, Ministry of Agriculture and Food of Belarus, GDT
Dairy powder production in Belarus is export oriented; Belarus reportedly consumed only 8,000 MT of
SMP out of 127,000 MT it produced in 2016. Average monthly SMP stocks in Belarus are
approximately 90 percent of its average monthly production. Demand for Belarusian butter remains
strong in Russia and motivates its production, consequently SMP output also grows in 2017.
Reportedly, butter production increased 6 percent year-on-year in Belarus by the end of the third quarter
in 2017; consequently, the SMP stocks ready for shipment to Russia also increased.
Belarus exported 61,937 MT of SMP to Russia in January-August 2017, a 12 percent decline in absolute
numbers and in value. If Belarus reduces SMP export prices following the global trend, it will have
downward pressure on Russian SMP production. At the same time, stable demand for SMP in Russia
promises recovery of imports from Belarus in the next season.
The share of Belarus in Russia’s SMP imports reduced from 95 percent in 2015 to 79 percent in
January-July 2017. Russia opened its market for dairy products from Turkey in 2016 and shipped 9,266
MT of SMP last year. SMP shipments from Turkey to Russia further increased by 166 percent in
January-July 2017. In January-July 2017 Russia also imported SMP from Iran (also a new supplier
since 2016), Switzerland, New Zealand, Uruguay, Argentina, Kyrgyzstan, Moldova, Serbia, and
Germany. These countries together accounted for 10 percent of SMP imports.

Dry Milk Powders: WMP (HS Codes 040221, 040229)
Table 5. Russia: Whole Milk Powder Supply and Distribution, 1,000 MT
Dairy, Dry Whole Milk
Powder 2016 2017 2018
Market Begin Year Jan 2016 Jan 2017 Jan 2018
Russia USDA
Official
New
Post
USDA
Official
New
Post
USDA
Official
New
Post
Beginning Stocks 5 5 4 4 0 10
Production 42 42 40 61 0 60
Other Imports 48 48 50 52 0 50
Total Imports 48 48 50 52 0 50
Total Supply 95 95 94 117 0 120
Other Exports 1 1 1 1 0 2
Total Exports 1 1 1 1 0 2
Human Dom.
Consumption
90 90 90 106 0 110
Other Use, Losses 0 0 0 0 0 0
Total Dom.
Consumption
90 90 90 106 0 110
Total Use 91 91 91 107 0 112
Ending Stocks 4 4 3 10 0 8
Total Distribution 95 95 94 117 0 120
(1000 MT)
NOTE: Not Official USDA data;
Official USDA data is available at http://apps.fas.usda.gov/psdonline/
Whole Milk Powder (WMP) Production
FAS/Moscow forecasts WMP production in 2018 at 60,000 MT, which will account for 54.5 percent of
the total consumption. The forecast is based on assumptions that world WMP prices stabilize after a
moderate rise, and commercial dairies increase supply of raw milk for processing in Russia. Local
industry has sufficient processing capacity, but is constrained by high prices on raw milk during the
“low milk season” between September and April. As a result local products are less price competitive
compared to imported equivalents during most of the year. The share of WMP supply from Russian
plants in total consumption varied from 47 to 87 percent over the last decade. When average world
prices for WMP were high, local products became more competitive, and production increased. When
world prices declined, local producers decreased output under pressure from the flow of lower priced
imports. Unlike SMP, which is produced at every butter production plant, there are only few companies
specializing in whole milk powder production.
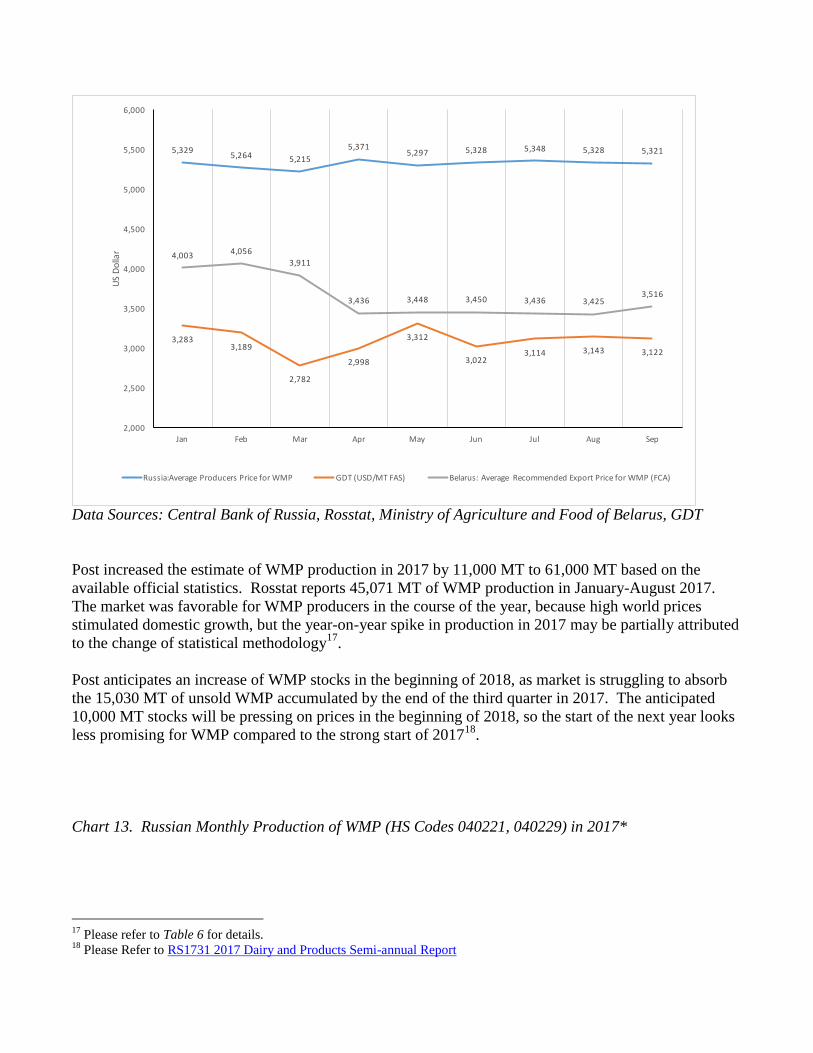
Chart 12. Comparison of Producer prices for WMP in Russia with Recommended Export Prices in
Belarus and Global Dairy Trade (GDT) in Jan-Sep 2017 (US dollars per MT).
5,3295,264 5,215
5,3715,297 5,328 5,348 5,328 5,321
3,2833,189
2,782
2,998
3,312
3,0223,114 3,143 3,122
4,003 4,056
3,911
3,436 3,448 3,450 3,436 3,4253,516
2,000
2,500
3,000
3,500
4,000
4,500
5,000
5,500
6,000
Jan Feb Mar Apr May Jun Jul Aug Sep
USDollar
Russia:AverageProducersPriceforWMP GDT(USD/MTFAS) Belarus:AverageRecommendedExportPriceforWMP(FCA)
Data Sources: Central Bank of Russia, Rosstat, Ministry of Agriculture and Food of Belarus, GDT
Post increased the estimate of WMP production in 2017 by 11,000 MT to 61,000 MT based on the
available official statistics. Rosstat reports 45,071 MT of WMP production in January-August 2017.
The market was favorable for WMP producers in the course of the year, because high world prices
stimulated domestic growth, but the year-on-year spike in production in 2017 may be partially attributed
to the change of statistical methodology17
.
Post anticipates an increase of WMP stocks in the beginning of 2018, as market is struggling to absorb
the 15,030 MT of unsold WMP accumulated by the end of the third quarter in 2017. The anticipated
10,000 MT stocks will be pressing on prices in the beginning of 2018, so the start of the next year looks
less promising for WMP compared to the strong start of 201718
.
Chart 13. Russian Monthly Production of WMP (HS Codes 040221, 040229) in 2017*
17
Please refer to Table 6 for details. 18
Please Refer to RS1731 2017 Dairy and Products Semi-annual Report

4.70 4.83 4.925.19
5.84
6.686.43 6.49
0.00
1.00
2.00
3.00
4.00
5.00
6.00
7.00
8.00
Jan Feb Mar Apr May June July Aug
1,000M
T
WholeMilkPowder(OKPD2:105122)
Source: Rosstat; Please also refer to Table 6 for information
WMP Consumption
The anticipated 2.1 percent annual economic growth may stimulate demand for WMP from its
consumers – confectionaries, bakeries, ice cream makers, producers of the processed meat products and
other processed foods. FAS/Moscow forecasts of 110,000 MT of WMP consumption in 2018.
WMP Trade
FAS/Moscow forecasts a decline of WMP imports to 50,000 MT in 2018 from 52,000 MT in 2017. The
forecast is based on the assumption that the moderate increase of world WMP prices and stable supply
of raw milk in Russia will motivate domestic industry to maintain the WMP production at 2017 level.
Considering the high WPM stocks in Russia, there will be no need in increased imports from Belarus
and other non-restricted suppliers. Despite the decline of tonnage, the total share of WMP imports is
anticipated to remain above 40 percent of consumption. Belarus remains the major supplier of WMP to
Russia, but New Zealand, Uruguay, and Argentina challenge Belarussian domination in its key export
market.
Russia imported 25,895 MT of WMP (HS Codes 040221, 040229) in January-July 2017. Belarus, New
Zealand, Uruguay and Argentina together accounted for 90 percent of this trade. Belarus shipped 11,298
MT, 36 percent decline from comparable months in 2016. In spite of this, shipments from Belarus
accounted for 43.6 percent of the total WMP imports. Russian importers significantly increased
shipments of WMP from New Zealand (to 5,617 MT from 0), and Uruguay (to 4,372 MT from 1,613).
Argentina increased shipments of WMP to Russia by seven percent to 3,891 MT.
The strong ruble and very competitive prices contributed to growth of imports from New Zealand, and
Latin America at the expense of Belarus. Belarus has lost a third of its WMP exports to Russia, but
started shipments to 18 new countries in Asia and Middle East (including China and Egypt). Thanks to
diversification of its export markets, Belarus did not accumulated much of WMP stocks, which may
strengthen the rising price trend in the midterm. Despite the reduced share in the trade, Belarus will
remain the key player in Russia’s milk powders market due to its proximity to Russia and trade
preferences within the EAEU.

Table 6. Correspondence Table PSD Dairy Product – OKPD 2007 –OKPD2
PSD
Reportable
Commodity
PSD Commodity
Definition
HTS
Code
OKPD (2010-
2016)
OKPD2(starting
01.01.2017)
Comments
Cheese A product obtained from the
coagulation of milk which has
been cultured and often aged. It is
typically produced from whole,
lowfat, skim, buttermilk, cream,
whey, and nonfat dry milk or a
combination of these products. It
includes fresh cheeses.
0406
“Cheese
and
Curd”
15.51.4 “Cheese,
cheese products
and tvorog”
minus
15.51.40.310
“Cheese products”
minus
15.51.40.130
“Dairy products
from tvorog”
10.51.40.110
“Cheese”
plus
10.51.40.300
“Tvorog”
10.51.40.110 “Cheese”
is a new product
category, reported by
Rosstat, starting on
01.01.2017.
Change in annual
production in 2017 is
attributed to the change
of product classification.
Butter A dairy product containing not
less than 78 percent of milk fat.
Includes anhydrous milk fat
(AMF).
040510;
040590
15.51.30
“Dairy Butter and
Spreads”
minus
spreads:
(15.51.30.210;
15.51.30220;
15.51.30230)
10.51.30.100
“Dairy Butter”
10.51.40.100 “Dairy
butter” is a new product
category, reported by
Rosstat, starting on
01.01.2017.
Change in annual
production in 2017 may
be attributed to the
change of product
classification.
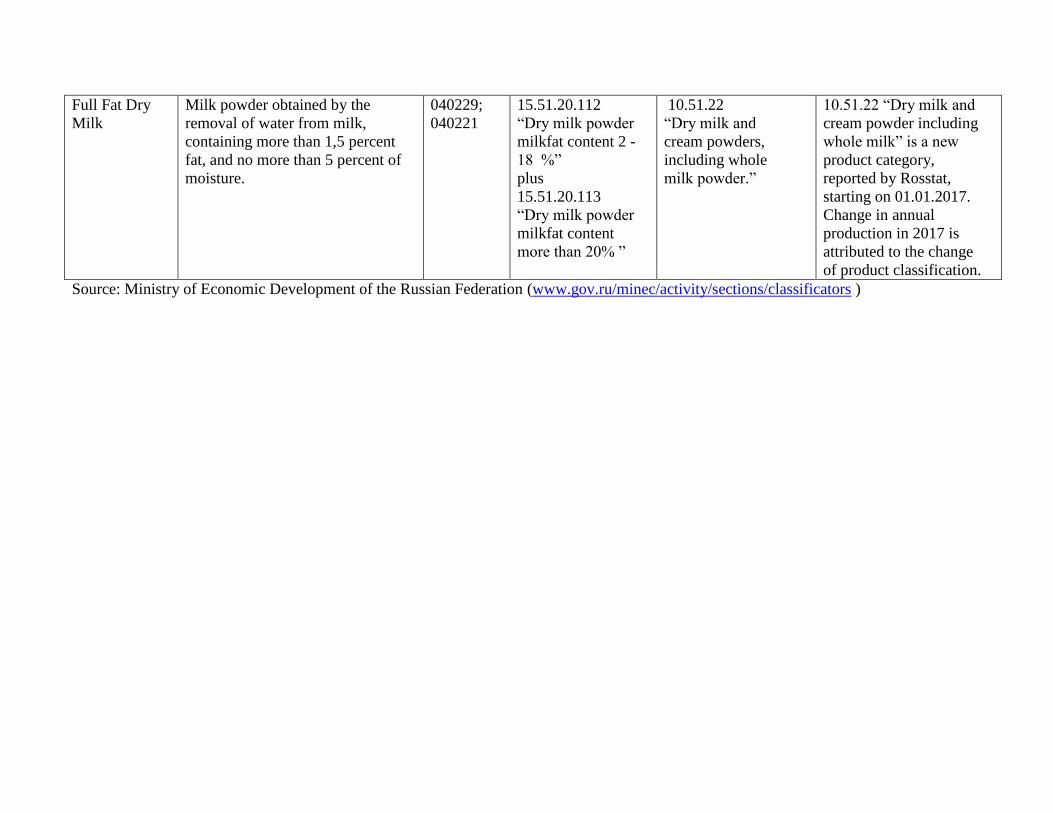
Full Fat Dry
Milk
Milk powder obtained by the
removal of water from milk,
containing more than 1,5 percent
fat, and no more than 5 percent of
moisture.
040229;
040221
15.51.20.112
“Dry milk powder
milkfat content 2 -
18 %”
plus
15.51.20.113
“Dry milk powder
milkfat content
more than 20% ”
10.51.22
“Dry milk and
cream powders,
including whole
milk powder.”
10.51.22 “Dry milk and
cream powder including
whole milk” is a new
product category,
reported by Rosstat,
starting on 01.01.2017.
Change in annual
production in 2017 is
attributed to the change
of product classification.
Source: Ministry of Economic Development of the Russian Federation (www.gov.ru/minec/activity/sections/classificators )
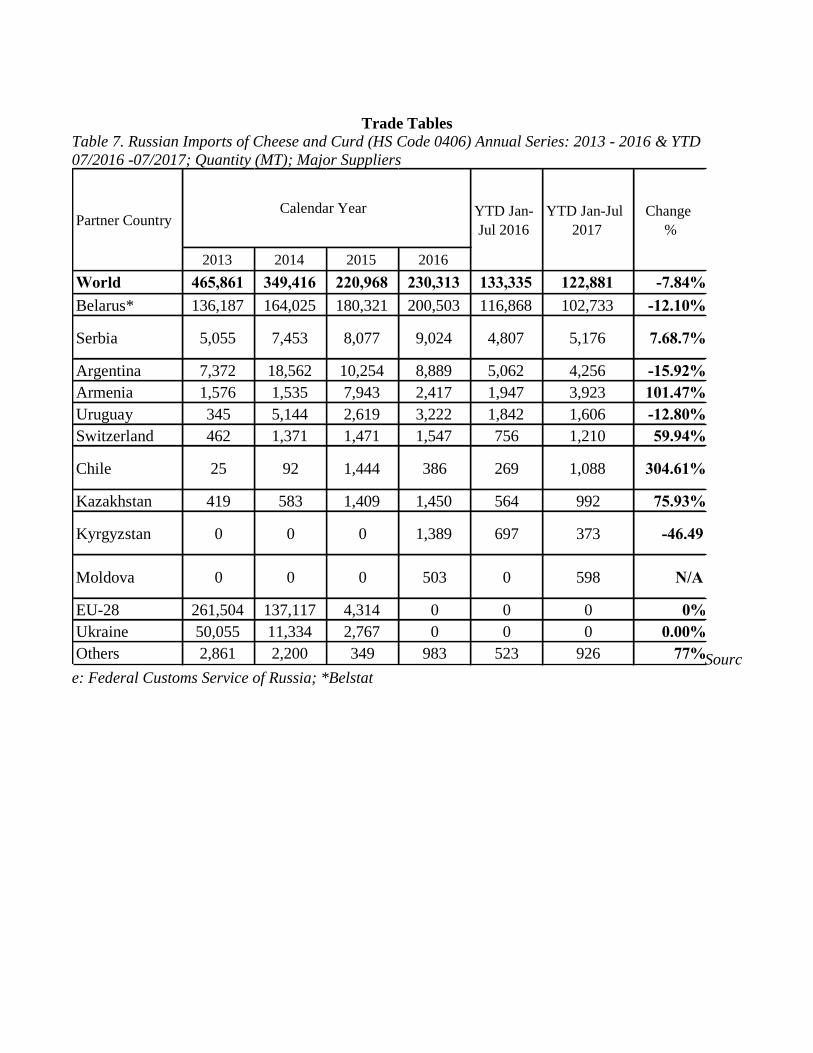
Trade Tables
Table 7. Russian Imports of Cheese and Curd (HS Code 0406) Annual Series: 2013 - 2016 & YTD
07/2016 -07/2017; Quantity (MT); Major Suppliers
2013 2014 2015 2016
World 465,861 349,416 220,968 230,313 133,335 122,881 -7.84%
Belarus* 136,187 164,025 180,321 200,503 116,868 102,733 -12.10%
Serbia 5,055 7,453 8,077 9,024 4,807 5,176 7.68.7%
Argentina 7,372 18,562 10,254 8,889 5,062 4,256 -15.92%
Armenia 1,576 1,535 7,943 2,417 1,947 3,923 101.47%
Uruguay 345 5,144 2,619 3,222 1,842 1,606 -12.80%
Switzerland 462 1,371 1,471 1,547 756 1,210 59.94%
Chile 25 92 1,444 386 269 1,088 304.61%
Kazakhstan 419 583 1,409 1,450 564 992 75.93%
Kyrgyzstan 0 0 0 1,389 697 373 -46.49
Moldova 0 0 0 503 0 598 N/A
EU-28 261,504 137,117 4,314 0 0 0 0%
Ukraine 50,055 11,334 2,767 0 0 0 0.00%
Others 2,861 2,200 349 983 523 926 77%
Partner CountryCalendar Year YTD Jan-
Jul 2016
YTD Jan-Jul
2017
Change
%
Sourc
e: Federal Customs Service of Russia; *Belstat

Table 8. Russian Imports of Butter (HS Codes 040510; 040590) Annual Series: 2013 - 2016 & YTD
07/2016 -07/2017 Quantity (MT Butter Equivalent); Major Suppliers
2013 2014 2015 2016
World 142,739 137,709 90,836 103,150 55,001 67,340 22.4%
Belarus* 46,068 53,642 68,194 74,022 43,749 43,062 -1.6%
New Zealand 27,058 19,892 7,090 15,881 4,793 17,339 261.8%
Kyrgyzstan 0 0 0 1,447 108 1,562 1346.3%
Uruguay 16,505 18,198 9,875 7,930 4,280 1,475 -65.5%
Argentina 11,314 11,270 3,556 1,887 1,312 1,512 15.2%
Azerbaijan 0 0 0 151 4 542 13450.0%
Turkey 0 6 0 7 0 427 n/a
Kazakhstan 152 228 1,278 654 159 413 159.7%
Moldova 320 140 325 1,080 560 340 -39.3%
Chile 400 250 25 0 0 200 n/a
Australia 10,052 14,746 0 0 0 0 0.0%
EU-28 30,267 17,849 0 0 0 0 0.0%
Others 603 1,488 493 91 36 468 1200.0%
YTD$Jan(Jul$
2016
YTD$Jan(Jul$
2017
Partner Country
YTD
2017/2016%
Change
Calendar Year
Source: Federal Customs Service of Russia; *Belstat
Table 9. Russian Imports of SMP (HS 040210) Annual Series: 2013 – 2016 & YTD 07/2016 -07/2017
Quantity (MT); Major Suppliers.
2013 2014 2015 2016
World 131,390 102,952 120,562 129,135 80,068 76,583 -4.35%
Belarus* 92,125 87,106 114,504 105,540 69,119 60,592 -12.34%
Turkey 0 0 0 9,266 3,311 8,829 166.66%
Iran 0 0 0 381 40 2,702 6655.00%
Switzerlan 705 1,707 1,459 4,836 2,676 2,422 -9.49%
New
Zealand0 0 1,713 322 216 813 276.39%
Uruguay 4,050 2,325 948 975 925 503 -45.62%
Argentina 8,313 2,692 1,658 6,403 3,239 302 -90.68%
EU-28 20,136 6,813 0 0 0 0 0.00%
Ukraine 5,619 1,710 20 0 0 0 0.00%
Others 442 599 260 1,412 542 420 -22.51%
Partner
Country
Calendar Year Jan-Jul
2016
Jan-Jul
2017
YTD%
Change
Source: Source: Federal Customs Service of Russia; *Belstat

Table 10. Russian Imports of WMP (HS Codes 040221, 040229) Annual Series: 2013 - 2016 & YTD
07/2016 -07/2017Quantity (MT); Major Suppliers WMP$imports
2013 2014 2015 2016
World 43,599 36,386 38,758 48,229 23,769 25,895 8.94%
Belarus* 39,987 29,702 37,232 27,600 17,898 11,298 -36.88%
New
Zealand78 0 182 4,213 0 5,167 n/a
Uruguay 0 598 550 3,413 1,613 4,372 171.05%
Argentina 503 3,488 550 10,227 3,633 3,891 7.10%
Costa Rica 0 0 0 2,044 0 322 n/a
Kazakhstan 417 94 223 708 0 315 n/a
Ukraine 807 138 0 0 599 220 -63.27%
EU-28 583 2,366 0 0 0 0 0.00%
Others 1,224 0 21 24 26 310 1092.31%
Partner
Country
Calendar Year YTD%
ChangeJan-Jul 2016 Jan-Jul 2017
Source: Source: Federal Customs Service of Russia; *Belstat

Attachment Attachment Link
File Attachment
Download