russian foreign trade in post-reform...
TRANSCRIPT

CHAPTER-4
RUSSIAN FOREIGN TRADE IN POST- REFORM ERA
In the process of transformation to a market system in Russia is inseparably
linked with the question of foreign trade. As the country's foreign trade regime
represents an integral component of the institutional and economic order now under
going renewal. The form it takes must be determined by the same principles and
objectives, which include contractual freedom, price liberalistion, competition and
privatisation. The fundamental feature of the transformation is stipulated that Russian
economy should be opened up to the world market. This is a sine quo non for the
desired change of system while at the same time acting as a source of new impulses
and, to a certain extent, as a guarantor for the success of the entire transformation
process.
Importance and Functions of Foreign Trade
The Russian economy's closer links in future with the world market ought
primarily to be regarded as a significant opportunity for economic and technological
progress. This is true even though this great country. with its huge domestic market is
less dependent upon foreign trade than smaller economi~s.
Fundamentally, foreign trade has a number of important functions to fulfill in the
stabilization of the economy as a whole. These derive first and foremost from the price
effects induced by foreign trade on the goods and factors markets alike, which can be
regarded as introducing international value standards into the economy. Ultimately,
more significant one the allocation effects induced on the basis of those price changes
leading to a transformation of the sectoral structures of production. This requires
fulfillment of certain prerequisite conditions which include removal of monopolistic
structures greater mobility of factors of production and the like. In future, however,
exploitation of the potential productivity impulses generated by foreign trade certainly
could be capable of setting welfare enhancing effects in motion, particularly when this
challenge is deliberately met head-on. After all, foreign trade guarantees a supply of
goods which would never be possible under conditions of autarky opening up
completely new opportunities for Russia's business enterprises and consumers. For
129

Russia too increasing real incomes and a rising demand for goods can be achieved with
the help of foreign trade, even if these improvements are intrinsically confined to those
areas closely associated with such trade.
Foreign Trade in Pre-reform Era
Russia is not only the most important successor states to the USSR with regard
to foreign trade but has also inherited the greater proportion of its economic potential.
Russia, today accounts for 76 per cent of Soviet Union's territory, 51 per cent of the
population, 59 per cent of the Gross National Product, 66 per cent of industrial
production and 46 per cent of agricultural production. 1 The largest reserv.es of oil, gas,
coal, gold, diamonds, timber and other natural resources identified in the USSR are
located in Russian territory. As om.: would therefore, expect Russia used to achieve
more than two-thirds of the former Soviet Union's foreign trade turn over, or more
specifically 78.9 per cent of export and 57.8 per cent ofimports.2
The foreign trade of Russia in the past is almost the foreign trade of the Soviet
Union as a whole and therefore the past performance of foreign trade of USSR is
reflection of the trade performance of Russian federation. A brief review of the USSR's
trade regime prior to reforms will invariable shed light on the trade performance etc. of
Russia for the above reasons. Further, the position taken up by Russia in the past
explains why all of the problems stemming from the planned economy past of the
Soviet Union have affected primarily Russia's Present foreign trade situation. Before
giving to the teething troubles of pre-reform era and underlining the new economic
order in the post-reform era, it is very essential to highlight the trade situation of USSR
vis-a-vis that of Eastern Europe & rest of world in the pre-reform era.
1 Klaus Werner, "Russia's Foreign Trade and the Economic Refonns," Intereconomics, vol. 28, no. 3 (May- June 1993), p.l46 2 'b'd I I ., p.l46.
130
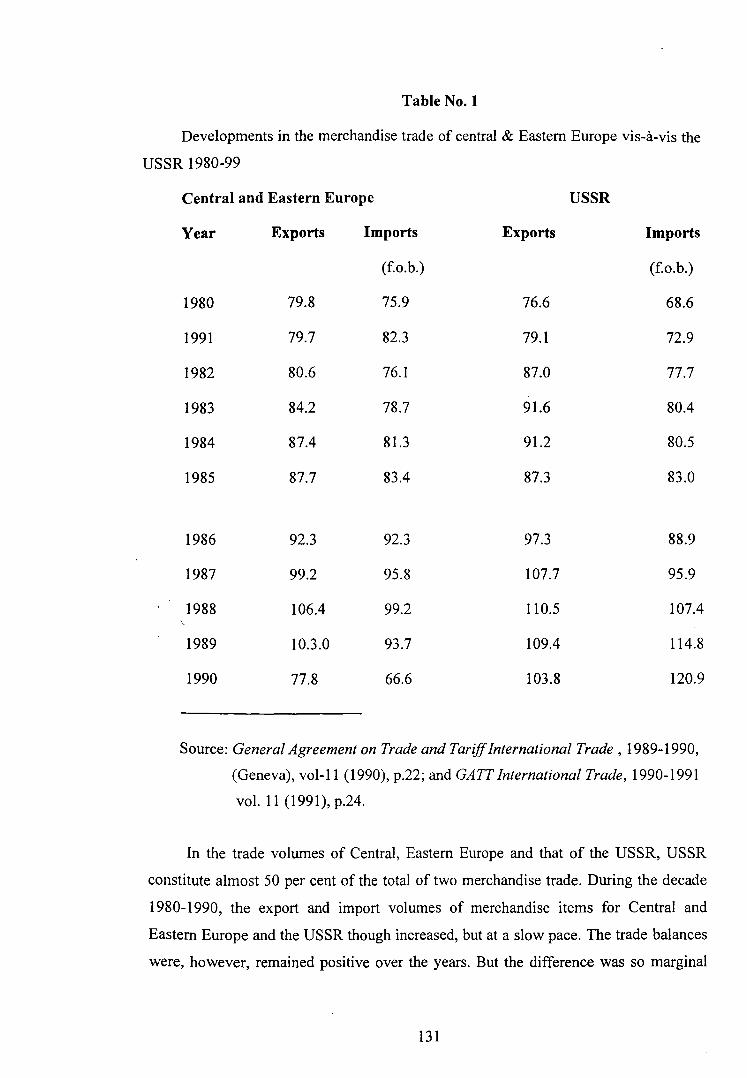
Table No.1
Developments in the merchandise trade of central & Eastern Europe vis-a-vis the
USSR 1980-99
Central and Eastern Europe
Year
1980
1991
1982
1983
1984
1985
1986
1987
1988
1989
1990
Exports
79.8
79.7
80.6
84.2
87.4
87.7
92.3
99.2
106.4
10.3.0
77.8
Imports
(f.o.b.)
75.9
82.3
76.1
78.7
81.3
83.4
92.3
95.8
99.2
93.7
66.6
Exports
76.6
79.1
87.0
91.6
91.2
87.3
97.3
107.7
110.5
109.4
103.8
USSR
Imports
(f.o.b.)
68.6
72.9
77.7
80.4
80.5
83.0
88.9
95.9
107.4
114.8
120.9
Source: General Agreement on Trade and Tariff International Trade , 1989-1990,
(Geneva), vol-11 (1990), p.22; and GATT International Trade, 1990-1991
vol. 11 (1991), p.24.
In the trade volumes of Central, Eastern Europe and that of the USSR, USSR
constitute almost 50 per cent of the total of two merchandise trade. During the decade
1980-1990, the export and import volumes of merchandise items for Central and
Eastern Europe and the USSR though increased, but at a slow pace. The trade balances
were, however, remained positive over the years. But the difference was so marginal
131
that it won't be wrong to describe the situation as passing on sword's edge. Thus,
everywhere they were creeping into stage from stage zero or negative balances and
moving thereby towards a phase of trade crisis.
The value of exports and imports though went on rising due to the exchange
rate variations, the share of trade declined considerably and continuously during the
mid eighties and late eighties which is clear from the following Table No.2. The value
of export for the whole region though started increasing from $178 bn to in 1985 to $
212 bn in 1989. It fell to$ 182 bn in 1990.
Between 1973-1985, the combined trade of Eastern Europe and the USSR
expanded in volume terms, more rapidly than the world trade. Both exports from and
imports into this region grew at an annual average rate of some 4 'l2 per cent as
compared with 3 per cent for world trade. Moreover, neither of the two recessions in
world trade (1975& 1982) significantly affected the trade of Eastern Europe and the
USSR. Not until 1985 did the volume of exports from the region decline, and then only
it started declining.
In value terms, the rate of growth of both exports and imports of Eastern Europe
and the USSR as a whole had slowed down to 1 'l2 per cent in 1984. Mainly due to
substantial reductions in shipments from Poland and the USSR, aggregate exports from
the area declined by some 2 'l2 per cent in 1935.3 Whereas imports into Eastern Europe
and the USSR recovered somewhat (up 3 ·per cent) under the combined effect of
accelerating imports into Bulgaria and a reversal of the declines in imports into
Hungary and the USSR.
With regard to trade data expressed in dollars, it should be kept in mind that
dollar unit values of both imports and exports of Eastern Europe and the USSR
increased less rapidly between 1973 and 1985 than those of world trade. This is due to
the areas trade structure and the pricing system used in intra-area exchanges and intra
area trade between Eastern Europe and the USSR, which did not change much in value
terms during the period under review, represented nearly 55 per cent of the area's
exports in 1985. more importantly the share of fuels in the area's intra-trade has
increased from 8 per cent in 1973 to about 25% in 1985. Although based on world
prices, fuel prices for intra-trade are calculated using a five year moving average. As a
3 GATT, International Trade, 1985-86 (Geneva, 1986), p.105.
132

result, when there is any change in world prices, there is a lag in the effect on intra-area
prices, (GATT, International Trade, 1985-86, pp.l05-106).
Table No.2
Share of Eastern Europe and USSR Trade in the World Trade
Year Trade value in bn $ Share in world trade (%)
Export Import Export Import
1985 178 171 9\12 8\12
1987 215 200 8\12 7\12
1988 226 214 8 7
1989 212 208 7 6\12
1990 182 187 5 5
Source: GATT, International Trade, 1985-86 (Geneva, 1986), p. 104; GATT,
International Trade, 1987-88, (1988), p. 57; GATT, International Trade, 1989-
90, (1990); and GATT, International Trade, 1990-91, (1991), p.23;
Volume of import also showed a rising trend and remained below the export
value amounting to positive trade balance except for the year 1990 where a deficit to
the tune of $ 65 was noticed. The share of export for the Eastern Europe and USSR
though was 9 \12% in 1985, it declined to 5% within a span of 5 years.
After intra-Central and Eastern Europe and USSR, it is the Western Europe
which accounts for 26 \12 per cent of the total exports of USSR and Eastern Europe
countries. The average annual change on the export during 19980-1988 to the Western
Europe found to be only 1\12 per cent and 11 per cent during 1989 over 1980-88. The
merchandise exports of the Eastern Europe and the USSR as on 1989 by destination is
summarised in the following table
133
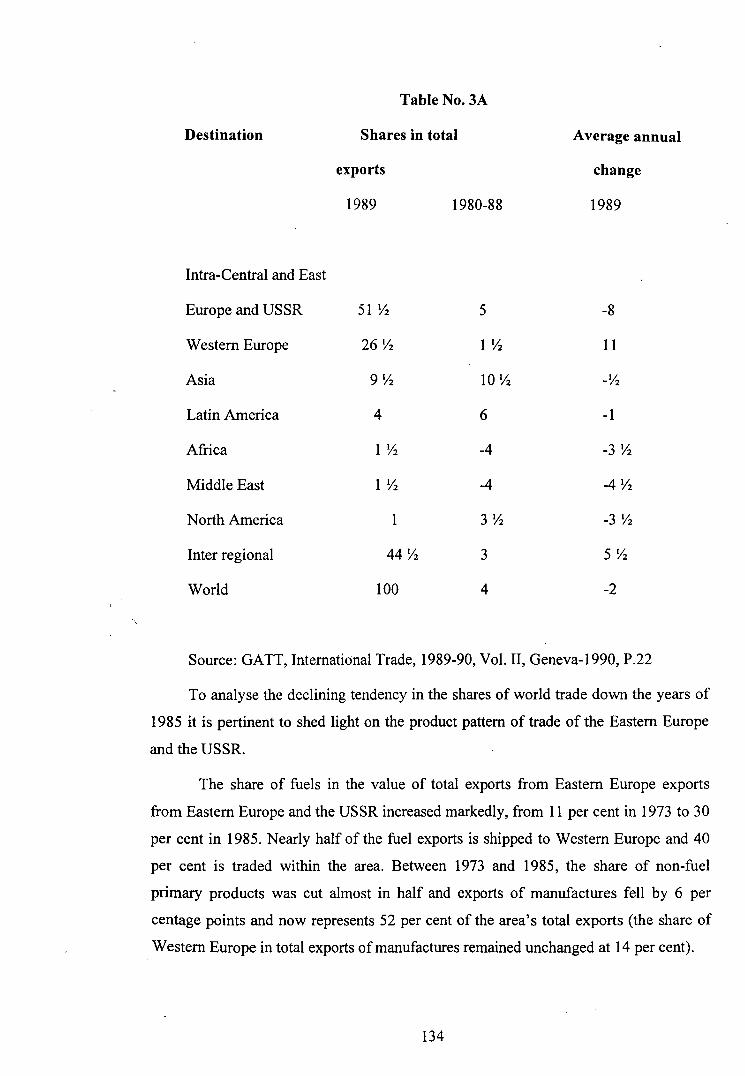
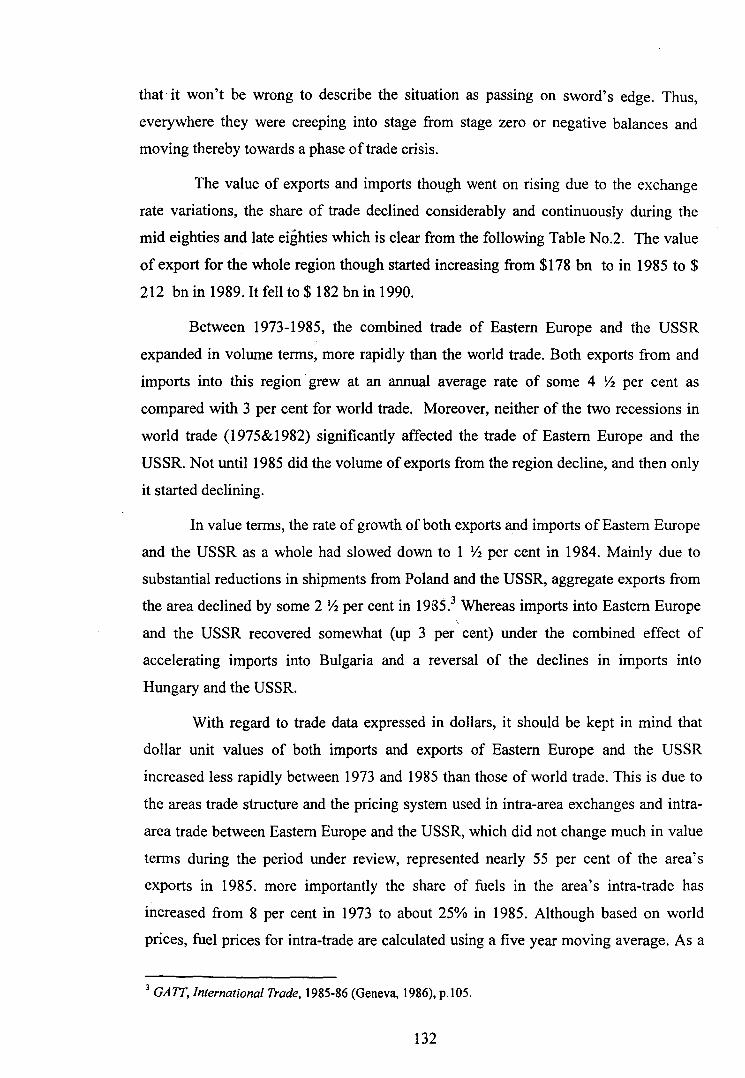
Table No. 3A
Destination Shares in total
exports
1989 1980-88
Intra-Central and East
Europe and USSR 51 'li 5
Western Europe 26 'li 1 'li
Asia 9'li IO'li
Latin America 4 6
Africa 1 'li -4
Middle East 1 'li -4
North America 1 3'li
Inter regional 44 'li 3
World 100 4
Average annual
change
1989
-8
11
-'li
-1
-3 'li
-4 'li
-3 'li
S'li
-2
Source: GATT, International Trade, 1989-90, Vol. II, Geneva-1990, P.22
To analyse the declining tendency in the shares of world trade down the years of
1985 it is pertinent to shed light on the product pattern of trade of the Eastern Europe
and the USSR.
The share of fuels in the value of total exports from Eastern Europe exports
from Eastern Europe and the USSR increased markedly, from 11 per cent in 1973 to 30
per cent in 1985. Nearly half of the fuel exports is shipped to Western Europe and 40
per cent is traded within the area. Between 1973 and 1985, the share of non-fuel
primary products was cut almost in half and exports of manufactures fell by 6 per
centage points and now represents 52 per cent of the area's total exports (the share of
Western Europe in total exports of manufactures remained unchanged at 14 per cent).
134

The decline in the share of non-fuel primary products was less pronounced due
to sustained imports of food stuffs between 1973-85, the value of non-fuel primary
product imports increased by $22 bn, of which $17bn, or 80 per cent of the total
increase was accounted for by food. 4
Table No-3 B*
Merchandise Exports and Imports of Eastern Europe and the USSR by broad
product categories- Billion dollars and percentage shows.
Export Import
1973 1980 1984 1985 1973 1980 1984 1985
52 158 183 178 Total 52 157 166 171
100 100 100 100 Shares 100 100 100 100
22 15 14 13 Non-fuel 25 25 24 22
primary products
11 27 31 30 Fuels 6 14 19 19
58 53 50 52 Manufactures 67 60 56 57
95 5 5 Unspecified 2 1 1 1
Source: GATT, International Trade, 1985-86, vol. II (1986), p.107.
The major suppliers of food outside the area were Latin America, North America
and Western Europe. Their respective shares in total food imports into Eastern Europe
and the USSR in 1985 were estimated at 33, 20 and 12 per cent respectively.5 Oil sector
dominates in the overall trade of the Western Europe with the Europe with the Eastern
Europe and the USSR in 1989, a year closer to beginning of the crisis period in those
region.
4 GATT, International Trade, 1985-86, (1986), p. 107. 5 ibid, p. 107.
135
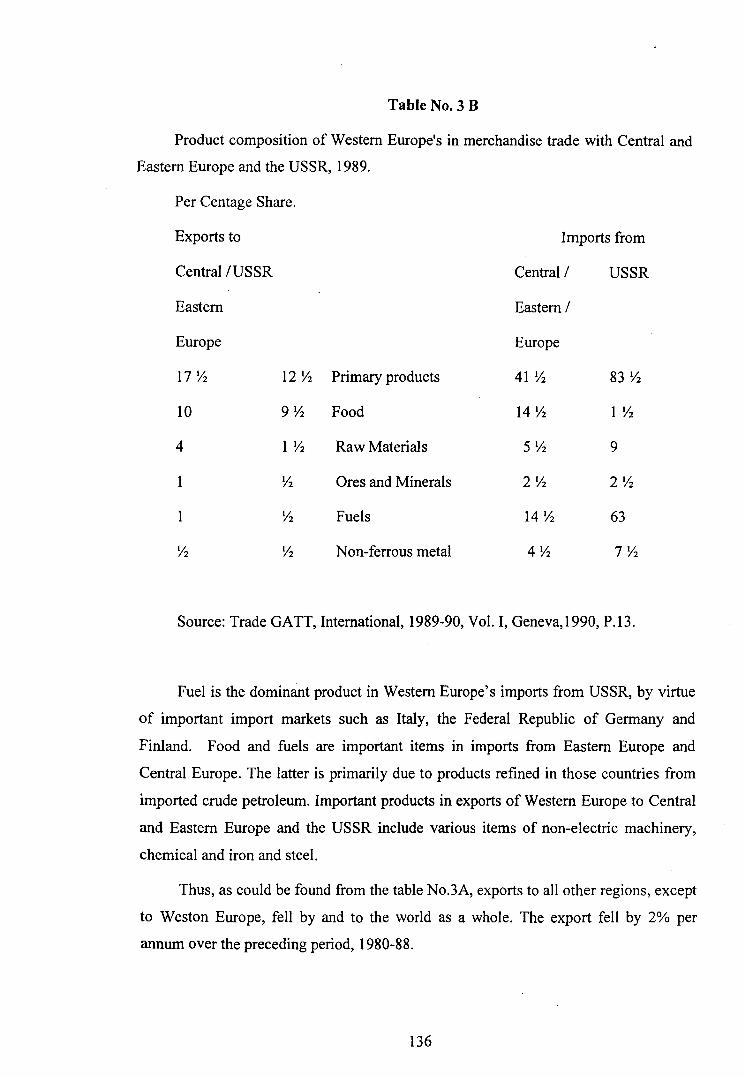
Table No.3 B
Product composition of Western Europe's in merchandise trade with Central and
Eastern Europe and the USSR, 1989.
Per Centage Share.
Exports to
Central /USSR
Eastern
Europe
17 ~ 12 ~
10 9~
4 1 ~
1 ~
1 ~
y2 y2
Primary products
Food
Raw Materials
Ores and Minerals
Fuels
Non-ferrous metal
Imports from
Central I
Eastern I
Europe
USSR
41 ~ 83 ~
14 ~ 1 ~
5~ 9
2~ 2~
14 ~ 63
4~ 7~
Source: Trade GATT, International, 1989-90, Vol. I, Geneva,1990, P.l3.
Fuel is the dominant product in Western Europe's imports from USSR, by virtue
of important import markets such as Italy, the Federal Republic of Germany and
Finland. Food and fuels are important items in imports from Eastern Europe and
Central Europe. The latter is primarily due to products refined in those countries from
imported crude petroleum. Important products in exports of Western Europe to Central
and Eastern Europe and the USSR include various items of non-electric machinery,
chemical and iron and steel.
Thus, as could be found from the table No.3A, exports to all other regions, except
to Weston Europe, fell by and to the world as a whole. The export fell by 2% per
annum over the preceding period, 1980-88.
136
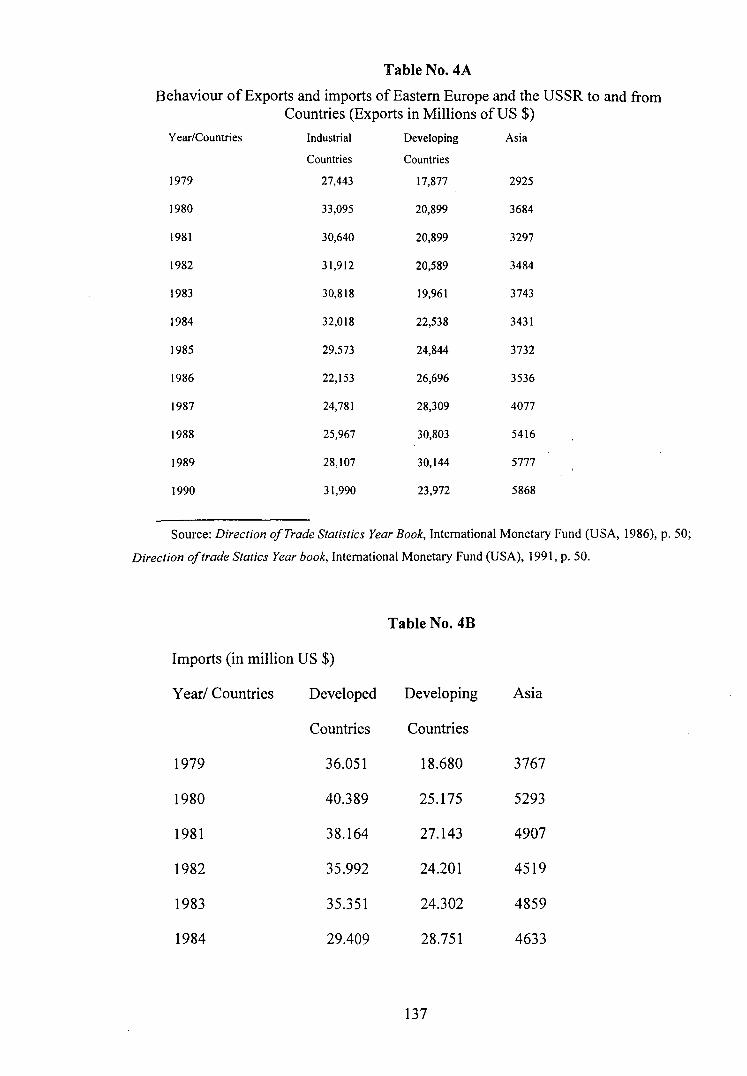
Table No. 4A
Behaviour ofExports and imports of Eastern Europe and the USSR to and from Countries (Exports in Millions of US $)
Year/Countries Industrial Developing Asia
Countries Countries
1979 27,443 17,877 2925
1980 33,095 20,899 3684
1981 30,640 20,899 3297
1982 31,912 20,589 3484
1983 30,818 19,961 3743
1984 32,018 22,538 3431
1985 29,573 24,844 3732
1986 22,153 26,696 3536
1987 24,781 28,309 4077
1988 25,967 30,803 5416
1989 28,107 30,144 5777
1990 31,990 23,972 5868
Source: Direction ofTrade Statistics Year Book, International Monetary Fund (USA, 1986), p. 50;
Direction of trade Statics Year book, International Monetary Fund (USA), 1991, p. 50.
Table No. 4B
Imports (in million US $)
Year/ Countries Developed Developing Asia
Countries Countries
1979 36.051 18.680 3767
1980 40.389 25.175 5293
1981 38.164 27.143 4907
1982 35.992 24.201 4519
1983 35.351 24.302 4859
1984 29.409 28.751 4633
137
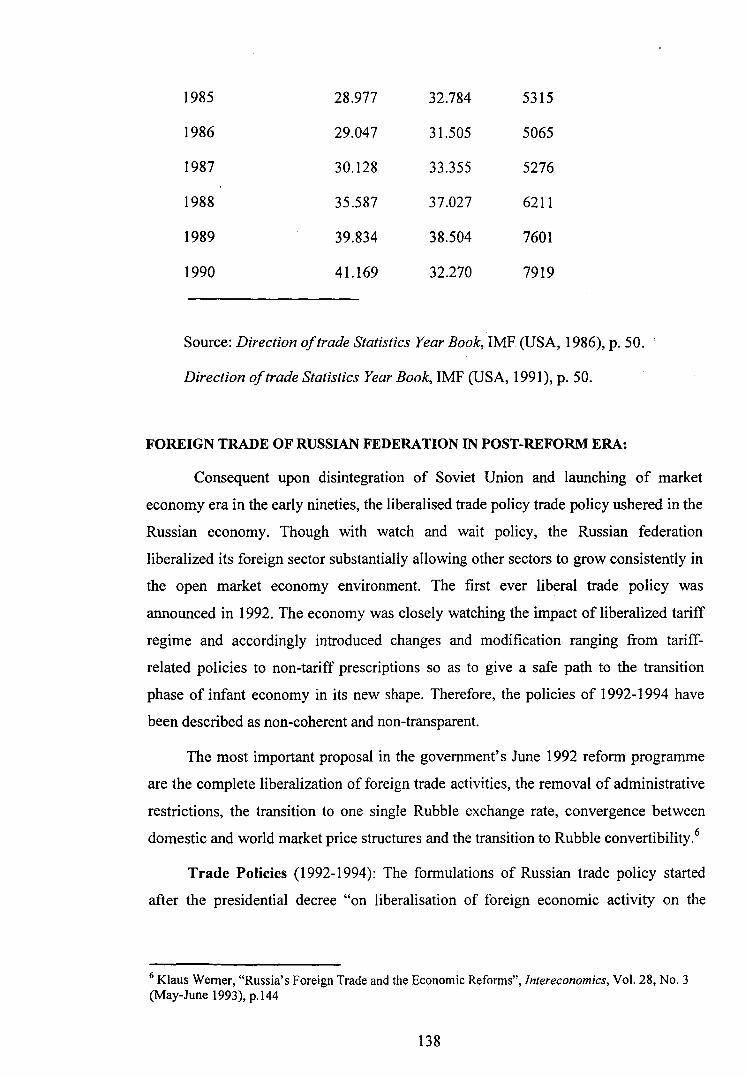
1985 28.977 32.784 5315
1986 29.047 31.505 5065
1987 30.128 33.355 5276
1988 35.587 37.027 6211
1989 39.834 38.504 7601
1990 41.169 32.270 7919
Source: Direction oftrade Statistics Year Book, IMF (USA, 1986), p. 50.
Direction oftrade Statistics Year Book, IMF (USA, 1991), p. 50.
FOREIGN TRADE OF RUSSIAN FEDERATION IN POST-REFORM ERA:
Consequent upon disintegration of Soviet Union and launching of market
economy era in the early nineties, the liberalised trade policy trade policy ushered in the
Russian economy. Though with watch and wait policy, the Russian federation
liberalized its foreign sector substantially allowing other sectors to grow consistently in
the open market economy environment. The first ever liberal trade policy was
announced in 1992. The economy was closely watching the impact of liberalized tariff
regime and accordingly introduced changes and modification ranging from tariff
related policies to non-tariff prescriptions so as to give a safe path to the transition
phase of infant economy in its new shape. Therefore, the policies of 1992-1994 have
been described as non-coherent and non-transparent.
The most important proposal in the government's June 1992 reform programme
are the complete liberalization of foreign trade activities, the removal of administrative
restrictions, the transition to one single Rubble exchange rate, convergence between
domestic and world market price structures and the transition to Rubble convertibility.6
Trade Policies (1992-1994): The formulations of Russian trade policy started
after the presidential decree "on liberalisation of foreign economic activity on the
6 Klaus Werner, "Russia's Foreign Trade and the Economic Reforms", Intereconomics, Vol. 28, No.3 (May-June 1993), p.l44
138
territory ofthe Russian Federation" was signed on 15th November 1991. In 1992-1994/
Russian trade policy was not always coherent and transparent showing successive
advances and retreats in trade liberalisation. Nevertheless, two main trends have been
quite clear: having started in 1992 with very liberal and open import regime, Russia
now displays an exactly opposite pattern, with largely liberalized exports and rather
considerably protection on import side. On balance, some liberalisation was achieved
during the period.
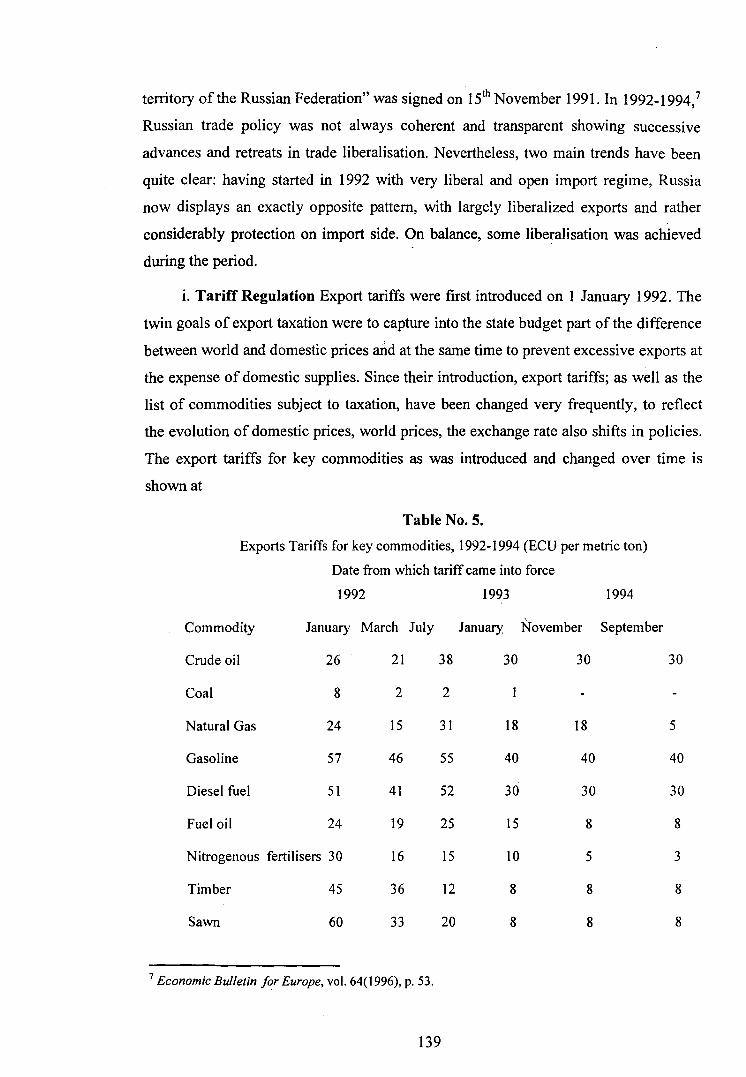
i. Tariff Regulation Export tariffs were first introduced on 1 January 1992. The
twin goals of export taxation were to capture into the state budget part of the difference
between world and domestic prices al1d at the same time to prevent excessive exports at
the expense of domestic supplies. Since their introduction, export tariffs; as well as the
list of commodities subject to taxation, have been changed very frequently, to reflect
the evolution of domestic prices, world prices, the exchange rate also shifts in policies.
The export tariffs for key commodities as was introduced and changed over time is
shown at
Table No.5.
Exports Tariffs for key commodities, 1992-1994 (ECU per metric ton)
Date from which tariff came into force
1992 1993. 1994
Commodity January March July January November September
Crude oil 26 21 38 30 30 30
Coal 8 2 2
Natural Gas 24 15 31 18 18 5
Gasoline 57 46 55 40 40 40
Diesel fuel 51 41 52 30 30 30
Fuel oil 24 19 25 15 8 8
Nitrogenous fertilisers 30 16 15 10 5 3
Timber 45 36 12 8 8 8
Sawn 60 33 20 8 8 8
7 Economic Bulletin for Europe, vol. 64(1996), p. 53.
139
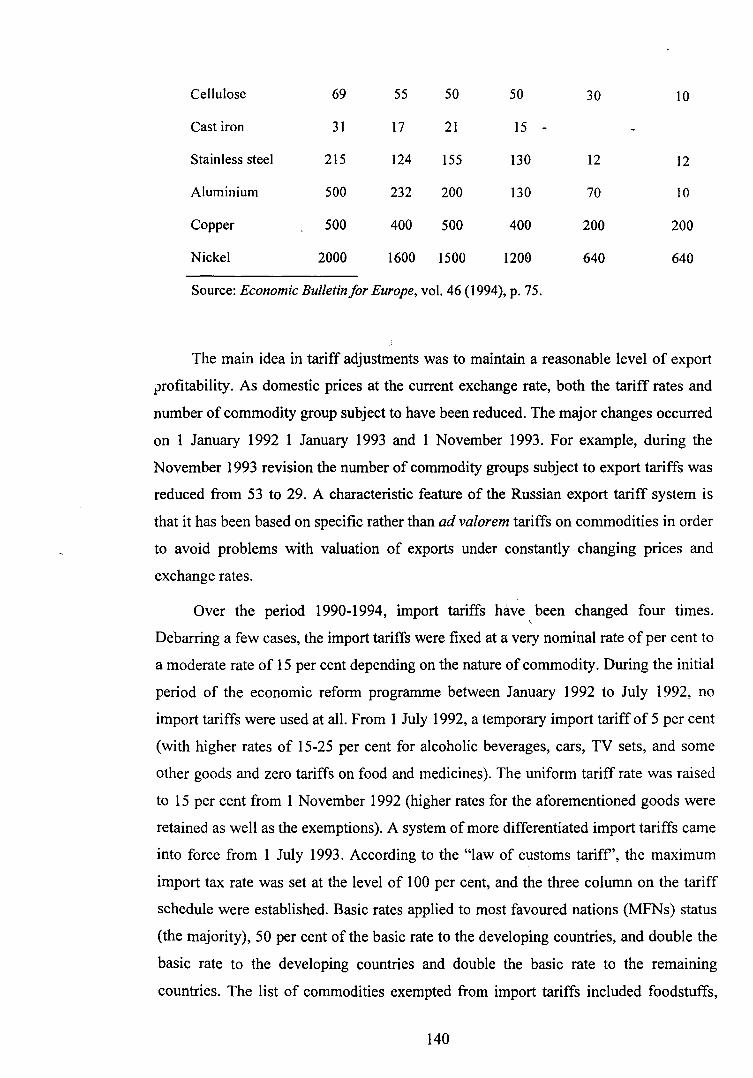
Cellulose 69 55 50 50 30 10
Cast iron 31 17 21 15 -
Stainless steel 215 124 155 130 12 12
Aluminium 500 232 200 130 70 10
Copper 500 400 500 400 200 200
Nickel 2000 1600 1500 1200 640 640
Source: Economic Bulletin for Europe, vol. 46 (1994), p. 75.
The main idea in tariff adjustments was to maintain a reasonable level of export
_profitability. As domestic prices at the current exchange rate, both the tariff rates and
number of commodity group subject to have been reduced. The major changes occurred
on 1 January 1992 1 January 1993 and 1 November 1993. For example, during the
November 1993 revision the number of commodity groups subject to export tariffs was
reduced from 53 to 29. A characteristic feature of the Russian export tariff system is
that it has been based on specific rather than ad valorem tariffs on commodities in order
to avoid problems with valuation of exports under constantly changing prices and
exchange rates.
Over the period 1990-1994, import tariffs have·, been changed four times.
Debarring a few cases, the import tariffs were fixed at a very nominal rate of per cent to
a moderate rate of 15 per cent depending on the nature of commodity. During the initial
period of the economic reform programme between January 1992 to July 1992, no
import tariffs were used at all. From 1 July 1992, a temporary import tariff of 5 per cent
(with higher rates of 15-25 per cent for alcoholic beverages, cars, TV sets, and some
other goods and zero tariffs on food and medicines). The uniform tariff rate was raised
to 15 per cent from 1 November 1992 (higher rates for the aforementioned goods were
retained as well as the exemptions). A system of more differentiated import tariffs came
into force from 1 July 1993. According to the "law of customs tariff', the maximum
import tax rate was set at the level of 100 per cent, and the three column on the tariff
schedule were established. Basic rates applied to most favoured nations (MFNs) status
(the majority), 50 per cent of the basic rate to the developing countries, and double the
basic rate to the developing countries and double the basic rate to the remaining
countries. The list of commodities exempted from import tariffs included foodstuffs,
140
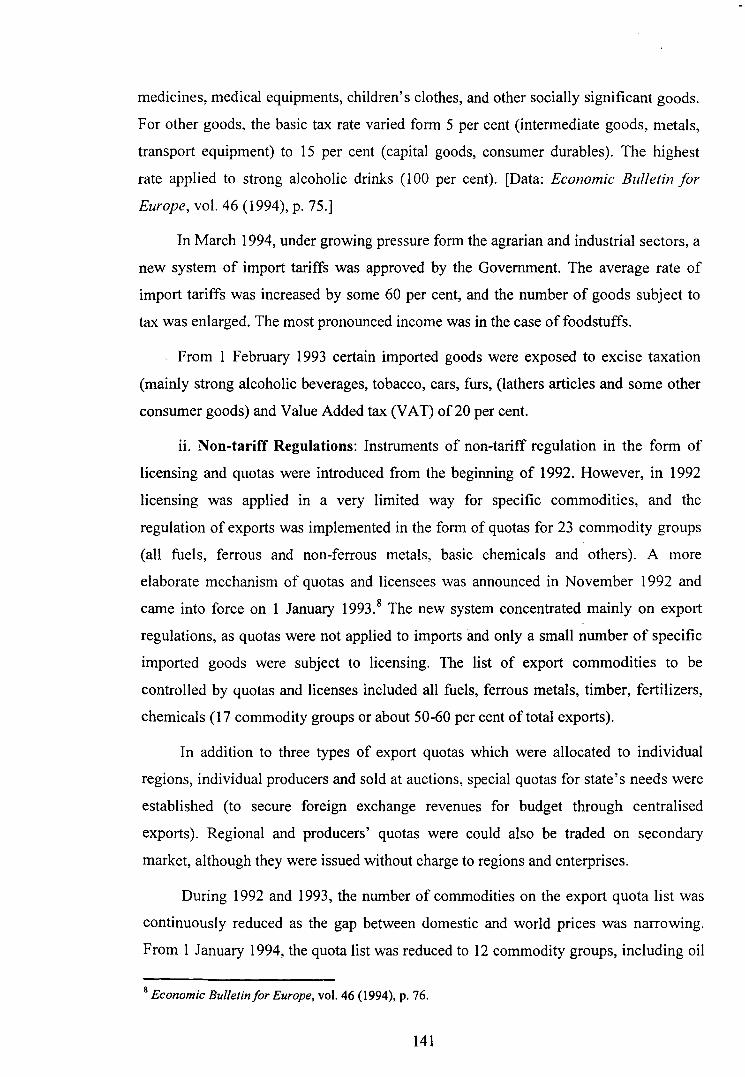
medicines, medical equipments, children's clothes, and other socially significant goods.
For other goods, the basic tax rate varied form 5 per cent (intermediate goods, metals,
transport equipment) to 15 per cent (capital goods, consumer durables). The highest
rate applied to strong alcoholic drinks (1 00 per cent). [Data: Economic Bulletin for
Europe, vol. 46 (1994), p. 75.]
In March 1994, under growing pressure form the agrarian and industrial sectors, a
new system of import tariffs was approved by the Government. The average rate of
import tariffs was increased by some 60 per cent, and the number of goods subject to
tax was enlarged. The most pronounced income was in the case of foodstuffs.
From 1 February 1993 certain imported goods were exposed to excise taxation
(mainly strong alcoholic beverages, tobacco, cars, furs, (lathers articles and some other
consumer goods) and Value Added tax (VAT) of20 per cent.
ii. Non-tariff Regulations: Instruments of non-tariff regulation in the form of
licensing and quotas were introduced from the beginning of 1992. However, in 1992
licensing was applied in a very limited way for specific commodities, and the
regulation of exports was implemented in the form of quotas for 23 commodity groups
(all fuels, ferrous and non-ferrous metals, basic chemicals and others). A more
elaborate mechanism of quotas and licensees was announced in November 1992 and
came into force on 1 January 1993.8 The new system concentrated mainly on export
regulations, as quotas were not applied to imports and only a small number of specific
imported goods were subject to licensing. The list of export commodities to be
controlled by quotas and licenses included all fuels, ferrous metals, timber, fertilizers,
chemicals (17 commodity groups or about 50-60 per cent of total exports).
In addition to three types of export quotas which were allocated to individual
regions, individual producers and sold at auctions, special quotas for state's needs were
established (to secure foreign exchange revenues for budget through centralised
exports). Regional and producers' quotas were could also be traded on secondary
market, although they were issued without charge to regions and enterprises.
During 1992 and 1993, the number of commodities on the export quota list was
continuously reduced as the gap between domestic and world prices was narrowing.
From 1 January 1994, the quota list was reduced to 12 commodity groups, including oil
8 Economic Bulletin for Europe, vol. 46 (1994), p. 76.
141
and oil products, gas, electric energy, some ferrous metals and food products. From I
July 1994 all export quotas and licenses were to be abolished, but later it was classified
that quotas and licenses would be retained to the end of 1994 for crude oil and
petroleum products as well as for a number of commodities agreed between Russia and
European Union (these are mainly aluminium, fabrics and textile articles). From I
January 1995 quotas and licenses for exports of crude oil and petroleum products are
also to be eliminated.9
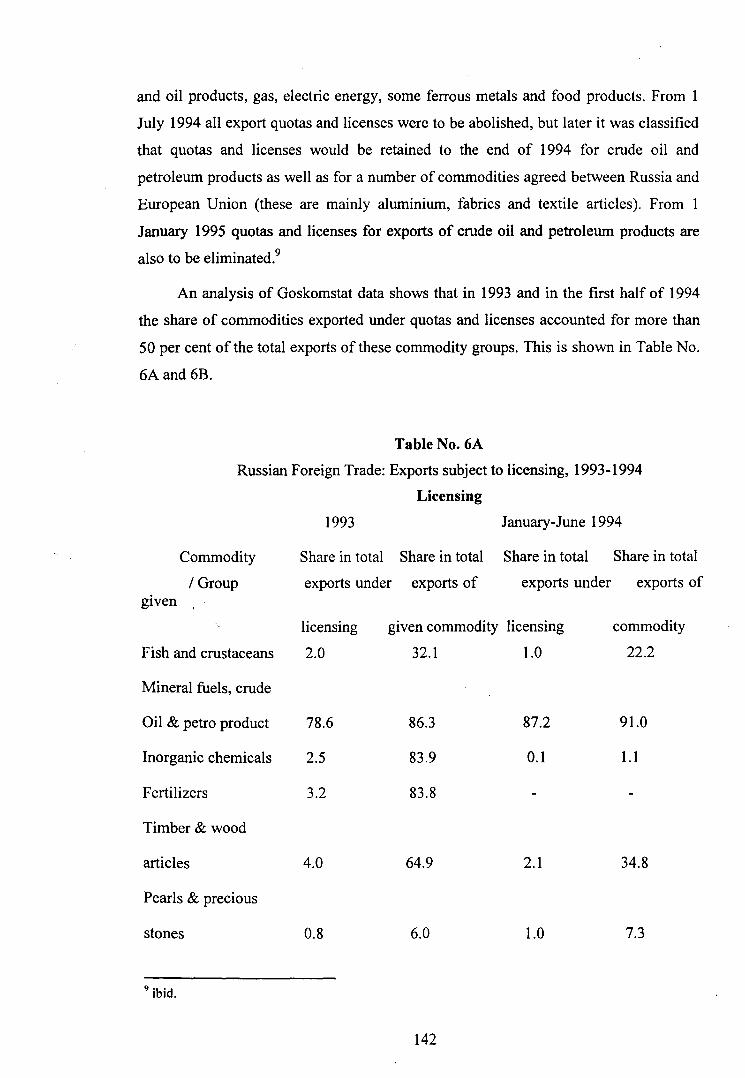
An analysis of Goskomstat data shows that in 1993 and in the first half of 1994
the share of commodities exported under quotas and licenses accounted for more than
50 per cent ofthe total exports of these commodity groups. This is shown in Table No.
6Aand 6B.
Table No. 6A
Russian Foreign Trade: Exports subject to licensing, 1993-1994
Licensing
1993 January-June 1994
Commodity Share in total Share in total Share in total Share in total
I Group exports under exports of exports under exports of gtven
'
licensing given commodity licensing commodity
Fish and crustaceans 2.0 32.1 1.0 22.2
Mineral fuels, crude
Oil & petro product 78.6 86.3 87.2 91.0
Inorganic chemicals 2.5 83.9 0.1 1.1
Fertilizers 3.2 83.8
Timber & wood
articles 4.0 64.9 2.1 34.8
Pearls & precious
stones 0.8 6.0 1.0 7.3
9 ibid.
142
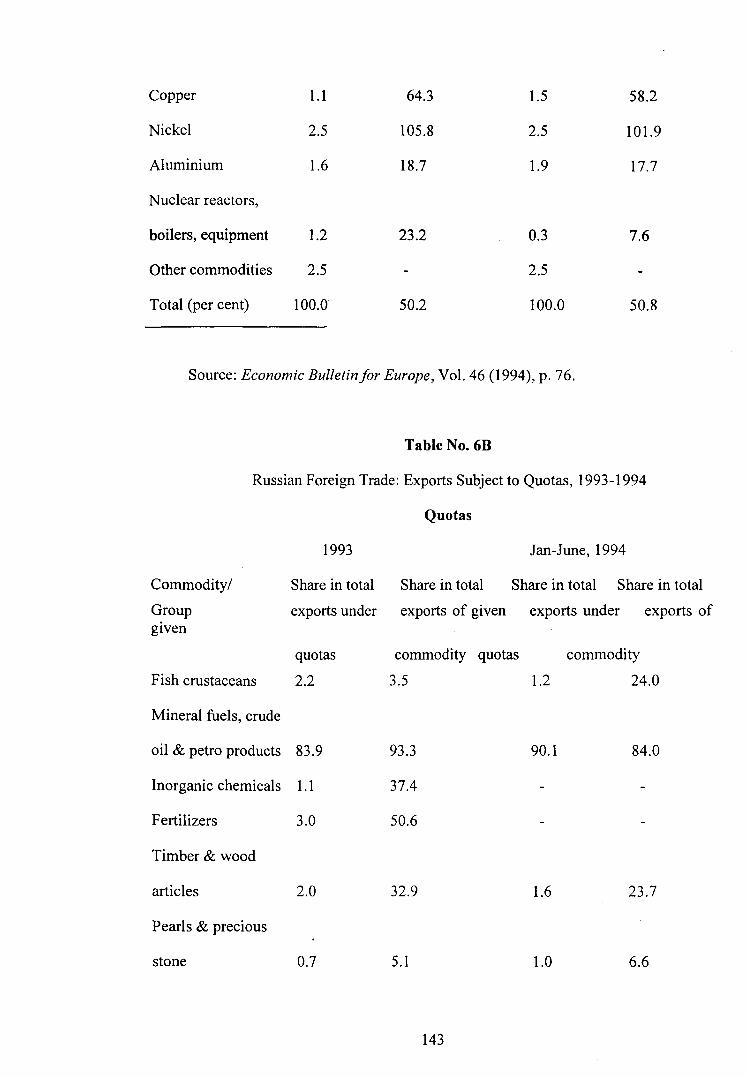
Copper 1.1 64.3 1.5 58.2
Nickel 2.5 105.8 2.5 101.9
Aluminium 1.6 18.7 1.9 17.7
Nuclear reactors,
boilers, equipment 1.2 23.2 0.3 7.6
Other commodities 2.5 2.5
Total (per cent) 100.0 50.2 100.0 50.8
Source: Economic Bulletin/or Europe, Vol. 46 (1994), p. 76.
Table No. 6B
Russian Foreign Trade: Exports Subject to Quotas, 1993-1994
Quotas
1993 Jan-June, 1994
Commodity/
Group
Share in total Share in total Share in total Share in total
exports under exports of given exports under exports of given
Fish crustaceans
Mineral fuels, crude
quotas
2.2
oil & petro products 83.9
Inorganic chemicals 1.1
Fertilizers 3.0
Timber & wood
articles 2.0
Pearls & precious
stone 0.7
commodity quotas
3.5
93.3
37.4
50.6
32.9
5.1
143
1.2
90.1
1.6
1.0
commodity
24.0
84.0
23.7
6.6

Copper 1.1 62.5 1.3 44.5
Nickel 2.4 101.1 2.5 90.3
Aluminium 1.4 16.7 0.2 2.0
Nuclear reactors,
boilers, equipment
Other commodities 2.2 2.1
Total (per cent) 100.0 50.9 100.0 45.3
Source: Economic Bulletin of Europe, Vol. 46 (1994), p. 76.
iii. Strategically Important Commodities (SIC), and Special Exporters
provision: In order to protect state revenues and avoid income losses from non
equivalent exchange and secure the repatriation of export earnings, a list of
"strategically important commodities- (SIC)" was introduced from the second half of
1992, as well as a category of " special exporters", which were the only trade
orgnisations authorized to export these commodities. "The SIC list was identical with
the list of goods subject to quotas and licensing. The special exporters were registered
by the Ministry for Foreign Economic Relations, where continuously changed the 26
register both as to the number and the participants on the basis of their performance. At
the end of 1993, there were about 800 special exporters in 1994 their number was
reduced to 497. After elimination of quota in 1994, special exporters had to register
their contracts at the Ministry of Foreign Economic Relations and get a special
certificate for this. Thus, the abolition of one form of none-tariff regulation (quotas and
licenses) was replaced by another one (registration of contracts). However, from 1
January 1995the category of special exporters was abolished. 10
Besides the above policy measures, the State itself actively participated in trade
through 'centralised' exports and the system centralised won designed to acquire hard
currency for the govt. For debt servicing centralised imports and other purposes. The
Government centralized imports for debt servicing and other purposes. The system of
10 ibid.
144

centralized imports was used to provide domestic consumers with imported goods at a
price lower than the world market price, with the difference (subsidiary) paid by the
government. Centralised imports included both consumer goods (mainly food stuffs and
medicines) and investment goods and industrial inputs. Centralized exports accounted
for 33 per cent of total exports in 1992, 30 per cent in 1993 and 15 per cent in the first
half of 1994. The centralised imports are also continuously shrinking continuously. At
the end of 1993, all State subsidies for imports were abolished the government's direct
involvement in foreign trade was gradually reduced between 1992-1994. 11
iv. Measures to prevent capital flight: Tax controls over foreign exchange operations
and repatriation of foreign exchange earnings are perhaps the most acute problems
confronted by Russian trade policy markers. Trying to cut capital flight from Russia,
the authorities introduced a system of foreign exchange control over exporters' proceed
from January 1, 1994. The system tries to detect and gauge any difference between the
announced value of the contract and actual revenues obtained by exporters. Every
export transactions must be recorded in a special "passport", including all details of the
contracts. On the basis of this document, and also of bank information on payments
made out of enterprises' accounts. The customs committees compares export earnings
with the value of goods delivered and thus has a chance to uncover hidden revenues and
capital flight. As a result of this measure, the estimated amount 0f capital flight
diminished sharply in 1994 as compared with 1993.
v. Foreign exchange Policy: At the beginning of 1992, a certain liberalization of the
foreign exchange market was implemented. However, till that period, multiple
exchange rates continue along with a complicated system of foreign exchange
allocation for imports through weekly auctions and direct rationing. In addition the
principle of compulsory surrender of exports earnings was maintained. From January to
June 1992, exporters had a legal right to retain 50 per cent of hard currency revenues,
40 per cent was to be sold at a Republican hard currency reserve at a fixed rate and 1 0
per cent to the central bank of Russia at the official rate.
The rudiments of a foreign exchange market were established when the Moscow
Inter Bank Currency Exchange (MICEX) started weekly auctions, with the current
II ibid., p. 77.
145

exchange rate fixed on the basis of supply and demand. The operations of the MICEX
were performed under the control of the Central Bank, which used its hard currency
reserves to influence the exchange rate through a mechanism of interventions. from
July 1, 1992, a new set of measures was introduced to better regulate the foreign
exchange market. The most important was the unification of exchange rates for current
account transactions. The rate was floating and was determined twice a week on the
basis of quotations at the auctions of the MICEX. Exporters still had to sell 50 per cent
of their hard currency earnings, not to the government as before, but rather directly to
foreign exchange market through authorized banks where their hard currency accounts
were kept. Exporters' profits were sharply boosted as the rate used for these
transactions was the market rate.
However, in spite of the proclaimed exchange rate unification a concealed system
of multiple rates continued to be applied in the system of centralized imports. The
system though was far from perfect, it is perhaps one of the few examples in Russia
where a market is doing its job. But it remains highly volatile and its performance some
times is dismal.
The precipitate fall of Rouble in September 1994 and its dramatic collapse by
22 per cent on 11 October 1994 demonstrates the deficiencies of the thin and unstable
market. The primary causes for large exchange rate fluctuations ,Tie deeply rooted in
erratic macro-economic policies and institutional rigidities charact~ristic of the Russian
economy.
TRADE PERFORMANCE OF RUSSIAN ECONOMY DURING 1992 AND BEYOND:
To analyse the trade performance of the newly emerging Russian economy, data
problem is very severe due to its very infancy of the new form. These problems need
prior discussion to avoid and adjust certain anomalies.
Statistical and Data Problem Statistics on Russian foreign trade only started with the
emergence of Russia as an independent state, as Soviet Foreign trade statistics were
compiled only for the USSR as a whole, without break up by Republics Hence, all data
on Russian trade for the years before 1992 are estimates derived from USSR statistics,
the accuracy of which diminishes as one moves backward from 1992.
146
From the very beginning, the Russian Goshmostat faced a great number of
problem in the collection of foreign trade data: absence of customs boarders between
Russia and other Soviet Republics, transition to the new trade classification based on
the harmonized commodity description and coding system, the rapidly growing number
of firms involved in international trade and the appearance of new types to trade
activity such as exports and imports by private individuals. Under such conditions, the
first estimates of trade flows in 1992-1993 were invariably not very reliable and subject
to frequent revisions.
In 1992-1993, the methodlogy applied by Goskomstat to collect and process trade
data was stile largely based on the old principles existing under the state monopoly of
foreign trade. The system was based on reports from all economic units conducting
trade activities, which had registered with the regional statistical offices. The core of
this unit was formed by a limited number of large foreign trade organization inherited
from the Soviet period. On the basis of those reports, Gusokmstat made first estimates
of trade flow broken up by commodities and countries.
Usually these estimates severely underestimated the actual trade levels, especially
in the case of imports because not all trading entities registered with statistical offices
and the disciplines of reporting was rather poor. The preliminary Gusokmstat estimates
were then adjusted in lin~ with a special procedure elaborated by Gusokmstat together
with the ministry for foreign economic relations (MFER). This procedure takes into
account customs information mirror statistics of Russia's trade partner and the reports
of MFER representatives abroad. 12 The discrepancy between the initial trade data and
the adjusted trade values is in some cases, quite substantial which may be seen from the
following Table.
12 Ibid, p. 68.
147
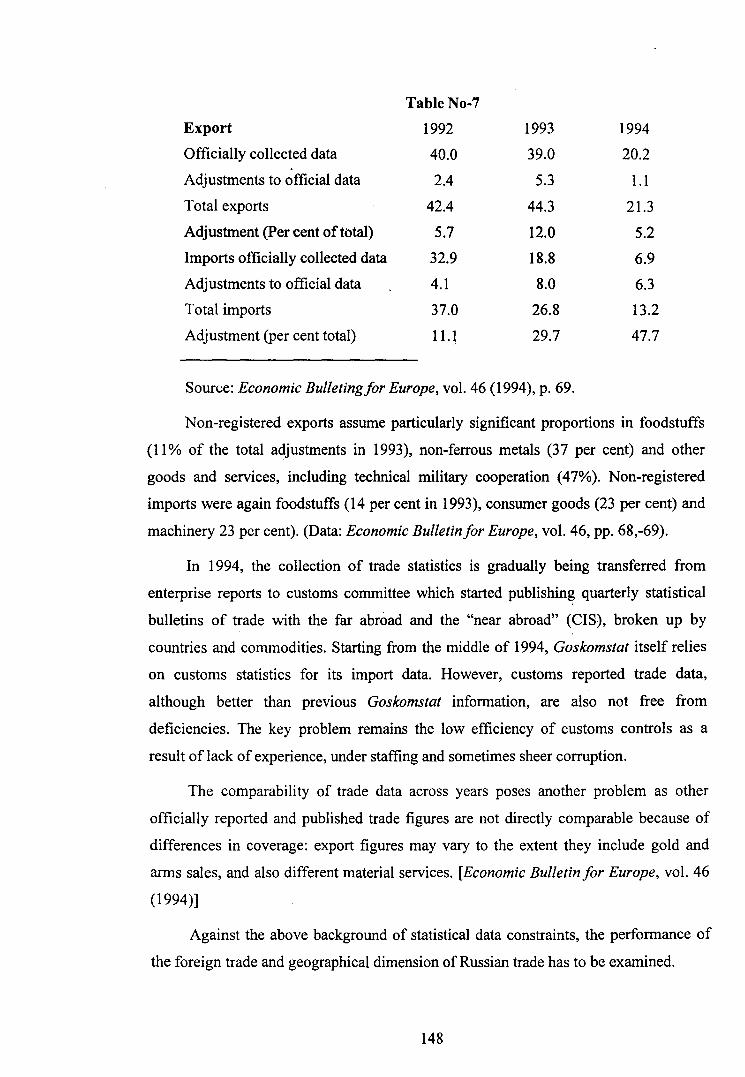
Table No-7
Export 1992 1993 1994
Officially collected data 40.0 39.0 20.2
Adjustments to official data 2.4 5.3 1.1
Total exports 42.4 44.3 21.3
Adjustment (Percent of total) 5.7 12.0 5.2
Imports officially collected data 32.9 18.8 6.9
Adjustments to official data 4.1 8.0 6.3
Total imports 37.0 26.8 13.2
Adjustment (per cent total) 11.1 29.7 47.7
Sour"e: Economic Bulletingfor Europe, vol. 46 (1994), p. 69.
Non-registered exports assume particularly significant proportions in foodstuffs
(11% of the total adjustments in 1993), non-ferrous metals (37 per cent) and other
goods and services, including technical military cooperation (47%). Non-registered
imports were again foodstuffs (14 per cent in 1993), consumer goods (23 per cent) and
machinery 23 per cent). (Data: Economic Bulletin for Europe, vol. 46, pp. 68,-69).
In 1994, the collection of trade statistics is gradually being transferred from
enterprise reports to customs committee which started publishing quarterly statistical
bulletins of trade with the far abroad and the "near abroad" (CIS), broken up by
countries and commodities. Starting from the middle of 1994, Goskomstat itself relies
on customs statistics for its import data. However, customs reported trade data,
although better than previous Goskomstat information, are also not free from
deficiencies. The key problem remains the low efficiency of customs controls as a
result of lack of experience, under staffing and sometimes sheer corruption.
The comparability of trade data across years poses another problem as other
officially reported and published trade figures are not directly comparable because of
differences in coverage: export figures may vary to the extent they include gold and
arms sales, and also different material services. [Economic Bulletin for Europe, vol. 46
(1994)]
Against the above background of statistical data constraints, the performance of
the foreign trade and geographical dimension of Russian trade has to be examined.
148
GEOGRAPHICAL STRUCTURE I DIRECTION OF TRADE:
In the late 1980s and till the beginning of the 1990s the direction of trade was strongly
influenced by political factors. The breakdown of socialism first in Europe and then in
Russia changed the situation radically. By 1991, the old trade links had cracked. And
when the new Russian government started liberalising foreign trade at the end of 1991,
regional structure of foreign trade was broadly reshaped.
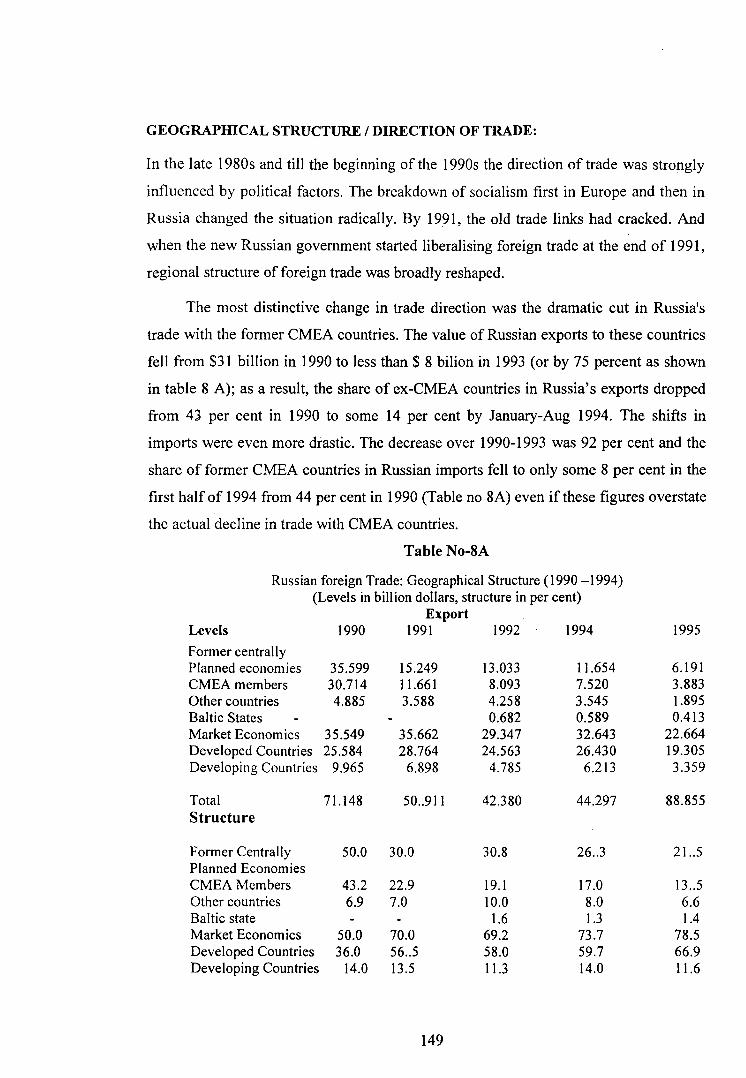
The most distinctive change in trade direction was the dramatic cut in Russia's
trade with the former CMEA countries. The value of Russian exports to these countries
fell from $31 billion in 1990 to less than $ 8 bilion in 1993 (or by 75 percent as shown
in table 8 A); as a result, the share of ex-CMEA countries in Russia's exports dropped
from 43 per cent in 1990 to some 14 per cent by January-Aug 1994. The shifts in
imports were even more drastic. The decrease over 1990-1993 was 92 per cent and the
share of former CMEA countries in Russian imports fell to only some 8 per cent in the
first half of 1994 from 44 per cent in 1990 (Table no 8A) even if these figures overstate
the actual decline in trade with CMEA countries.
Table No-8A
Russian foreign Trade: Geographical Structure ( 1990 -1994) (Levels in billion dollars, structure in per cent)
Export Levels 1990 1991 1992 1994 1995
Former centrally Planned economies 35.599 15.249 13.033 11.654 6.191 CMEA members 30.714 11.661 8.093 7.520 3.883 Other countries 4.885 3.588 4.258 3.545 1.895 Baltic States 0.682 0.589 0.413 Market Economics 35.549 35.662 29.347 32.643 22.664 Developed Countries 25.584 28.764 24.563 26.430 19.305 Developing Countries 9.965 6.898 4.785 6.213 3.359
Total 71.148 50 .. 911 42.380 44.297 88.855 Structure
Former Centrally 50.0 30.0 30.8 26 .. 3 21 .. 5 Planned Economies CMEA Members 43.2 22.9 19.1 17.0 13 .. 5 Other countries 6.9 7.0 10.0 8.0 6.6 Baltic state 1.6 1.3 1.4 Market Economics 50.0 70.0 69.2 73.7 78.5 Developed Countries 36.0 56 .. 5 58.0 59.7 66.9 Developing Countries 14.0 13.5 11.3 14.0 11.6
149
Total 100.0 100.0 100.0 100.0 100.0
Source: Economic Bulletin/or Europe, vol. 46 (1994), p.70
Table No. 8B
Russian foreign Trade: Geographical structure 1990 -1994 (Levels in billion dollar structure in percentage)
Import Levels 1990 1991 1992 1994 1995
Former centrally Planned Economies 41.482 13.997 8.762 5.934 3.035 CMEA members 36.293 10 .. 917 5.347 2.875 1.457
Other countries 5.189 3.080 3.082 2.887 1.492 Baltic States 0.333 0.172 0.086 Market economics 40.269 30.476 28.222 20.873 14.109 Developed countries 32.480 25.857 23.055 16.239 11.888 Developing countries 7. 789 4.619 5.167 4.634 2.221
Total 81.751 44.473 36.984 26.807 17.144
Structure
Former centrally 50.7 31.5 23.7 22.1 17.7 Planed economics CMEA members 44.4 24.5 14.5 10.7 8.5 Other countries 6.3 6.9 8.3 10.8 8.7 Baltic State's 0.9 0.6 0.5 Market economies 49.3 68.5 76.3 77.9 82.3 Developed countries 39.7 58.1 62.3 60.6 69.3
Developing countries 9.5 10.4 14.0 17.3 13.0
Total 100.0 100.0 100.0 100.0 100.0
Source: Economic Bulletin/or Europe, Vol. 46 (1994), p.70
Due to the unrealistic and artificial valuation of trade flows prior to 1991, there can be
no doubt about a dramatic shrinkage of trade between Russia and its former CMEA
partners.
In 1990-94, Russian exports to the developed market economies (basically
organisation for economic cooperation and development (OECD) countries exhibited
no clear-cut tendency, fluctuating within the range of $25-$28 billion (Table 8A).
150
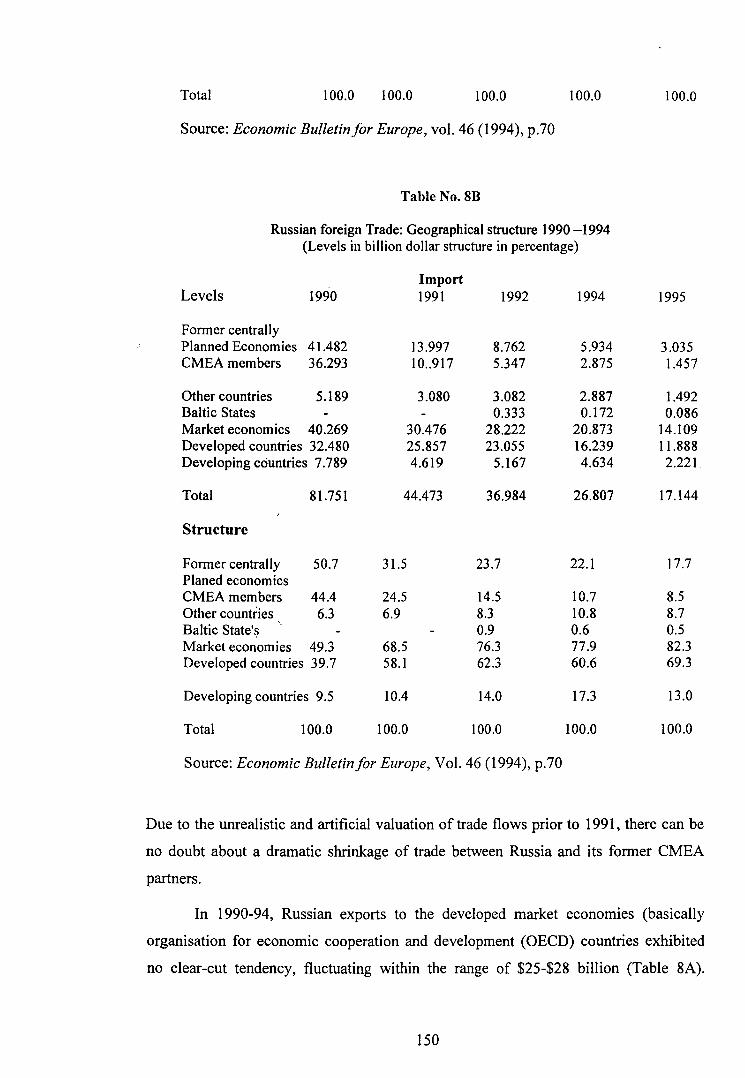
Reflecting the decline of Russian total exports in 1990-92, the share of industrial
countries increased from 36 per cent in 1990 to 67 per cent in the first eight months of
1994. Russian import (Table 8B) from the developed market economies fell by a factor
of two over 1990-1993, but due to the fact that total imports dropped by almost three
times over the same period, the share of industrial countries in Russian imports
increased from 40 per cent in 1990 to 69 per cent in Jan-Aug, 1994. It is worth
mentioning that from 1992 Russia was running with a large trade surplus with the
developed countries, a phenomenon reflecting large-scale capital flight out of Russia.
Trade with developing countries has also been changing. While the share of
these countries in Russian exports was nearly stable in 1990-94, their share in Russian
imports was growing (from 10 per cent in 1990 to 17 per cent in 1993). Changes in the
composition of developing countries involved in trade with Russia show a clear shift
away from former political allies and towards new {lartners among rapidly developing
economies (China, Turkey & the Asian "Tigers"). China rose to the position of second
largest export market for Russia in 1993, after Germany.
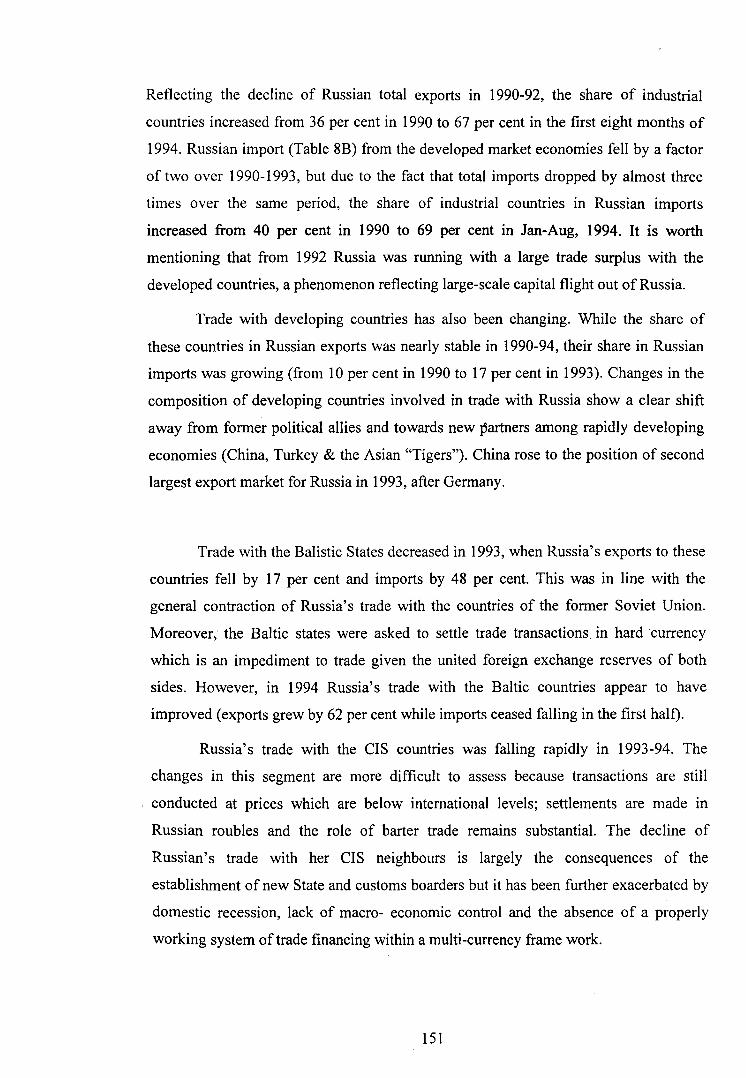
Trade with the Balistic States decreased in 1993, when Russia's exports to these
countries fell by 17 per cent and imports by 48 per cent. This was in line with the
general contraction of Russia's trade with the countries of the former Soviet Union.
Moreover, the Baltic states were asked to settle trade transactions in hard currency
which is an impediment to trade given the united foreign exchange reserves of both
sides. However, in 1994 Russia's trade with the Baltic countries appear to have
improved (exports grew by 62 per cent while imports ceased falling in the first half).
Russia's trade with the CIS countries was falling rapidly in 1993-94. The
changes in this segment are more difficult to assess because transactions are still
conducted at prices which are below international levels; settlements are made in
Russian roubles and the role of barter trade remains substantial. The decline of
Russian's trade with her CIS neighbours is largely the consequences of the
establishment of new State and customs boarders but it has been further exacerbated by
domestic recession, lack of macro- economic control and the absence of a properly
working system of trade financing within a multi-currency frame work.
151

During 1995, the large increase in exports to developing countries was notable. In
the same period, exports to the developing countries doubled and those to the East
European countries grew at a faster pace than exports to the Western market
economies. Significant growth in trade with the East European countries particularly
for exports (up by 43 per cent), suggests a possible revival of intra-regional cooperation
following the strong recovery of these economies, especially those in CIET A.
Maintaining its rising trend, the Russian trade with Balistic States grew rapidly.
Russian trade surpluses increased substantially with all trade-partner groups in 1995.
The largest surplus was trade with developing countries. However exports to the
developing countries declined in 1996, but imports rose rapidly. During the same
period, exports to the East European countries stagnated Russian's. imports from the
transition economies, however, declined by & per cent in the first half of 1996, the
biggest fall being with the Baltic States on Russian data.
Till end of first half of 1998, Russia's foreign trade saw a shift from the
developed economies to developing and transition economies it continued with trade
surpluses with almost all trading partners. 13
COMPOSITION OF TRADE (COMMODITY): The commodity break up of Russia's
exports in 1990-93 by nine aggregated commodity groups show that (Table 9A & 9B)
mineral fuels continue to dominate exports, although their share fell to less than 50 per
cent in 1993 because of falling world prices14. An interesting development has been an
increase of foodstuff exports, mainly fish (80-85 per cent of the total). Exports of
metals and raw diamonds also increased in 1993 as compared to 1990. All other
commodity groups, including semi-manufactures like timber and basic chemicals, were
on a downward trend with especially pronounced drops in manufactures. Exports of
textiles and foot wear fell by 71 per cent 1990 to 1993, while machinery and equipment
exports were down by 77per cent over the same period of time. In general, the share of
machinery dropped from 17.6 per cent of total exports in 1990 to 6.5 per cent in 1993,
and to less than 5 per cent in the first eight months of 1994.
13 Economic Survey of Europe, No. 3 (1998), p. 98. 14 Economic Bulletin for Europe, vol. 46, 1994. p. 72.
152
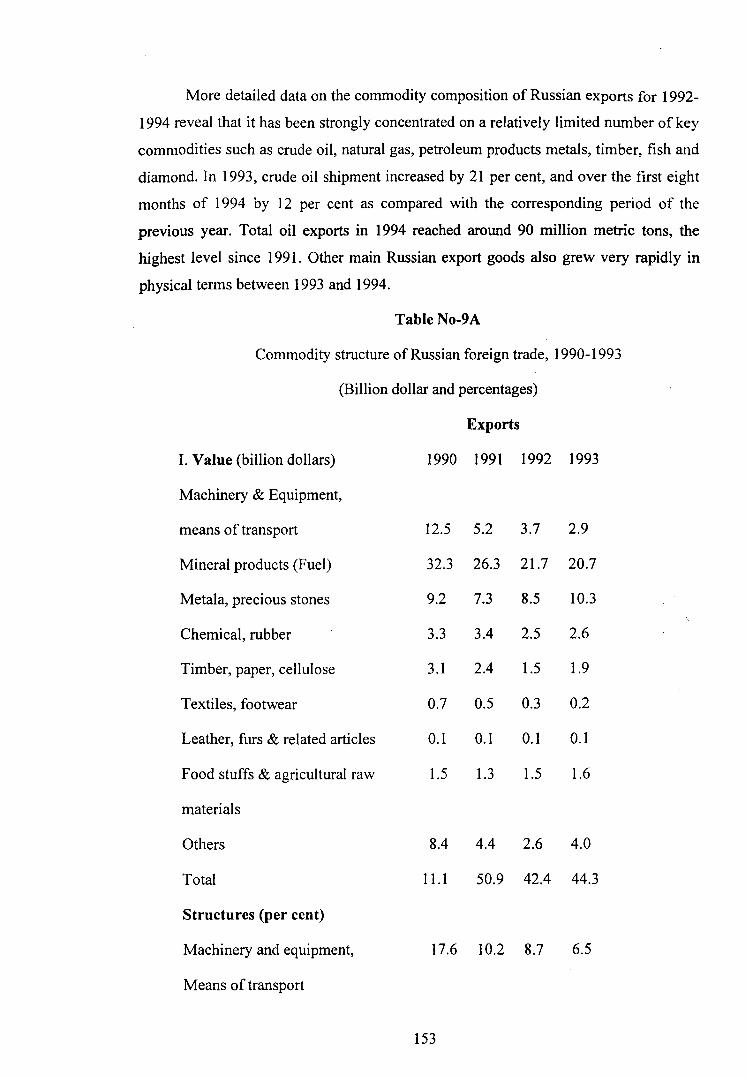
More detailed data on the commodity composition of Russian exports for 1992-
1994 reveal that it has been strongly concentrated on a relatively limited number of key
commodities such as crude oil, natural gas, petroleum products metals, timber, fish and
diamond. In 1993, crude oil shipment increased by 21 per cent, and over the first eight
months of 1994 by 12 per cent as compared with the corresponding period of the
previous year. Total oil exports in 1994 reached around 90 million metric tons, the
highest level since 1991. Other main Russian export goods also grew very rapidly in
physical terms between 1993 and 1994.
Table No-9A
Commodity structure of Russian foreign trade, 1990-1993
(Billion dollar and percentages)
Exports
I. Value (billion dollars)
Machinery & Equipment,
means of transport
Mineral products (Fuel)
Metala, precious stones
Chemical, rubber
Timber, paper, cellulose
Textiles, footwear
Leather, furs & related articles
Food stuffs & agricultural raw
materials
Others
Total
Structures (per cent)
Machinery and equipment,
Means of transport
1990 1991 1992 1993
12.5
32.3
9.2
3.3
3.1
0.7
0.1
1.5
8.4
11.1
5.2 3.7 2.9
26.3 21.7 20.7
7.3 8.5 10.3
3.4 2.5 2.6
2.4 1.5 1.9
0.5 0.3 0.2
0.1 0.1 0.1
1.3 1.5 1.6
4.4 2.6 4.0
50.9 42.4 44.3
17.6 10.2 8.7 6.5
153

Mineral products 45.4 51.7 51.2 46.7
Metala, precious stones 12.9 14.3 20.0 23.3
Chemical, rubber 4.6 6.7 5.9 5.9
Timber, paper, cellulose 4.4 4.7 3.5 4.3
Textiles, footwear 1.0 1.0 0.7 0.5
Leather, furs & related articles 0.1 0.2 0.2 0.2
Food stuffs & agricultural raw
materials 2.1 2.6 3.5 3.6
Others 11.8 8.6 6.1 9.0
Total 100.0 100.0 100.0 100.0
Source: Economic Bulletin/or Europe, vol. 46 (1994), p. 72.
Table No. 9B
Commodity structure of Russian foreign trade, 1990-1994
(Billion dollars and percentages)
Imports
Value (billion dollars) 1990 1991 1992 1993 1994 1995 1996
Machinary and Equipment, 36.3 15.8 14.5 9.1
Means of transport
Mineral products 2.4 1.3 1.0 1.1
Metala, precious stones 4.4 2.8 1.2 0.9
Chamical, rubber 8.9 5.5 3.5 1.7
Tumber, paper, cellulose 0.9 0.5 0.5 0.1
Textiles, footwear 7.6 4.4 4.2 3.7
154
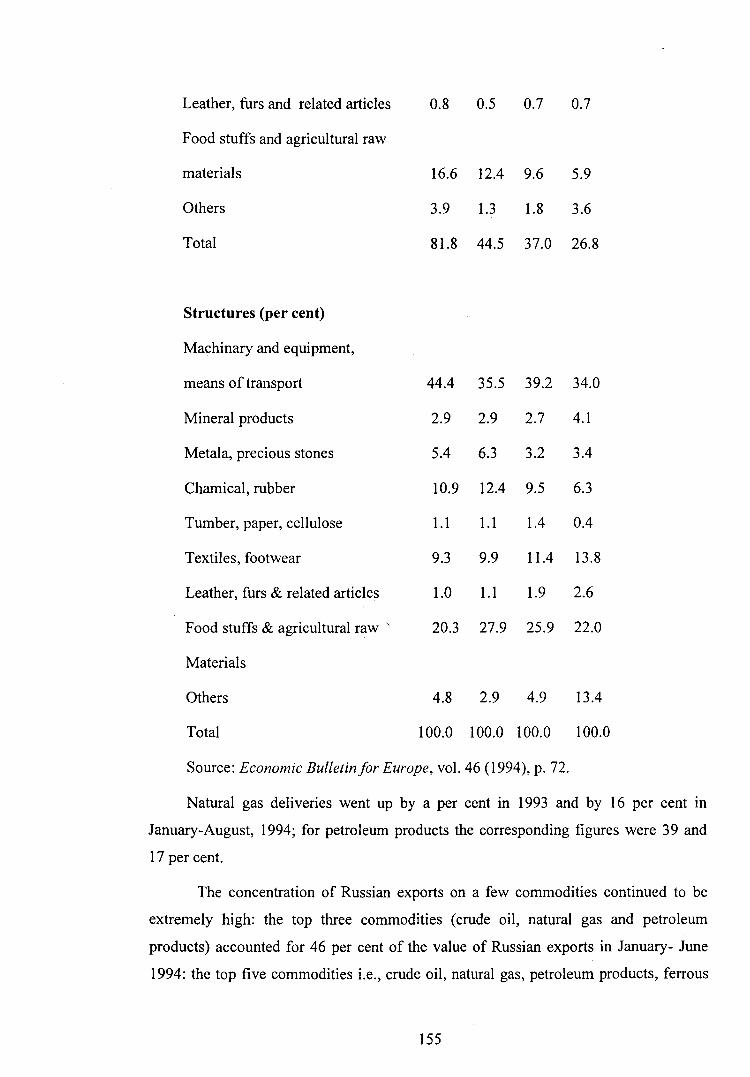
Leather, furs and related articles
Food stuffs and agricultural raw
materials
Others
Total
Structures (per cent)
Machinary and equipment,
means of transport
Mineral products
Metala, precious stones
Chamical, rubber
Tumber, paper, cellulose
Textiles, footwear
Leather, furs & related articles
Food stuffs & agricultural raw '
Materials
Others
Total
0.8 0.5 0.7 0.7
16.6 12.4 9.6 5.9
3.9 1.3 1.8 3.6
81.8 44.5 37.0 26.8
44.4 35.5 39.2 34.0
2.9 2.9 2.7 4.1
5.4 6.3 3.2 3.4
10.9 12.4 9.5 6.3
1.1 1.1 1.4 0.4
9.3 9.9 11.4 13.8
1.0 1.1 1.9 2.6
20.3 27.9 25.9 22.0
4.8 2.9 4.9 13.4
100.0 100.0 100.0 100.0
Source: Economic Bulletin/or Europe, vol. 46 (1994), p. 72.
Natural gas deliveries went up by a per cent in 1993 and by 16 per cent in
January-August, 1994; for petroleum products the corresponding figures were 39 and
17 per cent.
The concentration of Russian exports on a few commodities continued to be
extremely high: the top three commodities (crude oil, natural gas and petroleum
products) accounted for 46 per cent of the value of Russian exports in January- June
1994: the top five commodities i.e., crude oil, natural gas, petroleum products, ferrous
155
metals and diamonds account for 60 per cent. In addition to the above five
commodities, taking aluminum, timber, fish, fertilizers and cars into account, the top
ten account for three quarter of Russian exports.
The other tendency found in case of export of civilian machines & equipment is
that, they have been losing weight within total exports; their share in 1994 is expected
to fall below 5 per cent level15•
However, exports of military equipment came to around $ 3 billion in 1993 97
per cent of total exports of 1993) and will probably reach 4 billion in 1994, the decline
in civilian machinery exports seems to be a structural tendency rather than a temporary
phenomenon. Both demand supply factors play their role.
On the supply side, the domestic output of machinery and equipment registered
the highest contraction among all industrial branches. Russian machinery exports
(consisting mainly of heavy material - and energy intensive machinery) were
traditionally channeled to the CMEA and developing countries. The ex-CMEA market
is now practically lost for Russian machinery shipments, while the developing countries
are also reducing their purchases as Russian exporters are no longer in a position to
offer their products on favourable credit conditions. The main advantage to Russian
machinery export was their cheapness, which offset the low quality and generfllly poor
technical standard of goods. But the strong tendency towards appreciation of the
Rouble in real terms, a considerable increase of domestic energy prices and the
discontinuation of subsidized state credits have wiped out this advantage.
On the import side, the analysis of structural changes at the level of aggregated
commodity group shows three main tendencies, a reduction of machinery imports, a
rising share of consumer gods; and some growth of food imports. Thus the general
trend in import adjustment is that they are becoming more consumer oriented than
producer oriented.
Till late 1994 and the first half of 1995, there was no marked change in the
composition of trade. It remained largely a supplier of raw materials and energy
15 Ibid., p. 73.
156

products. Similarly, according to the custom data, the growth of imports for western
countries was concentrated in the first half of 1995. 16
In the first half of 1996, the combined share of mineral products including fuel
in the total Russian exports was 70 per cent as against 62 per cent at close of 1994. In
terms of value, in the first of 1996, there was growth of 39 per cent in the base
metals/minerals like crude oil, natural gas etc. Exports of precious stones, metals, ores
which accounted for 13 per cent in 1994, fell down to 7.5 percentage points. The most
probable reasons for this fall were high supply prices dictated by the state monopoly on
the domestic market reinforced by high taxes on domestic producers, and a dispute in
the uncut diamond sales deal with De Beers, which temporarily interrupted sales. The
share of machinery and equipment in Russian's exports remained under 3 per cent in
the first half of 1996 which is very close to 1994 figure. (Data: Economic Survey of
Europe, no. 3 (1998), p. 94).
However, in value terms, these commodities were fastest growing commodity
group. Imports of machinery and equipment fell by 15 per cent in value, and their share
in total import by 3 percentage points in the first half of 1996 as compared with the
same period of 1995. Falling imports from the West of some industrial consumer goods
and foodstuffs, including agricultural products, seem to have been partially offset by
increased imports from the CIS region.
During the first half of 1997 as compared with the same periods, the two
outstanding sectoral performers bucking the trend were the mineral products sector and
opticals, precision and medical equipment, which increased in value terms by 12 and
72 per cent, respectively.
In 1998, however, a remarkable departure in the trading of mineral products was
noticed. There was a significant fall of 28 per cent in the value of exports of such
products, which is due to the decline in crude oil process, while the fall in exports of
metal largely reflects weak import demand and lower prices for ferrous metals, nickel
and copper. Exports of precious metals and stones doubled, probably reflecting the
1998 liberalistion of gold exports that allowed Russian banks to exports precious metals
and the 1997 supply agreement between Alrosa, Russia's main diamond producer, and
worlds diamond cartel. (Data Economic Survey of Europe, No.3, 1998, p. 1994-1995).
16 Economic Bulletin for Europe, vol. 47 (1995), p. 67.
157
In 1998, the value of Russia's imports of food rose by almost robust 50 per cent
reflecting increased volumes and continued stagnation of domestic agricultural
production. Imports of machinery and equipment as well as chemicals slowed down
reflecting stagnant aggregate industrial production in Russia in the first half of 1998 as
compared to the period a year back.
OVERALL TRADE PERFORMANCE OF RUSSIAN FEDERATION (1992-1998):
After the break up of the USSR, the Russian Federation found its foreign trade
sector substantially expanded as what had been inter-republic trade within the Soviet
Union, now became external trade. The levels of Russian foreign trade in 1989-90 fell
sharply in the following years suffering from a battery of external and internal shocks
such as the collapse of CMEA in 1991, the disintegration of the Soviet Union and the
break up of the centralized controls over the economy in the absence of an efficient
market mechanism. In 1992, both exports and 'imports fell by 17 per cent. In that year,
the trade performance was affected, above all, by the frequent changes of regulations,
but also by general economic recession that followed price liberalization Exports were
mainly limited by various supply constraints while imports demand fell because of very
high process of important goods in rouble terms. During the second year of economic
reform (1993), exports increased by 4.5 per cent, but imports fell by almost 28 per
cent, mainly because cf sharp cut in cenrtralised imports, which were subsidized from
the state budget.
In the first half of 1994, exports grew even faster than in the previous year.
Moreover imports also started to improve, showing an increase of almost 4 per cent
over the corresponding period of the previous year. 17
During the first half of 1995, as compared with the same period of previous
year, the dollar value of the Russian Federations trade with non-CIS countries grew
very rapidly. The value of Russian exports increased by 39 per cent, growing for the
third consecutive year, while imports grew by 17 per cent, following an increase of 5
per cent in 1994. 18 There was significant value growth in trade with all major partner
17
18 Ibid, p. 62. Ibid, p. 62.
158
groups, including, for the first time since the collapse of the CMAEA, former CMEA
member countries.
However, a significant part of the rise in these dollar trade values reflects the
substantial depreciation of the dollar against other major currencies; hence, in the
absence of aggregate price and volume indices, the interpretations of this apparent
acceleration of trade growth must remain rather uncertain. On a rather tentative
assessment it would appear that export growth indeed accelerated some what in volume
terms, expanding at some 10-12 per cent, where as most of the value growth in imports
probably reflects price changes, volume remaining stagnant.
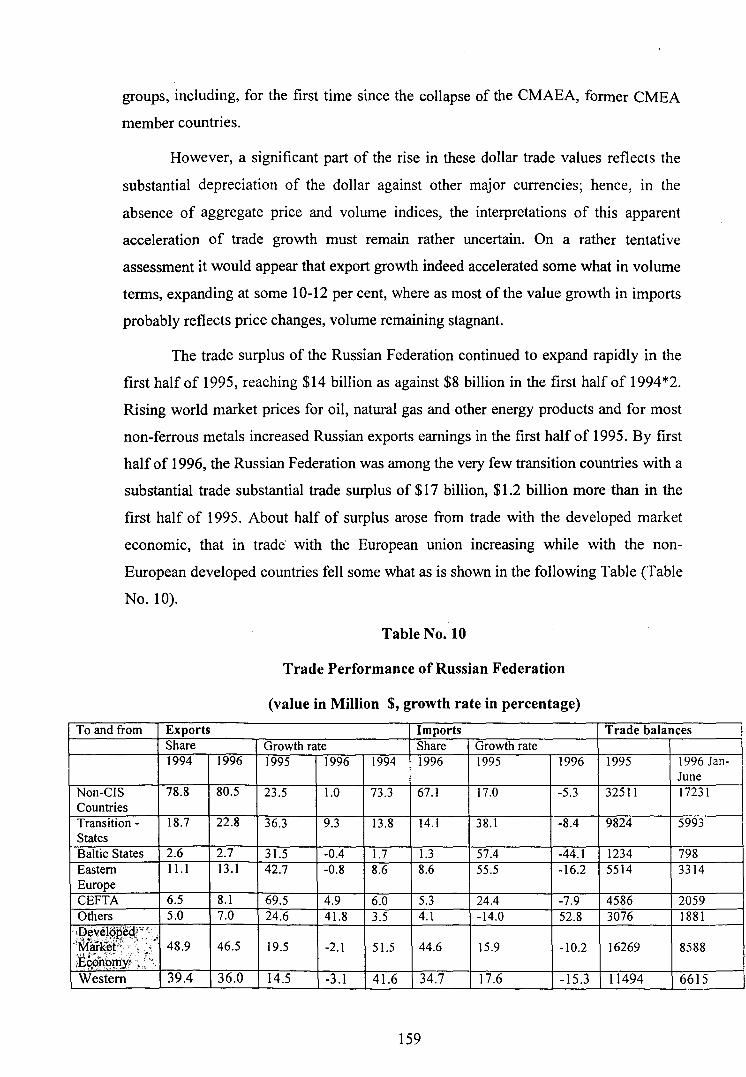
The trade surplus of the Russian Federation continued to expand rapidly in the
first half of 1995, reaching $14 billion as against $8 billion in the first half of 1994*2.
Rising world market prices for oil, natural gas and other energy products and for most
non-ferrous metals increased Russian exports earnings in the first half of 1995. By first
half of 1996, the Russian Federation was among the very few transition countries with a
substantial trade substantial trade surplus of $17 billion, $1.2 billion more than in the
first half of 1995. About half of surplus arose from trade with the developed market
economic, that in trade· with the European union increasing while with the non
European developed countries fell some what as is shown in the following Table (Table
No. 10).
Table No. 10
Trade Performance of Russian Federation
(value in Million $, growth rate in percentage)
To and from Exports Imports Trade balances Share Growth rate Share Growth rate 1994 1996 1995 1996 1994 1996 1995 1996 1995 1996 Jan-
June Non-CIS 78.8 80.5 23.5 1.0 73.3 67.1 17.0 -5.3 32511 17231 Countries Transition - 18.7 22.8 36.3 9.3 13.8 14.1 38.1 -8.4 9824 5993 States Baltic States 2.6 2.7 31.5 -0.4 1.7 1.3 57.4 -44.1 1234 798 Eastern 11.1 13.1 42.7 -0.8 8.6 8.6 55.5 -16.2 5514 3314 Europe CEFTA 6.5 8.1 69.5 4.9 6.0 5.3 24.4 -7.9 4586 2059 Others 5.0 7.0 24.6 41.8 3.5 4.1 -14.0 52.8 3076 1881
·,Deveio~ooY''-:·
·:mgl{~f~~ ~: '; , ·· 48.9 46.5 19.5 -2.1 51.5 44.6 15.9 -10.2 16269 8588 !E9,<>N~¢y! ,,; : Western 39.4 36.0 14.5 -3 .I 41.6 34.7 17.6 -15.3 11494 6615
159
Europe European 33.2 31.0 17.2 -4.6 32.2 33.2 44.5 -15.2 8241 4916 union Germany 8.1 7.5 10.5 7.0 14.7 10.8 15.1 -28.0 -496 543 Others 9.5 10.5 40.1 .}.3 10.0 10.0 8.9 13.6 4775 1973 Developing 11.3 11.3 20.1 -1.0 8.0 8.4 8.4 13.6 6417 2651 countries CIS 21.2 19.5 -0.1 20.6 26.7 32.9 31.3 49.7 720 323 World Total 100.0 100.0 18.5 4.3 100.0 100.0 10.8 7.8 33230 17554
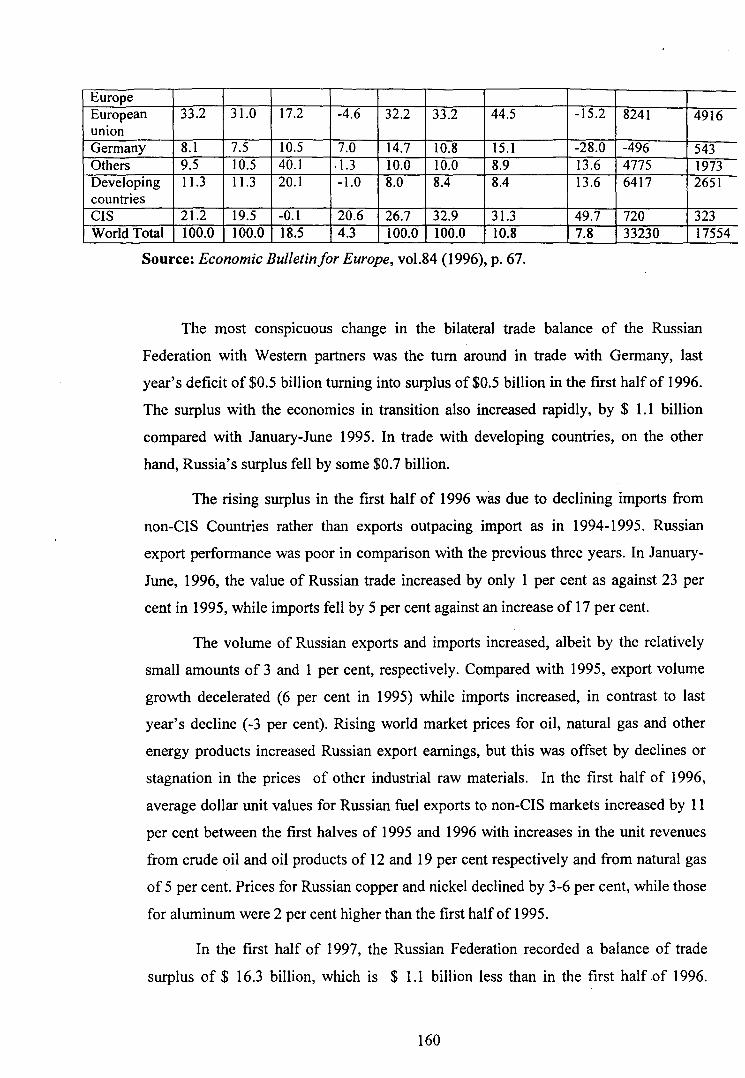
Source: Economic Bulletin/or Europe, vol.84 (1996), p. 67.
The most conspicuous change in the bilateral trade balance of the Russian
Federation with Western partners was the turn around in trade with Germany, last
year's deficit of $0.5 billion turning into surplus of $0.5 billion in the first half of 1996.
The surplus with the economies in transition also increased rapidly, by $ 1.1 billion
compared with January-June 1995. In trade with developing countries, on the other
hand, Russia's surplus fell by some $0.7 billion.
The rising surplus in the first half of 1996 was due to declining imports from
non-CIS Countries rather than exports outpacing import as in 1994-199 5. Russian
export performance was poor in comparison with the previous three years. In January
June, 1996, the value of Russian trade increased by only 1 per cent as against 23 per
cent in 1995, while imports fell by 5 per cent against an increase of 17 per cent.
The volume of Russian exports and imports increased, albeit by the relatively
small amounts of 3 and 1 per cent, respectively. Compared with 1995, export volume
growth decelerated (6 per cent in 1995) while imports increased, in contrast to last
year's decline ( -3 per cent). Rising world market prices for oil, natural gas and other
energy products increased Russian export earnings, but this was offset by declines or
stagnation in the prices of other industrial raw materials. In the first half of 1996,
average dollar unit values for Russian fuel exports to non-CIS markets increased by 11
per cent between the first halves of 1995 and 1996 with increases in the unit revenues
from crude oil and oil products of 12 and 19 per cent respectively and from natural gas
of 5 per cent. Prices for Russian copper and nickel declined by 3-6 per cent, while those
for aluminum were 2 per cent higher than the first half of 1995.
In the first half of 1997, the Russian Federation recorded a balance of trade
surplus of $ 16.3 billion, which is $ 1.1 billion less than in the first half of 1996.
160
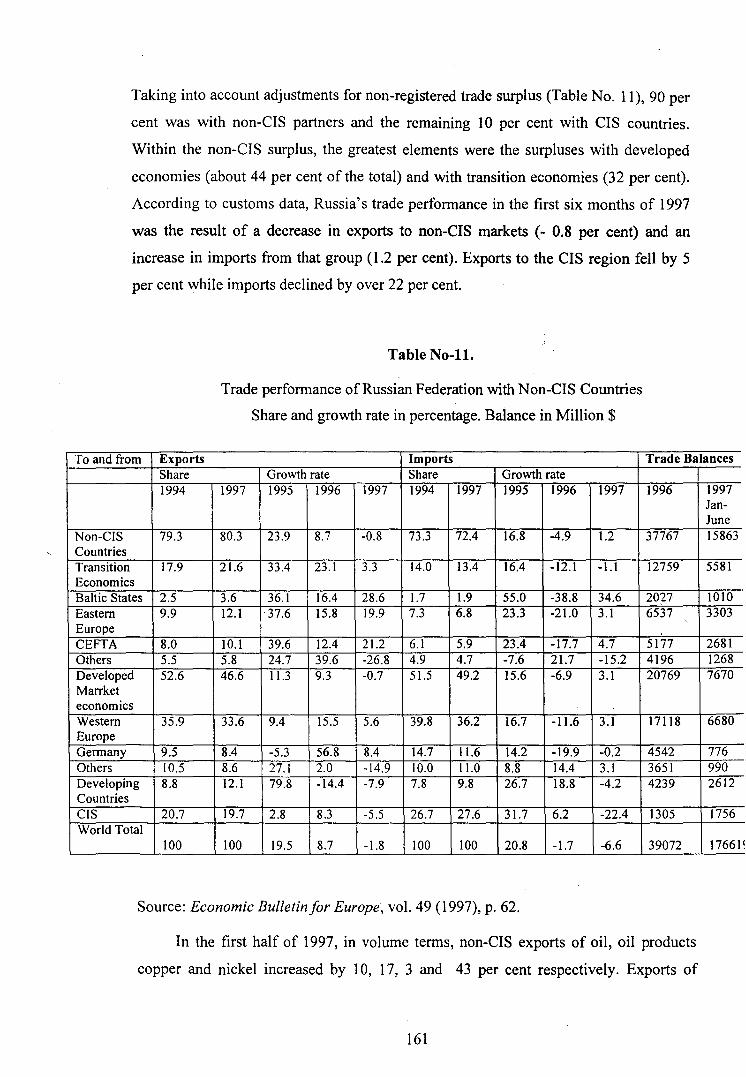
Taking into account adjustments for non-registered trade surplus (Table No. 11 ), 90 per
cent was with non-CIS partners and the remaining 10 per cent with CIS countries.
Within the non-CIS surplus, the greatest elements were the surpluses with developed
economies (about 44 per cent of the total) and with transition economies (32 per cent).
According to customs data, Russia's trade performance in the first six months of 1997
was the result of a decrease in exports to non-CIS markets (- 0.8 per cent) and an
increase in imports from that group (1.2 per cent). Exports to the CIS region fell by 5
per cent while imports declined by over 22 per cent.
Table No-11.
Trade performance of Russian Federation with Non-CIS Countries
Share and growth rate in percentage. Balance in Million $
To and from Exports Imports Trade Balances Share Growth rate Share Growth rate 1994 1997 1995 1996 1997 1994 1997 1995 1996 1997 1996
Non-CIS 79.3 80.3 23.9 8.7 -0.8 73.3 72.4 16.8 -4.9 1.2 37767 Countries Transition 17.9 21.6 33.4 23.1 3.3 14.0 13.4 16.4 -12.1 -1.1 12759 Economics Baltic States 2.5 3.6 36.1 16.4 28.6 1.7 1.9 55.0 -38.8 34.6 20f7 Eastern 9.9 12.1 37.6 15.8 19.9 7.3 6.8 23.3 -21.0 3.1 6537 Europe CEFTA 8.0 10.1 39.6 12.4 21.2 6.1 5.9 23.4 -17.7 4.7 5177 Others 5.5 5.8 24.7 39.6 -26.8 4.9 4.7 -7.6 21.7 -15.2 4196 Developed 52.6 46.6 11.3 9.3 -0.7 51.5 49.2 15.6 -6.9 3.1 20769 Marrket economics Western 35.9 33.6 9.4 15.5 5.6 39.8 36.2 16.7 -11.6 3.1 17118 Europe Germany 9.5 8.4 -5.3 56.8 8.4 14.7 11.6 14.2 -19.9 -0.2 4542 Others 10.5 8.6 27.1 2.0 -14.9 10.0 11.0 8.8 14.4 3.1 3651 Developing 8.8 12.1 79.8 -14.4 -7.9 7.8 9.8 26.7 18.8 -4.2 4239 Countries CIS 20.7 19.7 2.8 8.3 -5.5 26.7 27.6 31.7 6.2 -22.4 1305 World Total
100 100 19.5 8.7 -1.8 100 100 20.8 -1.7 -6.6 39072
Source: Economic Bulletin for Europe, vol. 49 (1997), p. 62.
In the first half of 1997, in volume terms, non-CIS exports of oil, oil products
copper and nickel increased by 10, 17, 3 and 43 per cent respectively. Exports of
161
1997 Jan-June 15863
5581
1010 3303
2681 1268 7670
6680
776 990 2612
1756
17661 ~
natural gas, coal, aluminum decreased by 7, 20 and 0.7 per cent respectively. In the first
half of 1997, Russia's average exports prices for energy products such as coal, oil and
oil products did not change much relative to 1996. In contrast, the natural gas export
price increased by over 50 per cent. Interestingly, the price increases for coal and
natural gas were offset by the export volume declines noted above. With respect to
metals, which are Russian's second most important source of export earnings, average
export prices were lower than the first half of 1996, Iron, copper, nickel and aluminum·
prices were 12.7, 12, 9.3 and 9.2 per cent lower respectively, in the first six months of
1997.
In the first half of 1998, in value terms, Russia's exports to non-CIS markets fell
by 15 per cent. Virtually all ofthe decline can be attributed to lower prices for Russia's
key exports as the overall volume of non-CIS exports was only slightly lower. On the
import side, thevalue of Russia's non-CIS purchases continued to grow albeit at a
lower rate than in 1997. Average import prices fell by 5 and 12 per cent respectively,
compared with the same periods of 1997, stimulating increased import demand. The
increased volume of imports from Non-CIS markets, while very high in the first quarter
-32 per cent slowed down to 17 per cent in the second quarter. Merchandise trade
surplus with non-CIS countries was roughly half of what it was in first half of 1997.
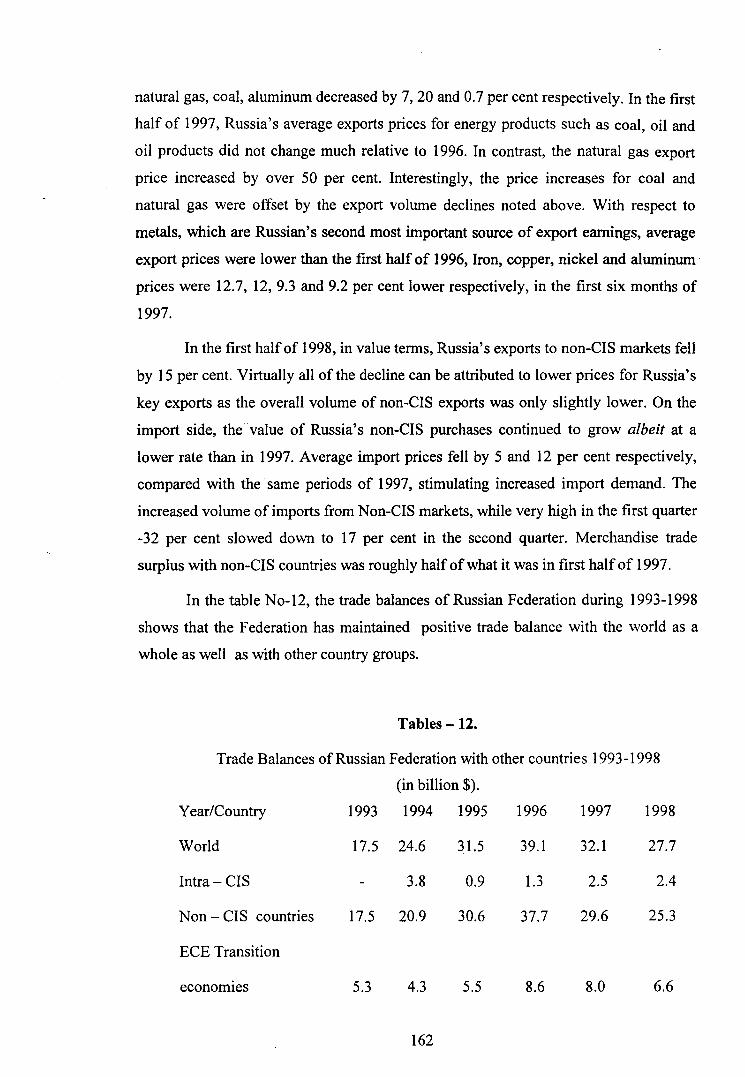
In the table No-12, the trade balances of Russian Federation during 1993-1998
shows that the Federation has maintained positive trade balance with the world as a
whole as well as with other country groups.
Tables -12.
Trade Balances of Russian Federation with other countries 1993-1998
(in billion$).
Year/Country 1993 1994 1995 1996 1997 1998
World 17.5 24.6 31.5 39.1 32.1 27.7
Intra- CIS 3.8 0.9 1.3 2.5 2.4
Non- CIS countries 17.5 20.9 30.6 37.7 29.6 25.3
ECE Transition
economies 5.3 4.3 5.5 8.6 8.0 6.6
162

Eastern Europe 4.6 3.3 4.3 6.6 5.9 5.0
Developed market
economies 10.2 12.8 15.6 18.8 13.6 12.6
Euporian Union 8.4 6.9 8.4 11.5 8.4 7.5
Developing Countries 2.0 3.8 9.4 10.3 8.0 6.2
Source: Economic Survey of Europe, No.3 (1998), P. 73
Even though, there were ups and down in the trade with certain region or among
the commodities, the overall trade performance has shown a marked improvement
following the reforms.
ROLE OF BARTER TRANSACTIONS IN RUSSIA'S FOREIGN TRADE: .
Barter transactions have played a significant role in Russia's trade since 1991,
when state control over foreign tra,de was eased and the initial stabilization and first
reform attempts resulted in an acute financial squeeze on Russian enterprises. Barter
trade offered possibilities to circumvent foreign exchange constraints and the
advantage of huge differentials between domestic and international prices. In addition,
the attractiveness of barter in 1992 was boosted, in the case of barter exports, by the
exemption from the compulsory surrender of foreign exchange at a below-market rate
(55 R/$), but this privilege lost its attraction when a single floating rate was introduced
in July 1992. (Economic Bulletin/or Europe, Vol.46 (1994), P.73)
Barter export constituted only 30 per cent of the total exports of the commodity
group in 1992 while barter import accounted for only 9.1 per cent. Among the
commodity group's, it is the mineral products including fuel, which constituted 25 per
cent of the total.
163
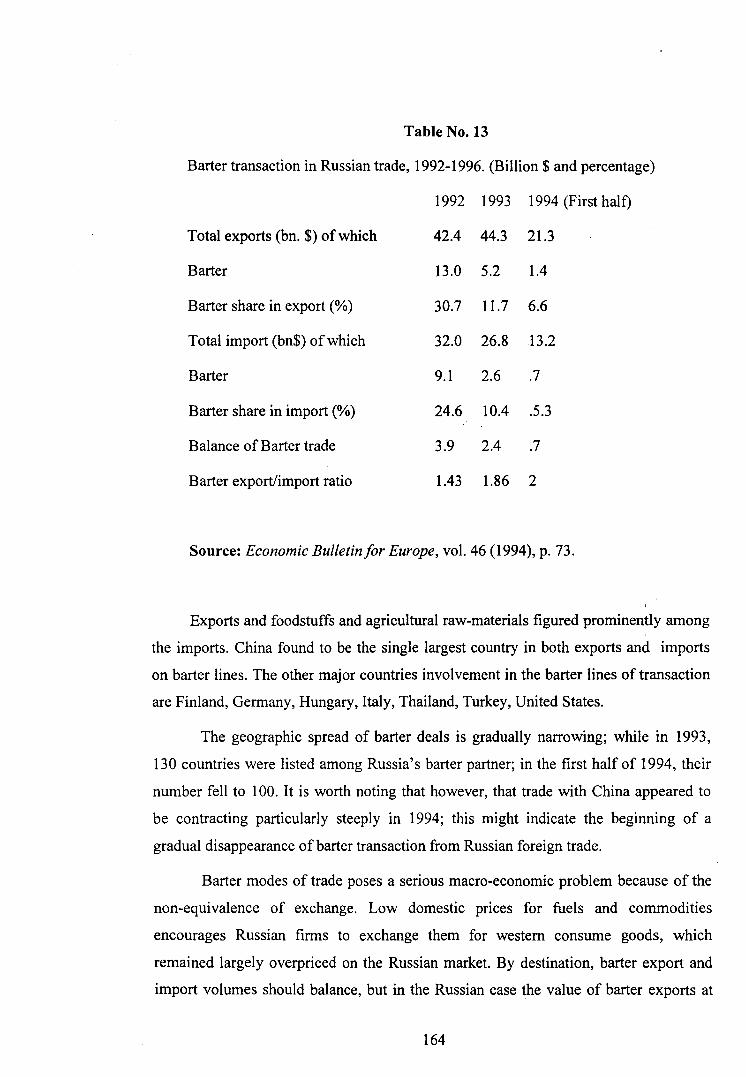
Table No.13
Barter transaction in Russian trade, 1992-1996. (Billion $ and percentage)
1992 1993 1994 (First half)
Total exports (bn. $)of which 42.4 44.3 21.3
Barter 13.0 5.2 1.4
Barter share in export (%) 30.7 11.7 6.6
Total import (bn$) of which 32.0 26.8 13.2
Barter 9.1 2.6 .7
Barter share in import (%) 24.6 10.4 .5.3
Balance of Barter trade 3.9 2.4 .7
Barter export/import ratio 1.43 1.86 2
Source: Economic Bulletin/or Europe, vol. 46 (1994), p. 73.
Exports and foodstuffs and agricultural raw-materials figured prominently among
the imports. China found to be the single largest country in both exports and imports
on barter lines. The other major countries involvement in the barter lines of transaction
are Finland, Germany, Hungary, Italy, Thailand, Turkey, United States.
The geographic spread of barter deals is gradually narrowing; while in 1993,
130 countries were listed among Russia's barter partner; in the first half of 1994, their
number fell to 100. It is worth noting that however, that trade with China appeared to
be contracting particularly steeply in 1994; this might indicate the beginning of a
gradual disappearance of barter transaction from Russian foreign trade.
Barter modes of trade poses a serious macro-economic problem because of the
non-equivalence of exchange. Low domestic prices for fuels and commodities
encourages Russian firms to exchange them for western consume goods, which
remained largely overpriced on the Russian market. By destination, barter export and
import volumes should balance, but in the Russian case the value of barter exports at
164
world market prices usually exceeded the value of imports by a large margin. the
resulting losses for the national income are important. The government tried to reduce
the scope of barter transactions by exposing them to higher export taxation: in 1992,
were 15 per cent and later 30 per cent, higher than for regular transactions. From 1st
January 1993, the tax margin was raised to 50 per cent. However, from 1 November
1993, the separate export tariff for barter transactions was abolished under the law on
customs Tariffs which established uniform tariff rates partly as a result of these
measures, but also because of the gradual convergence of relative prices in Russia and
in international markets, the share of barter deals in over all trade flows has been
decreasing as could be seen on Table No-13.
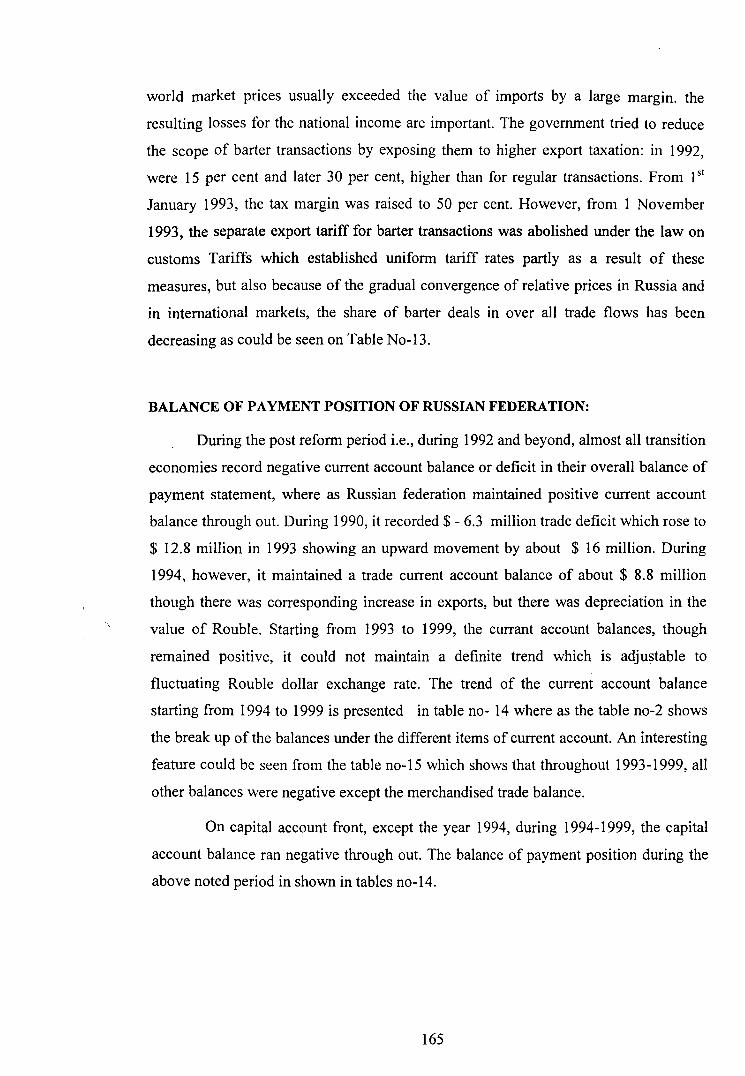
BALANCE OF PAYMENT POSITION OF RUSSIAN FEDERATION:
During the post reform period i.e., during 1992 and beyond, almost all transition
economies record negative current account balance or deficit in their overall balance of
payment statement, where as Russian federation maintained positive current account
balance through out. During 1990, it recorded $ - 6.3 million trade deficit which rose to
$ 12.8 million in 1993 showing an upward movement by about $ 16 million. During
1994, however, it maintained a trade current account balance of about $ 8.8 million
though there was corresponding increase in exports, but there was depreciation in the
value of Rouble. Starting from 1993 to 1999, the currant account balances, though
remained positive, it could not maintain a definite trend which is adjustable to
fluctuating Rouble dollar exchange rate. The trend of the current account balance
starting from 1994 to 1999 is presented in table no- 14 where as the table no-2 shows
the break up of the balances under the different items of current account. An interesting
feature could be seen from the table no-15 which shows that throughout 1993-1999, all
other balances were negative except the merchandised trade balance.
On capital account front, except the year 1994, during 1994-1999, the capital
account balance ran negative through out. The balance of payment position during the
above noted period in shown in tables no-14.
165
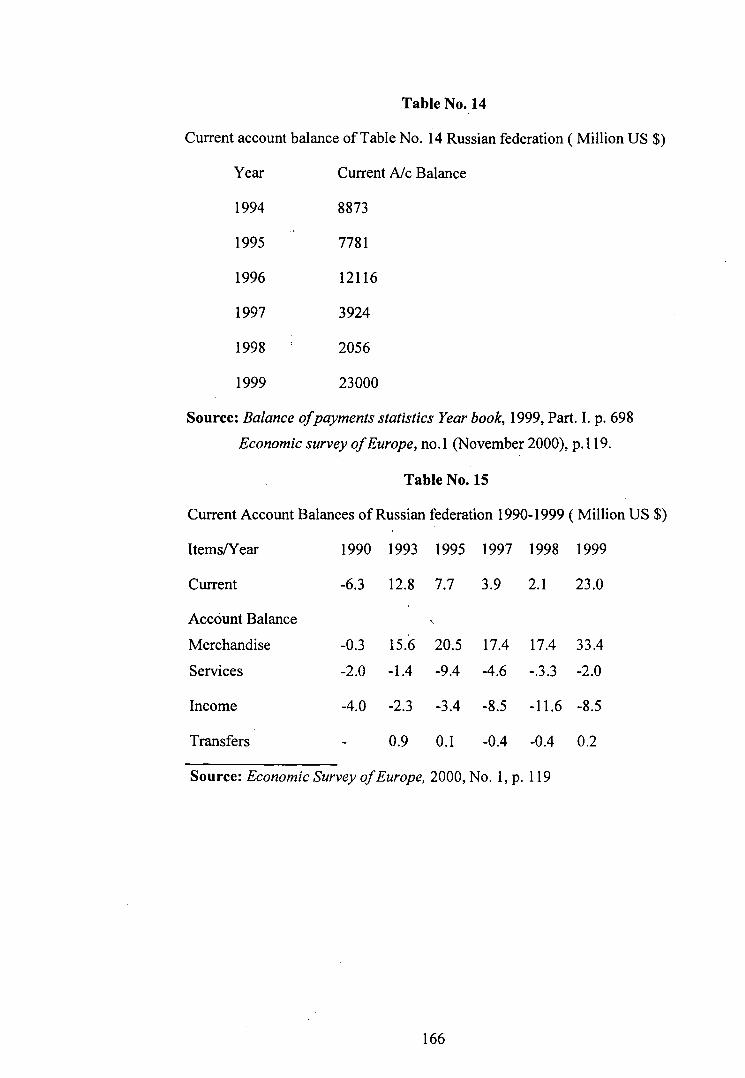
Table No. 14
Current account balance ofTable No. 14 Russian federation (Million US$)
Year Current Nc Balance
1994 8873
1995 7781
1996 12116
1997 3924
1998 2056
1999 23000
Source: Balance ofpayments statistics Year book, 1999, Part. I. p. 698
Economic survey of Europe, no.1 (November 2000), p.119.
Table No.15
Current Account Balances of Russian federation 1990-1999 ( Million US $)
Items/Year 1990 1993 1995 1997 1998 1999
Current -6.3 12.8 7.7 3.9 2.1 23.0
Account Balance ',
Merchandise -0.3 15.6 20.5 17.4 17.4 33.4
Services -2.0 -1.4 -9.4 -4.6 -.3.3 -2.0
Income -4.0 -2.3 -3.4 -8.5 -11.6 -8.5
Transfers 0.9 0.1 -0.4 -0.4 0.2
Source: Economic Survey of Europe, 2000, No. I, p. 119
166
Tables No-16.
Exchange rates of Russian Federation
(Annual average, national currency unit per dollar)
Year Rouble per $
1980 0.65
1987 0.63
1988 0.61
1989 0.63
1990 0.59
1991 1.74
1992 192.75
1993 927.46
1994 2204
1995 4559
1996 5121
1997 5785
1998 9.71
1999 24.62
Source: Economic Survey of Europe, 2000, No. 1, p. 238.
167
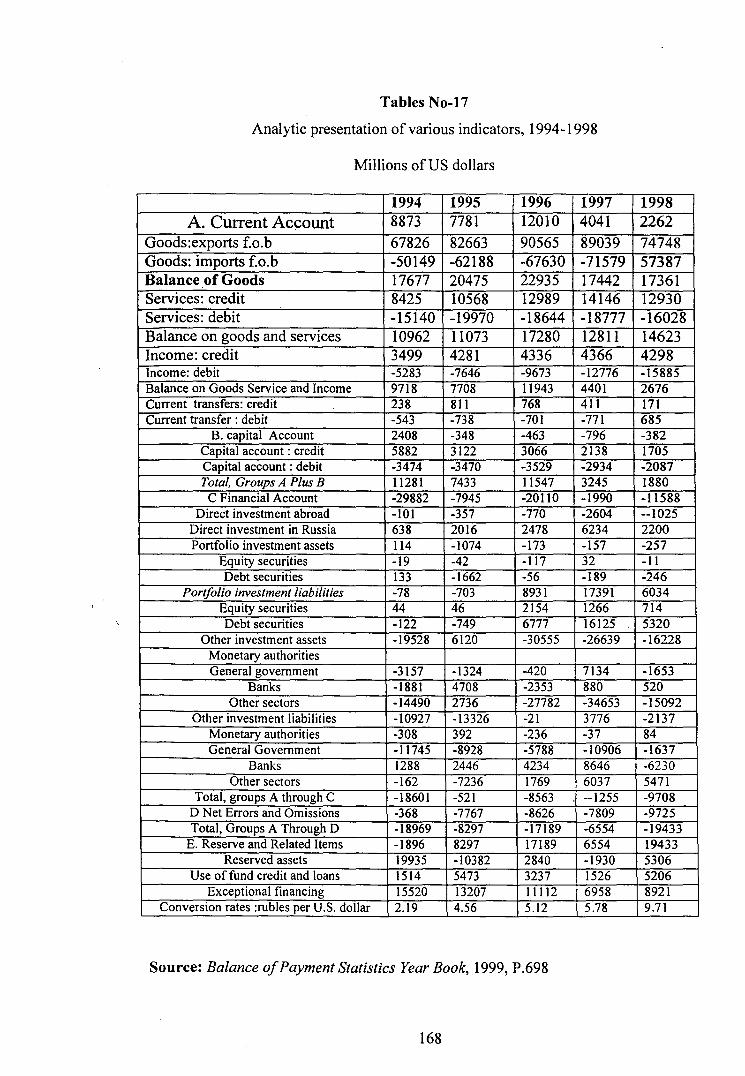
Tables No-17
Analytic presentation of various indicators, 1994-1998
Millions of US dollars
1994 1995 1996 1997 1998 A. Current Account 8873 7781 12010 4041 2262
Goods:exports f.o.b 67826 82663 90565 89039 74748 Goods: imports f.o.b -50149 -62188 -67630 -71579 57387 Balance of Goods 17677 20475 22935 17442 17361 Services: credit 8425 10568 12989 14146 12930 Services: debit -15140 -19970 -18644 -18777 -16028 Balance on goods and services 10962 11073 17280 12811 14623 Income: credit 3499 4281 4336 4366 4298 Income: debit -5283 -7646 -9673 -12776 -15885 Balance on Goods Service and Income 9718 7708 11943 4401 2676 Current transfers: credit 238 811 768 411 171 Current transfer : debit -543 -738 -701 -771 685
B. capital Account 2408 -348 -463 -796 -382 Capital account : credit 5882 3122 3066 2138 1705 Capital account : debit -3474 -3470 -3529 -2934 -2087 Total, Groups A Plus B 11281 7433 11547 3245 1880
C Financial Account -29882 -7945 -20110 -1990 -11588 Direct investment abroad -101 -357 -770 -2604 --1025
Direct investment in Russia 638 2016 2478 6234 2200 Portfolio investment assets 114 -1074 -173 -157 -257
Equity securities -19 -42 -117 32 -11 Debt securities 133 -1662 -56 -189 -246
Portfolio investment liabilities -78 -703 8931 17391 6034 Equity securities 44 46 2154 1266 714 Debt securities -122 -749 6777 16125 5320
Other investment assets -19528 6120 -30555 -26639 -16228 Monetary authorities General government -3157 -1324 -420 7134 -1653
Banks -1881 4708 -2353 880 520 Other sectors -14490 2736 -27782 -34653 -15092
Other investment liabilities -10927 -13326 -21 3776 -2137 Monetary authorities -308 392 -236 -37 84 General Government -11745 -8928 -5788 -10906 -1637
Banks 1288 2446 4234 8646 -6230 Other sectors -162 -7236 1769 6037 5471
Total, groups A through C -18601 -521 -8563 --1255 -9708 D Net Errors and Omissions -368 -7767 -8626 -7809 -9725 Total, Groups A Through D -18969 -8297 -17189 -6554 -19433
E. Reserve and Related Items -1896 8297 17189 6554 19433 Reserved assets 19935 -10382 2840 -1930 5306
Use offund credit and loans 1514 5473 3237 1526 5206 Exceptional financing 15520 13207 11112 6958 8921
Conversion rates :rubles per U.S. dollar 2.19 4.56 5.12 5.78 9.71
Source: Balance of Payment Statistics Year Book, 1999, P.698
168
EXCHANGE RATE PROBLEM: FIXED V/S FLEXIBLE RATE:
Having shed light on current account trade balances of the last few years, the
most important segment of balance of payment statement, the next pertinent question
that needs to be answered is the sustainability of the current account balance (surplus)
given the pace and parameters of trade reforms. Exchange rate volatility has attributed
inter alia other factors, towards the fluctuations of current account surplus (CAS).
Therefore, a special care needs to be attached to the exchange rate problems to even out
any abnormal volatility of roubles in order to allow smooth trade operation.
On August 17, 1998 the Russian government announced the widening of the
exchange rate band vis-a vis the US$, which in fact meant the giving up of the
exchange rate target and the introduction of flexi~le exchange rates. 19 At the same time
a moratorium of external debts and the imposition of capital account controls were
decided. The failure of monetary system and the insolvency of the government have
been the result of a deep crisis of the financial sector which had long been apparent, but
nevertheless surprised investors by its severity. The dramatic flight of the rouble might
immediately lead to a new era of hyper inflation. This ominous situation provides the
background for the revising discussion about what would constitute an adequate
exchange rate system.
In the countries with a weak financial sector, there is a fatal trade-off between the
possible import of macro-economic stabilisation via a nominal exchange rate peg and
the vulnerability to speculative attacks that can only be excluded in a region with
flexible exchange rates. Past proposals that aimed at mitigating this trade-off have been
ignored by politicians because they seemed to be too complicated or simply because the
underlying monetary system was unpopular at the time. On trade and international
economy sector front, to break the vicious circle of lack of credibility, inflationary
expectations and non-sustainability, the question there arises is as to which exchange
rate system would be the best. The following few paragraphs will be devoted to this
end.
19 Axel Jochem, Currency Board and Crawling Peg, Jntereconomics, Vol.33, No.6 (1998), p.289.
169

Fixed or Flexible exchange Rates:
Fixed exchange rates are often supposed to support the credibility of the central
bank, because they reduce its discretionary attitude and facilitate the verification of its
announcements.20 This aspect is of particular importance in countries with lack of
reputation and many exceed the efficiency loss due to restrained flexibility. However,
an exchange rate target is not per se more credible than an inflation target or a
quantitative monetary target. The import of reputation from a foreign central bank
postulates the apparent ability and willingness of the monetary authority to maintain
and to defend the pre announced parity. Consequently, the success of nominal exchange
rate peg is tied to compliance with some necessary per-conditions
Pre conditions for working of fixed exchange rate (FER):
The country must have at its disposal sufficient reserves in the reference currency
in order to guarantee the technical sustainability of the exchange rate targets. Secondly,
prices should be sufficiently flexible on all markets. Finally, the current account has to
be widely liberalized and the share of trade in GDP has to be sufficiently large.
Otherwise, the level of the peg will be too short to flaxibilise domestic prices.
Certainly, none of these criteria are met by Russia or most ofthe countries in transition.
Can 'currency Board' be a Solution ?
Currency Board enjoy growing support among politicians and can claim recent
success in Argentina and some small countries in transition. The principal idea of
currency board is to re(gain) · credibility by giving up a major part of national
sovereignty to another country with a better reputation. Hence, a currency board is a
very rigorous way of "tying one's hand". This is done by renouncing any discretionary
national monetary policy and introducing a special kind of "currency substitution".
Domestic coins and bills are issued only in exchange for the foreign reserve currency,
i.e the ratio of foreign exchange to domestic currency in circulation never falls below
1:1. The advantage of this procedure is two fold.
First, a currency board will always ensure the technical sustainability of a pre
announced (and usually constitutionally prescribed) exchange rate target. While a
speculative attack may exhaust the foreign reserves of a central bank and force it to
20 Ibid, p. 289.
170
float the exchange rate or to restrict convertibility, a currency board can from a
theoretical point of view redeem its liabilities until the very last coin. Obviously, this
fact will considerably raise the credibility of the monetary system. The second
advantage of a currency board is often overlooked, but of special importance for
countries with an unsound financial sector: a currency board is quite easy to handle and,
hence, economises on the scarce factor " banking down-how". Experts can be
employed to mange the problem of outstanding loans and to establish efficient banking
supervision in stead of dealing with the control of the money supply. On the other side
of the story, however, visualises the system to be weak in so far as currency boards
cannot function as a h~nder of last resort(LLR). 21 Secondly, the costs of adjustment
under currency board is substantial in an environment of high inflation differential
compared to the anchor currency, which can be classified as a special case of price
rigidity. An excessive increase in domestic prices leads to an appreciation of the real
exchange rate that cannot be corrected by a nominal devolution. Consequently, the
country suffers a continual loss of international competitiveness which stops only when
inflation differences have disappeared. The process of disflation may be rather tedious
and cause substantial social costs undermining political sustainability. This aspect
seems to be extremely important in Russia.
Where the population's readiness to accept further privations and its confidence
in the government are very limited. Thirdly, currency board is ,rather expensive as the
CB hasto buy non-interest bearing foreign currency as against the Central Bank's (CB)
interest bearing assests.
A Mid Way Solution, Smoothing Adjustment by Crawling Peg:
A crawling peg is situated somewhere between fixed and flexible exchange
rates. The continual rise of the central rate allows for an adjustment of inflation
differentials, but only along a predetermined, non-stochastic path. Allowing for
inflation rate differences does not rule out the possibility of using the exchange rate for
macro-economic stabilization. The idea behind a crawling peg is to stubilise inflation
first and reduce it later. The annual depreciation rate should be gradually reduced and
finally disappear.
21 Ibid, p. 290.
171

Besides an average trend component, in some countries, the nominal exchange
rate can float within a limited area around the central rate in order to react to short-term
disturbances. If this additional flexibility exists, the exchange rate region is called a
crawling band. Until August, 16, 1998, Russia had tied the Rouble to the US $ by a
crawling band with a margin of ±.5%.22 As history has shown, a crawling band or a
crawling peg may support the political sustainability of the exchange rate target, but
they cannot guarantee its technical sustainability as long as the stock of foreign
exchange in the central bank's balance falls short of domestic currency in circulation.
When in August 1998, private expectations anticipated a devaluation of the Rouble in
the near future, the mechanism of self-fulfilling prophecies was set in motion,· a
mechanism which can only be stopped by the incontestable competence of the
monetary authority to defend the exchange rate target.
Combining Currency Board and Crawling Peg :
Although at first glance a crawling peg would appear to rule out the
simultaneous implementation of a currency board, this is not in fact the case. The trade
off between technical and political sustainability can be solved by combining both
instruments, i.e by backing the rouble with US$, but allowing for a continual pre
announced devaluation.
In an orthodox currency board system the issuing of domestic currency
necessitates a balance of payments surplus that can be realised by positive current
account and/or net capital inflows. The currency board then absorbs the accompanying
supply of foreign exchange and in tum issues domestic currency. The combination of a
crawling peg opens a third source of money creation. Now the continual appreciation of
foreign assets is accompanied by a steady increase in national money supply.
Summarising, the combination of a currency board with a crawling peg seems to
attenuate the major objections against the individual exchange rate regimes. On the one
hand, the complementing implementation of both instruments reduces the social and
fiscal costs which are usually associated with a currency Board. By avoiding a drastic
fall in the real exchange rate and a severe loss of seigniorage, political sustainability is
strengthened. On the other hand, the renunciation of any discretionary attitude and
complete coverage of domestic currency circulation by foreign exchange sustainability
22 Ibid, p. 292.
172
of the system in comparison with currently practiced crawling peg regimes, which do
without the full coverage of domestic currency by the reference currency.
Implementation Problems:
When the implementation of a "crawling peg currency" has in principle been
decided, the next question concerns the choice of the appropriate anchor currency. Two
aspects have to be taken into account. First, the reference currency has to enjoy an
excellent reputation if the important macro-economic stability is not to be damned to
failure from the very beginning. Second, special attention should be paid to the real
exchange rate which is the sum of a countries bilateral real exchange rates, weighted by
the individual shares in its foreign trade. From this point of view, the ideal anchor
currency would be not a single currency, but a currency basket that reflects the
countries foreign trade structure. However, a currency board would be obligated to
exchange any currency of the basket and could thus maintain the constant relationship
to all others only by additional market interventions. This could cause a substantial
transaction cost and damage its character as a pure currency board without monetary
instruments.
If bilateral trade relation are taken as the criterion for the choice of the anchor
currency, the E'uro,,will be the optimal peg for the rouble. In 1996 more than 30 per
cent of Russian's exports and imports were transacted with the European Union, states
only had a share of about five per cent of Russia's foreign trade. 23
In order to guarantee the full coverage of roubles by users, the International
Monetary Fund (IMP) should provide financial aid in the form of a stabilistion fund as
the leading industrial countries did in the case of Poland in 1990s. The risk of abuse by
the Russian Government can be reduced and the credibility of the currency board
enhanced if only the liquidity reserve and a possible surplus reserve are physically
placed in Russia while the fund holds the investment reserve on trust.
23 Ibid, p. 293.
173
Better choice for Russia :
The above story has shown that from an economic point of view there are good
arguments to peg the Rouble to the Euro by a currency board and to smooth adjustment
by a crawling peg. For this, Russian politicians would hence be well advised to promote
trade liberalisation in stead of reverting to convertibility restraints and other
protectionist measures which are being improved to delay urgently delayed reforms.
Next, the drastic devaluation of the rouble is not the cause but the consequence
of the current financial crisis. The implementation of new monetary rules cannot
replace the fundamental reorganization of the financial sector. As long as the settlement
of private and public liabilities is not guaranteed, Russia will not succeed in regaining
reputations which is a pre-requisite for attracting international investment and
preventing capital flight.
Finally, the implementation of a currency board entails the transfer of national
sovereignty to the central bank which issues the reference currency in today's Russia.
This may encounter heavy political resistance. However, even in the past, when Russia
practiced a crawling bond vis-a-vis the Dollar, the sovereignty of the central bank was
limited. As long as the monetary authority follows an exchange rate target, it can
control money supply only in the short-run, in the long run. Just as in a currency board
system, the circulation of domestic currency board system, the circulation of domestic
currency is determined by the balance of payments. The 'loss of sovereignty will hence
be loss than may appear at the first glance.
The reform period is too short to conclude any thing about the impact of the
reforms on the trade front. Taken the parameters of openness into account, Russian
federation is still in the preliminary stage of trade liberalisation. However, the hitherto
undertaken reformed measures has had positive impact on the performance of the trade
sector. This is also very much contrasting with the fact that the large share of Russia's
exports taken up by raw materials, state, the facts can be expected to retain its influence
in the sphere of foreign trade for a quite some time to come. As could be seen from the
foregoing analyses the commodity structure of the trade of Russian Federation has not
gone a drastic change for the reasons of very infancy of the reformed institutions to
cope up with the changing environment. While oil, fuel and natural minerals and raw
174
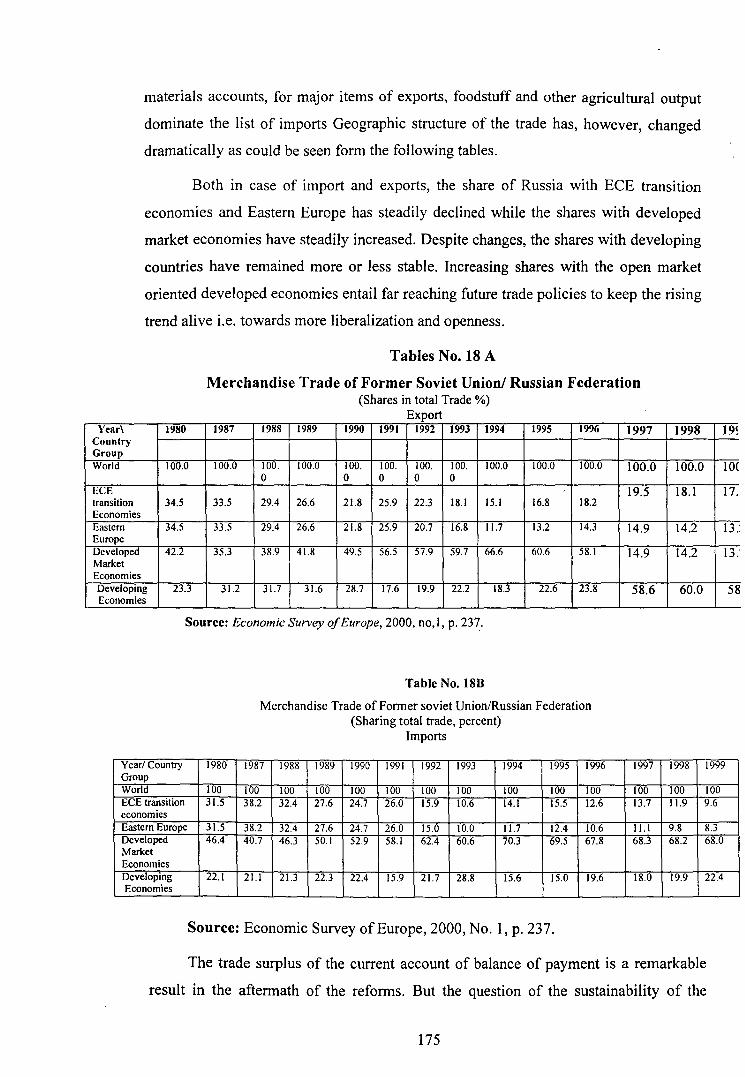
materials accounts, for major items of exports, foodstuff and other agricultural output
dominate the list of imports Geographic structure of the trade has, however, changed
dramatically as could be seen form the following tables.
Both in case of import and exports, the share of Russia with ECE transition
economies and Eastern Europe has steadily declined while the shares with developed
market economies have steadily increased. Despite changes, the shares with developing
countries have remained more or less stable. Increasing shares with the open market
oriented developed economies entail far reaching future trade policies to keep the rising
trend alive i.e. towards more liberalization and openness.
Year\ 1980 Country Group World 100.0
ECE transition 34.5 Economies Eastern 34.5 Europe Developed 42.2 Market Economies Developing 23.3 Economies
Tables No. 18 A
Merchandise Trade of Former Soviet Union/ Russian Federation (Shares in total Trade%)
Export 1987 1988 1989 1990 1991 1992 1993 1994 1995 1996 1997
100.0 100. 100.0 100. 100. 100. 100. 100.0 100.0 100.0 100.0 0 0 0 0 0
19.5 33.5 29.4 26.6 21.8 25.9 22.3 18.1 15.1 16.8 18.2
33.5 29.4 26.6 21.8 25.9 20.7 16.8 11.7 13.2 14.3 14.9
35.3 38.9 41.8 49.5 56.5 57.9 59.7 66.6 60.6 58.1 14.9
31.2 31.7 31.6 28.7 17.6 19.9 22.2 18.3 22.6 23.8 58.6
Source: Economic Survey of Europe, 2000, no, I, p. 237.
Year/ Country Group World ECE transition economies Eastern Europe Developed Market Economies Developing Economies
1980
100 31.5
31.5 46.4
22.1
Table No. 18B
Merchandise Trade of Former soviet Union/Russian Federation (Sharing total trade, percent)
Imports
1987 1988 1989 1990 1991 1992 1993 1994 1995 1996
100 100 100 100 100 100 100 100 100 100 38.2 32.4 27.6 24.7 26.0 15.9 10.6 14.1 15.5 12.6
38.2 32.4 27.6 24.7 26.0 15.0 10.0 11.7 12.4 10.6 40.7 46.3 50.1 52.9 58.1 62.4 60.6 70.3 69.5 67.8
21.1 21.3 22.3 22.4 15.9 21.7 28.8 15.6 15.0 19.6
Source: Economic Survey ofEurope, 2000, No.1, p. 237.
1997
100 13.7
11.1 68.3
18.0
1998
100.0
18.1
14.2
14.2
60.0
1998
100 11.9
9.8 68.2
19.9
19~
10(
17.
13.
13.
58
1999
100 9.6
8.3 68.0
22.4
The trade surplus of the current account of balance of payment is a remarkable
result in the aftermath of the reforms. But the question of the sustainability of the
175
surplus in comparison to the overall economic performance is however very difficult to
answer in view of lack of consistent data and indication of related variables. Trade with
the East European countries have deteriorated and this needs revival. It, therefore, has
to bring greater liberalisation, convertible currencies and world market prices into its
key determinants.
Regarding exchange rate problem, the best course of action for Russia is to peg
Rouble against the Euro which will not only create favorable investment climate and
prevent capital flight, but also the fluctuations in trade surplus could be minimised.
In addition to the above, a set of tariff and non-tariff measures are inevitable to
consolidate and strengthen the trade within the CIS partners which may be outlined as
follows.
Any national trade policy requires the definition of customs borders and
customs areas. This process is not yet completed in the CIS states including Russia.
Intra-CIS and extra-CIS trade flows are treated somewhat differently but there is no
official preferential trading arrangement, no free-trade area with specification of rules
of origin, and no customs union with a common external trade policy. Declarations
given at CIS summits concerning co-operation· in an economic community are vague
and without substance. The implementation of policies with respect to intra-CIS trade
relations often appears inconsistent and contradictory. Russian imports from other CIS ',
states, for instance are exempted from import tariffs and VAT while strict controls still
continue to exist for exports. There are a number of arguments for the case of nationally
autonomous trade policies in line with nationally autonomous monetary policies. Very
importantly, transparency is improved and national trade policies can be used to
implement different national policy objectives and to adjust to different economic
structures. Should countries decide to merge economically, for instance, by accepting
the Russian rouble as the sole legal tender, national trade policies would have to be
revised in the light of a customs union or at least a free-trade area with the Russian
Federation. Such a process seems to be under way since 1993 as a result of ill-fated
experiments with autonomous monetary policies in many CIS states.
Trade policies are instruments to achieve policy targets. Which targets should
be achieved in individual CIS states is not clear. Protection of domestic industries,
export promotion, and revenue generation are three possible targets which might
176
require different trade policies. To maximise revenues, for instance, tariffs schedules
should theoretically be designed according to the different price elasticities of demand
(low tariffs on products with elastic demand, higher tariffs on products fasting inelastic
demand). However, such differentiated tariffs are very difficult to implement in an
early stage of "institutional maturity" and they usually conflict with the target of neutral
protection, which means that there should be no discrimination between import
competing industries. This holds as differentiated nominal tariffs with tariff levels
selected on grounds of price elasticities would lead to higher effective protection than
nominal protection and to higher protection than nominal protection of finished goods
industries than of intermediates (the former usually facing higher price elasticties than
the latter). Thus, following the revenue target might lead to the same pattern of
inefficient import substitution in industries close to the consumers as in many
developing countries in the sixties and seventies. It is well-known that the target of
revenue generation plays an important role in low-income countries with weak tax
administration and with an insufficient base either for direct taxation or for taxing
domestic rather than international transactions. Therefore, some low income CIS states,
for instance in Central Asia or in the Caucasian region, could be tempted to operate
domestic trade policies basically under the target of revenue generation, by issuing
differentiated tariff schedules with the effect of larger spreads of tariff equivalents.
Such differentiation would conform with endogenous tariff theory, as the success of
lobbying is expected to vary across sectors if the sectors have different political and
economic leverage. Given the early stage of institutional reforms, there is still scope for
avoiding an inadequate focus on fiscal objectives. The first-best solution would be to
develop domestic revenue sources (VAT, excise taxes, taxes on income or fortune), and
the second-best to meet the revenue target by minimizing tariff spreads or even by
taxing imports uniformly. The same reluctance to use trade policies as an instrument for
targets other than import protection and export promotion seems advisable with respect
to income distribution and balance of payments purposes. Changing the income
distribution the core objective of rent-seeking should be approached by domestic policy
measures (income transfers and subsidies) while balance of payments targets should be
achieved by exchange rate flexibility instead of trade policies such as import surcharges
or export subsidies. Paying attention to such principles would leave protection or export
promotion as the major targets of trade policies.
177
To start with short-term economic targets, export expansion towards any partner
country offering hard currency earnings appears to be a prime target worth following by
the CIS states for several reasons. First, CIS states seriously lack foreign exchange to
stabilise the exchange rate and to ease the hard budget constraint with respect to
external savings. These constraints exist as the CIS states are not creditworthy in
international markets. Nor do they attract foreign direct investment on a large scale.
Foreign public aid cannot compensate for the reluctance of international investors and
private donors. Therefore, access to external savings is very much limited and can be
eased only by squeezing imports or expanding exports. The experience of many
developing countries with the former has been disenchanting because production
declined as a result of reduced capital goods imports. Hence, only the latter way is
advisable. Second, export diversification helps to release CIS states from exogenous
commodity price shocks and from concurrent exchange rate volatility (Dutch disease
problem). It stabilizes flows of export earnings. Third, export diversification is
instrumental for linking domestic producers to international networks and for acquiring
technological and commercial skills. Fourth, Export diversification contributes to
shifting CIS production towards sectors with a more income elastic export demand than
commodities. Fifth, it may ease political tensions between CIS states, which could arise
if the countries underbid each other in homogeneous commodity markets (either by
"devaluation races" or export subsidisation). experience with commodity exporters
from some developing countries suggests that such competition is very likely.
The early state of administrative capacity in CIS states suggests that all tools
should be marked by simplicity, transparency and conformity with the market
mechanism. This requires that quotas be phased out as soon as possible. Quotas, if not
auctioned, clearly signal allocative inefficiency following lobby activities. Auctioning
quotas is inferior to tariffs for administrative as well as theoretical reasons. There are
few exceptions which emerge exogenously. Quotas for exports of multi-fiber products,
for instance, should be auctioned in order to enable CIS governments to collect the
quota rents which would accrue to domestic producers if quotas were allocated on non
price grounds (e.g. on the "first come, first served" principle or on other bureaucratic
principles). Still, the question arises whether the principle of abandoning quotas should
be applied to the total foreign trade of CIS states, including intra-CIS trade. This
178

question is open to debate. It has been argued in favour of transitional arrangements
that intra-CIS quotas should be maintained for those products which could be re
exported because of domestic underpricing relative to world market prices". The case
against such arrangements is based on the fear that quotas could proliferate and extend
rather than shorten the transition process. Again, taxes appear to be the preferable tool.
However, with monetary disintegration proceeding rapidly within the CIS region and
with similar trends emerging in the real sector the ultimate target should be for each
CIS state to treat intra-CIS trade and extra-CIS trade equally. This target, which would
also meet the administrative criteria of simplicity and transparency should be achieved
as soon as possible. It would not preclude preferential relations in a later period but the
principle of non-discrimination should have short-run priority. Future institutional re
integration would be facilitated if the tariff schedules of the individual CIS states were
similar and as uniform as possible. Thus, the crossroad situation of discrimination
versus non-discrimination should be answered in favour of non-discrimination. Again,
however, endogenous tariff theory would explain why, in spite of economic arguments
pro non-discrimination, preferential trading relation between CIS state would be
furthered.
179