ryan white quality management update - scdhec
TRANSCRIPT

Ryan White Quality Management Update
Katrina D. Gary, DHEC
Aaron O’Brien, Roper St. Francis

Continuous Quality Improvement • Quality is defined as meeting and/or exceeding the
expectations of our customers.
• Success is achieved through meeting the needs of those we serve.
• Most problems are found in processes, not in people. CQI does not seek to blame, but rather to improve processes.
• It is possible to achieve continual improvement through small, incremental changes.
• Continuous improvement is most effective when it becomes a natural part of the way everyday work is done.
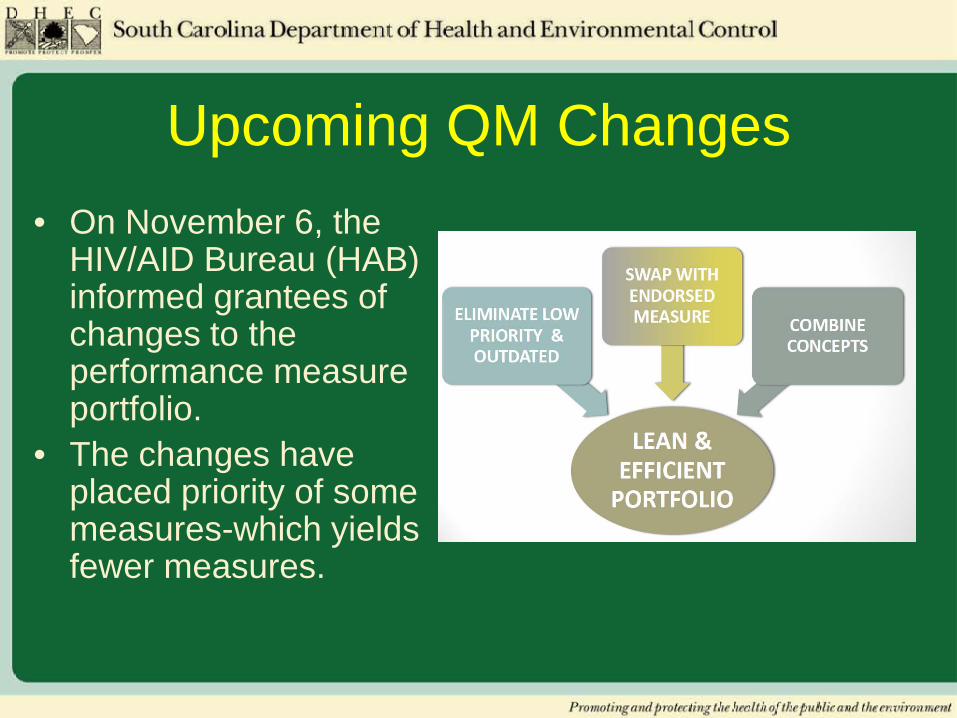
Upcoming QM Changes • On November 6, the
HIV/AID Bureau (HAB) informed grantees of changes to the performance measure portfolio.
• The changes have placed priority of some measures-which yields fewer measures.


Archived

Questions?
Ambulatory Service
At least 1 CD4 and VL in CY
2 or more CD4s and VLs in CY
CD4 < 50, Rx MAC Proph.
CD4 < 200, Rx PCP Proph.
TB Screening (Reporting
Period)
TB Screening
(Ever)
Syphilis Screening
Hepatitis C Screening (Reporting
Peiod)
Hepatitis C Screening (Since Dx)
PAP Exams
Pregnant Women Rx
ART
HIV Virus Supression (VL<200)
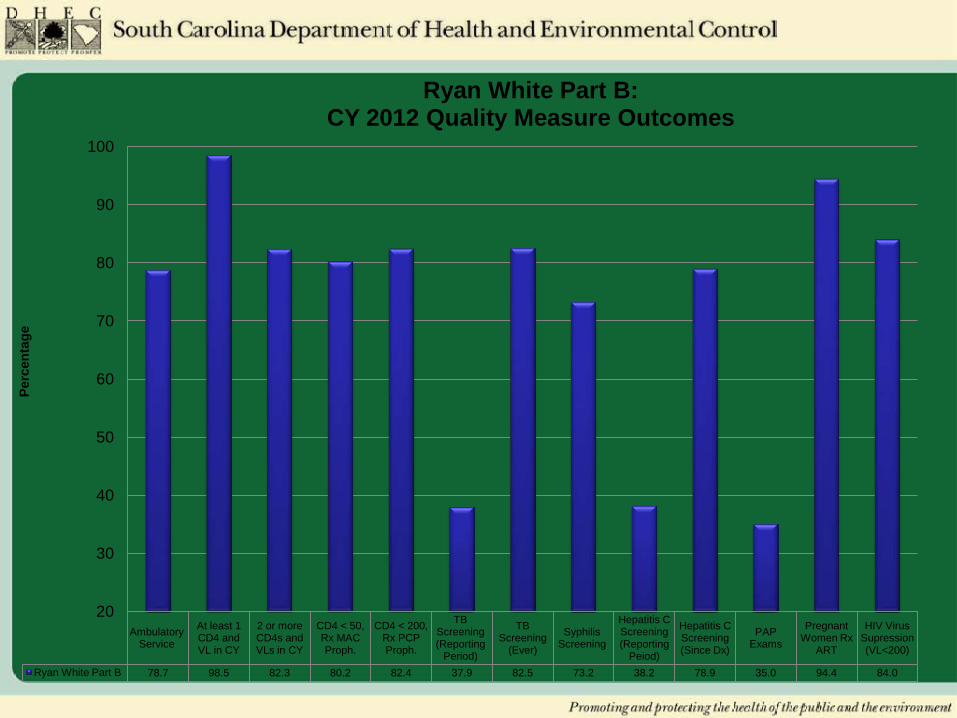
Ryan White Part B 78.7 98.5 82.3 80.2 82.4 37.9 82.5 73.2 38.2 78.9 35.0 94.4 84.0
20
30
40
50
60
70
80
90
100
Perc
enta
ge
Ryan White Part B: CY 2012 Quality Measure Outcomes

Ambulatory Service
At least 1 CD4 and VL
in CY
2 or more CD4's and VL's in CY
CD4 < 50, prescribed
MAC
CD4 < 200, prescribed
PCP
TB Screening (Reporting
Period)
Syphilis Screening
Hepatitis C Screening
(Since Diagnosis)
PAP Exams
2009 Average 73.3 95.3 55.7 24.0 37.8 42.9 68.1 44.6 2010 Average 72.0 96.6 63.3 52.8 53.4 37.9 64.0 42.1 2011 Average 73.1 96.9 82.7 73.3 67.9 53.4 63.8 45.4 2012 Average 78.7 98.5 82.3 80.2 82.4 37.9 73.2 78.9 35.0
0
10
20
30
40
50
60
70
80
90
100
Perc
enta
ge
Ryan White Part B Quality Management Data Trends

73.3% 72.0% 73.1% 78.7%
0
10
20
30
40
50
60
70
80
90
100
2009 2010 2011 2012
Perc
enta
ge
Ryan White Part B Trends: Ambulatory Service
Ambulatory Service Target
*Inclusive of clients who had at least 1 Ambulatory Service during the reporting period, and their first service was prior to six months after the start of the reporting period.

55.7%
63.3%
82.7% 82.3%
0
10
20
30
40
50
60
70
80
90
100
2009 2010 2011 2012
Perc
enta
ge
Ryan White Part B: 2 or More CD4's and VL's in CY 2012
CD4's and VL's in CY Target

44.6% 42.1%
45.4%
35.0%
0
10
20
30
40
50
60
70
80
90
100
2009 2010 2011 2012
Perc
enta
ge
Ryan White Part B Trends: Pap Exams
Pap Exam Average Target
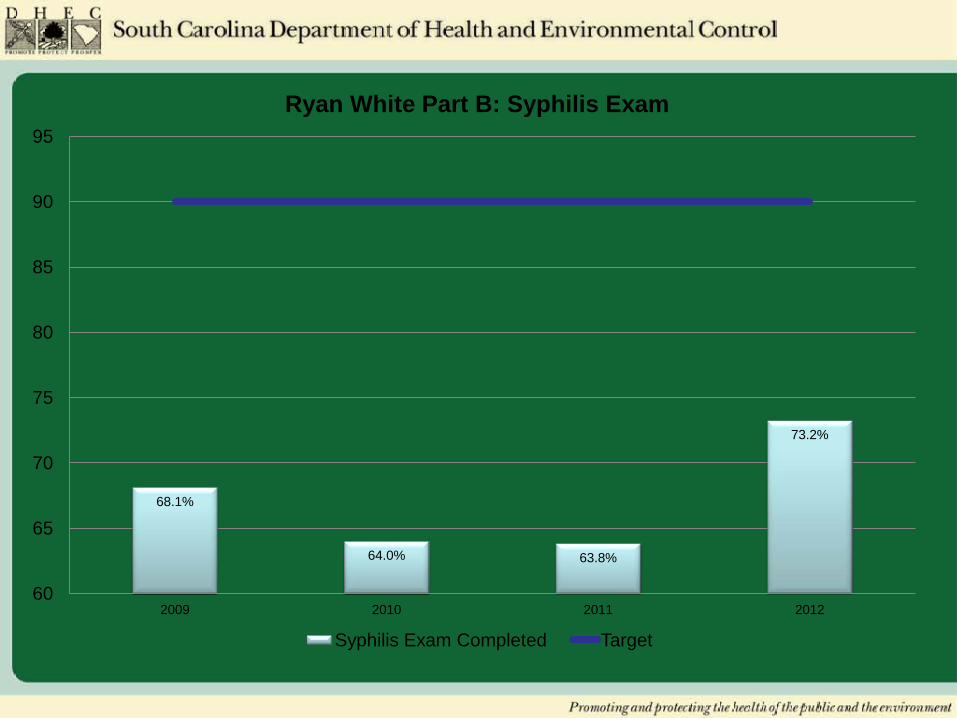
68.1%
64.0% 63.8%
73.2%
60
65
70
75
80
85
90
95
2009 2010 2011 2012
Ryan White Part B: Syphilis Exam
Syphilis Exam Completed Target

24.0%
37.8%
52.8% 53.4%
73.3%
67.9%
80.2% 82.4%
0
10
20
30
40
50
60
70
80
90
100
CD4 < 50, prescribed MAC Prophylaxis CD4 < 200, prescribed PCP Prophylaxis
Perc
enta
ge
Ryan White Part B Trends: MAC and PCP Prophylaxis
2009 2010 2011 2012 Target

42.9% 37.9%
53.4%
37.9%
82.5%
0
10
20
30
40
50
60
70
80
90
100
2009 2010 2011 2012
Perc
enta
ge
Ryan White Part B Trends: TB Screening
TB Screening (Reporting Period) TB Screening (Ever) Target
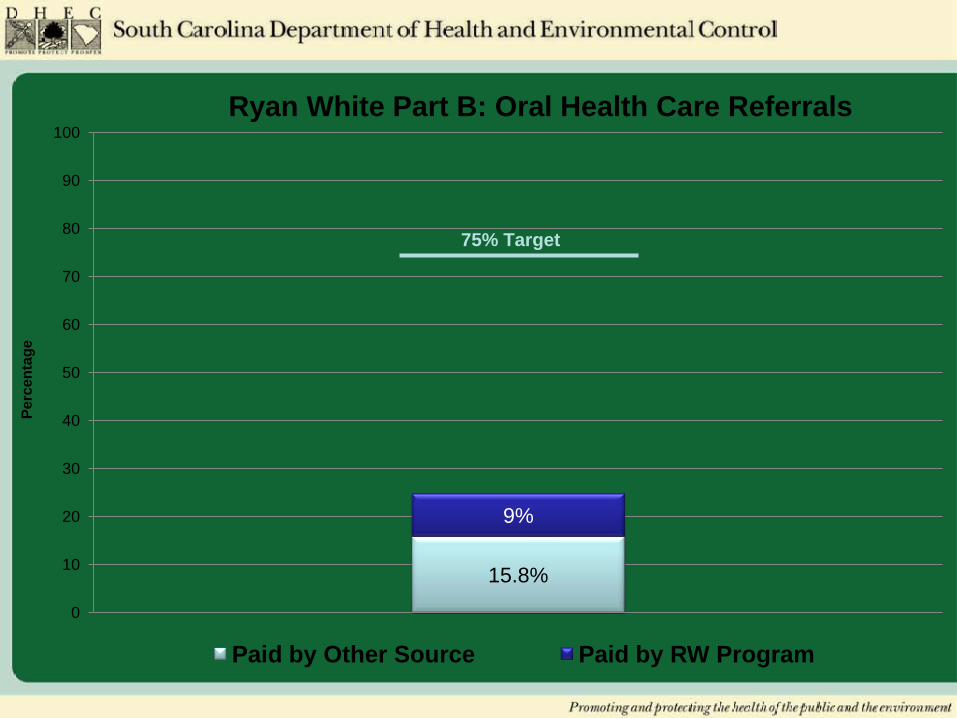
15.8%
9%
0
10
20
30
40
50
60
70
80
90
100
Perc
enta
ge
Ryan White Part B: Oral Health Care Referrals
Paid by Other Source Paid by RW Program
75% Target

10.9%
89.2%
Ryan White Part B: Older Than 13 years and Prescribed ART
Not Prescribed ART Prescribed ART
** This measure represents clients who had a CD4 <= 350 or VL >= 100,000, older than 13 yrs, and prescribed ART

ART Prescription Received
94%
ART Prescription Not Received
6%
Ryan White Part B: Pregnant Women and ART
ART Prescription Received ART Prescription Not Received

84.0%
0
10
20
30
40
50
60
70
80
90
100 Ryan White Part B: HIV Virus Suppression (VL<200)
HIV Virus Suppression (VL<200)

Key Elements of a Breakthrough Performance
• Providers will have to: – Have the will to do what it takes to change to a
new system. – Share and implement ideas on which to base the
design of the new system. – Execute the ideas.

Any Questions

Ryan White Part C Update
Aaron O’Brien


South Carolina Part C Programs • BJ Comprehensive Health • CareSouth Carolina • Catawba Care • Eau Claire Cooperative Health Centers, Inc • HopeHealth, Inc • Little River Medical Center Inc. • Low Country Health Care System, Inc • New Horizon Family Health Services • Roper St. Francis Healthcare • Sandhills Medical Foundation • Spartanburg Regional Healthcare System

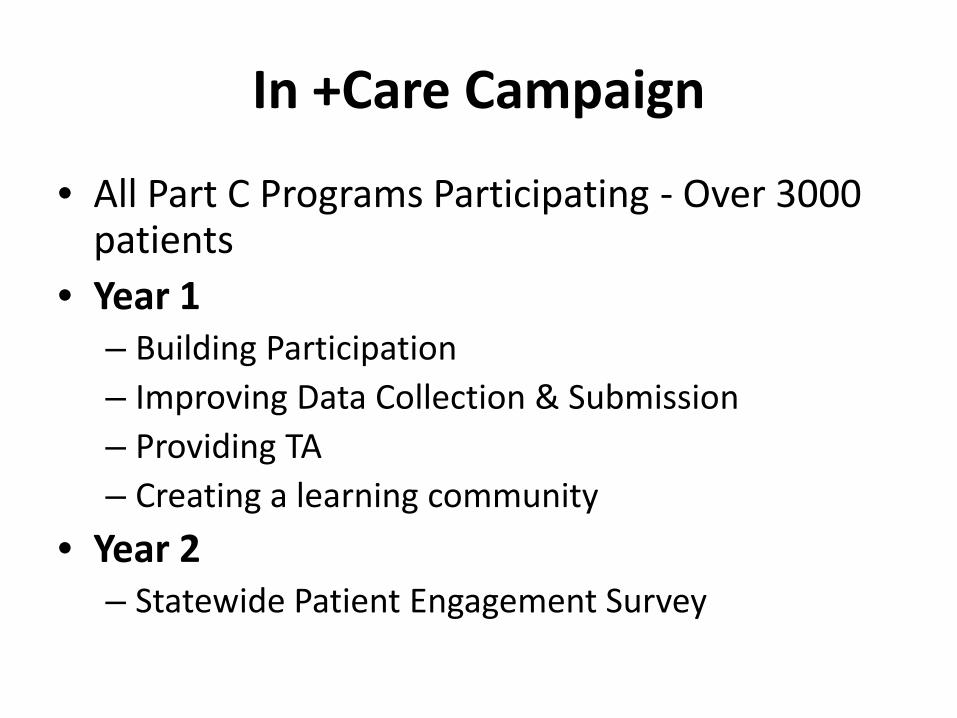
In +Care Campaign
• All Part C Programs Participating - Over 3000 patients
• Year 1 – Building Participation – Improving Data Collection & Submission – Providing TA – Creating a learning community
• Year 2 – Statewide Patient Engagement Survey
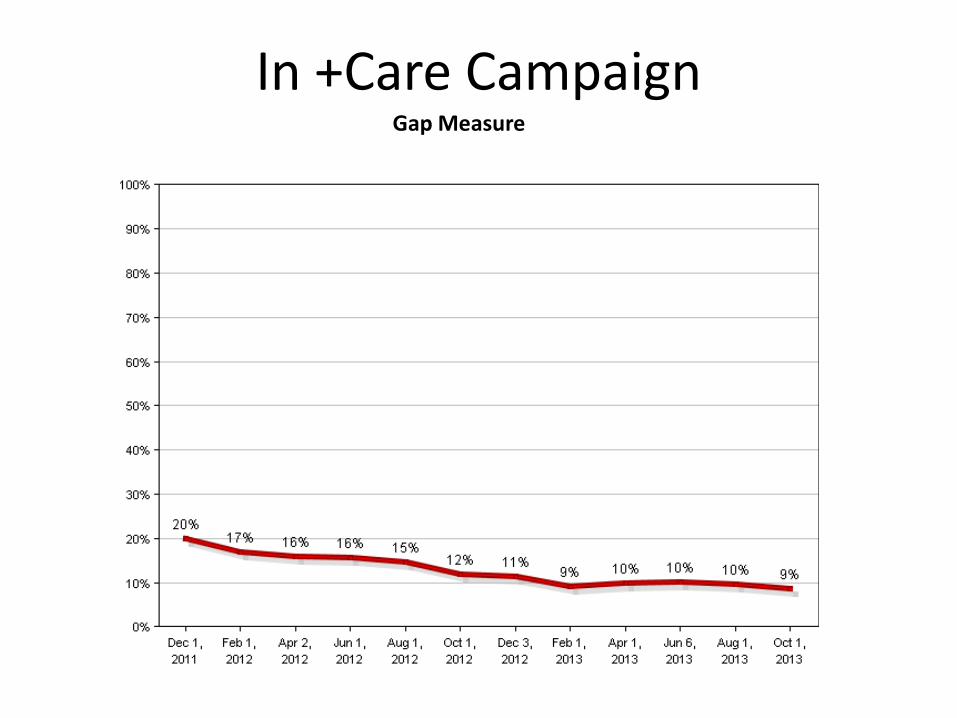
In +Care Campaign Gap Measure

In +Care Campaign Visit Frequency Measure

In +Care Campaign Viral Load Measure


Patient Engagement Survey
• 9 Part C Programs conducted interviews • Facilitators/barriers to care • Asked to rate their own level of engagement

Participants
Male, 61%
Female, 39%
African American, 77%
White, 22%
Hispanic, 1%
Yes, 83%
No, 17%
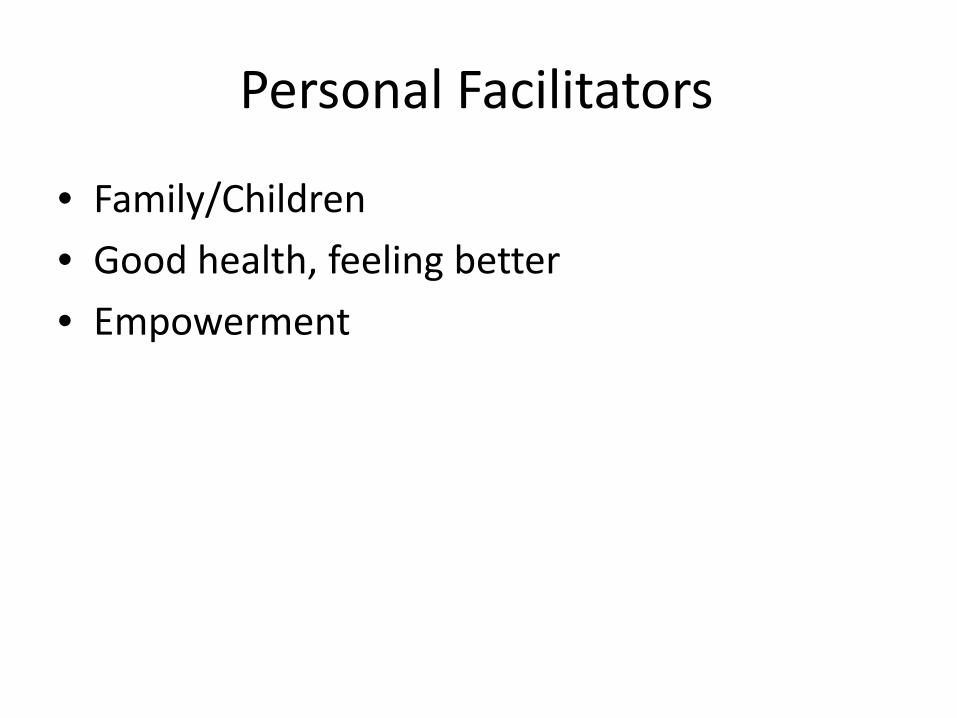
Personal Facilitators

Personal Facilitators
• Family/Children
Personal Facilitators
• Family/Children • Good health, feeling better
Personal Facilitators
• Family/Children • Good health, feeling better • Empowerment

Personal Facilitators
• Family/Children • Good health, feeling better • Empowerment • Feeling educated

Personal Facilitators
• Family/Children • Good health, feeling better • Empowerment • Feeling educated • Spirituality/Faith

Personal Facilitators
• Family/Children • Good health, feeling better • Empowerment • Feeling educated • Spirituality/Faith • Accomplishments/Improved Results
Personal Facilitators
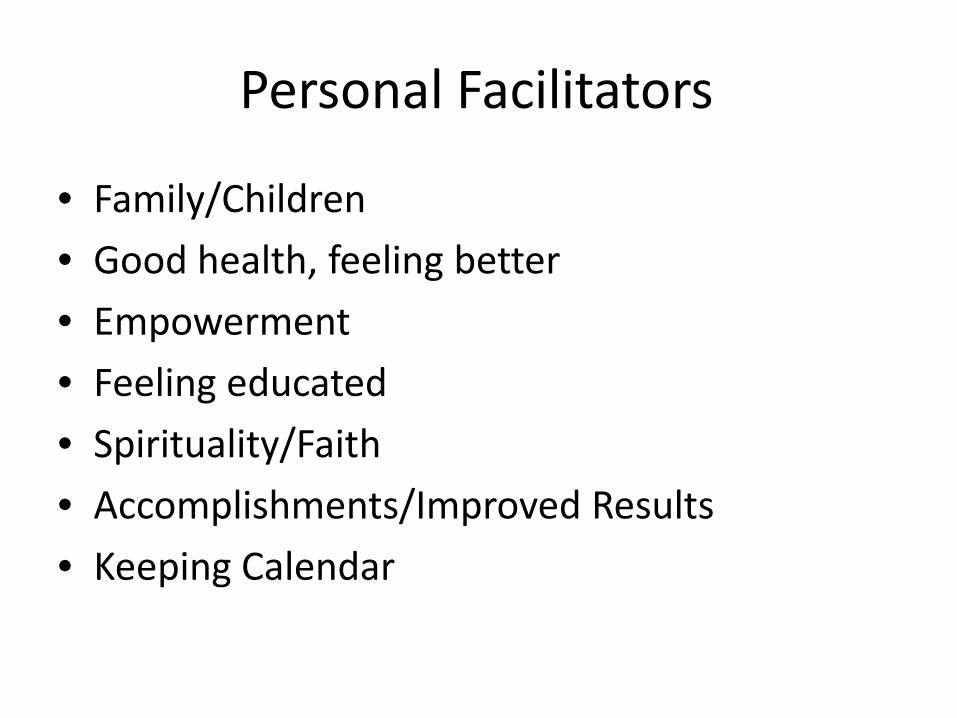
• Family/Children • Good health, feeling better • Empowerment • Feeling educated • Spirituality/Faith • Accomplishments/Improved Results • Keeping Calendar

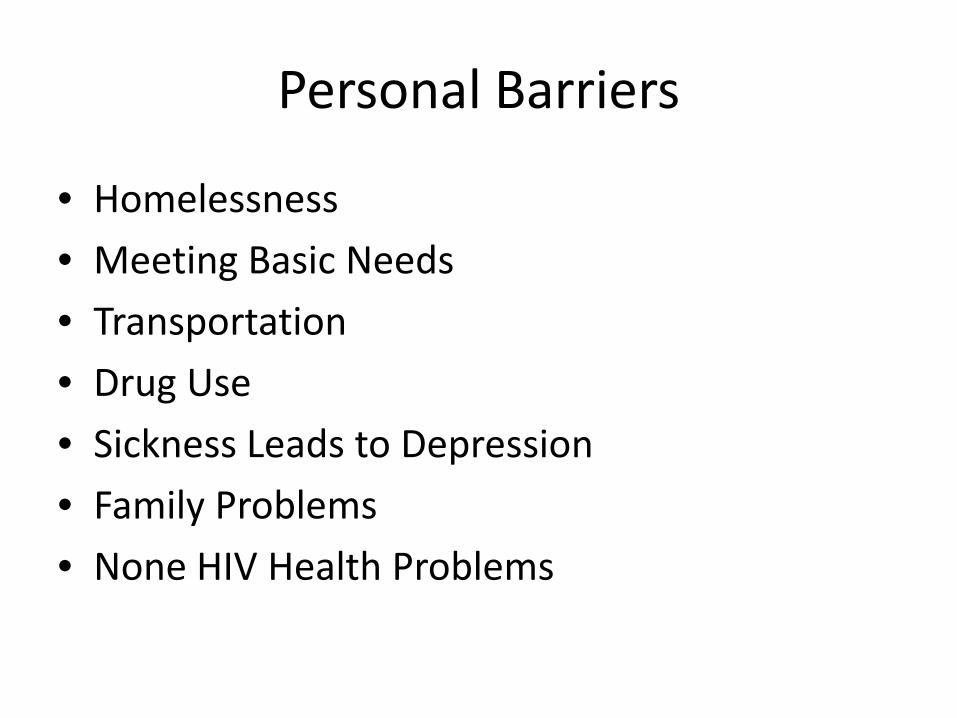
Personal Barriers

Personal Barriers
• Homelessness

Personal Barriers
• Homelessness • Meeting Basic Needs

Personal Barriers
• Homelessness • Meeting Basic Needs • Transportation

Personal Barriers
• Homelessness • Meeting Basic Needs • Transportation • Drug Use
Personal Barriers
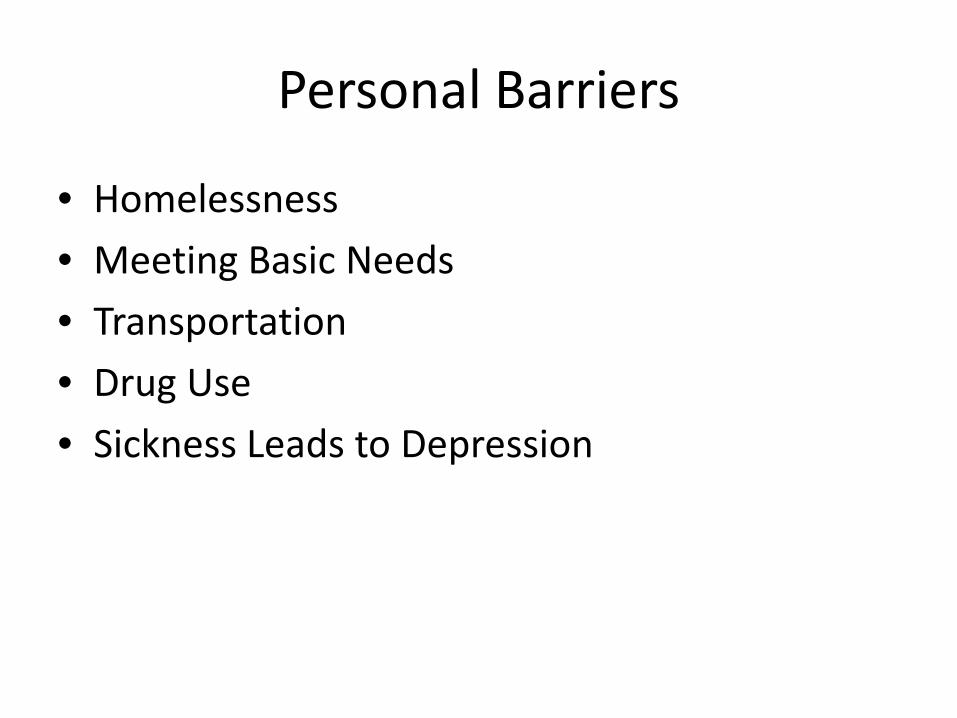
• Homelessness • Meeting Basic Needs • Transportation • Drug Use • Sickness Leads to Depression
Personal Barriers
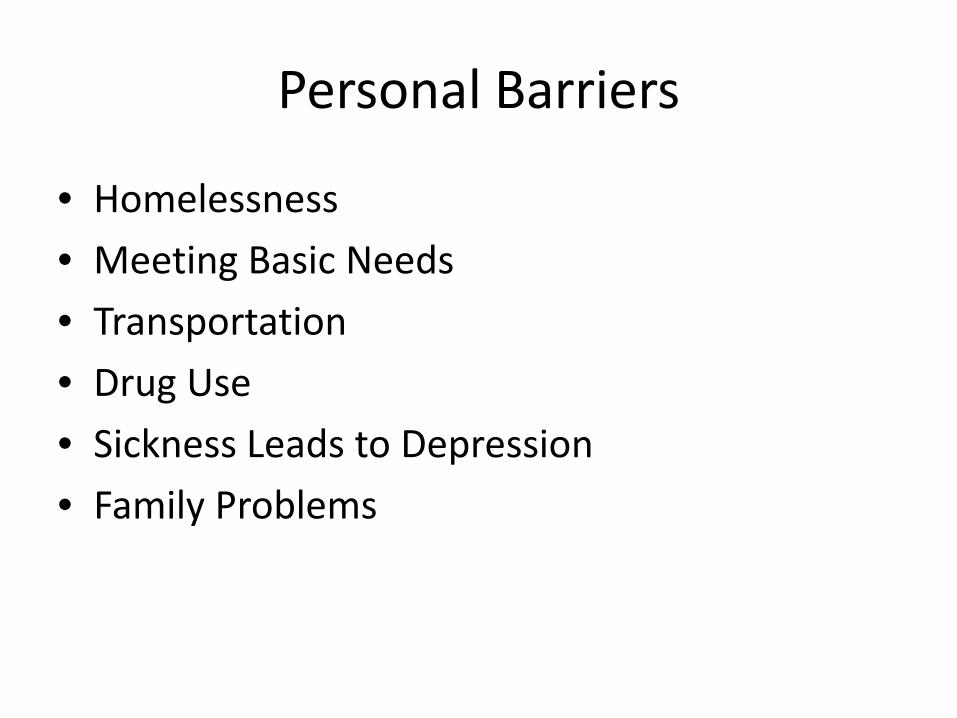
• Homelessness • Meeting Basic Needs • Transportation • Drug Use • Sickness Leads to Depression • Family Problems
Personal Barriers
• Homelessness • Meeting Basic Needs • Transportation • Drug Use • Sickness Leads to Depression • Family Problems • None HIV Health Problems

Personal Barriers
• Homelessness • Meeting Basic Needs • Transportation • Drug Use • Sickness Leads to Depression • Family Problems • None HIV Health Problems • Stigma/Acceptance of Disease


Provider Facilitators

Provider Facilitators
• Communication

Provider Facilitators
• Communication • Trust
Provider Facilitators
• Communication • Trust • Relationship

Provider Facilitators
• Communication • Trust • Relationship • Knowledge/expertise

Provider Facilitators
• Communication • Trust • Relationship • Knowledge/expertise • Provider reinforces appointment adherence

Provider Facilitators
• Communication • Trust • Relationship • Knowledge/expertise • Provider reinforces appointment adherence • Consistency

Provider Facilitators
• Communication • Trust • Relationship • Knowledge/expertise • Provider reinforces appointment adherence • Consistency • Safety

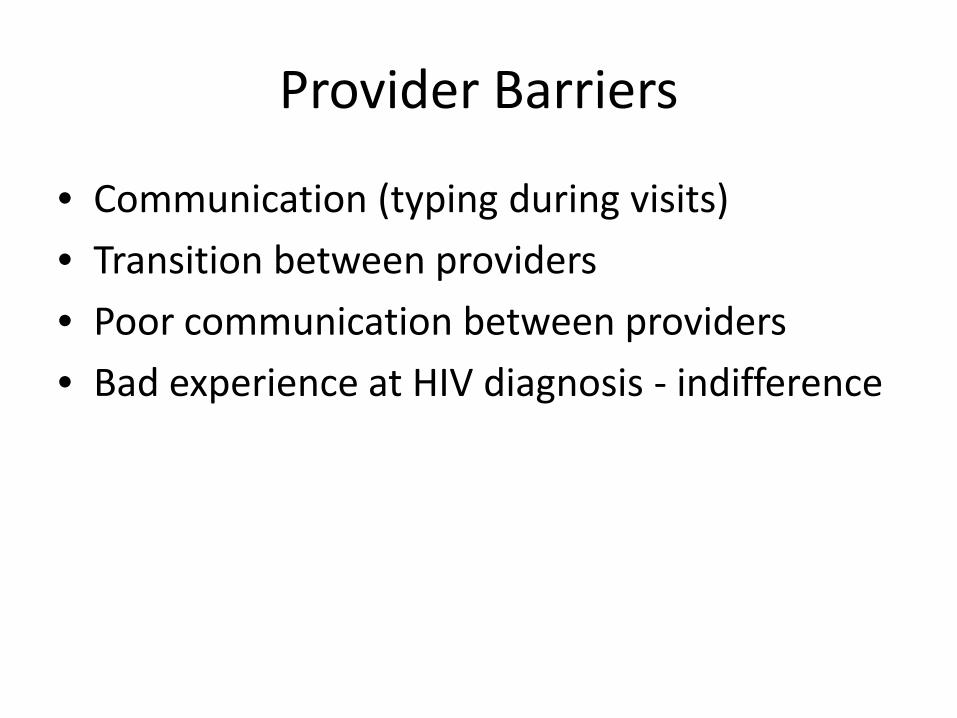
Provider Barriers
Provider Barriers
• Communication (typing during visits)

Provider Barriers
• Communication (typing during visits) • Transition between providers

Provider Barriers
• Communication (typing during visits) • Transition between providers • Poor communication between providers
Provider Barriers
• Communication (typing during visits) • Transition between providers • Poor communication between providers • Bad experience at HIV diagnosis - indifference

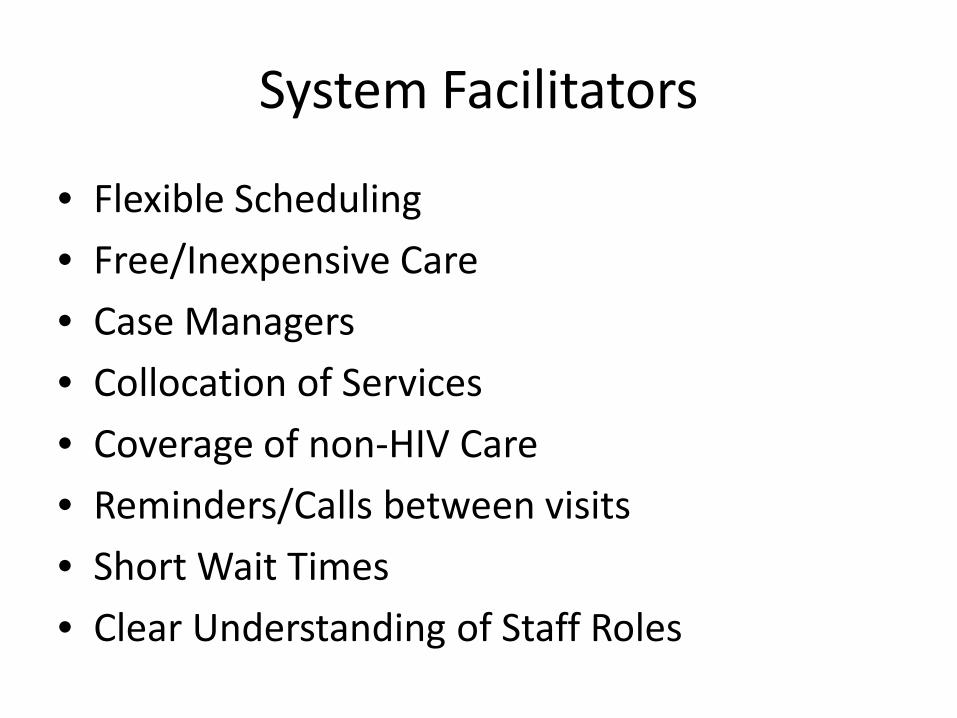
System Facilitators
System Facilitators
• Flexible Scheduling
System Facilitators
• Flexible Scheduling • Free/Inexpensive Care
System Facilitators
• Flexible Scheduling • Free/Inexpensive Care • Case Managers

System Facilitators
• Flexible Scheduling • Free/Inexpensive Care • Case Managers • Collocation of Services
System Facilitators
• Flexible Scheduling • Free/Inexpensive Care • Case Managers • Collocation of Services • Coverage of non-HIV Care

System Facilitators
• Flexible Scheduling • Free/Inexpensive Care • Case Managers • Collocation of Services • Coverage of non-HIV Care • Reminders/Calls between visits

System Facilitators
• Flexible Scheduling • Free/Inexpensive Care • Case Managers • Collocation of Services • Coverage of non-HIV Care • Reminders/Calls between visits • Short Wait Times
System Facilitators
• Flexible Scheduling • Free/Inexpensive Care • Case Managers • Collocation of Services • Coverage of non-HIV Care • Reminders/Calls between visits • Short Wait Times • Clear Understanding of Staff Roles

System Barriers

System Barriers
• Phone Systems

System Barriers
• Phone Systems • Group Activities
System Barriers
• Phone Systems • Group Activities • Burdensome Paperwork

System Barriers
• Phone Systems • Group Activities • Burdensome Paperwork • Wait times


Improving Engagement

Improving Engagement
• Patient Experience
Improving Engagement
• Patient Experience • Empower/Educate Patients

Improving Engagement
• Patient Experience • Empower/Educate Patients • HOPWA Programs

Improving Engagement
• Patient Experience • Empower/Educate Patients • HOPWA Programs • Supportive Testing
Improving Engagement
• Patient Experience • Empower/Educate Patients • HOPWA Programs • Supportive Testing • Flexible Scheduling

Improving Engagement
• Patient Experience • Empower/Educate Patients • HOPWA Programs • Supportive Testing • Flexible Scheduling • Consistency – CMs & Providers
Improving Engagement
• Patient Experience • Empower/Educate Patients • HOPWA Programs • Supportive Testing • Flexible Scheduling • Consistency – CMs & Providers • Treat Comorbidities


HAB Measures
Measure 2009 2010 2011 2012 MAC Prophylaxis 63% 68% 61% 83% PCP Prophylaxis 65% 72% 66% 91% Syphilis Screenings 73% 75% 74% 85% Cervical Paps 52% 47% 53% 49% TB Screening 61% 63% 68% 85% 2 CD4 Counts 86% Hepatitis C 89% Oral Health 17% Pregnant ART 100% VL Suppression 77%