s-2s memo toshiyuki gogami 17 may 2015. contents analysis results of wc test
TRANSCRIPT

S-2S MEMO
Toshiyuki Gogami17 May 2015
Contents
Analysis results of WC test
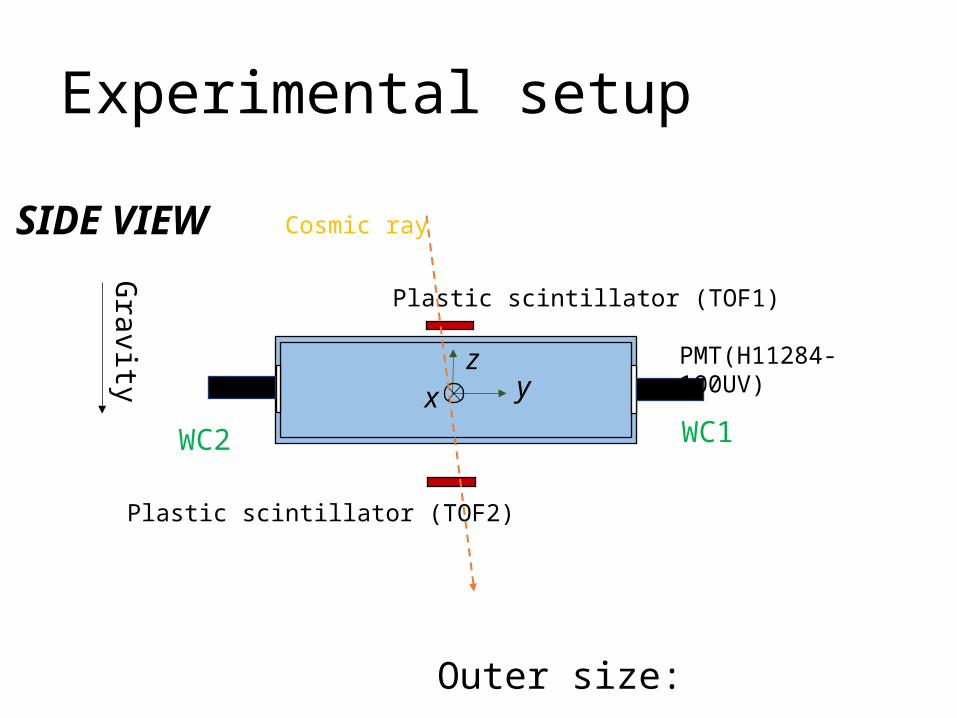
Experimental setup
Outer size:
Gravity
SIDE VIEW
PMT(H11284-100UV)y
zx
Plastic scintillator (TOF1)
Plastic scintillator (TOF2)
Cosmic ray
WC1WC2

Pictures of WC at room.319 in Kyoto Univ.

Run summary
http://www-nh.scphys.kyoto-u.ac.jp/~gogami/s-2s/doc/wctest2015/RunSummary_wctest2015.pdf

Analysis

NPE calibration using LED
Obtain ADC channels per NPE
Fluctuate from time to time due to: Fitting results Performance fluctuations of electric circuit and PMT
etc.
But !!!

Ensemble of calibration data
Run ID:3, 5, 7, 9, 11, 13, 15, 17, 18 , 20 and 21
Filled fitting results of each calibration run.

Ensemble of calibration data
Run ID:3, 5, 7, 9, 11, 13, 15, 17, 18 , 20 and 21
Used for a conversionfrom ADC ch to NPE
Systematic error: 0.25 / 6.84 for WC1 0.22 / 18.95 for WC2

NPE derivation from NPE histograms
Used function: Single Gaussian function1. Scan a fitting range to minimize the fitting chi-square2. Obtain the mean value Used as a result
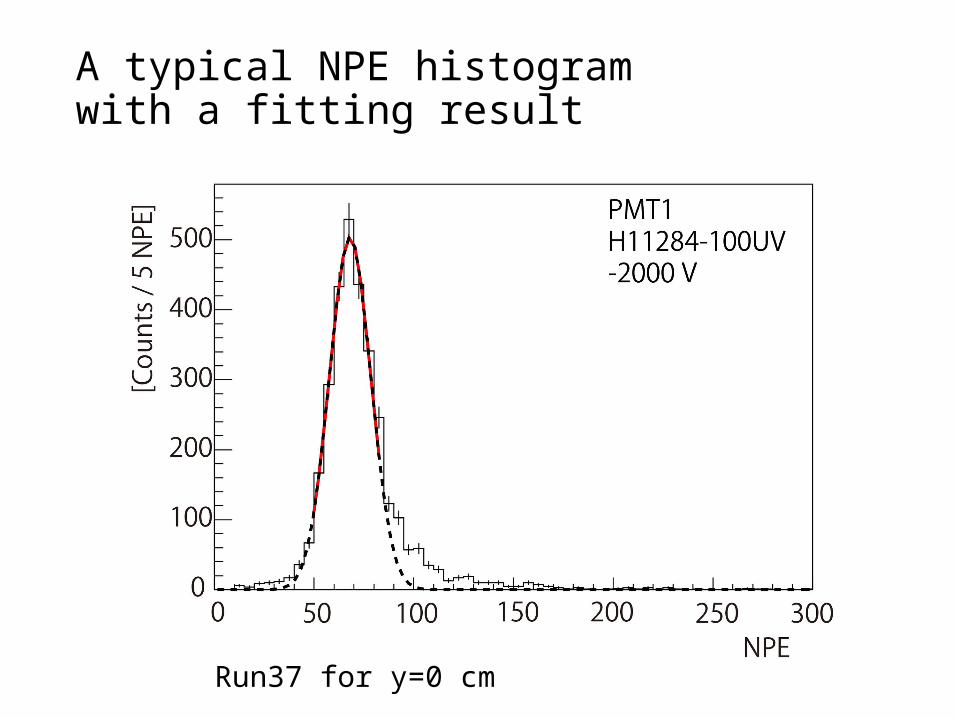
A typical NPE histogram with a fitting result
Run37 for y=0 cm

Data phase
Phase 1 (4/21 – 4/25)
Phase 2 (5/11 – )
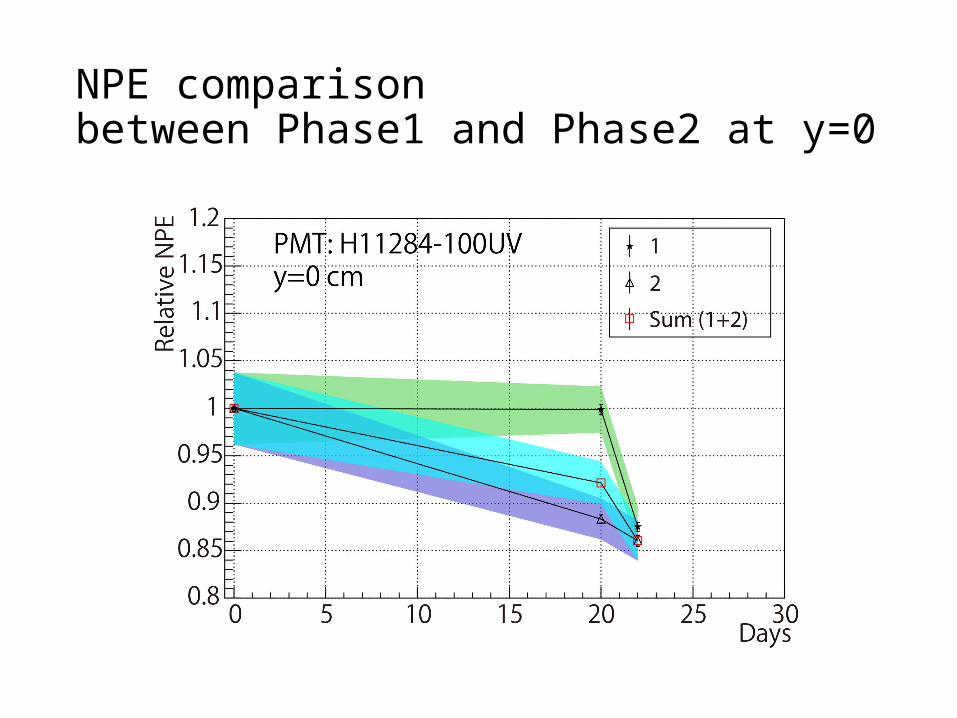
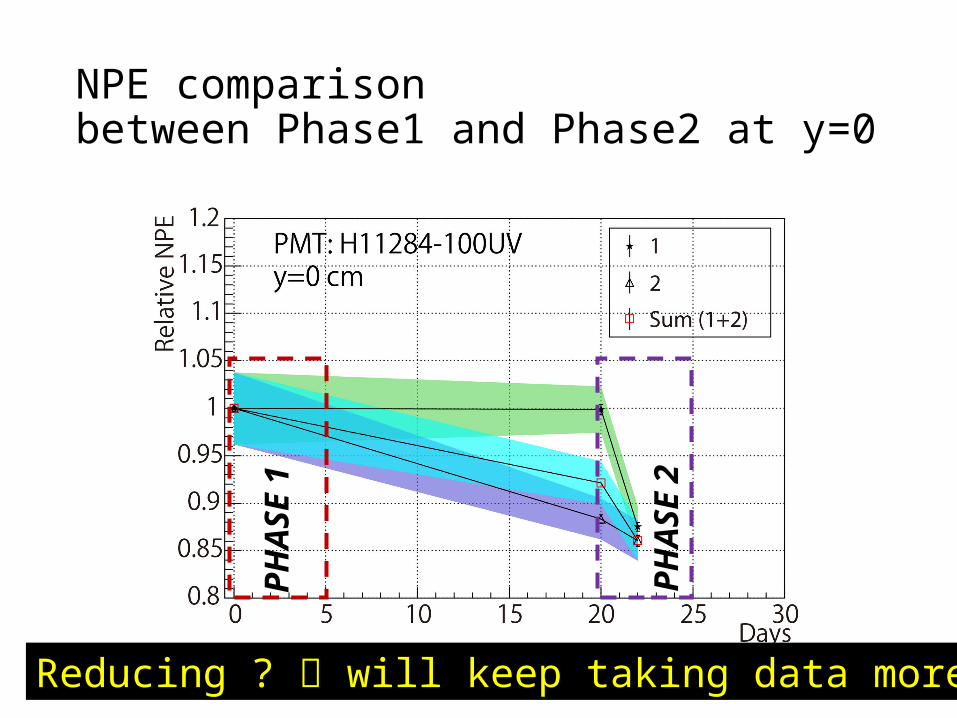
NPE comparisonbetween Phase1 and Phase2 at y=0
NPE comparisonbetween Phase1 and Phase2 at y=0
PHAS
E 1
PHAS
E 2
Reducing ? will keep taking data more.

y-dependencefor Phase 1 and 2
Phase 1 Phase 2consistent with the errors.
Tendency is

y-dependencefor Phase 1 and 2
Phase 1 Phase 2consistent with the errors.
At y = 0 cm, (PMT1, PMT2, Sum ) = (77.8±0.3, 99.0±0.4, 176.5±0.7)
At y = 0 cm, (PMT1, PMT2, Sum ) = (68.0±0.5, 86.3±0.6, 154.0±0.7)REDUCED !!
Tendency is

Summary
NPE is reducing… The reduction may be caused by water deterioration due to caulking material (Bathcaulk-N).
Further studies will be done !!