s e a c o r m ar i n e h ol d i n gs i n c
TRANSCRIPT

Table of Contents
UNITED STATESSECURITIES AND EXCHANGE COMMISSION
WASHINGTON, DC 20549________________________________________
FORM 10-Q________________________________________(Mark One) ☒ QUARTERLY REPORT PURSUANT TO SECTION 13 OR 15(d) OF THE SECURITIES EXCHANGE ACT OF 1934
For the quarterly period ended June 30, 2018 or
☐ TRANSITION REPORT PURSUANT TO SECTION 13 OR 15(d) OF THE SECURITIES EXCHANGE ACT OF 1934
For the transition period from to
Commission file number 1-37966
SEACOR Marine Holdings Inc.(Exact Name of Registrant as Specified in Its Charter)
________________________________________
Delaware 47-2564547(State or Other Jurisdiction of
Incorporation or Organization) (IRS Employer
Identification No.)
7910 Main Street, 2nd Floor Houma, LA 70360
(Address of Principal Executive Offices) (Zip Code)
985-876-5400(Registrant’s Telephone Number, Including Area Code)
Not Applicable
(Former Name, Former Address and Former Fiscal Year, if Changed Since Last Report)________________________________________
Indicate by check mark whether the registrant: (1) has filed all reports required to be filed by Section 13 or 15(d) of the SecuritiesExchange Act of 1934 during the preceding 12 months (or for such shorter period that the registrant was required to file such reports), and(2) has been subject to such filing requirements for the past 90 days. Yes ☒ No ☐
Indicate by check mark whether the registrant has submitted electronically and posted on its corporate Web site, if any, every
Interactive Data File required to be submitted and posted pursuant to Rule 405 of Regulation S-T (§232.405 of this chapter) during thepreceding 12 months (or for such shorter period that the registrant was required to submit and post such files). Yes ☒ No ☐
Indicate by check mark whether the registrant is a large accelerated filer, an accelerated filer, a non-accelerated filer, or a smaller
reporting company. See definitions of “large accelerated filer,” “accelerated filer,” “smaller reporting company,” and “emerging growthcompany” in Rule 12b-2 of the Exchange Act. (Check one):
Large accelerated filer ☐
Accelerated filer ☐
Non-accelerated filer ☒(Do not check if a smaller
reporting company)
Smaller reportingcompany ☐
Emerging growthcompany ☒
If an emerging growth company, indicate by check mark if the registrant has elected not to use the extended transition period for
complying with any new or revised financial accounting standards provided pursuant to Section 13(a) of the Exchange Act. ☒ Indicate by check mark whether the registrant is a shell company (as defined in Rule 12b-2 of the Exchange Act). Yes ☐ No ☒ The total number of shares of common stock, par value $.01 per share, outstanding as of August 9, 2018 was 20,441,590. The
Registrant has no other class of common stock outstanding.

Table of Contents
SEACOR MARINE HOLDINGS INC.
Table of Contents Part I. Financial Information 1 Item 1. Financial Statements (Unaudited) 1 Condensed Consolidated Balance Sheets as of June 30, 2018 and December 31, 2017 1 Condensed Consolidated Statements of Loss for the Three and Six Months Ended June 30, 2018
and 2017 2 Condensed Consolidated Statements of Comprehensive Loss for the Three and Six Months
Ended June 30, 2018 and 2017 3 Condensed Consolidated Statement of Changes in Equity for the Six Months Ended June 30,
2018 4 Condensed Consolidated Statements of Cash Flows for the Six Months Ended June 30, 2018 and
2017 5 Notes to Condensed Consolidated Financial Statements 6 Item 2. Management’s Discussion and Analysis of Financial Condition and Results of Operations 19 Item 3. Quantitative and Qualitative Disclosures About Market Risk 38 Item 4. Controls and Procedures 38 Part II. Other Information 39 Item 1. Legal Proceedings 39 Item 1A. Risk Factors 39 Item 2. Unregistered Sales of Equity Securities and Use of Proceeds 39 Item 3. Default Upon Senior Securities 39 Item 4. Mine Safety Disclosures 39 Item 5. Other Information 39 Item 6. Exhibits 40
i

Table of Contents PART I—FINANCIAL INFORMATION ITEM 1. FINANCIAL STATEMENTS
SEACOR MARINE HOLDINGS INC.UNAUDITED CONDENSED CONSOLIDATED BALANCE SHEETS
(in thousands, except share data) June 30, 2018 December 31, 2017
ASSETS Current Assets:
Cash and cash equivalents $ 86,239 $ 110,234 Restricted cash 1,951 2,317 Receivables:
Trade, net of allowance for doubtful accounts of $4,001 and $4,039 in 2018 and 2017, respectively 57,658 45,616 Other 16,039 12,341
Inventories 3,666 3,756 Prepaid expenses and other 4,090 3,026
Total current assets 169,643 177,290 Property and Equipment:
Historical cost 1,287,855 1,179,836 Accumulated depreciation (564,477) (560,160)
723,378 619,676 Construction in progress 82,274 70,157 Net property and equipment 805,652 689,833
Investments, at Equity, and Advances to 50% or Less Owned Companies 115,424 92,169 Construction Reserve Funds 38,152 45,361 Other Assets 3,667 3,851 $ 1,132,538 $ 1,008,504
LIABILITIES AND EQUITY Current Liabilities:
Current portion of long-term debt $ 22,858 $ 22,858 Accounts payable and accrued expenses 23,774 24,024 Due to SEACOR Holdings 746 1,358 Accrued wages and benefits 4,986 5,087 Accrued income taxes 4,352 4,290 Accrued capital, repair and maintenance expenditures 24,462 19,618 Deferred revenues 10,227 10,104 Other current liabilities 12,442 11,879
Total current liabilities 103,847 99,218 Long-Term Debt 348,912 292,041 Conversion Option Liability on Convertible Senior Notes 21,886 6,832 Deferred Income Taxes 49,789 55,506 Deferred Gains and Other Liabilities 27,289 31,741
Total liabilities 551,723 485,338 Equity:
SEACOR Marine Holdings Inc. stockholders’ equity: Common stock, $.01 par value, 60,000,000 shares authorized; 20,441,590 and 17,675,356 shares issued in
2018 and 2017, respectively 204 177 Additional paid-in capital 413,754 303,996 Retained earnings 150,585 216,511 Shares held in treasury (54) — Accumulated other comprehensive loss, net of tax (13,129) (12,493)
551,360 508,191 Noncontrolling interests in subsidiaries 29,455 14,975
Total equity 580,815 523,166 $ 1,132,538 $ 1,008,504
The accompanying notes are an integral part of these condensed consolidated financial statementsand should be read in conjunction herewith.
1

Table of Contents
SEACOR MARINE HOLDINGS INC.UNAUDITED CONDENSED CONSOLIDATED STATEMENTS OF LOSS
(in thousands, except share data) Three Months Ended June 30, Six Months Ended June 30, 2018 2017 2018 2017 Operating Revenues $ 60,701 $ 42,323 $ 112,422 $ 76,627 Costs and Expenses:
Operating 48,820 44,482 89,993 77,861 Administrative and general 15,532 21,705 28,339 33,531 Depreciation and amortization 18,406 14,633 37,918 27,136
82,758 80,820 156,250 138,528 Gains (Losses) on Asset Dispositions and Impairments, Net 1,055 (6,318) (1,588) (1,499)Operating Loss (21,002) (44,815) (45,416) (63,400)Other Income (Expense):
Interest income 352 275 568 1,125 Interest expense (6,489) (4,546) (12,622) (7,728)SEACOR Holdings management fees — (1,283) — (3,208)SEACOR Holdings guarantee fees (7) (75) (19) (151)Marketable security (losses) gains, net — (109) — 11,629 Derivative losses, net (2,668) (213) (14,184) (302)Foreign currency losses, net (818) (1,094) (679) (1,283)Other, net — — — (1)
(9,630) (7,045) (26,936) 81 Loss Before Income Tax Benefit and Equity in Earnings of 50% or Less OwnedCompanies (30,632) (51,860) (72,352) (63,319)Income Tax Benefit (4,724) (13,800) (14,548) (17,222)Loss Before Equity in Earnings of 50% or Less Owned Companies (25,908) (38,060) (57,804) (46,097)Equity in (Losses) Earnings of 50% or Less Owned Companies, Net of Tax (721) 1,571 (513) 2,009 Net Loss (26,629) (36,489) (58,317) (44,088)Net Loss attributable to Noncontrolling Interests in Subsidiaries (1,605) (2,497) (4,460) (2,701)Net Loss attributable to SEACOR Marine Holdings Inc. $ (25,024) $ (33,992) $ (53,857) $ (41,387) Basic and Diluted Loss Per Common Share and Warrants of SEACOR MarineHoldings Inc. $ (1.25) $ (1.93) $ (3.00) $ (2.34)Basic and Diluted Weighted Average Common Shares and Warrants Outstanding: 19,978,516 17,631,567 17,967,242 17,651,352
The accompanying notes are an integral part of these condensed consolidated financial statements
and should be read in conjunction herewith. 2

Table of Contents
SEACOR MARINE HOLDINGS INC.UNAUDITED CONDENSED CONSOLIDATED STATEMENTS OF COMPREHENSIVE LOSS
(in thousands) Three Months Ended June 30, Six Months Ended June 30, 2018 2017 2018 2017 Net Loss $ (26,629) $ (36,489) $ (58,317) $ (44,088)Other Comprehensive Loss:
Foreign currency translation (losses) gains (2,785) 1,865 (873) 2,784 Derivative (losses) gains on cash flow hedges (63) (429) 68 (438)Reclassification of derivative (losses) gains on cash flow hedges to interestexpense (1) 37 — 49 Reclassification of derivative losses on cash flow hedges to equity in earningsof 50% or less owned companies 42 147 171 335
(2,807) 1,620 (634) 2,730 Income tax benefit (8) (533) (35) (887)
(2,815) 1,087 (669) 1,843 Comprehensive Loss (29,444) (35,402) (58,986) (42,245)Comprehensive Loss attributable to Noncontrolling Interests in Subsidiaries (1,715) (2,399) (4,493) (2,505)Comprehensive Loss attributable to SEACOR Marine Holdings Inc. $ (27,729) $ (33,003) $ (54,493) $ (39,740)
The accompanying notes are an integral part of these condensed consolidated financial statements
and should be read in conjunction herewith. 3

Table of Contents
SEACOR MARINE HOLDINGS INC.UNAUDITED CONDENSED CONSOLIDATED STATEMENT OF CHANGES IN EQUITY
(in thousands)
Common
Stock
AdditionalPaid-InCapital
SharesHeld in Treasury
RetainedEarnings
AccumulatedOther
ComprehensiveLoss
Non-ControllingInterests InSubsidiaries
TotalEquity
December 31, 2017 177 303,996 — 216,511 (12,493) 14,975 523,166 Impact of adoption of accounting
principle — — — (12,069) — — (12,069)December 31, 2017 as adjusted 177 303,996 — 204,442 (12,493) 14,975 511,097
Issuance of Common Stock 23 42,973 — — — — 42,996 Issuance of Warrants — 62,809 — — — — 62,809 Amortization of employee share awards — 1,896 — — — — 1,896 Exercise of options 1 812 — — — — 813 Exercise of Warrants 3 — (3) — — — — Restricted stock vesting — — (51) — — — (51)Director share awards — 893 — — — — 893 Acquisition of consolidated joint venture — — — — — (12,037) (12,037)Issuance of noncontrolling interests — 375 — — — 31,010 31,385 Net loss — — — (53,857) — (4,460) (58,317)Other comprehensive loss — — — — (636) (33) (669)
June 30, 2018 204 413,754 (54) 150,585 (13,129) 29,455 580,815
The accompanying notes are an integral part of these condensed consolidated financial statementsand should be read in conjunction herewith.
4

Table of Contents
SEACOR MARINE HOLDINGS INC.UNAUDITED CONDENSED CONSOLIDATED STATEMENTS OF CASH FLOWS
(in thousands) Six Months Ended June 30, 2018 2017 Cash Flows from Operating Activities Net Loss $ (58,317) $ (44,088)Adjustments to reconcile net loss to net cash used in operating activities:
Depreciation and amortization 37,918 27,136 Deferred financing costs amortization 501 1,752 Restricted stock amortization 1,896 89 Restricted stock vesting (51) — Director share awards 893 — Debt discount amortization 2,719 2,192 Amortization of deferred gains against charter expense (4,019) (4,100)Bad debt expense 10 579 Loss from equipment sales, retirements or impairments 1,588 1,499 Gains from sale of marketable securities, net — (11,629)Proceeds from sale of securities — 51,877 Derivative losses 14,184 302 Cash settlement on derivative transactions, net (150) (188)Currency loss 679 1,283 Deferred income taxes (17,395) (5,560)Equity earnings (losses), net 513 (2,009)Dividends received from equity investees 1,324 1,642
Changes in Operating Assets and Liabilities: Accounts receivables (15,414) 10,572 Other assets (466) 3,583 Accounts payable and accrued liabilities (99) 18,804
Net cash (used in) provided by operating activities (33,686) 53,736 Cash Flows from Investing Activities:
Purchases of property and equipment (15,548) (28,803)Cash settlements on derivative transactions, net — (324)Proceeds from disposition of property and equipment 3,526 9,549 Net change in construction reserve fund 7,209 10,410 Investments in and advances to 50% or less owned companies (25,560) (4,216)Return of investments and advances from 50% or less owned companies — 7,350 Proceeds from sale of investment in equity investees — 89 Payments received on third party notes receivable, net 99 — Cash assumed on consolidation of 50% or less owned companies — 1,943 Business acquisitions, net of cash acquired — (9,751)
Net cash used in investing activities (30,274) (13,753)Cash Flows from Financing Activities:
Payments on long-term debt (35,202) (3,973)Proceeds from issuance of long-term debt, net of issue costs 18,471 3,223 SMHI Restricted Stock — (2,656)Purchase of subsidiary shares from noncontrolling interests — (3,693)Proceeds from exercise of stock options and Warrants 813 — Issuance of stock 42,996 — Issuance of Warrants 12,809 —
Net cash provided by (used in) financing activities 39,887 (7,099)Effects of Exchange Rate Changes on Cash and Cash Equivalents (288) 1,127 Net (Decrease) Increase in Cash, Cash Equivalents and Restricted Cash (24,361) 34,011 Cash, Restricted Cash and Cash Equivalents, Beginning of Period 112,551 118,771 Cash, Restricted Cash and Cash Equivalents, End of Period $ 88,190 $ 152,782
The accompanying notes are an integral part of these condensed consolidated financial statementsand should be read in conjunction herewith.
5

Table of Contents
SEACOR MARINE HOLDINGS INC.NOTES TO CONDENSED CONSOLIDATED FINANCIAL STATEMENTS
(unaudited) 1. BASIS OF PRESENTATION AND ACCOUNTING POLICIES
The condensed consolidated financial statements include the accounts of SEACOR Marine Holdings Inc. and its consolidatedsubsidiaries (the “Company”). In the opinion of management, all adjustments (consisting of normal recurring adjustments) have been made tofairly present the unaudited condensed consolidated financial statements for the periods indicated. Results of operations for the interim periodspresented are not necessarily indicative of operating results for the full year or any future periods.
Certain information and footnote disclosures normally included in financial statements prepared in accordance with generally accepted
accounting principles in the United States have been condensed or omitted. These condensed consolidated financial statements should be readin conjunction with the Company’s financial statements and related notes thereto included in the Company's Annual Report on Form 10-K forthe year ended December 31, 2017.
Unless the context otherwise indicates, any reference in this Quarterly Report on Form 10-Q to the “Company” refers to SEACOR
Marine Holdings Inc. and its consolidated subsidiaries and any reference in this Quarterly Report on Form 10-Q to “SEACOR Marine” refers toSEACOR Marine Holdings Inc. without its consolidated subsidiaries. Capitalized terms used and not specifically defined herein have the samemeaning given those terms in the Company's Annual Report on Form 10-K for the year ended December 31, 2017.
SEACOR Marine was previously a subsidiary of SEACOR Holdings Inc. (along with its consolidated subsidiaries, other thanSEACOR Marine and its subsidiaries, collectively referred to as “SEACOR Holdings”). On June 1, 2017, SEACOR Holdings completed aspin-off of SEACOR Marine by way of a pro rata dividend of SEACOR Marine’s common stock, par value $0.01 per share (“CommonStock”), all of which was then held by SEACOR Holdings, to SEACOR Holdings’ shareholders of record as of May 22, 2017 (the “Spin-off”).SEACOR Marine entered into certain agreements with SEACOR Holdings to govern SEACOR Marine’s relationship with SEACOR Holdingsfollowing the Spin-off, including a Distribution Agreement, two Transition Services Agreements, an Employee Matters Agreement and a TaxMatters Agreement. Immediately following the Spin-off, SEACOR Marine began to operate as an independent, publicly traded company.
Recently Adopted Accounting Standards. In May 2014, the Financial Accounting Standards Board (“FASB”) issued Accounting
Standards Update (“ASU”) 2014-09, “Revenue from Contracts with Customers (Topic 606)” to clarify the principles for recognizing revenueand to develop a common revenue standard and disclosure requirements. The new standard supersedes current revenue recognitionrequirements and industry-specific guidance. Under the new standard, revenue is recognized when a customer obtains control of promisedgoods or services in an amount that reflects the consideration the entity expects to receive in exchange for those goods or services. TheCompany adopted this new standard on January 1, 2018 using the modified retrospective approach by recognizing the cumulative effect ofinitially applying the new standard as an adjustment to the opening balance of accumulated deficit. The Company implemented the necessarychanges to its business processes, systems and controls to support recognition and disclosure of this ASU upon adoption. The Company'srevenues are primarily based on leases or rental agreements with customers and is not addressed in the new standard. As a result, the adoptionof the standard did not have a material effect on the Company's financial position, results of operations or cash flows, but did result in increaseddisclosures related to revenue recognition policies.
In November 2016, the FASB issued ASU 2016-18, “Statement of Cash Flows (Topic 230) – Restricted Cash”, which requires that
amounts generally described as restricted cash be included with cash and cash equivalents when reconciling the beginning-of-period and end-of-period amounts shown on the statement of cash flows. The Company adopted this new standard on January 1, 2018. Retrospectivepresentation was required. The adoption of the standard did not have a material effect on the Company's financial position, results of operationsor cash flows. In accordance with ASU 2016-18, the Company has included restricted cash as part of the beginning-of-period and end-of-periodcash balances on the condensed consolidated statement of cash flows.
Revenue Recognition. Revenue is recognized when (or as) the Company transfers promised goods or services to its customers in
amounts that reflect the consideration to which the Company expects to be entitled to in exchange for those goods or services, which occurswhen (or as) the Company satisfies its contractual obligations and transfers over control of the promised goods or services to its customers.Costs to obtain or fulfill a contract are expensed as incurred.
Lease Revenues. The primary source of the Company’s revenues is earned through time charter and bareboat agreements. Time charter
and bareboat agreements are rental agreements that are recognized ratably over the lease term as the services are provided, typically on a perday basis. The charterer will take the vessel on hire for a specific period of time and uses the vessel to move cargo, people or equipment andwill pay the Company a rate per day. Under a time charter, the Company provides a vessel to a customer for a set term and is responsible for alloperating expenses, typically excluding fuel. Under a bareboat charter, the Company provides a vessel to a customer for a set term and thecustomer assumes responsibility for all operating expenses and the risk of operation (see Note 15).
6

Table of Contents
Revenues from Customers. The Company contracts with various customers to carry out management services for vessels as agents forand on behalf of ship owners. These services include crew management, technical management, commercial management, insurancearrangements, sale and purchase of vessel, provisions, and bunkering. As the manager, the Company undertakes to use its best endeavors toprovide the agreed management services as agents for and on behalf of the owners in accordance with sound ship management practice and toprotect and promote the interest of the owners in all matters relating to the provision of services hereunder. The Company also contracts withvarious customers to carry out management services regarding engineering for vessel construction and vessel conversions. The vast majority ofthe ship management agreements span over the length of one to three years and are typically billed on a monthly basis. The Company transferscontrol of the service to the customer and satisfies its performance obligation over the term of the contract, and therefore recognizes revenueover the term of the contract while related costs are expensed as incurred (see Note 15).
Revenue that does not meet these criteria is deferred until the criteria is met and are considered contract liabilities. Contract liabilities,
included in other current liabilities in the accompanying condensed consolidated balance sheets, for the six months ended June 30 were asfollows (in thousands): 2018 2017 Balance at beginning of period $ 10,104 $ 6,953
Revenues deferred during the period 1,673 2,337 Revenues recognized during the period (1,550) —
Balance at end of period $ 10,227 $ 9,290
As of June 30, 2018, contract liabilities of $6.8 million related to the time charter of several offshore support vessels paid through theconveyance of an overriding royalty interest (the “Conveyance”) in developmental oil and gas producing properties operated by a customer inthe U.S. Gulf of Mexico. Payments under the Conveyance, and the timing of such payments, were contingent upon production and energy saleprices. On August 17, 2012, the customer filed a voluntary petition for Chapter 11 bankruptcy. The Company is vigorously defending itsinterest in connection with the bankruptcy filing; however, payments received under the Conveyance subsequent to May 19, 2012 are subject tocreditors’ claims in bankruptcy court. The Company will recognize revenues when reasonably assured of a judgment in its favor. All costs andexpenses related to these charters were recognized as incurred.
As of June 30, 2018, contract liabilities of $3.2 million related to the time charter of an offshore support vessel to a customer for whichcollection was not reasonably assured. The Company will recognize revenues when collected or when collection is reasonably assured. Allcosts and expenses related to this charter were recognized as incurred.
Property and Equipment. Equipment, stated at cost, is depreciated using the straight-line method over the estimated useful life of the
asset to an estimated salvage value. With respect to each class of asset, the estimated useful life is based upon a newly built asset being placedinto service and represents the time period beyond which it is typically not justifiable for the Company to continue to operate the asset in thesame or similar manner. From time to time, the Company may acquire older assets that have already exceeded the Company’s useful life policy,in which case the Company depreciates such assets based on its best estimate of remaining useful life, typically the next survey or certificationdate.
As of June 30, 2018, the estimated useful life (in years) of each of the Company’s major categories of new equipment was as follows:
Offshore Support Vessels:
Wind farm utility vessels 10 All other offshore support vessels (excluding wind farm utility) 20
Equipment maintenance and repair costs and the costs of routine overhauls, drydockings and inspections performed on vessels and
equipment are charged to operating expense as incurred. Expenditures that extend the useful life or improve the marketing and commercialcharacteristics of equipment as well as major renewals and improvements to other properties are capitalized.
Certain interest costs incurred during the construction of equipment are capitalized as part of the assets’ carrying values and areamortized over such assets’ estimated useful lives. During the six months ended June 30, 2018, capitalized interest totaled $1.0 million.
Impairment of Long-Lived Assets. The Company performs an impairment analysis of long-lived assets used in operations, including
intangible assets, when indicators of impairment are present. These indicators may include a significant decrease in the market price of a long-lived asset or asset group, a significant adverse change in the extent or manner in which a long-lived asset or asset group is being used or in itsphysical condition, or a current period operating or cash flow loss combined with a history of operating or cash flow losses or a forecast thatdemonstrates continuing losses associated with the use of a long-lived asset or asset group. If the carrying values of the assets are notrecoverable, as determined by the estimated undiscounted cash flows, the estimated fair value of the assets or asset groups are compared to theircurrent carrying values and impairment charges are recorded if the carrying value exceeds fair value. The Company performs its testing on anasset or asset group basis. Generally, fair value is determined using valuation techniques, such as expected discounted cash flows or appraisals,as appropriate. During the six months ended June 30, 2018, the Company recognized $3.0 million of impairment charges primarily related tofour anchor-handling vessels removed from service and adjusted to scrap value.
7

Table of ContentsImpairment of 50% or Less Owned Companies. Investments in 50% or less owned companies are reviewed periodically to assess
whether there is an other-than-temporary decline in the carrying value of the investment. In its evaluation, the Company considers, among otheritems, recent and expected financial performance and returns, impairments recorded by the investee and the capital structure of the investee.When the Company determines the estimated fair value of an investment is below carrying value and the decline is other-than-temporary, theinvestment is written down to its estimated fair value. Actual results may vary from the Company’s estimates due to the uncertainty regardingprojected financial performance, the severity and expected duration of declines in value, and the available liquidity in the capital markets tosupport the continuing operations of the investee, among other factors. Although the Company believes its assumptions and estimates arereasonable, the investee’s actual performance compared with the estimates could produce different results and lead to additional impairmentcharges in future periods. During the six months ended June 30, 2018, the Company recognized impairment charges of $1.2 million related toone of its 50% or less owned companies which the Company believes will be unable to meet all of its liabilities.
Income Taxes. During the six months ended June 30, 2018, the Company's effective income tax rate of 20.1% was primarily due to
taxes provided on income attributable to noncontrolling interests, foreign sourced income not subject to U.S. income taxes, foreign taxes notcreditable against U.S. income taxes, and a reversal of an unrecognized tax benefit. During the six months ended June 30, 2017, the Company’seffective income tax rate of 27.2% was primarily due to losses of foreign subsidiaries not benefited.
Deferred Gains. The Company has sold certain equipment to its 50% or less owned companies, entered into vessel sale-leasebacktransactions with finance companies, and provided seller financing on sales of its equipment to third parties and its 50% or less ownedcompanies. A portion of the gains realized from these transactions were deferred and recorded in deferred gains and other liabilities in theaccompanying condensed consolidated balance sheets. Deferred gain activity related to these transactions for the six months ended June 30 wasas follows (in thousands): 2018 2017 Balance at beginning of period $ 25,006 $ 33,910 Amortization of deferred gains included in operating expenses as a reduction to rental expense (4,019) (4,099) Other adjustments (250) (364)Balance at end of period $ 20,737 $ 29,447
Accumulated Other Comprehensive Income (Loss). The components of accumulated other comprehensive loss were as follows (inthousands):
SEACOR Marine Holdings Inc.
Stockholders’ Equity Noncontrolling Interests
ForeignCurrency
TranslationAdjustments
DerivativeIncome
(Losses) onCash FlowHedges, net Total
ForeignCurrency
TranslationAdjustments
DerivativeIncome
(Losses) onCash FlowHedges, net
OtherComprehensiveIncome (Loss)
December 31, 2017 $ (13,195) $ 702 $ (12,493) $ (1,357) $ 1 Other comprehensive income (loss) (847) 246 (601) (26) (7) $ (634)Income tax expense — (35) (35) — — (35)
Six months Ended June 30, 2018 $ (14,042) $ 913 $ (13,129) $ (1,383) $ (6) $ (669)
Loss Per Share. Basic loss per common share of the Company is computed based on the weighted average number of common sharesand warrants to purchase common shares at an exercise price of $0.01 per share (“Warrants”) issued and outstanding during the relevantperiods. The Warrants are included in the basic loss per common share because the shares issuable upon exercise of the Warrants are issuablefor de minimis cash consideration. Diluted loss per common share of the Company is computed based on the weighted average number ofcommon shares and Warrants issued and outstanding plus the effect of potentially dilutive securities through the application of the if-convertedmethod that assumes all common shares have been issued and outstanding during the relevant periods pursuant to the conversion ofthe Convertible Senior Notes. For the six months ended June 30, 2018 and 2017, diluted earnings per common share of the Company excluded2,183,708 and 4,070,500 common shares, respectively, issuable pursuant to the Company’s Convertible Senior Notes (see Note 4) as the effectof their inclusion in the computation would be anti-dilutive. In addition, for the six months ended June 30, 2018, diluted loss per commonshare of the Company excluded 196,338 shares of restricted stock and 694,691 outstanding stock options as the effect of their inclusion in thecomputation would be anti-dilutive.
New Accounting Pronouncements. On February 25, 2016, the Financial Accounting Standards Board (“FASB”) issued acomprehensive new leasing standard, which improves transparency and comparability among companies by requiring lessees to recognize alease liability and a corresponding lease asset for virtually all lease contracts. It also requires additional disclosures about leasing arrangements.The Company will adopt the new standard on January 1, 2019 and will use the modified retrospective approach upon adoption. The Companyexpects the adoption of the new standard will have a material impact on its consolidated financial position, results of operations and cash flows,although it has not yet determined the extent of the impact.
In February 2018, the FASB issued a new accounting standard which allows a reclassification from accumulated other comprehensive
income to retained earnings of stranded tax effects resulting from the Tax Cuts and Jobs Act passed in December 2017. The standard iseffective for interim and annual periods beginning after December 15, 2018. The Company does not expect the adoption of the new standard tohave a material impact on its consolidated financial position or its results of operations and cash flows.
In June 2018, the FASB issued a new accounting standard which addresses aspects of the accounting for nonemployee share-based
payment transactions. The standard is effective for interim and annual periods beginning after December 15, 2018. The Company does not

expect the adoption of the new standard to have a material impact on its consolidated financial position or its results of operations and cashflows.
8

Table of Contents 2. EQUIPMENT ACQUISITIONS AND DISPOSITIONS
During the six months ended June 30, 2018, capital expenditures were $18.8 million. Equipment deliveries during the sixmonths ended June 30, 2018 included one wind farm utility vessel, six liftboats contributed from Montco Offshore, LLC (“MOI”)to certain designated wholly-owned subsidiaries of Falcon Global Holdings LLC (“FGH”) as described in Note 4 below and twoplatform supply vessels constructed through the SEACOSCO joint venture as described in Note 3 below.
During the six months ended June 30, 2018, the Company sold one fast support vessel and two supply vessels previouslyretired and removed from service, one standby safety vessel, one supply vessel and one fast support vessel, and other property andequipment for net proceeds of $2.6 million ($2.5 million in cash and $0.1 million of previously received deposits) and gains of $1.4million. 3. INVESTMENTS, AT EQUITY, AND ADVANCES TO 50% OR LESS OWNED COMPANIES
SEACOSCO. On January 17, 2018, the Company announced the formation of SEACOSCO Offshore LLC(“SEACOSCO”), a Marshall Islands entity jointly owned by the Company and affiliates of COSCO SHIPPING GROUP (“COSCOSHIPPING”). SEACOSCO entered into contracts for the purchase of eight Rolls-Royce designed, new construction platformsupply vessels (“PSVs”) from COSCO SHIPPING HEAVY INDUSTRY (GUANGDONG) CO., LTD (the “Shipyard”), an affiliateof COSCO SHIPPING, for approximately $161.1 million, of which 70% will be financed by the Shipyard, and secured by thePSVs on a non-recourse basis to the Company. SEACOSCO took delivery of two vessels in the quarter ending March 31, 2018,took title to another five of the PSVs in the quarter ending June 30, 2018, and expects to take title to one vessel in 2019. Thereafter, the Shipyard, at its cost, will store the PSVs at its facility for periods ranging from six to 18 months. The Company'stotal committed investment for construction and working capital requirements is approximately $27.5 million for an unconsolidated50% interest in SEACOSCO. During the six months ended June 30, 2018, the Company contributed capital of $25.6 million incash. The remaining committed investment will be due as the remaining vessel and equipment are delivered as part of the $27.5million commitment. The Company is responsible for full commercial, operational, and technical management of the vessels on aworldwide basis.
SEACOR Grant DIS. As of June 30, 2018, the Company estimates that SEACOR Grant DIS will be unable to meet all its
liabilities, and has recorded a bad debt reserve of $0.4 million against SEACOR Grant DIS’s liability to the Company and animpairment charge of $1.2 million to reduce its investment carrying value to zero.
Guarantees. The Company has guaranteed certain of the outstanding charter receivables of one of its managed 50% or
less owned companies if a customer defaults in payment and the Company either fails to take enforcement action against thedefaulting customer or fails to assign its right of recovery against the defaulting customer. As of June 30, 2018, the total amountguaranteed by the Company under this arrangement is $0.5 million.
In addition, as of June 30, 2018, two of the Company's 50% or less owned companies have bank debt secured by, among
other things, a first preferred mortgage on their vessels. The banks also have the authority to require the Company and its partnersto fund uncalled capital commitments, as defined in the partnership agreements. In such event, the Company would be required tocontribute its allocable share of uncalled capital, which is $1.2 million in the aggregate. This liability is included in other long-termliabilities.
4. LONG-TERM DEBT
Convertible Senior Notes. On December 1, 2015, the Company issued $175.0 million in aggregate principal amount of itsConvertible Senior Notes (the “Convertible Senior Notes”), at an interest rate of 3.75%, due December 1, 2022, to investmentfunds managed and controlled by the Carlyle Group (collectively “Carlyle”). The Convertible Senior Notes are convertible intoshares of Common Stock at a conversion rate of 23.26 shares per $1,000 in principal amount of such notes, subject to certainconditions, or, into Warrants to purchase an equal number of shares of Common Stock at an exercise price of $0.01 per share inorder to facilitate the Company's compliance with the provisions of the Jones Act.
On May 2, 2018, the Company and Carlyle entered into an exchange transaction (the “Exchange”) pursuant to which
Carlyle exchanged $50 million in principal amount of the Convertible Senior Notes for Warrants to purchase 1,886,792 shares ofCommon Stock (to facilitate compliance with the provisions of the Jones Act) at an exercise price of $0.01 per share, subject toadjustments (the “Carlyle Warrants”), representing an implied exchange rate of approximately 37.73 shares per $1,000 in principalamount of the Convertible Senior Notes (equivalent to an exchange price of $26.50 per share). The Carlyle Warrants have a 25-yearterm, which commenced May 2, 2018. The Company and Carlyle also amended the $125.0 million in principal amount ofConvertible Senior Notes that remained outstanding following the Exchange to (i) increase the interest rate from 3.75% per annumto 4.25% per annum and (ii) extend the maturity date of the Convertible Senior Notes by 12 months to December 1, 2023. Intereston the Convertible Senior Notes is payable semi-annually on June 15 and December 15 of each year.
9


Table of Contents
MOI Joint Venture. On February 8, 2018, a wholly-owned subsidiary of the Company and MOI formed and capitalized ajoint venture named Falcon Global Holdings LLC. In connection therewith and MOI’s plan of reorganization, which wasconfirmed on January 18, 2018, MOI emerged from its Chapter 11 bankruptcy case. In accordance with the terms of a Joint VentureContribution and Formation Agreement, the Company and MOI contributed certain liftboat vessels and other related assets to FGHand its designated subsidiaries, and FGH and its designated subsidiaries assumed certain operating liabilities and indebtednessassociated with the liftboat vessels and related assets. On February 8, 2018, Falcon Global USA LLC (“FGUSA”), a wholly-ownedsubsidiary of FGH, paid $15.0 million of MOI’s debtor-in-possession obligations and entered into a $131.1 million creditagreement comprised of a $116.1 million term loan (the “FGUSA Term Loan”) and a $15.0 million revolving loan facility (the“FGUSA Revolving Loan Facility”) bearing interest at a variable rate (currently 6.63%), maturing in 2024, and secured by vesselsowned by wholly-owned subsidiaries of FGUSA (the “FGUSA Credit Facility”). The full amount of the FGUSA Term Loan andother amounts paid by affiliates of MOI satisfied in full the amounts outstanding under MOI’s pre-petition credit facilities. TheFGUSA Credit Facility, apart from a guarantee of certain interest payments and participation fees for two years after the closing ofthe transactions, is non-recourse to SEACOR Marine and its subsidiaries other than FGUSA. The Company performed a fairmarket valuation of the debt reflecting a debt discount of $10.0 million, which will be amortized over the life of the FGUSA CreditFacility. Scheduled principal payments begin in 2020. During the six months ending June 30, 2018, the Company borrowed $10.0million under the FGUSA Revolving Loan Facility for working capital purposes. The Company consolidates FGH as the Companyholds 72% of the equity interest in FGH and is entitled to appoint a majority of the board of managers of FGH.
Windcat. During the six months ended June 30, 2018, the Company converted €6.0 million denominated debt to pound
sterling debt, paying off approximately $7.5 million in euro debt and borrowing approximately $8.5 million in pound sterling debt,resulting in a net increase in USD borrowings of $1.0 million to be used for future capital commitments.
Letters of Credit. As of June 30, 2018, the Company had outstanding letters of credit of $7.9 million securing one long-term
debt obligation, and $1.7 million for labor and performance guarantees.
5. INCOME TAXES
The following table reconciles the difference between the statutory federal income tax rate for the Company and theeffective income tax rate on continuing operations for the six months ended June 30, 2018: Statutory rate 21.0%Noncontrolling interests (1.2)%Foreign earnings not subject to U.S. income tax (3.0)%Foreign taxes not creditable against U.S. income tax (2.4)%Unrecognized tax benefit 5.4%Other 0.3% 20.1%
As of December 31, 2017, the Company's net operating loss carryforwards excluded potential tax benefits of $3.9 million asa result of uncertainty regarding interpretation of the new U.S. tax legislation signed into law on December 22, 2017. Subsequentguidance has confirmed that the Company should recognize the tax benefits of $3.9 million and therefore, for the six monthsending June 30, 2018, the Company removed the valuation allowance previously established against the net operating losscarryforwards.
6. DERIVATIVE INSTRUMENTS AND HEDGING STRATEGIES
Derivative instruments are classified as either assets or liabilities based on their individual fair values. The fair values of theCompany’s derivative instruments as of June 30, 2018 were as follows (in thousands):
Derivative
Asset(1) DerivativeLiability
Derivatives designated as hedging instruments: Interest rate swap agreements (cash flow hedges) $ 436 $ 44(2)
436 44 Derivatives not designated as hedging instruments:
Conversion option liability on Convertible Senior Notes — 21,886 Interest rate swap agreements 1,104 —
$ 1,540 $ 21,930 ______________________(1) Included in other receivables in the accompanying condensed consolidated balance sheets.(2) Included in other current liabilities in the accompanying condensed consolidated balance sheets.
10

Table of ContentsCash Flow Hedges. The Company and certain of its 50% or less owned companies have interest rate swap agreements
designated as cash flow hedges. By entering into these interest rate swap agreements, the Company and its 50% or less ownedcompanies have converted the variable LIBOR or EURIBOR component of certain of their outstanding borrowings to a fixedinterest rate. The Company recognized immaterial losses on derivative instruments designated as cash flow hedges during the sixmonths ended June 30, 2018. As of June 30, 2018, the interest rate swaps held by the Company and its 50% or less ownedcompanies were as follows:
• Windcat Workboats had two interest rate swap agreements maturing in 2021 that call for the Company to pay a fixed rate of
interest of (0.03)% on the aggregate notional value of €15.0 million (approximately $17.5 million) and receive a variableinterest rate based on EURIBOR on the aggregate notional value.
• MexMar had five interest rate swap agreements with maturities in 2023 that call for MexMar to pay a fixed rate of interest
ranging from 1.71% to 2.10% on the aggregate amortized notional value of $104.0 million and receive a variable interestrate based on LIBOR on the aggregate amortized notional value.
• Sea-Cat Crewzer II had an interest rate swap agreement maturing in 2019 that calls for Sea-Cat Crewzer II to pay a fixed
rate of interest of 1.52% on the amortized notional value of $19.7 million and receive a variable interest rate based onLIBOR on the amortized notional value.
• Sea-Cat Crewzer had an interest rate swap agreement maturing in 2019 that calls for Sea-Cat Crewzer to pay a fixed rate of
interest of 1.52% on the amortized notional value of $17.4 million and receive a variable interest rate based on LIBOR onthe amortized notional value.
Other Derivative Instruments. The Company recognized (losses) gains on derivative instruments not designated as hedging
instruments for the six months ended June 30 as follows (in thousands):
2018 2017 Conversion option liability on Convertible Senior Notes $ (15,054) $ 145 Forward currency exchange, option and future contracts — (56) Interest rate swap agreements 870 (391) $ (14,184) $ (302)
The conversion option liability relates to the bifurcated embedded conversion option in the Convertible Senior Notes (seeNote 4 in this Quarterly Report on Form 10-Q and Note 7 in the Company's Annual Report on Form 10-K for the year endedDecember 31, 2017).
The Company and certain of its 50% or less owned companies have entered into interest rate swap agreements for thegeneral purpose of providing protection against increases in interest rates, which might lead to higher interest costs. As of June 30,2018, the interest rate swaps held by the Company or its 50% or less owned companies were as follows:
• Falcon Global International had an interest rate swap agreement maturing in 2022 that calls for the Company to pay a fixed
interest rate of 2.06% on the amortized notional value of $53.1 million and receive a variable interest rate based on LIBORon the amortized notional value.
• OSV Partners had two interest rate swap agreements with maturities in 2020 that call for OSV Partners to pay a fixed rate of
interest ranging from 1.89% to 2.27% on the aggregate amortized notional value of $30.4 million and receive a variableinterest rate based on LIBOR on the aggregate amortized notional value.
7. FAIR VALUE MEASUREMENTS
The fair value of an asset or liability is the price that would be received to sell an asset or transfer a liability (an exit price) in theprincipal or most advantageous market for the asset or liability in an orderly transaction between market participants on the measurement date.The Company utilizes a fair value hierarchy that maximizes the use of observable inputs and minimizes the use of unobservable inputs whenmeasuring fair value and defines three levels of inputs that may be used to measure fair value. Level 1 inputs are quoted prices in active marketsfor identical assets or liabilities. Level 2 inputs are observable inputs other than quoted prices included in Level 1 that are observable for theasset or liability, either directly or indirectly, including quoted prices for similar assets or liabilities in active markets, quoted prices in marketsthat are not active, inputs other than quoted prices that are observable for the asset or liability, or inputs derived from observable market data.Level 3 inputs are unobservable inputs that are supported by little or no market activity and are significant to the fair value of the assets orliabilities.
The Company’s financial assets and liabilities as of June 30, 2018 that are measured at fair value on a recurring basis were as follows(in thousands): Level 1 Level 2 Level 3 ASSETS Derivative instruments (included in other receivables) $ — $ 1,541 $ — Construction reserve funds 38,152 — — LIABILITIES

Derivative instruments — 44 21,886 11

Table of ContentsLevel 3 Measurement. The fair value of the conversion option liability on the Convertible Senior Notes is estimated with significant
inputs that are both observable and unobservable in the market and therefore is considered a Level 3 fair value measurement. The Companyused a binomial lattice model that assumes the holders will maximize their value by finding the optimal decision between redeeming at theredemption price or converting into shares of Common Stock. This model estimates the fair value of the conversion option as the differential inthe fair value of the notes including the conversion option compared with the fair value of the notes excluding the conversion option. Thesignificant observable inputs used in the fair value measurement include the price of Common Stock and the risk free interest rate. Thesignificant unobservable inputs are the estimated Company credit spread and Common Stock volatility, which were based on comparablecompanies in the transportation and energy industries.
The estimated fair values of the Company’s other financial assets and liabilities as of June 30, 2018 were as follows (in thousands): Estimated Fair Value
CarryingAmount Level 1 Level 2 Level 3
ASSETS Cash, cash equivalents and restricted cash $ 88,190 $ 88,190 $ — $ — Investments, at cost, in 50% or less owned companies (included in otherassets) 132 see below LIABILITIES Long-term debt, including current portion 371,770 — 357,742 —
The carrying value of cash, cash equivalents and restricted cash approximates fair value. The fair value of the Company’s long-termdebt was estimated based upon quoted market prices or by using discounted cash flow analysis based on estimated current rates for similartypes of arrangements. The long-term debt balance includes $121.6 million, net, assumed from FGUSA. It was not practicable to estimate thefair value of certain of the Company’s investments, at cost, in 50% or less owned companies because of the lack of quoted market prices andthe inability to estimate fair value without incurring excessive costs. Considerable judgment was required in developing certain of the estimatesof fair value and, accordingly, the estimates presented herein are not necessarily indicative of the amounts that the Company could realize in acurrent market exchange.
The Company’s other assets and liabilities that were measured at fair value during the six months ended June 30, 2018 were as follows(in thousands): Level 1 Level 2 Level 3 ASSETS Property and equipment:
Anchor handling towing supply $ — $ 2,000 $ — Liftboats — — 134,775
Property and equipment. During the six months ended June 30, 2018, the Company recognized impairment charges of $3.0 million
primarily associated with certain vessels (see Note 1). The Level 2 fair values were determined based on the sales prices of similar propertyand equipment at scrap value.
The Level 3 vessels listed above were contributed by MOI to wholly-owned subsidiaries of FGH and recorded at fair value. The Level 3
fair values were determined based on two separate third-party valuations using significant inputs that are unobservable in the market. Due tolimited market transactions, the primary valuation methodology applied by both appraisers was an estimated cost approach less economicdepreciation for comparable aged vessels. The Level 3 fair value of the vessels was based on a simple average between the two appraisals.
The significant unobservable inputs used in the fair value measurement for the liftboats provided by the appraisers were based on i)
quotes from local shipyards, ii) economic life ranging from 25 to 40 years and iii) economic obsolescence factor ranging from 45% to 50%.The calculated yearly physical depreciation was multiplied by the remaining useful life of each vessel, based on the date of build, and theresidual value was added back to arrive at a base cost approach value for each vessel.
8. WARRANTS
On April 26, 2018, the Company closed a private placement of its Common Stock and Warrants to purchase its CommonStock (to facilitate compliance with Jones Act restrictions) for aggregate gross proceeds of $56,855,000 (the “PIPE PrivatePlacement”) with certain qualified institutional buyers and other accredited investors. The PIPE Private Placement included theissuance of 2,168,586 shares of Common Stock (the “PIPE Shares”) and Warrants to purchase 674,164 shares of the CommonStock at an exercise price of $0.01 per share (the “PIPE Warrants”). The PIPE Warrants were issued to Proyectos Globales deEnergia y Servicios CME, S.A. de C.V. a variable capital corporation (sociedad anónima de capital variable) incorporated andexisting under the laws of the United Mexican States (“CME”) and have a 25-year term, which commenced April 26, 2018.
As indicated in Note 4, on May 2, 2018, the Company and Carlyle entered into the Exchange pursuant to which Carlyle
exchanged $50.0 million in principal amount of the Convertible Senior Notes for the Carlyle Warrants. The Carlyle Warrants have a25-year term, which commenced May 2, 2018.
12

Table of Contents
On May 31, 2018, Carlyle exercised Carlyle Warrants to purchase a total of 250,585 shares of Common Stock (after givingeffect to the withholding of 108 shares of Common Stock as payment for the exercise price of the Warrants - see Note 14) (the“Carlyle Warrant Exercise”). Following the Carlyle Warrant Exercise, Carlyle holds Warrants to purchase 1,636,099 shares ofCommon Stock at an exercise price of $0.01 per share.
On June 8, 2018, CME exercised PIPE Warrants and paid an aggregate cash exercise price of $0.01 per share to purchase a
total of 38,857 shares of Common Stock (the “CME Warrant Exercise”). Following the CME Warrant Exercise, CME holdsWarrants to purchase 635,307 shares of Common Stock at an exercise price of $0.01 per share.
Weighted Average
Exercise Price Number ofWarrants
Balance as of December 31, 2017 — — Warrants issued - January 1 - June 30, 2018 $ 0.01 2,560,956 Warrants exercised - January 1 - June 30, 2018 $ 0.01 (289,550)Balance as of June 30, 2018 $ 0.01 2,271,406 9. STOCKHOLDERS' EQUITY
On January 1, 2018, the Company adopted a new accounting standard issued by the FASB on October 24, 2016, whichrequires companies to account for the income tax effects of intercompany sales and transfers of assets other than inventory. Theimpact of the adoption of the new standard resulted in a reduction of $12.1 million to the Company’s opening retained earnings.
On February 8, 2018, the Company formed FGH, a joint venture between the Company and MOI. In accordance with the
terms of the Joint Venture Contribution and Formation Agreement, the Company and MOI contributed certain liftboat vessels andother related assets to the joint venture and assumed certain operating liabilities and indebtedness associated with the liftboatvessels and related assets. The transaction consolidates the fifteen liftboat vessels operated by the Company and six liftboat vesselspreviously operated by MOI. FGUSA, a wholly-owned subsidiary of FGH, paid $15.0 million of MOI's debtor-in-possessionobligations and entered into a $131.1 million credit agreement comprised of the FGUSA Term Loan and the FGUSA RevolvingLoan Facility. The Company performed a fair market valuation of the debt reflecting a debt discount of $10.0 million, which will beamortized over the life of the FGUSA Credit Facility.
On March 26, 2018, the Company issued 103,213 shares of Common Stock to an accredited investor for a total of $1.8
million in gross proceeds pursuant to a private placement in reliance on the exemption from registration set forth in Section 4(a)(2)of the Securities Act.
As indicated in Note 8, on April 26, 2018, the Company closed the PIPE Private Placement for aggregate gross proceeds of
$56,855,000 with certain qualified institutional buyers and other accredited investors. The PIPE Private Placement included theissuance of the PIPE Shares and the PIPE Warrants. The PIPE Shares and PIPE Warrants were issued in reliance upon theexemption from registration provided by Section 4(a)(2) of the Securities Act.
As indicated in Notes 4 and 8, on May 2, 2018, the Company and Carlyle entered into the Exchange pursuant to which
Carlyle exchanged $50.0 million in principal amount of the Convertible Senior Notes for the Carlyle Warrants. The CarlyleWarrants were issued in reliance upon the exemption from registration provided by Section 4(a)(2) of the Securities Act. 10. NONCONTROLLING INTERESTS IN SUBSIDIARIES
Noncontrolling interests in the Company’s consolidated subsidiaries were as follows (in thousands):
Noncontrolling
Interests June 30, 2018 December 31, 2017 Falcon Global Holdings 28.0% $ 26,967 $ 12,087 Windcat Workboats 12.5% 2,201 2,608 Other 1.8% 287 280 $ 29,455 $ 14,975
Falcon Global Holdings. The Company formed FGH, a joint venture between the Company and MOI. The Company andMOI contributed certain liftboat vessels and other related assets to FGH and its designated subsidiaries and assumed certainoperating liabilities and indebtedness associated with the liftboat vessels and related assets, including a previous joint venture(“Falcon Global International” or “FGI”) that owned and operated two liftboats. The transaction consolidates the 15 liftboatvessels operated by the Company and six liftboat vessels previously operated by MOI. The total capital contributed to FGH wasapproximately $112.5 million of which, $43.3 million was transferred from FGI and $18.8 million was contributed by MOI andrecorded at fair value, with the remaining capital contributed by the Company. As a result of the transaction, the noncontrollinginterest in the joint venture held by MOI is 28.0%.

During the six months ended June 30, 2018, the net loss of Falcon Global Holdings was $14.4 million, of which $4.0million was attributable to noncontrolling interests.
13
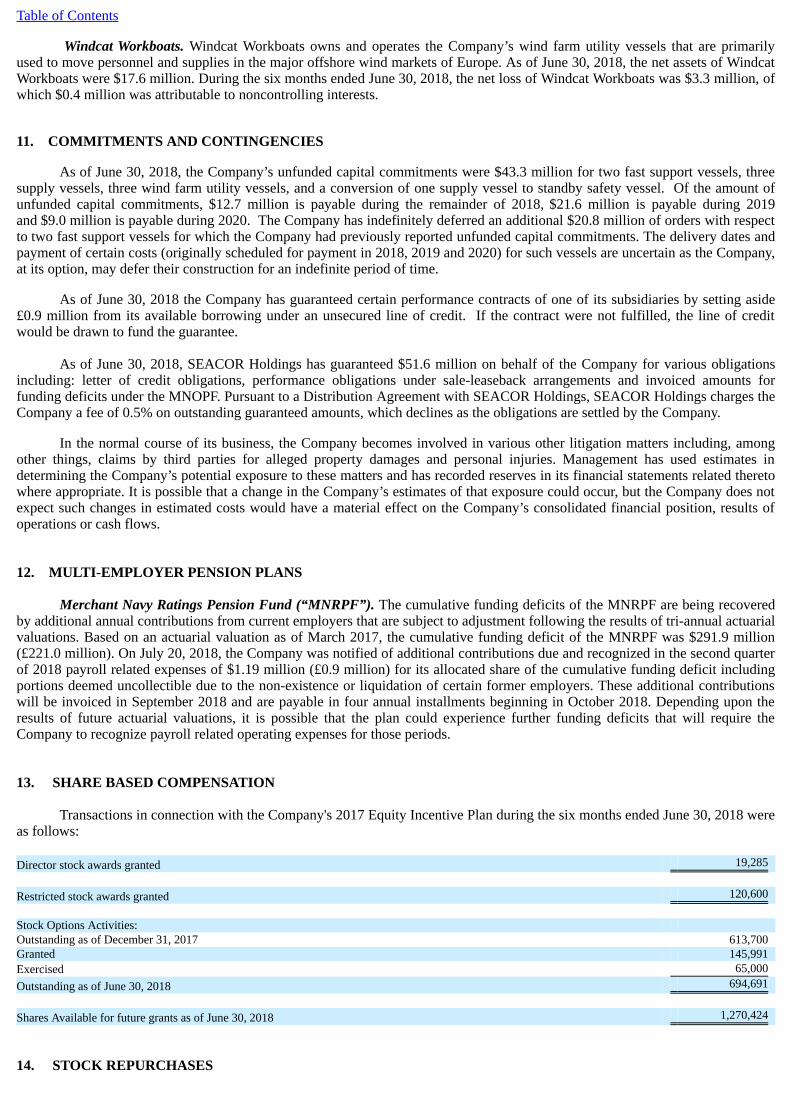
Table of Contents
Windcat Workboats. Windcat Workboats owns and operates the Company’s wind farm utility vessels that are primarilyused to move personnel and supplies in the major offshore wind markets of Europe. As of June 30, 2018, the net assets of WindcatWorkboats were $17.6 million. During the six months ended June 30, 2018, the net loss of Windcat Workboats was $3.3 million, ofwhich $0.4 million was attributable to noncontrolling interests. 11. COMMITMENTS AND CONTINGENCIES
As of June 30, 2018, the Company’s unfunded capital commitments were $43.3 million for two fast support vessels, threesupply vessels, three wind farm utility vessels, and a conversion of one supply vessel to standby safety vessel. Of the amount ofunfunded capital commitments, $12.7 million is payable during the remainder of 2018, $21.6 million is payable during 2019and $9.0 million is payable during 2020. The Company has indefinitely deferred an additional $20.8 million of orders with respectto two fast support vessels for which the Company had previously reported unfunded capital commitments. The delivery dates andpayment of certain costs (originally scheduled for payment in 2018, 2019 and 2020) for such vessels are uncertain as the Company,at its option, may defer their construction for an indefinite period of time.
As of June 30, 2018 the Company has guaranteed certain performance contracts of one of its subsidiaries by setting aside£0.9 million from its available borrowing under an unsecured line of credit. If the contract were not fulfilled, the line of creditwould be drawn to fund the guarantee.
As of June 30, 2018, SEACOR Holdings has guaranteed $51.6 million on behalf of the Company for various obligations
including: letter of credit obligations, performance obligations under sale-leaseback arrangements and invoiced amounts forfunding deficits under the MNOPF. Pursuant to a Distribution Agreement with SEACOR Holdings, SEACOR Holdings charges theCompany a fee of 0.5% on outstanding guaranteed amounts, which declines as the obligations are settled by the Company.
In the normal course of its business, the Company becomes involved in various other litigation matters including, amongother things, claims by third parties for alleged property damages and personal injuries. Management has used estimates indetermining the Company’s potential exposure to these matters and has recorded reserves in its financial statements related theretowhere appropriate. It is possible that a change in the Company’s estimates of that exposure could occur, but the Company does notexpect such changes in estimated costs would have a material effect on the Company’s consolidated financial position, results ofoperations or cash flows.
12. MULTI-EMPLOYER PENSION PLANS
Merchant Navy Ratings Pension Fund (“MNRPF”). The cumulative funding deficits of the MNRPF are being recoveredby additional annual contributions from current employers that are subject to adjustment following the results of tri-annual actuarialvaluations. Based on an actuarial valuation as of March 2017, the cumulative funding deficit of the MNRPF was $291.9 million(£221.0 million). On July 20, 2018, the Company was notified of additional contributions due and recognized in the second quarterof 2018 payroll related expenses of $1.19 million (£0.9 million) for its allocated share of the cumulative funding deficit includingportions deemed uncollectible due to the non-existence or liquidation of certain former employers. These additional contributionswill be invoiced in September 2018 and are payable in four annual installments beginning in October 2018. Depending upon theresults of future actuarial valuations, it is possible that the plan could experience further funding deficits that will require theCompany to recognize payroll related operating expenses for those periods.
13. SHARE BASED COMPENSATION
Transactions in connection with the Company's 2017 Equity Incentive Plan during the six months ended June 30, 2018 wereas follows:
Director stock awards granted 19,285 Restricted stock awards granted 120,600 Stock Options Activities: Outstanding as of December 31, 2017 613,700 Granted 145,991 Exercised 65,000 Outstanding as of June 30, 2018 694,691 Shares Available for future grants as of June 30, 2018 1,270,424 14. STOCK REPURCHASES

On May 14, 2018, the Company acquired for treasury 2,242 shares of Common Stock for an aggregate purchase price of$51,454 from its employees to cover their tax withholding obligations upon the lapsing of restrictions on share awards. Theseshares were purchased in accordance with the terms of the Company's 2017 Equity Incentive Plan and not pursuant to therepurchase authorizations granted by the Company's Board of Directors. On May 24, 2018, in connection with the net settlement ofthe Carlyle Warrant Exercise, the Company acquired for treasury 108 shares of Common Stock for an aggregate purchase price of$2,562 from Carlyle to cover the $0.01 exercise price of the Carlyle Warrants. (See Note 8).
14

Table of Contents 15. SEGMENT INFORMATION
The Company’s segment presentation and basis of measurement of segment profit or loss are as previously described in theCompany’s Annual Report on Form 10-K for the year ended December 31, 2017. The following tables summarize the operatingresults, capital expenditures and assets of the Company’s reportable segments (in thousands).
United States(primarily
Gulf ofMexico)
Africa(primarily
West Africa) Middle East
and Asia
Brazil,Mexico,
Central andSouth
America
Europe(primarilyNorth Sea) Total
For the Three Months Ended June 30,2018 Time Charter Statistics:
Average Rates Per Day $ 10,503 $ 9,509 $ 8,226 $ 19,127 $ 4,823 $ 7,324 Fleet Utilization 23% 88% 82% 57% 76% 62%Fleet Available Days 3,710 1,331 2,005 416 5,066 12,528
Operating Revenues: Time charter $ 9,052 $ 11,122 $ 13,591 $ 4,556 $ 18,505 $ 56,826 Bareboat charter — — — 1,156 — 1,156 Other marine services 1,676 350 (792) 845 640 2,719
10,728 11,472 12,799 6,557 19,145 60,701 Direct Costs and Expenses:
Operating: Personnel 4,636 4,314 4,069 1,219 10,495 24,733 Repairs and maintenance 1,529 1,663 3,576 32 2,270 9,070 Drydocking 910 910 72 11 1,209 3,112 Insurance and loss reserves 902 248 361 169 254 1,934 Fuel, lubes and supplies 900 900 922 349 1,051 4,122 Other 29 1,402 836 488 254 3,009
8,906 9,437 9,836 2,268 15,533 45,980 Direct Vessel Profit $ 1,822 $ 2,035 $ 2,963 $ 4,289 $ 3,612 14,721 Other Costs and Expenses:
Operating: Leased-in equipment $ 1,856 $ 962 $ — $ — $ 22 2,840 Administrative and general 15,532 Depreciation and amortization $ 5,915 $ 2,924 $ 4,311 $ 2,280 $ 2,976 18,406
36,778 Gains on Asset Dispositions andImpairments 1,055 Operating Loss $ (21,002)
15

Table of Contents
United States(primarily
Gulf ofMexico)
Africa(primarily
West Africa) Middle East
and Asia
Brazil,Mexico,
Central andSouth
America
Europe(primarilyNorth Sea) Total
For the Six Months Ended June 30,2018 Time Charter Statistics:
Average Rates Per Day $ 9,740 $ 9,482 $ 8,155 $ 18,069 $ 4,984 $ 7,174 Fleet Utilization 20% 89% 74% 52% 72% 58%Fleet Available Days 7,760 2,591 4,137 635 10,006 25,129
Operating Revenues: Time charter $ 15,034 $ 21,916 $ 24,965 $ 5,930 $ 36,123 $ 103,968 Bareboat charter — — — 2,299 — 2,299 Other marine services 3,331 1,637 (922) 955 1,154 6,155
18,365 23,553 24,043 9,184 37,277 112,422 Direct Costs and Expenses:
Operating: Personnel 8,628 8,387 8,091 1,595 19,708 46,409 Repairs and maintenance 2,223 3,019 6,004 337 4,560 16,143 Drydocking 1,435 912 61 11 2,950 5,369 Insurance and loss reserves 1,336 466 597 236 489 3,124 Fuel, lubes and supplies 1,393 1,569 1,956 414 2,335 7,667 Other 54 2,438 2,044 548 532 5,616
15,069 16,791 18,753 3,141 30,574 84,328 Direct Vessel Profit $ 3,296 $ 6,762 $ 5,290 $ 6,043 $ 6,703 28,094 Other Costs and Expenses:
Operating: Leased-in equipment $ 3,718 $ 1,925 $ — $ — $ 22 5,665
Administrative and general 28,339 Depreciation and amortization $ 12,450 $ 5,731 $ 10,401 $ 3,499 $ 5,837 37,918
71,922 Losses on Asset Dispositions andImpairment (1,588)Operating Loss $ (45,416) As of June 30, 2018 Property and Equipment:
Historical cost $ 439,026 $ 184,037 $ 317,536 $ 165,145 $ 182,111 $ 1,287,855 Accumulated depreciation (225,116) (57,909) (86,239) (58,078) (137,135) (564,477)
$ 213,910 $ 126,128 $ 231,297 $ 107,067 $ 44,976 $ 723,378
16
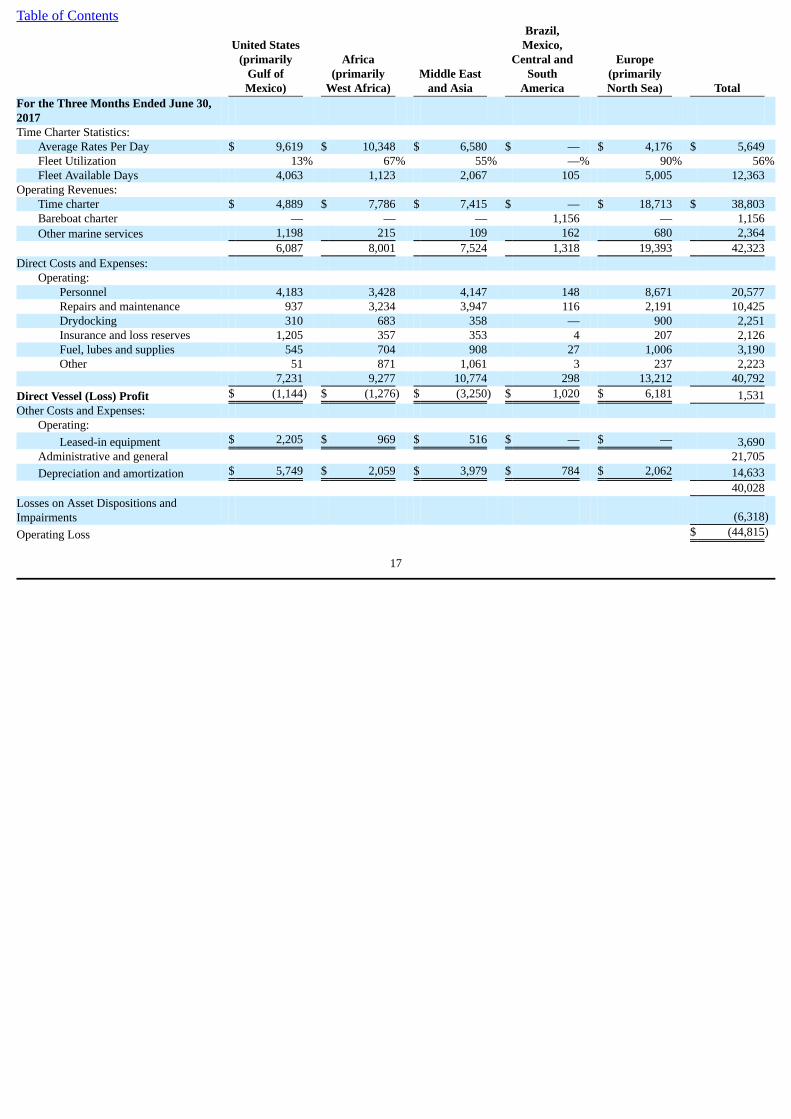
Table of Contents
United States(primarily
Gulf ofMexico)
Africa(primarily
West Africa) Middle East
and Asia
Brazil,Mexico,
Central andSouth
America
Europe(primarilyNorth Sea) Total
For the Three Months Ended June 30,2017 Time Charter Statistics:
Average Rates Per Day $ 9,619 $ 10,348 $ 6,580 $ — $ 4,176 $ 5,649 Fleet Utilization 13% 67% 55% —% 90% 56%Fleet Available Days 4,063 1,123 2,067 105 5,005 12,363
Operating Revenues: Time charter $ 4,889 $ 7,786 $ 7,415 $ — $ 18,713 $ 38,803 Bareboat charter — — — 1,156 — 1,156 Other marine services 1,198 215 109 162 680 2,364
6,087 8,001 7,524 1,318 19,393 42,323 Direct Costs and Expenses:
Operating: Personnel 4,183 3,428 4,147 148 8,671 20,577 Repairs and maintenance 937 3,234 3,947 116 2,191 10,425 Drydocking 310 683 358 — 900 2,251 Insurance and loss reserves 1,205 357 353 4 207 2,126 Fuel, lubes and supplies 545 704 908 27 1,006 3,190 Other 51 871 1,061 3 237 2,223
7,231 9,277 10,774 298 13,212 40,792 Direct Vessel (Loss) Profit $ (1,144) $ (1,276) $ (3,250) $ 1,020 $ 6,181 1,531 Other Costs and Expenses:
Operating: Leased-in equipment $ 2,205 $ 969 $ 516 $ — $ — 3,690
Administrative and general 21,705 Depreciation and amortization $ 5,749 $ 2,059 $ 3,979 $ 784 $ 2,062 14,633
40,028 Losses on Asset Dispositions andImpairments (6,318)Operating Loss $ (44,815)
17
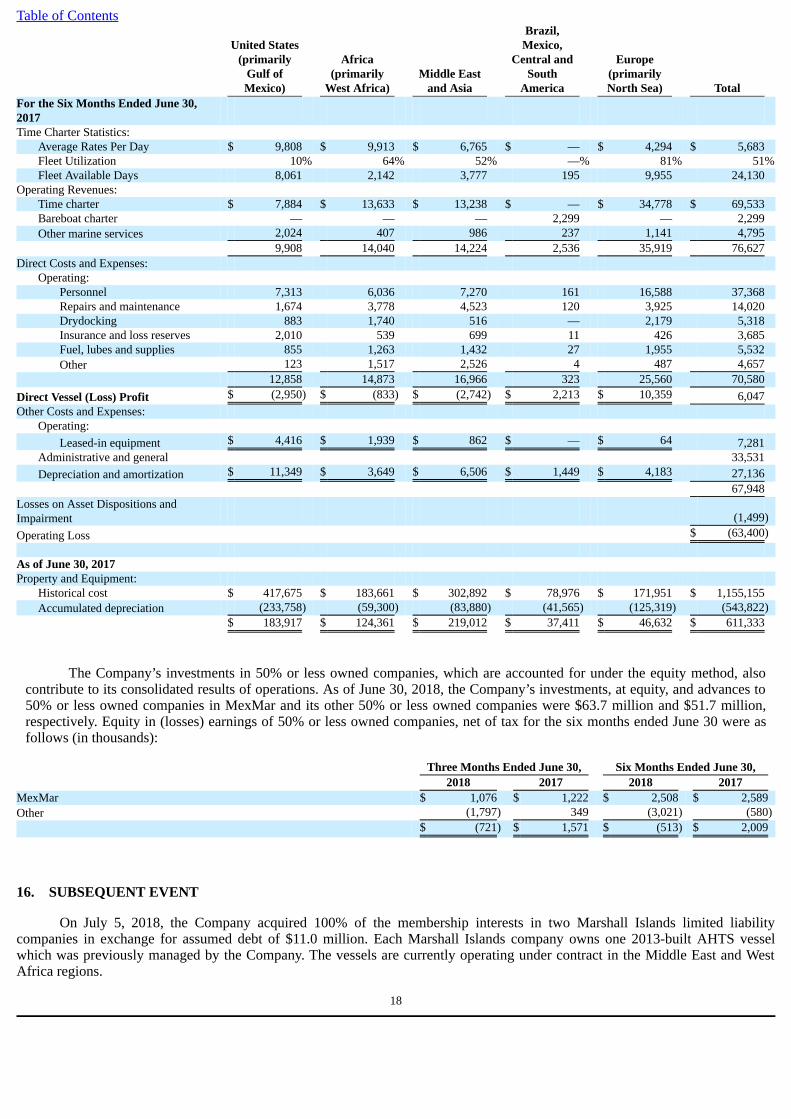
Table of Contents
United States(primarily
Gulf ofMexico)
Africa(primarily
West Africa) Middle East
and Asia
Brazil,Mexico,
Central andSouth
America
Europe(primarilyNorth Sea) Total
For the Six Months Ended June 30,2017 Time Charter Statistics:
Average Rates Per Day $ 9,808 $ 9,913 $ 6,765 $ — $ 4,294 $ 5,683 Fleet Utilization 10% 64% 52% —% 81% 51%Fleet Available Days 8,061 2,142 3,777 195 9,955 24,130
Operating Revenues: Time charter $ 7,884 $ 13,633 $ 13,238 $ — $ 34,778 $ 69,533 Bareboat charter — — — 2,299 — 2,299 Other marine services 2,024 407 986 237 1,141 4,795
9,908 14,040 14,224 2,536 35,919 76,627 Direct Costs and Expenses:
Operating: Personnel 7,313 6,036 7,270 161 16,588 37,368 Repairs and maintenance 1,674 3,778 4,523 120 3,925 14,020 Drydocking 883 1,740 516 — 2,179 5,318 Insurance and loss reserves 2,010 539 699 11 426 3,685 Fuel, lubes and supplies 855 1,263 1,432 27 1,955 5,532 Other 123 1,517 2,526 4 487 4,657
12,858 14,873 16,966 323 25,560 70,580 Direct Vessel (Loss) Profit $ (2,950) $ (833) $ (2,742) $ 2,213 $ 10,359 6,047 Other Costs and Expenses:
Operating: Leased-in equipment $ 4,416 $ 1,939 $ 862 $ — $ 64 7,281
Administrative and general 33,531 Depreciation and amortization $ 11,349 $ 3,649 $ 6,506 $ 1,449 $ 4,183 27,136
67,948 Losses on Asset Dispositions andImpairment (1,499)Operating Loss $ (63,400) As of June 30, 2017 Property and Equipment:
Historical cost $ 417,675 $ 183,661 $ 302,892 $ 78,976 $ 171,951 $ 1,155,155 Accumulated depreciation (233,758) (59,300) (83,880) (41,565) (125,319) (543,822)
$ 183,917 $ 124,361 $ 219,012 $ 37,411 $ 46,632 $ 611,333
The Company’s investments in 50% or less owned companies, which are accounted for under the equity method, also
contribute to its consolidated results of operations. As of June 30, 2018, the Company’s investments, at equity, and advances to50% or less owned companies in MexMar and its other 50% or less owned companies were $63.7 million and $51.7 million,respectively. Equity in (losses) earnings of 50% or less owned companies, net of tax for the six months ended June 30 were asfollows (in thousands):
Three Months Ended June 30, Six Months Ended June 30, 2018 2017 2018 2017 MexMar $ 1,076 $ 1,222 $ 2,508 $ 2,589 Other (1,797) 349 (3,021) (580) $ (721) $ 1,571 $ (513) $ 2,009 16. SUBSEQUENT EVENT
On July 5, 2018, the Company acquired 100% of the membership interests in two Marshall Islands limited liabilitycompanies in exchange for assumed debt of $11.0 million. Each Marshall Islands company owns one 2013-built AHTS vesselwhich was previously managed by the Company. The vessels are currently operating under contract in the Middle East and WestAfrica regions.
18

Table of Contents ITEM 2. MANAGEMENT’S DISCUSSION AND ANALYSIS OF FINANCIAL CONDITION AND RESULTS OF
OPERATIONS
This Form 10-Q includes “forward-looking statements” within the meaning of the Private Securities Litigation Reform Actof 1995. Certain statements discussed in this Form 10-Q as well as in other reports, materials and oral statements that theCompany releases from time to time to the public constitute “forward-looking statements” within the meaning of the PrivateSecurities Litigation Reform Act of 1995. Generally, words such as “anticipate,” “estimate,” “expect,” “project,” “intend,”“believe,” “plan,” “target,” “forecast” and similar expressions are intended to identify forward-looking statements. Such forward-looking statements concern management’s expectations, strategic objectives, business prospects, anticipated economic performanceand financial condition and other similar matters. These statements are not guarantees of future performance and actual events orresults may differ significantly from these statements. Actual events or results are subject to significant known and unknown risks,uncertainties and other important factors, including decreased demand and loss of revenues as a result of a decline in the price ofoil and resulting decrease in capital spending by oil and gas companies, an oversupply of newly built offshore support vessels,additional safety and certification requirements for drilling activities in the U.S. Gulf of Mexico and delayed approval ofapplications for such activities, the possibility of U.S. government implemented moratoriums directing operators to cease certaindrilling activities in the U.S. Gulf of Mexico and any extension of such moratoriums, weakening demand for the Company’s servicesas a result of unplanned customer suspensions, cancellations, rate reductions or non-renewals of vessel charters or failures tofinalize commitments to charter vessels in response to a decline in the price of oil, increased government legislation and regulationof the Company’s businesses could increase cost of operations, increased competition if the Jones Act and related regulations arerepealed, liability, legal fees and costs in connection with the provision of emergency response services, such as the response to theoil spill as a result of the sinking of the Deepwater Horizon in April 2010, decreased demand for the Company’s services as a resultof declines in the global economy, declines in valuations in the global financial markets and a lack of liquidity in the credit sectors,including, interest rate fluctuations, availability of credit, inflation rates, change in laws, trade barriers, commodity prices andcurrency exchange fluctuations, the cyclical nature of the oil and gas industry, activity in foreign countries and changes in foreignpolitical, military and economic conditions, changes to the status of applicable trade treaties including as a result of the U.K.'simpending exit from the European Union, changes in foreign and domestic oil and gas exploration and production activity, safetyrecord requirements, compliance with U.S. and foreign government laws and regulations, including environmental laws andregulations and economic sanctions, the dependence on several key customers, consolidation of the Company’s customer base, theongoing need to replace aging vessels, industry fleet capacity, restrictions imposed by the Jones Act and related regulations on theamount of foreign ownership of the Company’s Common Stock, operational risks, effects of adverse weather conditions andseasonality, adequacy of insurance coverage, the ability of the Company to maintain effective internal controls over financialreporting, in accordance with Section 404 of the Sarbanes-Oxley Act, the attraction and retention of qualified personnel by theCompany, and various other matters and factors, many of which are beyond the Company’s control as well as those discussed inItem 1A (Risk Factors) of the Company's Annual Report on Form 10-K and other reports filed by the Company with the Securitiesand Exchange Commission (“SEC”). It should be understood that it is not possible to predict or identify all such factors.Consequently, the preceding should not be considered to be a complete discussion of all potential risks or uncertainties andinvestors and analysts should not place undue reliance on forward-looking statements. Forward-looking statements speak only asof the date of the document in which they are made. The Company disclaims any obligation or undertaking to provide any updatesor revisions to any forward-looking statement to reflect any change in the Company’s expectations or any change in events,conditions or circumstances on which the forward-looking statement is based, except as required by law. It is advisable, however, toconsult any further disclosures the Company makes on related subjects in its filings with the SEC, including Annual Reports onForm 10-K, Quarterly Reports on Form 10-Q and Current Reports on Form 8-K (if any). These statements constitute theCompany’s cautionary statements under the Private Securities Litigation Reform Act of 1995. Overview
The Company provides global marine and support transportation services to offshore oil and gas exploration, developmentand production facilities worldwide. The Company currently operates a diverse fleet of 179 support and specialty vessels, of which139 are owned or leased-in, 31 are joint ventured, and nine are managed on behalf of unaffiliated third parties. The primary users ofthe Company’s services are major integrated oil companies, large independent oil and gas exploration and production companiesand emerging independent companies.
The Company operates its fleet in five principal geographic regions: the United States, primarily in the Gulf of Mexico;Africa, primarily in West Africa; the Middle East and Asia; Brazil, Mexico, Central and South America; and Europe, primarily inthe North Sea. The Company’s vessels are highly mobile and regularly and routinely move between countries within a geographicregion. In addition, the Company’s vessels are redeployed among its geographic regions, subject to flag restrictions, as changes inmarket conditions dictate. The number and type of vessels operated, their rates per day worked and their utilization levels are thekey determinants of the Company’s operating results and cash flows. Unless a vessel is cold-stacked, there is little reduction indaily running costs and, consequently, operating margins are most sensitive to changes in rates per day worked and utilization. TheCompany manages its fleet utilizing a global network of shore side support, administrative and finance personnel.
Offshore oil and gas market conditions deteriorated beginning in 2014 and continued to deteriorate when oil prices hit a
thirteen-year low of less than $27 per barrel (on the New York Mercantile Exchange) in February 2016. As of June 30, 2018, oilprices had increased from the February 2016 lows to a price of approximately $74 per barrel. While the Company has experienced

what it believes is a beginning of a recovery, it continued to experience difficult market conditions through the second quarter of2018.
19

Table of ContentsLow oil prices and the subsequent decline in offshore exploration have forced many operators in the industry to restructure
or liquidate assets. The Company continues to closely monitor the reactivation of existing offshore support vessels as well as thedelivery of newly built offshore support vessels to the industry-wide fleet, which is creating situations of oversupply, furtherlowering the demand for the Company’s existing offshore support vessel fleet. A continuation of (i) low customer exploration anddrilling activity levels, and (ii) the increasing size of the global offshore support vessel fleet as vessels are reactivated and newlybuilt vessels are placed into service could, in isolation or together, have a material adverse effect on the Company’s results ofoperations, financial position and cash flows.
As shipyards, finance parties and industry operators have been forced to restructure or liquidate assets, the Company has
reviewed discreet opportunities to acquire or takeover the management of certain assets. In this industry context, the Company mayfrom time to time deploy capital in connection with transactions that it determines enhance market coverage and/or represent asubstantial discount to replacement value.
Recent Events. On July 5, 2018, the Company acquired 100% of the membership interests in two Marshall Islands limited
liability companies in exchange for assumed debt of $11.0 million. Each Marshall Islands company owns one 2013-built AHTSvessel which was previously managed by the Company. The vessels are currently operating under contract in the Middle East andWest Africa regions.
The Spin-off. SEACOR Marine was previously a subsidiary of SEACOR Holdings. On June 1, 2017, SEACOR Holdings
completed a spin-off of SEACOR Marine by way of a pro rata dividend of SEACOR Marine’s Common Stock, all of which wasthen held by SEACOR Holdings, to SEACOR Holdings shareholders of record as of May 22, 2017. SEACOR Marine entered intocertain agreements with SEACOR Holdings to govern SEACOR Marine’s relationship with SEACOR Holdings following theSpin-off, including a Distribution Agreement, two Transition Services Agreements, an Employee Matters Agreement and a TaxMatters Agreement. Immediately following the Spin-off, SEACOR Marine began to operate as an independent, publicly tradedcompany.
20

Table of Contents Consolidated Results of Operations
The sections below provide an analysis of the Company's results of operations for the three months (“Current YearQuarter”) and six months (“Current Six Months”) ended June 30, 2018 compared with the three months (“Prior Year Quarter”) andsix months (“Prior Six Months”) ended June 30, 2017. For the periods indicated, the Company’s consolidated results of operationswere as follows (in thousands, except statistics): Three Months Ended June 30, Six Months Ended June 30, 2018 2017 2018 2017 Time Charter Statistics:
Average Rates Per Day Worked(excluding wind farm) $ 9,742 $ 8,431 $ 9,425 $ 8,359 Average Rates Per Day $ 7,324 $ 5,649 $ 7,174 $ 5,683 Fleet Utilization (excluding wind farm) 58% 43% 54% 40% Fleet Utilization 62% 56% 58% 51% Fleet Available Days (excluding windfarm) 9,071 8,996 18,342 17,433 Fleet Available Days 12,528 12,363 25,129 24,130
Operating Revenues: Time charter $ 56,826 94% $ 38,803 92% $ 103,968 92% $ 69,533 91%Bareboat charter 1,156 2% 1,156 3% 2,299 2% 2,299 3%Other marine services 2,719 4% 2,364 5% 6,155 6% 4,795 6%
60,701 100% 42,323 100% 112,422 100% 76,627 100%Costs and Expenses:
Operating: Personnel 24,733 41% 20,577 49% 46,409 41% 37,368 49%Repairs and maintenance 9,070 15% 10,425 25% 16,143 14% 14,020 18%Drydocking 3,112 5% 2,251 5% 5,369 4% 5,318 7%Insurance and loss reserves 1,934 3% 2,126 5% 3,124 3% 3,685 5%Fuel, lubes and supplies 4,122 7% 3,190 7% 7,667 7% 5,532 7%Other 3,009 5% 2,223 5% 5,616 5% 4,657 6%Leased-in equipment 2,840 4% 3,690 9% 5,665 5% 7,281 10%
48,820 80% 44,482 105% 89,993 79% 77,861 102%Administrative and general 15,532 26% 21,705 51% 28,339 25% 33,531 44%Depreciation and amortization 18,406 30% 14,633 35% 37,918 34% 27,136 35%
82,758 136% 80,820 191% 156,250 138% 138,528 181%Gains (Losses) on Asset Dispositions andImpairments, Net 1,055 2% (6,318) (15)% (1,588) (2)% (1,499) (2)%Operating Loss (21,002) (34)% (44,815) (106)% (45,416) (40)% (63,400) (83)%Other (Expense) Income, Net (9,630) (16)% (7,045) (17)% (26,936) (24)% 81 —%Loss Before Income Tax Benefit and Equityin Earnings (Losses) of 50% or Less OwnedCompanies (30,632) (50)% (51,860) (123)% (72,352) (64)% (63,319) (83)%Income Tax Benefit (4,724) (8)% (13,800) (33)% (14,548) (13)% (17,222) (22)%Loss Before Equity in Earnings (Losses) of50% or Less Owned Companies (25,908) (42)% (38,060) (90)% (57,804) (51)% (46,097) (61)%Equity in (Losses) Earnings of 50% or LessOwned Companies (721) (1)% 1,571 4% (513) (1)% 2,009 3%Net Loss (26,629) (43)% (36,489) (86)% (58,317) (52)% (44,088) (58)%Net Loss attributable to NoncontrollingInterests in Subsidiaries (1,605) (2)% (2,497) (6)% (4,460) (4)% (2,701) (4)%Net Loss attributable to SEACOR MarineHoldings Inc. $ (25,024) (41)% $ (33,992) (80)% $ (53,857) (48)% $ (41,387) (54)%
Direct Vessel Profit. Direct vessel profit (defined as operating revenues less operating expenses excluding leased-inequipment, “DVP”) is the Company's measure of segment profitability when applied to reportable segments and a non-GAAPmeasure when applied to individual vessels, fleet categories or the combined fleet. DVP is a critical financial measure used by theCompany to analyze and compare the operating performance of its individual vessels, fleet categories, regions and combined fleet,without regard to financing decisions (depreciation for owned vessel vs. leased-in expense for leased-in vessels). DVP is alsouseful when comparing the Company's fleet's performance against those of its competitors who may have differing fleet financingstructures.
DVP by region and by vessel class has material limitations as an analytical tool in that it does not reflect all of the costs
associated with the operation of the Company’s fleet, and it should not be considered in isolation or used as a substitute for theCompany’s results as reported under GAAP. A reconciliation of DVP by region and by vessel class to operating loss, its mostcomparable GAAP measure, is included in the tables below.
21

Table of ContentsThe following tables summarize the operating results and property and equipment for the Company’s reportable segments
for the periods indicated (in thousands, except statistics):
United States(primarily
Gulf ofMexico)
Africa(primarily
West Africa) Middle East
and Asia
Brazil,Mexico,
Central andSouth
America
Europe(primarilyNorth Sea) Total
For the Three Months Ended June 30,2018 Time Charter Statistics:
Average Rates Per Day $ 10,503 $ 9,509 $ 8,226 $ 19,127 $ 4,823 $ 7,324 Fleet Utilization 23% 88% 82% 57% 76% 62%Fleet Available Days 3,710 1,331 2,005 416 5,066 12,528
Operating Revenues: Time charter $ 9,052 $ 11,122 $ 13,591 $ 4,556 $ 18,505 $ 56,826 Bareboat charter — — — 1,156 — 1,156 Other marine services 1,676 350 (792) 845 640 2,719
10,728 11,472 12,799 6,557 19,145 60,701 Direct Costs and Expenses:
Operating: Personnel 4,636 4,314 4,069 1,219 10,495 24,733 Repairs and maintenance 1,529 1,663 3,576 32 2,270 9,070 Drydocking 910 910 72 11 1,209 3,112 Insurance and loss reserves 902 248 361 169 254 1,934 Fuel, lubes and supplies 900 900 922 349 1,051 4,122 Other 29 1,402 836 488 254 3,009
8,906 9,437 9,836 2,268 15,533 45,980 Direct Vessel Profit $ 1,822 $ 2,035 $ 2,963 $ 4,289 $ 3,612 14,721 Other Costs and Expenses:
Operating: Leased-in equipment $ 1,856 $ 962 $ — $ — $ 22 2,840 Administrative and general 15,532 Depreciation and amortization $ 5,915 $ 2,924 $ 4,311 $ 2,280 $ 2,976 18,406
36,778 Gains on Asset Dispositions andImpairments 1,055 Operating Loss $ (21,002)
United States(primarily
Gulf ofMexico)
Africa(primarily
West Africa) Middle East
and Asia
Brazil,Mexico,
Central andSouth
America
Europe(primarilyNorth Sea) Total
For the Six Months Ended June 30,2018 Time Charter Statistics:
Average Rates Per Day $ 9,740 $ 9,482 $ 8,155 $ 18,069 $ 4,984 $ 7,174 Fleet Utilization 20% 89% 74% 52% 72% 58%Fleet Available Days 7,760 2,591 4,137 635 10,006 25,129
Operating Revenues: Time charter $ 15,034 $ 21,916 $ 24,965 $ 5,930 $ 36,123 $ 103,968 Bareboat charter — — — 2,299 — 2,299 Other marine services 3,331 1,637 (922) 955 1,154 6,155
18,365 23,553 24,043 9,184 37,277 112,422 Direct Costs and Expenses:
Operating: Personnel 8,628 8,387 8,091 1,595 19,708 46,409 Repairs and maintenance 2,223 3,019 6,004 337 4,560 16,143 Drydocking 1,435 912 61 11 2,950 5,369 Insurance and loss reserves 1,336 466 597 236 489 3,124 Fuel, lubes and supplies 1,393 1,569 1,956 414 2,335 7,667 Other 54 2,438 2,044 548 532 5,616
15,069 16,791 18,753 3,141 30,574 84,328 Direct Vessel Profit $ 3,296 $ 6,762 $ 5,290 $ 6,043 $ 6,703 28,094 Other Costs and Expenses:
Operating: Leased-in equipment $ 3,718 $ 1,925 $ — $ — $ 22 5,665
Administrative and general 28,339 Depreciation and amortization $ 12,450 $ 5,731 $ 10,401 $ 3,499 $ 5,837 37,918
71,922 Losses on Asset Dispositions andImpairments (1,588)

Operating Loss $ (45,416) As of June 30, 2018 Property and Equipment:
Historical cost $ 439,026 $ 184,037 $ 317,536 $ 165,145 $ 182,111 $ 1,287,855 Accumulated depreciation (225,116) (57,909) (86,239) (58,078) (137,135) (564,477)
$ 213,910 $ 126,128 $ 231,297 $ 107,067 $ 44,975 $ 723,378 22

Table of Contents
United States(primarily
Gulf ofMexico)
Africa(primarily
West Africa) Middle East
and Asia
Brazil,Mexico,
Central andSouth
America
Europe(primarilyNorth Sea) Total
For the Three Months Ended June 30,2017 Time Charter Statistics:
Average Rates Per Day $ 9,619 $ 10,348 $ 6,580 $ — $ 4,176 $ 5,649 Fleet Utilization 13% 67% 55% —% 90% 56%Fleet Available Days 4,063 1,123 2,067 105 5,005 12,363
Operating Revenues: Time charter $ 4,889 $ 7,786 $ 7,415 $ — $ 18,713 $ 38,803 Bareboat charter — — — 1,156 — 1,156 Other marine services 1,198 215 109 162 680 2,364
6,087 8,001 7,524 1,318 19,393 42,323 Direct Costs and Expenses:
Operating: Personnel 4,183 3,428 4,147 148 8,671 20,577 Repairs and maintenance 937 3,234 3,947 116 2,191 10,425 Drydocking 310 683 358 — 900 2,251 Insurance and loss reserves 1,205 357 353 4 207 2,126 Fuel, lubes and supplies 545 704 908 27 1,006 3,190 Other 51 871 1,061 3 237 2,223
7,231 9,277 10,774 298 13,212 40,792 Direct Vessel (Loss) Profit $ (1,144) $ (1,276) $ (3,250) $ 1,020 $ 6,181 1,531 Other Costs and Expenses:
Operating: Leased-in equipment $ 2,205 $ 969 $ 516 $ — $ — 3,690
Administrative and general 21,705 Depreciation and amortization $ 5,749 $ 2,059 $ 3,979 $ 784 $ 2,062 14,633
40,028 Losses on Asset Dispositions andImpairments (6,318)Operating Loss $ (44,815)
United States(primarily
Gulf ofMexico)
Africa(primarily
West Africa) Middle East
and Asia
Brazil,Mexico,
Central andSouth
America
Europe(primarilyNorth Sea) Total
For the Six Months Ended June 30,2017 Time Charter Statistics:
Average Rates Per Day $ 9,808 $ 9,913 $ 6,765 $ — $ 4,294 $ 5,683 Fleet Utilization 10% 64% 52% —% 81% 51%Fleet Available Days 8,061 2,142 3,777 195 9,955 24,130
Operating Revenues: Time charter $ 7,884 $ 13,633 $ 13,238 $ — $ 34,778 $ 69,533 Bareboat charter — — — 2,299 — 2,299 Other marine services 2,024 407 986 237 1,141 4,795
9,908 14,040 14,224 2,536 35,919 76,627 Direct Costs and Expenses:
Operating: Personnel 7,313 6,036 7,270 161 16,588 37,368 Repairs and maintenance 1,674 3,778 4,523 120 3,925 14,020 Drydocking 883 1,740 516 — 2,179 5,318 Insurance and loss reserves 2,010 539 699 11 426 3,685 Fuel, lubes and supplies 855 1,263 1,432 27 1,955 5,532 Other 123 1,517 2,526 4 487 4,657
12,858 14,873 16,966 323 25,560 70,580 Direct Vessel (Loss) Profit $ (2,950) $ (833) $ (2,742) $ 2,213 $ 10,359 6,047 Other Costs and Expenses:
Operating: Leased-in equipment $ 4,416 $ 1,939 $ 862 $ — $ 64 7,281
Administrative and general 33,531 Depreciation and amortization $ 11,349 $ 3,649 $ 6,506 $ 1,449 $ 4,183 27,136
67,948 Losses on Asset Dispositions andImpairments (1,499)Operating Loss $ (63,400)

As of June 30, 2017 Property and Equipment:
Historical cost $ 417,675 $ 183,661 $ 302,892 $ 78,976 $ 171,951 $ 1,155,155 Accumulated depreciation (233,758) (59,300) (83,880) (41,565) (125,319) (543,822)
$ 183,917 $ 124,361 $ 219,012 $ 37,411 $ 46,632 $ 611,333
23
Table of Contents
For additional information, the following tables summarize the world-wide operating results and property and equipmentfor each of the Company’s vessel classes for the periods indicated (in thousands, except statistics):
Anchorhandlingtowingsupply
Fastsupport Supply
Standbysafety Specialty Liftboats
Windfarmutility
Otheractivity Total
For the Three Months Ended June30, 2018 Time Charter Statistics:
Average Rates Per Day $ 13,381 $ 6,963 $ 7,174 $ 9,157 $ — $ 19,225 $ 2,330 $ — $ 7,324 Fleet Utilization 23% 62% 69% 80% —% 43% 73% —% 62%Fleet Available Days 866 3,820 637 1,746 91 1,911 3,457 — 12,528
Operating Revenues: Time charter $ 2,712 $ 16,488 $ 3,149 $ 12,791 $ — $ 15,788 $ 5,898 $ — $ 56,826 Bareboat charter — — 1,156 — — — — — 1,156 Other marine services (91) (505) 39 39 — 1,569 563 1,105 2,719
2,621 15,983 4,344 12,830 — 17,357 6,461 1,105 60,701 Direct Costs and Expenses:
Operating: Personnel 1,593 5,258 1,999 8,148 79 4,671 2,295 690 24,733 Repairs and maintenance 1,281 3,406 259 1,464 13 1,553 987 107 9,070 Drydocking 945 115 585 624 — 842 1 — 3,112 Insurance and loss reserves 265 314 134 143 25 889 93 71 1,934 Fuel, lubes and supplies 586 1,015 317 843 (29) 1,153 219 18 4,122 Other 689 1,466 1,048 144 93 336 173 (940) 3,009
5,359 11,574 4,342 11,366 181 9,444 3,768 (54) 45,980 Direct Vessel (Loss) Profit $ (2,738) $ 4,409 $ 2 $ 1,464 $ (181) $ 7,913 $ 2,693 $ 1,159 14,721 Other Costs and Expenses:
Operating: Leased-in equipment $ 1,855 $ 342 $ — $ — $ — $ 644 $ 22 $ (23) 2,840
Administrative and general 15,532 Depreciation and amortization $ 532 $ 6,585 $ 1,394 $ 681 $ 283 $ 6,333 $ 2,380 $ 218 18,406
36,778 Gains on Asset Dispositions andImpairments 1,055 Operating Loss $ (21,002)
24

Table of Contents
Anchorhandlingtowingsupply
Fastsupport Supply
Standbysafety Specialty Liftboats
Windfarmutility
Otheractivity Total
For the Six Months Ended June30, 2018 Time Charter Statistics:
Average Rates Per Day $ 11,634 $ 7,321 $ 6,803 $ 9,107 $ — $ 18,022 $ 2,319 $ — $ 7,174 Fleet Utilization 22% 57% 71% 79% —% 37% 68% —% 58%Fleet Available Days 2,126 7,600 1,270 3,595 181 3,570 6,787 — 25,129
Operating Revenues: Time charter $ 5,499 $ 31,915 $ 6,151 $ 25,842 $ — $ 23,914 $ 10,647 $ — $ 103,968 Bareboat charter — — 2,299 — — — — — 2,299 Other marine services 1,347 (1,161) 21 79 — 2,325 992 2,552 6,155
6,846 30,754 8,471 25,921 — 26,239 11,639 2,552 112,422 Direct Costs and Expenses:
Operating: Personnel 2,990 10,014 3,955 15,086 243 8,132 4,517 1,472 46,409 Repairs and maintenance 1,675 5,950 704 3,018 50 2,687 1,812 247 16,143 Drydocking 1,425 106 585 2,365 (6) 893 1 — 5,369 Insurance and loss reserves 356 638 236 281 35 1,540 196 (158) 3,124 Fuel, lubes and supplies 739 1,810 1,011 1,834 54 1,821 363 35 7,667 Other 1,141 2,926 1,767 305 197 753 269 (1,742) 5,616
8,326 21,444 8,258 22,889 573 15,826 7,158 (146) 84,328 Direct Vessel Profit $ (1,480) $ 9,310 $ 213 $ 3,032 $ (573) $ 10,413 $ 4,481 $ 2,698 28,094 Other Costs and Expenses:
Operating: Leased-in equipment $ 3,713 $ 684 $ — $ — $ — $ 1,282 $ 22 $ (36) 5,665
Administrative and general 28,339 Depreciation and amortization $ 2,022 $ 13,170 $ 4,137 $ 1,375 $ 565 $ 11,358 $ 4,808 $ 483 37,918
71,922 Losses on Asset Dispositions andImpairments (1,588)Operating Loss $ (45,416) As of June 30, 2018 Property and Equipment:
Historical cost $ 188,507 $ 420,776 $ 95,088 $112,869 $ 30,529 $ 337,239 $ 71,575 $ 31,272 $ 1,287,855 Accumulated depreciation (168,841) (99,020) (45,759) (93,736) (19,869) (65,900) (44,483) (26,869) $ (564,477)
$ 19,666 $ 321,756 $ 49,329 $ 19,133 $ 10,660 $ 271,339 $ 27,092 $ 4,402 $ 723,378
25

Table of Contents
Anchorhandlingtowingsupply
Fastsupport Supply
Standbysafety Specialty Liftboats
Windfarmutility
Otheractivity Total
For the Three Months Ended June30, 2017 Time Charter Statistics:
Average Rates Per Day $ 10,774 $ 8,086 $ 6,028 $ 8,457 $ 12,000 $ 10,315 $ 2,124 $ — $ 5,649 Fleet Utilization 24% 43% 48% 80% 5% 16% 90% —% 56%Fleet Available Days 1,274 3,684 $ 580 1,820 273 1,365 3,367 — 12,363
Operating Revenues: Time charter $ 3,299 $ 12,712 $ 1,679 $ 12,279 $ 149 $ 2,251 $ 6,434 $ — $ 38,803 Bareboat charter — — 1,156 — — — — — 1,156 Other marine services (50) 152 (87) 36 278 384 583 1,068 2,364
3,249 12,864 2,748 12,315 427 2,635 7,017 1,068 42,323 Direct Costs and Expenses:
Operating: Personnel 2,745 4,815 1,198 6,698 316 2,748 2,036 21 20,577 Repairs and maintenance 990 5,893 362 1,610 56 915 599 — 10,425 Drydocking 62 979 — 900 — 310 — — 2,251 Insurance and loss reserves 307 381 34 137 35 1,167 83 (18) 2,126 Fuel, lubes and supplies 317 990 156 844 59 667 162 (5) 3,190 Other (425) 1,527 252 199 98 488 80 4 2,223
3,996 14,585 2,002 10,388 564 6,295 2,960 2 40,792 Direct Vessel (Loss) Profit $ (747) $ (1,721) $ 746 $ 1,927 $ (137) $ (3,660) $ 4,057 $ 1,066 1,531 Other Costs and Expenses:
Operating: Leased-in equipment $ 1,869 $ 860 $ 331 $ — $ — $ 630 $ — $ — 3,690
Administrative and general 21,705 Depreciation and amortization $ 2,418 $ 4,403 $ 1,278 $ 566 $ 579 $ 3,045 $ 1,768 $ 576 14,633
40,028 Losses on Asset Dispositions andImpairments (6,318)Operating Loss $ (44,815)
26

Table of Contents
Anchorhandlingtowingsupply
Fastsupport Supply
Standbysafety Specialty Liftboats
Windfarmutility
Otheractivity Total
For the Six Months Ended June30, 2017 Time Charter Statistics:
Average Rates Per Day $ 11,765 $ 7,768 $ 7,782 $ 8,295 $ 12,000 $ 10,293 $ 2,074 $ — $ 5,683 Fleet Utilization 20% 43% 32% 80% 2% 9% 78% —% 51%Fleet Available Days 2,534 6,896 1,210 3,620 543 2,630 6,697 — 24,130
Operating Revenues: Time charter $ 5,869 $ 23,254 $ 3,136 $ 23,974 $ 149 $ 2,346 $ 10,805 $ — $ 69,533 Bareboat charter — — 2,299 — — — — — 2,299 Other marine services (213) 1,005 (153) 69 278 425 945 2,439 4,795
5,656 24,259 5,282 24,043 427 2,771 11,750 2,439 76,627 Direct Costs and Expenses: Operating:
Personnel 5,239 8,825 2,253 13,032 581 3,754 3,678 6 37,368 Repairs and maintenance 1,487 6,602 562 2,818 96 1,320 1,135 — 14,020 Drydocking 410 1,989 — 2,180 — 739 — — 5,318 Insurance and loss reserves 664 843 108 273 96 1,542 172 (13) 3,685 Fuel, lubes and supplies 733 1,602 327 1,669 129 789 288 (5) 5,532 Other (709) 2,851 1,206 396 247 502 168 (4) 4,657
7,824 22,712 4,456 20,368 1,149 8,646 5,441 (16) 70,580 Direct Vessel (Loss) Profit $ (2,168) $ 1,547 $ 826 $ 3,675 $ (722) $ (5,875) $ 6,309 $ 2,455 6,047 Other Costs and Expenses:
Operating: Leased-in equipment $ 3,742 $ 1,550 $ 663 $ — $ — $ 1,262 $ 64 $ — 7,281
Administrative and general 33,531 Depreciation and amortization $ 4,837 $ 7,821 $ 2,573 $ 1,125 $ 1,160 $ 4,968 $ 3,597 $ 1,055 27,136
67,948 Losses on Asset Dispositions andImpairments (1,499)Operating Loss $ (63,400) As of June 30, 2017 Property and Equipment:
Historical cost $ 224,490 $ 381,705 $ 87,443 $116,244 $ 38,500 $ 195,108 $ 63,839 $ 47,826 $ 1,155,155 Accumulated depreciation (183,322) (81,341) (52,649) (94,790) (18,442) (47,942) (34,135) (31,201) (543,822)
$ 41,168 $ 300,364 $ 34,794 $ 21,454 $ 20,058 $ 147,166 $ 29,704 $ 16,625 $ 611,333 Fleet Counts. The Company's fleet count as of June 30 was as follows:
Owned Joint Ventured Leased-in Managed Total
2018 Anchor handling towing supply 6 1 4 2 13 Fast support 40 5 1 3 49 Supply 8 19 — 2 29 Standby safety 20 1 — — 21 Specialty 1 1 — 2 4 Liftboats 19 — 2 — 21 Wind farm utility 38 4 — — 42 132 31 7 9 179
2017 Anchor handling towing supply 11 1 4 9 25 Fast support 40 5 1 3 49 Supply 7 17 — 2 26 Standby safety 20 1 — — 21 Specialty 3 1 — 2 6 Liftboats 13 — 2 — 15 Wind farm utility 37 3 — — 40 131 28 7 16 182
27

Table of Contents Operating Income (Loss)
United States, primarily Gulf of Mexico. For the three and six months ended June 30, the Company’s direct vessel profit(loss) in the United States was as follows (in thousands, except statistics): For the Three Months Ended June 30, For the Six Months Ended June 30, 2018 2017 2018 2017 Time Charter Statistics:
Rates Per Day Worked: Anchor handling towing supply $ 27,326 $ 35,000 $ 27,326 $ 35,496 Fast support 6,594 8,454 6,894 8,550 Supply 6,953 — 6,953 — Liftboats 12,955 10,315 11,992 10,293 Overall 10,503 9,619 9,740 9,808
Utilization: Anchor handling towing supply 3% 1% 1% 1%Fast support 23% 16% 23% 16%Supply 40% —% 11% —%Liftboats 31% 19% 27% 9%Overall 23% 13% 20% 10%
Available Days: Anchor handling towing supply 546 910 1,446 1,810 Fast support 1,507 1,802 3,088 3,455 Supply 34 91 124 181 Specialty 91 91 181 181 Liftboats 1,532 1,169 2,921 2,434 Overall 3,710 4,063 7,760 8,061
Operating revenues: Time charter $ 9,052 84% $ 4,889 80% $ 15,034 82% $ 7,884 80%Other marine services 1,676 16% 1,198 20% 3,331 18% 2,024 20%
10,728 100% 6,087 100% 18,365 100% 9,908 100%Direct operating expenses:
Personnel 4,636 43% 4,183 69% 8,628 47% 7,313 74%Repairs and maintenance 1,529 14% 937 15% 2,223 12% 1,674 17%Drydocking 910 9% 310 5% 1,435 8% 883 9%Insurance and loss reserves 902 9% 1,205 20% 1,336 7% 2,010 20%Fuel, lubes and supplies 900 8% 545 9% 1,393 8% 855 9%Other 29 —% 51 1% 54 —% 123 1%
8,906 83% 7,231 119% 15,069 82% 12,858 130%Direct Vessel Profit (Loss) $ 1,822 17% $ (1,144) (19)% $ 3,296 18% $ (2,950) (30)%
Current Year Quarter compared with Prior Year Quarter
Operating Revenues. Time charter revenues were $4.2 million higher in the Current Year Quarter compared with the Prior
Year Quarter primarily due to the addition of six liftboats associated with the FGH joint venture. Time charter revenues were$4.0 million higher for the liftboat fleet and $0.2 million higher for the anchor handling towing supply vessels. As of June 30,2018, the Company had 25 of 38 owned and leased-in vessels (six anchor handling towing supply vessels, 12 fast supportvessels, six liftboats and one specialty vessel) cold-stacked compared with 32 of 42 vessels as of June 30, 2017. As of June 30,2018, the Company had retired and removed from service five vessels (four anchor handling towing supply vessels and onesupply vessel) in this region.
Direct Operating Expenses. Direct operating expenses were $1.7 million higher in the Current Year Quarter compared withthe Prior Year Quarter. On an overall basis, direct operating expenses were $3.6 million higher due to net fleet acquisitionsprimarily associated with the FGH joint venture, $1.2 million lower due to the effect of cold-stacking vessels, and $0.7 millionlower due to the repositioning of vessels between geographic regions.
28

Table of Contents
Current Six Months compared with Prior Six Months Operating Revenues. Time charter revenues were $7.2 million higher in the Current Six Months compared with the Prior
Six Months primarily due to the addition of six liftboats associated with the FGH joint venture. Time charter revenues were $7.3million higher for the liftboat fleet, $0.3 million higher for the fast support vessels and $0.4 million lower for the anchorhandling towing supply vessels. As of June 30, 2018, the Company had 25 of 38 owned and leased-in vessels (six anchorhandling towing supply vessels, 12 fast support vessels, six liftboats, and one specialty vessel) cold-stacked compared with 32of 42 vessels as of June 30, 2017. As of June 30, 2018, the Company had retired and removed from service five vessels (fouranchor handling towing supply vessels and one supply vessel) in this region.
Direct Operating Expenses. Direct operating expenses were $2.2 million higher in the Current Six Months compared withthe Prior Six Months. On an overall basis, direct operating expenses were $5.3 million higher due to net fleet acquisitionsprimarily associated with the FGH joint venture, $2.1 million lower due to the effect of cold-stacking vessels, $0.7 million lowerdue to the repositioning of vessels between geographic regions and $0.3 million for the active fleet and other marine services.
Africa, primarily West Africa. For the three and six months ended June 30, the Company’s direct vessel profit (loss) in
Africa was as follows (in thousands, except statistics): For the Three Months Ended June 30, For the Six Months Ended June 30, 2018 2017 2018 2017 Time Charter Statistics:
Rates Per Day Worked: Anchor handling towing supply $ 13,014 $ 11,699 $ 12,301 $ 12,550 Fast support 9,841 9,556 9,877 8,587 Supply 7,464 12,495 7,425 13,334 Overall 9,509 10,348 9,482 9,913
Utilization: Anchor handling towing supply 88% 99% 94% 59%Fast support 87% 66% 87% 71%Supply 90% 78% 91% 89%Overall 88% 67% 89% 64%
Available Days: Anchor handling towing supply 182 182 362 452 Fast support 728 759 1,448 1,328 Supply 421 91 781 181 Specialty — 91 — 181 Overall 1,331 1,123 2,591 2,142
Operating revenues: Time charter $ 11,122 97% $ 7,786 97% $ 21,916 93% $ 13,633 97%Other marine services 350 3% 215 3% 1,637 7% 407 3%
11,472 100% 8,001 100% 23,553 100% 14,040 100%Direct operating expenses:
Personnel 4,314 38% 3,428 43% 8,387 36% 6,036 43%Repairs and maintenance 1,663 14% 3,234 40% 3,019 13% 3,778 27%Drydocking 910 8% 683 9% 912 4% 1,740 12%Insurance and loss reserves 248 2% 357 4% 466 2% 539 4%Fuel, lubes and supplies 900 8% 704 9% 1,569 6% 1,263 9%Other 1,402 12% 871 11% 2,438 10% 1,517 11%
9,437 82% 9,277 116% 16,791 71% 14,873 106%Direct Vessel Profit (Loss) $ 2,035 18% $ (1,276) (16)% $ 6,762 29% $ (833) (6)%
Current Year Quarter compared with Prior Year Quarter
Operating Revenues. Time charter revenues were $3.3 million higher in the Current Year Quarter compared with the PriorYear Quarter primarily due to fleet additions. Time charter revenues were $5.3 million higher due to fleet additions, $1.7 millionlower due to the repositioning of vessels between geographic regions and $0.3 million lower due to a reduction in average dayrates. As of June 30, 2018, the Company had no owned or leased-in vessels cold-stacked in this region compared with one of 14vessels as of June 30, 2017. As of June 30, 2018, the Company had one specialty vessel retired and removed from service in thisregion.
Direct Operating Expenses. Direct operating expenses were $0.2 million higher in the Current Year Quarter compared withthe Prior Year Quarter. On an overall basis, direct operating costs were $1.3 million higher due to net fleet additions, $0.8 millionlower due to the repositioning of vessels between geographic regions and $0.3 million lower for the active fleet and other changesin fleet mix. Personnel costs were $0.9 million higher primarily due to net fleet additions, and repairs and maintenance expenseswere $1.6 million lower primarily due to main engine replacements that occurred during the Prior Year Quarter.
29

Table of ContentsCurrent Six Months compared with Prior Six Months Operating Revenues. Time charter revenues were $8.3 million higher in the Current Six Months compared with the Prior
Six Months primarily due to fleet additions. Time charter revenues were $11.6 million higher due to net fleet additions, $1.1million higher due to improved utilization of which $0.8 million was due to the reactivation of vessels from cold-stack, $4.0million lower due to the repositioning of vessels between geographic regions and $0.4 million lower due to a reduction inaverage day rates. Other marine services were $1.2 million higher primarily due to the recognition of previously deferredrevenue, following receipt of cash, due to collection concerns with regard to one customer. As of June 30, 2018, the Companyhad no owned or leased-in vessels cold-stacked in this region compared with one of 14 vessels as of June 30, 2017. As of June30, 2018, the Company had one specialty vessel retired and removed from service in this region.
Direct Operating Expenses. Direct operating expenses were $1.9 million higher in the Current Six Months compared withthe Prior Six Months. On an overall basis, direct operating costs were $4.8 million higher due to net fleet additions, $0.9 millionlower for the active fleet and other changes in fleet mix, $0.6 million lower due to the effect of cold-stacking vessels and otherchanges in fleet mix, and $1.4 million lower due to the repositioning of vessels between geographic regions. Personnel costswere $2.4 million higher primarily due to net fleet additions. Drydocking expenses were $0.8 million lower due to reduceddrydocking activity, and repairs and maintenance expenses were $0.8 million lower due to main engine replacements thatoccurred during the Prior Six Months.
Middle East and Asia. For the three and six months ended June 30, the Company’s direct vessel profit (loss) in the Middle
East and Asia was as follows (in thousands, except statistics): For the Three Months Ended June 30, For the Six Months Ended June 30, 2018 2017 2018 2017 Time Charter Statistics:
Rates Per Day Worked: Anchor handling towing supply $ 8,135 $ 7,956 $ 7,750 $ 8,180 Fast support 5,683 7,018 6,073 6,959 Supply 4,989 3,800 4,372 4,074 Specialty — 12,000 — 12,000 Liftboats 31,998 — 33,311 — Wind farm utility 2,025 — 2,025 — Overall 8,226 6,580 8,155 6,765
Utilization: Anchor handling towing supply 20% 66% 37% 77%Fast support 96% 76% 85% 77%Supply 53% 52% 66% 29%Specialty —% 14% —% 7%Liftboats 94% —% 73% —%Wind farm utility 40% —% 39% —%Overall 82% 55% 74% 52%
Available Days: Anchor handling towing supply 138 182 318 272 Fast support 1,365 1,032 2,715 1,932 Supply 91 398 274 848 Specialty — 91 — 181 Liftboats 182 182 362 182 Wind farm utility 229 — 468 362 Overall 2,005 1,885 4,137 3,777
Operating revenues: Time charter $ 13,591 106% $ 7,415 99% $ 24,965 104% $ 13,238 93%Other marine services (792) (6)% 109 1% (922) (4)% 986 7%
12,799 100% 7,524 100% 24,043 100% 14,224 100%Direct operating expenses:
Personnel 4,069 32% 4,147 55% 8,091 34% 7,270 51%Repairs and maintenance 3,576 28% 3,947 52% 6,004 25% 4,523 32%Drydocking 72 1% 358 5% 61 —% 516 3%Insurance and loss reserves 361 3% 353 5% 597 2% 699 5%Fuel, lubes and supplies 922 7% 908 12% 1,956 8% 1,432 10%Other 836 6% 1,061 14% 2,044 9% 2,526 18%
9,836 77% 10,774 143% 18,753 78% 16,966 119%Direct Vessel Profit (Loss) $ 2,963 23% $ (3,250) (43)% $ 5,290 22% $ (2,742) (19)%
Current Year Quarter compared with Prior Year Quarter Operating Revenues. Time charter revenues were $6.2 million higher in the Current Year Quarter compared with the Prior
Year Quarter primarily due to net fleet additions. Time charter revenues were $5.1 million higher due to net fleet additions, $1.5million higher due to the repositioning of vessels between geographic regions, $0.4 million higher due to improved utilizationand $0.8 million lower due to a reduction in average day rates. As of June 30, 2018, the Company had one of 21 owned andleased-in vessels cold-stacked in this region (one anchor handling towing supply vessel) compared with three of 23 vessels as ofJune 30, 2017. As of June 30, 2018, the Company had one specialty vessel retired and removed from service in this region.

30

Table of Contents
Direct Operating Expenses. Direct operating expenses were $0.9 million lower in the Current Year Quarter compared withthe Prior Year Quarter. On an overall basis, direct operating expenses were $0.2 million higher due to fleet dispositions and $0.5million higher due to the repositioning of vessels between geographic regions, $0.5 million lower for the vessels in activeservice, $0.4 million lower due to the effect of cold stacking vessels and $0.7 million lower due to less drydocking and mainengine repairs.
Current Six Months compared with Prior Six Months Operating Revenues. Time charter revenues were $11.7 million higher in the Current Six Months compared with the Prior
Six Months primarily due to net fleet additions. Time charter revenues were $10.0 million higher due to net fleet additions, $1.8million higher due to the repositioning of vessels between geographic regions, $1.0 million higher due to improved utilization ofwhich $0.6 million was due to the reactivation of vessels from cold-stack, and $1.1 million lower due to a reduction in averageday rates. Other marine services were $1.9 million lower primarily due to the completion of a bareboat charter. As of June 30,2018, the Company had one of 22 owned and leased-in vessels cold-stacked in this region (one anchor handling towing supplyvessel) compared with three of 23 vessels as of June 30, 2017. As of June 30, 2018, the Company had one specialty vesselretired and removed from service in this region.
Direct Operating Expenses. Direct operating expenses were $1.8 million higher in the Current Six Months compared withthe Prior Six Months. On an overall basis, direct operating expenses were $3.1 million higher due to net fleet additions and $0.8million higher due to the repositioning of vessels between geographic regions. Direct operating expenses were $0.8 millionlower due to the effect of cold stacking vessels, $0.5 million lower due to less drydocking and main engine repairs and $0.8million lower for vessels in active service and other changes in fleet mix.
Brazil, Mexico, Central and South America. For the three and six months ended June 30, the Company’s direct vessel
profit in Brazil, Mexico, Central and South America was as follows (in thousands, except statistics): For the Three Months Ended June 30, For the Six Months Ended June 30, 2018 2017 2018 2017 Time Charter Statistics:
Rates Per Day Worked: Fast support 6,800 — 68,000 — Liftboats 24,113 — 21,047 — Overall 19,127 — 18,069 —
Utilization: Fast support 31% —% 20% —%Liftboats 86% —% 91% —%Overall 57% —% 52% —%
Available Days: Fast support 220 91 348 181 Liftboats 197 14 287 14 Overall 417 105 635 195
Operating revenues: Time charter $ 4,556 69% $ — —% $ 5,930 65% $ — —%Bareboat charter 1,156 31% 1,156 88% 2,299 35% 2,299 91%Other marine services 845 —% 162 12% 955 —% 237 9%
6,557 100% 1,318 100% 9,184 100% 2,536 100%Direct operating expenses:
Personnel 1,219 19% 148 11% 1,595 17% 161 6%Repairs and maintenance 32 —% 116 9% 337 4% 120 5%Drydocking 11 —% — —% 11 —% — —%Insurance and loss reserves 169 3% 4 1% 236 3% 11 1%Fuel, lubes and supplies 349 5% 27 2% 414 4% 27 1%Other 488 8% 3 —% 548 6% 4 —%
2,268 35% 298 23% 3,141 34% 323 13%Direct Vessel Profit $ 4,289 65% $ 1,020 77% $ 6,043 66% $ 2,213 87%
Current Year Quarter compared with Prior Year Quarter Operating Revenues. Time charter revenues were $4.6 million higher in the Current Year Quarter compared with the Prior
Year Quarter. Time charter revenues were $2.6 million higher due to the repositioning of vessels between geographic regionsand $2.0 million higher due to fleet additions. As of June 30, 2018, the Company had one of eight owned and leased-in vesselscold-stacked in this region (one fast support vessel) compared with one of four vessels as of June 30, 2017.
Direct Operating Expenses. Direct operating expenses were $2.0 million higher in the Current Year Quarter comparedwith the Prior Year Quarter, of which $1.1 million was due to the repositioning of vessels and $0.9 million was due to fleetadditions.
31

Table of Contents Current Six Months compared with Prior Six Months Operating Revenues. Time charter revenues were $5.9 million higher in the Current Six Months compared with the Prior
Six Months. Time charter revenues were $3.9 million higher due to the repositioning of vessels between geographic regions and$2.0 million higher due to fleet additions. As of June 30, 2018, the Company had one of 8 owned and leased-in vessels cold-stacked in this region (one fast support vessel) compared with one of four vessels as of June 30, 2017.
Direct Operating Expenses. Direct operating expenses were $2.8 million higher in the Current Six Months compared withthe Prior Six Months, of which $1.6 million was due to the repositioning of vessels and $1.2 million was due to fleet additions.
Europe, primarily North Sea. For the three and six months ended June 30, the Company’s direct vessel profit in Europe
was as follows (in thousands, except statistics): For the Three Months ended June 30, For the Six Months Ended June 30, 2018 2017 2018 2017 Time Charter Statistics:
Rates Per Day Worked: Standby 9,157 8,457 9,107 8,295 Wind farm utility 2,342 2,124 2,331 2,074 Overall 4,823 4,176 4,984 4,294
Utilization: Standby 80% 80% 79% 80%Wind farm utility 76% 95% 70% 82%Overall 76% 90% 72% 81%
Available Days: Supply 91 — 91 — Standby 1,746 1,820 3,595 3,620 Wind farm utility 3,228 3,185 6,319 6,335 Overall 5,065 5,005 10,005 9,955
Operating revenues: Time charter $ 18,505 97% $ 18,713 96% $ 36,123 97% $ 34,778 97%Other marine services 640 3% 680 4% 1,154 3% 1,141 3%
19,145 100% 19,393 100% 37,277 100% 35,919 100%Direct operating expenses:
Personnel 10,495 55% 8,671 45% 19,708 53% 16,588 46%Repairs and maintenance 2,270 12% 2,191 11% 4,560 12% 3,925 11%
Drydocking 1,209 6% 900 5% 2,950 8% 2,179 6%Insurance and loss reserves 254 1% 207 1% 489 1% 426 1%
Fuel, lubes and supplies 1,051 6% 1,006 5% 2,335 6% 1,955 6%Other 254 1% 237 1% 532 2% 487 1%
15,533 81% 13,212 68% 30,574 82% 25,560 71%Direct Vessel Profit $ 3,612 19% $ 6,181 32% $ 6,703 18% $ 10,359 29%
Current Year Quarter compared with Prior Year Quarter Operating Revenues. For standby safety vessels, time charter revenues were $0.5 million higher in the Current Year
Quarter compared with the Prior Year Quarter. Time charter revenues were $ 0.7 million higher due to favorable changes incurrency exchange rates, $0.5 million higher due to improved utilization, $0.1 million higher due to increased average day rates,and $0.8 million lower due to fleet dispositions.
For wind farm utility vessels, time charter revenues were $0.7 million lower. Time charter revenues were $0.3 millionhigher due to favorable changes in currency exchange rates, $0.3 million higher due to fleet additions, $0.1 million higher due toimproved average day rates, $0.2 million lower due to repositioning of vessels between geographic regions and $1.2 millionlower due to reduced utilization.
Direct Operating Expenses. Direct operating expenses were $2.3 million higher in the Current Year Quarter compared tothe Prior Year Quarter. On an overall basis vessel operating expenses were $1.4 million higher due to the cost of converting twosupply vessels to standby safety classification, $1.2 million higher due to MNRPF pension deficit expense, $0.4 million higherfor vessels in active service, primarily due to unfavorable changes in currency exchange rates, and $0.7 million lower due to netfleet dispositions.
32

Table of Contents
Current Six Months compared with Prior Six Months Operating Revenues. For standby safety vessels, time charter revenues were $1.9 million higher in the Current Six Months
compared with the Prior Six Months. Time charter revenues were $2.2 million higher due to favorable changes in currencyexchange rates, $0.8 million higher due to improved utilization, $0.9 million lower due to fleet dispositions and $0.2 millionlower due to reduced average day rates.
For wind farm utility vessels, time charter revenues were $0.5 million lower. Time charter revenues were $0.8 million
higher due to favorable changes in currency exchange rates, $0.3 million higher due to fleet additions, $0.1 million higher due toimproved day rates, $1.3 million lower due to reduced utilization and $0.4 million lower due to the repositioning of vesselsbetween geographic regions.
Direct Operating Expenses. Direct operating expenses were $5.0 million higher in the Current Six Months compared to
the Prior Six Months. On an overall basis vessel operating expenses were $2.9 million higher for vessels in active service,primarily due to unfavorable changes in currency exchange rates, $1.2 million higher due to MNRPF pension deficit expense,$2.0 million higher due to the cost of converting two supply vessels to standby safety classification, $1.0 million lower due tonet fleet dispositions and $0.1 million lower due to the repositioning of vessels between geographic regions.
Leased-in Equipment. Leased-in equipment expenses for the Current Year Quarter and Current Six Months were $0.8
million and $1.6 million lower compared with the Prior Year Quarter and Prior Six Months, respectively, due to the impairment andremoval from service of a leased-in vessel during 2017.
Administrative and general. Administrative and general expenses for the Current Year Quarter and Current Six Months
were $6.1 million and $5.2 million lower compared with the Prior Year Quarter and Prior Six Months, respectively, primarily dueto the acceleration of certain stock awards following the Spin-off in 2017 and the reduction in fees in connection with supportservices provided by SEACOR Holdings. These reductions were partially offset by increased legal and professional fees and equityincentive awards in 2018.
Depreciation and amortization. Depreciation and amortization expense for the Current Year Quarter and Current Six
Months were $3.8 million and $10.8 million higher compared with the Prior Year Quarter and Prior Six Months, respectively,primarily due to net fleet additions.
Gains (Losses) on Asset Dispositions and Impairments, Net. During the Current Year Quarter, the Company sold one
offshore support vessel and two supply vessels previously retired and removed from service, one standby safety vessel, one fastsupport vessel and other equipment for net proceeds of $2.2 million and a gain of $1.2 million. During the Prior Year Quarter, theCompany sold one supply vessel, two offshore support vessels previously retired and removed from service and other equipmentfor net proceeds of $1.3 million and losses of $0.6 million. In addition, the Company recorded impairment charges of $5.7 millionduring the Prior Year Quarter primarily related to one leased-in supply vessel removed from service, as it was not expected to bemarketed prior to being returned to its owner.
During the Current Six Months, the Company sold one fast support vessel and two supply vessels previously retired and
removed from service, one fast support vessel, one anchor handling towing supply vessel, one standby safety vessel and otherequipment for net proceeds of $2.6 million and gains of $1.4 million, all of which was recognized currently. In addition, theCompany recorded impairment charges of $3.0 million primarily related to the Company’s anchor handling towing supplyvessels. During the Prior Six Months, the Company sold two liftboats, one supply vessel, four offshore support vesselspreviously retired and removed from service and other equipment for net proceeds of $10.0 million and gains of $4.2 million, allof which were recognized currently. In addition, the Company recognized impairment charges of $5.7 million during the PriorSix Months primarily related to one leased-in supply vessel removed from service, as it was not expected to be marketed prior tobeing returned to its owner.
Other Income (Expense), Net
For the periods ended June 30, the Company’s other income (expense) was as follows (in thousands):
Three Months Ended June 30, Six Months Ended June 30, 2018 2017 2018 2017Other Income (Expense):
Interest income $ 352 $ 275 $ 568 $ 1,125 Interest expense (6,489) (4,546) (12,622) (7,728)SEACOR Holdings management fees — (1,283) — (3,208)SEACOR Holdings guarantee fees (7) (75) (19) (151)Marketable security (losses) gains, net — (109) — 11,629 Derivative losses, net (2,668) (213) (14,184) (302)Foreign currency losses, net (818) (1,094) (679) (1,283)Other, net — — — (1) $ (9,630) $ (7,045) $ (26,936) $ 81

Interest income. Interest income in the Current Six Months was lower compared with the Prior Six Months primarily due tolower interest from marketable security positions.
33

Table of Contents
Interest expense. Interest expense in the Current Year Quarter and Current Six Months compared with the Prior YearQuarter and Prior Six Months, respectively, was higher primarily due to additional interest incurred on the debt facilities of FalconGlobal International, Sea-Cat Crewzer, Sea-Crewzer II and Sea-Cat Crewzer III and FGUSA, along with higher interest as a resultof the variable nature of interest rates on debt facilities.
SEACOR Holdings management fees. Following the Spin-off, SEACOR Holdings no longer charges management fees to
the Company. However, Transition Service Agreement fees for various support services for a period up to two years following theSpin-off are included in administrative and general expenses.
Marketable security gains, net. Marketable security gains of $11.6 million in the Prior Six Months were primarily due to a
long security position exited by the Company during the Prior Six Months.
Derivative gains (losses), net. Net derivative losses during the Current Year Quarter and Current Six Months were primarilydue to increases in the fair value of the Company’s conversion option liability on its Convertible Senior Notes. The increases in theconversion option liability were primarily the result of increases in the Company’s share price and estimated credit spread, offset bya reduction in the liability following conversion of $50.0 million of its Convertible Senior Notes to equity as a result of theExchange.
Foreign currency (gains) losses, net. Foreign currency losses for the Current Six Months were primarily due to the
weakening of the pound sterling in relation to the euro underlying certain of the Company’s debt balances.
Income Tax Benefit During the Current Six Months, the Company's effective income tax rate of 20.1% was primarily due to taxes provided on
income attributable to noncontrolling interests, foreign sourced income not subject to U.S. income taxes, foreign taxes notcreditable against U.S income taxes, and a reversal of an unrecognized benefit. During the Prior Six Months, the Company'seffective income tax rate of 27.2% was primarily due to losses of foreign subsidiaries not benefited.
Equity in Earnings (Losses) of 50% or Less Owned Companies, Net of Tax Equity in earnings of 50% or less owned companies, net of tax, for the Current Year Quarter and Current Six Month
compared with the Prior Year Quarter and Prior Six Months were $2.3 million and $2.5 million lower, respectively, due to thefollowing changes in equity earnings (losses) (in thousands):
Three Months Ended June 30, Six Months Ended June 30, 2018 2017 2018 2017 MexMar $ 1,076 $ 1,222 $ 2,508 $ 2,589 OSV Partners (356) (228) (1,043) (420)Sea-Cat Crewzer — 248 — 234 Sea-Cat Crewzer II — (25) — 99 SEACOR Grant DIS — (42) (1,056) (35)Falcon Global International — — — (1,559)Dynamic Offshore Drilling (915) 93 (707) 617 SEACOSCO (1,323) — (1,491) — Other 797 303 1,276 484 $ (721) $ 1,571 $ (513) $ 2,009
OSV Partners. During the Current Year Quarter equity losses from OSV Partners GP LLC and OSV Partners LP LLC
(collectively “OSV Partners”) were $0.1 million higher compared to the Prior Year Quarter primarily due to the vessels owned bythese entities being out-of-service.
Seacor Grant DIS. During the Current Six Months equity losses of $1.1 million were primarily due to an impairment
charge of $1.1 million, net of taxes, for an other than temporary decline in the fair value of the Company’s investment in SeacorGrant DIS.
Falcon Global International. During the Prior Six Months, the Company’s partner declined to participate in a capital call
from FGI and, as a consequence, the Company obtained 100% voting control of FGI in accordance with the terms of theoperating agreement and began consolidating FGI’s net assets effective March 31, 2017. In February 2018, the Company andMOI (an affiliate of our partner in FGI during the Prior Six Months) contributed certain assets, including 100% of the equityinterests in each member of FGI, to FGH, a consolidated subsidiary of the Company, in accordance with the terms of a JointVenture Contribution and Formation Agreement (see Note 10).
SEACOSCO. During the Current Year Quarter and Current Six Months equity losses of $1.3 million and $1.5 million,respectively, were primarily due to the mobilization of two new built vessels following delivery from the shipyard.
34

Table of Contents Liquidity and Capital Resources
General
The Company’s ongoing liquidity requirements arise primarily from working capital needs, capital commitments and itsobligations to service outstanding debt. The Company may use its liquidity to fund capital expenditures, make acquisitions or tomake other investments. Sources of liquidity are cash balances, marketable securities, construction reserve funds and cash flowsfrom operations. From time to time, the Company may secure additional liquidity through asset sales or the issuance of debt, sharesof SEACOR Marine Common Stock or common stock of its subsidiaries, preferred stock or a combination thereof.
As of June 30, 2018, the Company had unfunded capital commitments of $43.3 million that included two fast supportvessels, three supply vessels and three wind farm utility vessel. The Company’s capital commitments by year of expected paymentare as follows (in thousands): Remainder of 2018 $ 12,707 2019 21,620 2020 8,970 $ 43,297
The Company has indefinitely deferred an additional $20.8 million of orders with respect to two fast support vessels for
which the Company had previously reported unfunded capital commitments.
As of June 30, 2018, the Company had outstanding debt of $371.8 million, net of debt discount and issue costs. TheCompany’s contractual long-term debt maturities as of June 30, 2018, are as follows:
Actual Remainder of 2018 $ 11,429 2019 53,233 2020 18,421 2021 44,914 2022 43,293 Years subsequent to 2022 240,390 $ 411,680
As of June 30, 2018, the Company held balances of cash, cash equivalents, restricted cash, marketable securities andconstruction reserve funds totaling $126.3 million. As of June 30, 2018, construction reserve funds of $38.2 million wereclassified as non-current assets in the accompanying condensed consolidated balance sheets as the Company has the intent andability to use the funds to acquire equipment. Additionally, the Company had $7.3 million available under subsidiary creditfacilities.
Summary of Cash Flows For the six months ended June 30, the following is a summary of the Company's cash flows (in thousands):
Six months Ended June 30, 2018 2017 Cash flows provided by or (used in):
Operating Activities $ (33,686) $ 53,736 Investing Activities (30,274) (13,753) Financing Activities 39,887 (7,099) Effects of Exchange Rate Changes on Cash, Cash Equivalents and Restricted Cash (288) 1,127
Increase (Decrease) in Cash, Cash Equivalents and Restricted Cash $ (24,361) $ 34,011
35
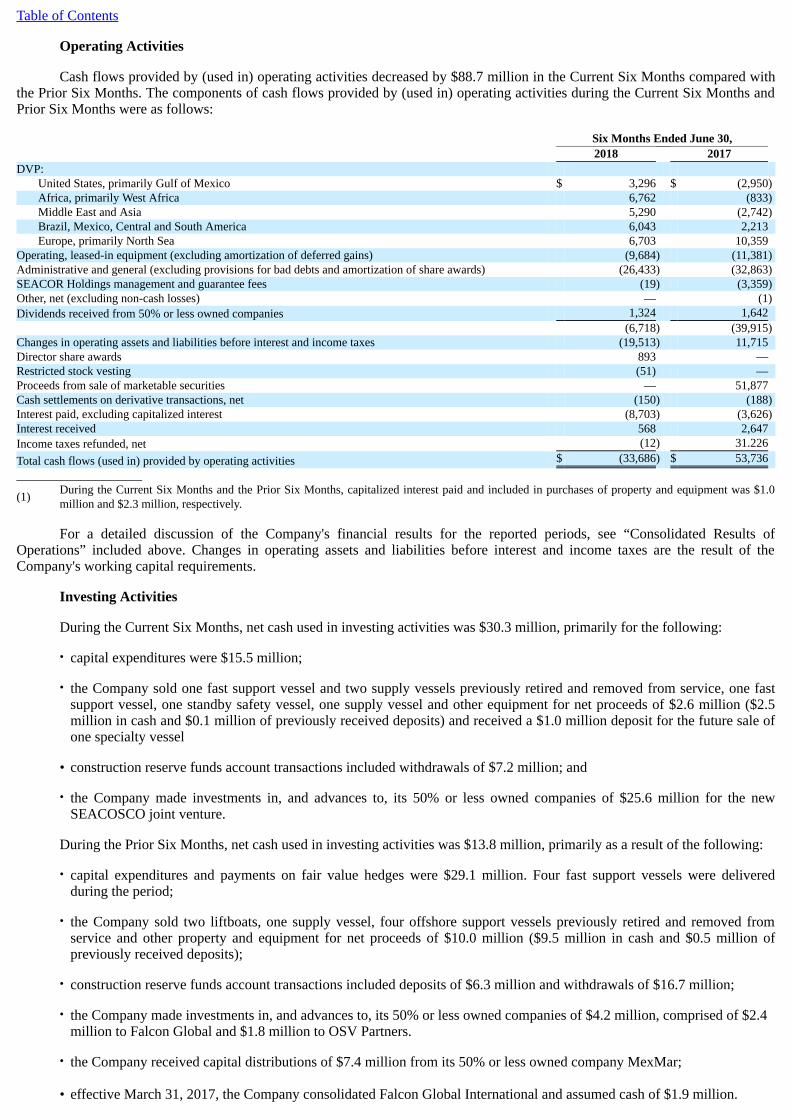
Table of Contents
Operating Activities
Cash flows provided by (used in) operating activities decreased by $88.7 million in the Current Six Months compared withthe Prior Six Months. The components of cash flows provided by (used in) operating activities during the Current Six Months andPrior Six Months were as follows:
Six Months Ended June 30, 2018 2017 DVP:
United States, primarily Gulf of Mexico $ 3,296 $ (2,950)Africa, primarily West Africa 6,762 (833)Middle East and Asia 5,290 (2,742)Brazil, Mexico, Central and South America 6,043 2,213 Europe, primarily North Sea 6,703 10,359
Operating, leased-in equipment (excluding amortization of deferred gains) (9,684) (11,381)Administrative and general (excluding provisions for bad debts and amortization of share awards) (26,433) (32,863)SEACOR Holdings management and guarantee fees (19) (3,359)Other, net (excluding non-cash losses) — (1)Dividends received from 50% or less owned companies 1,324 1,642 (6,718) (39,915)Changes in operating assets and liabilities before interest and income taxes (19,513) 11,715 Director share awards 893 — Restricted stock vesting (51) — Proceeds from sale of marketable securities — 51,877 Cash settlements on derivative transactions, net (150) (188)Interest paid, excluding capitalized interest (8,703) (3,626)Interest received 568 2,647 Income taxes refunded, net (12) 31.226 Total cash flows (used in) provided by operating activities $ (33,686) $ 53,736 _____________________
(1) During the Current Six Months and the Prior Six Months, capitalized interest paid and included in purchases of property and equipment was $1.0million and $2.3 million, respectively.
For a detailed discussion of the Company's financial results for the reported periods, see “Consolidated Results of
Operations” included above. Changes in operating assets and liabilities before interest and income taxes are the result of theCompany's working capital requirements.
Investing Activities
During the Current Six Months, net cash used in investing activities was $30.3 million, primarily for the following: • capital expenditures were $15.5 million; • the Company sold one fast support vessel and two supply vessels previously retired and removed from service, one fast
support vessel, one standby safety vessel, one supply vessel and other equipment for net proceeds of $2.6 million ($2.5million in cash and $0.1 million of previously received deposits) and received a $1.0 million deposit for the future sale ofone specialty vessel
• construction reserve funds account transactions included withdrawals of $7.2 million; and • the Company made investments in, and advances to, its 50% or less owned companies of $25.6 million for the new
SEACOSCO joint venture.
During the Prior Six Months, net cash used in investing activities was $13.8 million, primarily as a result of the following: • capital expenditures and payments on fair value hedges were $29.1 million. Four fast support vessels were delivered
during the period; • the Company sold two liftboats, one supply vessel, four offshore support vessels previously retired and removed from
service and other property and equipment for net proceeds of $10.0 million ($9.5 million in cash and $0.5 million ofpreviously received deposits);
• construction reserve funds account transactions included deposits of $6.3 million and withdrawals of $16.7 million; • the Company made investments in, and advances to, its 50% or less owned companies of $4.2 million, comprised of $2.4
million to Falcon Global and $1.8 million to OSV Partners. • the Company received capital distributions of $7.4 million from its 50% or less owned company MexMar; • effective March 31, 2017, the Company consolidated Falcon Global International and assumed cash of $1.9 million.

36

Table of Contents • effective April 28, 2017, the Company acquired a 100% controlling interest in Sea-Cat Crewzer II LLC through the
acquisition of its partners' 50% ownership interest for $9.6 million, net of cash acquired; and
• effective April 28, 2017, the Company acquired a 100% controlling interest in Sea-Cat Crewzer LLC through theacquisition of its partners' 50% ownership interest for $0.1 million, net of cash acquired.
Financing Activities
During the Current Six Months, net cash provided by financing activities was $39.9 million. The Company:
• borrowed $10.0 million under the FGUSA Revolving Loan Facility; • paid $15.0 million in debtor-in-possession obligations assumed from MOI; • converted €6.0 million of denominated debt into pound sterling debt, paying $7.5 million in euro debt and borrowing $8.5
million in pound sterling debt, resulting in a net increase in USD borrowings of $1.0 million; • made scheduled payments on long-term debt and obligations of $12.7 million; • issued Common Stock for proceeds of $43.0 million in a private placement; and • issued Warrants to purchase Common Stock for proceeds of $12.8 million in a private placement.
During the Prior Six Months, net cash used in financing activities was $7.1 million. The Company: • borrowed $3.4 million under the Sea-Cat Crewzer III Term Loan Facility; • made other scheduled payments on long-term debt and capital lease obligations of $4.0 million; • incurred issuance costs of $0.2 million related to a number of new debt facilities; • purchased subsidiary shares from holders of noncontrolling interests for $3.7 million; and
• paid SEACOR Holdings $2.7 million for the distribution of SEACOR Marine restricted stock to Company personnel inconnection with the Spin-off.
Short and Long-Term Liquidity Requirements
The Company believes that a combination of cash balances on hand, construction reserve funds, cash generated from
operating activities, availability under existing subsidiary financing arrangements and access to the credit and capital markets willprovide sufficient liquidity to meet its obligations, including to support its capital expenditures program, working capital and debtservice requirements. The Company continually evaluates possible acquisitions and dispositions of certain businesses and assets.The Company’s sources of liquidity may be impacted by the general condition of the markets in which it operates and the broadereconomy as a whole, which may limit its access to the credit and capital markets on acceptable terms. Management will continue toclosely monitor the Company’s performance and liquidity, as well as the credit and capital markets.
Off-Balance Sheet Arrangements
For a discussion of the Company’s off-balance sheet arrangements, refer to Liquidity and Capital Resources included inthe Company's Annual Report on Form 10-K for the year ended December 31, 2017. There has been no material change in theCompany’s off-balance sheet arrangements during the six months ended June 30, 2018.
Debt Securities and Credit Agreements
For a discussion of the Company’s debt securities and credit agreements, see “Note 4. Long-Term Debt” in the unaudited
consolidated financial statements included elsewhere in this Quarterly Report on Form 10-Q and in “Note 7. Long-Term Debt” inthe Company's audited consolidated financial statements included in its Annual Report on Form 10-K.
Contractual Obligations and Commercial Commitments
For a discussion of the Company’s contractual obligations and commercial commitments, refer to Liquidity and Capital
Resources included in the Company's Annual Report on Form 10-K for the year ended December 31, 2017. There has been nomaterial change in the Company’s contractual obligations and commercial commitments during the six months ended June 30,2018.
37

Table of Contents
Contingencies
As of June 30, 2018, SEACOR Holdings has guaranteed $51.6 million on behalf of the Company for various obligationsincluding: letter of credit obligations, performance obligations under sale-leaseback arrangements and invoiced amounts forfunding deficits under the MNOPF. Pursuant to a Transition Services Agreement with SEACOR Holdings, SEACOR Holdingscharges the Company a fee of 0.5% per annum on outstanding guaranteed amounts, which declines as the obligations are settled bythe Company.
In the normal course of its business, the Company becomes involved in various other litigation matters including, among
other things, claims by third parties for alleged property damages and personal injuries. Management has used estimates indetermining the Company’s potential exposure to these matters and has recorded reserves in its financial statements related theretowhere appropriate. It is possible that a change in the Company’s estimates of that exposure could occur, but the Company does notexpect such changes in estimated costs would have a material effect on the Company’s consolidated financial position, results ofoperations or cash flows.
ITEM 3. QUANTITATIVE AND QUALITATIVE DISCLOSURES ABOUT MARKET RISK
For a discussion of the Company’s exposure to market risk, refer to “Quantitative and Qualitative Disclosures About MarketRisk” included in the Company's Annual Report on Form 10-K for the year ended December 31, 2017. There has been no materialchange in the Company’s exposure to market risk during the Current Six Months. ITEM 4. CONTROLS AND PROCEDURES Evaluation of Disclosure Controls and Procedures
With the participation of the Company’s principal executive officer and principal financial officer, management evaluatedthe effectiveness of the Company’s disclosure controls and procedures (as defined in Rules 13a-15(e) and 15d-15(e) under theSecurities Exchange Act of 1934, as amended (the “Exchange Act”)), as of June 30, 2018. Based on their evaluation, theCompany’s principal executive officer and principal financial officer concluded that the Company’s disclosure controls andprocedures were effective as of June 30, 2018.
The Company’s disclosure controls and procedures have been designed to ensure that information required to be disclosedby the Company in the reports it files or submits under the Exchange Act is recorded, processed, summarized and reported withinthe time periods specified in the Securities and Exchange Commission’s rules and forms. Disclosure controls and proceduresinclude, without limitation, controls and procedures designed to ensure that information required to be disclosed by the Company inthe reports it files or submits under the Exchange Act is accumulated and communicated to the Company’s management, includingits principal executive and principal financial officers, to allow timely decisions regarding required disclosures. All internal controlsystems, no matter how well designed, have inherent limitations. Therefore, even those internal control systems determined to beeffective can provide only a level of reasonable assurance with respect to financial statement preparation and presentation.
Changes in Internal Control Over Financial Reporting
There have been no changes in the Company’s internal control over financial reporting (as defined in Rules 13a-15(f) and15d-15(f) under the Exchange Act) that occurred during the three months ended June 30, 2018 that have materially affected, or arereasonably likely to materially affect, the Company’s internal control over financial reporting.
38
Table of Contents PART II—OTHER INFORMATION ITEM 1. LEGAL PROCEEDINGS
For a description of developments with respect to pending legal proceedings described in the Company's Annual Report onForm 10-K for the year ended December 31, 2017, see Note 10. “Commitments and Contingencies” included in Part I. Item 1.“ Financial Statements” elsewhere in this Quarterly Report on Form 10-Q. ITEM 1A. RISK FACTORS
For a discussion of the Company’s risk factors, refer to “Risk Factors” included in the Company's Annual Report on Form10-K for the year ended December 31, 2017. There have been no material changes in the Company’s risk factors during the CurrentSix Months. ITEM 2. UNREGISTERED SALES OF EQUITY SECURITIES AND USE OF PROCEEDS
On March 26, 2018, the Company issued 103,213 shares of Common Stock to an accredited investor for a total of $1.8million in gross proceeds. The shares of Common Stock were issued in a private placement exempt from the registrationrequirements of the Securities Act, in reliance on the exemption set forth in Section 4(a)(2) of the Securities Act.
On April 26, 2018, the Company closed the PIPE Private Placement for aggregate gross proceeds of $56,855,000 with
certain qualified institutional buyers and other accredited investors and entered into a registration rights agreement with thosequalified institutional buyers and other accredited investors. The PIPE Private Placement included the issuance of the PIPE Sharesand the PIPE Warrants. The PIPE Shares and PIPE Warrants in the PIPE Private Placement were issued in reliance upon theexemption from registration provided by Section 4(a)(2) of the Securities Act.
On May 2, 2018, the Company and Carlyle entered into the Exchange pursuant to which Carlyle exchanged $50.0 million in
principal amount of the Convertible Senior Notes for the Carlyle Warrants. The Carlyle Warrants in the Exchange were issued inreliance upon the exemption from registration provided by Section 4(a)(2) of the Securities Act.
On May 31, 2018, Carlyle exercised Carlyle Warrants to purchase a total of 250,585 shares of Common Stock (after giving
effect to the withholding of 108 shares of Common Stock as payment for the exercise price of the Warrants) (the “CarlyleWarrant Exercise”). Following the Carlyle Warrant Exercise, Carlyle holds Warrants to purchase 1,636,099 shares of CommonStock at an exercise price of $0.01 per share. The Common Stock issued in the Carlyle Warrant Exercise was issued in relianceupon the exemption from registration provided by Section 4(a)(2) of the Securities Act.
On June 8, 2018, CME exercised PIPE Warrants and paid an aggregate cash exercise price of $0.01 per share to purchase atotal of 38,857 shares of Common Stock (the “CME Warrant Exercise”). Following the CME Warrant Exercise, CME holdsWarrants to purchase 635,307 shares of Common Stock at an exercise price of $0.01 per share. The Common Stock issued in theCME Warrant Exercise was issued in reliance upon the exemption from registration provided by Section 4(a)(2) of theSecurities Act.
ITEM 3. DEFAULT UPON SENIOR SECURITIES
None. ITEM 4. MINE SAFETY DISCLOSURES
Not applicable. ITEM 5. OTHER INFORMATION
None.
39

Table of Contents ITEM 6. EXHIBITS
10.1
Subscription Agreement, dated as of April 20, 2018, by and among SEACOR Marine Holdings Inc. and the purchasers named therein(incorporated by reference to Exhibit 10.5 to the Quarterly Report on Form 10-Q of SEACOR Marine Holdings Inc. filed with theSecurities and Exchange Commission on May 10, 2018).
10.2
Registration Rights Agreement, dated as of April 26, 2018, by and among SEACOR Marine Holdings Inc. and the purchasers namedtherein (incorporated by reference to Exhibit10.6 to the Quarterly Report on Form 10-Q of SEACOR Marine Holdings Inc. filed with the Securities and Exchange Commission onMay 10, 2018).
10.3
Amendment and Exchange Agreement, dated as of May 2, 2018, by and among SEACOR Marine Holdings Inc. and the purchasersnamed therein (incorporated by reference to Exhibit 10.1 to the Current Report on Form 8-K of SEACOR Marine Holdings Inc. filedwith the Securities and Exchange Commission on May 2, 2018).
10.4 Form of Director Stock Option Agreement under the SEACOR Marine Holdings Inc. 2017 Equity Incentive Plan.31.1
Certification by the Principal Executive Officer pursuant to Rule 13a-14(a) and Rule 15d-14(a) of the Securities Exchange Act, asamended.
31.2 Certification by the Principal Financial Officer pursuant to Rule 13a-14(a) and Rule 15d-14(a) of the Securities Exchange Act, asamended.
32 Certification by the Principal Executive Officer and Chief Financial Officer pursuant to 18 U.S.C. Section 1350, as adopted pursuant toSection 906 of the Sarbanes-Oxley Act of 2002
101.INS** XBRL Instance Document101.SCH** XBRL Taxonomy Extension Schema101.CAL** XBRL Taxonomy Extension Calculation Linkbase101.DEF** XBRL Taxonomy Extension Definition Linkbase101.LAB** XBRL Taxonomy Extension Label Linkbase101.PRE** XBRL Taxonomy Extension Presentation Linkbase
______________________** Pursuant to Rule 406T of Regulation S-T, these interactive data files are deemed not filed or part of a registration statement or prospectus for
purposes of Sections 11 or 12 of the Securities Act of 1933 or Section 18 of the Securities Exchange Act of 1934 and otherwise are not subject toliability.
40

Table of Contents
SIGNATURES
Pursuant to the requirements of the Securities Exchange Act of 1934, the registrant has duly caused this report to be signed on its behalf by theundersigned thereunto duly authorized. SEACOR Marine Holdings Inc. (Registrant)
DATE:August 9, 2018 By: /s/ John Gellert
John Gellert, President and Chief Executive Officer(Principal Executive Officer)
DATE:August 9, 2018 By: /s/ Jesus Llorca
Jesus Llorca, Executive Vice Presidentand Chief Financial Officer(Principal Financial Officer)
41

Exhibit 10.4
DIRECTOR STOCK OPTION GRANT AGREEMENTPURSUANT TO THE SEACOR MARINE HOLDINGS INC.
2017 EQUITY INCENTIVE PLAN THIS DIRECTOR STOCK OPTION GRANT AGREEMENT (this “Agreement”), dated as of [________], 20[__] (the “Grant Date”), sets forth theagreement of SEACOR Marine Holdings Inc., a Delaware corporation (the “Company”), to grant options to [______________], a non-employee director ofthe Company or its Affiliates (the “Grantee”), to purchase Shares on the terms and subject to the conditions hereinafter provided. The stock options to be granted pursuant hereto shall not be Incentive Stock Options. 1. Agreement to Grant; Grant Date and Number of Shares. The Company hereby agrees, subject to Paragraph 5, to grant to the Grantee options topurchase a total of [________] Shares (the “Stock Options”) on the Grant Date. The Stock Options shall vest and become exercisable to purchase Shares asprovided in Paragraph 4. 2. Exercise Price. The per-Share exercise price of the Stock Options shall be equal to the Fair Market Value on the Grant Date. The Company shallprovide notice to the Grantee of the per-Share exercise price promptly after the Grant Date. 3. Payment of Exercise Price. The option exercise price may be paid in cash, by the delivery of Shares then owned by the Grantee (which are not thesubject of any pledge or other security interest and which have been owned by the Grantee for at least six months), by the withholding of Shares for which aStock Option is exercisable or by a combination of these methods. Payment may also be made by delivering a properly executed exercise notice to theCompany together with a copy of irrevocable instructions to a broker to deliver promptly to the Company the aggregate amount of sale or loan proceeds topay the exercise price. To facilitate the foregoing, the Company may enter into agreements for coordinated procedures with one or more brokerage firms. TheCompany may prescribe any other method of paying the exercise price that it determines to be consistent with applicable law. In determining which methodsthe Grantee may utilize to pay the exercise price, the Company may consider such factors as it determines are appropriate. 4. Vesting and Exercise Period.
A. GENERAL. Subject to the terms and conditions set forth herein, the Stock Options shall be fully vested and exercisable on the Grant Date. No Stock Option awarded hereunder shall be exercisable later than ten years after the Grant Date. The Stock Options awarded hereunder shall not betransferable otherwise than by will or the laws of descent and distribution, and shall be exercisable during the Grantee's lifetime only by the Grantee.Notwithstanding the foregoing, Stock Options may be transferred by the Grantee solely to the Grantee’s spouse, siblings, parents, children and grandchildrenor trusts for the benefit of such persons or partnerships, corporations, limited liability companies or other entities owned solely by such persons, includingtrusts for such persons.
B. DEATH. In the event of the Grantee's death, each Stock Option that was unexercised as of the date of death may be exercised until the first tooccur of (i) the one-year anniversary of the date of death and (ii) the tenth anniversary of the Grant Date.
C. RETIREMENT. In the event of the Grantee’s formal retirement from service with the Company under acceptable circumstances as determined
by the Committee in its sole discretion, each Stock Option that was unexercised as of the date of retirement may be exercised until the first to occur of (i) theone-year anniversary of the Grantee’s retirement date and (ii) the tenth anniversary of the Grant Date.
D. VOLUNTARY RESIGNATION. Subject to Paragraph 6, in the event of the Grantee’s voluntary termination of service with the Company, each
Stock Option that was unexercised as of the date of termination may be exercised until the first to occur of (i) the date which is 90 days after the effective dateof such termination and (ii) the tenth anniversary of the Grant Date. 5. Termination of Stock Options; Post-Service Exercises. Except as provided for in Paragraph 4 or 6 hereof, or as otherwise provided by the Committee,(i) no Stock Option represented by this Agreement may be exercised after termination of the Grantee’s service with the Company, and (ii) all Stock Optionsshall terminate and be of no further force or effect from and after the date of such termination.

6. Adjustment Provisions; Change of Control.
A. The Stock Options shall be subject to adjustment as provided in Section 4(b) of the Plan.
B. The Stock Options shall be subject to Section 13 of the Plan upon and following a Change of Control. 7. Tenure. The Grantee’s right to continue to serve the Company or any of its Affiliates as a non-employee director, or otherwise, shall not be enlarged orotherwise affected by the award hereunder. 8. Representations and Warranties of Grantee. The Grantee hereby represents and warrants to the Company as follows:
A. The Grantee has the legal right and capacity to enter into this Agreement and fully understands the terms and conditions of this Agreement.
B. The Grantee is acquiring the Shares subject to the Stock Options for investment purposes only and not with a view to, or in connection with, thepublic distribution thereof in violation of the Securities Act of 1933, as amended (the “Securities Act”).
C. If any Shares subject to the Stock Options shall be registered under the Securities Act, no public offering (otherwise than on a national securities
exchange, as defined in the Securities Exchange Act of 1934, as amended) of any Shares acquired hereunder shall be made by the Grantee (or any otherperson) under such circumstances that he or she (or such person) may be deemed an underwriter, as defined in the Securities Act.
D. The Grantee understands and agrees that none of the Shares subject to the Stock Options may be offered, sold, assigned, transferred, pledged,hypothecated or otherwise disposed of except in compliance with this Agreement and the Securities Act pursuant to an effective registration statement orapplicable exemption from the registration requirements of the Securities Act and applicable state securities or “blue sky” laws, and then only in accordancewith the SEACOR Marine Holdings Inc. Insider Trading and Tipping Procedures and Guidelines (the “Insider Trading Policy”). The Grantee furtherunderstands that the Company has no obligation to cause or to refrain from causing the resale of any of the Shares subject to the Stock Options or any otherShares or shares of its capital stock to be registered under the Securities Act or to comply with any exemption under the Securities Act which would permitthe Shares subject to the Stock Options to be sold or otherwise transferred by the Grantee. The Grantee further understands that, without approval in writingpursuant to the Insider Trading Policy, no trade may be executed in any interest or position relating to the future price of Company securities, such as a putoption, call option, or short sale (which prohibition includes, among other things, establishing any “collar” or other mechanism for the purpose of establishinga price).
E. Notwithstanding anything herein to the contrary, the Company shall have no obligation to deliver any Shares hereunder or make any other
distribution of benefits under hereunder unless such delivery or distribution would comply with all applicable laws (including, without limitation, theSecurities Act), and the applicable requirements of any securities exchange or similar entity.
9. Notices. Any notice required or permitted hereunder shall be deemed given, if to the Grantee, when delivered (a) by a nationally recognized overnightdelivery service (receipt requested), (b) by e-mail or other electronic means, or (c) by certified or registered mail, return receipt requested, postage prepaid, atsuch address as the Company shall maintain for the Grantee in its personnel records or such other address as he or she may designate in writing to theCompany. Grantee will promptly notify the Company in writing upon any change in Grantee’s mailing address or e-mail address. Any notice required orpermitted hereunder shall be deemed given, if to the Company, when delivered by certified or registered mail, return receipt requested, postage prepaid, to theCompany, at 7910 Main Street, 2nd Floor, Houma, LA, Attention: Corporate Secretary or such other address as the Company may designate in writing to theGrantee. 10. Failure to Enforce Not a Waiver. The failure of the Company to enforce at any time any provision of this Agreement shall in no manner be construedto be a waiver of such provision or of any other provision hereof. 11. Amendment and Termination. Subject to the terms of the Plan, this Agreement may not be amended or terminated unless such amendment ortermination is in writing and duly executed by each of the parties hereto. 12. Counterparts. This Agreement may be executed in counterparts, each of which shall be deemed to be an original, but all of which together shallconstitute but one and the same instrument. 13. Benefit and Binding Effect. This Agreement shall be binding upon and shall inure to the benefit of the Company, its successors and assigns, and theGrantee, his or her executors, administrators, personal representatives and heirs. In the event that any part of this Agreement shall be held to be invalid orunenforceable, the remaining parts hereof shall nevertheless continue to be valid and enforceable as though the invalid portions were not a part hereof.
2

14. Entire Agreement. This Agreement contains the entire understanding of the parties hereto with respect to the Stock Options and supersedes all prioragreements, discussions and understandings with respect to such subject matter. 15. Governing Law. This Agreement shall be governed by, and construed and enforced in accordance with, the laws of the State of Delaware, withoutgiving effect to principles and provisions thereof relating to conflict or choice of laws. 16. Clawback. The Stock Options and the Shares issued upon exercise of the Stock Options will be subject to such clawback provisions as may be requiredto be made pursuant to any applicable law, government regulation or stock exchange listing requirement, or other applicable Company policy. 17. 2017 Equity Incentive Plan Controls. This Agreement is subject to all terms and provisions of the SEACOR Marine Holdings Inc. 2017 EquityIncentive Plan (and as amended, modified or supplemented from time to time, the “Plan”), which are incorporated herein by reference. In the event of anyconflict, the terms and provisions of the Plan shall control over the terms and provisions of this Agreement. All capitalized terms herein shall have themeanings given to such terms by the Plan unless otherwise defined herein or unless the context clearly indicates otherwise. IN WITNESS WHEREOF, the Company has executed this Agreement on the date and year first above written. SEACOR MARINE HOLDINGS INC. ___________________________[Name][Title] The undersigned hereby accepts, and agrees to, all terms and provisions of the foregoing Stock Option Grant Agreement. GRANTEE Signature: ________________________ Name: [________________________] Date: [________________________]
3

Date: August 9, 2018 /s/ John GellertName: John GellertTitle: President and Chief Executive Officer
(Principal Executive Officer)
Exhibit 31.1CERTIFICATION OF CHIEF EXECUTIVE OFFICER
PURSUANT TO RULE 13a-14(a) AND 15d-14(a), AS AMENDEDI, John Gellert, certify that: 1. I have reviewed this quarterly report on Form 10-Q of SEACOR Marine Holdings Inc.; 2. Based on my knowledge, this report does not contain any untrue statement of a material fact or omit to state a material fact necessary to
make the statements made, in light of the circumstances under which such statements were made, not misleading with respect to the periodcovered by this report;
3. Based on my knowledge, the financial statements and other financial information included in this report, fairly present in all material
respects the financial condition, results of operations and cash flows of the registrant as of, and for, the periods presented in this report; 4. The registrant's other certifying officer and I are responsible for establishing and maintaining disclosure controls and procedures (as defined
in Exchange Act Rules 13a-15(e) and 15d-15(e)) for the Registrant and have: a) Designed such disclosure controls and procedures, or caused such disclosure controls and procedures to be designed under our
supervision, to ensure that material information relating to the Registrant, including its consolidated subsidiaries, is madeknown to us by others within those entities, particularly during the period in which this report is being prepared;
b) Designed such internal control over financial reporting, or caused such internal control over financial reporting to be designed
under our supervision, to provide reasonable assurance regarding the reliability of financial reporting and the preparation offinancial statements for external purposes in accordance with generally accepted accounting principles;
c) Evaluated the effectiveness of the Registrant's disclosure controls and procedures and presented in this report our conclusions
about the effectiveness of the disclosure controls and procedures as of the end of the period covered by this report based onsuch evaluation; and
d) Disclosed in this report any change in the Registrant's internal control over financial reporting that occurred during the
Registrant's most recent fiscal quarter that has materially affected, or is reasonably likely to materially affect, the Registrant'sinternal control over financial reporting; and
5. The Registrant's other certifying officer and I have disclosed, based on our most recent evaluation of internal control over financial
reporting, to the Registrant's auditors and the audit committee of the Registrant's board of directors (or persons performing the equivalentfunctions):
a) All significant deficiencies and material weaknesses in the design or operation of internal control over financial reporting
which are reasonably likely to adversely affect the Registrant's ability to record, process, summarize and report financialinformation; and
b) Any fraud, whether or not material, that involves management or other employees who have a significant role in the
Registrant's internal control over financial reporting.

Date: August 9, 2018 /s/ Jesus LlorcaName: Jesus LlorcaTitle: Executive Vice President and
Chief Financial Officer(Principal Financial Officer)
Exhibit 31.2CERTIFICATION
I, Jesus Llorca, certify that: 1. I have reviewed this quarterly report on Form 10-Q of SEACOR Marine Holdings Inc.; 2. Based on my knowledge, this report does not contain any untrue statement of a material fact or omit to state a material fact necessary to
make the statements made, in light of the circumstances under which such statements were made, not misleading with respect to the periodcovered by this report;
3. Based on my knowledge, the financial statements and other financial information included in this report, fairly present in all material
respects the financial condition, results of operations and cash flows of the registrant as of, and for, the periods presented in this report; 4. The registrant's other certifying officer and I are responsible for establishing and maintaining disclosure controls and procedures (as defined
in Exchange Act Rules 13a-15(e) and 15d-15(e)) for the Registrant and have: a) Designed such disclosure controls and procedures, or caused such disclosure controls and procedures to be designed under our
supervision, to ensure that material information relating to the Registrant, including its consolidated subsidiaries, is madeknown to us by others within those entities, particularly during the period in which this report is being prepared;
b) Designed such internal control over financial reporting, or caused such internal control over financial reporting to be designed
under our supervision, to provide reasonable assurance regarding the reliability of financial reporting and the preparation offinancial statements for external purposes in accordance with generally accepted accounting principles;
c) Evaluated the effectiveness of the Registrant's disclosure controls and procedures and presented in this report our conclusions
about the effectiveness of the disclosure controls and procedures as of the end of the period covered by this report based onsuch evaluation; and
d) Disclosed in this report any change in the Registrant's internal control over financial reporting that occurred during the
Registrant's most recent fiscal quarter that has materially affected, or is reasonably likely to materially affect, the Registrant'sinternal control over financial reporting; and
5. The Registrant's other certifying officer and I have disclosed, based on our most recent evaluation of internal control over financialreporting, to the Registrant's auditors and the audit committee of the Registrant's board of directors (or persons performing the equivalentfunctions):
a) All significant deficiencies and material weaknesses in the design or operation of internal control over financial reporting
which are reasonably likely to adversely affect the Registrant's ability to record, process, summarize and report financialinformation; and
b) Any fraud, whether or not material, that involves management or other employees who have a significant role in the
Registrant's internal control over financial reporting.

Date: August 9, 2018 /s/ John GellertName: John GellertTitle: President and Chief Executive Officer
(Principal Executive Officer) Date: August 9, 2018 /s/ Jesus LlorcaName: Jesus LlorcaTitle: Executive Vice President and
Chief Financial Officer(Principal Financial Officer)
Exhibit 32CERTIFICATION OF CHIEF EXECUTIVE OFFICER
AND CHIEF FINANCIAL OFFICER PURSUANT TO 18 U.S.C. SECTION 1350,AS ADOPTED BY SECTION 906 OF THE SARBANES-OXLEY ACT OF 2002
Each of the undersigned, the Chief Executive Officer and the Chief Financial Officer of SEACOR Marine Holdings Inc. (the “Company”), hereby certifies, tothe best of her/his knowledge and belief, that the Form 10-Q of the Company for the quarterly period ended June 30, 2018 (the “Periodic Report”)accompanying this certification fully complies with the requirements of Section 13(a) or 15(d) of the Securities Exchange Act of 1934, as amended, and thatthe information contained in the Periodic Report fairly presents, in all material respects, the financial condition and results of operations of the Company. Thiscertification is provided solely for purposes of complying with the provisions of Section 906 of the Sarbanes-Oxley Act and is not intended to be used for anyother purpose.