“s et the night on fire !” mafia violence and … “s et the night on fire!” mafia violence...
TRANSCRIPT

1
“SET THE NIGHT ON FIRE!” MAFIA VIOLENCE AND ELECTIONS IN ITALY
Elisabetta Olivieri Bank of Italy
Salvatore Sberna* European University Institute
ABSTRACT
Do criminal organizations use strategically violence for electoral purposes? This paper aims at analyzing the relation between criminal violence and elections in Italy where four regionally-based mafia-like groups operate. The empirical analysis is drawn from a unique panel data of monthly intimidation attacks reported by police forces in 105 Italian provinces from 1983 to 2003. Through a diff-in-diff design, the paper finds statistical evidence that as elections approach intimidation attacks increase in those provinces where mafia-like groups operate. Criminal groups find opportunities for and constraints in using violence depending on the uncertainty of the elections, and on exogenous shocks such as policing. The motives that lead these organizations to be involved in elections are scrutinized, addressing empirically the impact of violence on local public spending and voters’ turnout. We observe an increase in local public spending in those cities where more criminal-electoral violence occurs. Conversely, as violence increases, less voters likely go to the polls. These findings are consistent with a large case study literature documenting the intervention of criminal organizations into elections to capture politicians, influence voters and to engage in rent-seeking.1 Keywords: Election, Political Violence, Organized Crime, Electoral Behavior
DRAFT VERSION PLEASE DO NOT CITE
1 Earlier versions of this paper were presented at the CEES Seminar at UCLA (Los Angeles, June 7, 2010), the ECPR Joint Sessions - Workshop on “Political Violence and Institutions" (St. Gallen, April 12-17, 2011), Department of Economics, Pisa University and Bank of Italy. We gratefully acknowledge helpful comments by the participants at these event and especially Miriam Golden, Simon Hug, Kristian Gleditsch, Guglielmo Barone and Paolo Sestito; support for data collection by Emanuele Marotta, Italian National Police, as well as Enzo Calabria and Paolo Fantini, SDI - Ministry of Interior. Salvatore Sberna is grateful for the hospitality of the Center for European and Eurasian Studies at UCLA and acknowledge financial support by the U.S.-Italy Fulbright Commission (Fulbright Fellowship 2010-2011). The views expressed herein do not necessarily reflect those of our Institutions. * Corresponding author.
2
In recent years, media and press around the world have presented compelling evidence on the
involvement of criminal organizations in electoral campaigns both in established democracies (Italy,
Japan) and in many democracies in transition, such as in Russia, Mexico and Latin America. Neither
democracies nor autocracies have proved to be immune to organized crime that especially undermines
countries’ fragile moves toward real democracy, such as in Russia (Varese, 2001) or in Central and Latin
America (Bailey & Godson, 2000; Villareal, 2002; Bergman & Whitehead, 2009). In some
circumstances, in fact, criminal organizations not only affect the human security and rule-of-law of the
country, but also interfere with free and fair elections. This intervention can vary significantly from
campaign finance to voter mobilization, or eventually violence, following a different strategy of
interaction between organized crime and politics. Cases span from countries where criminal
organizations have grown in scale and scope posing a security threat to regimes' stability (Columbia,
Jamaica, Mexico), to countries that have experienced a long and enduring side-by-side relationship
(Italy, Japan, the United States). Therefore, the use of violence is just one option among different
alternative strategies of interaction, and relies on different costs-and-benefits calculations for each
organization. In some countries, threatening is cheaper than bribing. In Columbia, for instance, in June
2002, the main narco-guerrilla group, the FARC, launched a campaign targeting city mayors who “were
unsympathetic to its cause” (Dal Bò & al., 2006:43). After several threats of kidnapping and the
assassination of two city mayors, they forced 222 out of 1,098 city mayors in a region of the country to
resign. More recently in Mexico, during the dramatic escalation of violence, drugs cartels assassinated
15 mayors, and at least 126 more were death threatened just in 2010 (Rios, 2011). In the same year, a
PRI gubernatorial candidate in the state of Tamaulipas was shot dead just few days before an election
he was expected to win, and similar interferences were conducted during state elections in Michoacán.
Conversely, in other countries, the use of violence represents the failure of disputes’ settlement
arrangements among criminal groups, and between criminals and legitimate actors. This is especially
true in the case of those criminal groups – mafia-like criminal organizations – specialized in producing,
promoting and selling protection whereby property rights’ enforcement is weak (Gambetta, 1993). The
provision of this service, in fact, cannot rely only on a coercive and predatory approach, but on
reputation, information, trust (Gambetta, 1993). Here the similarity between a stationary bandit and a
mafioso (Olson, 2000).
In Southern Italy, where the first organizational structure of a mafia group was created and then
spread out around the world, historical and press evidence indicate that criminal groups use a wide
variety of strategies to influence the electoral process: from running themselves for elections to
boycotting candidates through violence. In 1992, the Antimafia Parliament Commission investigated
about episodes of violence and homicides during electoral campaigns, and more recently, in 2012, a
special parliamentary committee was ordered to inquiry into intimidation attacks against elected
3
officials at municipal level. According to a recent victimization report, in 2009 there were 370
intimidation attacks against local government representatives. The year after, 363 similar cases were
reported. More than 70% of these attacks were against elected officials, the rest was against their
relatives or local civil servants2. In Italy, homicides are sporadic compared to intimidation attacks,
which especially occur in subnational elections to intimidate opposition candidates, voters, journalists,
or, more often, criminal rivals running for elections. A bullet sent in the post, the burning of cars or
other damages against private properties are clearly part of a repertoire of signaling used by this kind of
groups (Gambetta 2009).
Despite this abundant evidence, quite surprisingly, only few studies have directly addressed the
empirical and theoretical challenges associated with temporal and spatial variation in criminal violence.
Most of the studies that scrutinize the connection between elections and political violence focus mainly
on terrorist and ethnic groups, and remain mainly confined to developing democracies or to countries
highly fragmented along ethnic lines3. Some seminal works have addressed theoretically the crucial role
played by violence in organizing and governing crime (Reuter, 1983), or in creating the reputation as
protection’s provider (Gambetta, 1993), or in punishing non-payment to re-establish mafia reputation
upon entrepreneurs and fakers (Smith & Varese, 2001). More recently, some theoretical studies have
looked at criminal violence as a mean of political influence. Dal Bò et al. (2006) present a model where
groups attempt to influence policies using both bribes (plata) and the threat of punishment (plomo). The
use of punishment lowers the returns from public office and reduces the incentives of high-ability
citizens to enter public life. In relation with the Mexican case, Rios (2011) has analyzed corruption
interactions between the Mexican government and drug traffickers, and the way in which
decentralization affects the price and number of bribes, and ultimately the incentives that traffickers
have to be violent.
However, because of the lack and reliability of data, few studies have empirically investigated the
topic and found support for some of these hypotheses. Some studies have tried to assess the impact of
organized crime upon economic growth and structure (Lavezzi, 2008; Pinotti, 2011), public transfers
(Barone and Narciso, 2012), foreign investments (Daniele & Marani, 2011), electoral turnout and
accountability (Acemoglu et al., 2009; Sanchez&Chacon, 2005), but, no empirical analysis has
scrutinized the determinants of mafias’ activities (Bandiera 2003). The major methodological problems
are the collection of data that often select on the dependent variable (by focusing only on certain type
2 These data have been collected through a content analysis of newspapers, thus it is only a partial assessment of the phenomenon. Avviso Pubblico Report (2011), Amminsitratori sotto tiro, 3 Many studies have assessed empirically the variation in electoral times of the violence employed by terrorist groups (Eubank and Weinberg, 2001; Pape, 2003; Kydd and Walter; 2002, 2006; Chenoweth, 2010; Aksoy, 2010), or by ethnic groups (Cohen, 1997; Collier, 2009). Many authors have showed that the timing of the use of violence is not random, but it can be strategically decided and linked to the competitiveness of elections (Wilkinson, 2004; Collier and Vicente, 2009; Acemoglu & al., 2009).
4
of violence), or reverse causality problems between organized crime and other socio-economic
variables.
In this study, we try to address these problems, testing whether some political determinants of
mafia activities do exist. Thus, we look at the relation between elections and criminal-electoral violence,
i.e. the violence employed strategically by criminal organizations as elections approach. We argue that in
mafia territories the election-time effects on criminal violence can be dramatic. Criminals seeking to
influence the electoral process can use violence as an electoral resource and as a mean to settle disputes
among criminal rivals or candidates. We test this hypothesis focusing on Italy where several criminal
groups operate. These organizations are commonly clustered in four regional consortia: Camorra in
Campania, Sacra Corona Unita in Apulia, ‘Ndrangheta in Calabria and Cosa Nostra in Sicily. However,
the most valid strategy to understand mafias’ behavior is a micro-level approach, looking at their
ultimate unit of analysis that is a mafia family. Called cosche in Sicily or ‘ndrine in Calabria, a single clan is
a territorially-based group operating in the same limited territory since a varying span of time4. Families’
survival depends on several factors, such as the internal cohesion, the existence of disputes’ settlement
mechanisms among families, or exogenous shocks, such as law-enforcement and policing. This study
adopts this approach, contributing to recent stream of research on the micro-dynamics of violence
(Cederman&Gleditsch, 2009).
Because of it, we expect violence to vary across time and space in Italy: first, because mafia
presence varies across provinces, even within the same region; second, because elections timing and
results vary across provinces and elections. The analysis is drawn from an unique panel data of monthly
crimes (arson and bomb attacks) reported by police forces in Italian provinces and province capital
towns from 1983 to 2003. Here, it is important to emphasize that these data do not capture only
electoral violence, but all the different manifestations of violence carried out by criminal groups
(extortion, mafia conflicts, mafia policing). In order to identify an electoral timing effect on violence,
we use a quasi-experimental approach, i.e. a difference-in-difference empirical design.
Therefore, first, we compare mafias’ violence of Italian provinces in electoral and no-electoral
years running a simple OLS regression. Then, in order to exclude the presence of confounding factors,
we adopt a difference-in-difference identification strategy, comparing mafias’ violence in electoral and no-
electoral months in provinces where regional (and municipal) elections occur with a control group of
provinces where elections do not simultaneously occur. The control group provides a counterfactual
scenario for mafias’ violence in electoral provinces in the absence of elections. The evidence shows a
significant increase in the number of crimes during electoral months, especially in those areas whereby
mafia groups operate. The estimates remain robust after several falsification and validity tests we run.
4 There are groups operating in the same neighborhood since one hundred year, such as the Giuliano family in Naples.

5
In a second part of the paper, we ponder the significance of this relation, disentangling the causal
mechanism linking elections and violence. First, we try to explain variation in criminal-electoral
violence across and in-between provinces, looking at the impact of electoral competition and policing.
Under some conditions, criminals may have strong incentives to use violence. In the paper, we show
that more violence is employed, for instance, in those provinces where elections are very uncertain, and
the margin between the two most voted parties is tight. These findings are consistent with other recent
studies that have examined the relation between greater electoral competition and homicides at
subnational level in countries undergoing a transition to democracy (Villareal, 2002). Then, we show
that law-enforcement positively affects criminal-electoral violence. It means that higher level of
electoral violence occurs in those provinces whereby police arrested more mafia members in the year
prior elections. This evidence gives support to a model presented by Smith and Varese (2001) in which,
counter-intuitively, policies that increase policing lead to a short-term increase in violence.
Moreover, in the last past of the paper, we evaluate the outcomes of this violence exploring the
motives that lead these organizations to be involved in elections. Voters’ mobilization and local public
spending are the two main links we scrutinize in the paper. We argue, in fact, that criminal
organizations use violence during the electoral campaigns also to capture policy decisions on public
spending. Criminal groups are, in fact, engaged in rent-seeking like any other stakeholders in local
political arena. They have preferences on political rents created and allocated by policy makers, and
they fiercely compete against each other to impose control upon them. We test this hypothesis looking
at the relation between criminal violence and public spending at municipal level. We found that an
increase in violence is significantly correlated with an increase in local public spending. Then, we look
at the impact upon electoral turnout, and we found that violence negatively affects voters’ mobilization.
1. The politics of organized crime: the effect of elections on violence
Unlike ordinary criminal organizations, which are avowedly nonpartisan and have virtually no
contact with parties, mafia-like groups are structurally integrated within the political systems in which
they operate for many reasons. First, these groups naturally gravitate toward government because they
seek to influence the direction and content of governmental action to reach organizational goals –
immunity against law-enforcement, rent-seeking (Della Porta & Vannucci, 1999). Mafias are, after all,
groups, which pay attention to whatever is necessary to the maintenance of the integrity and continuity
of the organization itself. Therefore, mafias have preferences over public policies and do not attempt to
displace the state, even though they are at war with it. They exist side-by-side with the state, in a
relationship variously referred to as complementary or symbiotic (Armao, 2003). Second, these groups
6
are involved in politics because they can provide several resources demanded in political markets.
According to the insightful analysis of Gambetta (1993), mafia-like groups are specialized in producing,
promoting and selling protection in those markets where property rights are poorly protected and
guaranteed, such as in the illegal market of political corruption (Varese 2005). However, the demand of
Mafia protection is not limited to illegal markets as those associated with corruption, but it can arise
also during elections. In those moments, mafia-politics nexus is based on mutual interests, both of
criminal organizations and politicians. The latter, in fact, are captured by special Mafia interests (Barro,
1993; Grossman&Helpman, 2001; Golden&Tiwari, 2009; Acemoglu et al., 2009). In exchange of
immunity and rents, criminal organizations can affect elections in many ways by contributing to finance
campaigns, or mobilizing voters to provide electoral support to politicians they prefer to favor, or, in
extreme cases, being themselves running for elections (Della Porta and Vannucci, 1999). Their presence
opens alternative strategies normally not available to candidates in democratic elections, including
intimidation and violence, ballot fraud. Menu of electoral manipulation (Schedler, 2002) consists of
several alternatives for controlling voters, more than the mere use of intimidation and force. Through
these means criminal organizations help favored politicians in retaining political support by voters. As a
consequence of it, mutual interests reduce the incentives of politicians to disrupt criminal networks.
This explains why mafia-politics equilibrium likely persists along the time (Acemoglu et al., 2009).
In any case, given the covert nature of the resources exchanged in mafia-politics nexus, we
focus on violence because this is a resource directly linked to protection and that naturally emerged up
from criminal underworld. Mafia-like groups use violence in a myriad of ways and for several motives,
both in legal and illegal markets. Violence clearly arises from producing illegality (Reuter 1983), and it is
exploited instrumentally to pursue diverse goals, such as to resolve disputes among mafioso families, or
to enforce monopoly in illegal markets (Schelling, 1967). In this paper, we look at criminal-electoral
violence, defined as any organized act or threat by criminal organizations that occur during an electoral
process from the date of nomination for political offices to the date of elections, to intimidate,
physically harm, blackmail, or abuse a political/criminal stakeholders in seeking to influence directly or
indirectly an electoral process (Fisher, 2002).
The strategic timing differentiates this violence from other uses. Election times are crucial for at
least two reasons. (1) In democracy, around elections many political groups try to influence the political
process and they increase the volume of their activities. Political parties seek contributions and
resources for campaigns while interest groups increase their lobbying activities providing their own
resources. Criminal organizations behave similarly to them. They use violence to gain access to the
political arena and to the state's resources. If this is true, we should observe an increase in the number
of intimidation attacks as elections are close since even criminal groups fiercely compete. In election
times, homicides or intimidations among criminals are also means of reputation-building and

7
demonstration of the readiness to use violence. By those acts, they establish their reputation upon
criminal competitors, but also voters and candidates. (2) Electoral campaigns divide parties, candidates
and voters. Campaign rhetoric must emphasize party differences to attract voters, and in the process
issues related to law enforcement, corruption and organized crime can exaggerate potential stakes.
Furthermore, candidates must be visible during campaign, greatly increasing their risks of being
targeted by rivals or criminal groups. Drawing on these propositions, we formulate synthetically the
main hypothesis of this study:
HP1: In those areas controlled by organized crime intimidation attacks increase when elections are close.
According to this formulation, we argue that elections have an exogenous effect on criminal-electoral
violence. We would expect an overall increase of intimidation attacks before elections in those areas
controlled by organized crime.
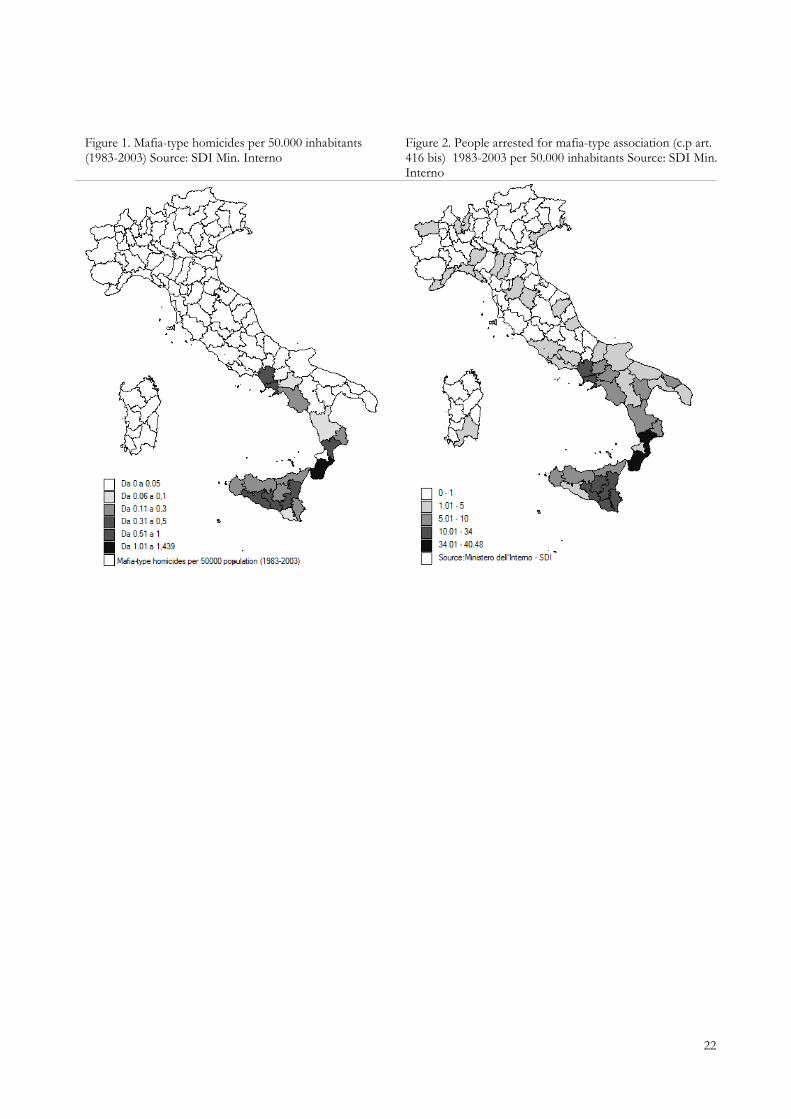
2. Background. Mafia and Politics in Italy According to the National Antimafia Agency, 380 mafia groups are counted in Southern Italy
with ramifications in several provinces of Northern Italy and other countries in Europe and abroad
(Paoli, 1997). Data on people arrested for mafia-type association show that Southern Italy is the area
where criminal organizations mostly operate. A significant divide exists between the rest of country and
four regions: Campania, Apulia, Calabria and Sicily (see Figure 1 and Figure 2). Since the inclusion of
the mafia-type association crime into the criminal code in 1982, more than 4,350 mafia association
crimes have been reported by police forces. Data on mafia-type homicides depict again a highly
polarized phenomenon. In twenty years, more than 5,570 mafia-related homicides have been
committed until 2003, mainly in the same regions. Calabria is the one with the highest per-capita rate.
More interestingly, the presence of mafia groups varies across provinces even within Southern
regions. Figure 1 and 2 show that some Southern provinces have a lower crimes rate, such as in Sicily
(Ragusa, Enna) or in Campania (Avellino, Benevento). According to these data, Italian mafia cannot be
considered as though it was a uniform and nation-wide entity, or even regionally organized. Although it
is heuristically valid to speak of ‘mafia-type association’ for the four regionally-based organized crime
networks (Camorra, Sacra Corona Unita, ‘Ndragheta, Cosa Nostra), several features concerning origins
and development deserve attention from a comparative perspective. Each group has its own criminal
formula, degree of institutionalization, strategic objectives, expressed by the different temporal and
geographical expansion dynamics. Mafias’ principal activities are drug trafficking, extortion, rigging of
public contracts and trafficking in persons, though they have also invested heavily in legal enterprises in
8
the construction and food industries and more recently, wind energy (Sciarrone 2011).
<< Figures 1 & 2 >>
These organizations have been structurally integrated within the Italian political system despite
the regime changes that occurred in the country since the last century. Such relations were by no means
contingent but regular and systemic. Police and historical records present exhaustive evidence
convincingly demonstrating the persistence of a close link between organized crime and politics since
the unification of the country (Franchetti, 1900; Lupo, 2010). There is abundant evidence of collusion
between candidates or elected officials and mafia-like groups both at subnational and national level.
The municipal level is obviously the most vulnerable to mafia infiltration, due the control these
organizations can achieve in limited territories such as small towns. Since 1991, central government
dissolved more than 179 town councils under suspicions of mafias’ infiltration, by forcing elected
officials to resign. More generally, 962 cities in Italy present at least one indicator of mafia presence or
infiltration in legitimate business (ANCI, 2012). Regional governments have also proved to be
vulnerable to mafia penetration. In the case of Sicily, the two last ex-governors resigned due mafia
allegations5. Moreover, out of 90 members of the Sicilian regional assembly elected in 2008, 26 were
under investigations for corruption or got arrested in some cases for allegedly exchanging votes for
favors with mafia groups. Similar allegations raised in other Southern regions like in Campania or in
Calabria where, for instance, in October 2005 Francis Fortugno, the vice president of the regional
assembly, was killed by some ‘Ndrangheta members while he was at the polling station to vote for the
primary elections in Locri.
However, compared to intimidation attacks, assassination of state representatives is a sporadic
event especially in the last 20 years. Since 1897, only 5% of innocent victims assassinated by a mafia
group in Italy (46 up to 900 people) was a politician or a party activist running for election or already
holding a public office when she was killed. However, the number of elected officials killed by the
mafia would be much higher if we also include those politicians assassinated by criminal groups for
being already linked to or directly appointed by rival groups.
3. Data and variables
5 They are Salvatore Cuffaro and Raffaele Lombardo. The first was found guilty in 2008 of divulging information about anti-mafia investigations to a mafia boss, and sentenced to seven years in prison; the latter is accused for allegedly exchanging votes for favors with Santapaola clan member, Vincenzo Aiello, arrested in 2010 on several Mafia charges.

9
Our main source of data is the Minister of Interior Archive on crimes reported by the three main
Italian police forces (Arma dei Carabinieri, Polizia di Stato, Guardia di Finanza) to the judiciary
authority6. Criminal acts are grouped into several categories according to the type of action and crime.
We have information on criminal violence at province level for the all country and at municipal level
for province principal towns (capoluoghi). The uniqueness of this dataset derives from the temporal
disaggregation which permits to exploit violence at monthly level. Our period of analysis spans from
January 1983 to December 2003.7 Unfortunately, this dataset does not provide any information about
both victims and offenders of such events. Therefore, our panel includes all violent acts, not only those
targeting voters, politicians, bureaucrats or those committed by criminal organizations.
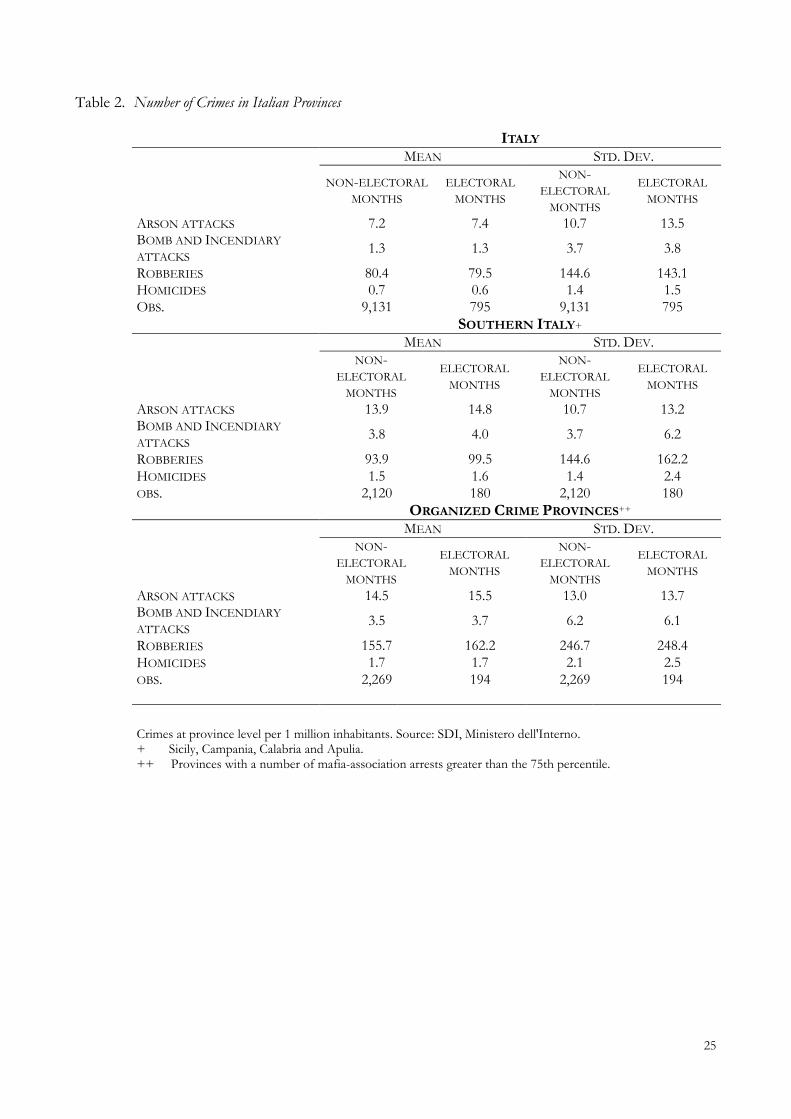
Table 2 shows the number of crime at provincial level per one million of inhabitants. For every
considered type of crime, this rate is higher in provinces where it is more likely that organized crime’s
pressure is strong, like Southern provinces and provinces with a high number of mafia-association
arrests: in these areas the number of arson attacks is three times higher than in the Italian average; the
number of incendiary attacks and homicides almost two times.
Our proxy of criminal violence is constructed by aggregating only two different kinds of crimes:
“arson attacks” and “incendiary attacks” (“incendi dolosi” and “attacchi dinamitardi e incendiari”).
Tactics used by criminals to influence voters, politicians, bureaucrats is much more complex than
simple arson attacks; indeed, selecting only these crimes we explicitly restrict our analysis to a
subsample of relevant cases of mafias’ violence. In spite of that, all other reported offences – such as
extortion, criminal association, drug dealing – encounter two main limits: they are not intimidating
attacks possibly related to the electoral process, and they capture also the effectiveness of anti-mafia
programs (Calderoni, 2010). This is also the reason why we use the offences reported by the police
instead of the crimes prosecuted by district tribunals and gathered by the Minister of Justice.
Concerning the reliability of these data, although indicators on crime and delinquency are
notoriously fraught with problems, our proxy of criminal violence is expected to be quite well measured.
Noteworthy, arson attacks are well reported for insurance purposes, therefore under-reporting is a
negligible issue. Furthermore, police and fire department necessarily intervene in these circumstances
and such intervention leads to an automatic reporting of the crime to police forces. Thus, we expect
that only a low percentage of offences - which do not need any intervention by the police or the
6 Under the “165 scheme report”, the Minister f Interior collected data about those crimes reported by police in all Italian provinces from 1983 to 2003. The system of reporting was not based on a hierarchical rule according to severity of criminal events, but, on the contrary, gather data about specific and single criminal acts and offenses. It included up to 20 separate offenses per incident, without providing elements on victims and offenders. 7 We select the period 1983 to 2003 for two reasons: only since 1983 police forces reported separately crimes committed by criminal organizations from ordinary crimes; second, the information system of data collection changed after 2003.

10
firefighters – are under-reported by victims.
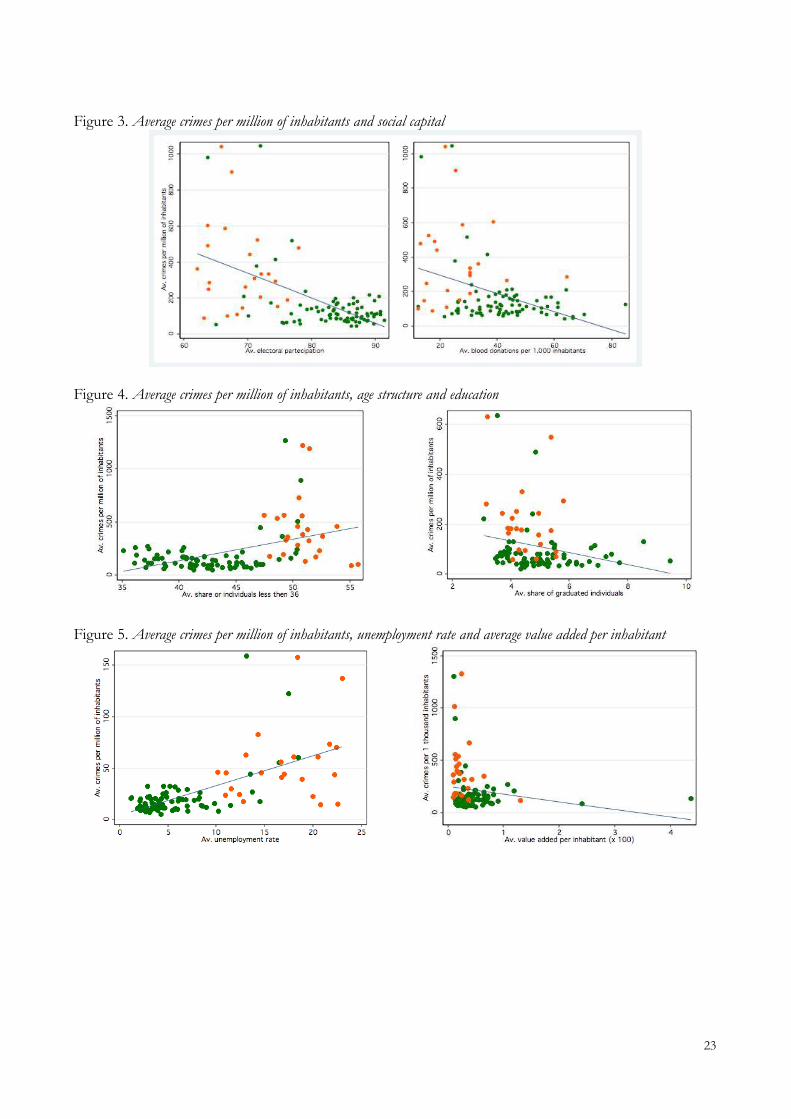
Consistently with the previous literature8, our measure of criminal violence is correlated with the
main local determinants of crime (social capital, age structure of the population, education,
unemployment, per capita income). In particular, figure 3 graphs provincial average violence against
two proxies of social capital (electoral participation and blood donations). A clear negative trend is
observable, with Southern provinces (orange dots) standing on the left part of the plot. Furthermore,
figures 4 and 5 graphs provincial average violence and some other structural correlates of crime (age
structure, education, unemployment, provincial per capita value added). Again, negative correlation
exists between violence and education and income. As expected, violence is positively correlated with
unemployment and the percentage of the provincial population constituted by young individuals (under
36 years old).
<< Figures 3, 4 & 5 >>
In our analysis we will measure the amount of election-related violence looking at the difference
between the number of incendiary and explosive attacks in the election period and afterwards using
regional and municipal elections from 1983 to 2003 (Table 1). Given that elections are not held at the
same time in all the regions/municipalities, our identification strategy will be based on the comparison
of changes in crime in electoral and non-electoral periods in: (i) provinces where elections occur and (ii)
in provinces where elections do not take place at that time (see section 4.2 for further details).
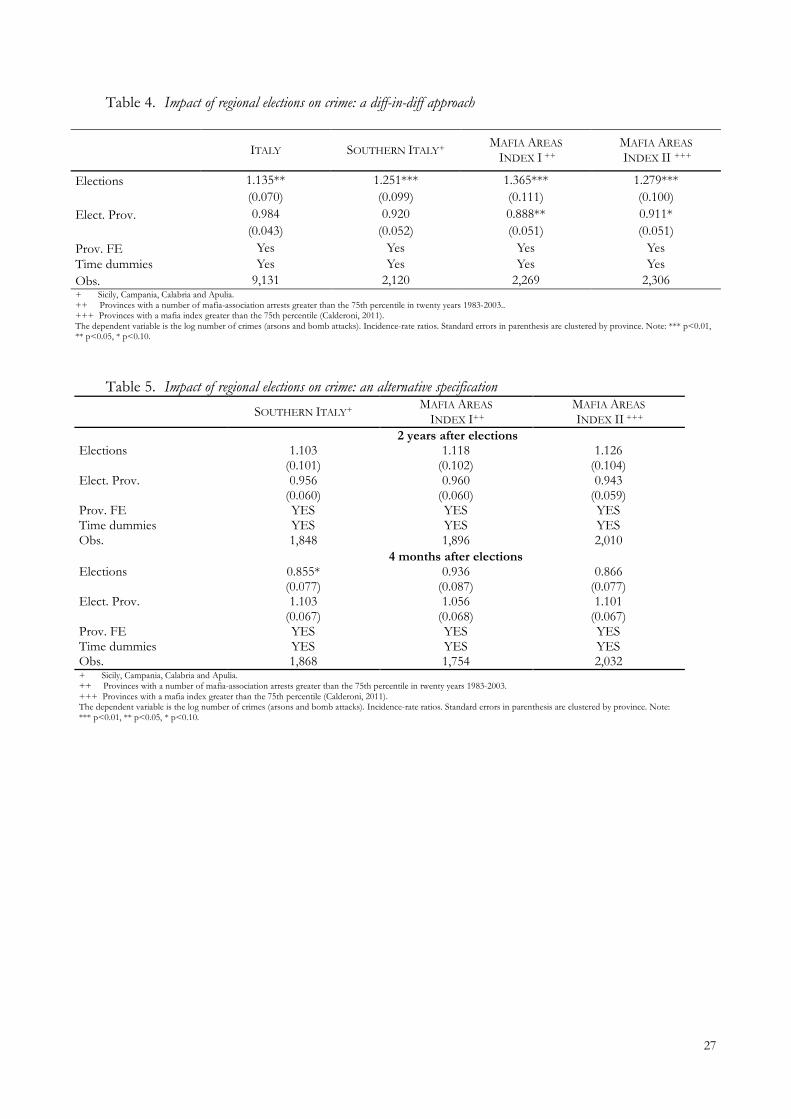
Figure 7 shows the number of crimes per inhabitant at provincial level in electoral and non-
electoral months for provinces where elections take place and for other provinces. As far as provinces
with a low organized crime’s pressure are concerned, both the amount of crimes and their trend over
electoral months are similar in provinces with and without elections. This evidence suggests that
elections don’t influence in any significant way crime intensity in non-organized crime provinces.
Conversely, in organized crime provinces the number of crimes increases in electoral months only in
provinces where elections take place. This is consistent with the hypothesis that criminal organizations
use strategically violence for electoral purposes.
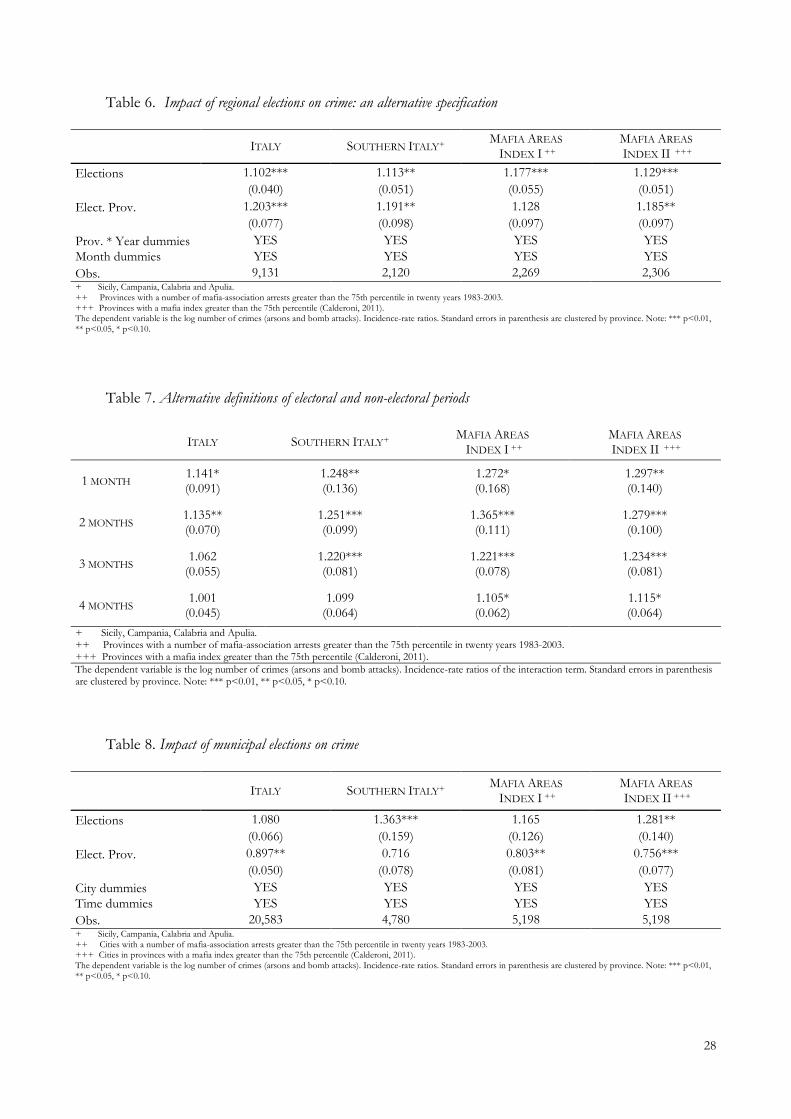
Finally, we used data on regional elections’ results from the Minister of Interior’s archive. Using
these data, we defined a measure of the expected lack of competitiveness in elections, which is equal to
the difference between the share of votes of the first and the second party in previous elections. Figure
8 shows that a higher degree of expected competitiveness in elections seems to be associated with an
increase in violence. However, these correlations are at best only suggestive as they may be affected by
omitted variables or reverse causation. In the following empirical section we deal with some of these
8 See Villareal (2002 for a review of previous works.
11
issues.
4. Empirical strategy In this section we present a set of empirical models to identify the effect of regional elections on
criminal violence.
4.1 Testing the effect of regional elections on crime We first test through a rough OLS empirical strategy what is the effect of regional elections on
crime. We sum up crimes at province and annual level and we compare the average number of crimes
with and without elections using the following model:
logCRIMEp,y = α + βELECTIONp,y +ω logPOPp,y + Xp,y + PROVINCEp +TIMEy +ξp,y (1)
where the dependent variable is the log number of crimes per inhabitant in a province in a certain year
and the main explanatory is a dummy variable equal to one in electoral years in provinces where
regional elections occur. We control for the log number of inhabitants and for other time-varying
characteristics which may affect the number of crime at local level (the age structure of the population
and the unemployment rate). We also include province fixed effects to control for the time invariant
heterogeneity among provinces and year dummies to take out the business cycle and every other
episodic events correlated with the number of crimes. Standard errors are robust to heteroschedasticity
and clustered by provinces.
We estimate this model for the all Italian provinces and for three subsets of provinces where it is
likely that organized crime’s pressure is stronger: (i) provinces of four regions of Southern Italy
(Campania, Apulia, Calabria and Sicily), (ii) provinces where the number of mafia-association arrests in
twenty years (1983-2003) is greater than the 75th percentile of the distribution of these arrests in Italian
provinces (Mafia Areas Index I), and (iii) provinces with a mafia index greater than the 75th percentile
of the distribution of this index in Italian provinces (Mafia Areas Index II, see Calderoni, 20119).
4.2 Testing the effect of regional elections with a diff-in-diff strategy However, many other factors unfolding over times, besides elections, might have caused the
9 The Mafia Index proposed by Calderoni (2011) for each province is equal to the average of the scores on four indicators of mafia presence: mafia-type associations; mafia murders; city councils dissolved for mafia infiltration; and assets confiscated from organised crime.
12
change in violence over time. In order to exclude the presence of confounding factors we adopt a
difference-in-difference identification strategy, which is usually used in economics to study the impact of
some ‘treatments’ (i.e. policy reforms) on economic issues such as unemployment, income, etc. This
estimation model compares changes over time for treated units with the change experienced by a
control group in the same time period. Applied to this study, elections can be considered as a suitable
form of treatment for at least three reasons. First, elections are clearly exogenous since organized crime
cannot affect their timing. Second, elections occur at a single point in time because they have clear
starting and stopping dates thus it permits to observe the variation in criminal violence both before and
after elections are held. Third, we have more elections over time (i.e. more pre-/post- time periods) and
they do not occur necessarily across provinces at the same moment (as national elections do). Because
of this identification strategy, we estimate the impact of elections on crime focusing only on months
close to the elections. We define as ‘electoral months’ the month where regional elections take place as
well as the previous month. We choose this time period in order to cover the entire electoral campaign.
We compare the number of crimes during the electoral period with the number of crimes in the two
months immediately after elections (what we call ‘non-electoral period’). Differently from model (1),
the comparison of these two short and close groups of months makes us confident about the fact that
the difference in the number of crimes in these two time-periods is crucially affected by the
approaching of elections rather than to other illegal goals (Angrist and Pischke, 2008).
In this setting the control group is composed by areas which do not experience elections in the
same time period. Thus, the impact of elections on criminal violence can be estimated by computing a
double difference, one over time (in electoral and non-electoral months) and one across units (in
electoral and non- electoral areas). The crucial assumption is that in the absence of elections the trend
among the two groups would have been the same. In particular, we estimate the following model:
CRIMEp,t = α +δELECTIONp,t + λELECT _ PROVINCEp,t + PROVINCEp +TIMEt +ξ p,t (2)
where p is the province and t the time. The dependent variable is the number of arsons and bomb
attacks in a province in a certain month; the two main explanatories are two dummy variables:
ELECTION identifies electoral months in electoral provinces, while ELECT_PROVINCE identifies
electoral provinces. The estimated coefficient for represents the differential effect of elections on
crime in provinces where elections occur with respect to other provinces.
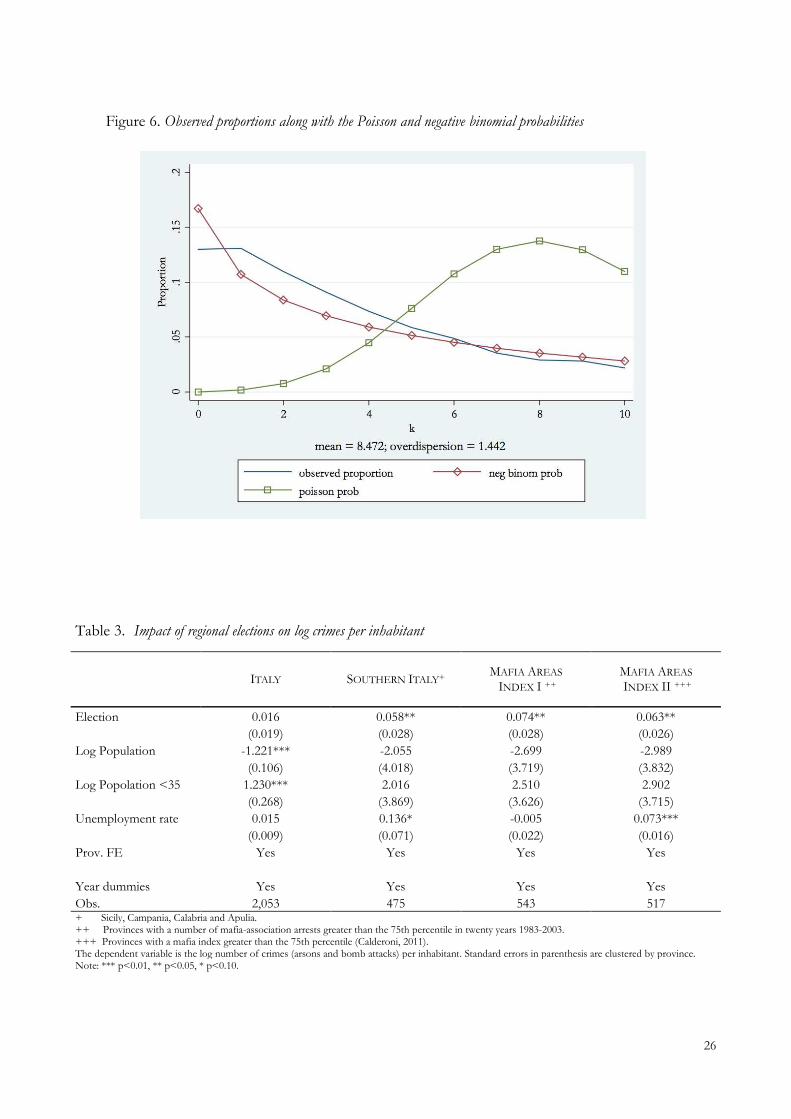
Given the characteristics of our dependent variable and the high frequency of our data, an OLS
strategy could be misleading. Thus, we estimate also some more proper models for count data. Many
count models that have been proposed by the literature (see Cameron and Trivedi, 1998 for a survey on
13
count models) are variants of the Poisson model. Noteworthy, the Poisson model has limited
applicability in practice because of its implication of equidispersion, that is, the variance of the
dependent variable should be equal to its mean both conditional on the explanatory variables. Among
the variants of the Poisson regression model, the negative binomial model turns out to be a widely used
one for its parsimony.10 Given the level of over-distribution we have in our data, the negative binomial
distribution should fit data better than Poisson model (figure 6).11
<< Figure 6 >>
In order to get a more sensible interpretation of our results, our tables show the estimated
incidence rate ratios (IRR), defined as the ratios of the expected number of crimes given that the
independent variable varies by one unit, over the expected number of crimes if this variation did not
occur. It is easy to show that for a one-unit variation in the dependent variable, the estimated incidence
rate vary by a factor of exp(COEFFICIENT). Thus, if the IRR attached to a covariate is higher (lower)
than one, a variation of that covariate will have a positive (negative) effect on the estimated number of
crimes.
Again, we estimate this model in a separate way for the all country, Southern provinces,
provinces with a high concentration of mafia-association arrests and provinces with a high mafia index.
5. Results
Table 3 presents the results of model (1) using a OLS estimator. We find that the occurrence of
elections has a positive and significant effect on the amount of crimes in provinces of Southern Italy. In
particular, the elections lead to an increase by 6 per cent in local crimes per inhabitant. This effect is
even higher if we define mafia areas according to the number of mafia arrests (here having elections
increases by almost 8 per cent the number of crimes; over 7 per cent). Conversely, both the
magnitude and the significance of the coefficient are much lower when we consider the all country.
These results shed light on the hypothesis that crimes in electoral periods are strictly related to
10 For other applications of negative binomial model, see, e.g., Hausman, Hall and Griliches (1984) on patents and R&D relationship, Cameron, Trivedi, Milne and Piggott (1988) on the determination of health service utilization and health insurance service, and Haab and McConnell (1996) on recreation demand analysis, among others. 11 In all our estimations we reject the hypothesis that the dispersion parameter α is equal to zero. Only when the parameter is zero the model reduces to the simpler Poisson model. As a matter of fact, since the significance of our estimated coefficients in a negative binomial setting may be partly driven by a problem of serial correlation in our data, we tested all our results using a both a Poisson model and a standard OLS model as a mere robustness check. Results are available upon request.
14
organized crime.
Table 4 shows the estimated results from the difference-in-difference strategy (model 2). We find that
having elections increases the number of crimes by 14 per cent in Italy. The all increase comes from
those areas that suffer the most pressures by organized crime: in Southern Italy during electoral months
the amount of violence increases by 25 per cent. In provinces with a high number of mafia-association
arrests the increase is by 37 per cent; in provinces with a high mafia index by 28 per cent. We find
support to the hypothesis that mafia groups increase their lobbying activities when elections are close.
6. Robustness and extensions
In this section we discuss robustness checks and some extensions of the empirical analysis. First
of all, a key assumption in the difference-in-difference approach: treated should be similar to controls
before the treatment. Thus, provinces with elections should be similar to other provinces during non-
electoral months. Since regional elections occur during spring months everywhere but a small number
of Italian regions (including Sicily), treated could be systematically different from controls because of
the different timing of elections. In section 6.1 we perform some standard falsification tests in order to
check whether results are not significant in non-electoral time; furthermore we verify whether the
electoral timing over the year affects our estimates. Then, in sections 6.2 and 6.3 we extend our analysis
to other possible definitions of electoral months and to municipal elections.
6.1 The timing of regional elections
To address concerns that the observed change in crime during electoral months is spurious, we
perform two standard falsification exercises using the same econometric design in other point of time.
First, we compare crimes in treated and control provinces 2 year after elections; then we compare them
4 months after elections. The latter case, in particular, can be seen as a proof of the so called ‘common
trend assumption’: shifting our period of analysis of 4 months we indirectly see whether our main
results are driven by the fact that during post-electoral months the number of crimes is lower in
electoral provinces then in other provinces. In both the exercises, both electoral and non-electoral
provinces are presumably unaffected by any elections and, thus, our main coefficient should not be
significantly different from zero (as shown in Table 5).
Furthermore, regional elections in Italy do not occur everywhere during the same months of the
year. In particular, table 1 shows that in Southern regions they usually take place in April-May, except
Sicily, where elections are in June. This difference in electoral timing may affect all our specifications.
15
To verify that the timing of elections over the year is not relevant, we use two different strategies.
The first one consists in estimating model (2) including interaction terms between the month of the
year and our main explanatory (the variable Elections). In so doing, we estimate the effect of election on
crime separately for every possible electoral timing. Then, we test the hypothesis that all the estimated
coefficients of the interaction variables are equal. We find no evidence of a differential impact of
elections over the year: for all our territorial definition the chi-square test statistics are very low and not
different from zero at any standard significance level.12
The second strategy consists in estimating a new difference-in-difference model:
tpmypmypmypmyp MONTHYEARPROVINCEPROVINCEELECTELECTIONCRIME ,,,,,,, *_ ξλδα +++++= (3)
where we include the interaction between province and year specific dummies, and month specific
dummies. Now we specifically control for every month-specific effect and the main estimated
coefficient represents the increase in monthly crime due to elections with respect to the province
average number of crimes during that year. Our main results (in Table 6) stay significant even using this
specification.
6.2 Different definitions of electoral and non-electoral periods The length of the electoral and non-electoral periods of time is selected in an arbitrary way. Our
choice is driven by the intent to capture the entire length of the electoral campaign and to have a non-
election period sufficiently close to the electoral one. In this section we modify the number of months
in both the electoral and non-electoral periods in order to show that estimated results in table 5 are not
crucially determined by our way to select observations.
Table 7 shows that results become lower when time periods are longer, consistently with the idea
that we are including ‘less relevant’ observations. When our electoral period is equal to 4 months, our
main coefficients are almost equal to zero.
6.3 The effects of municipal elections on crime
In this section we try to estimate model (2) using data on municipal elections for Italian capoluoghi.
Since now elections do not occur at the same time in all the provinces of the same region, treated and
controls may belong to the same regions. Thus, this choice takes out all possible interregional
12 Chi-square test statistics is 9.6 for the all country, with an estimated probability to be higher equal to 0.14. For Southern provinces these values are respectively equal to 1.9 and 0.60; for provinces with a high number of mafia-arrests 3.6 and 0.31; for provinces with a high mafia index 2.37 and 0.50.

16
differences among treated and controls, making our results more robust.
By the way, using municipal data has one relevant cons: we do not have data on the timing of
municipal elections. We solved this problem estimating the election timing on the basis of the date of
the first municipal council reunion13. To be sure to cover all the electoral period, we extend the
definition of ‘electoral month’ to the four months before the first council reunion and we exclude the
month of the first council reunion. Analogously, ‘non-electoral months’ are the four months after the
first reunion.
Consistently with the results in section 5, we find that in cities of Southern Italy crimes increase
in electoral months by 36 per cent. In cities with a high number of mafia-related arrests the increase is
17 per cent; for cities in provinces with a high mafia-index it is equal to 28 per cent (Table 8).
7. Disentangling the causal mechanism
7.1 Explaining variation in criminal-electoral violence
By demonstrating the existence of this link, we can finally consider this violence as a rational and
political act, though it is used by a criminal organization. However, as any rational action, these groups
find opportunities for and constraints on using violence within the institutional structure through
which they interact (Krain 1998). Existing related literature on political violence shows that
approaching elections do not unconditionally increase violent attacks from terrorist or ethnic groups,
other institutional variables can intervene: the permissiveness of electoral system (Aksoy, 2010); the
competitiveness of elections (Wilkinson, 2004); cost-benefit calculations depending on being
incumbent or challenger (Collier and Vicente, 2009)14. The likelihood to use intimidation depends on an
evaluation of likely payoff from relying on alternative non-violent resources (money, reputation,
membership) and the capacity to effectively influence candidates and voters (Collier and Vicente, 2009).
Violence is only one, and probably the most costly resource to be exploited in order to provide mafioso
“protection”, compared to not-coercive means which are equally strategic, such like reputation and
information (Gambetta, 1993). When non-violent means become useless, violence is the only available
tactic to influence elections. Therefore, here we focus on two variables that we think can explain
13 We use data of the Anagrafe degli Amministratori Locali, Minister of Interior. 14 In a recent study about elections in Nigeria, Collier and Vicente (2009) come to this result through a field experiment. They found that voter intimidation is effective in reducing voter turnout, and that violence was systematically dissociated from incumbents, contradicting Wilkinson’s results (2004). Interestingly, they established that incumbents have a comparative advantage in alternative strategies as vote buying and ballot fraud, because they control both the electoral process and state resources.

17
variation in the use of violence by criminal groups during elections: the competitiveness of elections
and law-enforcement.
Does electoral competition affect criminal-electoral violence? With reference to political structure, interests groups have been found to be less able to influence
politicians when the latter have strong majorities upon which they can rely (Barro 1973; Besley 2006;
Grossman and Helpman 1996). The ability to advance special interests, in other words, depends on the
relative strength of the political actors. Therefore, we expect that a more competitive political market
would lead to more violence because of the increasing demand for protection. Drawing on these
propositions, we formulate the following hypothesis:
HP2: More competitive are elections, and thus the gap between the first two parties is tight, more likely mafia groups will increase violence during elections.
We check whether electoral violence is lower (or higher) when elections are supposed to be more
competitive. In particular, we regress a measure of expected election competitiveness (the difference
between the share of the first and the second party in previous elections) on the number of crimes at
province level in electoral years. We include also a quadratic term for the expected level of competition,
in order to allow for the possibility that the relationship between the two variables is not linear.
logCRIMEp,y = σ +τ log DIFFp,y +νLogDIFF 2p,y + π logPOPp,y + Xp,y + PROVINCEp +TIMEy +υp,y . (4)
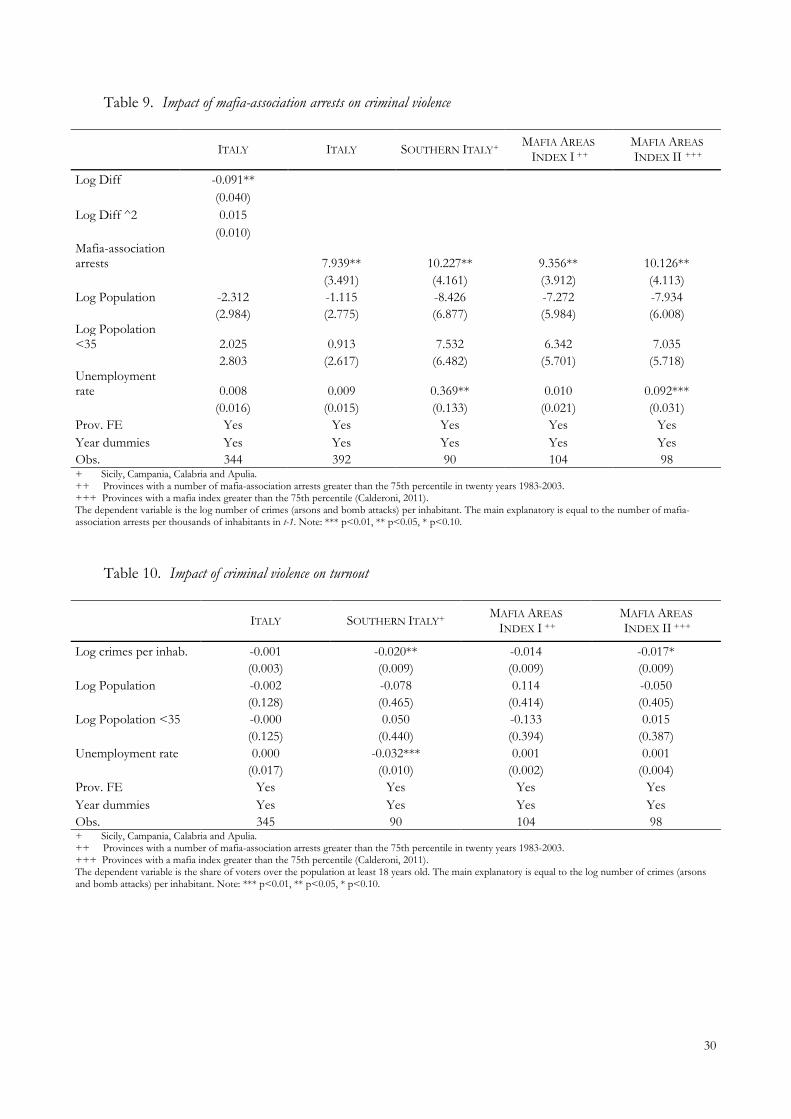
Table 9 shows the relation between electoral violence and elections’ uncertainty. The dependent
variable is the log of the annual number of crimes (arsons and bomb attacks) per inhabitant in electoral
years, defined as in model (1); the main explanatory is equal to the log difference between the vote
shares of the first coalition and the second party during elections. In order to overcome endogeneity
problems, we shift the explanatory variable back in time, using the information on electoral
competitiveness in the previous elections (t-1). Thus, the higher the explanatory, the lower the degree
of competition expected by voters as well as by criminal organizations. Some control variables were
also included. Despite the low number of observations, we find evidence of a negative relationship
between the two variables: the lower the gap between the two parties, the higher criminal violence. This
is consistent with the idea that intimidation may be more effective when the electoral results are more
uncertain.
Does policing explain variation in criminal violence?

18
Dealing with an illegal phenomenon, other exogenous shocks can affect the relation between
violence and elections. In their model, Smith and Varese (2001) predict that in the case of protection-
racket, policies that increase policing lead to a short-term increase in violence. Entrepreneurs do not
want to pay, and when threatened, they could think that the counterpart is a faker and not a real
mafioso, thus mafia members more likely need violence to re-establish their reputation. Applied to
political protection, we argue that, counter-intuitively, policies targeting mafiosi affect the opportunities
of mafia groups to use non-coercive resources to influence elections (campaign finance, political
mobilization of affiliates, information and reputation), leading to an increase in violence. Again, mafiosi
need violence to re-establish their reputation, this time, upon both favored and opposition candidates.
Therefore
HP3: More effective is policing against mafia groups, thus more mafiosi are arrested, more likely mafia groups will increase violence during elections.
We check whether effective policing affects criminal-electoral violence, using a similar
specification strategy of model (4), but changing explanatory variable. We regress a measure of policing
(the number of mafia members arrested in the year previous elections in province p) on the log of the
annual number of crimes (arsons and bomb attacks) per inhabitant in electoral years, defined as in
model (1). Again, in order to overcome endogeneity problems, we shift the explanatory variable back in
time, using the information on arrests in the year previous elections. The same control variables of
model (3) are also included. As Table 9 shows, we find evidence of a positive and significant
relationship between the two variables: more mafia members got arrested, the higher criminal violence
during elections. The relation does not lose significance even though we restrict our analysis for the
three subsets of provinces where it is likely that organized crime’s pressure is stronger. Despite the
lower number of observations, the effect gains magnitude, revealing that especially in mafia areas
policing directly affects the way mafias establish their reputation as protection’s provider.
7.2 Some evidence on the impact of electoral violence
The impact of these organizations and activities on democratic governance and economic
development can be dramatic. Along this lines, a series of recent studies show the negative impact of
organized crime on accountability and freedom (Allum & Siebert, 2003; Sberna 2012), representation
and political selection (Dal Bò&Di Tella, 2006), and electoral turnout (Sanchez&Chacon, 2005). On the
economic side, according to Pinotti (2011), organized crime is responsible for a 16% loss in GDP-per-
19
capita over a 30-year period in some areas of Southern Italy where these groups operate. This impact is
also explained by the capacity of mafia-like groups to divert public transfers. In Sicily, criminal groups
have been found to be able in diverting about 35% of the total amount of public transfers to the region
(Barone and Narciso, 2012). Therefore, the purpose of this section is to provide some evidence on the
relation between criminal-electoral violence and post-electoral behaviors of politicians and voters. In
particular, we focus on the correlation between pre-electoral intimidations and public spending after
elections, on one hand, and between pre-electoral intimidations and voter turnout, on the other one.
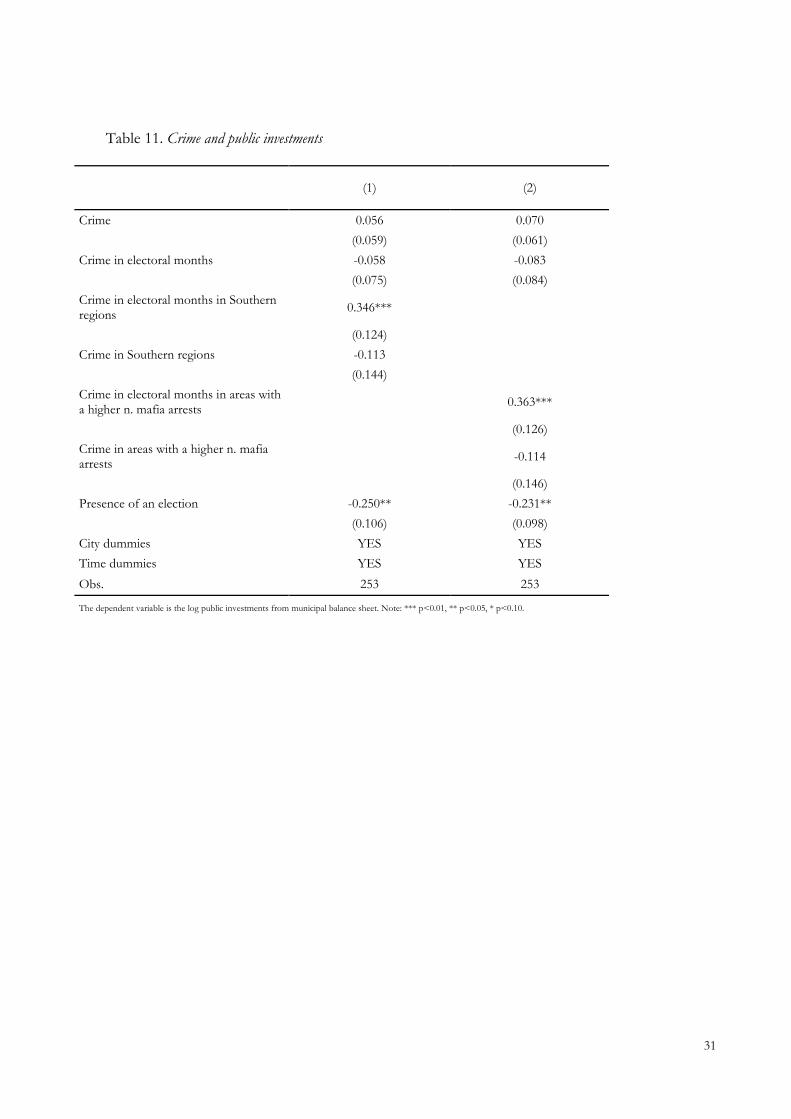
Rents-seeking and criminal violence: the impact on public spending
Criminal organizations use violence during elections for several reasons. To capture policy
decisions on public spending is certainly one of the most crucial motives leading mafias’ behavior.
Criminal groups are, in fact, engaged in rent-seeking like any other stakeholders in local political arena..
They have preferences on political rents created and allocated by policy makers, and they fiercely
compete against each other to impose control upon them. Drawing on these propositions, we
formulate the following hypothesis about the link between criminal-electoral violence and public
spending:
HP4: More violence criminal groups employ during elections, more likely local public spending will increase.
We control for this hypothesis, estimate a simple model, which reads as follows:
ycyctcycycycycyc YEARCITYElectSouthCElectCElectSouthCCdingPublicSpen ,,,,,,, ____ ξνθπλδα ++++++++= (5)
where the dependent variable measures the total amount of public spending in the municipality c in the
year y. Data come from municipal balance sheet. We used only “capital” transfers, commonly allocated
to fund investments. C represents the number of crimes during electoral months, as defined in section
3. Variables are in log terms. The main explanatory come from the interaction between the number of
crimes and some dummy variables: the presence of elections (ELECT_C), Southern regions (C_South)
and both of them (ELECT_C_South). Furthermore, we control for the presence of an election, city
fixed effects and year specific dummies. Thus, our estimated coefficient θ should reveal whether
electoral violence tends to affect the amount of money spent by local governments in places where
criminal associations operate differently from other regions and differently from non-electoral violence.
We find that there is not a significant change in investments depending on crimes in electoral years
everywhere but in Southern regions (Table 10). Here an increase by 1 per cent in crimes in electoral
months tends to increase investments by 0.3 per cent. We obtained similar results using areas with a
high number of mafia arrests instead of regions of Southern Italy.

20
Namely, the identification of the effects of electoral crimes on public spending may suffer from
reverse causality problems: investments may expand organized crime and thus increase the number of
mafia-related crimes. The gap in the timing of crimes (from February to May) and the balance approval
(April of the following year) may only alleviate this problem. By the way, we can say that only in those
areas where criminal organizations operate, electoral violence is correlated with local spending. This
finding is consistent with the evidence showing the interests of criminal organizations in the public
works sector and more generally in those sectors where higher political rents are distributed by political
makers (Barone and Narcidso, 2013).
Voters’ mobilization and criminal violence: the impact on electoral turnout The lack of victimization data does not allow us to conduct in-depth analyses of the impact of
criminal-electoral violence upon elections. On a theoretical point of view, criminal organizations can
target two different channels to affect elections: the demand side or the offer side of the political
market. In the first case, the attempt to change preferences of restive voters through intimidation is not
only the most costly strategy, but also the less effective because it might lead to unforeseeable
outcomes, such as the increase of antimafia opposition. However, although they do not target directly
voters, mafia groups can establish during the electoral campaign a climate of fear and threats, that
would raise the cost of political campaigns for politicians (avoiding them from standing as candidate
because of the risk), or would persuade voters of not going to the polls, as well. For instance, a criminal
group can decide to boycott elections, when the expected results do not favor their interests. In Italy,
there have several cases like this, especially when the group controls a small village. In the town of
Seminara, in Calabria, for example, in 2005 the local boss decided to confiscate some voters’ electoral
cards, giving them back few hours after polls closed (DPR. 29/12/2007). Therefore, we assess whether
electoral violence significantly affects voter turnout, testing the following hypothesis:
HP5: More violence criminal groups employ during elections, more likely voters will avoid going to the polls. To assess this link, we estimate a simple model, which reads as follows:
ypypypypyp YEARPROVINCEXCRIMETurnout ,,,, log ξλδα +++++= (6)
where the dependent variable measures the electoral turnout in the province p in the year y. CRIME
represents the log number of crimes in the electoral months of the same year y. We try to overcome
endogeneity problems, by shifting the explanatory variable back in time, using the information on
electoral violence in the months of electoral campaigns. Therefore, we address the retrospective
decisions of voters to go voting only after having experienced mafia violence in the previous months.
21
Furthermore, we also control for some socio-economic variables X, province fixed effects and year
specific dummies. Thus, our estimated coefficient δ should reveal whether electoral violence tends to
affect electoral turnout and the choice of voters to go to the ballot stations. As Table 11 shows, we
found that electoral turnout significantly decreases, as criminal-electoral violence is higher during the
campaign. This is true in Southern Italy, and, despite the low number of observations in mafia areas.
These findings are consistent with previous studies on electoral violence, which found a similar link
between electoral turnout and pre-electoral turbulence (Sancherz&Chacon, 2005; Acemoglu et al.
2009).
7. Conclusions
According to the estimation, elections cause a 25% increase in intimidation attacks in Southern
Italian provinces and a 37% in those provinces intensively controlled by organized crime. To the best
of our knowledge, this is the first estimate of the impact of elections on criminal violence accounting
for cross-areas and secular trends. These findings are consistent with a large case study literature
documenting the interventions of criminal organizations into the electoral process in Southern Italy.
We also found that uncertainty in both political and criminal markets (measured as electoral
competiveness and policing) are positively correlated with violence. Because of it, these findings
support, counter-intuitively, the idea that this type of violence is not associated with a stronger control
upon electorate of mafia groups, but, conversely, to a higher degree of opposition or electoral
accountability. The availability of victimization data would certainly help the interpretations of these
findings, giving an insight into the logic of criminal violence, which has been proved to be more politics-
oriented than expected in the previous studies.
22
Figure 1. Mafia-type homicides per 50.000 inhabitants (1983-2003) Source: SDI Min. Interno
Figure 2. People arrested for mafia-type association (c.p art. 416 bis) 1983-2003 per 50.000 inhabitants Source: SDI Min. Interno
23
Figure 3. Average crimes per million of inhabitants and social capital
Figure 4. Average crimes per million of inhabitants, age structure and education
Figure 5. Average crimes per million of inhabitants, unemployment rate and average value added per inhabitant

24
Table 1. Regional Elections in Southern Italy (1983-2003)
Region Province Regional Elections National Elections
SICILY
Agrigento
Caltanissetta Catania Enna
Messina Palermo Ragusa Siracusa Trapani
June 24, 2001 June 16, 1996 June 16, 1991 June 22, 1986
May 13, 2001 April 21, 1996
March 27, 1994 April 5, 1992 June 14, 1987 June 26, 1983
CALABRIA
Catanzaro Cosenza Crotone*
Reggio Calabria Vibo Valentia*
April 16, 2000 April 23, 1995 May 6, 1990 May 12, 1985
CAMPANIA
Avellino
Benevento Caserta Napoli Salerno
APULIA
Bari
Brindisi Foggia Lecce
Taranto
Source: Archivio Elettorale, Ministero dell’Interno.
25
Table 2. Number of Crimes in Italian Provinces
ITALY MEAN STD. DEV.
NON-ELECTORAL
MONTHS ELECTORAL
MONTHS
NON-ELECTORAL
MONTHS
ELECTORAL
MONTHS
ARSON ATTACKS 7.2 7.4 10.7 13.5 BOMB AND INCENDIARY
ATTACKS 1.3 1.3 3.7 3.8
ROBBERIES 80.4 79.5 144.6 143.1 HOMICIDES 0.7 0.6 1.4 1.5 OBS. 9,131 795 9,131 795
SOUTHERN ITALY+
MEAN STD. DEV.
NON-ELECTORAL
MONTHS
ELECTORAL
MONTHS
NON-ELECTORAL
MONTHS
ELECTORAL
MONTHS
ARSON ATTACKS 13.9 14.8 10.7 13.2 BOMB AND INCENDIARY
ATTACKS 3.8 4.0 3.7 6.2
ROBBERIES 93.9 99.5 144.6 162.2 HOMICIDES 1.5 1.6 1.4 2.4 OBS. 2,120 180 2,120 180
ORGANIZED CRIME PROVINCES++
MEAN STD. DEV.
NON-ELECTORAL
MONTHS
ELECTORAL
MONTHS
NON-ELECTORAL
MONTHS
ELECTORAL
MONTHS
ARSON ATTACKS 14.5 15.5 13.0 13.7 BOMB AND INCENDIARY
ATTACKS 3.5 3.7 6.2 6.1
ROBBERIES 155.7 162.2 246.7 248.4 HOMICIDES 1.7 1.7 2.1 2.5 OBS. 2,269 194 2,269 194
Crimes at province level per 1 million inhabitants. Source: SDI, Ministero dell'Interno. + Sicily, Campania, Calabria and Apulia. ++ Provinces with a number of mafia-association arrests greater than the 75th percentile.
26
Figure 6. Observed proportions along with the Poisson and negative binomial probabilities
Table 3. Impact of regional elections on log crimes per inhabitant
ITALY SOUTHERN ITALY+ MAFIA AREAS
INDEX I ++ MAFIA AREAS INDEX II +++
Election 0.016 0.058** 0.074** 0.063**
(0.019) (0.028) (0.028) (0.026)
Log Population -1.221*** -2.055 -2.699 -2.989
(0.106) (4.018) (3.719) (3.832)
Log Popolation <35 1.230*** 2.016 2.510 2.902
(0.268) (3.869) (3.626) (3.715)
Unemployment rate 0.015 0.136* -0.005 0.073***
(0.009) (0.071) (0.022) (0.016)
Prov. FE Yes Yes Yes Yes
Year dummies Yes Yes Yes Yes
Obs. 2,053 475 543 517 + Sicily, Campania, Calabria and Apulia. ++ Provinces with a number of mafia-association arrests greater than the 75th percentile in twenty years 1983-2003. +++ Provinces with a mafia index greater than the 75th percentile (Calderoni, 2011). The dependent variable is the log number of crimes (arsons and bomb attacks) per inhabitant. Standard errors in parenthesis are clustered by province. Note: *** p<0.01, ** p<0.05, * p<0.10.
27
Table 4. Impact of regional elections on crime: a diff-in-diff approach
ITALY SOUTHERN ITALY+
MAFIA AREAS INDEX I ++
MAFIA AREAS INDEX II +++
Elections 1.135** 1.251*** 1.365*** 1.279***
(0.070) (0.099) (0.111) (0.100)
Elect. Prov. 0.984 0.920 0.888** 0.911*
(0.043) (0.052) (0.051) (0.051)
Prov. FE Yes Yes Yes Yes
Time dummies Yes Yes Yes Yes
Obs. 9,131 2,120 2,269 2,306 + Sicily, Campania, Calabria and Apulia. ++ Provinces with a number of mafia-association arrests greater than the 75th percentile in twenty years 1983-2003.. +++ Provinces with a mafia index greater than the 75th percentile (Calderoni, 2011). The dependent variable is the log number of crimes (arsons and bomb attacks). Incidence-rate ratios. Standard errors in parenthesis are clustered by province. Note: *** p<0.01, ** p<0.05, * p<0.10.
Table 5. Impact of regional elections on crime: an alternative specification
SOUTHERN ITALY+ MAFIA AREAS
INDEX I++ MAFIA AREAS INDEX II +++
2 years after elections
Elections 1.103 1.118 1.126
(0.101) (0.102) (0.104)
Elect. Prov. 0.956 0.960 0.943
(0.060) (0.060) (0.059)
Prov. FE YES YES YES Time dummies YES YES YES Obs. 1,848 1,896 2,010
4 months after elections Elections 0.855* 0.936 0.866
(0.077) (0.087) (0.077)
Elect. Prov. 1.103 1.056 1.101
(0.067) (0.068) (0.067)
Prov. FE YES YES YES Time dummies YES YES YES Obs. 1,868 1,754 2,032 + Sicily, Campania, Calabria and Apulia. ++ Provinces with a number of mafia-association arrests greater than the 75th percentile in twenty years 1983-2003. +++ Provinces with a mafia index greater than the 75th percentile (Calderoni, 2011). The dependent variable is the log number of crimes (arsons and bomb attacks). Incidence-rate ratios. Standard errors in parenthesis are clustered by province. Note: *** p<0.01, ** p<0.05, * p<0.10.
28
Table 6. Impact of regional elections on crime: an alternative specification
ITALY SOUTHERN ITALY+
MAFIA AREAS INDEX I ++
MAFIA AREAS INDEX II +++
Elections 1.102*** 1.113** 1.177*** 1.129***
(0.040) (0.051) (0.055) (0.051)
Elect. Prov. 1.203*** 1.191** 1.128 1.185**
(0.077) (0.098) (0.097) (0.097)
Prov. * Year dummies YES YES YES YES
Month dummies YES YES YES YES
Obs. 9,131 2,120 2,269 2,306 + Sicily, Campania, Calabria and Apulia. ++ Provinces with a number of mafia-association arrests greater than the 75th percentile in twenty years 1983-2003. +++ Provinces with a mafia index greater than the 75th percentile (Calderoni, 2011). The dependent variable is the log number of crimes (arsons and bomb attacks). Incidence-rate ratios. Standard errors in parenthesis are clustered by province. Note: *** p<0.01, ** p<0.05, * p<0.10.
Table 7. Alternative definitions of electoral and non-electoral periods
ITALY SOUTHERN ITALY+
MAFIA AREAS INDEX I ++
MAFIA AREAS INDEX II +++
1 MONTH 1.141* (0.091)
1.248** (0.136)
1.272* (0.168)
1.297** (0.140)
2 MONTHS 1.135** (0.070)
1.251*** (0.099)
1.365*** (0.111)
1.279*** (0.100)
3 MONTHS 1.062
(0.055) 1.220*** (0.081)
1.221*** (0.078)
1.234*** (0.081)
4 MONTHS 1.001
(0.045) 1.099
(0.064) 1.105* (0.062)
1.115* (0.064)
+ Sicily, Campania, Calabria and Apulia. ++ Provinces with a number of mafia-association arrests greater than the 75th percentile in twenty years 1983-2003. +++ Provinces with a mafia index greater than the 75th percentile (Calderoni, 2011). The dependent variable is the log number of crimes (arsons and bomb attacks). Incidence-rate ratios of the interaction term. Standard errors in parenthesis are clustered by province. Note: *** p<0.01, ** p<0.05, * p<0.10.
Table 8. Impact of municipal elections on crime
ITALY SOUTHERN ITALY+
MAFIA AREAS INDEX I ++
MAFIA AREAS INDEX II +++
Elections 1.080 1.363*** 1.165 1.281**
(0.066) (0.159) (0.126) (0.140)
Elect. Prov. 0.897** 0.716 0.803** 0.756***
(0.050) (0.078) (0.081) (0.077)
City dummies YES YES YES YES
Time dummies YES YES YES YES
Obs. 20,583 4,780 5,198 5,198 + Sicily, Campania, Calabria and Apulia. ++ Cities with a number of mafia-association arrests greater than the 75th percentile in twenty years 1983-2003. +++ Cities in provinces with a mafia index greater than the 75th percentile (Calderoni, 2011). The dependent variable is the log number of crimes (arsons and bomb attacks). Incidence-rate ratios. Standard errors in parenthesis are clustered by province. Note: *** p<0.01, ** p<0.05, * p<0.10.
29
Figure 7. Elections and crime in non-electoral and electoral provinces
Figure 8. Electoral competition and crime
30
Table 9. Impact of mafia-association arrests on criminal violence
ITALY ITALY SOUTHERN ITALY+
MAFIA AREAS INDEX I ++
MAFIA AREAS INDEX II +++
Log Diff -0.091**
(0.040)
Log Diff ^2 0.015
(0.010) Mafia-association arrests 7.939** 10.227** 9.356** 10.126**
(3.491) (4.161) (3.912) (4.113)
Log Population -2.312 -1.115 -8.426 -7.272 -7.934
(2.984) (2.775) (6.877) (5.984) (6.008) Log Popolation <35 2.025 0.913 7.532 6.342 7.035
2.803 (2.617) (6.482) (5.701) (5.718) Unemployment rate 0.008 0.009 0.369** 0.010 0.092***
(0.016) (0.015) (0.133) (0.021) (0.031)
Prov. FE Yes Yes Yes Yes Yes
Year dummies Yes Yes Yes Yes Yes
Obs. 344 392 90 104 98 + Sicily, Campania, Calabria and Apulia. ++ Provinces with a number of mafia-association arrests greater than the 75th percentile in twenty years 1983-2003. +++ Provinces with a mafia index greater than the 75th percentile (Calderoni, 2011). The dependent variable is the log number of crimes (arsons and bomb attacks) per inhabitant. The main explanatory is equal to the number of mafia-association arrests per thousands of inhabitants in t-1. Note: *** p<0.01, ** p<0.05, * p<0.10.
Table 10. Impact of criminal violence on turnout
ITALY SOUTHERN ITALY+
MAFIA AREAS INDEX I ++
MAFIA AREAS INDEX II +++
Log crimes per inhab. -0.001 -0.020** -0.014 -0.017*
(0.003) (0.009) (0.009) (0.009)
Log Population -0.002 -0.078 0.114 -0.050
(0.128) (0.465) (0.414) (0.405)
Log Popolation <35 -0.000 0.050 -0.133 0.015
(0.125) (0.440) (0.394) (0.387)
Unemployment rate 0.000 -0.032*** 0.001 0.001
(0.017) (0.010) (0.002) (0.004)
Prov. FE Yes Yes Yes Yes
Year dummies Yes Yes Yes Yes
Obs. 345 90 104 98 + Sicily, Campania, Calabria and Apulia. ++ Provinces with a number of mafia-association arrests greater than the 75th percentile in twenty years 1983-2003. +++ Provinces with a mafia index greater than the 75th percentile (Calderoni, 2011). The dependent variable is the share of voters over the population at least 18 years old. The main explanatory is equal to the log number of crimes (arsons and bomb attacks) per inhabitant. Note: *** p<0.01, ** p<0.05, * p<0.10.
31
Table 11. Crime and public investments
(1) (2)
Crime 0.056 0.070
(0.059) (0.061)
Crime in electoral months -0.058 -0.083
(0.075) (0.084)
Crime in electoral months in Southern regions
0.346***
(0.124)
Crime in Southern regions -0.113
(0.144)
Crime in electoral months in areas with a higher n. mafia arrests
0.363***
(0.126)
Crime in areas with a higher n. mafia arrests
-0.114
(0.146)
Presence of an election -0.250** -0.231**
(0.106) (0.098)
City dummies YES YES
Time dummies YES YES
Obs. 253 253
The dependent variable is the log public investments from municipal balance sheet. Note: *** p<0.01, ** p<0.05, * p<0.10.
32
References
Acemoglu D., Robinson J. and Santos, R. [2009], The Monopoly of Violence: Evidence from Colombia, in «MIT Department of Economics Working», Paper No. 09-30
Angrist J., Pischke J.S. [2008], Mostly Harmless Econometrics, Princeton University Press, NJ
Aksoy D. [2010], Elections and the Timing of Terrorist Attacks in Democracies, mimeo.
Allum, F. and Siebert, R. [2003], Organized crime. A threat to democracy?, in F. Allum and R. Siebert, (eds), 'Organized Crime and the Challenge to Democracy', Routledge, New York, pp. 1-23.
Armao, F. [2003], Why is organized crime so successful?, in F. Allum and R. Siebert, (eds),'Organized Crime and the Challenge to Democracy', Routledge, New York, pp. 27-38.
Asmundo A. & Lisciandra M. [2008], The cost of protection racket in Sicily, in «Global Crime», vol. 9, n. 3, pp. 221-240.
Bandiera, O. [2003]. Land reform, the market for protection, and the origins of the Sicilian mafia: Theory and evidence, in «Journal of Law, Economics and Organization», vol. 19, n. 1, pp. 218-244.
Bailey J. and Godson R., [2000], eds., Organized Crime and Democratic Governability: Mexico and the U.S. -
Mexico Borderlands, University of Pittsburg Press, Pittsburg. Barone G. & Narciso G. [2013], The effect of mafia on public transfers, mimeo
Bertrand M., Duflo E. and Mullainathan S. [2004], How Much Should We Trust Differences-in-Differences Estimates?, in «The Quarterly Journal of Economics», 2004, vol. 119, n. 1, pp. 249-275.
Calderoni, F. [2011], Where is the mafia in Italy? Measuring the presence of the mafia across Italian provinces, in «Global Crime», vol. 12, n. 1, pp. 41-69.
Collier, P. and Vicente, P. [2009], Votes and Violence: Evidence from a Field Experiment in Nigeria, in «Discussion paper», Oxford University
Dal Bò, E., P. Dal Bò, and R. Di Tella [2006]. Plata o plomo: Bribe and punishment in a theory of political
influence, in «American Political Science Review», vol. 100, n. 1, pp. 41-53.
Daniele, V. & Marani, U., [2011]. Organized crime, the quality of local institutions and FDI in Italy: A panel data analysis,in «European Journal of Political Economy», vol. 27, n. 1, pp. 132-142
Della Porta, D. e Vannucci, A. [1999], Corrupt Exchanges: Actors, Resources and Mechanisms of Political
Corruption, Aldine De Gruyter, New York. Fajnzylber, P., D. Lederman, & N. Loayza [2002], What causes violent crime?, in «European Economic Review»,
vol. 46, n. 7, pp. 1323-1357. Gambetta, D. [1993], The Sicilian Mafia. The Business of Private Protection, Harvard University Press,
Cambridge: MA.
33
Gambetta, D. and Reuter, P. [1995], Conspiracy Among the Many: The Mafia in Legitimate Industries, in Fiorentini and Peltzam, The Economics of Organised Crime, Cambridge: Cambridge University Press, pp. 116-139.
Golden, M. and Chang, E. [2001], Competitive Corruption: Factional Conflict and Political Malfeasance in
Postwar Italian Christian Democracy, in «World Politics» vol. 53, n. 4, pp. 588–622. Golden, M. and Picci, L. [2006], Corruption and the Management of Public Works in Italy, in Susan Rose-
Ackerman, ed., The Handbook of Economic Corruption, Cheltenham, Edward Elgar. Golden, M. and Tiwari, D. [2009], Legislative Corruption in Contemporary India, Paper presented at the
annual meeting of the American Political Science Association, Toronto. Grossman, G and Helpman, E. [2001], Special Interest Politics, MIT Press, Cambridge Harasymiw, B. [2003], Putting organized crime in its place . . . within political science, Paper presented at the
Canadian Political Science Association, Dalhousie University, Halifax, Nova Scotia, 1 June 2003. King, G. [1988] Statistical models for political science event counts: Bias in conventional procedures and evidence for the
exponential Poisson regression model, in «American Journal of Political Science», vol. 32, n. 39, pp. 838-863 Kitschelt, H. [2000], Linkages between citizens and politicians in democratic polities, in «Comparative Political
Studies», vol. 33, n. 6/7, pp. 845-879 Krain, M. [1998], Contemporary Democracies Revisited. Democracy, Political Violence, and Event
Count Models, in «Comparative Political Studies», vol.31, n. 2, pp. 139-164 Lavezzi, A. [2008], Economic structure and vulnerability to organised crime: Evidence from Sicily, in «Global Crime»,
vol. 9, n. 3, pp. 198-220 Lupo, S. [1996], Storia della mafia dalle origini ai giorni nostri, Donzelli, Roma. Leonardi R. and Wertman, D. [1989], Italian Christian Democracy: The Politics of Dominance, Macmillan,
London Paoli, L. [1997], The Political Criminal Nexus in Italy, in «Trends in Organized Crime», vol. 3, n. 1, pp. 49-56 Rios, V. [2011], Why are Mexican mayors getting killed by traffickers? Corruption Dynamics in Mexico, [mimeo] Sanchez, F. and Chacon, M. [2005], Conflict, State and Decentralisation: from social progress to an armed dispute
for local control, 1974-2002, in «Crisis States Research Center Working», vol. 1, n. 70 Sberna, S. [2011], Criminal-Political Capture and Local Government In Italy. The impact of institutional reforms,
mimeo Sciarrone, R. [1998], Mafie vecchie, mafie nuove. Radicamento ed espansione, Roma, Donzelli. Schelling, T.C. [1984], Choice and Consequence, Harvard University Press, Cambridge: MA;
[1967], Economic Analysis and Organized Crime, in «The President’s Commission on Law Enforcement and the Administration of Justice», (eds), 'Task Force Report: Organized Crime', U.S. Government Printing Office, Washington, pp. 114–126

34
Skaperdas, S. (2001). The political economy of organized crime: providing protection when the state does not. Economics of Governance 2 (3), 173{202.
Tilly, Charles. [1985]. “War Making and State Making as Organized Crime”. in Bringing the state back in,
ed. Peter B. Evans, Dietrich Rueschemeyer, and Theda Skocpol. Cambridge: Cambridge University Press.
Varese, Federico. [2005]. The Russian Mafia: Private Protection in a New Market Economy., Oxford: Oxford
University Press. Villareal, A. [ 2002], Political Competition and Violence in Mexico: Hierarchical Social Control in Local Patronage Structures, in «American Sociological Review», vol. 67, n. 4, pp. 477-498
Wilkinson, Steven I. [2006]. Votes and Violence: Electoral Competition and Ethnic Riots in India. Cambridge, MA/New York, NY: Cambridge University Press.