s michigan state budget office david p. massaron l
TRANSCRIPT

111 S. CAPITOL • P.O. BOX 30026 • LANSING, MICHIGAN 48909
.www.michigan.gov • (517) 335-3420
January 29, 2021
The Honorable Jim Stamas, Chair The Honorable Thomas Albert, Chair
Senate Appropriations Committee House Appropriations Committee
Michigan State Senate Michigan House of Representatives
State Capitol State Capitol
Lansing, Michigan 48909 Lansing, Michigan 48909
Dear Legislators:
Attached is the monthly financial report for the month ending December 31, 2020. This
report is submitted pursuant to MCL 18.1386. This report can also be found on the
Internet at the following address:
www.michigan.gov/budget under “Spending and Revenue Reports”.
If you have questions concerning the information in this report, please contact this office.
Sincerely,
David P. Massaron
State Budget Director
Attachment
cc: Mike Shirkey, Senate Maj. Leader Jim Runestad, Chair, Senate Finance Com.
Jim Ananich, Senate Min. Leader Matt Hall, Chair, House Tax Policy Com.
Jason Wentworth, Speaker of the House JoAnne Huls, Executive Office
Donna Lasinski, House Min. Leader Tricia Foster, Executive Office
Senate Appropriations Committee Jen Flood, Executive Office
House Appropriations Committee Bethany Wicksall, Acting Deputy State Budget Dir.
Senate Fiscal Agency Heather Boyd, Office of Financial Mgmt.
House Fiscal Agency Internal State Budget Office Distribution
STATE OF MICHIGAN
GRETCHEN WHITMER STATE BUDGET OFFICE DAVID P. MASSARON
GOVERNOR LANSING DIRECTOR

FISCAL2021
Beginning Balance 2,042.8$ 1
RevenuesOngoing:
August 2020 Consensus Forecast 9,536.7$ Shift Venture MI Fund II to Voucher Purchase 75.0$ Public Act 126 of 2020 (15.0)$ Local Government Program Payments (490.1)$
Subtotal Ongoing Revenue 9,106.6$ One-Time:
Miscellaneous Adjustments 11.2$
Subtotal One-Time Revenue 11.2$
Total Revenue 9,117.8$
ExpendituresOngoing:
Public Acts 165 and 166 of 2020 10,316.9$ Subtotal Ongoing Expenditures 10,316.9$
One-Time:Public Acts 165 and 166 of 2020 285.3$ Public Act 257 of 2020 243.3$ Reserve for Disallowance 62.8$ Transfer to BSF 35.0$
Subtotal One-Time Expenditures 626.4$
Total Expenditures 10,943.3$
Ending Balance 217.3$
GENERAL FUND, GENERAL PURPOSEFiscal Year 2021
Projected Revenues and ExpendituresDecember 31, 2020
($ in millions)
1 This report does not reflect final revenue and expenditure data for the fiscal year ending September 30, 2020. Final year-end activity will be reflected in the fiscal year 2020 Comprehensive Annual Financial Report. The beginning balance includes $435.5 million in estimated lapses. Subsequent to the period covered by this report, the January 15th Consensus Revenue Estimating Conference increased projected fiscal year 2020 revenue $474.0 million, resulting in estimated fiscal year 2021 beginning balance of more than $2.5 billion.
- 1 -

FISCAL2021
Beginning Balance 900.7$
RevenuesOngoing:
August 2020 Consensus Forecast 13,501.9$ General Fund 40.0$ Community District Trust Fund 77.7$ Federal Revenue 1,806.9$
Subtotal Ongoing Revenue 15,426.5$ One-Time:
General Fund 11.0$ Subtotal One-Time Revenue 11.0$
Total Revenue 15,437.5$
ExpendituresOngoing:
School Aid - PA 165 of 2020 15,340.1$ Community Colleges - PA 165 of 2020 425.7$ Universities - PA 165 of 2020 356.1$
Subtotal Ongoing Expenditures 16,121.9$ One-Time:
School Aid - PA 165 of 2020 185.0$ Subtotal One-Time Expenditures 185.0$
Total Expenditures 16,306.9$
Ending Balance 31.3$
SCHOOL AID FUNDFiscal Year 2021
Projected Revenues and ExpendituresDecember 31, 2020
($ in millions)
1 This report does not reflect final revenue and expenditure data for the fiscal year ending September 30, 2020. Final year-end activity will be reflected in the fiscal year 2020 Comprehensive Annual Financial Report. The beginning balance includes $31.4 million in estimated lapses. Subsequent to the period covered by this report, the January 15th Consensus Revenue Estimating Conference increased projected fiscal year 2020 revenue $282.0 million, resulting in estimated fiscal year 2021 beginning balance of nearly $1.2 billion.
- 2 -
1

Expenditures & Encumbrances
Year to DateFY 2020
Fiscal YearEnd
SEP 30, 2020Department
InitialAppropriations (1)
ExecutiveOrders &
SupplementalAppropriations (1)
Encumbrance,Work Project &Capital Outlay
Carry Forwards (2)
TotalAuthorization
Expenditures &Encumbrances
Year to DateFY 2021
47.8 110.5 Agriculture and Rural Development 121.3 5.2 23.8 150.3 41.4
22.9 93.1 Attorney General 105.3 2.1 20.0 127.4 22.2
153.7 389.4 Capital Outlay (3) 332.4 0.0 674.8 1,007.2 96.8
3.4 14.0 Civil Rights 18.0 1.5 1.9 21.4 3.2
393.6 1,435.8 Colleges and Universities 1,343.9 0.0 13.5 1,357.4 387.1
677.8 2,017.3 Corrections 2,050.7 2.5 251.0 2,304.1 659.6
88.4 1,131.4 Education 516.7 7.2 156.2 680.0 176.2
98.3 502.2 Environment, Great Lakes, and Energy 480.9 3.0 658.5 1,142.4 90.5
4.2 7.4 Executive Office 7.1 0.0 0.9 8.1 3.8
6,159.5 26,633.3 Health and Human Services 28,453.2 47.0 1,171.9 29,672.1 7,210.2
13.4 53.9 Insurance and Financial Service 73.3 1.5 0.0 74.8 13.0
52.3 271.3 Judiciary 313.6 0.4 4.9 319.0 49.6
129.5 444.8 Labor and Economic Opportunity 745.2 22.5 45.8 813.5 153.7
6.4 24.2 Legislative Auditor General 26.7 0.0 3.5 30.2 6.2
42.9 154.3 Legislature 172.4 0.0 93.7 266.1 41.2
97.0 333.4 Licensing and Regulatory Affairs 452.6 58.5 39.8 551.0 177.6
0.0 0.1 Marshall Plan for Talent 0.0 0.0 30.3 30.3 0.0
14.9 86.7 Michigan Strategic Fund 120.3 0.0 0.0 120.3 23.2
0.0 0.0 Michigan Veterans' Facility Authority 41.3 0.0 0.0 41.3 22.9
70.8 171.9 Military and Veterans Affairs 102.4 10.1 12.5 125.0 50.6
52.8 132.7 Natural Resources 136.5 5.0 58.2 199.7 44.3
62.2 252.4 State 254.3 12.1 73.4 339.8 59.1
0.0 0.0 State Land Bank Authority 0.0 0.0 0.0 0.0 0.0
165.7 880.6 State Police 737.2 32.9 81.1 851.2 151.2
111.5 1,198.2 Technology, Management and Budget (4) 495.0 6.1 245.4 746.5 186.0
2.7 6.2 Transportation 0.0 47.0 29.5 76.5 0.0
764.4 3,721.6 Treasury 2,080.6 78.9 201.6 2,361.2 795.5
$9,236.3 $40,066.8 $39,180.9 $343.4 $3,892.3 $43,416.6 $10,465.1
(1) Includes boilerplate appropriations.(2) Carryforward amounts do not include authorization related to amounts appropriated for fiscal year 2020. Entry of these amounts is expected in January 2021.(3) Includes all capital outlay activity regardless of agency.(4) Includes Civil Service Commission.
SUMMARY OF EXPENDITURES AND ENCUMBRANCESGENERAL FUND - ALL PURPOSE
December 31, 2020($ in millions)
Fiscal Year 2020 Fiscal Year 2021
- 3 -

ESTIMATED BALANCE OF STATE PAYMENTSTO LOCAL UNITS OF GOVERNMENT
Fiscal Year 2021
($ in millions)
EXEC. ORDER TOTALINITIAL and APPROPRIATIONS
APPROPRIATIONS SUPPLEMENTALS YEAR-TO-DATE
Payments to local units of government 19,907.4 0.0 19,907.4
Total state spending from state resources 35,359.1 243.3 35,602.4
Percentage of state spending from state resources paid to local units 56.30% 0.00% 55.92%
Required payments to local units (48.97%) 17,315.4 119.1 17,434.5
Surplus/(deficit) $2,592.0 ($119.1) $2,472.9
December 31, 2020
- 4 -

STATE OF MICHIGANYEAR-TO-DATE BALANCE SHEET
COUNTER - CYCLICAL BUDGET AND ECONOMIC STABILIZATION FUNDDecember 31, 2020
($ in thousands)
ASSETS
Current Assets:Equity in common cash $ 829,101
Total Assets $ 829,101
LIABILITIES
Current Liabilities:
Total Current Liabilities $ -
Total Liabilities -
FUND BALANCES
Committed 829,101
Total Fund Balances 829,101
Total Liabilities and Fund Balances $ 829,101
- 5 -

STATE OF MICHIGANYEAR-TO-DATE STATEMENT OF REVENUES AND EXPENDITURES
COUNTER - CYCLICAL BUDGET AND ECONOMIC STABILIZATION FUNDOctober 1, 2020 through December 31, 2020
($ in thousands)
REVENUES
Miscellaneous $ -
Total Revenues -
EXPENDITURES
Current:General government -
Total Expenditures -
Excess of Revenues over (under)Expenditures -
OTHER FINANCING SOURCES (USES)
Transfers from other funds - Transfers to other funds -
Total Other Financing Sources (Uses) -
Excess of Revenues and Other Sourcesover (under) Expenditures andOther Uses $ - 1
1 Balance does not reflect closing adjustments such as accounts receivable,accounts payable, etc.
- 6 -

ASSETS
Current Assets:Equity in common cash $ 85,856 Investments - Other current assets -
Total Current Assets 85,856
Noncurrent Assets:Investments 679,345
Total Assets $ 765,201
LIABILITIES
Current Liabilities:Accounts payable and other liabilities $ 10,238 Amounts due to other funds -
Total Current Liabilities 10,238
Total Liabilities 10,238
FUND BALANCES
Nonspendable 500,000 Restricted 254,963
Total Fund Balances 754,963
Total Liabilities and Fund Balances $ 765,201
December 31, 2020($ in thousands)
STATE OF MICHIGANYEAR-TO-DATE BALANCE SHEET
MICHIGAN NATURAL RESOURCES TRUST FUND
- 7 -

STATE OF MICHIGANYEAR-TO-DATE STATEMENT OF REVENUES AND EXPENDITURES
MICHIGAN NATURAL RESOURCES TRUST FUNDOctober 1, 2020 through December 31, 2020
($ in thousands)
REVENUES
Taxes $ - From federal agencies - From licenses and permits - Miscellaneous 15,652
Total Revenues 15,653
EXPENDITURES
Current:General government 1 Conservation, environment,
recreation, and agriculture 3,686 Capital outlay 387
Total Expenditures 4,074
Excess of Revenues over (under)Expenditures 11,578
OTHER FINANCING SOURCES (USES)
Proceeds from bond issues - Proceeds from sale of capital assets - Transfers from other funds - Transfers to other funds -
Total Other Financing Sources (Uses) -
Excess of Revenues and Other Sourcesover (under) Expenditures andOther Uses $ 11,578 1
1 Balance does not reflect closing adjustments such as accounts receivable,accounts payable, etc.
- 8 -
- 9 -
REVENUE OVERVIEW Office of Revenue and Tax Analysis Michigan Department of Treasury
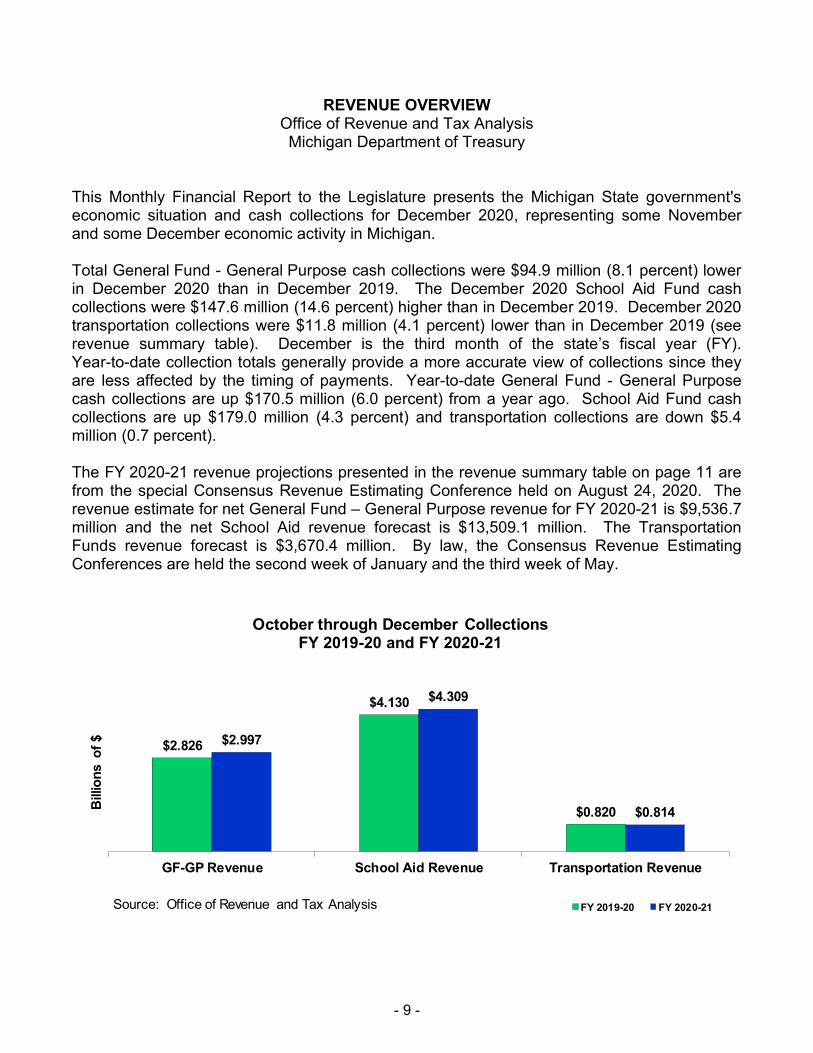
This Monthly Financial Report to the Legislature presents the Michigan State government's economic situation and cash collections for December 2020, representing some November and some December economic activity in Michigan.
Total General Fund - General Purpose cash collections were $94.9 million (8.1 percent) lower in December 2020 than in December 2019. The December 2020 School Aid Fund cash collections were $147.6 million (14.6 percent) higher than in December 2019. December 2020 transportation collections were $11.8 million (4.1 percent) lower than in December 2019 (see revenue summary table). December is the third month of the state’s fiscal year (FY). Year-to-date collection totals generally provide a more accurate view of collections since they are less affected by the timing of payments. Year-to-date General Fund - General Purpose cash collections are up $170.5 million (6.0 percent) from a year ago. School Aid Fund cash collections are up $179.0 million (4.3 percent) and transportation collections are down $5.4 million (0.7 percent).
The FY 2020-21 revenue projections presented in the revenue summary table on page 11 are from the special Consensus Revenue Estimating Conference held on August 24, 2020. The revenue estimate for net General Fund – General Purpose revenue for FY 2020-21 is $9,536.7 million and the net School Aid revenue forecast is $13,509.1 million. The Transportation Funds revenue forecast is $3,670.4 million. By law, the Consensus Revenue Estimating Conferences are held the second week of January and the third week of May.
$2.826
$4.130
$0.820
$2.997
$4.309
$0.814
GF-GP Revenue School Aid Revenue Transportation Revenue
Bill
ion
s o
f $
Source: Office of Revenue and Tax Analysis
October through December CollectionsFY 2019-20 and FY 2020-21
FY 2019-20 FY 2020-21

- 10 -
$162
$976
$729
$399
$94
$959
$775
$368
SBT/MBT/CIT Income Withholding Sales Lottery Sales
Mill
ion
s o
f $
Source: Office of Revenue and Tax Analysis
December Revenue CollectionsFY 2019-20 and FY 2020-21
FY 2019-20 FY 2020-21
$0.230
$2.613
$2.137
$0.968
$0.214
$2.690
$2.152
$1.149
SBT/MBT/CIT Income Withholding Sales Lottery Sales
Bill
ion
s o
f $
Source: Office of Revenue and Tax Analysis
October through December CollectionsFY 2019-20 and FY 2020-21
FY 2019-20 FY 2020-21

Revenue Summary FY 2020-21General Fund-General Purpose, School Aid, and Transportation Funds
(in thousands)
For The Month Ended: December 31, 2020
Month-End Cash Collections Data October Through December Cash Collections Data Revenue Projections
December Difference Year-to-Date Difference FY 2019-20 FY 2020-21 FY 2020-21August 2020 Statutory August 2020
2019 2020 Amount Percent Source of Revenue FY 2019-20 FY 2020-21 Amount Percent Forecast Estimate ForecastIncome Taxes
$976,327 $958,788 ($17,538) -1.8% Withholding $2,613,457 $2,690,109 $76,652 2.9% $10,404,000 $9,971,300 $9,971,30066,818 77,309 10,491 15.7% Quarterlies 112,477 130,180 17,703 15.7% 1,099,400 1,019,500 1,019,50017,924 14,017 (3,907) -21.8% Annuals 100,320 112,293 11,973 11.9% 1,275,200 1,147,600 1,147,600
$1,061,069 $1,050,115 ($10,954) -1.0% Gross Collections $2,826,254 $2,932,582 $106,328 3.8% $12,778,600 $12,138,400 $12,138,40026,944 25,084 (1,859) -6.9% Less: Refunds 136,385 126,742 (9,643) -7.1% 2,361,300 2,366,900 2,366,900
0 0 0 na State Campaign Fund 0 0 0 na 800 800 800$1,034,125 $1,025,030 ($9,094) -0.9% Net Personal Income $2,689,869 $2,805,840 $115,972 4.3% $10,416,500 $9,770,700 $9,770,700
39,000 50,000 11,000 28.2% Less: Disbursements to MTF 117,000 150,000 33,000 28.2% 468,000 600,000 600,0005,750 5,750 0 0.0% Less: Disbursements to Renew Michigan 17,250 17,250 0 0.0% 69,000 69,000 69,000
247,006 244,467 (2,538) -1.0% Less: Disbursements to SAF 657,929 682,706 24,777 3.8% 3,042,700 2,889,900 2,889,900$742,369 $724,813 ($17,556) -2.4% Net Personal Income To GF-GP $1,897,690 $1,955,884 $58,194 3.1% $6,836,800 $6,211,800 $6,211,800
Consumption Taxes$118,005 $124,971 $6,966 5.9% Sales (a) $346,173 $358,647 $12,473 3.6% $1,280,000 $1,250,200 $1,250,200
94,616 79,543 (15,073) -15.9% Use (a) (h) 107,157 212,435 105,278 98.2% 697,000 654,500 654,50013,696 14,035 339 2.5% Tobacco 43,844 45,198 1,354 3.1% 174,500 167,800 167,8003,969 1,017 (2,952) -74.4% Beer, Wine & Mixed Spirits 12,413 13,543 1,130 9.1% 48,000 50,500 50,5004,862 6,241 1,378 28.3% Liquor Specific 9,858 13,487 3,629 36.8% 56,000 57,500 57,500
$235,148 $225,806 ($9,342) -4.0% Total Consumption Taxes $519,445 $643,310 $123,865 23.8% $2,255,500 $2,180,500 $2,180,500
Other Taxes$2,312 $52 ($2,260) -97.7% Single Business ($4,485) $431 $4,916 na $0 $0 $03,141 3,806 665 21.2% Insurance Premiums Taxes $94,282 96,175 1,894 2.0% 351,800 380,400 380,4005,453 3,858 (1,595) -29.2% Sub-total SBT & Insurance 89,797 96,607 6,810 7.6% 351,800 380,400 380,400
(43,535) (121,622) (78,088) 179.0% Michigan Business Tax (112,307) (194,118) (81,811) -72.8% (641,000) (643,900) (643,900)203,601 215,680 12,078 5.9% Corporate Income Tax 347,074 407,327 60,253 17.4% 1,045,100 912,800 912,800
0 0 0 na Inheritance / Estate 0 0 0 na 0 0 0735 286 (448) -61.0% Telephone & Telegraph 11,355 10,292 (1,062) -9.4% 30,000 30,000 30,000
1,904 2,025 122 6.4% Oil & Gas Severance 4,723 3,613 (1,111) -23.5% 14,000 12,000 12,0008,646 7,250 (1,396) -16.2% Penalties & Interest 22,511 24,122 1,611 7.2% 100,000 127,000 127,000
60 188 127 212.0% Essential Services Assessment 506 988 482 95.4% 121,000 125,000 125,000(29) 56 85 na Miscellaneous Other/Railroad 27 79 53 197.0% 2,000 2,000 2,000
(11,667) (12,667) (1,000) -8.6% Treasury Enforcement Programs (e) (35,000) (38,000) (3,000) -8.6% (140,000) (152,000) (152,000)$165,168 $95,053 ($70,115) -42.5% Total Other Taxes $328,685 $310,911 ($17,774) -5.4% $882,900 $793,300 $793,300
$1,142,686 $1,045,672 ($97,013) -8.5% Subtotal GF-GP Taxes $2,745,820 $2,910,104 $164,285 6.0% $9,975,200 $9,185,600 $9,185,600
continued
- 11 -

Revenue Summary FY 2020-21General Fund-General Purpose, School Aid, and Transportation Funds
(in thousands)
For The Month Ended: December 31, 2020
Month-End Cash Collections Data October Through December Cash Collections Data Revenue Projections
December Difference Year-to-Date Difference FY 2019-20 FY 2020-21 FY 2020-21August 2020 Statutory August 2020
2019 2020 Amount Percent Source of Revenue FY 2019-20 FY 2020-21 Amount Percent Forecast Estimate ForecastNon-Tax Revenue (e)
$1,250 $833 ($417) -33.3% Federal Aid $3,750 $2,500 ($1,250) -33.3% $15,000 $10,000 $10,0008 8 0 0.0% Local Agencies 25 25 0 0.0% 100 100 100
500 583 83 16.7% Services 1,500 1,750 250 16.7% 6,000 7,000 7,0001,000 1,167 167 16.7% Licenses & Permits 3,000 3,500 500 16.7% 12,000 14,000 14,000
0 0 0 na Investments/Interest Costs 0 0 0 na 4,000 4,000 4,000833 833 0 0.0% Misc. Non-tax Revenue 2,500 2,500 0 0.0% 10,000 10,000 10,000
16,250 18,750 2,500 15.4% Liquor Purchase Revolving Fund 48,750 56,250 7,500 15.4% 195,000 225,000 225,0007,000 6,750 (250) -3.6% From Other Funds-Lottery & Escheats 21,000 20,250 (750) -3.6% 79,500 81,000 81,000
$26,842 $28,925 $2,083 7.8% Total Non-Tax Revenue $80,525 $86,775 $6,250 7.8% $321,600 $351,100 $351,100
$1,169,527 $1,074,597 ($94,930) -8.1% Total GF-GP Revenue $2,826,345 $2,996,879 $170,535 6.0% $10,296,800 $9,536,700 $9,536,700
School Aid Fund$302,932 $320,131 $17,198 5.7% Sales Tax 4% $896,005 $922,112 $26,106 2.9% $3,358,700 $3,344,700 $3,344,700
224,258 241,884 17,626 7.9% Sales Tax 2% 643,304 615,161 (28,143) -4.4% 2,629,800 2,604,600 2,604,60047,308 39,924 (7,383) -15.6% Use Tax 2% 143,082 212,608 69,525 48.6% 584,500 576,000 576,00052,905 44,490 (8,415) -15.9% State Education Property Tax 1,393,861 1,422,527 28,666 2.1% 2,155,900 2,163,000 2,163,00027,517 43,117 15,600 56.7% Real Estate Transfer Tax 94,982 125,665 30,683 32.3% 300,600 325,000 325,00065,000 180,000 115,000 177.0% Lottery Transfer (b) 161,822 180,000 18,178 11.2% 1,130,000 1,026,800 1,026,80010,355 1,857 (8,497) -82.1% Casino Wagering Tax 30,175 14,192 (15,983) -53.0% 61,400 112,800 112,8004,793 12,863 8,070 168.0% Liquor Excise Tax 9,518 12,863 3,345 35.1% 55,600 57,100 57,100
27,804 28,492 688 2.5% Cigarette/Tobacco Tax 89,011 91,759 2,749 3.1% 327,700 314,900 314,900733 19 (714) -97.4% Indus. & Comm. Facilities Taxes 7,504 11,021 3,517 46.9% 36,500 33,000 33,000
0 1,199 1,199 na Recreational Marihuana 0 16,051 16,051 na 4,200 27,300 27,300675 439 (236) -35.0% Specific Other 2,693 2,205 (488) -18.1% 26,800 26,800 26,800
247,006 244,467 (2,538) -1.0% Income Tax Earmarking 657,929 682,706 24,777 3.8% 3,042,700 2,889,900 2,889,900$1,011,285 $1,158,882 $147,597 14.6% Total School Aid Fund $4,129,885 $4,308,870 $178,985 4.3% $13,714,400 $13,501,900 $13,501,900
Multi-Fund Revenue Summary$729,145 $775,435 $46,290 6.3% Sales Tax 6% $2,136,646 $2,152,014 $15,368 0.7% $8,227,800 $8,159,000 $8,159,000504,887 533,551 28,664 5.7% Sales Tax 4% (d) 1,493,342 1,536,853 43,511 2.9% 5,598,000 5,554,400 5,554,400224,258 241,884 17,626 7.9% Sales Tax 2% 643,304 615,161 (28,143) -4.4% 2,629,800 2,604,600 2,604,600141,924 119,773 (22,150) -15.6% Use Tax 6% (g) 429,246 637,823 208,576 48.6% 1,747,400 1,722,000 1,722,000
68,822 70,525 1,703 2.5% Tobacco Taxes 220,323 227,127 6,803 3.1% 880,300 847,100 847,1000 0 0 na Tobacco Settlement 3,270 0 (3,270) -100.0% na na na
continued
- 12 -

Revenue Summary FY 2020-21General Fund-General Purpose, School Aid, and Transportation Funds
(in thousands)
For The Month Ended: December 31, 2020
Month-End Cash Collections Data October Through December Cash Collections Data Revenue Projections
December Difference Year-to-Date Difference FY 2019-20 FY 2020-21 FY 2020-21August 2020 Statutory August 2020
2019 2020 Amount Percent Source of Revenue FY 2019-20 FY 2020-21 Amount Percent Forecast Estimate ForecastMajor Transportation Revenues
$23,683 $18,771 ($4,912) -20.7% Diesel Fuel / Motor Carrier Fuel Tax $63,480 $62,019 ($1,461) -2.3% $222,000 $227,000 $227,000116,349 84,009 (32,341) -27.8% Gasoline 306,213 263,424 (42,789) -14.0% 1,058,000 1,150,000 1,150,00099,895 115,052 15,157 15.2% Motor Vehicle Registration 294,053 300,581 6,528 2.2% 1,340,000 1,373,000 1,373,000
4,737 3,935 (802) -16.9% Other Taxes, Fees & Misc. 13,674 12,757 (917) -6.7% 199,326 217,996 217,9968,472 8,537 65 0.8% Comprehensive Transportation (c) 25,416 25,610 194 0.8% 101,662 102,439 102,439
39,000 50,000 11,000 28.2% Income Tax Earmarking 117,000 150,000 33,000 28.2% 468,000 600,000 600,000$292,136 $280,303 ($11,833) -4.1% Total Major Trans. Revenues $819,836 $814,392 ($5,445) -0.7% $3,388,988 $3,670,435 $3,670,435
Lottery Sales By Games$195,749 $218,816 $23,066 11.8% Instant Games (f) $462,769 $621,257 $158,487 34.2% na na na
90,470 87,603 (2,867) -3.2% Daily Games 224,244 278,597 54,353 24.2% na na na38,779 34,774 (4,005) -10.3% Lotto and Big Game (f) 85,957 108,158 22,201 25.8% na na na
803 677 (126) -15.7% Keno Game 2,091 2,139 48 2.3% na na na1,290 1,039 (251) -19.5% Lucky For Life 3,351 3,258 (93) -2.8% na na na
10,292 4,093 (6,200) -60.2% Other (f) 30,906 15,109 (15,797) -51.1% na na na61,527 20,977 (40,550) -65.9% Club Games 159,078 120,227 (38,851) -24.4% na na na
$398,912 $367,979 ($30,933) -7.8% Total Lottery Sales $968,397 $1,148,745 $180,348 18.6% na na na
(a) GF-GP Sales has been adjusted based on Comprehensive Transportation Fund, Health Initiative, Constitutional Revenue Sharing, and Aviation Fund. GF-GP Use has beenadjusted based on Aviation Fund.
(b) The statutory estimate does not include an estimate of lottery sales. It only includes an estimate of the School Aid Fund transfer. The transfersshown are actual transfers from Lottery to School Aid Fund.
(c) The Comprehensive Transportation Fund distributions have been estimated (includes sales tax transfer and other miscellaneous revenuesdedicated to the Comprehensive Transportation Fund).
(d) 2.0% collections adjusted to reflect exemption on residential utilities.
(e) Non-tax revenue items other than interest are estimates.
(f) Lottery Sales include iLottery net win amounts; and Other lottery games includes the new Fast Cash games, which began in July 2017.
(g) Gross Use tax collections include the transferred amounts to the Local Community Stabilization Authority, which are front-loaded at the beginning of the fiscal year. The year-to-date 2020revenues were $179.0 million and the year-to date 2021 revenues are $212.8 million. Per 2014 Public Act 80, the total fiscal year 2020 Local Community Stabilization Share (LCSS) was$465.9 million and the total fiscal year 2021 LCSS is $491.5 million.
(h) General Fund Use tax collections are net of LCSS revenue. The year-to-date 2020 LCSS revenues were $141.7 million and the year-to-date 2021 LCSS revenues are $176.8 million.
(i) Official CAFR figures are adjusted to put them on a comparable basis with Consensus Estimates.
Source: Michigan Department of Treasury, Office of Revenue & Tax Analysis, based on reports from theOffice of Financial Management, Michigan Department of Technology, Management and Budget, and otherreports from the Michigan Department of Treasury.
- 13 -

-14-
Economic Highlights (All data seasonally adjusted unless otherwise noted.) U.S. Economy
U.S. real Gross Domestic Product increased at a 33.4 percent annual rate in the third quarter of 2020, according to the revised estimate, after a decline of a 31.4 percent annual rate in the second quarter. The coronavirus (COVID-19) pandemic that hit the U.S. in 2020 drove the significant swings in GDP. The first, second, and third quarter of 2020 contributions to the percent change in GDP are shown in the graph below.
Personal consumption expenditures contributed significantly to the increase in the third quarter, along with private inventories and fixed investment. Net exports and government spending were both drags on the economy. Real final sales increased 25.9 percent in the third quarter while on the inflation front, the implicit price deflator increased by 3.7 percent, according to the latest data.
U.S. wage and salary employment declined by 140,000 jobs in December, the first decline after seven months of job gains. Employment levels were still 9.8 million payroll jobs, or 6.5 percent, below February’s level. In December, job gains in most sectors were overshadowed by the significant decline in the leisure and hospitality sector, which lost 498,000 jobs. Government employment declined also, by 45,000 jobs. Sectors with the largest increases in employment include professional business services with 161,000 jobs, retail trade with 120,500 jobs, construction with 51,000 jobs, and transportation and warehousing with 46,600 jobs.
In December, the U.S. unemployment rate remained at 6.7 percent. Civilian employment totaled 149.8 million, similar to the level in November, while the number unemployed also remained relatively flat at 10.7 million. Of the unemployed, 3.0 million were reported as being on a temporary layoff, an increase of 0.2 million from 2.8 million in November.
The Index of Consumer Sentiment increased slightly in December, rising 3.8 index-points from November to 80.7. The year over year consumer sentiment is 18.6 index-points below December 2019 levels. In a departure of trends over the last 50 years, in which consumer’s outlook of their personal
-4.8%
-24.0%
25.4%
-0.2%
-5.3%
5.4%
- 1.3% -3.5%
6.6%
1.1%0.6%
-3.2%
0.2%0.8%
-0.8%GDP
Growth, -5.0%
GDP Growth, -31.4%
GDP Growth, 33.4%
-35%
-25%
-15%
-5%
5%
15%
25%
35%
-35%
-25%
-15%
-5%
5%
15%
25%
35%
2020 Q1 2020 Q2 2020 Q3
Real GDP Growth and Contributions to Percent Change
Personal consumption expenditures Fixed investment Private inventories Net exports GovernmentSource: Bureau of Economic Analysis

-15-
finances and the national economy were closely related, the pandemic has caused these outlooks to diverge. Consumers who have remained employed continue to have a positive outlook of their personal finances but a negative outlook of the national economy. Consumers expect an inflation rate of 2.5 percent in the year ahead, down from November’s expected inflation rate of 2.8 percent.
Short-term interest rates remained flat in December, as the 3-month Treasury bill (T-bill) rate continued at 0.09 percent. Compared to one year ago, the T-bill rate decreased 1.45 percentage points. The Aaa corporate bond rate declined 0.04 percentage points to an interest yield of 2.26 percent in December and was down 0.75 percentage points from its year-ago level. The interest rate on high-grade municipal bonds declined 0.13 percentage points to 1.97 percent in December and was down 1.29 percentage points from a year ago.
U.S. weekly initial unemployment claims spiked in March through May due to the COVID-19 pandemic, peaking at 6,867,000 claims the week of March 28th. Weekly initial claims have been below one million for the past twenty weeks, declining to 965,000 initial claims for the week of January 9th.
40
60
80
100
2010 2012 2014 2016 2018 2020
Inde
x Va
lue
(196
6 =
100)
2000 2002 2004 2006 2008Source: University of Michigan, Survey Research Center
Index of Consumer Sentiment
December 2020 = 80.7
0
2
4
6
8
10
2000 2002 2004 2006 2008 2010 2012 2014 2016 2018 2020
Perc
ent
Selected Key Interest Rates
Source: Economic Indicators
T-Bills = 0.09%Moody's Aaa = 2.26%
S & P High Grade = 1.97%
0
1,000,000
2,000,000
3,000,000
4,000,000
5,000,000
6,000,000
7,000,000
8,000,000
1992 1994 1996 1998 2000 2002 2004 2006 2008 2010 2012 2014 2016 2018 2020
Source: U.S. Employment and Training Administration
U.S. Weekly Initial Unemployment Claims
Week of July 25, 1992564,000
Week of Mar 28, 2009665,000
Week of Jan 9, 2021965,000
Week of Mar 28, 20206,867,000

-16-
Michigan Economy
The Michigan jobless rate increased 0.5 percentage points to 7.5 percent in December, up from November’s revised 7.0 percent jobless rate. This is the second increase in a row in the unemployment rate in Michigan since April. The civilian labor force decreased by 141,000 in December, a 2.9 percent decline from November, while the number unemployed increased by 14,000, a 4.1 percent increase. The number unemployed is 88.0 percent higher than in December 2019.
Michigan wage and salary employment declined in December by 64,000 jobs from November, and was down 487,000 jobs, or 10.9 percent, from December 2019. In December, sectors with the largest declines include leisure and hospitality services with 60,000 jobs lost and government with 8,000 jobs lost. The sectors with the largest gains include trade, transportation, and utilities as well as retail trade which each gained 8,000 jobs. All other major sectors had relatively flat employment changes.
Michigan initial claims for unemployment increased in March, April, and May, peaking at 388,554 initial claims the week ending April 4th and declined to 24,654 the week of January 9th. In total, there were 2,239,009 initial claims over the past forty-three weeks. In the last ten weeks, Michigan has averaged 22,588 initial claims each week, a slight increase from the ten-week averages of August through October. Michigan initial claims data are not seasonally adjusted.
Michigan real GDP grew at a 44.2 annual percent rate in the third quarter of 2020, after declining at a 37.6 annual percent rate in the second quarter due to the pandemic. Michigan’s third quarter 2020 rate was above the national rate of 33.4 percent. Michigan ranked 3rd nationally and was the highest among the Great Lakes states, which averaged a 38.7 percent annual growth rate.
26
1014182226
2016 2017 2018 2019 2020
Perc
ent
Source: Bureau of Labor Statistics and Michigan Department of Technology, Management & Budget
Unemployment Rates 2016 - 2020
Michigan = 7.5%United States = 6.7%
Source: Bureau of Economic Analysis

-17-
Motor Vehicle Sector
U.S. light vehicle sales (cars and light trucks) increased 4.1 percent in December from November levels, selling at a 16.3 million unit seasonally adjusted annual rate. Domestic car sales declined 3.7 percent while light truck sales increased 7.6 percent from November. Import car sales increased 6.6 percent while light truck sales declined 0.3 percent from November. Compared to last year, light vehicle sales in December were down by 3.2 percent. Domestic car sales decreased 18.3 percent and light truck sales increased 1.9 percent from the year ago levels. Import car sales were down 11.9 percent and light truck sales were up 0.8 percent from last year. For December 2020, domestic light vehicles recorded a 77.8 percent share of a 16.3 million unit market, down 0.1 percent from the 77.2 percent share of December 2019.
Michigan motor vehicle production was up slightly in December, with 132,289 total units, 1.4 percent above November’s production, but down 11.2 percent from a year ago. Nationally, motor vehicle production was down 2.1 percent from a year ago. In December, Michigan's car production was 9,646 units while the state's truck production was 122,643 units. Compared with a year ago, car production declined 50.1 percent in Michigan but declined only 15.9 percent nationwide, while truck production declined 5.4 percent in Michigan and increased 2.4 percent nationwide from a year ago. Michigan motor vehicle production data are not seasonally adjusted.
0
5
10
15
20
2015 2016 2017 2018 2019 2020
Mill
ions
(SAA
R)
Source: Bureau of Economic Analysis
U.S. Light Vehicle Sales
Cars Lt Trucks
0
100
200
300
2015 2016 2017 2018 2019 2020
Thou
sand
s
Source: Office of Revenue and Tax Analysis
Michigan Motor Vehicle Production
Cars Trucks

Summary Estimates of the Constitutional Revenue LimitBased on the August 24, 2020 Consensus Revenue
Agreement(Article IX, Section 26)
(in millions)
Fiscal Year Fiscal Year Fiscal Year2018-19 2019-20 2020-21Actual Estimate Estimate
Applicable Calendar Year Personal Income $460,270 $484,030 $502,540Section 26 Base Ratio 9.49% 9.49% 9.49%
Revenue Limit $43,679.6 $45,934.4 $47,691.0
Revenue Limit $43,679.6 $45,934.4 $47,691.0State Revenue Subject to Limit $34,011.3 $33,773.0 $33,096.2
Amount Under (Over) Limit $9,668.3 $12,161.4 $14,594.9
Sources:
Personal Income EstimateThe FY 2018-19 calculation uses the official personal income estimate for calendar year 2017 (Survey of Current Business, October 2018). The FY 2019-20 calculation uses the official personal income estimate for calendar year 2018 (Survey of Current Business, October 2019). The FY 2020-21 calculation uses the August 24, 2020 Consensus Revenue Agreement.
Revenue Subject to the LimitThe FY 2018-19 calculation uses the State of Michigan Statement of Revenue Subject to Constitutional Limitation - Legal Basis for the Fiscal Year Ended September 30, 2019.The FY 2019-20 calculation uses the August 24, 2020 Consensus Revenue Agreement.The FY 2020-21 calculation uses the August 24, 2020 Consensus Revenue Agreement.
Column detail may not add to totals due to rounding
Prepared By: Office of Revenue and Tax Analysis, Michigan Department of Treasury
-18-