s n μ determination of consistency limits of clay by … · abstract the liquid limit of clay is...
TRANSCRIPT
3431
Proceedings of the XVI ECSMGEGeotechnical Engineering for Infrastructure and DevelopmentISBN 978-0-7277-6067-8
© The authors and ICE Publishing: All rights reserved, 2015doi:10.1680/ecsmge.60678
parameters for the analyses of piled embankments model tests. The influence of relative density and grain size are studied as well. It can be concluded from the test results that the grain size of the sand has no significant influences on the properties of sand with the same relative density. Peak friction angles and dilation angles in plane strain are quite high, pos-sible because of the significant proportion of feldspar, the σ2 displacement is confined, and the high relative density.
Figure 9. p-q curves of the Non-circular particles with different friction coefficient μ
0 2 4 6-0.1
0.0
0.1
0.2
0.3
0.4
0.5
0.6
0.7
0.8
(σ1-σ3),II,Dr=85% (σ1-σ3),DEM εv,II,Dr=85% εv,DEM
ε1 (%)
σ 1-σ3
(MPa
)
0.0
0.4
0.8
1.2
1.6
2.0
2.4fp,DEM
εv(%
)
fp
εp εp,DEM
Figure 10. Deviatoric stress and dilatancy curves of the laboratory tests and the DEM simulation
Micromechanical parameters used in 2D DEM can
be obtained by calibrations. When circular particles are used, the high strength found from the plane strain tests can not be reached. Non-circular clusters can be used to increase the peak friction and dilation angle of the particle assembly without increasing the friction coefficient to larger than 1.
Not only the high friction angle, but also the stress and dilatancy curves under confining stress of 100 kPa can be simulated quite well by non-circular par-
ticles. The micromechanical parameters used in piled embankment simulations are suggested as follow: 1/2 triangular particle clumps and 1/2 square-shape parti-cle clumps, kn = 200 MN/m, kn/ks = 3/1, n2d = 0.18, and μ = 0.8.
6 ACKNOWLEDGEMENT
The study was supported by the National Natural Science Foundation of China (Project No. 51208403) and the Fundamental Research Funds for the Central Universities (WUT: 2013-II-018). We gratefully acknowledge their support.
REFERENCE
Alshibli, K.A., Batiste, S.N., & Sture, S. 2003. Strain localization in sand: plane strain versus triaxial compression. Journal of Ge-otechnical and Geoenvironmental Engineering, 129(6), 483-494. Bolton, M. D. 1986. The strength and dilatancy of sands. Ge-otechnique, 36(1), 65-78. Chang. Z., Yang J., Chen X.H. 2010. Granula mechanical analysis of the strength and dilatancy of sands. Engineering mechanics, 27(4):95-104. Cundall, P.A., & Strack, O.D. 1979. A discrete numerical model for granular assemblies. Geotechnique, 29(1), 47-65. Han, J., Bhandari, A., & Wang, F. 2011. DEM analysis of stresses and deformations of geogrid-reinforced embankments over piles. International Journal of Geomechanics, 12(4), 340-350. Houlsby, G.T. 1991. How the dilatancy of soils affects their behav-iour. University of Oxford, Department of Engineering Science. Itasca. 2004. Particle flow code in two dimensions (PFC2D), Itasca, Minneapolis. Marachi, N.D., Duncan, J.M., Chan, C.K., & Seed, H. B. 1981. Plane-strain testing of sand. Laboratory shear strength of soils, ASTM STP 740, R. N. Yong, and F. C. Townsend, eds., ASTM, 294–302. Potyondy, D.O., & Cundall, P.A. 2004. A bonded-particle model for rock. International journal of rock mechanics and mining sci-ences, 41(8), 1329-1364. Rothenburg, L., & Bathurst, R.J. 1993. Influence of particle eccen-tricity on micromechanical behavior of granular materials. Me-chanics of Materials,16(1), 141-152. Shi X.S. & Cheng Z.L, 2011. Unified strength theory parameters of rockfill material in plane strain state. Chinese Journal of Rock Mechanics and Engineering, 30(11), 2244 – 2253. Sadrekarimi, A., & Olson, S.M. 2011. Critical state friction angle of sands. Geotechnique, 61(9), 771-783. Sture, S., Costes, N.C., Batiste, S.N., et al. 1998. Mechanics of granular materials at low effective stresses. Journal of Aerospace Engineering, 11(3), 67-72.
Determination of consistency limits of clay by means of extrusion tests
Détermination des limites de consistance d’argiles au moyen d’essais d’extrusion
R.D. Verástegui-Flores*1, G. Di Emidio2 1 iMMC, Université catholique de Louvain, Louvain-la-Neuve, Belgium
2 Laboratory of Geotechnics, Ghent University, Ghent, Belgium * Corresponding Author
ABSTRACT The liquid limit of clay is commonly determined through the Casagrande test or the fall-cone test, while the plastic limit is determined through the hand rolling method. The greatest issue with some of these techniques is their low repeatability and operator de-pendency. In order to minimize those issues, an indirect-extrusion based technique was evaluated as an alternative method to determine both consistency limits. The experimental work was carried out on mixtures of kaolin and bentonite to cover a wide range of plasticity. The results suggested that there is a specific extrusion pressure linked to each consistency limit and that the results are repeatable. The liquid limit obtained through the extrusion method closely matches the results of the fall-cone test. Similarly, the plastic limit out of extrusion closely matches the results of the hand rolling method.
RÉSUMÉ La limite de liquidité de l'argile est généralement déterminée par l'essai de Casagrande ou l'essai au cône, alors que la limite plastique est déterminée par la méthode au rouleau. Le principal problème avec certaines de ces techniques est leur faible répétabilité ainsi que l'influence de l'opérateur. Afin de minimiser ces problèmes, une méthode d'extrusion indirecte a été évaluée comme une méthode alter-native pour déterminer les limites de consistance. Le travail expérimental a été effectué sur des mélanges de kaolin et bentonite pour cou-vrir une large gamme de plasticité. Les résultats suggèrent l'existence d'une pression d'extrusion spécifique liée à chaque limite de consis-tance et que les résultats sont répétables. La limite liquide obtenue par le procédé d'extrusion correspond étroitement aux résultats de l'essai au cône. De même, la limite plastique obtenue de l'essai d'extrusion indirecte correspond étroitement aux résultats de la méthode conven-tionnelle au rouleau.
1 INTRODUCTION
In soil mechanics, consistency is a fundamental pa-rameter for the classification of fine-grained soil. Consistency can be classified as liquid, plastic, semi-solid and solid, each associated with a rheological behavior. The consistency of clay is liquid at high water contents and changes from liquid to solid as the water content decreases.
The most relevant consistency indexes are the liq-uid limit (wL) and the plastic limit (wP). wL is the wa-ter content of a sample at the boundary between liq-uid and plastic behavior, whereas wP is the water content of a sample at the boundary between plastic and semi solid behavior. wL is determined through
the Casagrande cup test or the fall-cone test, while wP is determined through the hand rolling method. The greatest issue with some of these techniques is their low repeatability and operator dependency. In order to minimize those issues, an indirect extrusion tech-nique was evaluated as an alternative to determine both, wL and wP.
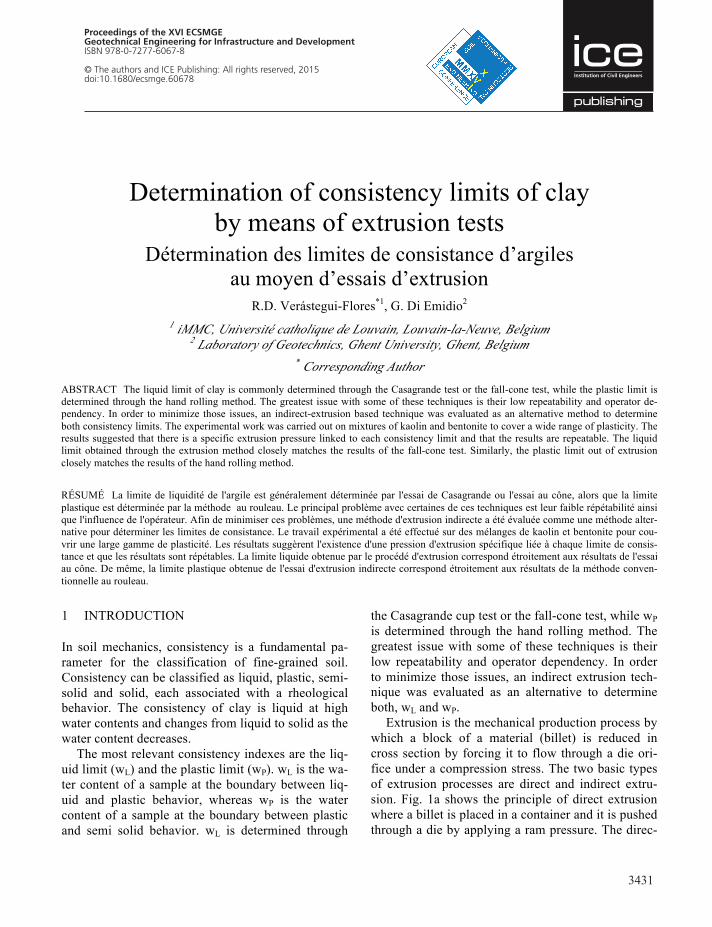
Extrusion is the mechanical production process by which a block of a material (billet) is reduced in cross section by forcing it to flow through a die ori-fice under a compression stress. The two basic types of extrusion processes are direct and indirect extru-sion. Fig. 1a shows the principle of direct extrusion where a billet is placed in a container and it is pushed through a die by applying a ram pressure. The direc-
Geotechnical Engineering for Infrastructure and Development
3432
tion of sample flow and ram travel is the same. Under direct extrusion, the extrusion pressure vs. ram dis-placement curve most commonly has the form shown in Fig. 1a. Initially, the extrusion pressure rises rapid-ly up to a peak value. Then, as extrusion initiates, the pressure decreases as the frictional component at the container wall decreases. Finally, at the billet’s end, the pressure increases once more as the billet be-comes short and the material shows higher resistance to flow. Under indirect extrusion, also called reverse extrusion, the die moves against the sample, which is in a stationary container (Fig. 1b). The directions of sample flow and die travel are opposite. The ad-vantage of indirect extrusion is that no frictional forces are mobilized at the container wall and there-fore the extrusion pressure primarily depends on the properties of the sample.
The concept of extrusion has been applied for the rheological characterization of different materials such as food, ceramics, etc. (e.g. Cheyne et al., 2005; Göhlert & Uebel , 2009). The extrusion technique was probably first applied for geotechnical purposes by Whyte (1982); however, his work focused on es-tablishing a relationship between undrained shear strength, extrusion pressure and water content.
Figure 1. Extrusion process: (a) direct (b) indirect
Kayabali & Tufenkci (2010) investigated indirect extrusion to determine the consistency limits of dif-ferent types of natural soil with plasticity indexes IP < 50, taking as a reference the consistency tests de-scribed by the ASTM D 4318 (2010). They reported a correlation with significant dispersion probably due to the different shearing conditions that the clay sam-ples undergo in the Casagrande cup and in the indi-rect extrusion setup, and probably also due the im-pact of side friction in their testing setup.
The aim of this paper is to investigate whether it is possible to establish a stronger correlation for the de-termination of consistency limits of different clay samples over a wider range of plasticity through the indirect extrusion technique by minimizing all possi-ble sources of dispersion. At the same time, the re-sults are compared to the test methods described in ASTM D 4318 (2010) and BS 1377-2 (1990).
2 MATERIALS
The experimental work was carried out on mixtures of kaolin (K) and bentonite (B) to cover a wide range of plasticity (e.g. 100%K, 80%K+20%B, 60%K+40%B, 40%K+60%B, 20%K+ 80%B and 100%B). Some properties are given in table 1.
Kaolin and bentonite were first mixed dry at the specific ratios. Subsequently, deionized water was added to the mixtures to achieve various water con-tents. Water and clay were mixed in a dough mixer for about 15 minutes. Then, the wet samples were stored in air-tight containers (in a conditioned room at about 20ºC) at least for one day before testing.
The testing program on these samples included the execution of conventional tests to evaluate wL and wP and more importantly, the development and evalua-tion of an indirect-extrusion method. The outcome of the conventional tests serves as a reference for the calibration of the extrusion method.
Table 1. Properties of the clay materials
Property Kaolin Bentonite Specific gravity 2.64 2.52 Liquid limit, % 53.2 374.7 Plastic limit, % 31.0 62.9 Swell index, ml/2g 3.5 18.0 CEC, meq/100g 1.4 73.8
Short billet
Short billetExtrusion
Extrusion
Bill
et
com
pres
sion
Bill
et
com
pres
sion
Pressure
Ram Displacement
Die Displacement
Billet
F
Ram
Die
Pressure
Billet
F/2
Die
F/2
(a)
(b)
PE
3 METHODS
3.1 Conventional methods for the liquid limit
LL may be determined through the Casagrande cup test (ASTM D 4318, 2010) or the fall cone test (BS 1377-2, 1990). The repeatability of the Casagrande cup method is known to be affected by operator judgment (Whyte, 1982; Özer, 2009). On the contra-ry, repeatability is not an issue for the fall cone test, however the outcome of this test has to be carefully assessed as it will produce results for all soil types including non-plastic soils, giving a wrong represen-tation of plasticity (Prakash & Sridharan, 2006). Moreover, the Casagrande cup and fall cone test do not produce the same results (Wasti, 1987; Schmitz et al., 2004; Prakash & Sridharan, 2006; Lee & Freeman, 2009; Özer, 2009). In general, good agree-ment is observed for soils within an approximate range of 0% < wL < 70%. Outside this range, the fall cone test produces lower wL values.
3.2 Conventional methods for the plastic limit
wP is evaluated out of the standardized hand rolling method (ASTM D 4318, 2010; BS 1377-2, 1990). However, a few fall-cone based methods are availa-ble in the literature as well (e.g. Wood & Wroth, 1978; Wasti, 1987; Feng, 2004; Lee & Freeman, 2009). In this research, the method proposed by Feng (2004) was followed in addition to the hand method. Here, four fall cone measurements are carried out to obtain cone penetrations ranging from 10 mm to 3 mm. Then, wP is determined, through linear extrapo-lation in a bi-logarithmic chart, as the water content corresponding to a cone penetration of 2 mm.
3.3 Indirect extrusion testing method
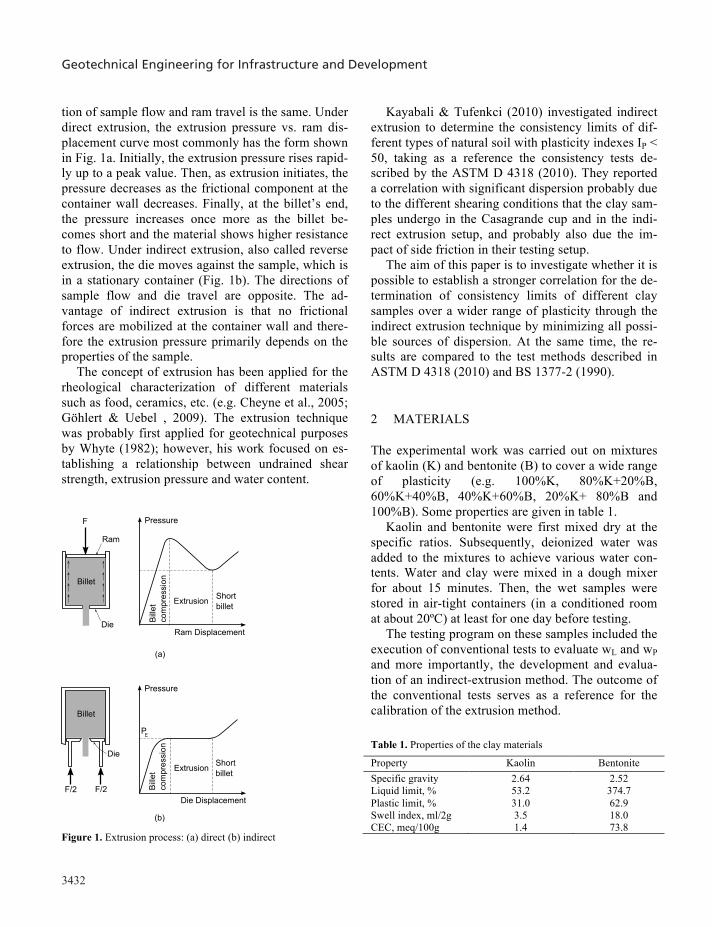
The equipment used for the indirect extrusion tests consists of a load frame provided with a platen that moves at adjustable constant rates, an indirect extru-sion device (Fig. 2), a load cell with a capacity of 2 kN and a linear displacement transducer. The indirect extrusion device consists of a steel container and a steel extrusion die. The extrusion die rests on top of a cylindrical tube and a footplate. The die orifice with diameter d has a conical shape to minimize friction between the extruded sample and the die.
Figure 2. Indirect extrusion device used in this research.
During extrusion testing, the die displacement and
the extrusion load (FE) are continuously recorded. The extrusion pressure PE is then evaluated out of the steady-state portion of the measured FE vs. die dis-placement curve (e.g. Fig. 1b) through:
𝑃𝑃! =!!!
(1)
where A is the cross section of the sample container. PE not only depends on the clay water content, but al-so on the die displacement rate (v) and on the extru-sion factor (r). The extrusion factor is defined here as r = D/d, where D is the diameter of the sample con-tainer and d is the diameter of the die orifice.
A test is started as soon as the die is set to travel against the clay sample. For the sake of simplicity, it is desired that all tests are performed making use of a single extrusion factor and a single die displacement rate that produce representative and repeatable data. So, a choice was made based on a series of experi-ments to evaluate the impact of these factors. The die with r = 4 and a rate v = 4 mm/min were selected as the most suitable for all further indirect extrusion tests in this research.
LoadSoil sample(O = 40 mmH = 50 mm)
Steel container
Steel extrusion die D = 40 mm
d
Side openingfor access tothe extrudedsoil thread
35 mm
110 mm
3433
tion of sample flow and ram travel is the same. Under direct extrusion, the extrusion pressure vs. ram dis-placement curve most commonly has the form shown in Fig. 1a. Initially, the extrusion pressure rises rapid-ly up to a peak value. Then, as extrusion initiates, the pressure decreases as the frictional component at the container wall decreases. Finally, at the billet’s end, the pressure increases once more as the billet be-comes short and the material shows higher resistance to flow. Under indirect extrusion, also called reverse extrusion, the die moves against the sample, which is in a stationary container (Fig. 1b). The directions of sample flow and die travel are opposite. The ad-vantage of indirect extrusion is that no frictional forces are mobilized at the container wall and there-fore the extrusion pressure primarily depends on the properties of the sample.
The concept of extrusion has been applied for the rheological characterization of different materials such as food, ceramics, etc. (e.g. Cheyne et al., 2005; Göhlert & Uebel , 2009). The extrusion technique was probably first applied for geotechnical purposes by Whyte (1982); however, his work focused on es-tablishing a relationship between undrained shear strength, extrusion pressure and water content.
Figure 1. Extrusion process: (a) direct (b) indirect
Kayabali & Tufenkci (2010) investigated indirect extrusion to determine the consistency limits of dif-ferent types of natural soil with plasticity indexes IP < 50, taking as a reference the consistency tests de-scribed by the ASTM D 4318 (2010). They reported a correlation with significant dispersion probably due to the different shearing conditions that the clay sam-ples undergo in the Casagrande cup and in the indi-rect extrusion setup, and probably also due the im-pact of side friction in their testing setup.
The aim of this paper is to investigate whether it is possible to establish a stronger correlation for the de-termination of consistency limits of different clay samples over a wider range of plasticity through the indirect extrusion technique by minimizing all possi-ble sources of dispersion. At the same time, the re-sults are compared to the test methods described in ASTM D 4318 (2010) and BS 1377-2 (1990).
2 MATERIALS
The experimental work was carried out on mixtures of kaolin (K) and bentonite (B) to cover a wide range of plasticity (e.g. 100%K, 80%K+20%B, 60%K+40%B, 40%K+60%B, 20%K+ 80%B and 100%B). Some properties are given in table 1.
Kaolin and bentonite were first mixed dry at the specific ratios. Subsequently, deionized water was added to the mixtures to achieve various water con-tents. Water and clay were mixed in a dough mixer for about 15 minutes. Then, the wet samples were stored in air-tight containers (in a conditioned room at about 20ºC) at least for one day before testing.
The testing program on these samples included the execution of conventional tests to evaluate wL and wP and more importantly, the development and evalua-tion of an indirect-extrusion method. The outcome of the conventional tests serves as a reference for the calibration of the extrusion method.
Table 1. Properties of the clay materials
Property Kaolin Bentonite Specific gravity 2.64 2.52 Liquid limit, % 53.2 374.7 Plastic limit, % 31.0 62.9 Swell index, ml/2g 3.5 18.0 CEC, meq/100g 1.4 73.8
Short billet
Short billetExtrusion
Extrusion
Bill
et
com
pres
sion
Bill
et
com
pres
sion
Pressure
Ram Displacement
Die Displacement
Billet
F
Ram
Die
Pressure
Billet
F/2
Die
F/2
(a)
(b)
PE
3 METHODS
3.1 Conventional methods for the liquid limit
LL may be determined through the Casagrande cup test (ASTM D 4318, 2010) or the fall cone test (BS 1377-2, 1990). The repeatability of the Casagrande cup method is known to be affected by operator judgment (Whyte, 1982; Özer, 2009). On the contra-ry, repeatability is not an issue for the fall cone test, however the outcome of this test has to be carefully assessed as it will produce results for all soil types including non-plastic soils, giving a wrong represen-tation of plasticity (Prakash & Sridharan, 2006). Moreover, the Casagrande cup and fall cone test do not produce the same results (Wasti, 1987; Schmitz et al., 2004; Prakash & Sridharan, 2006; Lee & Freeman, 2009; Özer, 2009). In general, good agree-ment is observed for soils within an approximate range of 0% < wL < 70%. Outside this range, the fall cone test produces lower wL values.
3.2 Conventional methods for the plastic limit
wP is evaluated out of the standardized hand rolling method (ASTM D 4318, 2010; BS 1377-2, 1990). However, a few fall-cone based methods are availa-ble in the literature as well (e.g. Wood & Wroth, 1978; Wasti, 1987; Feng, 2004; Lee & Freeman, 2009). In this research, the method proposed by Feng (2004) was followed in addition to the hand method. Here, four fall cone measurements are carried out to obtain cone penetrations ranging from 10 mm to 3 mm. Then, wP is determined, through linear extrapo-lation in a bi-logarithmic chart, as the water content corresponding to a cone penetration of 2 mm.
3.3 Indirect extrusion testing method
The equipment used for the indirect extrusion tests consists of a load frame provided with a platen that moves at adjustable constant rates, an indirect extru-sion device (Fig. 2), a load cell with a capacity of 2 kN and a linear displacement transducer. The indirect extrusion device consists of a steel container and a steel extrusion die. The extrusion die rests on top of a cylindrical tube and a footplate. The die orifice with diameter d has a conical shape to minimize friction between the extruded sample and the die.
Figure 2. Indirect extrusion device used in this research.
During extrusion testing, the die displacement and
the extrusion load (FE) are continuously recorded. The extrusion pressure PE is then evaluated out of the steady-state portion of the measured FE vs. die dis-placement curve (e.g. Fig. 1b) through:
𝑃𝑃! =!!!
(1)
where A is the cross section of the sample container. PE not only depends on the clay water content, but al-so on the die displacement rate (v) and on the extru-sion factor (r). The extrusion factor is defined here as r = D/d, where D is the diameter of the sample con-tainer and d is the diameter of the die orifice.
A test is started as soon as the die is set to travel against the clay sample. For the sake of simplicity, it is desired that all tests are performed making use of a single extrusion factor and a single die displacement rate that produce representative and repeatable data. So, a choice was made based on a series of experi-ments to evaluate the impact of these factors. The die with r = 4 and a rate v = 4 mm/min were selected as the most suitable for all further indirect extrusion tests in this research.
LoadSoil sample(O = 40 mmH = 50 mm)
Steel container
Steel extrusion die D = 40 mm
d
Side openingfor access tothe extrudedsoil thread
35 mm
110 mm
Verástegui-Flores and Di Emidio
Geotechnical Engineering for Infrastructure and Development
3434
4 RESULTS AND DISCUSSION
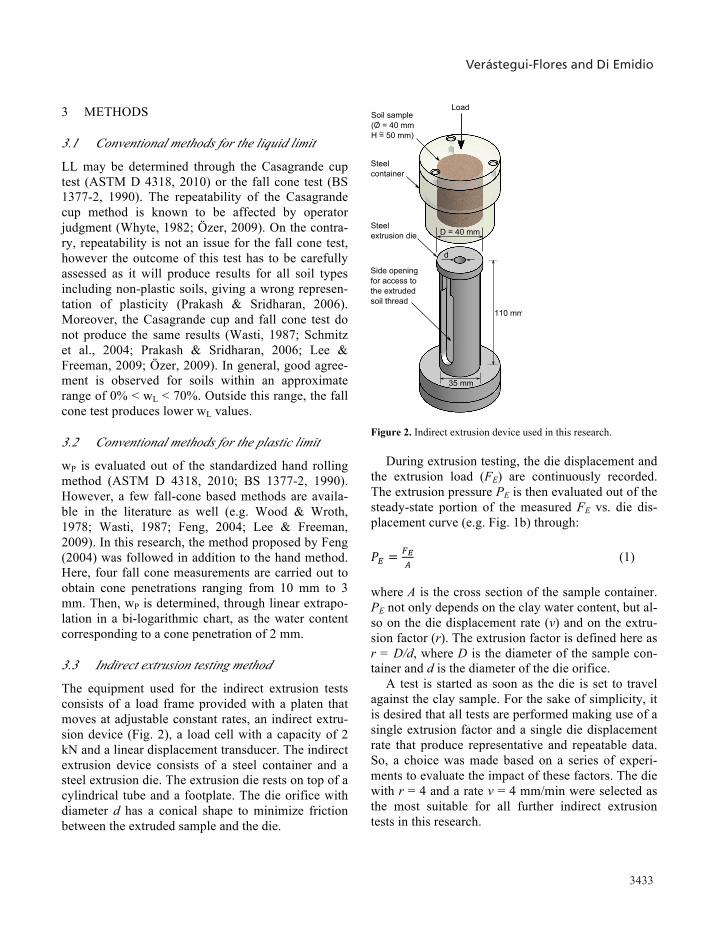
The consistency limits out of conventional tests on kaolin/bentonite mixtures are summarized in Fig 3. As expected, both wL and wP increase with increasing bentonite content. In agreement with literature, wL out of fall cone test is lower than Casagrande cup re-sults for high wL values. wP out of the hand method and the fall cone method are in good agreement.
The testing program with the indirect extrusion technique included, first, the determination of the characteristic steady-state extrusion pressures corre-sponding to wL and wP states (PE(LL) and PE(PL) re-spectively) on reference samples. Next, it followed the verification of such values as indicators of con-sistency in other soil samples.
For the determination of PE(LL), a kaolin sample was taken as reference. wL of kaolin out of Casa-grande and fall cone tests are very similar, wL(Cas) = 53.2% and wL(FC) = 55.6%, respectively. Then, a remolded sample of kaolin was prepared at a water content equal to the average LL. Next, several indi-rect extrusion tests were carried out on this material to evaluate the repeatability of the outcome (Fig. 4a). As expected, beyond the onset of extrusion, the ex-trusion pressure reaches a constant value, which indi-cates steady-state flow of the soil sample. The evalu-ation of the steady-state extrusion pressure was straightforward and it showed little dispersion with an average value of PE(LL) = 23.6 kPa corresponding to the liquid limit state.
Figure 3. wL and wP through conventional methods.
(a)
(b)
Figure 4. Evaluation of the steady-state extrusion pressure at (a) liquid limit state (b) plastic limit state.
For the determination of PE(PL), a bentonite sample
was taken as reference. But, unlike samples at wL, samples at wP are hardly workable. Therefore it was opted for performing extrusion tests at water contents slightly higher than wP and evaluating PE(PL) out of regression and extrapolation as it is done in the fall-cone method for the determination of wP (Feng, 2004). Indirect extrusion tests were carried out on samples at various water contents (every tests was repeated twice). The relationship between water con-tent (w) and the steady-state extrusion pressure was observed to be highly non linear in a semi-
0 20 40 60 80 1000
50
100
150
200
250
300
350
400
Con
sist
ency
lim
its (%
)
Bentonite content (%)
wL: Casagrande cup
wL: Fall cone test
wP: Hand method
wP: Fall cone test
Liquid limits
Plastic limits
0 2 4 6 8 100
5
10
15
20
25
30
35
40
Ext
rusi
on p
ress
ure
(kP
a)
Die displacement (mm)
Steady-state flow at the liquid limit PE(LL)
=23.6 kPa
10 100 100010
100
1000W
ater
con
tent
(%)
Steady-state extrusion pressure (kPa)
Plastic limit
Steady-state pressure at w
P, P
E(PL)= 558.3 kPa
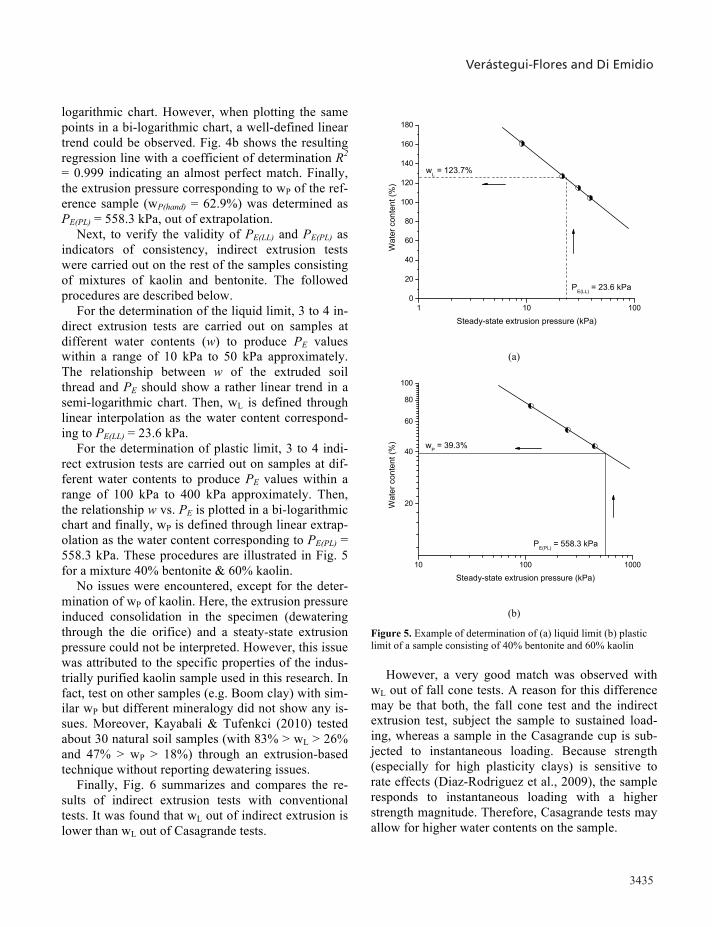
logarithmic chart. However, when plotting the same points in a bi-logarithmic chart, a well-defined linear trend could be observed. Fig. 4b shows the resulting regression line with a coefficient of determination R2 = 0.999 indicating an almost perfect match. Finally, the extrusion pressure corresponding to wP of the ref-erence sample (wP(hand) = 62.9%) was determined as PE(PL) = 558.3 kPa, out of extrapolation.
Next, to verify the validity of PE(LL) and PE(PL) as indicators of consistency, indirect extrusion tests were carried out on the rest of the samples consisting of mixtures of kaolin and bentonite. The followed procedures are described below.
For the determination of the liquid limit, 3 to 4 in-direct extrusion tests are carried out on samples at different water contents (w) to produce PE values within a range of 10 kPa to 50 kPa approximately. The relationship between w of the extruded soil thread and PE should show a rather linear trend in a semi-logarithmic chart. Then, wL is defined through linear interpolation as the water content correspond-ing to PE(LL) = 23.6 kPa.
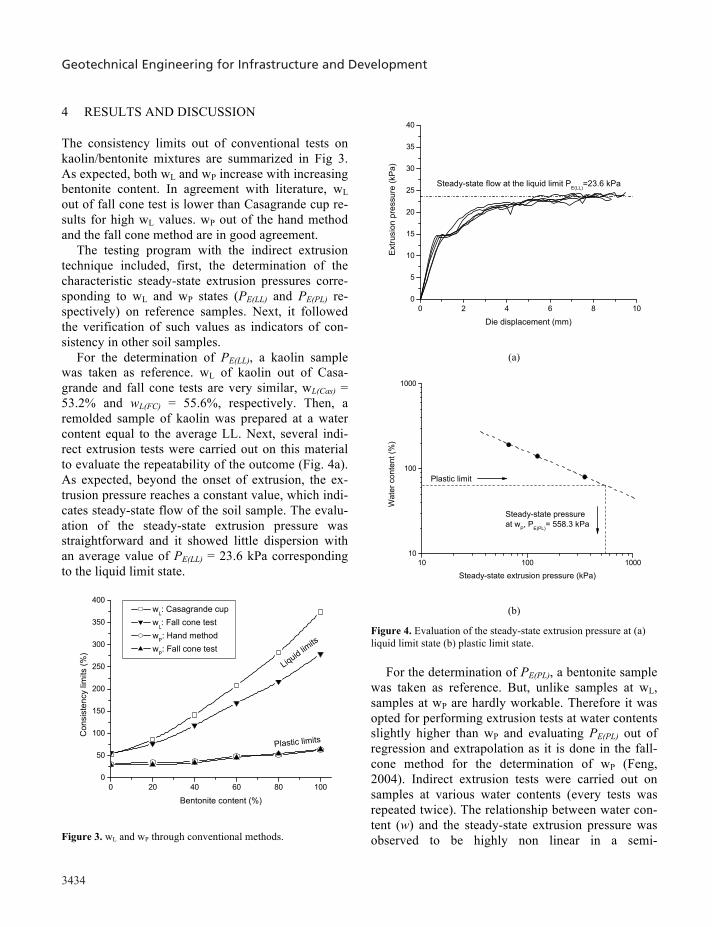
For the determination of plastic limit, 3 to 4 indi-rect extrusion tests are carried out on samples at dif-ferent water contents to produce PE values within a range of 100 kPa to 400 kPa approximately. Then, the relationship w vs. PE is plotted in a bi-logarithmic chart and finally, wP is defined through linear extrap-olation as the water content corresponding to PE(PL) = 558.3 kPa. These procedures are illustrated in Fig. 5 for a mixture 40% bentonite & 60% kaolin.
No issues were encountered, except for the deter-mination of wP of kaolin. Here, the extrusion pressure induced consolidation in the specimen (dewatering through the die orifice) and a steaty-state extrusion pressure could not be interpreted. However, this issue was attributed to the specific properties of the indus-trially purified kaolin sample used in this research. In fact, test on other samples (e.g. Boom clay) with sim-ilar wP but different mineralogy did not show any is-sues. Moreover, Kayabali & Tufenkci (2010) tested about 30 natural soil samples (with 83% > wL > 26% and 47% > wP > 18%) through an extrusion-based technique without reporting dewatering issues.
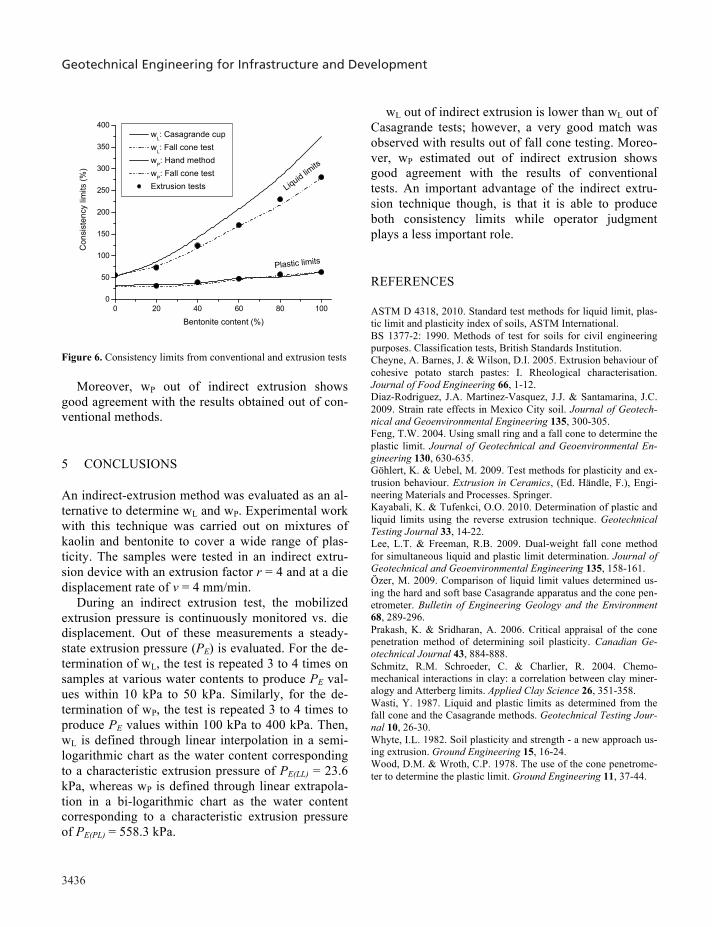
Finally, Fig. 6 summarizes and compares the re-sults of indirect extrusion tests with conventional tests. It was found that wL out of indirect extrusion is lower than wL out of Casagrande tests.
(a)
(b)
Figure 5. Example of determination of (a) liquid limit (b) plastic limit of a sample consisting of 40% bentonite and 60% kaolin
However, a very good match was observed with
wL out of fall cone tests. A reason for this difference may be that both, the fall cone test and the indirect extrusion test, subject the sample to sustained load-ing, whereas a sample in the Casagrande cup is sub-jected to instantaneous loading. Because strength (especially for high plasticity clays) is sensitive to rate effects (Diaz-Rodriguez et al., 2009), the sample responds to instantaneous loading with a higher strength magnitude. Therefore, Casagrande tests may allow for higher water contents on the sample.
1 10 1000
20
40
60
80
100
120
140
160
180
Wat
er c
onte
nt (%
)
Steady-state extrusion pressure (kPa)
wL = 123.7%
PE(LL)
= 23.6 kPa
10 100 1000
20
40
60
80
100
Wat
er c
onte
nt (%
)
Steady-state extrusion pressure (kPa)
wP = 39.3%
PE(PL)
= 558.3 kPa
3435
4 RESULTS AND DISCUSSION
The consistency limits out of conventional tests on kaolin/bentonite mixtures are summarized in Fig 3. As expected, both wL and wP increase with increasing bentonite content. In agreement with literature, wL out of fall cone test is lower than Casagrande cup re-sults for high wL values. wP out of the hand method and the fall cone method are in good agreement.
The testing program with the indirect extrusion technique included, first, the determination of the characteristic steady-state extrusion pressures corre-sponding to wL and wP states (PE(LL) and PE(PL) re-spectively) on reference samples. Next, it followed the verification of such values as indicators of con-sistency in other soil samples.
For the determination of PE(LL), a kaolin sample was taken as reference. wL of kaolin out of Casa-grande and fall cone tests are very similar, wL(Cas) = 53.2% and wL(FC) = 55.6%, respectively. Then, a remolded sample of kaolin was prepared at a water content equal to the average LL. Next, several indi-rect extrusion tests were carried out on this material to evaluate the repeatability of the outcome (Fig. 4a). As expected, beyond the onset of extrusion, the ex-trusion pressure reaches a constant value, which indi-cates steady-state flow of the soil sample. The evalu-ation of the steady-state extrusion pressure was straightforward and it showed little dispersion with an average value of PE(LL) = 23.6 kPa corresponding to the liquid limit state.
Figure 3. wL and wP through conventional methods.
(a)
(b)
Figure 4. Evaluation of the steady-state extrusion pressure at (a) liquid limit state (b) plastic limit state.
For the determination of PE(PL), a bentonite sample
was taken as reference. But, unlike samples at wL, samples at wP are hardly workable. Therefore it was opted for performing extrusion tests at water contents slightly higher than wP and evaluating PE(PL) out of regression and extrapolation as it is done in the fall-cone method for the determination of wP (Feng, 2004). Indirect extrusion tests were carried out on samples at various water contents (every tests was repeated twice). The relationship between water con-tent (w) and the steady-state extrusion pressure was observed to be highly non linear in a semi-
0 20 40 60 80 1000
50
100
150
200
250
300
350
400
Con
sist
ency
lim
its (%
)
Bentonite content (%)
wL: Casagrande cup
wL: Fall cone test
wP: Hand method
wP: Fall cone test
Liquid limits
Plastic limits
0 2 4 6 8 100
5
10
15
20
25
30
35
40
Ext
rusi
on p
ress
ure
(kP
a)
Die displacement (mm)
Steady-state flow at the liquid limit PE(LL)
=23.6 kPa
10 100 100010
100
1000
Wat
er c
onte
nt (%
)
Steady-state extrusion pressure (kPa)
Plastic limit
Steady-state pressure at w
P, P
E(PL)= 558.3 kPa
logarithmic chart. However, when plotting the same points in a bi-logarithmic chart, a well-defined linear trend could be observed. Fig. 4b shows the resulting regression line with a coefficient of determination R2 = 0.999 indicating an almost perfect match. Finally, the extrusion pressure corresponding to wP of the ref-erence sample (wP(hand) = 62.9%) was determined as PE(PL) = 558.3 kPa, out of extrapolation.
Next, to verify the validity of PE(LL) and PE(PL) as indicators of consistency, indirect extrusion tests were carried out on the rest of the samples consisting of mixtures of kaolin and bentonite. The followed procedures are described below.
For the determination of the liquid limit, 3 to 4 in-direct extrusion tests are carried out on samples at different water contents (w) to produce PE values within a range of 10 kPa to 50 kPa approximately. The relationship between w of the extruded soil thread and PE should show a rather linear trend in a semi-logarithmic chart. Then, wL is defined through linear interpolation as the water content correspond-ing to PE(LL) = 23.6 kPa.
For the determination of plastic limit, 3 to 4 indi-rect extrusion tests are carried out on samples at dif-ferent water contents to produce PE values within a range of 100 kPa to 400 kPa approximately. Then, the relationship w vs. PE is plotted in a bi-logarithmic chart and finally, wP is defined through linear extrap-olation as the water content corresponding to PE(PL) = 558.3 kPa. These procedures are illustrated in Fig. 5 for a mixture 40% bentonite & 60% kaolin.
No issues were encountered, except for the deter-mination of wP of kaolin. Here, the extrusion pressure induced consolidation in the specimen (dewatering through the die orifice) and a steaty-state extrusion pressure could not be interpreted. However, this issue was attributed to the specific properties of the indus-trially purified kaolin sample used in this research. In fact, test on other samples (e.g. Boom clay) with sim-ilar wP but different mineralogy did not show any is-sues. Moreover, Kayabali & Tufenkci (2010) tested about 30 natural soil samples (with 83% > wL > 26% and 47% > wP > 18%) through an extrusion-based technique without reporting dewatering issues.
Finally, Fig. 6 summarizes and compares the re-sults of indirect extrusion tests with conventional tests. It was found that wL out of indirect extrusion is lower than wL out of Casagrande tests.
(a)
(b)
Figure 5. Example of determination of (a) liquid limit (b) plastic limit of a sample consisting of 40% bentonite and 60% kaolin
However, a very good match was observed with
wL out of fall cone tests. A reason for this difference may be that both, the fall cone test and the indirect extrusion test, subject the sample to sustained load-ing, whereas a sample in the Casagrande cup is sub-jected to instantaneous loading. Because strength (especially for high plasticity clays) is sensitive to rate effects (Diaz-Rodriguez et al., 2009), the sample responds to instantaneous loading with a higher strength magnitude. Therefore, Casagrande tests may allow for higher water contents on the sample.
1 10 1000
20
40
60
80
100
120
140
160
180
Wat
er c
onte
nt (%
)
Steady-state extrusion pressure (kPa)
wL = 123.7%
PE(LL)
= 23.6 kPa
10 100 1000
20
40
60
80
100W
ater
con
tent
(%)
Steady-state extrusion pressure (kPa)
wP = 39.3%
PE(PL)
= 558.3 kPa
Verástegui-Flores and Di Emidio
Geotechnical Engineering for Infrastructure and Development
3436
Figure 6. Consistency limits from conventional and extrusion tests
Moreover, wP out of indirect extrusion shows
good agreement with the results obtained out of con-ventional methods.
5 CONCLUSIONS
An indirect-extrusion method was evaluated as an al-ternative to determine wL and wP. Experimental work with this technique was carried out on mixtures of kaolin and bentonite to cover a wide range of plas-ticity. The samples were tested in an indirect extru-sion device with an extrusion factor r = 4 and at a die displacement rate of v = 4 mm/min.
During an indirect extrusion test, the mobilized extrusion pressure is continuously monitored vs. die displacement. Out of these measurements a steady-state extrusion pressure (PE) is evaluated. For the de-termination of wL, the test is repeated 3 to 4 times on samples at various water contents to produce PE val-ues within 10 kPa to 50 kPa. Similarly, for the de-termination of wP, the test is repeated 3 to 4 times to produce PE values within 100 kPa to 400 kPa. Then, wL is defined through linear interpolation in a semi-logarithmic chart as the water content corresponding to a characteristic extrusion pressure of PE(LL) = 23.6 kPa, whereas wP is defined through linear extrapola-tion in a bi-logarithmic chart as the water content corresponding to a characteristic extrusion pressure of PE(PL) = 558.3 kPa.
wL out of indirect extrusion is lower than wL out of Casagrande tests; however, a very good match was observed with results out of fall cone testing. Moreo-ver, wP estimated out of indirect extrusion shows good agreement with the results of conventional tests. An important advantage of the indirect extru-sion technique though, is that it is able to produce both consistency limits while operator judgment plays a less important role.
REFERENCES
ASTM D 4318, 2010. Standard test methods for liquid limit, plas-tic limit and plasticity index of soils, ASTM International. BS 1377-2: 1990. Methods of test for soils for civil engineering purposes. Classification tests, British Standards Institution. Cheyne, A. Barnes, J. & Wilson, D.I. 2005. Extrusion behaviour of cohesive potato starch pastes: I. Rheological characterisation. Journal of Food Engineering 66, 1-12. Diaz-Rodriguez, J.A. Martinez-Vasquez, J.J. & Santamarina, J.C. 2009. Strain rate effects in Mexico City soil. Journal of Geotech-nical and Geoenvironmental Engineering 135, 300-305. Feng, T.W. 2004. Using small ring and a fall cone to determine the plastic limit. Journal of Geotechnical and Geoenvironmental En-gineering 130, 630-635. Göhlert, K. & Uebel, M. 2009. Test methods for plasticity and ex-trusion behaviour. Extrusion in Ceramics, (Ed. Händle, F.), Engi-neering Materials and Processes. Springer. Kayabali, K. & Tufenkci, O.O. 2010. Determination of plastic and liquid limits using the reverse extrusion technique. Geotechnical Testing Journal 33, 14-22. Lee, L.T. & Freeman, R.B. 2009. Dual-weight fall cone method for simultaneous liquid and plastic limit determination. Journal of Geotechnical and Geoenvironmental Engineering 135, 158-161. Özer, M. 2009. Comparison of liquid limit values determined us-ing the hard and soft base Casagrande apparatus and the cone pen-etrometer. Bulletin of Engineering Geology and the Environment 68, 289-296. Prakash, K. & Sridharan, A. 2006. Critical appraisal of the cone penetration method of determining soil plasticity. Canadian Ge-otechnical Journal 43, 884-888. Schmitz, R.M. Schroeder, C. & Charlier, R. 2004. Chemo-mechanical interactions in clay: a correlation between clay miner-alogy and Atterberg limits. Applied Clay Science 26, 351-358. Wasti, Y. 1987. Liquid and plastic limits as determined from the fall cone and the Casagrande methods. Geotechnical Testing Jour-nal 10, 26-30. Whyte, I.L. 1982. Soil plasticity and strength - a new approach us-ing extrusion. Ground Engineering 15, 16-24. Wood, D.M. & Wroth, C.P. 1978. The use of the cone penetrome-ter to determine the plastic limit. Ground Engineering 11, 37-44.
0 20 40 60 80 1000
50
100
150
200
250
300
350
400
Con
sist
ency
lim
its (%
)
Bentonite content (%)
wL: Casagrande cup
wL: Fall cone test
wP: Hand method
wP: Fall cone test
Extrusion tests Liquid limits
Plastic limits
Resonant column and cyclic torsional shear
experiments on soils of the Trentino valleys (NE Italy)
Expérimentations sur sols dans la vallée du Trentin (NE Italie) avec
Colonne de résonnance et Cisaillement Cyclique Torsionnel
F. Fedrizzi*1
, P.L. Raviolo2
and A. Viganò3
1 Geotechnical Laboratory, Geological Survey, Autonomous Province of Trento, Trento, Italy 2
Wykeham Farrance Soil Mechanics Division of CONTROLS, Liscate (Milano), Italy 3 Istituto Nazionale di Oceanografia e di Geofisica Sperimentale, Udine, Italy
* Corresponding Author
ABSTRACT Experimental results from Resonant Column (RC) and Cyclic Torsional Shear (CTS) laboratory tests on clayey, silty and
sandy soils of the Trentino valleys (NE Italy) are here presented. Main calibrations and checking of equipment are explained in order to de-
scribe the adopted testing procedures. The influence of experimental methods and soil index properties on shear modulus and damping ratio
normalized values are investigated. Laboratory data are significantly affected by the testing method (RC or CTS), the applied effective
pressure and some index properties (i.e., plasticity for fine soils and voids ratio for sands). The comparison of laboratory and in-situ results
for the same reference site shows shear-wave velocities of the same order of magnitude and similar vertical profiles with along-depth in-
creasing velocity.
RÉSUMÉ Les résultats expérimentaux d’essais de laboratoire avec Colonne de Résonnance (RC) et Cisaillement Cyclique Torsionnel
(CTS) sur sols silteux, argileux et sablonneux de la vallée du Trentin (NE Italie) sont présentés. Les paramétrages préliminaires et étalon-
nages sont décrits pour expliquer les procédures d’essais adoptées. L’influence des méthodes expérimentales et les propriétés d’indices de
sols sur le module de cisaillement et le taux d’amortissement sont évalués. Les résultats en Laboratoire sont affectés de façon significative
par la méthode d’essai (RC ou CTS), la pression effective appliquée et les propriétés du sol (par ex. plasticité pour sols fins et pourcentage
de vides pour sables). La comparaison des résultats en laboratoire et sur site montre des vitesses d’onde de cisaillement du même ordre de
magnitude et des profils verticaux similaires avec un accroissement de vitesse en profondeur.
1 INTRODUCTION
Resonant Column (RC) and Cyclic Torsional Shear
(CTS) experiments define the stress–strain pre-failure
behaviour under cyclic load of undisturbed/re-
constituted soil samples (e.g., Yokota et al., 1981; Lo
Presti et al., 1997). Shear modulus and damping ratio
curves, as a function of shear strain generally be-
tween 0.0001% and 0.1%, are obtained. These types
of results are widely used for seismic response analy-
ses at a regional/local scale.
The RC and CTS apparatus used for the work here
presented is the Stokoe apparatus for a fixed-free
configuration (Stokoe et al., 1980).
During RC tests, a sinusoidal torsional vibration at
variable frequency is applied using a rotary excitation
device mounted at the top of the specimen. The fun-
damental frequency is measured according to
(Richart et al., 1970):
I
I0
= wnh
VS
tanw
nh
VS
[1]
where I is the mass polar moment of inertia of the
specimen, I0 is the mass polar moment of inertia of
the components mounted on the top of the specimen
(drive system, top platen, etc.), wn
is the circular
frequency of the first torsional mode of vibration, h
is the height of the specimen and VS is the shear-
wave velocity.
The shear modulus ( G ) can be calculated as:
G = rVS
2 [2]