s outh a sia report and s outh e ast a sia h ighlights · s outh a sia and s outh e ast a sia h...
TRANSCRIPT

WHAT IS GLAAS?
The UN-Water Global Analysis and Assessment of Sanitation and Drinking-water (GLAAS) monitors the efforts and approaches to extend and sustain water, sanitation and hygiene (WASH) systems and services.
Between 1990 and 2010 in SA & SEA, over 870 million people gained access to improved water sources and 940 million people gained access to improved sanitation In SA & SEA financing is reported as insufficient, especially for sanitation, and the institutional capacity to absorb what is available is limited. The danger of slippage against the MDG target is real.
POLITICAL WILL AND ACCOUNTABILITY: There is growing political will for WASH implementation, as expressed in new efforts to be more accountable and to plan and coordinate more effectively.
Over three quarter of countries surveyed in SA and SEA fully recognize the right to water however only 30% fully
recognize the right to sanitation
Globally countries report strong progress in adopting and publishing WASH sector policies
UN-Water Global Analysis and Assessment of Sanitation and Drinking-Water
THE cHALLENGE of ExTENDING AND SUSTAINING SErvIcES
2013 rEPOrT
Despite progress on setting targets and establishing policies, output is insufficient
to meet national targets in SA and SEA
Despite the global financial crisis, external support for WASH increased from 2008 to 2010
Percentage of population using improved sanitation facilities (2010)
Use of improved sanitation, 2010
91–100%
76–90%
50–75%
<50%
No or insuf�cient data
Not applicable
Use of improved sanitation, 2010
91–100%
76–90%
50–75%
<50%
No or insuf�cient data
Not applicable
91–100%
76–90%
50–75%
<50%
No or insuf�cient data
Not applicable
Use of drinking-water from an improved source, 2010
Fully recognized, both urban and rural Not yet developed
ProgressingFully recognized, urban or rural
Data not availableNot developed, but progressing in urban or rural Not applicable
Not a survey participant
Percentage of deaths attributable to inadequate WASH
>15%
Data not available
≤1%
>1–5%
>5–15%
Not applicable
Percentage of deaths attributable to inadequate WASH
>15%
Data not available
≤1%
>1–5%
>5–15%
Not applicable
Percentage of population using drinking-water from an improved source (2010)
Percentage of deaths attributable to inadequate WASH
SOUTH ASIA
AND SOUTH
EAST ASIA
HIGHLIGHTS
Use of improved sanitation, 2010
91–100%
76–90%
50–75%
<50%
No or insuf�cient data
Not applicable
20112009
20112009
Sanitation
Drinking-water
0 10 20 30 40 50 60 70 80 90 100
% of countries with agreed and published sector policy
20082010
-0.2
0.3
0.8
1.3
1.8
2.3
1.5
2.1
1.01.3
ODA non-concessional lending$US
bill
ion
com
mitm
ents
89%
67%
33% 33%
95%
73%
18%27%
0%
100%
Targets in place Policies adopted Perceived adequate�nance
Annual progress >75% or more to meet target
% o
f cou
ntrie
s re
por
ting
atta
inm
ent
South and South East AsiaRest of the world
The total amount of development aid, including non-concessional lending, for sanitation and water for SA & SEA increased from US$ 2.5 billion in 2008 to US$ 3.4 billion in 2010.
In 2011, countries reported substantive political commitmentsto WASH, increasing funding allocations, and leadership andcoordination among implementing agencies. The majority
of countries have established transparent WASH serviceprovision targets and have put in place supporting policies,and many monitor against these targets. countries also confirm that the rights to water and sanitation are increasinglyadopted in laws or policies. Accountability can be improved, as most countries do not include consumers in planning andonly half have established regular review processes.
Is the right to sanitation explicitly recognized in policy or law?
– South Asia and South East Asia Highlights
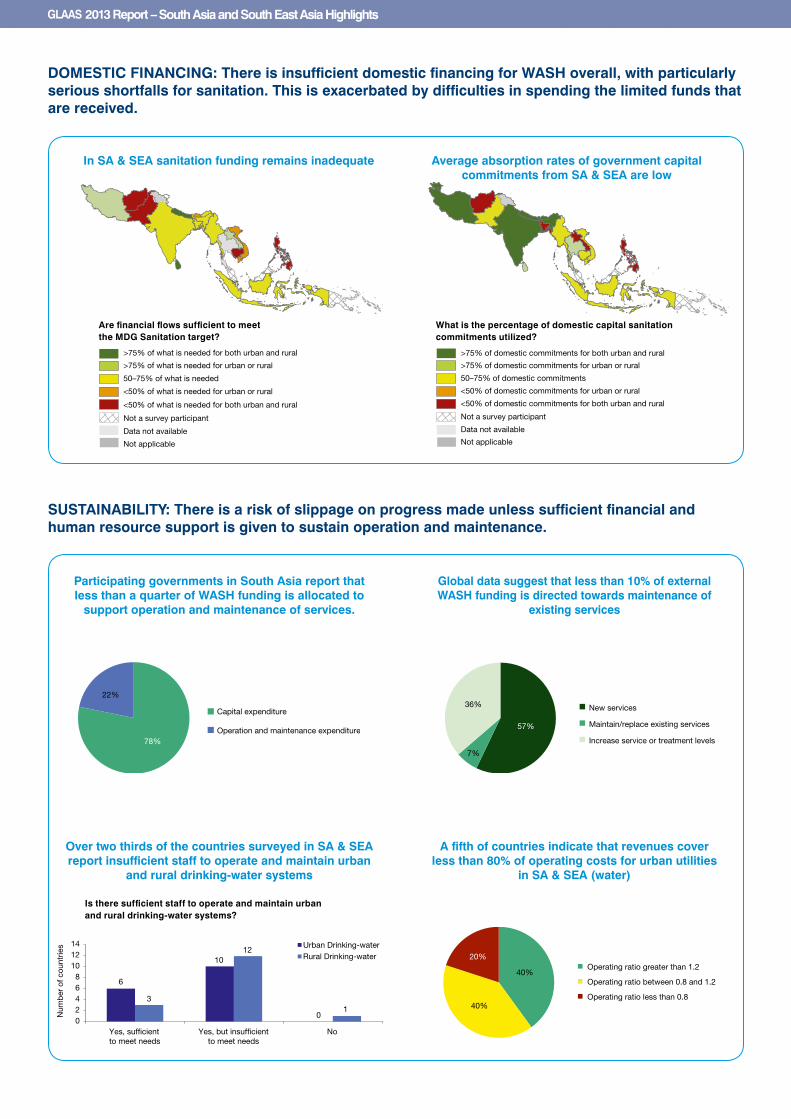
SUSTAINABILITY: There is a risk of slippage on progress made unless sufficient financial and human resource support is given to sustain operation and maintenance.
DOMESTIC FINANCING: There is insufficient domestic financing for WASH overall, with particularly serious shortfalls for sanitation. This is exacerbated by difficulties in spending the limited funds that are received.
Participating governments in South Asia report that less than a quarter of WASH funding is allocated to
support operation and maintenance of services.
Global data suggest that less than 10% of external WASH funding is directed towards maintenance of
existing services
A fifth of countries indicate that revenues cover less than 80% of operating costs for urban utilities
in SA & SEA (water)
Over two thirds of the countries surveyed in SA & SEA report insufficient staff to operate and maintain urban
and rural drinking-water systems
6
10
0
3
12
1 0 2 4 6 8
10 12 14
Num
ber
of c
ount
ries Urban Drinking-water
Rural Drinking-water
Yes, but insuf�cientto meet needs
Yes, suf�cientto meet needs
No
57%
7%
36% New services
Maintain/replace existing services
Increase service or treatment levels78%
22%
Capital expenditure
Operation and maintenance expenditure
40%
40%
20% Operating ratio greater than 1.2
Operating ratio between 0.8 and 1.2
Operating ratio less than 0.8
Is there sufficient staff to operate and maintain urban and rural drinking-water systems?
In SA & SEA sanitation funding remains inadequate Average absorption rates of government capital commitments from SA & SEA are low
>75% of domestic commitments for both urban and rural
50–75% of domestic commitments
>75% of domestic commitments for urban or rural
Data not available
<50% of domestic commitments for urban or rural
Not applicable
Not a survey participant
<50% of domestic commitments for both urban and rural
>75% of what is needed for both urban and rural
<50% of what is needed for both urban and rural
50–75% of what is needed
>75% of what is needed for urban or rural
Data not available
<50% of what is needed for urban or rural
Not applicable
Not a survey participant
Are financial flows sufficient to meet the MDG Sanitation target?
What is the percentage of domestic capital sanitation commitments utilized?

– South Asia and South East Asia Highlights
Targeting of external support for WASH can be further improved to assist those in need
Only 24% of sanitation and drinking-water aid is targeted to South East Asia and South Asia though the region currently holds 32% of the worlds unserved population in water and 46.8% of the unserved population in sanitation.
Total aid commitments for sanitation and drinking-water have been maintained between 2008 and 2010 though they have
increased for basic systems and decreased for large systems
The majority of ODA to SA & SEA is in the form of loans
Funds in respondent countries in South Asia are largely targeted for extending services in urban areas
responses from countries in SA and SEA indicate a wide variation in WASH funding sources.
77%
23%
Urban
Rural
Northern Africa
Southern Asia
Latin America and Caribbean
Sub-Saharan Africa
Western Asia
Eastern Asia
Oceania
South-eastern Asia
Caucasus and Central Asia
Developed countries
Not applicable
12%
27%
8%
9%
2%
15%12%
3%3%2%
NOTE: An additional 7% of global sanitation and water ODA is targeted to regional programmes 17
19
29
29
45
83
86
107
111
358
907
0 500 1000 1500 2000 2500
Norway
Italy
Denmark
Finland
Germany
Netherlands
United States
France
Korea
AsDB SpecialFunds
IDA
Japan
WASH aid to SA & SEAWASH aid to other parts of the world
Top 12 average annual commitments to sanitation and drinking-water to SA & SEA countries, 2008-2010 (US$ millions, constant 2009 $US)
57
0
500
1000
1500
2000
2500
3000
2000 2001 2002 2003 2004 2005 2006 2007 2008 2009 2010Aid
com
mitm
ent
to S
outh
and
Sou
th-e
ast
Asi
a (U
S$
mill
ions
, con
stan
t 20
09 $
US
)
Hygiene educationWater resources, rivers, waste managementPolicy and administrationLarge systemsBasic systems
0 100 200 300 400 500 600
Timor-LesteThailand
PhilippinesNepal
AfghanistanPakistanSri LankaIndonesia
BangladeshIndia
Vietnam
Top 11 average annual commitments to sanitation and drinking-water, 2008–2010 (US$ millions, constant 2009 $US)
LoansGrants
Financial resources and expenditure distribution for WASH are perceived to be the greatest limiting factor to meet targets.
Drinking-water continues to absorb the majority of WASHfunding, even in countries with relatively high drinking-watersupply coverage and relatively low sanitation coverage.
countries also indicate that expenditures are largely targetedfor extending services in urban areas, even in countrieswhere urban areas are relatively well served and rural areasare off-track. financial reporting in respondent countries in South and South East Asia is limited with only a few countries reporting on breakdown of spending. Many respondent countries however were able to report on sources of funding. The responses on funding sources within SA and SEA varied significantly.
100%
90%
80%
70%
60%
50%
40%
30%
20%
10%
0%
Other (ODA, Commercial)
Self-supply
Tariffs
Central regional andlocal government
% �nancial sourcesfor WASH
Afgha
nista
nBan
glades
hBhu
tan
India
Nepal
Pakist
anSri
Lank
aTh
ailan
dViet
Nam
Iran
(Islam
ic Rep
ublic
of)

– South Asia and South East Asia Highlights
The use of periodic reviews to monitor and evaluate the performance of sanitation and drinking-water uptake and services is increasingly used by countries as a basis for planning. However, the lack of robust data is a potentially major constraint to progress.
• over a third respondent of countries in South Asia and two thirds in South East Asia did not report on access to adequate sanitation in schools or health-care facilities, suggesting a lack of monitoring systems and capacity.
• Despite clear country responses indicating insufficient staff in water and sanitation services less than half of the respondent countries in South Asia and a third in South East Asia were able to provide data for staff in place and less than one third could anticipate staffing needs.
• To strengthen the collection of WASH financial information, a harmonized method of data monitoring is needed.
for further information: www.who.int/water_sanitation_health/glaas or [email protected]
The designations employed and the presentation of the material in this publication do not imply the expression of any opinion whatsoever on the part of the World Health organization concerning the legal status of any country, territory, city or area or of its authorities, or concerning the delimitation of its frontiers or boundaries. Dotted and dashed lines on maps represent approximate border lines for which there may not yet be full agreement.
MONITOrING AND EVALUATION: Improved monitoring is required to generate the information for evidence-based decision making.
Periodic sector reviews in SA & SEA exist, but in many cases are still not being used in planning
respondent countries in SA & SEA report that under 60% of urban/rural sanitation and drinking-
water sectors use information systems for decision making
Over half of respondent countries in SA & SEA failed to monitor against established targets for
school sanitation
Less than half of country respondents in SA & SEA could report on improved drinking-water coverage in health-care centres
The 2012 UN-Water GLAAS report presents data received from 75 developing countries, covering all the Millennium Development Goal (MDG) regions, of which 17 from SA & SEA, and from 24 external support agencies (ESAs), representing approximately 90% of official development assistance (oDA) for sanitation and drinking-water.
The 2012 report draws on the latest information, including data from the organisation for Economic co-operation and Development (oEcD) creditor reporting System (crS), and data gathered through two sets of questionnaires: one for low- and middle-income countries and one for ESAs. These questionnaires have allowed countries and donors to score their progress and WASH inputs according to objective criteria. While the responses are based on consensus from multiple national stakeholders and are subject to validation, it is acknowledged that the accuracy of responses will show variability. Thus, to some extent, the responses should be interpreted as a self-assessment of country and donor priorities.
56% 39%
Yes and used
Under development
No
5%
8
6
3
8
6
2
0
2
4
6
8
10
Targets, butnot monitored
No targets or strategyfor schools
Num
ber
of c
ount
ries Urban Sanitation
Rural Sanitation
Targets includedand monitored
Review and used in planning, both urban and rural No reviews performed
Review, but not used in planning
Review and used in planning, urban or rural
Data not available
Review, but not used in planning for urban or rural Not applicable
Not a survey participant
≥90%
75–89%
50–74%
<50%
Not a survey participant
Data not available
Not applicable
Is there a national information system used to inform decision-making?
Is there an annual or biennial review of the sector?
What percentage of health-care facilities have improved water supplies?
Have national sanitation targets for schools been established?