s tatistical r eview and e valuation...list of tables table 1: studies of detrol la (tolterodine...
TRANSCRIPT

U.S. Department of Health and Human Services Food and Drug Administration Center for Drug Evaluation and Research Office of Pharmacoepidemiology and Statistical Science Office of Biostatistics
S T A T I S T I C A L R E V I E W A N D E V A L U A T I O N
CLINICAL STUDIES
NDA/Serial Number: 21-228 (SE8/06)
Drug Name: Detrol LA (tolterodine prolonged release) capsules
Applicant: Pfizer, Inc.
(b) (4)
Date(s): Received: 10/10/2003; user fee (6 months) 04/09/2004
Clinical Reviewer: Lisa Soule, MD (HFD-580)
Project Manager: Jean Makie (HFD-580)
Statistical Reviewer: Joan Buenconsejo, MS, MPH (HFD-715)
Concurring Reviewer: Mike Welch, Ph.D. (HFD-715)
Biometrics Division Director: Ed Nevius, Ph.D. (HFD-715)
Keywords: NDA review, clinical studies, pediatric exclusivity, analysis of covariance, Wilcoxon rank sum test, last observation carried forward (LOCF)
1

Table of Contents
List of Tables 3
List of Figures 4
1. SUMMARY OF STATISTICAL REVIEW 5
2. STATISTICAL REVIEW AND EVALUATION OF EVIDENCE 6
2.1 Introduction and Background 6
2.2 Data Sources 6
2.3 Statistical Evaluation of Evidence on Efficacy 7
2.3.1 Study Designs 7
2.3.1.1 Study 583E-URO-0084-020 7
2.3.1.2 Study 583E-URO-0084-008 9
2.3.2 Patient Disposition 11
2.3.3 Demographics and Baseline Characteristics 13
2.3.4 Applicant’s Efficacy Results and Statistical Reviewer’s Results
and Discussion 17
2.3.4.1 Primary Efficacy Variable 17
2.3.4.2 Secondary Efficacy Variables 23
A. Study 020 23
B. Study 008 30
C. Summary 35
2.4 Findings in Special/Subgroup Population 36
2.5 Summary and Conclusion 46
2
LIST OF TABLES
Table 1: Studies of Detrol LA (Tolterodine prolonged release capsules) in
children 5 to 10 years of age for the treatment of overactive bladder 7
Table 2: Patient Disposition – Study 008 and Study 020 12
Table 3: Demographic and Baseline Characteristics for study 008 and 020 – ITT population 14
Table 4: Previous Treatment Characteristics for study 008 and 020 – ITT population 15
Table 5: Baseline Clinical Characteristics for study 008 and 020 – ITT population 16
Table 6: Summary of the results from the primary efficacy analysis in study 008 and 020 18
Table 7: Subject recruitment summarized by Country 19
Table 8: Summary of results from primary efficacy subgroup (urinary frequency)
analyses for Study 020 – Non-UK Popula tion 22
Table 9: Summary of results from secondary efficacy analyses for Study 020 – ITT Population 25
Table 10: Summary of results from secondary efficacy analyses for Study 020 – PP Population 26
Table 11: Summary of results from secondary efficacy analyses for Study 020 – Completer 27
Table 12: VASC Scores for Study 020 – ITT and PP population 28
Table 13: Summary of the results from the secondary efficacy analysis in Study 008 32
Table14: Change in PEMQoL and Treatment Satisfaction from Baseline to Week 12
– ITT and PP population 34
Table 15: Degree of Improvement in Continence during Waking Hours at Week 12
- ITT and PP population 35
Table 16: Summary of results from primary efficacy subgroup analyses for
Study 020 – ITT Population 37
Table 17: Summary of results from primary efficacy subgroup analyses for
Study 020 – PP Population 38
Table 18: Summary of results from primary efficacy subgroup analyses for
Study 0 20 – Completer Population 39
Table 19: Summary of results from primary efficacy subgroup analyses for
Study 008 – ITT Population 40
Table 20: Summary of results from primary efficacy subgroup analyses for
Study 008 – PP Population 41
Table 21: Summary of results from primary efficacy subgroup analyses for
42 Study 008 – Completer Population
Table 22: Subgroup Efficacy Analyses in Study 008 – ITT Population 43
3

29
LIST OF FIGURES
Figure 1: Change from Baseline to Week 12 for the six VASC subscales
4
1. SUMMARY OF STATISTICAL REVIEW
Two pediatric studies have been conducted by Pharmacia & Upjohn for Pfizer, Inc. in accordance with the requirements of the written request for pediatric studies (WR) submitted on January 23, 2001 and subsequent revisions issued on November 15, 2001, August 5, 2002, March 3, 2003, and October 8, 2003 to support the claim of pediatric exclusivity. The two studies were conducted for Detrol LA 2 mg QD (tolterodine prolonged release capsules) (b) (4)
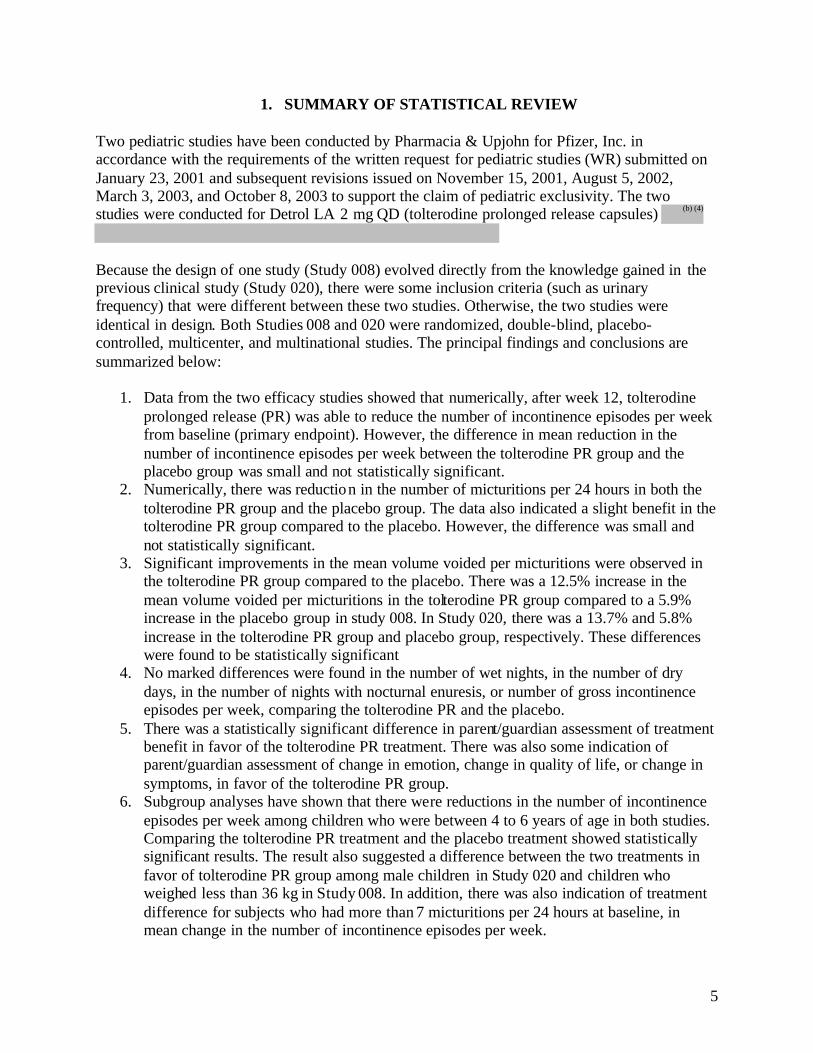
Because the design of one study (Study 008) evolved directly from the knowledge gained in the previous clinical study (Study 020), there were some inclusion criteria (such as urinary frequency) that were different between these two studies. Otherwise, the two studies were identical in design. Both Studies 008 and 020 were randomized, double-blind, placebo-controlled, multicenter, and multinational studies. The principal findings and conclusions are summarized below:
1. Data from the two efficacy studies showed that numerically, after week 12, tolterodine prolonged release (PR) was able to reduce the number of incontinence episodes per week from baseline (primary endpoint). However, the difference in mean reduction in the number of incontinence episodes per week between the tolterodine PR group and the placebo group was small and not statistically significant.
2. Numerically, there was reductio n in the number of micturitions per 24 hours in both the tolterodine PR group and the placebo group. The data also indicated a slight benefit in the tolterodine PR group compared to the placebo. However, the difference was small and not statistically significant.
3. Significant improvements in the mean volume voided per micturitions were observed in the tolterodine PR group compared to the placebo. There was a 12.5% increase in the mean volume voided per micturitions in the tolterodine PR group compared to a 5.9% increase in the placebo group in study 008. In Study 020, there was a 13.7% and 5.8% increase in the tolterodine PR group and placebo group, respectively. These differences were found to be statistically significant
4. No marked differences were found in the number of wet nights, in the number of dry days, in the number of nights with nocturnal enuresis, or number of gross incontinence episodes per week, comparing the tolterodine PR and the placebo.
5. There was a statistically significant difference in parent/guardian assessment of treatment benefit in favor of the tolterodine PR treatment. There was also some indication of parent/guardian assessment of change in emotion, change in quality of life, or change in symptoms, in favor of the tolterodine PR group.
6. Subgroup analyses have shown that there we re reductions in the number of incontinence episodes per week among children who were between 4 to 6 years of age in both studies. Comparing the tolterodine PR treatment and the placebo treatment showed statistically significant results. The result also suggested a difference between the two treatments in favor of tolterodine PR group among male children in Study 020 and children who weighed less than 36 kg in Study 008. In addition, there was also indication of treatment difference for subjects who had more than 7 micturitions per 24 hours at baseline, in mean change in the number of incontinence episodes per week.
5

2. STATISTICAL REVIEW AND EVALUATION OF EVIDENCE
a. Introduction and Background
This is a review of the c linical data in pediatric patients with detrusor overactivity of idiopathic origin as submitted in the supplemental new drug application, NDA 21-228 (SE8/06) for Tolterodine prolonged release (PR) capsules.
Currently, there are two formulations of tolterodine approved for the treatment of overactive bladder. The IR formulation, in 1 mg and 2 mg tablets administered twice daily, has been marketed in Europe and the USA for over 6 years. A prolonged release (PR) formulation, 2 mg and 4 mg administered once daily, has been marketed since 2001 to improve convenience and to enhance compliance and tolerability for patients.
Two
(b) (4)
pediatric studies have been conducted by Pharmacia & Upjohn (a subsidiary of Pfizer) in accordance with the requirements of the written request for pediatric studies (WR) submitted on January 23, 2001 and subsequent revisions issued on November 15, 2001, August 5, 2002, March 3, 2003, and October 8, 2003 to support the claim of pediatric exclusivity.
The submission contains the following two clinical studies conducted in the pediatric population, which will be the focus of this review:
1.) A phase III, randomized, double -blind, multicenter and multinational study to determine the efficacy and safety of Tolterodine prolonged release capsules in children 5 to 10 years of age with symptoms of urge urinary incont inence, suggestive of detrusor instability.
2.) A phase III, randomized, double -blind, multinational study to determine c linical efficacy and safety of Tolterodine prolonged release capsules 2 mg QD compared to placebo in children with symptoms of urinary urge incontinence suggestive of detrusor instability.
b. Data Sources
This statistical review is based on data submitted in studies 583E-URO -0084-020 and DETAPE0581-008.
The electronic submission of this NDA can be found at: \\Cdsesub1 \N21228\S 006\2003-10-10\
The clinical study report for studies 583E-URO-0084-020 and DETAPE-0581-008 is located at \\Cdsesub1 \N21228\S_006\2003-10-10\clinstat \overactive bladder \
The electronic datasets for both studies are under \\Cdsesub1 \N21228\S 006\2003-1010\crt\datasets \
6
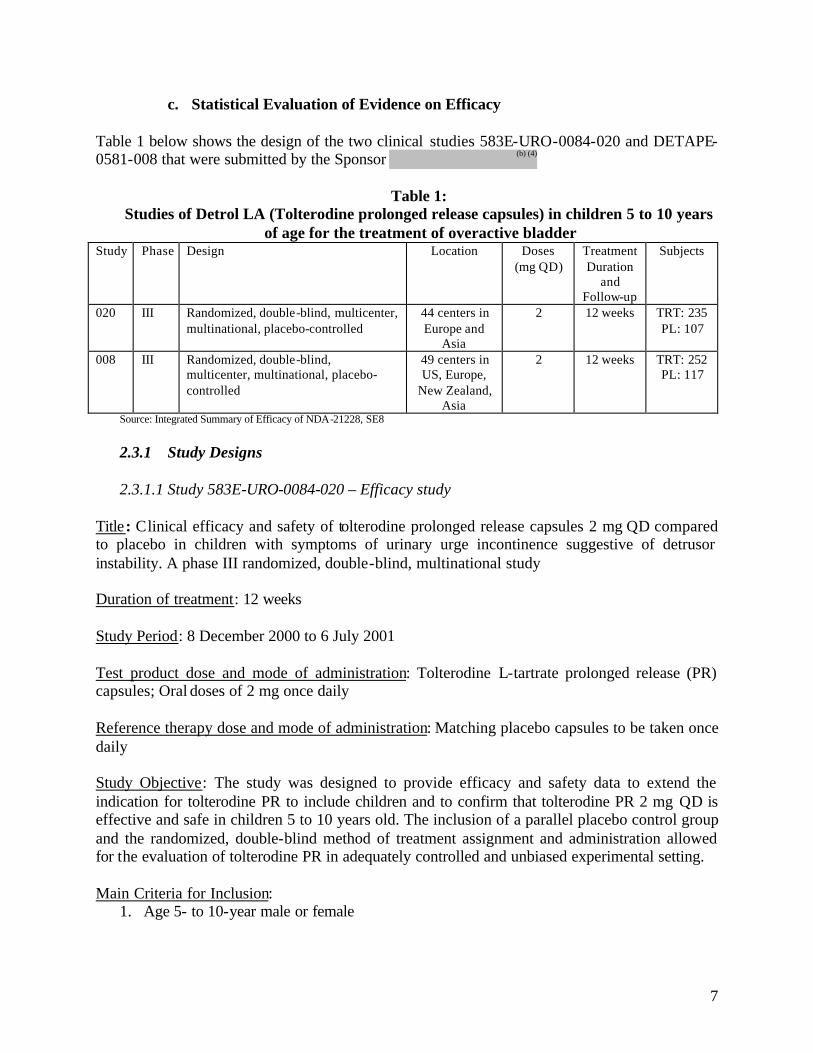
c. Statistical Evaluation of Evidence on Efficacy
Table 1 below shows the design of the two clinical studies 583E-URO-0084-020 and DETAPE(b) (4)
0581-008 that were submitted by the Sponsor
Table 1: Studies of Detrol LA (Tolterodine prolonged release capsules) in children 5 to 10 years
of age for the treatment of overactive bladder Study Phase Design Location Doses Treatment Subjects
(mg QD) Duration and
Follow-up 020 III Randomized, double -blind, multicenter, 44 centers in 2 12 weeks TRT: 235
multinational, placebo-controlled Europe and PL: 107 Asia
008 III Randomized, double -blind, multicenter, multinational, placebo-controlled
49 centers in US, Europe,
New Zealand, Asia
2 12 weeks TRT: 252 PL: 117
Source: Integrated Summary of Efficacy of NDA -21228, SE8
2.3.1 Study Designs
2.3.1.1 Study 583E-URO-0084-020 – Efficacy study
Title: C linical efficacy and safety of tolterodine prolonged release capsules 2 mg QD compared to placebo in children with symptoms of urinary urge incontinence suggestive of detrusor instability. A phase III randomized, double -blind, multinational study
Duration of treatment: 12 weeks
Study Period: 8 December 2000 to 6 July 2001
Test product dose and mode of administration: Tolterodine L-tartrate prolonged release (PR) capsules; Oral doses of 2 mg once daily
Reference therapy dose and mode of administration: Matching placebo capsules to be taken once daily
Study Objective : The study was designed to provide efficacy and safety data to extend the indication for tolterodine PR to include children and to confirm that tolterodine PR 2 mg QD is effective and safe in children 5 to 10 years old. The inclusion of a parallel placebo control group and the randomized, double-blind method of treatment assignment and administration allowed for t he evaluation of tolterodine PR in adequately controlled and unbiased experimental setting.
Main Criteria for Inclusion: 1. Age 5- to 10-year male or female
7

2. At least 1 incontinence or dampness episode per day during waking hours for at least 5 out of 7 days (confirmed by micturition during run-in period)
3. Subject and parent/guardian capable of understanding and cooperating with given information
4. Signed informed consent from subject, if possible, and from parental/guardian 5. Patients with a mean urinary frequency of > 2 micturitions per 24 hours as confirmed by
the micturition diary during the run- in period
Efficacy Endpoint:
Primary: Change from baseline in total number of incontinence episodes/week (during waking hours) after 12 weeks of treatment
Secondary: Change from baseline in mean number of micturitions per 24 hours, mean volume voided per micturition, number of ‘gross’ incontinence episodes/week, Visual Analog Scale for Children (VASC) results, and parent’s assessment of treatment benefit . In addition, the mean number of micturitions was analyzed for two separate subgroups based on a cut-off point of 7 micturitions per 24 hours at baseline.
Safety: Measurement of post-void residual (PVR) urine volume, electrocardiographic (ECG) recordings, laboratory safety values, and reporting of adverse events (AE)
Sample Size : Sample size was calculated with a two -sided t-test to detect a difference of at least 5 incontinence episodes in the primary endpoint between the two treatment groups with a power of 80% and a significance level of 5%. The calculation also assumed a common standard deviation of 13, which was based on the results from previous Phase III studies in adults and a subset of subjects for whom the number of incontinence episodes at baseline was wit hin the range expected in the study (i.e. 5 to 70 episodes). Based on these parameters, and a subject ratio of 2:1 in favor of tolterodine, the required sample size was 240 (160:80). In order to compensate for subjects expected to be withdrawn or non-evaluable, the planned sample size was increased by 20% (tolterodine 200:placebo100).
Treatment assignment/Blinding/Withdrawal: Eligible subjects were randomized to treatment with tolterodine PR 2 mg QD or placebo at study entry (Visit 2) in a 2:1 ratio. Sub jects began treatment on the day immediately following Visit 2 (randomization). Blinding was achieved by the use of tolterodine PR capsules which were physically indistinguishable from the placebo capsules, and by identical packaging labeling of all study medication. A subject was withdrawn from the study, if, in the opinion of the investigator, it was medically necessary, or it was the wish of the subject or parent/legally acceptable guardian. In such case, the primary reason was specified on the case repo rt form (CRF ) and the subject was examined as soon as possible. All relevant assessments were completed according to the schedule for the final visit (Visit 4), including the VASC where applicable.
Sponsor’s Data Analysis Method : All statistical tests performed by the Sponsor were two-sided and the level of significance was 0.05. Quantitative variables were summarized by treatment and
8

visit using descriptive statistics. Qualitative variables were summarized by treatment and visit using frequency tables. Treatment groups were compared using chi-square test.
Efficacy analysis was conducted on an intent-to-treat basis. The ITT analysis was performed using last observation carried forward (LOCF). Missing micturition chart data were extrapolated by the principle of last observation carried forward from the baseline visit or carried backward from the last visit, as appropriate. The per-protocol (PP) analyses were regarded as supportive efficacy analyses and were performed without any data imputations.
In both primary and secondary efficacy variables, the change from baseline to end of study was estimated within treatment groups and compared between treatment groups using analysis of variance (ANOVA). Hypothesis testing was conducted using Type III sum of squares. Treatment comparisons were performed with appropriate contrasts using least squares means. If the assumption of normally distributed was violated, rank transformations were performed prior to the analysis. No analysis of treatment by center interactio n was performed by the Sponsor for the reason that small number of subjects was expected in most centers.
Subgroup analyses for age and sex, and exploratory analyses investigating possible relationships between body mass index ( BMI) and the efficacy and safety variables were conducted.
Adverse events were tabulated by body system/organ class, and were summarized in frequency tables by treatment group, system organ class, preferred term and intensity. Descriptive statistics for changes from baseline to week 12 (or withdrawal) for each clinical laboratory test and in ECG variables were calculated for each treatment group. Proportion of subjects with a positive PVR urine volume was tabulated by treatment group.
2.3.1.2 Study 583E-URO-0084-008 – Efficacy study
Title: A phase III randomized, double-blind, multi-center and multinational study to determine the efficacy and safety of tolterodine prolonged release capsules in children 5 to 10 years of age with symptoms of urge urinary incontinence, suggestive of detrusor instability.
Duration of treatment: 12 weeks
Study Period: 9 April 2002 to 1 November 2002
Test product dose and mode of administration: Tolterodine L-tartrate prolonged release (PR) capsules 2 mg; Oral doses of 2 mg once daily Reference therapy dose and mode of administration: Matching placebo capsules to be taken once daily
Study Objective : The study was designed to provide efficacy and safety data to extend the indication for tolterodine PR to include children and to confirm that tolterodine PR 2 mg QD is effective and safe in children 5 to 10 years old. The inclusion of a parallel placebo control group and the randomized, double-blind method of treatment assignment and administration allowed for the evaluation of tolterodine PR in adequately controlled and unbiased experimental setting.
9

Main Criteria for Inclusion: 1. Age 5- to 10-year male or female 2. At least 1 incontinence or dampness episode per day during waking hours for at
least 5 out of 7 days (confirmed by micturition during run- in period) 3. Subject and parent/guardian capable of understanding and cooperating with given
information 4. Signed informed consent from subject, if possible, and from parental/guardian 5. Patients with a mean urinary frequency of at least 6 micturitions per 24 ho urs as
confirmed by the micturition diary during the run- in period
Efficacy Endpoint:
Primary: Change from baseline in number of daytime incontinence episodes per week after 12 weeks of treatment
Secondary: Change from baseline in number of incontinenc e episodes per week after 4 weeks, mean number of micturition/24h after 4 and 12 weeks, mean volume voided per micturition after 4 and 12 weeks of treatment, mean volume voided per micturition after 4 and 12 weeks of treatment, number of nights with noctur nal enuresis episodes per week after 4 and 12 weeks of treatment. In addition, change from baseline in Pediatric Enuresis Module to assess the Quality of Life (PEMQol) after 12 weeks of treatment and , and parent/guardian assessment of treatment benefit at 12 weeks.
Safety: incidence and severity of adverse events (AE) ; incidence of increased PVR; number of and reasons for withdrawal from the study
Sample Size : Sample size was calculated with a two -sided t-test to detect a difference of at least 5 incont inence episodes in the primary endpoint between the two treatment groups with a power of 80% and a significance level of 5%. The calculation also assumed a common standard deviation of 11, which was based on the results from previous Phase III studies in c hildren 5 to 10 years of age and on previous phase III studies in adults. Based on these parameters, and a subject ratio of 2:1 in favor of tolterodine, the required sample size was 270 (180:90). In order to compensate for subjects expected to be withdrawn or non-evaluable, the planned sample size was increased by 10% ( tolterodine 200:placebo100).
Treatment assignment/Blinding/Withdrawal: Eligible subjects were randomized to treatment with tolterodine PR 2 mg QD or placebo at study entry (Visit 2) in a 2:1 ratio. Subjects began treatment on the day immediately following Visit 2 (randomization). Blinding was achieved by the use of tolterodine PR capsules which were physically indistinguishable from the placebo capsules, and by identical packaging labeling of all study medication. A subject was withdrawn from the study, if, in the opinion of the investigator, it was medically necessary, or it was the wish of the subject or parent/legally acceptable guardian. In such case, the primary reason was specified on the CRF and the subject was examined as soon as possible. All relevant assessments were completed according to the schedule for the final visit (Visit 4).
10

Sponsor’s Data Analysis Method: All statistical tests performed by the Sponsor were two -sided and t he level of significance was 0.05. Quantitative variables were summarized by treatment and visit using descriptive statistics. Qualitative variables were summarized by treatment and visit using frequency tables. Treatment groups were compared using chi-square test.
Efficacy analysis was conducted on an intent-to-treat basis. The ITT analysis was performed using last observation carried forward (LOCF). Missing micturition chart data were extrapolated by the principle of last observation carried forward fro m the visit 2 or visit 3. The per-protocol (PP) analyses were regarded as supportive efficacy analyses and were performed without any data imputations.
In both primary and secondary efficacy variables, the change from baseline to end of study was estimated within treatment groups and compared between treatment groups using analysis of covariance (AN COVA). Factors included in the model were the baseline value for the specific variable, treatment, country, and treatment -by- country interaction. If the p-value for the baseline covariate or the treatment -by-country interaction exceeded 0.1, then this factor was to be excluded from the model. Hypothesis testing was conducted using Type III sum of squares. A 95% confidence interval (CI) was calculated using least squares means from the ANCOVA. Even if the assumption of normally distributed was violated, the Sponsor used parametric method for the primary analysis. Non-parametric analysis was conducted and considered as supportive analysis. No adjustments to account for multiple statistical tests were performed.
Subgroup analyses for age , weight, race, and sex were conducted on the efficacy variables that include the number of incontinence episodes per week at 4 and 12 weeks, number of micturitions per 24 hours at 4 and 12 weeks, volume voided per micturition at 4 and 12 weeks, and number of nights with episodes of enuresis per week at 4 and 12 weeks.
2.3.2 Patient Disposition
Table 2 below shows the disposition of patients in the two phase III pediatric studies (Study 008 and Study 020), through 12 weeks of treatment.
Of the 369 randomized patients in study 008, 100 (27.1%) were excluded from the PP population: 70 (27.8%) from the tolterodine PR group and 30 (25.6%) from the placebo group. The most common protocol violation in the tolterodine PR group was taking prohibited medication, accounting for almost 41% of all violations. The most common protocol violation in the placebo group was a Visit 4 that occurred outside ± 14 days of 12 weeks after randomization visit, accounting for 43% of the total violations in the placebo group. In addition, a total of 25 patients withdrew from the study: 17/251 (6.8%) from the tolterodine PR group and 8/117 (6.8%) from the placebo group.
In study 020, of the 252 randomized patients, 89 (35%) subjects were excluded from the PP population: 60 (25.5%) from the tolterodine PR group and 29 (27.1%) from the placebo group. Of these 89 subjects with major protocol violations, 40 of them withdrew from the study: 23 (9.8%) from the tolterodine PR group and 17 (15.9%) from the placebo group. The most common protocol violation in the tolterodine PR group and the placebo group was the missing,
11
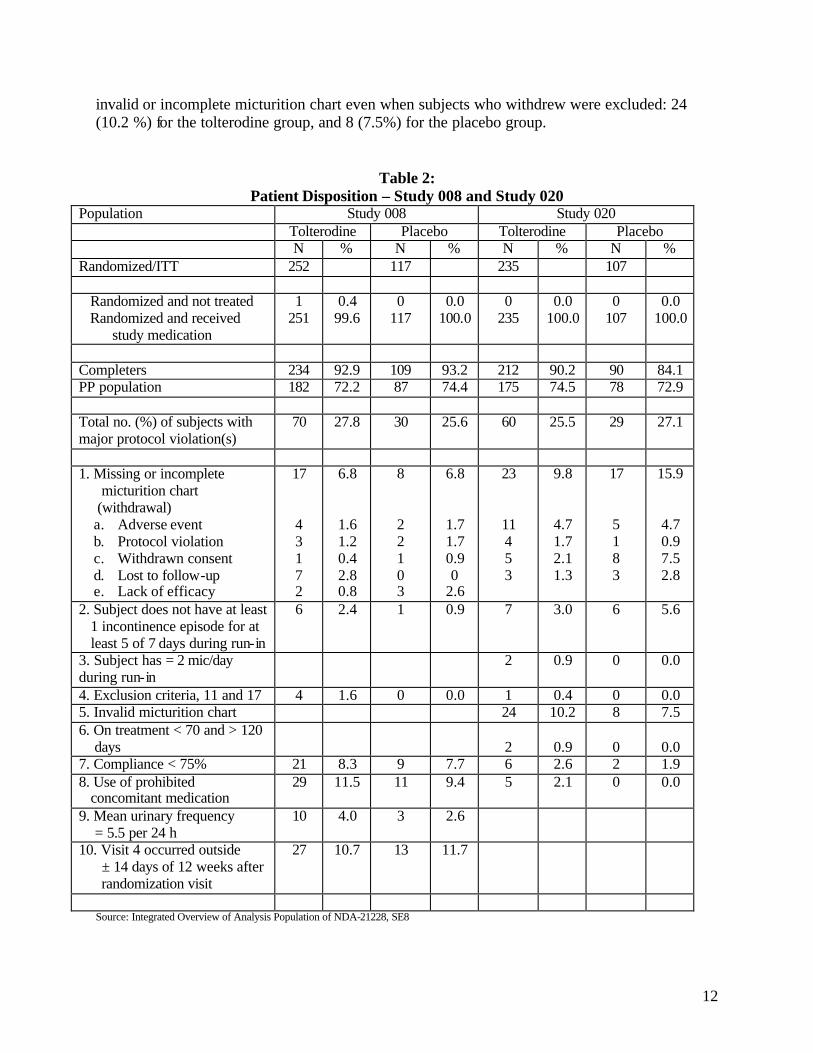
invalid or incomplete micturition chart even when subjects who withdrew were excluded: 24 (10.2 %) for the tolterodine group, and 8 (7.5%) for the placebo group.
Table 2: Patient Disposition – Study 008 and Study 020
Population Study 008 Study 020 Tolterodine Placebo Tolterodine Placebo N % N % N % N %
Randomized/ITT 252 117 235 107
Randomized and not treated Randomized and received
study medication
1 251
0.4 99.6
0 117
0.0 100.0
0 235
0.0 100.0
0 107
0.0 100.0
Completers 234 92.9 109 93.2 212 90.2 90 84.1 PP population 182 72.2 87 74.4 175 74.5 78 72.9
Total no. (%) of subjects with major protocol violation(s)
70 27.8 30 25.6 60 25.5 29 27.1
1. Missing or incomplete micturition chart
(withdrawal) a. Adverse event b. Protocol violation c. Withdrawn consent d. Lost to follow -up e. Lack of efficacy
17
4 3 1 7 2
6.8
1.6 1.2 0.4 2.8 0.8
8
2 2 1 0 3
6.8
1.7 1.7 0.9 0
2.6
23
11 4 5 3
9.8
4.7 1.7 2.1 1.3
17
5 1 8 3
15.9
4.7 0.9 7.5 2.8
2. Subject does not have at least 1 incontinence episode for at
least 5 of 7 days during run-in
6 2.4 1 0.9 7 3.0 6 5.6
3. Subject has = 2 mic/day during run-in
2 0.9 0 0.0
4. Exclusion criteria, 11 and 17 4 1.6 0 0.0 1 0.4 0 0.0 5. Invalid micturition chart 24 10.2 8 7.5 6. On treatment < 70 and > 120
days 2 0.9 0 0.0 7. Compliance < 75% 21 8.3 9 7.7 6 2.6 2 1.9 8. Use of prohibited
concomitant medication 29 11.5 11 9.4 5 2.1 0 0.0
9. Mean urinary frequency = 5.5 per 24 h
10 4.0 3 2.6
10. Visit 4 occurred outside ± 14 days of 12 weeks after randomization visit
27 10.7 13 11.7
Source: Integrated Overview of Analysis Population of NDA-21228, SE8
12
Statistical Reviewer’s Comment:
Both ITT and PP analyses were performed by the Sponsor in both studies. The primary efficacy analyses were based on the ITT population, and supportive efficacy analyses were performed using the PP population. As noted earlier, there were 25 patients who withdrew from the study in 008, which would imply that these patients would have incomplete charts. Last observation carried forward (LOCF) was the method of choice by the sponsor for the primary efficacy analysis. Because adverse event accounted for only 1.6% of the total randomized population, and only 6.8% of the total randomized population withdrew from the study, performing the primary efficacy analysis using LOCF should be acceptable. As an added sensitivity test, efficacy analysis was performed using the completer population. In study 020, there were a total of 47 subjects (20 %) in the tolterodine PR group and 25 subjects (23.4 %) in the placebo group who had missing, incomplete, or invalid charts. Although adverse event s accounted for only 4.7% missing from the total randomized population, there were 36 subjects (15 %) in the to lterodine PR group and 20 subjects (18.7%) in the placebo group that needs to be imputed because of missing or invalid data. Last observation carried forward from the baseline visit or carried backward from the last visit were the extrapolation method used by the sponsor for the primary efficacy analysis in the ITT population. The reviewer does not agree with the last observation carried backward approach used by the Sponsor. Therefore additional analysis, using only subjects with complete and valid micturition charts (i.e. completer), was conducted by the reviewer to assess the sensitivity of the Sponsor’s results.
2.3.3 Demographics and Baseline Characteristics
Tables 3 to 5 des cribe some basic demographic and baseline characteristics of the ITT population in studies 008 and 020. As shown from the tables, the treatment groups were well balanced with respect to their demographic and baseline characteristics. The sponsor noted that there was a slightly lower proportion of males in the tolterodine PR group compared with the placebo in study 008 (50.8 % vs. 55.6) and this reviewer found this not to be significant. Racial distribution, age, body weights, heights, and body mass index (BMI) values were comparable for the two treatment groups in the two studies.
Of the approximately 40 % of patients in each treatment group who reported previous medical treatment for overactive bladder in study 008, 52.9% in the tolterodine PR group and 45.5% in the placebo group reported poor efficacy. The reviewer found that this difference was not statistically significant. In study 020, of the approximately 45% of patients in each treatment group who reported previous medical treatment, 55.6 % in the tolterodine PR group and 68.6% in the placebo group reported poor efficacy. Again this difference was found not to be statistically significant by the reviewer.
In terms of the baseline clinical characteristics in studies 008 and 020, the treatment groups were found to be well-balanced as shown in Table 5.
Demographic and baseline characteristics of the PP and the “Completer” population were similar to those of the ITT population.
13

Table 3: Demographic and Baseline Characteristics for study 008 and 020 – ITT population
Characteristics Study 008 Study 020 Tolterodine Placebo Tolterodine Placebo
N=252 N=117 N=235 N=107 N(%) N (%) N(%) N (%)
Demographic Gender
Male Female
128 (50.8) 124 (49.2)
65 (55.6) 52 (44.4)
127 (54.0) 108 (46.0)
59 (55.1) 48 (44.9)
Age group, y 4 – 6 7 – 8 9 – 11
100 (39.7) 106 (42.1) 46 (18.3)
55 (47.0) 40 (34.2) 22 (18.8)
72 (30.6) 99 (42.1) 64 (27.2)
34 (31.8) 41 (38.3) 32 (29.9)
Race White Black Asian Mixed/multiracial Not listed
225 (89.3) 7 (2.8) 16 (6.3)
4 (1.6)
108 (92.3) 1 (0.9) 5 (4.3)
3 (2.6)
218 (92.8) 0 (0.0) 13 (5.5) 4 (1.7)
100 (93.5) 0 (0.0) 7 (6.5) 0 (0.0)
Mean age (± sd), y 7.44 (1.54) 7.36 (1.49) 7.9 (1.5) 7.9 (1.5)
Baseline Mean weight (± sd), kg
27.5 (10.13) 27.7 (8.78) 28.0 (7.4) 26.1 (6.2) Weight group
< 20 20 – 30
= 30
38 (15.1) 145 (57.5) 69 (27.4)
16 (13.7) 69 (59.0) 32 (27.4)
28 (11.9) 129 (54.9) 78 (33.2)
18 (16.8) 62 (57.9) 27 (25.2)
Mean height (± sd), cm 125.1 (11.2) 125.4 (11.3) 128.5 (10.3) 126.6 (11.6)
Mean BMI (± sd), kg/m2
17.2 (3.94) 17.3 (3.26) 16.7 (2.4) 16.1 (1.7) Metabolizer phenotype
Patients not reporting Extensive Poor
92 (36.5) 155 (61.5)
5 (2.0)
41 (35.0) 72 (61.5) 4 (3.4)
208 (88.5) 11 (4.7) 16 (6.8)
9 (8.4) 91 (85.0) 7 (6.5)
Source: Sponsor’s Clinica l Study Report Tables 9-5 to 9-6 for Study 020, and Tables 6 to 7 for Study 008
14
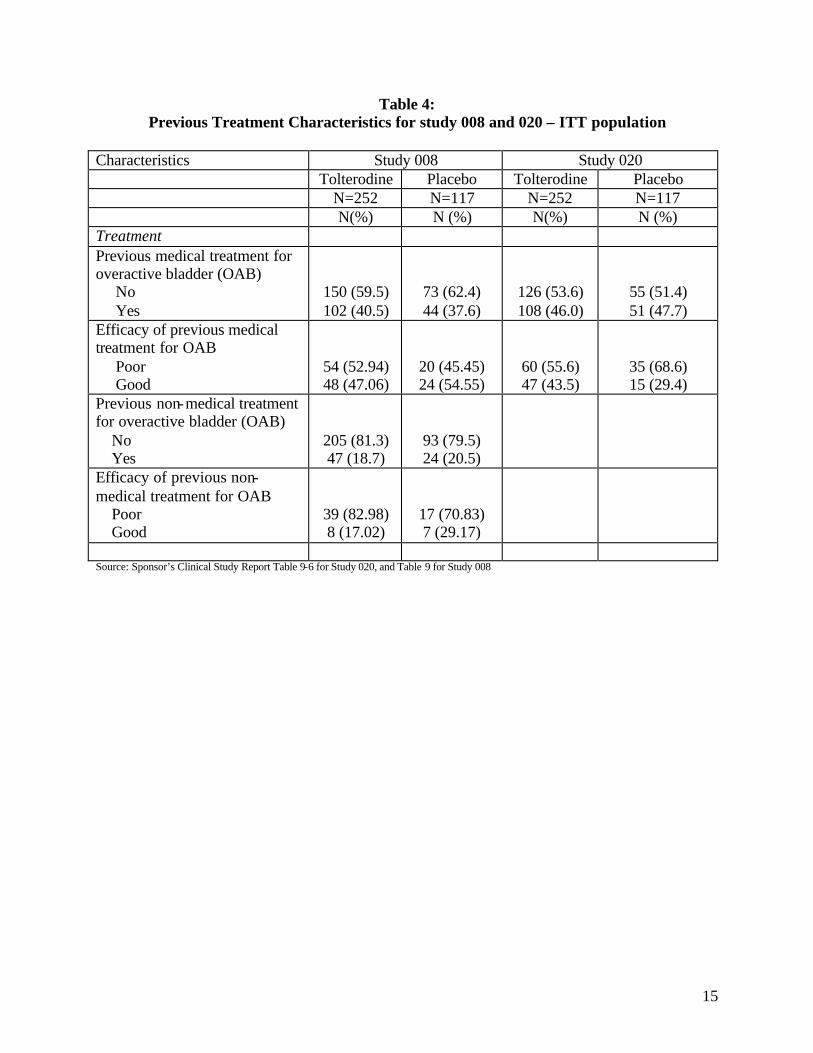
Table 4: Previous Treatment Characteristics for study 008 and 020 – ITT population
Characteristics Study 008 Study 020 Tolterodine Placebo Tolterodine Placebo
N=252 N=117 N=252 N=117 N(%) N (%) N(%) N (%)
Treatment Previous medical treatment for overactive bladder (OAB)
No Yes
150 (59.5) 102 (40.5)
73 (62.4) 44 (37.6)
126 (53.6) 108 (46.0)
55 (51.4) 51 (47.7)
Efficacy of previous medical treatment for OAB
Poor Good
54 (52.94) 48 (47.06)
20 (45.45) 24 (54.55)
60 (55.6) 47 (43.5)
35 (68.6) 15 (29.4)
Previous non-medical treatment for overactive bladder (OAB)
No Yes
205 (81.3) 47 (18.7)
93 (79.5) 24 (20.5)
Efficacy of previous non-medical treatment for OAB
Poor Good
39 (82.98) 8 (17.02)
17 (70.83) 7 (29.17)
Source: Sponsor’s Clinical Study Report Table 9-6 for Study 020, and Table 9 for Study 008
15
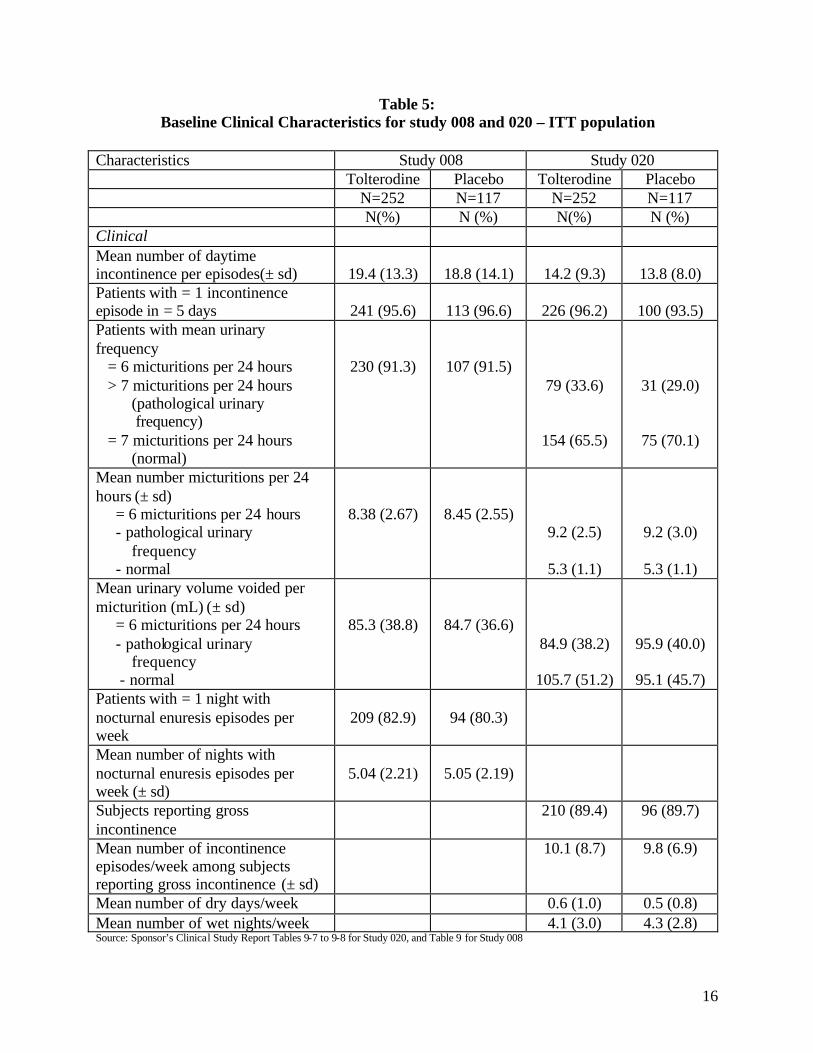
Table 5: Baseline Clinical Characteristics for study 008 and 020 – ITT population
Characteristics Study 008 Study 020 Tolterodine Placebo Tolterodine Placebo
N=252 N=117 N=252 N=117 N(%) N (%) N(%) N (%)
Clinical Mean number of daytime incontinence per episodes(± sd) 19.4 (13.3) 18.8 (14.1) 14.2 (9.3) 13.8 (8.0) Patients with = 1 incontinence episode in = 5 days 241 (95.6) 113 (96.6) 226 (96.2) 100 (93.5) Patients with mean urinary frequency
= 6 micturitions per 24 hours > 7 micturitions per 24 hours
(pathological urinary frequency)
= 7 micturitions per 24 hours (normal)
230 (91.3) 107 (91.5) 79 (33.6)
154 (65.5)
31 (29.0)
75 (70.1)
Mean number micturitions per 24 hours (± sd)
= 6 micturitions per 24 hours - pathological urinary
frequency - normal
8.38 (2.67) 8.45 (2.55) 9.2 (2.5)
5.3 (1.1)
9.2 (3.0)
5.3 (1.1) Mean urinary volume voided per micturition (mL) (± sd)
= 6 micturitions per 24 hours - pathological urinary
frequency - normal
85.3 (38.8) 84.7 (36.6) 84.9 (38.2)
105.7 (51.2)
95.9 (40.0)
95.1 (45.7) Patients with = 1 night with nocturnal enuresis episodes per week
209 (82.9) 94 (80.3)
Mean number of nights with nocturnal enuresis episodes per week (± sd)
5.04 (2.21) 5.05 (2.19)
Subjects reporting gross incontinence
210 (89.4) 96 (89.7)
Mean number of incontinence episodes/week among subjects reporting gross incontinence (± sd)
10.1 (8.7) 9.8 (6.9)
Mean number of dry days/week 0.6 (1.0) 0.5 (0.8) Mean number of wet nights/week 4.1 (3.0) 4.3 (2.8) Source: Sponsor’s Clinica l Study Report Tables 9-7 to 9-8 for Study 020, and Table 9 for Study 008
16
2.3.4 Applicant’s Efficacy Results and Statistical Reviewer’s Results and Discussion
2.3.4.1 Primary Efficacy Variables
The primary efficacy endpoint in both studies 008 and 020 was the change from baseline in number of daytime incontinence episodes/week after 12 weeks of treatment. Incontinence in both stud ies was defined as the sum of “gross” incontinence episodes plus “dampness ” episodes. In study 020, 7-day micturition charts for baseline data were collected on visit 2 (inclusion or randomization period) and another micturition chart for the last 7 days o n study medication were collected on visit 4 (after 12 weeks of treatment). In study 008, additional 7-day micturition chart was collected at Week 4.
Statistical Reviewer’s Comment
Following Amendment 3 of study 020 dated January 3, 2001, the variable “dampness episodes” was added to the micturition chart for all countries except for the United Kingdom (UK). The reason for excluding UK was that the timelines for Ethics approval in UK did not allow a late modification of the micturition diary for this country. In order to investigate the possible effects of different recording of events in the UK, the analysis of the primary efficacy variable (i.e. total number of incontinence episodes) was repeated by the Sponsor omitting the UK centers. This reviewer not es that it is also important to investigate this subgroup on subjects with pathological urinary frequency as well as the normal subgroup.
Review and Analysis of Primary Efficacy Variable:
In Table 6, a brief summary of the Sponsor’s findings to the primary efficacy endpoint in both study 008 and 020 is presented. Based on their statistical and analytical plan for study 020, the sponsor performed analysis of variance method to test the null hypothesis of no treatment difference between the tolterodine PR group and the placebo group in the ITT population. The analysis of treatment by country interaction was not considered by the sponsor because they expected small number of subjects to be in most centers. Based on the sponsor’s recruitment summary (Table 7 ), this assumption may be incorrect. As indicated in Table 7, there were some variations in the number of subjects who participated in the study from each country. In addition, the recruitment summary of study 008 (also pr esented in Table 7 ) was comparable to that of study 020. In study 008, the sponsor’s primary efficacy analysis was an analysis of covariance (ANCOVA) test with baseline value of the primary efficacy variable, country, and treatment by country interaction as covariates to the main predictor variable “treatment” to test treatment difference. In order to address the possible effects of country in the primary efficacy analysis, this reviewer conducted ANCOVA test on study 020. In addition, nonparametric analysis using stratified Wilcoxon test using country as stratification factor was also conducted by the reviewer as a supportive analysis.
In Table 6, results based on per-protocol population and completer population, are also provided. Per-protocol population is defined as any subject who did not have any protocol violations or who did not withdraw from the study. Completer population on the other hand is defined as any subjects who did not have any missing or incomplete incontinence data.
17

Table 6: Summary of the results from the primary e fficacy analysis in study 008 and 020, N Baseline Week 4 Week 12 Change
From baseline to
week 4
LSmean Diff
p-value 1
p-value 2
p-value 3
Change From
baseline to week 12
LS Mean Diff
p-value 1
p-value 2
p-value 3
Mean (SD) Med Mean (SD) Med Mean (SD) Med Study 020 ITT population - Tolderodine 235 14.2 (9.3) 11.4 8.9 (9.1) 7.0 -5.3 (7.6) 0.0689
- Placebo 107 13.8 (8.0) 12.0 10.0 (8.7) 8.0 -3.8 (6.0) -1.5 0.0607 0.0822
PP population - Tolderodine 175 14.5 (9.4) 12.6 8.2 (8.5) 6.0 -6.3 (7.9) 0.1321*
- Placebo 78 14.4 (8.2) 12.4 9.6 (9.0) 7.0 -4.8 (6.7) -1.6 0.0856 0.2010
Completer ** - Tolderodine 205 14.1 (9.2) 11.7 8.0 (8.5) 6.0 -6.1 (7.9) -1.5 0.0815 2
- Placebo 86 14.1 (8.2) 12.0 9.5 (8.9) 7.0 -4.7 (6.4) 0.2100 3
Study 008 ITT population - Tolderodine 252 19.4 (13.3) 16.0 11.9 (12.7) 8.0 9.3 (11.8) 5.0 -7.4 (9.7) -1.68 0.088 *** -10.0 (12.2) -0.87 0.403 ***
- Placebo 117 18.8 (14.1) 14.0 13.3 (12.9) 11.0 10.0 (10.1) 7.0 -5.5 (9.7) 0.0228 3 -8.8 (11.1) 0.0911 3
PP population - Tolderodine 182 19.8 (13.3) 16.2 12.2 (13.4) † 8.5 † 8.6 (11.3) 5.0 -7.7 (9.1) -1.1 0.3404 2 -11.2 (11.7) -1.1 0.317 ***
- Placebo 87 19.2 (14.0) 14.0 13.0 (12.6) 10.0 9.6 (9.7) 7.0 -6.2 (9.6) 0.1449 3 -9.6 (10.8) 0.0908
Completer ‡ - Tolderodine 19.2 (13.1) 16.0 11.5 (12.3) 8.0 9.1 (11.7) 5.0 -7.7 (9.8) -1.7 0.0766 -10.3 (11.6) -0.8 0.4709
- Placebo 18.4 (13.2) 14.0 12.8 (11.7) 11.0 9.8 (10.0) 7.0 -5.6 (9.7) 0.0117 -9.4 (11.0) 0.1066 1 Sponsor’s p-value ANOVA 2 Reviewer’s p-value using ANCOVA with baseline value, treatment, country, and treatment by country interaction if p < 0.1 3 Reviewer’s p-value using stratified Wilcoxon test using Country as stratification factor * Sponsor’s result was p=0.1281 ** Reviewer’s additional analyses; Completer is defined as subjects who have complete micturition chart *** Sponsor’s p -value using ANCOVA with baseline value, treatment, country, and treatment by country interaction if p < 0.1 † Sponsor’s result is: mean = 11.5 (sd=11.9) and median=8.0 ‡ Completers are subjects who completed micturition chart (no imputation needed). For visit 3, N=358 (Rx=243, Pl=115), for visit 4, N=348 (Rx=237, Pl=111). The baseline values are a little off for Week 12
18

Table 7: Subject recruitment summarized by Country
Study 020:
Study 008:
19
Based on the results from Table 6, there was evidence of improvement in the primary efficacy endpoint based on the mean change from baseline to week 12 in the number of incontinence episodes per week in both the tolterodine PR and the placebo groups (mean reduction from baseline o f 5.3 (± 7.6) and 3.8 (± 6.0), respectively) in the ITT population of Study 020. The re was also clear reduction from baseline in the mean number of incontinence episodes per week in the ITT population of Study 008 in both the treatment group (10.0 (± 12.2)) and the placebo group (8.8 (± 11.1)). These improvements also marked the differences between the two treatment groups favoring the tolterodine PR group (estimated mean difference (± standard error of the mean [SEM]) of 1.54 (±0.84) incontinence episodes per week in Study 020, and a least square estimated mean difference of 0.87 in Study 008). However these differences were smaller than expected and the differences did no t reach statistical significance. These results were consistent using different populations (i.e. PP or completer) and using different statistical tests (i.e. ANCOVA or non-parametric Wilcoxon rank sum test).
As part of Sponsor´s exploratory analyses, two separate subgroups were identified by the Sponsor based on subjects´ baseline micturitions per 24 hours or urinary frequency. Subjects were defined as having pathological urinary frequency when they have more than 7 micturitions per 24 hours at baseline, and subjects were defined as normal when they have at most 7 micturitions per 24 hours. The results from the exploratory analysis of the primary efficacy variable for subject with pathological urinary frequency and normal urinary frequency at baseline are also presented in Table 16. Note that because the analysis is exploratory, the results should be interpreted with caution. The result s from Table 16 showed significant difference in the mean change from baseline in the number of incontinence episodes per week between the tolterodine PR and the placebo using ANOVA and a non-parametric method among subjects with pathological urinary frequency. However, different conclusion can be reached when ANCOVA is used.
Exclusion of data from UK due to difference in recordings
In order to investigate the possible effects of different recording of eve nts in the UK, the analysis of the primary efficacy variable (i.e. total number of incontinence episodes) was repeated by the Sponsor and the statistical reviewer omitting the UK centers. The statistical reviewer also investigated the non-UK population sub group on subjects with pathological urinary frequency as well as the normal subgroup to determine whether there is significant difference betwee n the treatment groups. Table 8 presents the results of the primary efficacy variable in the non-UK population, as well as the results from the subgroup analysis between subjects with pathological urinary frequency and subjects with normal urinary frequency. From Table 8, it showed that there was a reduction of approximately 1.7 incontinence episodes per week in the treatment group compared to the control group in the ITT population. However this difference did not reach statistical significance of 0.05 using either the ANOVA method or Wilcoxon method. Comparing the treatment groups in either the PP population or the completer population also did not reach statistical significance. Stratifying subjects based on their urinary frequency did not produce any significant findings.
20

Statistical Reviewer Conclusion on the Primary Efficacy Analysis : The statistical reviewer finds no evidence of treatment difference in the number of incontinence episodes per week in the ITT, per-protocol (PP) or completer population. The statistical reviewer also finds no statistical significance difference existed in the non-UK population in the number of incontinence episodes per week. Overall, not enough evidence can warrant the efficacy of tolterodine PR in this population.
21

Table 8: Summary of results from primary efficacy subgroup (urinary frequenc y) analyses for Study 020 – Non-UK Population
N Baseline Week 12 Change From
baseline to week 12
LSmean Diff
p-value 1
p-value 2
Mean (SD) Median Mean (SD) Median ITT population
- Tolterodine 198 14.2 (9.1) 11.7 8.7 (8.6) 7.0 -5.6 (7.8) 0.0516* - Placebo 91 13.8 (7.6) 12.0 10.0 (8.7) 8.0 -3.8 (5.6) -1.7 0.0471
0.0892 • Pathological
- Tolterodine 63 16.0 (11.0) 7.0 9.2 (10.9) 7.0 -6.8 (10.8) -3.69 0.1296 - Placebo 22 15.3 (9.2) 7.0 12.8 (10.0) 8.8 -2.5 (6. 4) 0.0899
• Normal - Tolterodine 135 13.4 (7.9) 11.2 8.4 (7.4) 13.0 -5.0 (5.8) -0.81 0.3035 - Placebo 69 13.3 (7.0) 11.7 9.1 (8.1) 13.0 -4.2 (5.3) 0.5561
PP population - Tolterodine 153 14.5 (9.2) 12.6 8.0 (8.2) 6.0 -6.5 (7.9) 0.0838** - Placebo 68 14.2 (7.5) 12.8 9.6 (8.9) 7.0 -4.6 (6.1) -1.9 0.0554
0.1618 • Pathological
- Tolterodine 54 15.9 (11.2) 13.0 8.6 (10.5) 6.0 -7.3 (10.8) -3.0 0.2453 - Placebo 18 14.7 (8.1) 12.9 11.6 (8.8) 8.1 -3.0 (7.0) 0.1938
• Normal - Tolterodine 99 13.7 (7.9) 12.0 7.7 (6.7) 6.0 -6.0 (5.8) -1.1 0.2432 - Placebo 50 14.0 (7.4) 12.4 8.8 (8.9) 7.0 -5.2 (5.7) 0.7745
Completer Population - Tolterodine 179 14.2 (9.0) 11.8 8.0 (8.3) 6.0 -6.2 (8.0) -1.6 0.0741 - Placebo 77 13.9 (7.6) 12.4 9.4 (8.8) 7.0 -4.5 (5.9) 0.1949
• Pathological - Tolterodine 58 16.0 (11.0) 13.5 8.6 (10.7) 5.9 -7.4 (11.1) -3.1 0.2275 - Placebo 19 14.1 (8.2) 12.8 11.2 (8.8) 8.0 -2.9 (6.8) 0.1279
• Normal - Tolterodine 120 13.3 (7.8) 11.2 7.7 (6.9) 6.0 -5.6 (5.8) -0.7 0.3866 - Placebo 57 13.9 (7.5) 12.0 8.8 (8.8) 7.0 -5.1 (5.5) 0.9847
1 Reviewer’s p-value using ANCOVA with baseline value, treatment, country, and treatment by country interaction if p < 0.1 2 Reviewer’s p-value using stratified Wilcoxon test using Country as stratification factor * Sponsor’s p -value using ANOVA ** Sponsor’s p -value from ANOVA; Reviewer’s p -value from ANOVA = 0.0864
22
2.3.4.2 Secondary Efficacy Variables
Review and Analysis of Secondary Variables:
A. Study 020:
In this study, the Sponsor analyzed several secondary variables that include the number of micturitions per 24 hours, mean urinary volume voided per micturition, subject’s well-being as measured by the Vis ual Analogue scale for children, parent/guardian-assessed treatment benefit, number of dry days per week, number of wet nights per week, and the proportion of subjects who were continent during waking hours at the end of the study. In addition, the sponsor also performed analyses on the number of micturitions per 24 hours and urinary volume voided per micturition for two separate subgroups, those with normal urinary frequency at baseline (i.e. at most 7 micturitions per 24 hours), and those with pathological urinary frequency at baseline (i.e. more than 7 micturtions per 24 hours). Because of the exploratory nature of the analyses, statistical significance and p-values should be interpreted with caution.
Tables 9 to 11 present the results from secondary efficacy analyses. The results showed that although there was some small reduction in mean number of micturitions per 24 hour, some reduction in gross incontinenc e during waking hours, as well as improvements in the mean volume voided per micturitions, number of dry days and wet nights per week, these reductions in each of the treatment groups did not account for statistically significant difference between the two treatment groups. Performing subgroup analyses on the number of micturitions per 24 hours based on subjects’ baseline urinary frequency did not change the initial findings.
In terms of urinary volume voided per micturition, s ubjects in the tolterodine PR group showed significant increase from baseline compared to the placebo. This difference resulted to a statistically significant finding in the ITT population using ANCOVA. Further analyses showed that subjects with pathological urinary frequency benefited from the tolterodine PR in terms of urinary volume voided per micturition, compared to subjects in the normal group (i.e. at least 7 micturitions per 24 hours). However, the results from the PP population and the completer population were not consistent to those seen for the ITT population suggesting possible bias in the population. Therefore, any significant findings shown here are to be treated with caution.
Mean changes from baseline in each of the six VASC subscales were depicted for each treatment groups in Figure 1 for the ITT and PP population taken from Sponsor’s report. The Sponsor indicated in their report that a positive value in change from baseline indicates improvement. Eyeballing the figures showed that more improvement is evident in the placebo group compared to the tolterodine PR group in all VASC measurement scales. The results generated by the reviewer by repeating the descriptive analyses in the PP population produced different results from that of the Sponsors ́ . The reason for these d ifferences is unknown. The refore graphically, the reviewer’s output will produce slight ly different figure for PP population from that of Figure 1. As indicated in Table 12 under PP population, all
23

VASC scores from the placebo group we re higher than the to lterodine PR group. The statistical reviewer performed exploratory analyses on the VASC scores in the Study 020 for both ITT population and PP population using Wilcoxon rank -sum test without stratification. The results are also presented in Table 12. As expected, there was no statistically significant difference between the two treatment groups, except for stability scores in the PP population. Interpretation of this difference should be reported with caution since the result may be bias due to multiplicity.
The perception of treatment benefit, as assessed by the parent or guardian, showed that there was some benefit from tolterodine compared to the placebo. This difference (at least 15%) was statistically significant as reported by the Sponsor (p=0.0098; 95% CI = 3.7%, 27.1%). Similar result was obtained by the Sponsor using PP population, with at least 16.5% difference in percentages of subjects perceived as receiving at least some benefit from treatment compared to the control (p=0.0134; 95% CI = 3.4%, 29.7%).
There was no statistically or clinically significant difference between the two treatment groups in the proportions of subjects who were continent (i.e. had no episodes of “gross” incontinence or dampness) at Week 12. The sponsor reported that 12.4% subjects in the tolterodine PR group were continent, compared with 11.3% of placebo subjects (p=0.2385 using chi-square test; p=0.0645 using Wilcoxon rank sum test). Numerically, the proportion of subjects categorized as having “moderate to good” improvement favored tolterodine PR treatment, 32.1% vs. 18.9%.
24
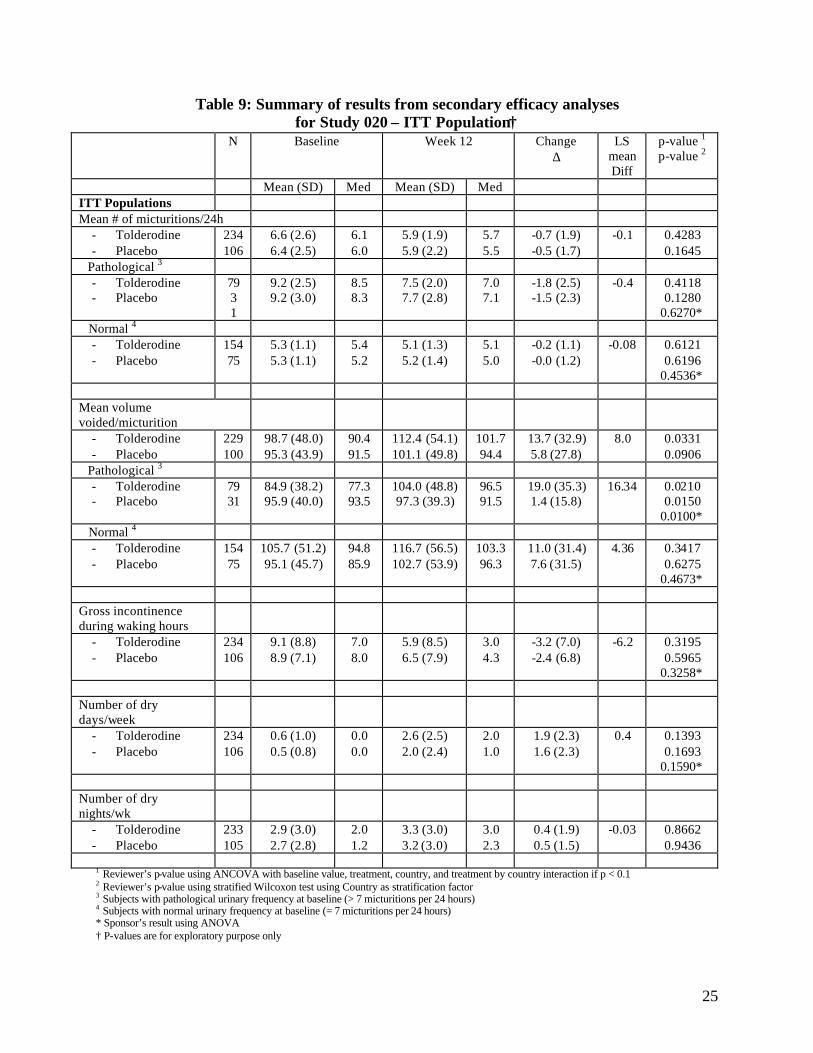
Table 9: Summary of results from secondary efficacy analyses for Study 020 – ITT Population†
N Baseline Week 12 Change D
LS mean Diff
p-value 1
p-value 2
Mean (SD) Med Mean (SD) Med ITT Populations Mean # of micturitions/24h
- Tolderodine - Placebo
234 106
6.6 (2.6) 6.4 (2.5)
6.1 6.0
5.9 (1.9) 5.9 (2.2)
5.7 5.5
-0.7 (1.9) -0.5 (1.7)
-0.1 0.4283 0.1645
Pathological 3
- Tolderodine - Placebo
79 3 1
9.2 (2.5) 9.2 (3.0)
8.5 8.3
7.5 (2.0) 7.7 (2.8)
7.0 7.1
-1.8 (2.5) -1.5 (2.3)
-0.4 0.4118 0.1280
0.6270* Normal 4
- Tolderodine - Placebo
154 75
5.3 (1.1) 5.3 (1.1)
5.4 5.2
5.1 (1.3) 5.2 (1.4)
5.1 5.0
-0.2 (1.1) -0.0 (1.2)
-0.08 0.6121 0.6196
0.4536*
Mean volume voided/micturition
- Tolderodine - Placebo
229 100
98.7 (48.0) 95.3 (43.9)
90.4 91.5
112.4 (54.1) 101.1 (49.8)
101.7 94.4
13.7 (32.9) 5.8 (27.8)
8.0 0.0331 0.0906
Pathological 3
- Tolderodine - Placebo
79 31
84.9 (38.2) 95.9 (40.0)
77.3 93.5
104.0 (48.8) 97.3 (39.3)
96.5 91.5
19.0 (35.3) 1.4 (15.8)
16.34 0.0210 0.0150
0.0100* Normal 4
- Tolderodine - Placebo
154 75
105.7 (51.2) 95.1 (45.7)
94.8 85.9
116.7 (56.5) 102.7 (53.9)
103.3 96.3
11.0 (31.4) 7.6 ( 31.5)
4. 36 0.3417 0.6275
0.4673*
Gross incontinence during waking hours
- Tolderodine - Placebo
234 106
9.1 (8.8) 8.9 (7.1)
7.0 8.0
5.9 (8.5) 6.5 (7.9)
3.0 4.3
-3.2 (7.0) -2.4 (6.8)
-6.2 0.3195 0.5965
0.3258*
Number of dry days/week
- Tolderodine - Placebo
234 106
0.6 (1.0) 0.5 (0.8)
0.0 0.0
2.6 (2.5) 2.0 (2.4)
2.0 1.0
1.9 (2.3) 1.6 (2.3)
0.4 0.1393 0.1693
0.1590*
Number of dry nights/wk
- Tolderodine - Placebo
233 105
2.9 (3.0) 2.7 (2.8)
2.0 1.2
3.3 (3.0) 3.2 (3.0)
3.0 2.3
0.4 (1.9) 0.5 (1.5)
-0.03 0.8662 0.9436
1 Reviewer’s p-value using ANCOVA with baseline value, treatment, country, and treatment by country interaction if p < 0.1 2 Reviewer’s p-value using stratified Wilcoxon test using Country as stratification factor 3 Subjects with pathological urinary frequency at baseline (> 7 micturitions per 24 hours)4 Subjects with normal urinary frequency at baseline (= 7 micturitions per 24 hours) * Sponsor’s result using ANOVA † P-values are for exploratory purpose only
25

Table 10: Summary of results from secondary efficacy analyses for Study 020 – PP Population †
N Baseline Week 12 Change D
LS mean Diff
p-value 1
p-value 2
Mean (SD) Med Mean (SD) Med Mean # of micturitions/24h
- Tolderodine - Placebo
175 78
6.8 (2.6) 6.5 (2.8)
6.3 6.0
6.0 (1.9) 6.0 (2.4)
5.7 5.5
-0.9 (2.0) -0.6 (2.0)
-0.2 0.4168 0.1024
Pathological 3
- Tolderodine - Placebo
66 24
9.3 (2.6) 9.5 (3.3)
8.7 8.5
7.4 (2.0) 7.5 (3.2)
7.0 6.6
-1.9 (2.6) -1.9 (2.4)
-0.2 0.6780 0.4714
Normal 4
- Tolderodine - Placebo
109 54
5.4 (0.97) 5.2 (1.0)
5.4 5.2
5.08 (1.2) 5.3 (1.5)
5.1 4.9
-0.3 (1.1) 0.01 (1.4)
-0.2 0.2663 0.2838
Mean volume voided/micturition
- Tolderodine - Placebo
169 70
93.0 (43.1) 96.4 (46.5)
87.5 92.1
109.2 (50.9) 103.9 (53.8)
101.7 92.3
16.6 (34.5) 8.3 (33.1)
15.4 0.1389 0.1679
Pathological 3
- Tolderodine - Placebo
63 21
83.4 (39.0) 91.0 (42.2)
75.7 84.3
101.3 (47.7) 94.1 (39.9)
95.7 82.6
19.8 (35.6) 2.3 (19.5)
16.6 0.0723 0.0725
Normal 4
- Tolderodine - Placebo
106 49
98.8 (44.6) 98.7 (48.4)
94.2 96.0
114.2 (52.4) 108.3 (58.8)
103. 5 98.3
14.6 (33.8) 10.8 (37.4)
3.9 0.5345 0.7154
Gross incontinence during waking hours
- Tolderodine - Placebo
175 78
9.1 (8.7) 9.1 (7.7)
7.0 8.1
5.6 (8.0) 6.1 (8.5)
3.0 2.9
-3.6 (7.6) -3.0 (7.6)
-0.7 0.4610 0.9685
Number of dry days/week
- Tolderodine - Placebo
175 78
0.6 (0.8) 0.4 (0.7)
0.0 0.0
2.7 (2.4) 2.3 (2.5)
2.0 1.2
2.1 (2.3) 1.9 (2.4)
0.2 0.5077 0.4714
Number of dry nights/wk
- Tolderodine - Placebo
174 77
2.8 (2.9) 2.8 (2.9)
1.6 1.4
3.2 (3.0) 3.4 (3.1)
3.0 4.0
0.4 (2.1) 0.5 (1.6)
-0.1 0.6474 0.9577
1 Reviewer’s p-value using ANCOVA with baseline value, treatment, country, and treatment by country interaction if p < 0.1 2 Reviewer’s p-value using stratified Wilcoxon test using Country as stratification factor 3 Subjects with pathological urinary frequency at baseline (> 7 micturitions per 24 hours) 4 Subjects with normal urinary frequency at baseline (= 7 micturitions per 24 hours) * Sponsor’s result using ANOVA † P-values are for exploratory purpose only
26

Table 11: Summary of results from secondary efficacy analyses for Study 020 – Completer Population†
N Baseline Week 12 Change D
LS mean Diff
p-value 1
p-value 2
Mean (SD) Med Mean (SD) Med Mean # of micturitions/24h
- Tolderodine - Placebo
205 86
6.7 (2.6) 6.5 (2.7)
6.3 6.0
5.9 (1.9) 5.9 (2.3)
5.7 5.3
-0.8 (2.0) -0.6 (1.9)
-0.1 0.6612 0.2577
Pathological 3
- Tolderodine - Placebo
73 25
9.3 (2.6) 9.4 (3.2)
8.6 8.3
7.3 (1.9) 7.5 (3.1)
7.0 6.7
-1.9 (2.6) -1.9 (2.4)
-0.3 0.52 12 0.3593
Normal 4
- Tolderodine - Placebo
132 61
5.3 (1.1) 2.3 (1.1)
5.4 5.2
5.1 (1.3) 5.2 (1.5)
5.1 4.9
-0.2 (1.2) -0.06 (1.3)
-0.06 0.7235 0.7477
Mean volume voided/micturition
- Tolderodine - Placebo
204 81
96.3 (46.0) 95.1 (45 .2)
88.9 88.1
111.6 (53.5) 102.2 (52.2)
101.7 95.3
15.3 (34.5) 7.1 (30.8)
8.0 0.0660 0.1416
Pathological 3
- Tolderodine - Placebo
72 24
83.7 (38.8) 93.5 (42.4)
75.8 89.8
104.3 (50.2) 95.3 (41.6)
95.7 82.6
20.6 (36.3) 1.8 (17.7)
18.5 0.0263 0.0304
Normal 4
- Tolderodine - Placebo
132 57
103.1 (48.3) 95.8 (46.7)
94.4 88.1
115.6 (55.0) 105.2 (56.2)
103.8 98.3
12.5 (33.2) 9.4 (34.7)
3.7 0.4864 0.7797
Gross incontinence during waking hours
- Tolderodine - Placebo
205 86
8.8 (8. 4) 8.9 (7.4)
7.0 8.0
5.2 (7.8) 6.0 (8.3)
2.3 2.8
-3.6 (7.4) -3.0 (7.5)
-0.8 0.3107 0.9939
Number of dry days/week
- Tolderodine - Placebo
205 86
0.6 (0.9) 0.5 (0.8)
0.0 0.0
2.9 (2.5) 2.4 (2.6)
2.3 1.2
2.2 (2.4) 1.9 (2.4)
0.3 0.3161 0.3632
Number of dry nights/wk
- Tolderodine - Placebo
204 86
2.8 (2.9) 2.7 (2.9)
1.5 1.2
3.3 (3.0) 3.3 (3.0)
3.3 2.6
0.5 (2.1) 0.6 (1.6)
-0.1 0.7040 0.9813
1 Reviewer’s p-value using ANCOVA with baseline value, treatment, country, and t reatment by country interaction if p < 0.1 2 Reviewer’s p-value using stratified Wilcoxon test using Country as stratification factor 3 Subjects with pathological urinary frequency at baseline (> 7 micturitions per 24 hours) 4 Subjects with normal urinary frequency at baseline (= 7 micturitions per 24 hours) * Sponsor’s result using ANOVA † P-values are for exploratory purpose only
27

Table 12: VASC Scores for Study 020 – ITT and PP population†
N Baseline Week 12 Change D
Mean Diff
p-value 1
Mean (SD) Med Mean (SD) Med ITT Population
Alertness - Tolderodine - Placebo
65 34
70.6 (12.7) 70.0 (12.0)
71.8 66.6
72.4 (14.9) 72.4 (11.6)
76.4 73.2
1.8 (14.5) 2.9 (12.6)
-1.1 0.4017
Self -Esteem - Tolderodine - Placebo
66 34
61.9 (13.8) 63.4 (14.6)
60.6 62.4
65.0 (15.4) 68.4 (15.6)
65.3 69.9
3.9 (14.5) 5.8 (12.9)
-1.9 0.5466
Mood - Tolderodine - Placebo
67 34
70.5 (19.9) 71.3 (16.4)
73.0 72.0
72.3 (19.8) 74.7 (15.9)
74.4 73.5
-0.0 (23.3) 3.6 (14.5)
-3.7 0.5956
Inhibition - Tolderodine - Placebo
67 34
47.7 (16.7) 47.6 (15.0)
43.8 48.8
48.4 (17.5) 48.0 (13.0)
46.3 48.2
-0.6 (13.9) 1.1 (12.5
-1.7 0.6711
Stability - Tolderodine - Placebo
66 34
64.8 (18.9) 64.0 (20.2)
64.9 66.6
67.0 (17.7) 70.8 (15.6)
67.6 69.3
0.6 (20.3) 8.1 (18.7)
-7.6 0.1296
Litheness - Tolderodine - Placebo
67 34
66.4 (18.0) 69.4 (13.6)
64.7 65.5
66.9 (17.5) 72.4 (14.8)
64.8 70.3
-0.4 (16.6) 2.6 (12.9)
-3.0 0.5897
PP Population Alertness - Tolderodine - Placebo
42 24
70.2 (12.6) 68.1 (10.1)
70.8 71.1
70.7 ( 15.0) 69.7 ( 11.0)
75.2 70.8
0.7 ( 13.3) 1.6 ( 13.2)
-0.9 0.3979
Self -Esteem - Tolderodine - Placebo
42 24
58.7 ( 12.4) 61.8 ( 14.6 )
58.2 62.0
61.9 ( 13.8) 65.9 ( 15.5)
61.7 65.7
3.4 ( 15.3) 3.7( 11.9)
-0.3 0.7181
Mood - Tolderodine - Placebo
43 25
71.2 ( 18.3) 67.9 ( 16.5 )
73.0 71.1
71.0 ( 17.8) 73.2 ( 15.7)
72.0 73.0
-2.4 (20.5) 5.53 ( 12.9)
-7.9 0.3918
Inhibition - Tolderodine - Placebo
43 24
49.9 ( 17.4) 48.9 ( 14.4 )
49.5 50.1
50.0 ( 18.8) 49.1 ( 11.8)
48.0 49.0
-0.9 (15.5) 0.1 ( 13.4)
-1.0 0.8930
Stability - Tolderodine - Placebo
42 24
63.8 ( 20.2) 59.5 ( 18.6)
64.9 60.5
65.7 ( 16.9) 70.0 ( 12.8)
66.0 69.0
0.2 ( 19.7) 10.8 ( 20.0)
-10.6 0.0270
Litheness - Tolderodine - Placebo
43 24
67.3 ( 18.5) 70.0 ( 12.8)
65.0 67.7
67.3 ( 16.9) 69.9 ( 13.7)
65.7 66.3
-0.2 (16.6) -0.4 (10.2)
0.2 0.6607
1 Reviewer’s p-value using stratified Wilcoxon rank sum test † P-values are for exploratory purpose only
28
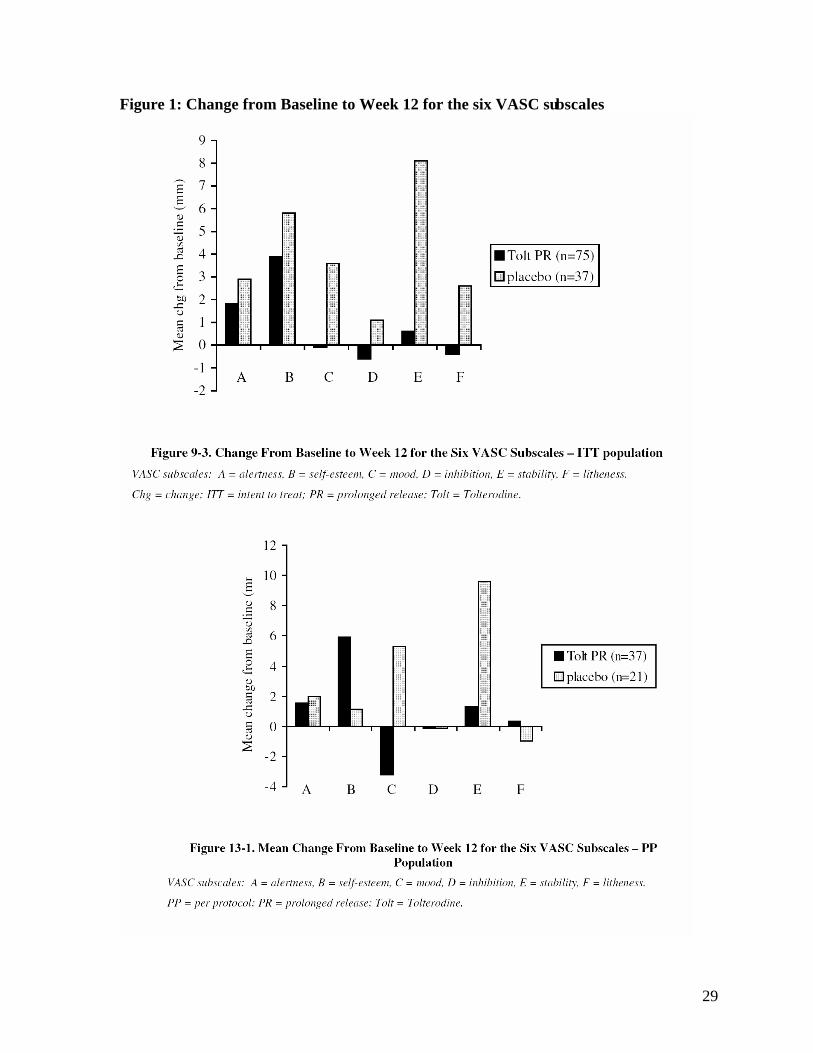
Figure 1: Change from Baseline to Week 12 for the six VASC subscales
29
B. Study 008
In this study, the Sponsor analyzed several secondary variables that include the number of daytime incontinence episodes per week after 4 weeks of treatment; mean number of micturitions per 24 hours after 4 weeks and after 12 weeks of treatment ; mean urinary volume voided per micturition after 4 weeks and after 12 weeks of treatment; number of nights with nocturnal enuresis per week after 4 weeks and after 12 weeks of treatment ; change in the PEMQoL after 12 weeks of treatment; and treatment satisfaction after 12 weeks of treatment
The statistical reviewer performed additional analyses that include non-parametric test, and repeating the same analyses in PP and completer population. The results are presented in Tables 13 to 15. Note that because of the explorato ry nature of the analyses, statistical significance and p-values must be interpreted with caution.
As indicated by the Sponsor in their report, as well as the reviewer’s analyses, although there were reductions in the number of daytime incontinence episodes per week after 4 and 12 weeks of treatment in each of the treatment groups, the difference in the reduction between the two groups was small and not statistically significant. There was only a reduction of 1.68 incontinence episodes per week in the tolterodine PR group compared to the placebo at Week 4 (95% CI =-3.62, 0.25, p=0.088), and a much smaller reduction (i.e. 0.87 incontinence episodes per week favoring tolterodine PR group) at Week 12. The same can be said of the mean number of micturitions per 24 hour and the number of nights with nocturnal enuresis at Week 4 and Week 12, where only very small reduction was evident when tolterodine PR group was compared to the placebo group (Table 13). In fact, there was a small increase in the number of micturitions per 24 hours in the tolterodine PR group compared to the control at Week 12 (i.e. 0.07 mic/24h, p=0.721). All these differences were not statistically significant.
There was a statistically significant difference in favor of tolterodine PR group observed in the change from baseline to Week 4 and Week 12 in mean urinary volume voided per micturition (Table 13).
Similar inferences were obtained from the analysis of results of the PP and completer population, as well as when non-parametric test statistics are used (Table 13).
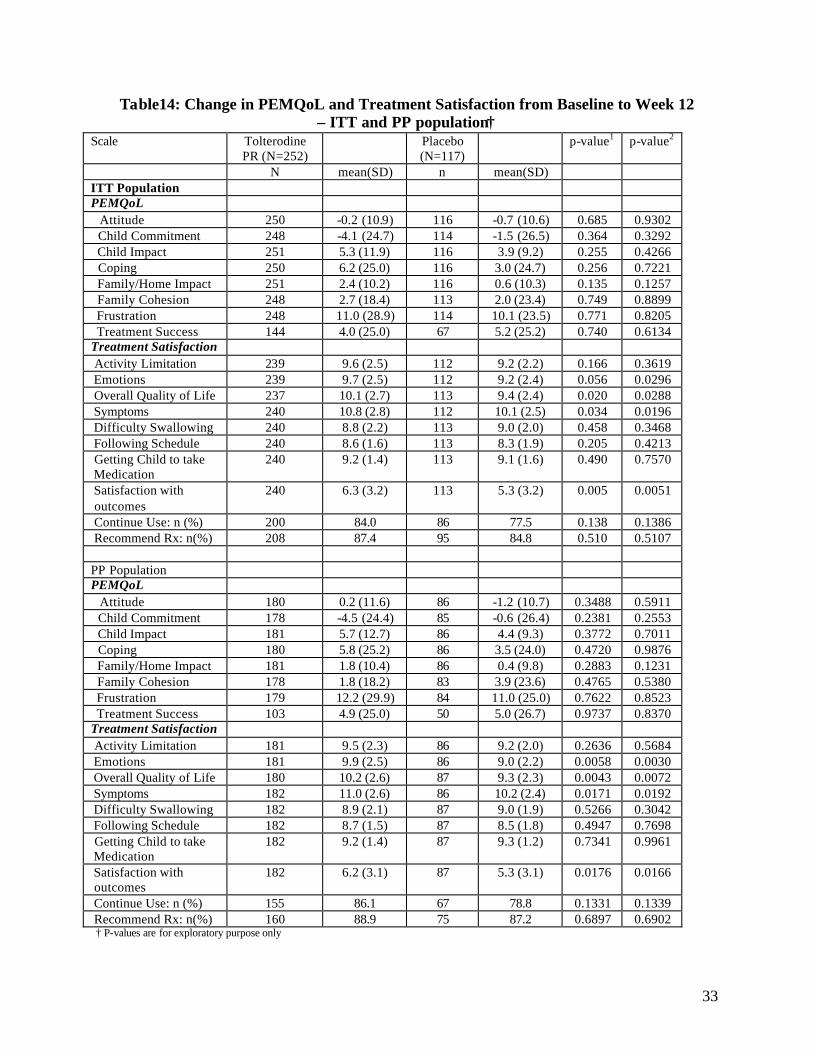
As for the parent/guardian reported variables, as indicated by the Sponsor, although there were some improvements in most of the PEMQoL scales (except for attitude and child commitment) in both treatment groups, these increases were not statistically significant as shown in Table 14. In the treatment satisfaction questionnaire, the sponsor indicated in their report that the items such as change in activity limitation, change in emotion, change in quality of life, and change in symptoms were constructed with 15- item responses ranging from -7 (“A very great deal worse” to +7 (“A very great deal better”). Mean responses for these 4 variables varied between 1.6 to 2.8 in the tolterodine PR group and 1.2 to 2.1 in the placebo group, as reported by the Sponsor (Sponsor’s Table 21). When the reviewer repeated the analyses using the data set provided by the Sponsor (QOL2_ITT and QOL2_PP), using
30

the 15-item-responses ranging from 1 to 15, the mean response for these 4 variables varied between 9.6 to 10.8 in the tolterodine PR group and 9.2 to 10.1 in the placebo group (Table 14). All the remaining items in the treatment satisfaction used a 10-point rating scale as defined by the sponsor. Although the scales in those 4 variables were different, the results obtained by the reviewer were the same as that of the Sponsor. As indicated by the Sponsor, except for difficulty following schedule and difficulty getting child to take medication, all the other items favored the tolterodine PR. However, only three items were statistically significant. Asking the respondent to indicate the degree of satisfaction with treatment outcomes or results, tolterodine PR was rated significantly higher than the placebo (6.3 vs. 5.3, respectively, p=0.005). Similarly, change in symptoms and change in the overall quality of life was rated higher in the tolterodine PR than the placebo (p=0.034 and p=0.02, respectively). With regards to the results from the PP population and from the non-parametric test statistics, the results were consistent with those from the ITT population except for the item “change in emotion”. Under PP population, tolterodine PR was rated significantly higher than the placebo in terms of change in emotion (9.9 vs. 9.0, respectively, p=0.0058). The difference was also significant in the ITT population when non-parametric test statistics was used.
As shown in Table 15, after 12 weeks of treatment, 15.1% of patients in the tolterodine PR group were continent compared with 10.3% of placebo patients in the ITT population. Although there was definite improvement in the tolterodine group, this difference did not achieve statistical significance. The same conclusion can be said with the PP population. However, the proportio n of moderate-to-good improvement definitely favored the tolterodine PR treatment in both ITT and PP population. In fact, there was a statistically significant difference between the two treatment groups in the shift between the various continence categories in the ITT population. However, this significance was not reached in the PP population.
31
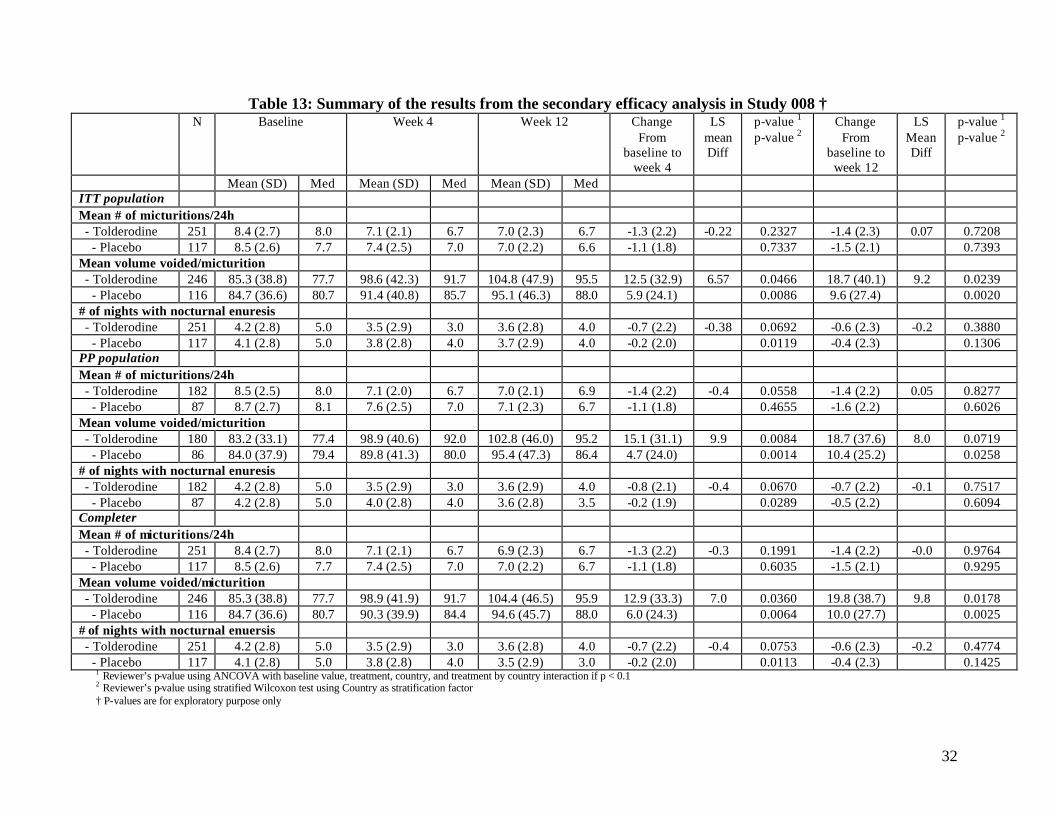
Table 13: Summary of the results from the secondary efficacy analysis in Study 008 † N Baseline Week 4 Week 12 Change
From baseline to
week 4
LS mean Diff
p-value 1
p-value 2 Change
From baseline to
week 12
LS Mean Diff
p-value 1
p-value 2
Mean (SD) Med Mean (SD) Med Mean (SD) Med ITT population Mean # of micturitions/24h - Tolderodine 251 8.4 (2.7) 8.0 7.1 (2.1) 6.7 7.0 (2.3) 6.7 -1.3 (2.2) -0.22 0.2327 -1.4 (2.3) 0.07 0.7208
- Placebo 117 8.5 (2.6) 7.7 7.4 (2.5) 7.0 7.0 (2.2) 6.6 -1.1 (1.8) 0.7337 -1.5 (2.1) 0.7393 Mean volume voided/micturition - Tolderodine 246 85.3 (38.8) 77.7 98.6 (42.3) 91.7 104.8 (47.9) 95.5 12.5 (32.9) 6.57 0.0466 18.7 (40.1) 9.2 0.0239
- Placebo 116 84.7 (36.6) 80.7 91.4 (40.8) 85.7 95.1 (46.3) 88.0 5.9 (24.1) 0.0086 9.6 (27.4) 0.0020 # of nights with nocturnal enuresis - Tolderodine 251 4.2 (2.8) 5.0 3.5 (2.9) 3.0 3.6 (2.8) 4.0 -0.7 (2.2) -0.38 0.0692 -0.6 (2.3) -0.2 0.3880
- Placebo 117 4.1 (2.8) 5.0 3.8 (2.8) 4.0 3.7 (2.9) 4.0 -0.2 (2.0) 0.0119 -0.4 (2.3) 0.1306 PP population Mean # of micturitions/24h - Tolderodine 182 8.5 (2.5) 8.0 7.1 (2.0) 6.7 7.0 (2.1) 6.9 -1.4 (2.2) -0.4 0.0558 -1.4 (2.2) 0.05 0.8277
- Placebo 87 8.7 (2.7) 8.1 7.6 (2.5) 7.0 7.1 (2.3) 6.7 -1.1 (1.8) 0.4655 -1.6 (2.2) 0.6026 Mean volume voided/micturition - Tolderodine 180 83.2 (33.1) 77.4 98.9 (40.6) 92.0 102.8 (46.0) 95.2 15.1 (31.1) 9.9 0.0084 18.7 (37.6) 8.0 0.0719
- Placebo 86 84.0 (37.9) 79.4 89.8 (41.3) 80.0 95.4 (47.3) 86.4 4.7 (24.0) 0.0014 10.4 (25.2) 0.0258 # of nights with nocturnal enuresis - Tolderodine 182 4.2 (2.8) 5.0 3.5 (2.9) 3.0 3.6 (2.9) 4.0 -0.8 (2.1) -0.4 0.0670 -0.7 (2.2) -0.1 0.7517
- Placebo 87 4.2 (2.8) 5.0 4.0 (2.8) 4.0 3.6 (2.8) 3.5 -0.2 (1.9) 0.0289 -0.5 (2.2) 0.6094 Completer Mean # of micturitions/24h - Tolderodine 251 8.4 (2.7) 8.0 7.1 (2.1) 6.7 6.9 (2.3) 6.7 -1.3 (2.2) -0.3 0.1991 -1.4 (2.2) -0.0 0.9764
- Placebo 117 8.5 (2.6) 7.7 7.4 (2.5) 7.0 7.0 (2.2) 6.7 -1.1 (1.8) 0.6035 -1.5 (2.1) 0.9295 Mean volume voided/micturition - Tolderodine 246 85.3 (38.8) 77.7 98.9 (41.9) 91.7 104.4 (46.5) 95.9 12.9 (33.3) 7.0 0.0360 19.8 (38.7) 9.8 0.0178
- Placebo 116 84.7 (36.6) 80.7 90.3 (39.9) 84.4 94.6 (45.7) 88.0 6.0 (24.3) 0.0064 10.0 (27.7) 0.0025 # of nights with nocturnal enuersis - Tolderodine 251 4.2 (2.8) 5.0 3.5 (2.9) 3.0 3.6 (2.8) 4.0 -0.7 (2.2) -0.4 0.0753 -0.6 (2.3) -0.2 0.4774
- Placebo 117 4.1 (2.8) 5.0 3.8 (2.8) 4.0 3.5 (2.9) 3.0 -0.2 (2.0) 0.0113 -0.4 (2.3) 0.1425 1 Reviewer’s p-value using ANCOVA with baseline value, treatment, country, and treatment by country interaction if p < 0.1 2 Reviewer’s p-value using stratified Wilcoxon test using Country as stratification factor † P-values are for exploratory purpose only
32
Ta ble14: Change in PEMQoL and Treatment Satisfaction from Baseline to Week 12 – ITT and PP population†
Scale Tolterodine PR (N=252)
Placebo (N=117)
p-value1 p-value2
N mean(SD) n mean(SD) ITT Population PEMQoL Attitude 250 -0.2 (10.9) 116 -0.7 (10.6) 0.685 0.9302 Child Commitment 248 -4.1 (24.7) 114 -1.5 (26.5) 0.364 0.3292 Child Impact 251 5.3 (11.9) 116 3.9 (9.2) 0.255 0.4266 Coping 250 6.2 (25.0) 116 3.0 (24.7) 0.256 0.7221 Family/Home Impact 251 2.4 (10.2) 116 0.6 (10.3) 0.135 0.1257 Family Cohesion 248 2.7 (18.4) 113 2.0 (23.4) 0.749 0.8899 Frustration 248 11.0 (28.9) 114 10.1 (23.5) 0.771 0.8205 Treatment Success 144 4.0 (25.0) 67 5.2 (25.2) 0.740 0.6134 Treatment Satisfaction Activity Limitation 239 9.6 (2.5) 112 9.2 (2.2) 0.166 0.3619 Emotions 239 9.7 (2.5) 112 9.2 (2.4) 0.056 0.0296 Overall Quality of Life 237 10.1 (2.7) 113 9.4 (2.4) 0.020 0.0288 Symptoms 240 10.8 (2.8) 112 10.1 (2.5) 0.034 0.0196 Difficulty Swallowing 240 8.8 (2.2) 113 9.0 (2.0) 0.458 0.3468 Following Schedule 240 8.6 (1.6) 113 8.3 (1.9) 0.205 0.4213 Getting Child to take Medication
240 9.2 (1.4) 113 9.1 (1.6) 0.490 0.7570
Satisfaction with outcomes
240 6.3 (3.2) 113 5.3 (3.2) 0.005 0.0051
Continue Use: n (%) 200 84.0 86 77.5 0.138 0.1386 Recommend Rx: n(%) 208 87.4 95 84.8 0.510 0.5107
PP Population PEMQoL Attitude 180 0.2 (11.6) 86 -1.2 (10.7) 0.3488 0.5911 Child Commitment 178 -4.5 (24.4) 85 -0.6 (26.4) 0.2381 0.2553
Child Impact 181 5.7 (12.7) 86 4.4 (9.3) 0.3772 0.7011 Coping 180 5.8 (25.2) 86 3.5 (24.0) 0.4720 0.9876 Family/Home Impact 181 1.8 (10.4) 86 0.4 (9.8) 0.2883 0.1231 Family Cohesion 178 1.8 (18.2) 83 3.9 (23.6) 0.4765 0.5380 Frustration 179 12.2 (29.9) 84 11.0 (25.0) 0.7622 0.8523 Treatment Success 103 4.9 (25.0) 50 5.0 (26.7) 0.9737 0.8370 Treatment Satisfaction Activity Limitation 181 9.5 (2.3) 86 9.2 (2.0) 0.2636 0.5684 Emotions 181 9.9 (2.5) 86 9.0 (2.2) 0.0058 0.0030 Overall Quality of Life 180 10.2 (2.6) 87 9.3 (2.3) 0.0043 0.0072 Symptoms 182 11.0 (2.6) 86 10.2 (2.4) 0.0171 0.0192 Difficulty Swallowing 182 8.9 (2.1) 87 9.0 (1.9) 0.5266 0.3042 Following Schedule 182 8.7 (1.5) 87 8.5 (1.8) 0.4947 0.7698 Getting Child to take Medication
182 9.2 (1.4) 87 9.3 (1.2) 0.7341 0.9961
Satisfaction with outcomes
182 6.2 (3.1) 87 5.3 (3.1) 0.0176 0.0166
Continue Use: n (%) 155 86.1 67 78.8 0.1331 0.1339 Recommend Rx: n(%) 160 88.9 75 87.2 0.6897 0.6902 † P-values are for exploratory purpose only
33
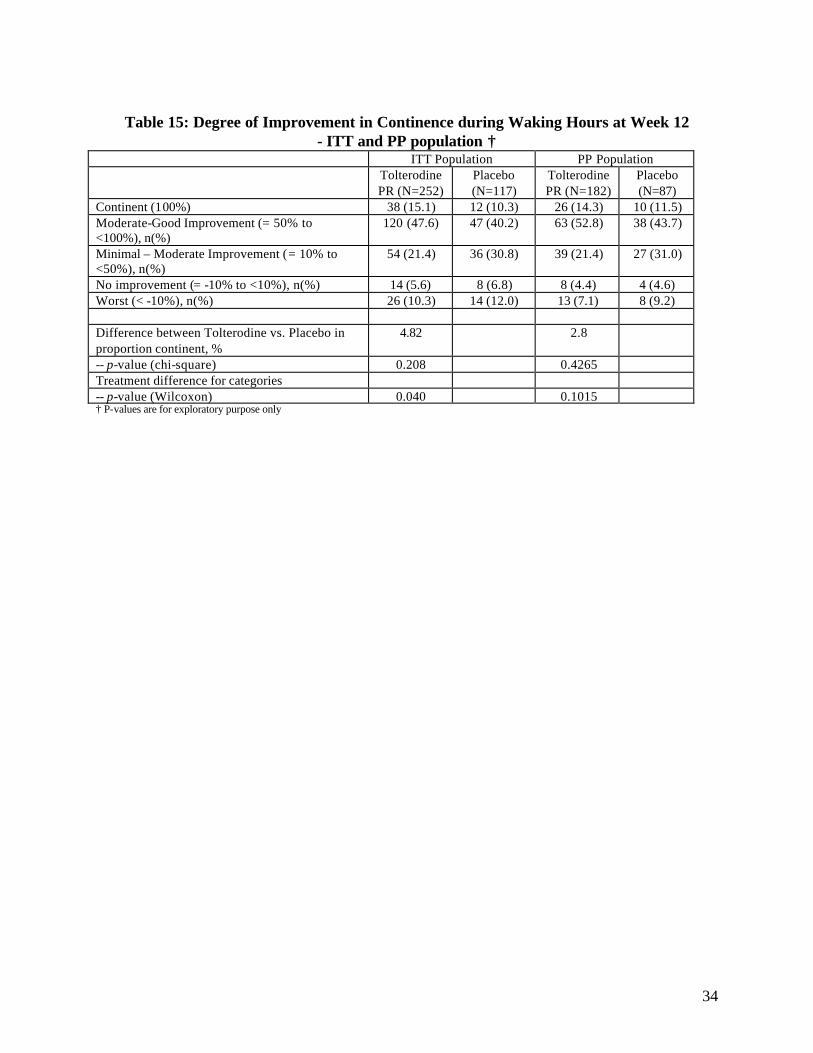
Table 15: Degree of Improvement in Continence during Waking Hours at Week 12 - ITT and PP population †
ITT Population PP Population Tolterodine PR (N=252)
Placebo (N=117)
Tolterodine PR (N=182)
Placebo (N=87)
Continent (1 00%) 38 (15.1) 12 (10.3) 26 (14.3) 10 (11.5) Moderate-Good Improvement (= 50% to <100%), n(%)
120 (47.6) 47 (40.2) 63 (52.8) 38 (43.7)
Minimal – Moderate Improvement ( = 10% to <50%), n(%)
54 (21.4) 36 (30.8) 39 (21.4) 27 (31.0)
No improvement (= -10% to <10%), n(%) 14 (5.6) 8 (6.8) 8 (4.4) 4 (4.6) Worst (< -10%), n(%) 26 (10.3) 14 (12.0) 13 (7.1) 8 (9.2)
Difference between Tolterodine vs. Placebo in proportion continent, %
4.82 2.8
-- p-value (chi-square) 0.208 0.4265 Treatment difference for categories -- p-value (Wilcoxon) 0.040 0.1015 † P-values are for exploratory purpose only
34
Statistical Reviewer’s Conclusion on Secondary (Efficacy) Variables
The results from both studies (008 and 020) were consistent with regards to the analysis of secondary variables. There was no statistically significant difference between the tolterodine PR group and the placebo group in the mean number of micturitions per 24 hours, in either of the studies or either of the population used. Although there was some reduction in the number of micturitions per 24 hours in favor of the tolterodine group, this reduction did not reach statistical significance. The same can be said to the other secondary variables tested such as numbe r of dry days per week (Study 020), gross incontinence during waking hours (Study 020), number of wet nights per week (Study 020), number of nights with nocturnal enuresis (Study 008), VASC subscales (Study 020), PEMQoL scores (Study 008), Treatment satisfaction questionnaire (study 008) where most were in favor of the tolterodine PR group. However, the difference was not statistically significant. In addition, both these studies also showed no significant difference in terms of the proportion of subjects who were continent, although it was evident that there was some improvement in the tolterodine PR group. In both studies, only mean volume voided was significantly different and the results were consistent across different population and different statistical tests. There was an increase in the mean volume voided per micturition in favor of the tolterodine PR group, and this was most evident on subjects with pathological urinary frequency (as shown in the subgroup analysis in Study 020, and as part of the inclusion criteria of Study 008). Overall, not enough evidence can warrant the efficacy of tolterodine PR in this population using the secondary variables.
35

2.4 Findings in Special/Subgroup Population
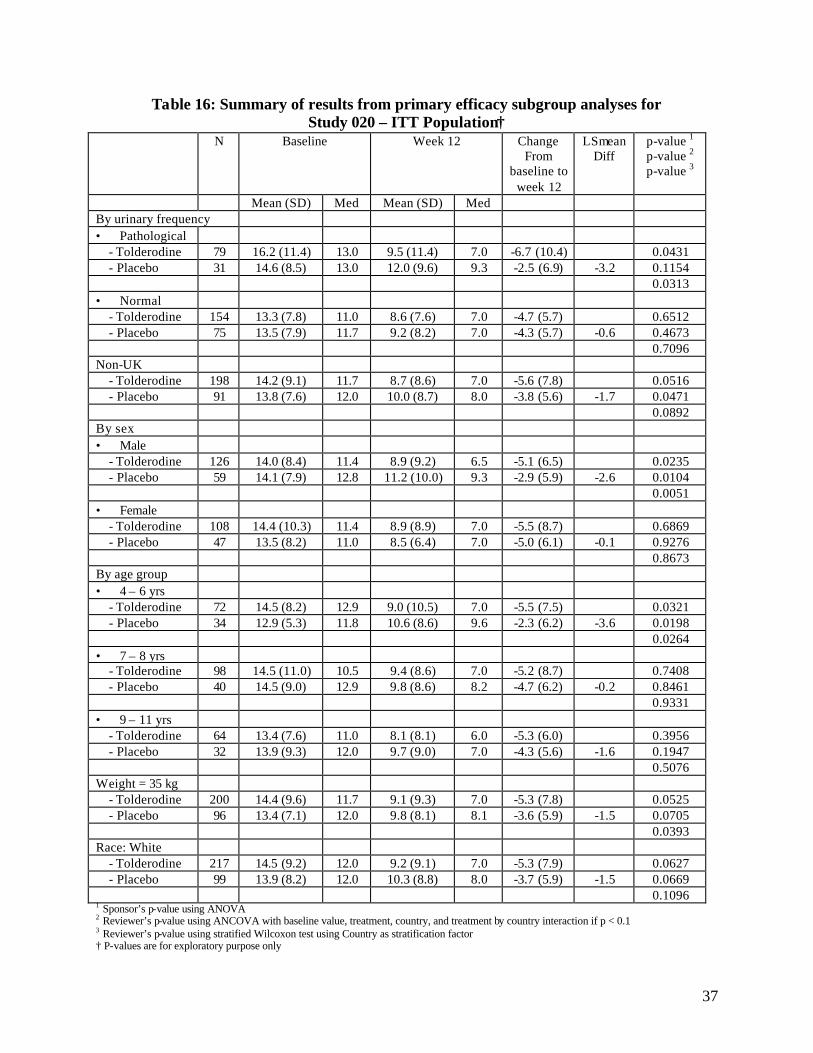
Tables 16 to 18 present the summary of different subgroup analyses for study 020 performed by the sponsor and replicated by the statistical reviewer. Additional analyses were performed by the statistical reviewer that includes ANCOVA and non-parametric tests for the ITT, per-protocol, and completer population. All these analyses are exploratory and interpretation of the results (i.e. statistical significance and p-values) warrants caution.
From the results shown in Tables 16 to 18, male subgroup and children between 4 to 6 years showed consistently significant difference between treatment groups in the mean change from baseline in the number of incontinence episodes per week. There was significant reduction of mean change from baseline in the number of incontinence episodes per week in the tolterodine PR group compared to the placebo group among the male group and children between 4 to 6 years of age.
Based on tables 16 to 18, there was nominally significant difference between treatment groups in the mean change from baseline in the number of incontinence episodes per week among subjects with pathological urinary frequency in the ITT population. However, this difference was not consistent across different population, such that the difference may be the result of imputation or this could be the result of some random difference. There was also some nominal significance among subjects in the non-UK centers and children who were weighing less than 36 kg. This nominal significance was consistent across different population (except for weight in the completer population) and across different statistical tests. Subjects who were white also showed nearly significant difference across different population.
For study 008, results are presented in Tables 19 to 21. As shown in the Tables, only children aged 4 to 6 in the tolterodine group showed statistically significant improvement in the number of incontinence episodes per week compared to the placebo. Although most subgroups (e.g. sex, weight, race) showed some reduction in the number of incontine nce episodes per week in both treatment groups, and all of them favored the tolterodine PR group. This small reduction did not translate into statistical significance that would warrant evidence of efficacy.
Additional subgroup analyses were performed by the Sponsor in Study 008 that was deemed to be exploratory by the reviewer. The subgroup analyses were to be performed by gender, weight, age, and race on some efficacy variables. The results are presented in Table 22. As expected, the mean volume voided per micturition was statistically significantly predominantly among the whites, children who weighed less than 36 kg, males, and children between aged 7 to 8. The significance implies improvement in the mean volume voided in the tolterodine PR group compared to the placebo. As described previously, there was significant reduction in the mean number of incontinence per episodes in both treatment groups among male s, children aged 4 to 6, and children who weighed less than 36 kg. Comparing the tolterodine PR group and placebo group among these subgroups produced statistically significant difference.
36
Ta ble 16: Summary of results from primary efficacy subgroup analyses for Study 020 – ITT Population†
N Baseline Week 12 Change From
baseline to week 12
LSmean Diff
p-value 1
p-value 2
p-value 3
Mean (SD) Med Mean (SD) Med By urinary frequency • Pathological
- Tolderodine 79 16.2 (11.4) 13.0 9.5 (11.4) 7.0 -6.7 (10.4) 0.0431 - Placebo 31 14.6 (8.5) 13.0 12.0 (9.6) 9.3 -2.5 (6.9) -3.2 0.1154
0.0313 • Normal
- Tolderodine 154 13.3 (7.8) 11.0 8.6 (7.6) 7.0 -4.7 (5.7) 0.6512 - Placebo 75 13.5 (7.9) 11.7 9.2 (8.2) 7.0 -4.3 (5.7) -0.6 0.4673
0.7096 Non-UK
- Tolderodine 198 14.2 (9.1) 11.7 8.7 (8.6) 7.0 -5.6 (7.8) 0.0516 - Placebo 91 13.8 (7.6) 12.0 10.0 (8.7) 8.0 -3.8 (5.6) -1.7 0.0471
0.0892 By sex • Male
- Tolderodine 126 14.0 (8.4) 11.4 8.9 (9.2) 6.5 -5.1 (6.5) 0.0235 - Placebo 59 14.1 (7.9) 12.8 11.2 (10.0) 9.3 -2.9 (5.9) -2.6 0.0104
0.0051 • Female
- Tolderodine 108 14.4 (10.3) 11.4 8.9 (8.9) 7.0 -5.5 (8.7) 0.6869 - Placebo 47 13.5 (8.2) 11.0 8.5 (6.4) 7.0 -5.0 (6.1) -0.1 0.9276
0.8673 By age group • 4 – 6 yrs
- Tolderodine 72 14.5 (8.2) 12.9 9.0 (10.5) 7.0 -5.5 (7.5) 0.0321 - Placebo 34 12.9 (5.3) 11.8 10.6 (8.6) 9.6 -2.3 (6.2) -3.6 0.0198
0.0264 • 7 – 8 yrs
- Tolderodine 98 14.5 (11.0) 10.5 9.4 (8.6) 7.0 -5. 2 (8.7) 0.7408 - Placebo 40 14.5 (9.0) 12.9 9.8 (8.6) 8.2 -4.7 (6.2) -0.2 0.8461
0.9331 • 9 – 11 yrs
- Tolderodine 64 13.4 (7.6) 11.0 8.1 (8.1) 6.0 -5.3 (6.0) 0.3956 - Placebo 32 13.9 (9.3) 12.0 9.7 (9.0) 7.0 -4.3 (5.6) -1. 6 0.1947
0.5076 W eight = 35 kg
- Tolderodine 200 14.4 (9.6) 11.7 9.1 (9.3) 7.0 -5.3 (7.8) 0.0525 - Placebo 96 13.4 (7.1) 12.0 9.8 (8.1) 8.1 -3.6 (5.9) -1.5 0.0705
0.0393 Race: White
- Tolderodine 217 14.5 (9.2) 12.0 9.2 (9.1) 7.0 -5.3 (7.9) 0.0627 - Placebo 99 13.9 (8.2) 12.0 10.3 (8.8) 8.0 -3.7 (5.9) -1.5 0.0669
0.1096 1 Sponsor’s p-value using ANOVA 2 Reviewer’s p-value using ANCOVA with baseline value, treatment, country, and treatment by country interaction if p < 0.1 3 Reviewer’s p-value using stratified Wilcoxon test using Country as stratification factor † P-values are for exploratory purpose only
37
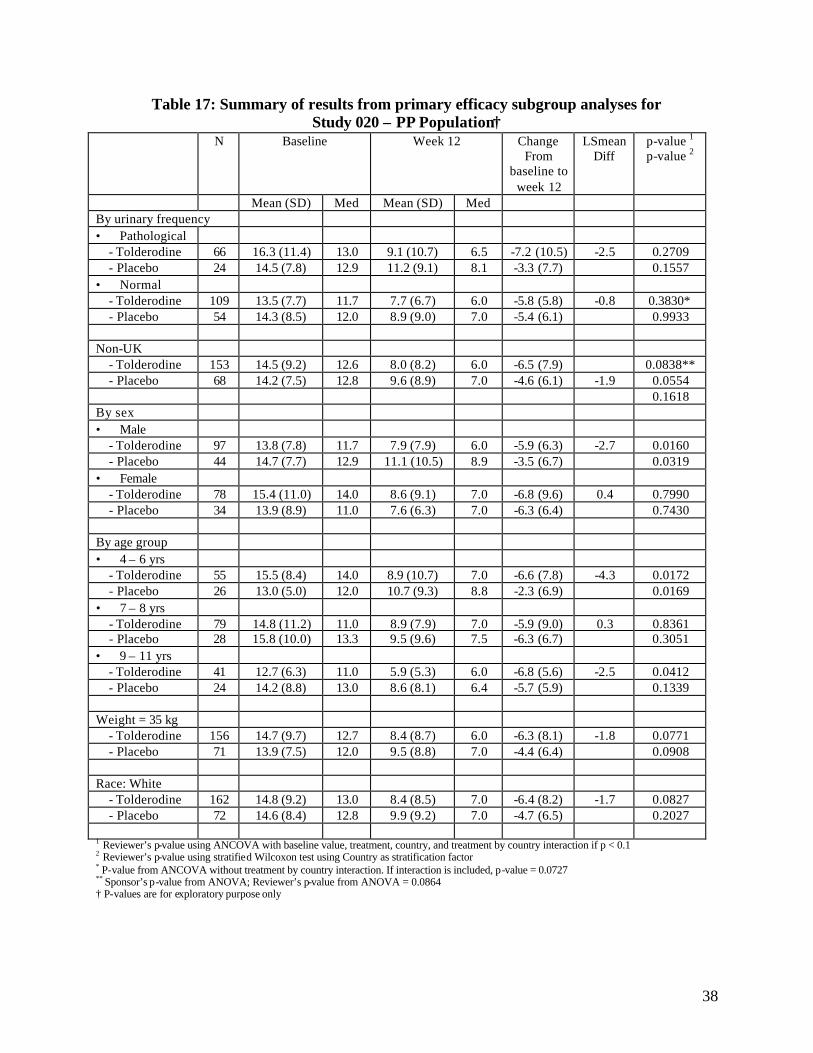
Table 17: Summary of results from primary efficacy subgroup analyses for Study 020 – PP Population†
N Baseline Week 12 Change From
baseline to week 12
LSmean Diff
p-value 1
p-value 2
Mean (SD) Med Mean (SD) Med By urinary frequency • Pathological
- Tolderodine 66 16.3 (11.4) 13.0 9.1 (10.7) 6.5 -7.2 (10.5) -2.5 0. 2709 - Placebo 24 14.5 (7.8) 12.9 11.2 (9.1) 8.1 -3.3 (7.7) 0.1557
• Normal - Tolderodine 109 13.5 (7.7) 11.7 7.7 (6.7) 6.0 -5.8 (5.8) -0.8 0.3830* - Placebo 54 14.3 (8.5) 12.0 8.9 (9.0) 7.0 -5.4 (6.1) 0.9933
Non-UK - Tolderodine 153 14.5 (9.2) 12.6 8.0 (8.2) 6.0 -6.5 (7.9) 0.0838** - Placebo 68 14.2 (7.5) 12.8 9.6 (8.9) 7.0 -4.6 (6.1) -1.9 0.0554
0.1618 By sex • Male
- Tolderodine 97 13.8 (7.8) 11.7 7.9 (7.9) 6.0 -5.9 (6.3) -2.7 0.0160 - Placebo 44 14.7 (7.7) 12.9 11.1 (10.5) 8.9 -3.5 (6.7) 0.0319
• Female - Tolderodine 78 15.4 (11.0) 14.0 8.6 (9.1) 7.0 -6.8 (9.6) 0.4 0.7990 - Placebo 34 13.9 (8.9) 11.0 7.6 (6.3) 7.0 -6.3 (6.4) 0.7430
By age group • 4 – 6 yrs
- Tolderodine 55 15.5 (8.4) 14.0 8.9 (10.7) 7.0 -6.6 (7.8) -4.3 0.0172 - Placebo 26 13.0 (5.0) 12.0 10.7 (9.3) 8.8 -2.3 (6.9) 0.0169
• 7 – 8 yrs - Tolderodine 79 14.8 (11.2) 11.0 8.9 (7.9) 7.0 -5.9 (9.0) 0.3 0.8361 - Placebo 28 15.8 (10.0) 13.3 9.5 (9.6) 7.5 -6.3 (6.7) 0.3051
• 9 – 11 yrs - Tolderodine 41 12.7 (6.3) 11.0 5.9 (5.3) 6.0 -6.8 (5.6) -2.5 0.0412 - Placebo 24 14.2 (8.8) 13.0 8.6 (8.1) 6.4 -5.7 (5.9) 0.1339
Weight = 35 kg - Tolderodine 156 14.7 (9.7) 12.7 8.4 (8.7) 6.0 -6.3 (8.1) -1.8 0.0771 - Placebo 71 13.9 (7.5) 12.0 9.5 (8.8) 7.0 -4.4 (6.4) 0.0908
Race: White - Tolderodine 162 14.8 (9.2) 13.0 8.4 (8.5) 7.0 -6.4 (8.2) -1.7 0.0827 - Placebo 72 14.6 (8.4) 12.8 9.9 (9.2) 7.0 -4.7 (6.5) 0.2027
1 Reviewer’s p-value using ANCOVA with baseline value, treatment, country, and treatment by country interaction if p < 0.1 2 Reviewer’s p-value using stratifie d Wilcoxon test using Country as stratification factor * P-value from ANCOVA without treatment by country interaction. If interaction is included, p -value = 0.0727 ** Sponsor’s p -value from ANOVA; Reviewer’s p-value from ANOVA = 0.0864 † P-values are for exploratory purpose only
38

Table 18: Summary of results from primary efficacy subgroup analyses for Study 020– Completer Population†
N Baseline Week 12 Change From
baseline to week 12
LSmean Diff
p-value 1
p-value 2
Mean (SD) Med Mean (SD) Med By urinary frequency • Pathological
- Tolderodine 73 15.9 (11.2) 13.0 8.7 (10.8) 5.8 -7.2 (10.8) -2.8 0.2008 - Placebo 25 14.1 (7.9) 12.8 10.9 (9.1) 8.0 -3.2 (7.5) 0.0919
• Normal - Tolderodine 132 13.0 (7.6) 11.2 7.6 (6. 9) 6.0 -5.4 (5.8) -0.6 0.5042 - Placebo 61 14.2 (8.4) 12.0 8.9 (8.8) 7.0 -5.3 (5.9) 0.8583
Non-UK - Tolderodine 179 14.2 (9.0) 11.8 8.0 (8.3) 6.0 -6.2 (8.0) -1.6 0.0741 - Placebo 77 13.9 (7.6) 12.4 9.4 (8.8) 7.0 -4.5 (5.9) 0.1949
By sex • Male
- Tolderodine 117 13.5 (7.8) 11.2 7.9 (8.2) 6.0 -5.5 (6.6) -2.4 0.0309 - Placebo 48 14.1 (7.8) 12.8 10.6 (10.3) 7.7 -3.5 (6.4) 0.0389
• Female - Tolderodine 88 14.8 (10.7) 12.5 8.1 (8.9) 6.0 -6.8 (9.2) -0.2 0.8896 - Placebo 39 14.1 (8.8) 11.0 8.0 (6.6) 7.0 -6.1 (6.3) 0.8257
By age group • 4 – 6 yrs
- Tolderodine 63 14.7 (8.2) 14.0 8.4 (10.6) 6.0 -6.3 (7.7) -4.2 0.0157 - Placebo 29 13.3 (5.6) 12.0 10.6 (9.3) 8.2 -2.7 (6.7) 0.0185
• 7 – 8 yrs - Tolderodine 90 14.3 (10.8) 10.5 8.7 (7.7) 7.0 -5.6 (8.9) 0.1 0.9342 - Placebo 32 15.1 (9.7) 13.3 9.3 (9.4) 7.5 -5.8 (6.5) 0.5653
• 9 – 11 yrs - Tolderodine 52 12.8 (7.0) 11.0 6.2 (6.5) 5.0 -6.6 (6.0) -1.7 0.1821 - Placebo 25 13.8 (8.9) 13.0 8.4 (8.0) 5.8 -5.5 (5.8) 0.4573
By weight • = 35 kg
- Tolderodine 180 14.2 (9.4) 11.7 8.3 (8.8) 6.0 -5.9 (8.0) -1.5 0.1081 - Placebo 78 13.9 (7.5) 12.0 9.5 (8.8) 7.0 -4.4 (6.2) 0.1646
Race: White - Tolderodine 188 14.4 (9.0) 12.6 8.3 (8.6) 6.0 -6.2 (8.1) -1.6 0.0827 - Placebo 80 14.3 (8.4) 12.4 9.7 (9.1) 7.0 -4.6 (6.3) 0.1955
1 Reviewer’s p-value using ANCOVA with baseline value, treatment, country, and treatment by country interaction if p < 0.1 2 Reviewer’s p-value using stratified Wilcoxon test using Country as stratification factor † P-values are for exploratory purpose only
39

Table 19: Summary of results from primary efficacy subgroup analyses for Study 008 – ITT Population†
N Baseline Week 4 Week 12 Change From
baseline to week 4
p-value 1
p-value 2 Change
From baseline to
week 12
p-value 1
p-value 2
Mean (SD) Med Mean (SD) Med Mean (SD) Med By sex • Male - Tolderodine 127 16.5 (8.8) 16.0 10.1 (8.4) 8.0 8.0 (8.7) 5.0 -6.4 (7.2) -1.2 0.3050 -8.5 (8.9) -0.3 0.773 *
- Placebo 65 17.5 (12.3) 14.0 11.7 (11.2) 9.0 8.9 (8.4) 7.0 -5.8 (11.1) 0.2426 -8.6 (11.2) 0.4083 • Female - Tolderodine 124 22.3 (16.2) 18.0 13.8 (15.8) 8.0 10.7 (14.2) 5.0 -8.5 (11.7) -2.4 0.1643 -11.6 (14.7) -1.1 0.549 *
- Placebo 52 20.5 (16.0) 17.0 15.3 (14.7) 12.0 11.5 (11.7) 9.5 -5.2 (7.5) 0.0526 -9.0 (11.2) 0.1297
By age group • 4 – 6 yrs - Tolderodine 100 21.0 (14.2) 17.0 12.6 (13.6) 9.0 8.5 (10.2) 5.0 -8.3 (9.7) -2.8 0.0526 -12.4 (13.2) -2.7 0.084 *
- Placebo 55 18.8 (14.0) 14.0 13.8 (11.7) 12.0 10.6 (11.2) 8.0 -5.0 (7.8) 0.0098 -8.2 (9.5) 0.0077 • 7 – 8 yrs - Tolderodine 106 17.6 (11.7) 15.0 11.1 (12.4) 7.0 9.2 (12.3) 5.0 -6.4 (9.2) -1.8 0.3169 -8.3 (10.1) -0.3 0.860 *
- Placebo 40 17.7 (15.0) 11.5 12.9 (15.2) 8.0 9.7 (10.0) 7.0 -4.8 (12.3 ) 0.4976 -8.0 (12.1) 0.7406 • 9 – 11 yrs - Tolderodine 46 20.1 (14.6) 16.0 12.1 (11.4) 9.0 11.3 (13.7) 7.0 -8.0 (11.0) 0.02 0.9928 -8.8 (13.4) 2.3 0.431 *
- Placebo 22 21.0 (13.0) 17.0 13.0 (12.0) 8.0 9.3 (7.0) 8.0 -8.0 (8.4) 0.9903 -11.7 (12.9) 0.6316
Weight =35 kg - Tolderodine 218 18.6 (12.9) 15.0 11.2 (11.4) 7.0 8.2 (9.3) 5.0 -7.4 (9.9) -1.7 0.0840 -10.4 (12.0) -2.0 0.0467
- Placebo 99 18.8 (14.7) 13.0 13.1 (12.7) 11.0 10.2 (10.5) 8.0 -5.71 (9.0) 0.0379 -8.55 (10.8) 0.0292
Race: White - Tolderodine 225 19.5 (13.8) 16.0 12.0 (12.9) 8.0 9.3 (11.9) 5.0 -7.4 (10.0) -1.7 0.1061 -10.2 (12.6) -1.0 0.348 *
- Placebo 108 18.7 (14.1) 14.0 13.3 (12.7) 11.0 10.1 (9.9) 8.0 -5.5 (9.5) 0.0524 -8.6 (11.4) 0.0737 1 Reviewer’s p-value using ANCOVA with baseline value, treatment, country, and treatment by country interaction if p < 0.1 2 Reviewer’s p-value using stratified Wilcoxon test using Country as stratification factor * Reviewer’s p-value using ANCOVA with baseline value, treatment, country, and treatment by country interaction if p < 0 1 † P-values are for exploratory purpose only
40
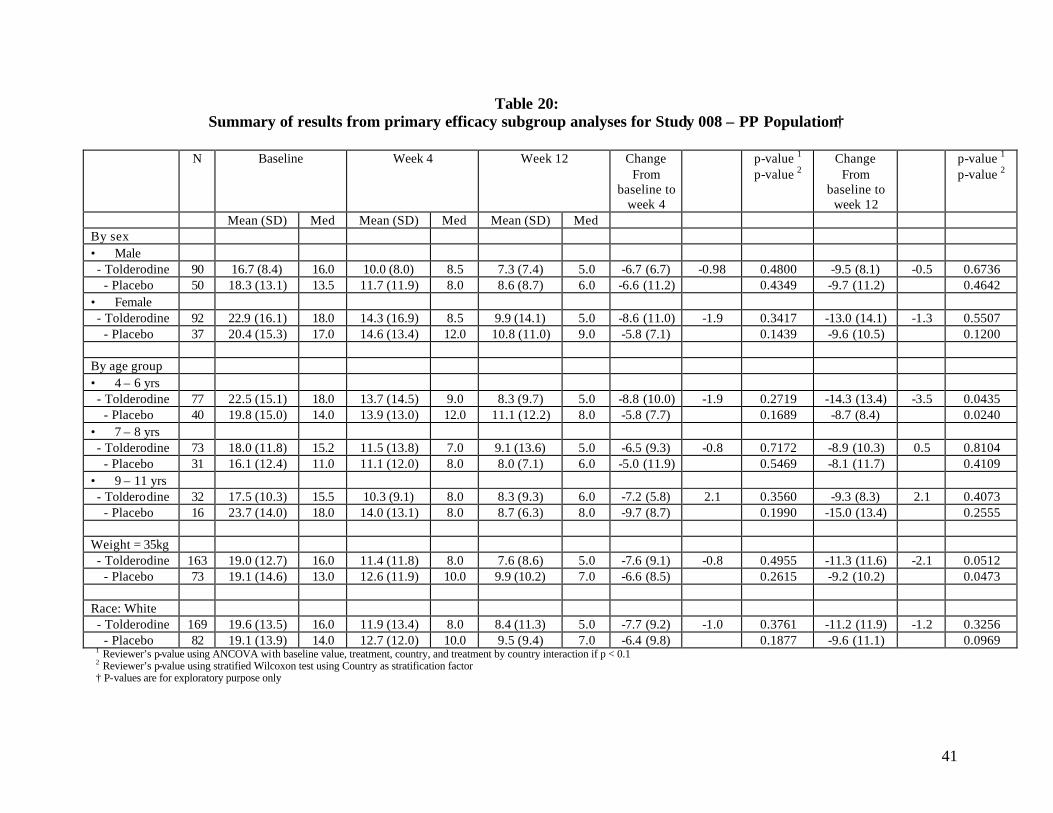
Table 20: Summary of results from primary efficacy subgroup analyses for Study 008 – PP Population†
N Baseline Week 4 Week 12 Change From
baseline to week 4
p-value 1
p-value 2 Change
From baseline to
week 12
p-value 1
p-value 2
Mean (SD) Med Mean (SD) Med Mean (SD) Med By sex • Male - Tolderodine 90 16.7 (8.4) 16.0 10.0 (8.0) 8.5 7.3 (7.4) 5.0 -6.7 (6.7) -0.98 0.4800 -9.5 (8.1) -0.5 0.6736
- Placebo 50 18.3 (13.1) 13.5 11.7 (11.9) 8.0 8.6 (8.7) 6.0 -6.6 (11.2) 0.4349 -9.7 (11.2) 0.4642 • Female - Tolderodine 92 22.9 (16.1) 18.0 14.3 (16.9) 8.5 9.9 (14.1) 5.0 -8.6 (11.0) -1.9 0.3417 -13.0 (14.1) -1.3 0.5507
- Placebo 37 20.4 (15.3) 17.0 14.6 (13.4) 12.0 10.8 (11.0) 9.0 -5.8 (7.1) 0.1439 -9.6 (10.5) 0.1200
By age group • 4 – 6 yrs - Tolderodine 77 22.5 (15.1) 18.0 13.7 (14.5) 9.0 8.3 (9.7) 5.0 -8.8 (10.0) -1.9 0.2719 -14.3 (13.4) -3.5 0.0435
- Placebo 40 19.8 (15.0) 14.0 13.9 (13.0) 12.0 11.1 (12.2) 8.0 -5.8 (7.7) 0.1689 -8.7 (8.4) 0.0240 • 7 – 8 yrs - Tolderodine 73 18.0 (11.8) 15.2 11.5 (13.8) 7.0 9.1 (13.6) 5.0 -6.5 (9.3) -0.8 0.7172 -8.9 (10.3) 0.5 0.8104
- Placebo 31 16.1 (12.4) 11.0 11.1 (12.0) 8.0 8.0 (7.1) 6.0 -5.0 (11.9) 0.5469 -8.1 (11.7) 0.4109 • 9 – 11 yrs - Toldero dine 32 17.5 (10.3) 15.5 10.3 (9.1) 8.0 8.3 (9.3) 6.0 -7.2 (5.8) 2.1 0.3560 -9.3 (8.3) 2.1 0.4073
- Placebo 16 23.7 (14.0) 18.0 14.0 (13.1) 8.0 8.7 (6.3) 8.0 -9.7 (8.7) 0.1990 -15.0 (13.4) 0.2555
Weight = 35kg - Tolderodine 163 19.0 (12.7) 16.0 11.4 (11.8) 8.0 7.6 (8.6) 5.0 -7.6 (9.1) -0.8 0.4955 -11.3 (11.6) -2.1 0.0512
- Placebo 73 19.1 (14.6) 13.0 12.6 (11.9) 10.0 9.9 (10.2) 7.0 -6.6 (8.5) 0.2615 -9.2 (10.2) 0.0473
Race: White - Tolderodine 169 19.6 (13.5) 16.0 11.9 (13.4) 8.0 8.4 (11.3) 5.0 -7.7 (9.2) -1.0 0.3761 -11.2 (11.9) -1.2 0.3256
- Placebo 82 19.1 (13.9) 14.0 12.7 (12.0) 10.0 9.5 (9.4) 7.0 -6.4 (9.8) 0.1877 -9.6 (11.1) 0.0969 1 Reviewer’s p-value using ANCOVA wi th baseline value, treatment, country, and treatment by country interaction if p < 0.1 2 Reviewer’s p-value using stratified Wilcoxon test using Country as stratification factor † P-values are for exploratory purpose only
41
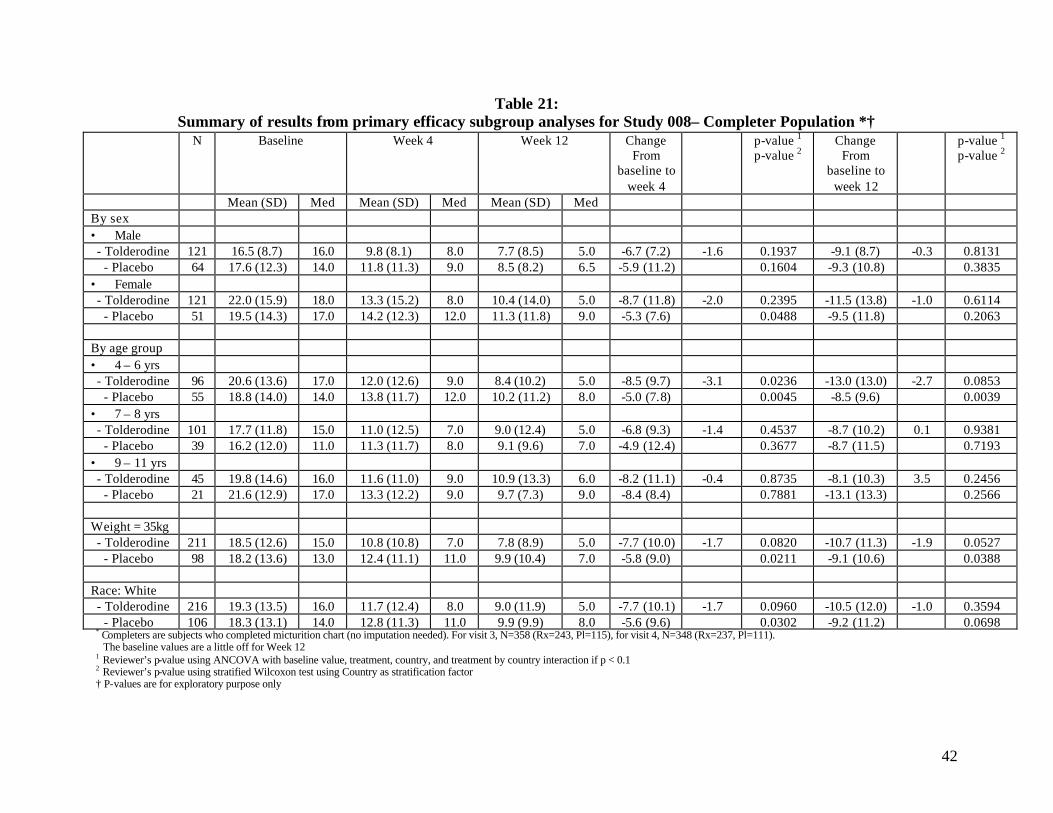
Table 21: Summary of results from primary efficacy subgroup analyses for Study 008– Completer Population *†
N Baseline Week 4 Week 12 Change From
baseline to week 4
p-value 1
p-value 2 Change
From baseline to
week 12
p-value 1
p-value 2
Mean (SD) Med Mean (SD) Med Mean (SD) Med By sex • Male - Tolderodine 121 16.5 (8.7) 16.0 9.8 (8.1) 8.0 7.7 (8.5) 5.0 -6.7 (7.2) -1.6 0.1937 -9.1 (8.7) -0.3 0.8131
- Placebo 64 17.6 (12.3) 14.0 11.8 (11.3) 9.0 8.5 (8.2) 6.5 -5.9 (11.2) 0.1604 -9.3 (10.8) 0.3835 • Female - Tolderodine 121 22.0 (15.9) 18.0 13.3 (15.2) 8.0 10.4 (14.0) 5.0 -8.7 (11.8) -2.0 0.2395 -11.5 (13.8) -1.0 0.6114
- Placebo 51 19.5 (14.3) 17.0 14.2 (12.3) 12.0 11.3 (11.8) 9.0 -5.3 (7.6) 0.0488 -9.5 (11.8) 0.2063
By age group • 4 – 6 yrs - Tolderodine 96 20.6 (13.6) 17.0 12.0 (12.6) 9.0 8.4 (10.2) 5.0 -8.5 (9.7) -3.1 0.0236 -13.0 (13.0) -2.7 0.0853
- Placebo 55 18.8 (14.0) 14.0 13.8 (11.7) 12.0 10.2 (11.2) 8.0 -5.0 (7. 8) 0.0045 -8.5 (9.6) 0.0039 • 7 – 8 yrs - Tolderodine 101 17.7 (11.8) 15.0 11.0 (12.5) 7.0 9.0 (12.4) 5.0 -6.8 (9.3) -1.4 0.4537 -8.7 (10.2) 0.1 0.9381
- Placebo 39 16.2 (12.0) 11.0 11.3 (11.7) 8.0 9.1 (9.6) 7.0 -4.9 (12.4) 0.3677 -8.7 (11.5) 0.7193 • 9 – 11 yrs - Tolderodine 45 19.8 (14.6) 16.0 11.6 (11.0) 9.0 10.9 (13.3) 6.0 -8.2 (11.1) -0.4 0.8735 -8.1 (10.3) 3.5 0.2456
- Placebo 21 21.6 (12.9) 17.0 13.3 (12.2) 9.0 9.7 (7.3) 9.0 -8.4 (8.4) 0.7881 -13.1 (13.3) 0.2566
Weight = 35kg - Tolderodine 211 18.5 (12.6) 15.0 10.8 (10.8) 7.0 7.8 (8.9) 5.0 -7.7 (10.0) -1.7 0.0820 -10.7 (11.3) -1.9 0.0527
- Placebo 98 18.2 (13.6) 13.0 12.4 (11.1) 11.0 9.9 (10.4) 7.0 -5.8 (9.0) 0.0211 -9.1 (10.6) 0.0388
Race: White - Tolderodine 216 19.3 (13.5) 16.0 11.7 (12.4) 8.0 9.0 (11.9) 5.0 -7.7 (10.1) -1.7 0.0960 -10.5 (12.0) -1.0 0.3594
- Placebo 106 18.3 (13.1) 14.0 12.8 (11.3) 11.0 9.9 (9.9) 8.0 -5.6 (9.6) 0.0302 -9.2 (11.2) 0.0698 * Completers are subjects who completed micturition chart (no imputation needed). For visit 3, N=358 (Rx=243, Pl=115), for visit 4, N=348 (Rx=237, Pl=111). The baseline values are a little off for Week 12
1 Reviewer’s p-value using ANCOVA with baseline value, treatment, country, and treatment by country interaction if p < 0.1 2 Reviewer’s p-value using stratified Wilcoxon test using Country as stratification factor † P-values are for exploratory purpose only
42
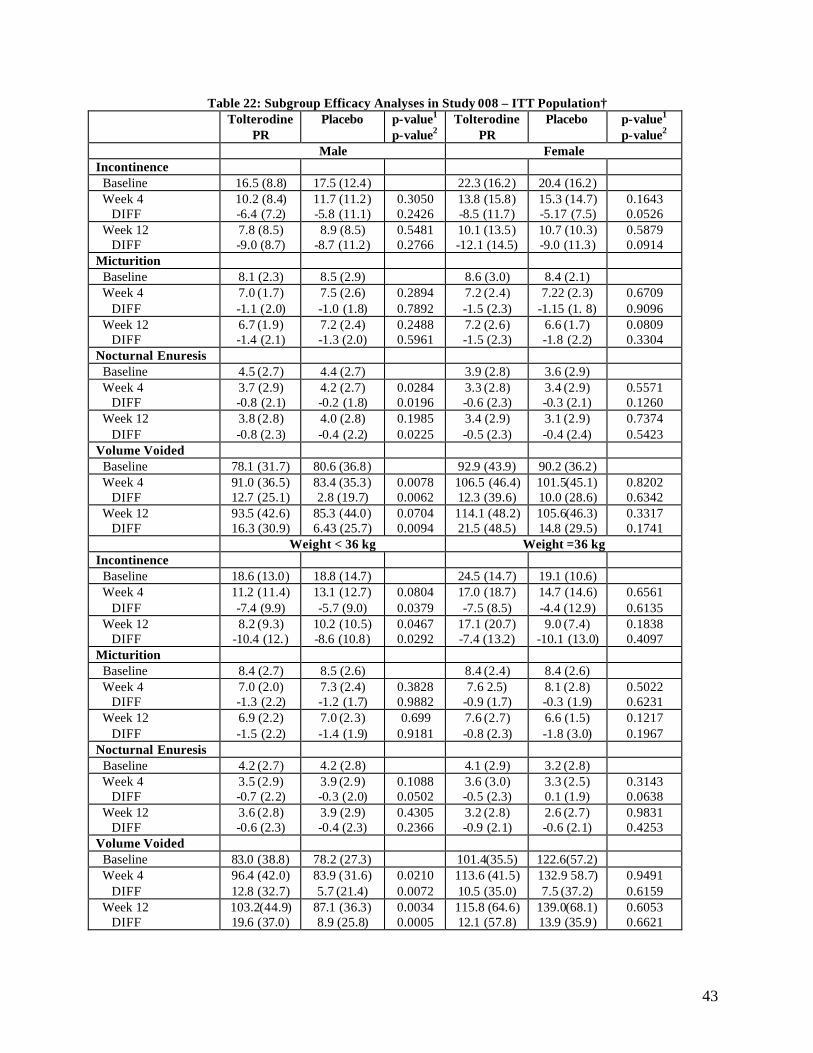
Table 22: Subgroup Efficacy Analyses in Study 008 – ITT Population† Tolterodine
PR Placebo p-value1
p-value2 Tolterodine
PR Placebo p-value1
p-value2
Male Female Incontinence Baseline 16.5 (8.8) 17.5 (12.4 ) 22.3 (16.2 ) 20.4 (16.2 ) Week 4
DIFF 10.2 (8.4) -6.4 (7.2)
11.7 (11.2 ) -5.8 (11.1)
0.3050 0.2426
13.8 (15.8 ) -8.5 (11.7 )
15.3 (14.7) -5.17 (7.5)
0.1643 0.0526
Week 12 DIFF
7.8 (8.5) -9.0 (8.7)
8.9 (8.5) -8.7 (11.2 )
0.5481 0.2766
10.1 (13.5 ) -12.1 (14.5)
10.7 (10.3) -9.0 (11.3 )
0.5879 0.0914
Micturition Baseline 8.1 (2.3) 8.5 (2.9) 8.6 (3.0) 8.4 (2.1) Week 4
DIFF 7.0 (1.7) -1. 1 (2.0)
7.5 (2.6) -1.0 (1.8)
0.2894 0.7892
7.2 (2.4) -1.5 (2.3)
7.22 (2. 3) -1.15 (1. 8)
0.6709 0.9096
Week 12 DIFF
6.7 (1. 9) -1.4 (2.1)
7.2 (2.4) -1.3 (2.0)
0.2488 0.5961
7.2 (2. 6) -1.5 (2.3)
6.6 (1.7) -1.8 (2.2)
0.0809 0.3304
Nocturnal Enuresis Baseline 4.5 (2.7) 4.4 (2.7) 3.9 (2.8) 3.6 (2.9) Week 4
DIFF 3.7 (2.9) -0.8 (2.1)
4.2 (2.7) -0.2 (1.8)
0.0284 0.0196
3.3 (2.8) -0.6 (2.3)
3.4 (2.9) -0.3 (2.1)
0.5571 0.1260
Week 12 DIFF
3.8 (2.8) -0.8 (2. 3)
4.0 (2.8) -0.4 (2.2)
0.1985 0.0225
3.4 (2.9) -0.5 (2.3)
3.1 (2.9) -0.4 (2.4)
0.7374 0.5423
Volume Voided Baseline 78.1 (31.7) 80.6 (36.8 ) 92.9 (43.9) 90.2 (36.2 ) Week 4
DIFF 91.0 (36.5) 12.7 (25.1)
83.4 (35.3 ) 2.8 (19.7)
0.0078 0.0062
106.5 (46.4) 12.3 (39.6)
101.5(45.1) 10.0 (28.6)
0.8202 0.6342
Week 12 DIFF
93.5 (42.6) 16.3 (30.9)
85.3 (44.0 ) 6.43 (25.7)
0.0704 0.0094
114.1 (48.2) 21.5 (48.5)
105.6(46.3) 14.8 (29.5)
0.3317 0.1741
Weight < 36 kg Weight =36 kg Incontinence Baseline 18.6 (13.0 ) 18.8 (14.7) 24.5 (14.7) 19.1 (10.6) Week 4
DIFF 11.2 (11.4) -7.4 (9.9)
13.1 (12.7) -5.7 (9.0)
0.0804 0.0379
17.0 (18.7 ) -7.5 (8.5)
14.7 (14.6) -4.4 (12.9)
0.6561 0.6135
Week 12 DIFF
8.2 ( 9.3) -10.4 (12. )
10.2 (10.5) -8.6 (10.8 )
0.0467 0.0292
17.1 (20.7) -7.4 (13.2)
9.0 (7.4) -10.1 (13.0)
0.1838 0.4097
Micturition Baseline 8.4 (2.7) 8.5 (2.6) 8.4 (2.4) 8.4 (2.6) Week 4
DIFF 7.0 (2.0) -1.3 (2.2)
7.3 (2.4) -1.2 (1.7)
0.3828 0.9882
7.6 2.5) -0.9 (1.7)
8.1 (2.8) -0.3 (1.9)
0.5022 0.6231
Week 12 DIFF
6.9 (2.2) -1.5 (2.2)
7.0 (2. 3) -1.4 (1.9)
0.699 0.9181
7.6 (2.7) -0.8 (2. 3)
6.6 (1.5) -1.8 (3.0)
0.1217 0.1967
Nocturnal Enuresis Baseline 4.2 (2.7) 4.2 (2.8) 4.1 (2.9) 3.2 (2.8) Week 4
DIFF 3.5 (2.9) -0.7 (2. 2)
3.9 (2. 9) -0.3 (2.0)
0.1088 0.0502
3.6 (3.0) -0.5 (2.3)
3.3 (2.5) 0.1 (1.9)
0.3143 0.0638
Week 12 DIFF
3.6 (2.8) -0.6 (2.3)
3.9 (2.9) -0.4 (2.3)
0.4305 0.2366
3.2 (2.8) -0.9 (2. 1)
2.6 (2. 7) -0.6 (2. 1)
0.9831 0.4253
Volume Voided Baseline 83.0 (38.8) 78.2 (27.3) 101.4(35.5) 122.6(57.2) Week 4
DIFF 96.4 (42.0) 12.8 (32.7)
83.9 ( 31.6) 5.7 (21.4)
0.0210 0.0072
113.6 (41. 5) 10.5 (35.0)
132.9 58.7) 7.5 (37. 2)
0.9491 0.6159
Week 12 DIFF
103.2(44.9) 19.6 (37.0 )
87.1 (36.3) 8.9 (25.8)
0.0034 0.0005
115.8 (64. 6) 12.1 (57.8)
139.0(68.1) 13.9 (35.9 )
0.6053 0.6621
43
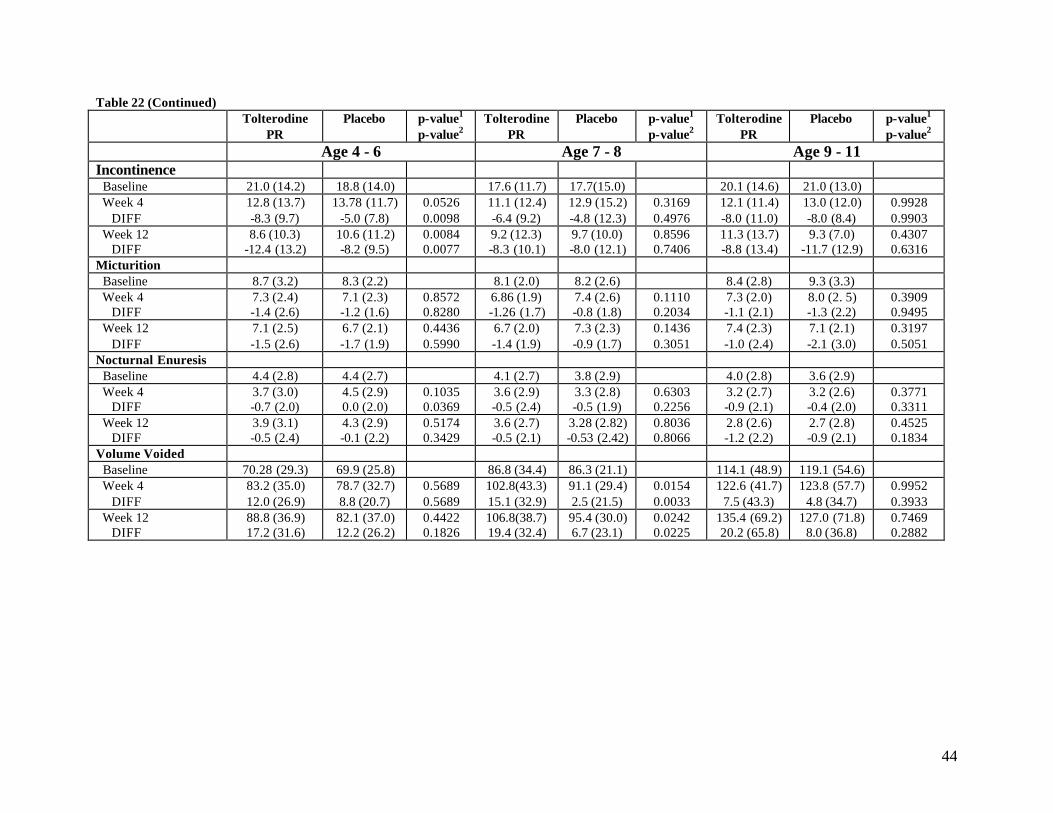
Table 22 (Continued) Tolterodine
PR Placebo p-value1
p-value2 Tolterodine
PR Placebo p-value1
p-value2 Tolterodine
PR Placebo p-value1
p-value2
Age 4 - 6 Age 7 - 8 Age 9 - 11 Incontinence Baseline 21.0 (14.2) 18.8 (14.0) 17.6 (11.7) 17.7(15.0) 20.1 (14.6) 21.0 (13.0) Week 4
DIFF 12.8 (13.7) -8.3 (9.7)
13.78 (11.7) -5.0 (7.8)
0.0526 0.0098
11.1 (12.4) -6.4 (9.2)
12.9 (15.2) -4.8 (12.3)
0.3169 0.4976
12.1 (11.4) -8.0 (11.0)
13.0 (12.0) -8.0 (8.4)
0.9928 0.9903
Week 12 DIFF
8.6 (10.3) -12.4 (13.2)
10.6 (11.2) -8.2 (9.5)
0.0084 0.0077
9.2 (12.3) -8.3 (10.1)
9.7 (10.0) -8.0 (12.1)
0.8596 0.7406
11.3 (13.7) -8.8 (13.4)
9.3 (7.0) -11.7 (12.9)
0.4307 0.6316
Micturition Baseline 8.7 (3.2) 8.3 (2.2) 8.1 (2.0) 8.2 (2.6) 8.4 (2.8) 9.3 (3.3) Week 4
DIFF 7.3 (2.4) -1.4 (2.6)
7.1 (2.3) -1.2 (1.6)
0.8572 0.8280
6.86 (1.9) -1.26 (1.7)
7.4 (2.6) -0.8 (1.8)
0.1110 0.2034
7.3 (2.0) -1.1 (2.1)
8.0 (2. 5) -1.3 (2.2)
0.3909 0.9495
Week 12 DIFF
7.1 (2.5) -1.5 (2.6)
6.7 (2.1) -1.7 (1.9)
0.4436 0.5990
6.7 (2.0) -1.4 (1.9)
7.3 (2.3) -0.9 (1.7)
0.1436 0.3051
7.4 (2.3) -1.0 (2.4)
7.1 (2.1) -2.1 (3.0)
0.3197 0.5051
Nocturnal Enuresis Baseline 4.4 (2.8) 4.4 (2.7) 4.1 (2.7) 3.8 (2.9) 4.0 (2.8) 3.6 (2.9) Week 4
DIFF 3.7 (3.0) -0.7 (2.0)
4.5 (2.9) 0.0 (2.0)
0.1035 0.0369
3.6 (2.9) -0.5 (2.4)
3.3 (2.8) -0.5 (1.9)
0.6303 0.2256
3.2 (2.7) -0.9 (2.1)
3.2 (2.6) -0.4 (2.0)
0.3771 0.3311
Week 12 DIFF
3.9 (3.1) -0.5 (2.4)
4.3 (2.9) -0.1 (2.2)
0.5174 0.3429
3.6 (2.7) -0.5 (2.1)
3.28 (2.82) -0.53 (2.42)
0.8036 0.8066
2.8 (2.6) -1.2 (2.2)
2.7 (2.8) -0.9 (2.1)
0.4525 0.1834
Volume Voided Baseline 70.28 (29.3) 69.9 (25.8) 86.8 (34.4) 86.3 (21.1) 114.1 (48.9) 119.1 (54.6) Week 4
DIFF 83.2 (35.0) 12.0 (26.9)
78.7 (32.7) 8.8 (20.7)
0.5689 0.5689
102.8(43.3) 15.1 (32.9)
91.1 (29.4) 2.5 (21.5)
0.0154 0.0033
122.6 (41.7) 7.5 (43.3)
123.8 (57.7) 4.8 (34.7)
0.9952 0.3933
Week 12 DIFF
88.8 (36.9) 17.2 (31.6)
82.1 (37.0) 12.2 (26.2)
0.4422 0.1826
106.8(38.7) 19.4 (32.4)
95.4 (30.0) 6.7 (23.1)
0.0242 0.0225
135.4 (69.2) 20.2 (65.8)
127.0 (71.8) 8.0 ( 36.8)
0.7469 0.2882
44

Table 22 (Continued) Tolterodine PR Placebo p-value1
p-value2
RACE = WHITE Incontinence Baseline 19.47 (13.8) 18.68 (14.1) Week 4
DIFF 12.07 (12.93) -7.40 (10.0)
13.27 (12.69) -5.45 (9.54)
0.1061 0.0524
Week 12 DIFF
8.88 (11.48) -10.8 (12.49)
9.81 (9.12) -8.62 (11.43)
0.2109 0.0242
Micturition Baseline 8.33 (2.68) 8.55 (2.62) Week 4
DIFF 7.05 (2.09) -1.28 (2.24)
7.47 (2.5) -1.09 (1.78)
0.1512 0.8696
Week 12 DIFF
6.91 (2.28) -1.44 (2.24)
7.04 (2.18) -1.54 (2.11)
0.9857 0.8009
Nocturnal Enuresis Baseline 4.20 (2.76) 4.03 (2.83) Week 4
DIFF 3.49 (2.86) -0.70 (2.18)
3.76 (2.84) -0.28 (1.97)
0.0964 0.0233
Week 12 DIFF
3.55 (2.87) -0.65 (2 .29)
3.51 (2.89) -0.44 (2.24)
0.6319 0.2418
Volume Voided Baseline 84.16 (39.3) 85.96 (36.7) Week 4
DIFF 97.8 (42.7) 13.06 (32.4)
92.68 (41.5) 5.96 (23.6)
0.0505 0.0042
Week 12 DIFF
103.86 (47.3) 20.60 (40.47)
95.74 (46.6) 10.50 (28.44)
0.0268 0.0018
1 Reviewer’s p-value using ANCOVA with baseline value, treatment, country 2 Reviewer’s p-value using Wilcoxon test † P-values are for exploratory purpose only
45
2.5 Summary and Conclusion
The Sponsor has submitted two clinical s tudies (study 008 and study 020) that contained the efficacy and safety data of Tolterodine prolonged release 2 mg QD capsules in pediatric patients aged 5 to 10 years with symptoms of urge incontinence, suggestive of detrusor instability.
Because the design of study 008 evolved directly from the knowledge gained in study 020, there are some inclusion criteria (such as the urinary frequency) that are different between these two studies, otherwise, the two studies were identical in design. Both studies 008 and 020 were randomized, double -blind, placebo-controlled, multicenter, and multinational studies.
The primary objective of each study was to compare the clinical efficacy of tolderodine PR 2 mg QD and placebo, as defined by the change in the number of incontinence episodes per week after 12 weeks of treatment, in children 5 to 10 years of age. The secondary efficacy endpoints included change from baseline in mean number of micturitions per 24 hours, mean volume voided per micturition, number of “gross” incontinence per week (Study 020), number dry days per week (Study 020), number of wet nights per week (Study 020), proportion of subjects who were continent (Study 020), number of nights with nocturnal enuresis (Study 008), Pediatric Enuresis Module to assess the Quality of Life (PEMQol ) (study 008), and parent/guardian assessment of treatment benefits.
Primary analysis was based on ITT population, and missing micturition chart data were replaced using the method of last observation carried forward (LOCF). In addition, missing baseline micturition chart data were extrapolated by the principle of last observation carried backward from the last visit in Study 020. Results of the primary endpoint in the tolderodine PR and placebo groups were compared with an analysis of variance (ANOVA) in Study 020, and analysis of covariance (ANCOVA) model in study 008. In addition, per-protocol population (PP) analyses without data imputation were conducted by the sponsor as supportive analyses.
Because the statistical reviewer does not agree with the imputation method and the primary analysis method (i.e. ANOVA) performed by the Sponsor in Study 020, additional analyses were performed by the reviewer that can be regarded as supportive analyses. The analyses include:
1. Analysis of covariance (ANCOVA) with baseline value of the efficacy variables, country, and country by treatment interaction (if p < 0.1) as covariates in the model
2. Wilcoxon rank sum test
In addition, per-protocol (PP) analyses as well as completer analyses (completer is defined as those subjects who have complete micturition charts) were performed by the statistical reviewer as supportive analyses in both studies.
Exploratory analyses were performed by the reviewer to both studies. In study 020, efficacy was evaluated in relation to baseline micturition and incontinence frequencies, as well as in relation to whether subjects were enrolled in UK or not because of the different recording method used in the UK center. In addition, subgroup analyses were performed based on gender, weight, age, and race.
46

Reviewer’s efficacy results and conclusion for study 020
A total of 342 patients were randomized, 235 subjects to tolterodine PR group and 107 subjects to placebo group. In the ITT population, improvement in the primary efficacy endpoint was evident based on the mean change from baseline to week 12 in the number of incontinence episodes per week seen in both the tolterodine and the placebo groups (mean reduction from baseline of 5.3 and 3.8, respectively, in daytime incontinence episodes per week). The ANOVA test was not statistically different (p=0.0689). The statistical reviewer repeated the analyses using ANCOVA and results showed no statistically significant difference between the two treatment groups as well (p=0.0607). Similar conclusions were achieved when a non-parametric test was used (p=0.0822), as well as when using the per-protocol (PP) population and the completer population (refer to Table 6).
For the secondary variables, mean volume voided for tolterodine PR was statistically significant compared to the placebo. Parent/guardian assessment of treatment benefit was also statistically significant in favor of the tolterodine group. Other secondary variables comparing the tolterodine PR group and placebo group were found not to be statistically significant.
The subgroup analyses showed a larger mean reduction in incontinence episodes frequency among children aged 4 to 6 years of age, and children who were male in the tolterodine PR group. The Sponsor also indicated that there was statistically significant difference between two treatment groups in terms of mean change from baseline in the number of incontinence per week among the subjects with pathological urinary frequency. The reviewer repeated t he analysis and found that when ANCOVA was used, the difference was not statistically significant . These trends in subgroup results would warrant new studies to confirm their validity.
Reviewer’s efficacy results and conclusion for study 008
A total of 369 patients were randomized, 252 subjects to tolterodine PR group and 117 subjects to placebo group. In the ITT population, reduction from baseline in the primary efficacy endpoint was evident based on the mean change from baseline to week 12 in the number of incontinence episodes per week seen in both the tolterodine and the placebo groups (mean reduction from baseline of 10.0 and 8.8, respectively, in daytime incontinence episodes per week). The ANCOVA test was not statistically different (p=0.403 ). The statistical reviewer repeated the analyses using a non-parametric test and results showed no statistically significant difference between the two treatment groups as well (p=0.0911) (These results are shown in Table 6).
For the secondary variables, mea n vo lume voided per micturition was statistically significant in favor of tolterodine . This was particularly noticeable among whites, including children who were aged 7 to 8 years old, children who weighed less than 36 kg and children that were male. Three treatment satisfaction variables (change in emotions, change in quality of life and change in symptoms) were found to be significantly different in both treatment groups favoring the tolterodine PR group.
Similar to Study 020, there were some indications in the subgroup analyses that the tolterodine PR may show benefit for children aged 4 to 6 years of age and children weighing less than 36 kg.
47

However, because the analyses are exploratory, such a supposition would warrant further investigation.
48

---------------------------------------------------------------------------------------------------------------------
---------------------------------------------------------------------------------------------------------------------
---------------------
This is a representation of an electronic record that was signed electronically and this page is the manifestation of the electronic signature.
/s/
Joan Buenconsejo 3/26/04 11:23:31 AM BIOMETRICS
Mike Welch 3/26/04 11:36:16 AM BIOMETRICS Concur with review.