s1: chapter 6 correlation dr j frost ([email protected]) last modified: 21 st november...
TRANSCRIPT


0 10 20 30 40 50 60 70 80 90 1000
102030405060708090
100
English Score
Mat
hs S
core
0 10 20 30 40 50 60 70 80 900
5
10
15
20
25
Age
Wee
kly
time
on in
tern
et (h
ours
)0 20 40 60 80 100 120 140
£0.00
£10.00
£20.00
£30.00
£40.00
£50.00
£60.00
£70.00
Distance travelled (km)
Cost
of t
rain
fare
0 10000 20000 30000 40000 50000 6000005
10152025303540
Number of people in city called 'Dave'
Crim
e Ra
te
Type of correlation:Weak positive correlation? ?
strength type
Weak negative correlation??
Strong positive correlation? ?
No correlation?
Recap of correlation

Recap
Variance
Recall that variance gives the extent to which the variable ‘varies’!
If we let then the variance is:

Covariance
We can extend variance to two variables.We might be interested in how one variable varies with another.
0 20 40 60 80 100 120 140£0.00
£10.00
£20.00
£30.00
£40.00
£50.00
£60.00
£70.00
Distance travelled (km)
Cost
of t
rain
fare
We can say that as distance (say ) increases, the cost (say ) increases. Thus the covariance of and is positive.
Covariance
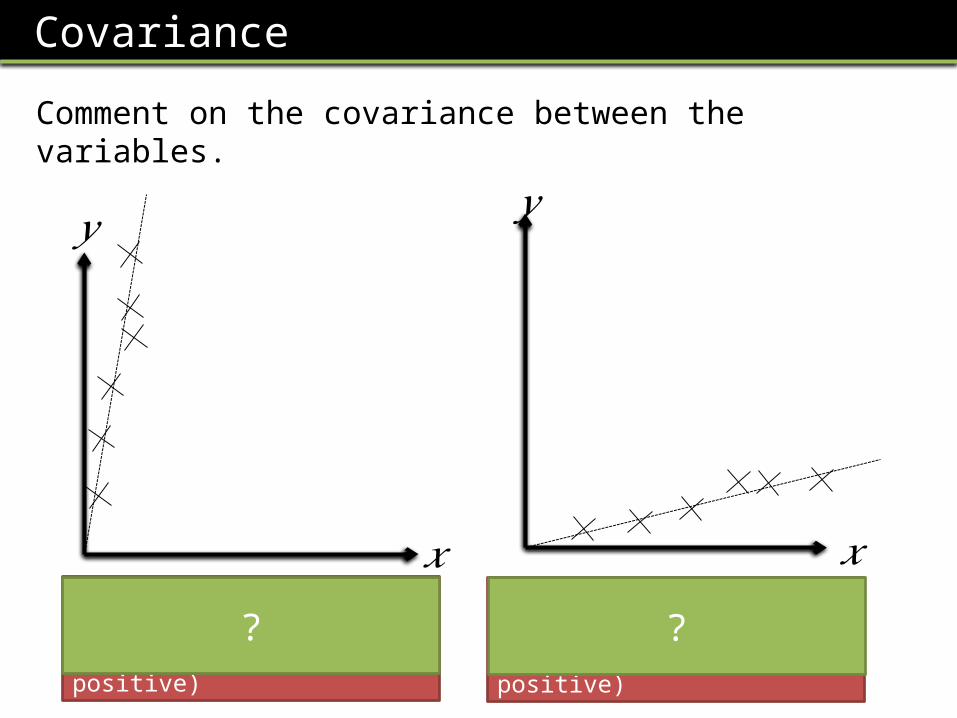
Comment on the covariance between the variables.
As increases, doesn’t change very much. So the covariance is small (but positive)
As increases, doesn’t change very much. So the covariance is small (but positive)
? ?
𝑥
𝑦 𝑦
𝑥

Covariance
Comment on the covariance between the variables.
As varies, doesn’t vary at all. So we say that variables are independent, and the covariance is 0.
?
𝑥
𝑦
As increases, decreases. So the covariance is negative.?
𝑥
𝑦
Covariance
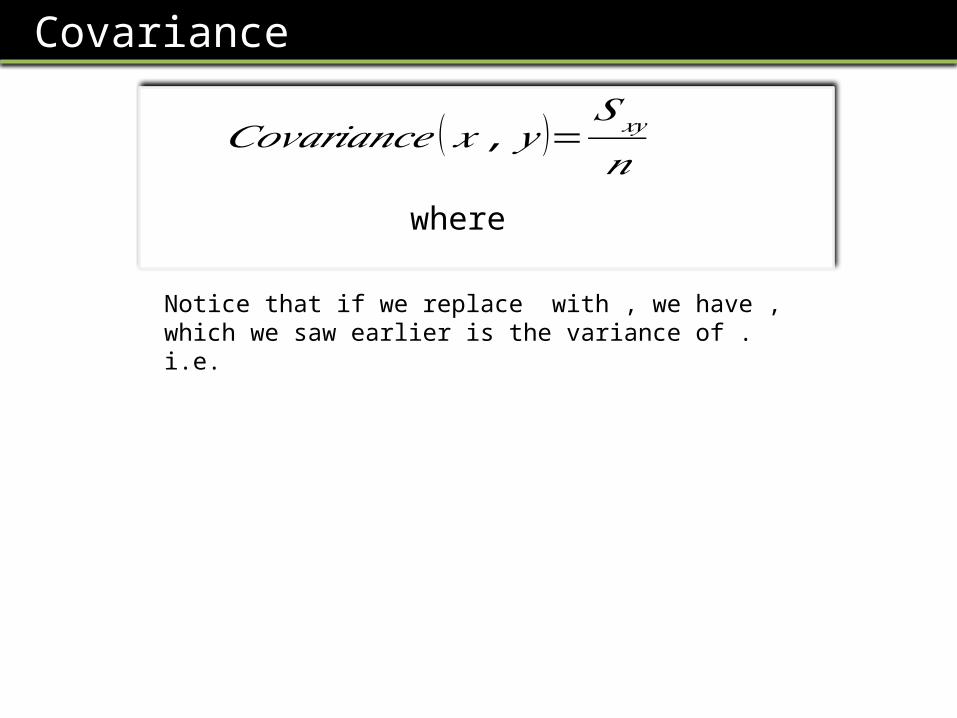
𝐶𝑜𝑣𝑎𝑟𝑖𝑎𝑛𝑐𝑒 (𝑥 , 𝑦 )=𝑆𝑥𝑦
𝑛where
Notice that if we replace with , we have , which we saw earlier is the variance of .i.e.

Simpler formulae for ,
You’re given these in the formula booklet, but it’s worth memorising them.Notice that the first is just the same formula as for variance, except we’ve just multiplied everything by , since
𝑆𝑥𝑥=Σ𝑥2−
(Σ 𝑥 )2
𝑛
𝑆𝑥𝑦=Σ 𝑥𝑦−(Σ 𝑥 ) (Σ 𝑦 )
𝑛
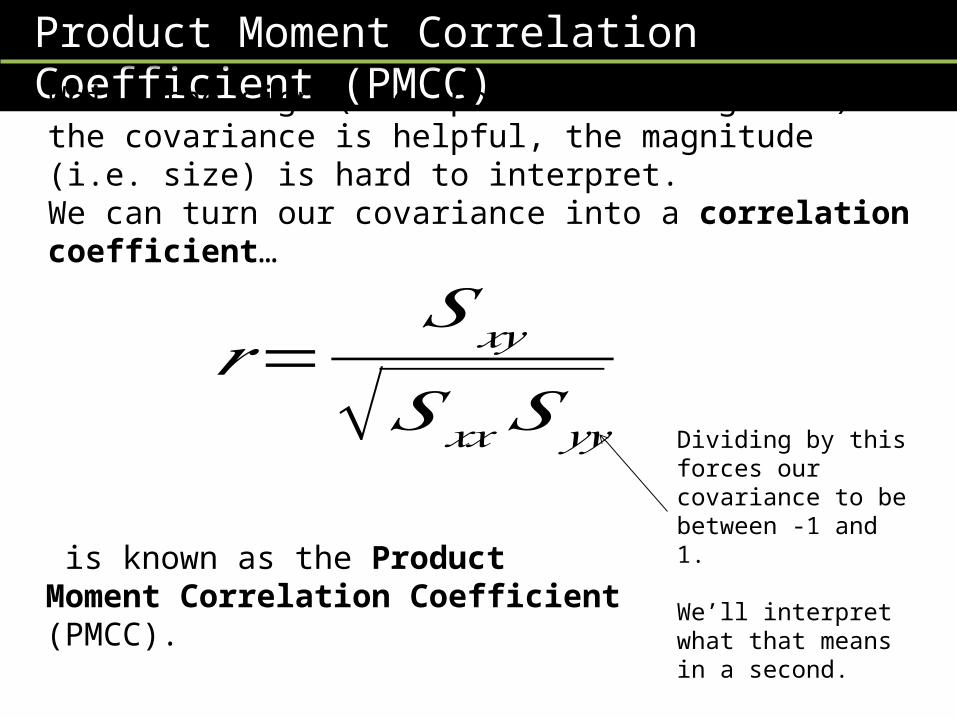
Product Moment Correlation Coefficient (PMCC)While the sign (i.e. positive or negative) of the covariance is helpful, the magnitude (i.e. size) is hard to interpret.We can turn our covariance into a correlation coefficient…
𝑟=𝑆𝑥𝑦
√𝑆𝑥𝑥𝑆𝑦𝑦 Dividing by this forces our covariance to be between -1 and 1.
We’ll interpret what that means in a second.
is known as the Product Moment Correlation Coefficient (PMCC).

Product Moment Correlation Coefficient (PMCC)
Baby A B C D E FHead Circumference () 31.1 33.3 30.0 31.5 35.0 30.2
Gestation Period () 36 37 38 38 40 40
Σ𝑥=191.1 Σ 𝑦=229Σ𝑥2=6105.39Σ 𝑦2=8753
Σ𝑥𝑦=7296.7
𝑆𝑥𝑥=Σ𝑥2−
(Σ 𝑥 )2
𝑛=18.855
𝑆 𝑦𝑦=Σ 𝑦2−
(Σ 𝑦 )2
𝑛=12.833
𝑆𝑥𝑦=Σ 𝑥𝑦−(Σ 𝑥 ) (Σ 𝑦 )
𝑛=3.05
𝑟=𝑆𝑥𝑦
√𝑆𝑥𝑥𝑆𝑦𝑦
=0.196
?
?
?
?
??
?
?
? 𝑛=6?

Product Moment Correlation Coefficient (PMCC)
? ? ?
?
? ? ?
?
Quite often the values are given to you in an exam.

Let’s do it on our calculators!
Baby A B C D E FHead Circumference () 31.1 33.3 30.0 31.5 35.0 30.2
Gestation Period () 36 37 38 38 40 40
• Put in Stats mode: MODE • Select for (i.e. calculations to do with linear
relationships)• Insert the data into your table. Use the arrow keys
and ‘=‘ to add the values.• Once done, press the button. This ‘accepts’ your
table of values.• Press , and choose for REGRESSION.• Select for . is now in your calculation, so press =.

Interpreting the PMCC
We’ve seen the PMCC varies between -1 and 1.
𝑟=1means
Perfect positive correlation.
𝑟=0means
No correlation
𝑟=−1means
Perfect negative correlation.
?
?
?

Interpreting the PMCC
0 10 20 30 40 50 60 70 80 90 1000
102030405060708090
100
English Score
Mat
hs S
core
0 10 20 30 40 50 60 70 80 900
5
10
15
20
25
AgeW
eekl
y tim
e on
inte
rnet
(hou
rs)
0 20 40 60 80 100 120 140£0.00
£10.00
£20.00
£30.00
£40.00
£50.00
£60.00
£70.00
Distance travelled (km)
Cost
of t
rain
fare
0 10000200003000040000500006000005
10152025303540
Number of people in city called 'Dave'
Crim
e Ra
te
𝑟=0.8
𝑟=0
𝑟=−0.4
𝑟=0.96

Exercises
Page 122 Exercise 6BQ1, 4, 5, 7, 9

Limitations of correlationOften there’s a 3rd variable that explains two others, but the two variables themselves are not connected.
Q1: The number of cars on the road has increased, and the number of DVD recorders bought has decreased. Is there a correlation between the two variables?
Buying a car does not necessarily mean that you will not buy a DVD recorder, so we cannot say there is a correlation between the two.
Q2: Over the past 10 years the memory capacity of personal computers has increased, and so has the average life expectancy of people in the western world. Is there are correlation between these two variables?
The two are not connected, but both are due to scientific development over time (i.e. a third variable!)
?
?

Effects of coding
We know that and
Therefore, if all our data values get k times bigger in size and values become times bigger, what happens to…
(Recap) The variance of : times as big
: times as big
: times as big
: times as big
: Unaffected!
?
?
?
?
?

Effects of coding
For the purposes of the S1 exam, you just need to remember that:
• Coding affects in the same way that the variance is affected. i.e. If the variance becomes 9 times larger, so does .
• If and/or are coded, the PMCC is unaffected.

𝑟=0.655
Example
1020 1032 1028 1034 1023 1038
320 335 345 355 360 380
𝑝=𝑥−10201
𝑞=𝑦−3005
0 12 8 14 3 18
4 7 9 11 12 16
We can now just find the PMCC of this new data set, and no further adjustment is needed.
?