s1. strategy for success. recommendations
TRANSCRIPT

1
S1. Strategy for success.
Recommendations.
Prepared by Alexander Mitiuriev
June, 2013
Rev. 4 EN
2
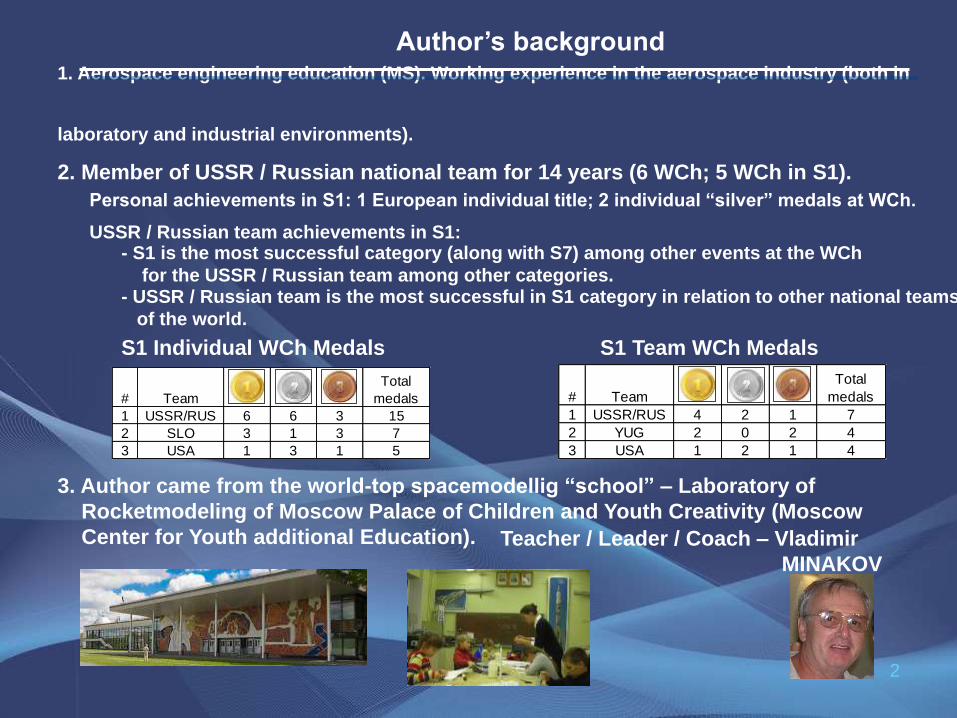
1. Aerospace engineering education (MS). Working experience in the aerospace industry (both in
laboratory and industrial environments). 2. Member of USSR / Russian national team for 14 years (6 WCh; 5 WCh in S1).
Personal achievements in S1: 1 European individual title; 2 individual “silver” medals at WCh.
3. Author came from the world-top spacemodellig “school” – Laboratory of
Rocketmodeling of Moscow Palace of Children and Youth Creativity (Moscow
Center for Youth additional Education).
USSR / Russian team achievements in S1: - S1 is the most successful category (along with S7) among other events at the WCh
for the USSR / Russian team among other categories.
Author’s background
S1 Individual WCh Medals S1 Team WCh Medals
- USSR / Russian team is the most successful in S1 category in relation to other national teams
of the world.
# Team
Total
medals
1 USSR/RUS 4 2 1 7
2 YUG 2 0 2 4
3 USA 1 2 1 4
# Team
Total
medals
1 USSR/RUS 6 6 3 15
2 SLO 3 1 3 7
3 USA 1 3 1 5
Teacher / Leader / Coach – Vladimir
MINAKOV

3
3 pupils of the “school” are on the tops of the 4 ranking-lists, based on
“Olympic” points: Individual “gold” – 3 pts; “silver” – 2 pts; “bronze” – 1 pt:
1.
World Championships
ILYIN Sergei
(USSR/RUS) 2
LEVYKH Alexander
(RUS)
2.
European
Championships
9
ILYIN Sergei
(Moscow)
3.
Soviet Union
Championships
4.
Russian
Championships
VORONOV Oleg
(Moscow)
6
10
Rank # 1-
Rank # 1-
Rank # 1-
Rank # 1-
3
21 points:
7
21 points:
1 1
33 points:
6 5
44 points:
4
Forward Notes 1. Some of the slides have remarks, explanations in the “Notes” part of the PPP.
These slides are marked with
2. All data are in metric: sketches dimensions – millimeters (mm);
Altitude – meters (m); mass – in gram (g).
3. The current presentation’s subject is Altitude models (S1).
However, some of the presented materials / conclusions are applicable
for other categories – S3 / 6 / 9 and / or S5.
5. Some of the conclusions in the presentation do
not have clear answer(s). Some of the problems /
selections between alternatives require
additional R&D or/and a simple executive choice
by the designer/modeler.
These cases are marked with
These cases are marked with or
4. Some of the data has been obtained from the book “Flight Dynamics of Missiles”
by Lebedev A.A. and Chernobrovkin L.S.,
"Mechanical engineering", 1973.
Data, obtained from this book, is marked with
The same data is presented in the book
«Sport Scale Models of Rockets» by Vladimir MINAKOV.

5
S1. Strategy for success. Recommendations
CONTENTS
1. Model geometry selection 6
2. Alignment 66
3. 2nd stage drag reduction 73
4. Materials 87
5. Engines 91
6. Piston 121
7. Streamer 146
8. Reliability issues 149
9. Technical results of the past World and European
Championships (top 10 contenders) 159
10. Key success factors of the past World Champions 180
11. They are HIGH because they are TALL 191
12. Conclision 195
6
1. Model geometry selection.
7
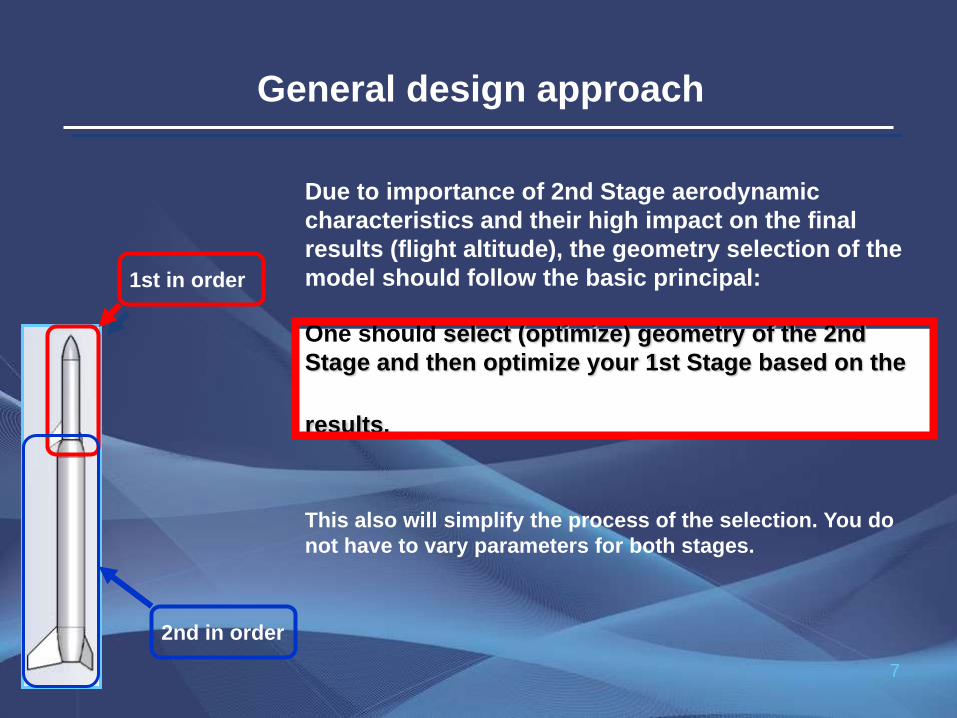
General design approach
1st in order
2nd in order
Due to importance of 2nd Stage aerodynamic
characteristics and their high impact on the final
results (flight altitude), the geometry selection of the
model should follow the basic principal:
One should select (optimize) geometry of the 2nd
Stage and then optimize your 1st Stage based on the
results.
This also will simplify the process of the selection. You do
not have to vary parameters for both stages.
8
1.1. Numerically simulated model of Cd total
9
1.1.1. Aerodynamic skin friction coefficient Cf
Skin friction coefficient Cf vs. Re number and transition location Xt, M=0
10
1.1.1. Aerodynamic skin friction coefficient Cf (con’t)
Graph interpretation of approximative dependence (2 Cf) vs. Re and Xt and
comparison with the original sources:
11
1.1.1.1. Location of Laminar-to-Turbulent flow transition point Xt
Factors, affecting location of Laminar-to-Turbulent flow transition point Xt
(critical Re value (Ret)): 1. Roughness of external surface
2. Single surface asperities
3. MICRO-waviness and MACRO-waviness of
external surface
12
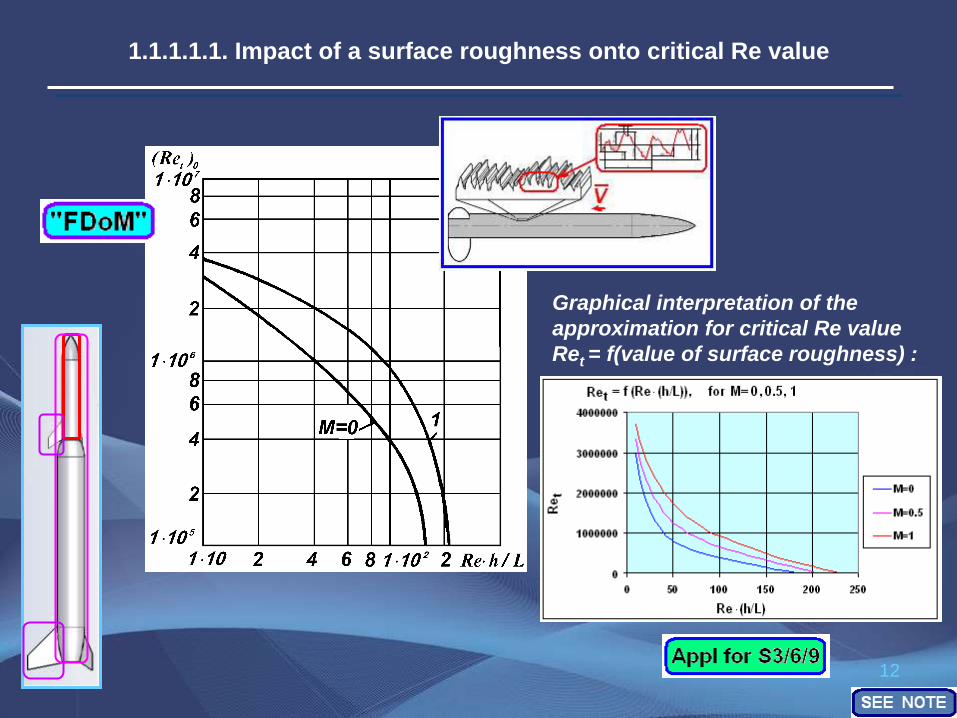
1.1.1.1.1. Impact of a surface roughness onto critical Re value
Graphical interpretation of the
approximation for critical Re value
Ret = f(value of surface roughness) :
13
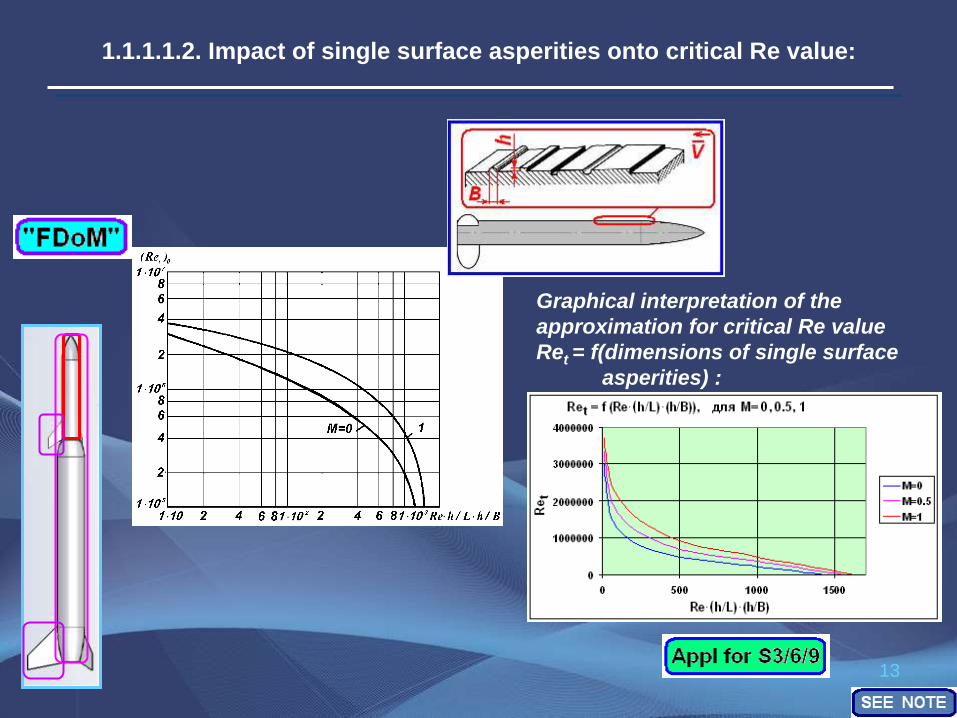
1.1.1.1.2. Impact of single surface asperities onto critical Re value:
Graphical interpretation of the
approximation for critical Re value
Ret = f(dimensions of single surface
asperities) :
14
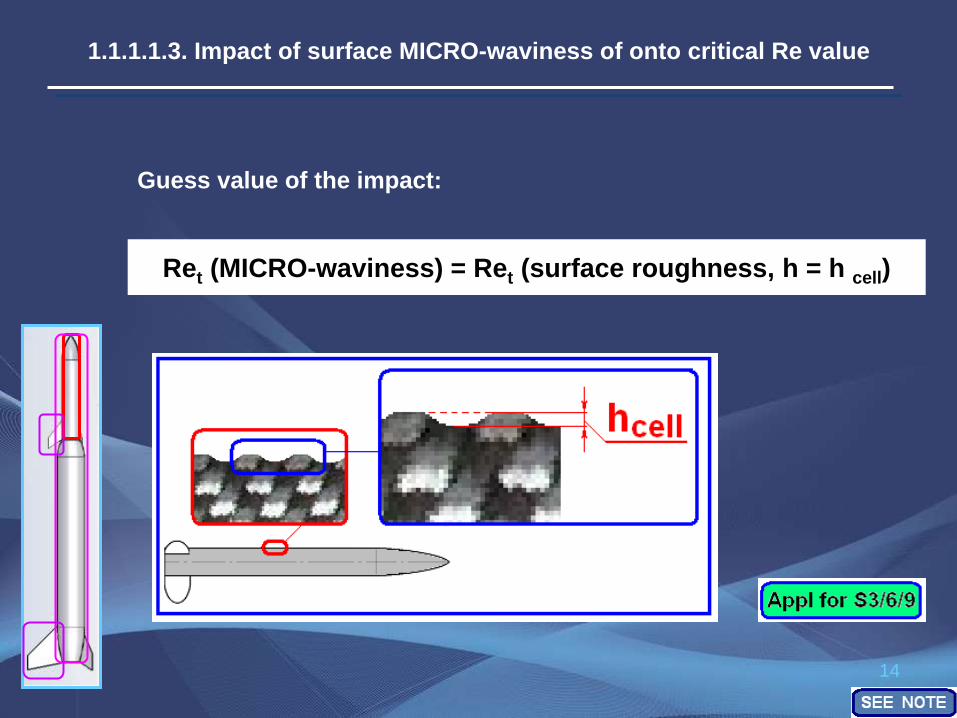
1.1.1.1.3. Impact of surface MICRO-waviness of onto critical Re value
Guess value of the impact:
Ret (MICRO-waviness) = Ret (surface roughness, h = h cell)

15
1.1.1.1.4. Impact of the MACRO-waviness of external surface onto critical
Re value
Ret (MACRO-waviness) = Ret (surface roughness, h = h wave)
Guess value of the impact:
16
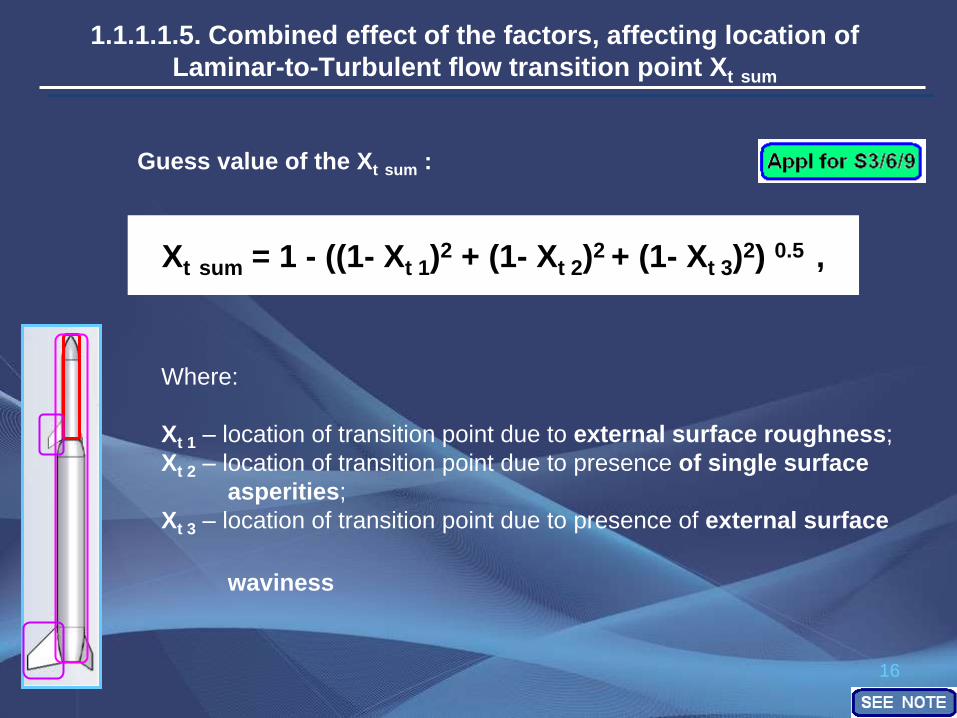
1.1.1.1.5. Combined effect of the factors, affecting location of
Laminar-to-Turbulent flow transition point Xt sum
Guess value of the Xt sum :
Where:
Xt 1 – location of transition point due to external surface roughness;
Xt 2 – location of transition point due to presence of single surface
asperities;
Xt 3 – location of transition point due to presence of external surface
waviness
Xt sum = 1 - ((1- Xt 1)2 + (1- Xt 2)
2 + (1- Xt 3)2) 0.5 ,
17
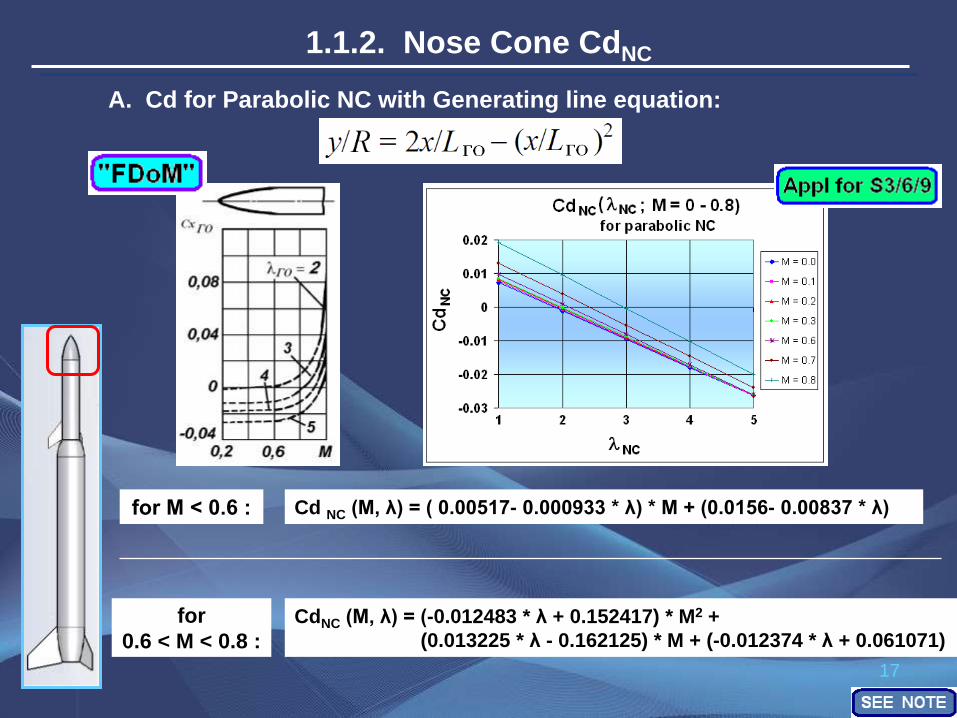
1.1.2. Nose Cone CdNC
A. Cd for Parabolic NC with Generating line equation:
Cd NC (M, λ) = ( 0.00517- 0.000933 * λ) * M + (0.0156- 0.00837 * λ) for М < 0.6 :
for
0.6 < M < 0.8 :
CdNC (M, λ) = (-0.012483 * λ + 0.152417) * M2 +
(0.013225 * λ - 0.162125) * M + (-0.012374 * λ + 0.061071)
18
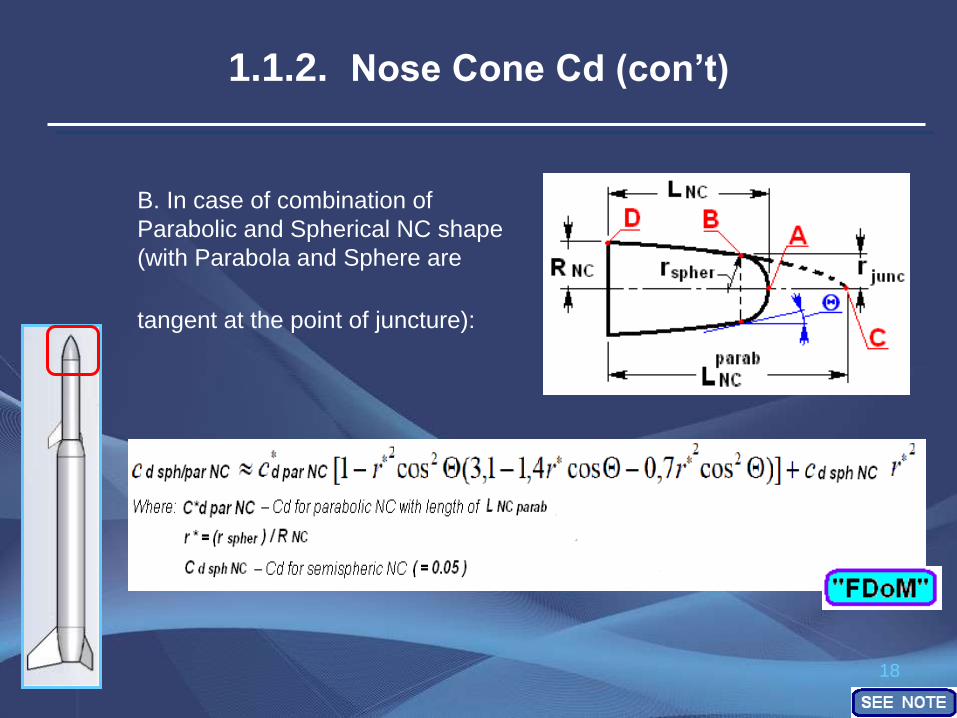
1.1.2. Nose Cone Cd (con’t)
B. In case of combination of
Parabolic and Spherical NC shape
(with Parabola and Sphere are
tangent at the point of juncture):
19
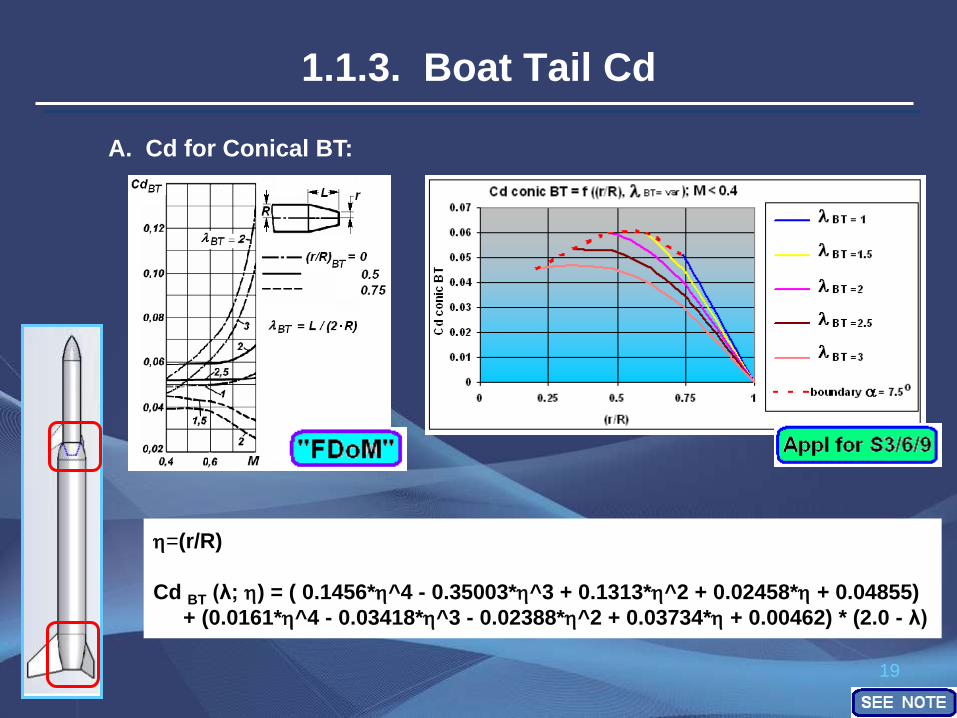
1.1.3. Boat Tail Cd
A. Cd for Conical BT:
=(r/R)
Cd BT (λ; ) = ( 0.1456*^4 - 0.35003*^3 + 0.1313*^2 + 0.02458* + 0.04855)
+ (0.0161*^4 - 0.03418*^3 - 0.02388*^2 + 0.03734* + 0.00462) * (2.0 - λ)
20
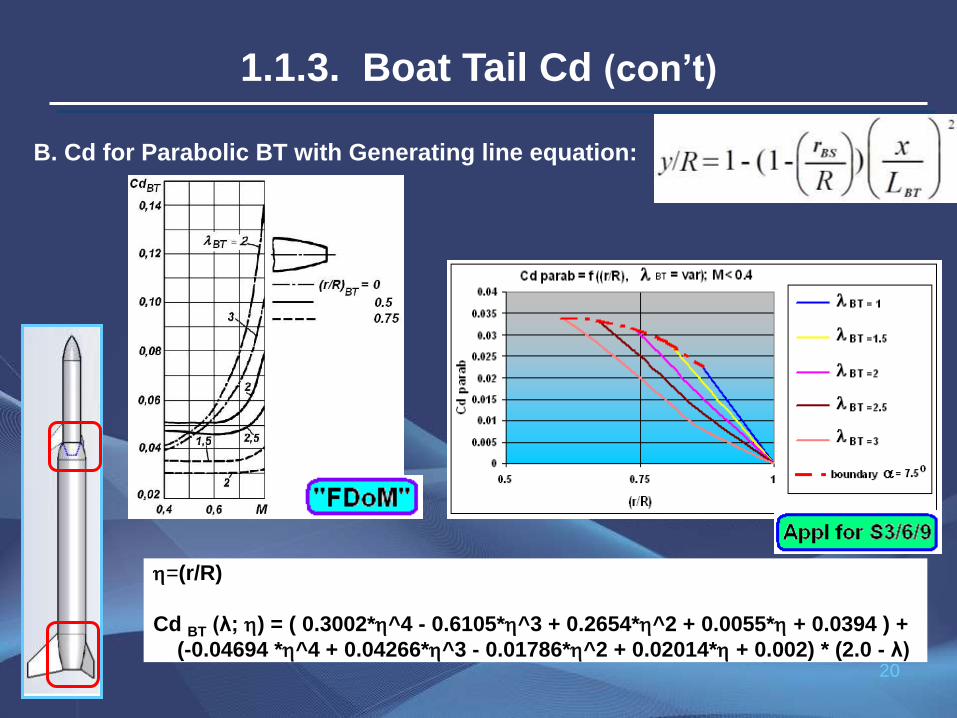
B. Cd for Parabolic BT with Generating line equation:
=(r/R)
Cd BT (λ; ) = ( 0.3002*^4 - 0.6105*^3 + 0.2654*^2 + 0.0055* + 0.0394 ) +
(-0.04694 *^4 + 0.04266*^3 - 0.01786*^2 + 0.02014* + 0.002) * (2.0 - λ)
1.1.3. Boat Tail Cd (con’t)
21
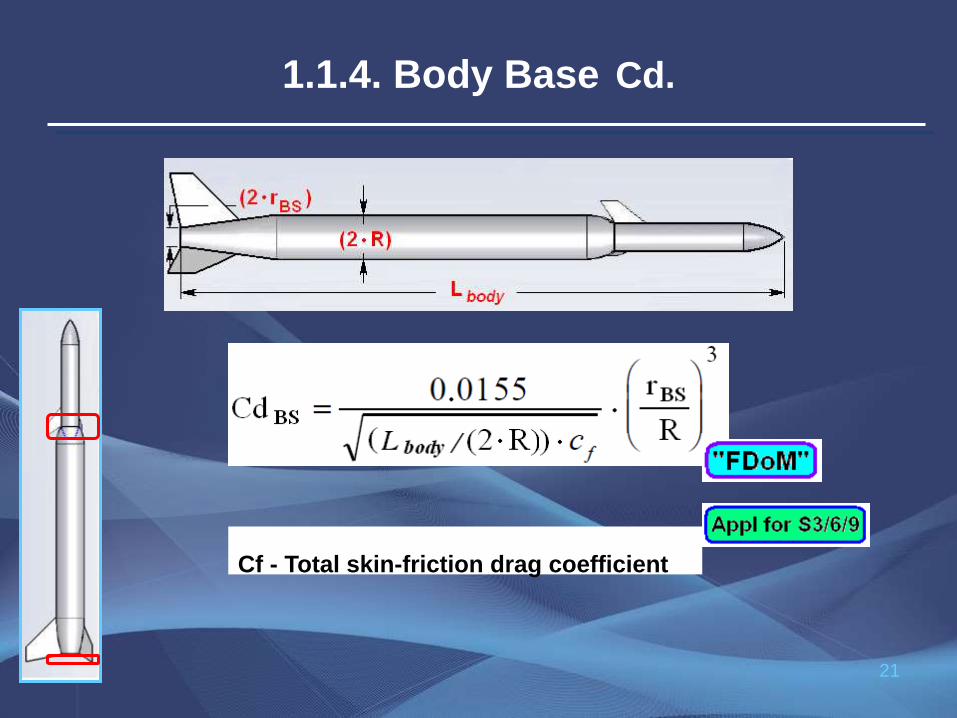
Cf - Total skin-friction drag coefficient
1.1.4. Body Base Cd.
22
1.2. Cases under consideration and assumptions
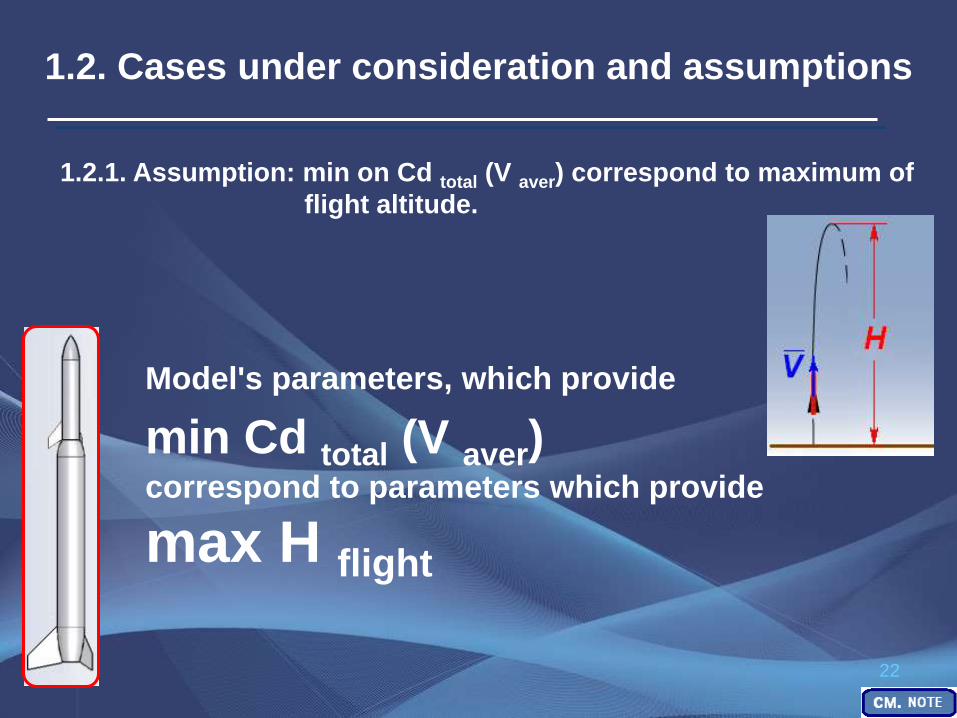
1.2.1. Assumption: min on Cd total (V aver) correspond to maximum of
flight altitude.
Model's parameters, which provide
min Cd total (V aver) correspond to parameters which provide
max H flight

23
Assumption:
Cd equal to sum of model’s elements
Cds (NC, body, BT, BS, fins) :
Cd = (Cd)i
1.2.2. Additivity Concept for Cd total and Cd of the model’s parts
24
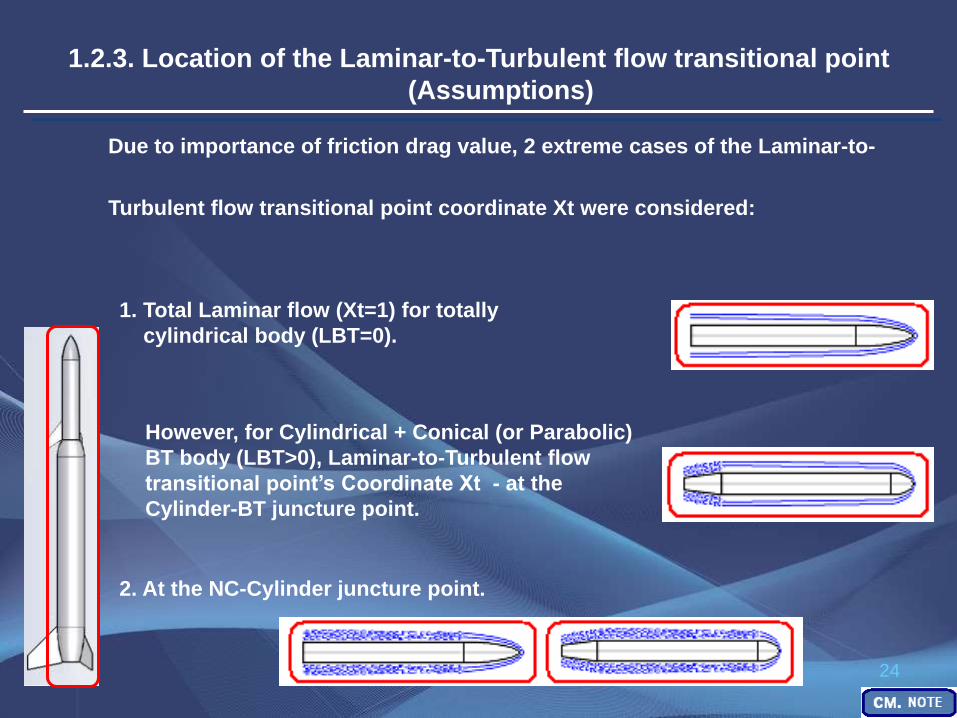
Due to importance of friction drag value, 2 extreme cases of the Laminar-to-
Turbulent flow transitional point coordinate Xt were considered:
1. Total Laminar flow (Xt=1) for totally
cylindrical body (LBT=0).
However, for Cylindrical + Conical (or Parabolic)
BT body (LBT>0), Laminar-to-Turbulent flow
transitional point’s Coordinate Xt - at the
Cylinder-BT juncture point.
2. At the NC-Cylinder juncture point.
1.2.3. Location of the Laminar-to-Turbulent flow transitional point
(Assumptions)
25
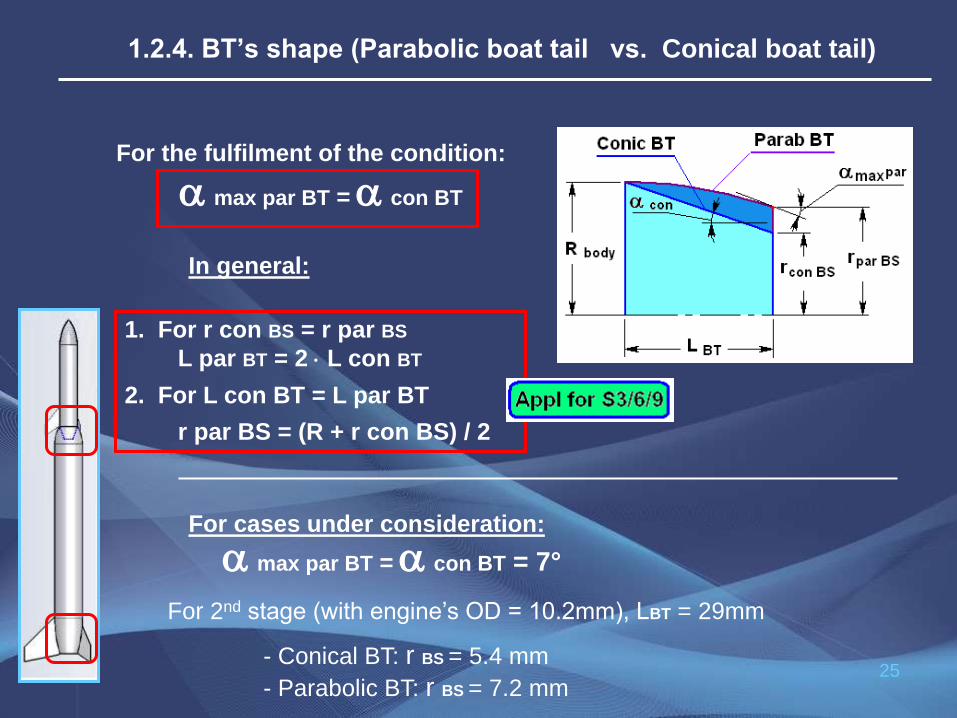
For the fulfilment of the condition:
max par BT = con BT
For cases under consideration: max par BT = con BT = 7°
- Parabolic BT: r BS = 7.2 mm - Conical BT: r BS = 5.4 mm
For 2nd stage (with engine’s OD = 10.2mm), LBT = 29mm
In general:
1. For r con BS = r par BS
L par BT = 2 L con BT
2. For L con BT = L par BT
r par BS = (R + r con BS) / 2
1.2.4. BT’s shape (Parabolic boat tail vs. Conical boat tail)

26
- Fins Shape
For simplicity of the analysis:
Fins are oval-shaped (close to elliptical shape) with semispan equal
to root chord length.
- Fins dimensions.
Fins total area (or dimension bk) was taken in order to obtain static
stability margin equal to 4/3 the caliber.
1.2.5. Fins

27
1st stage: Cd total was calculated for
V = 40 m/sec Vaverage for 1st stage.
1.2.6. Model’s flight velocities for Cd total calculation
2nd stage: Cd total was calculated for
V = 80 m/sec Vaverage for 2nd stage.
28
1.3. Numerical analysis results.
2nd stage

29
Predominantly
Laminar flow cases:
Predominantly
Turbulent flow cases:
1.3.1. Length of the 2nd stage

30
Conclusions:
1. In the cases of predominantly Laminar flow: the longer
2nd stage (within reasonable length range) the lower the
Cd value. 2. In the cases of predominantly Turbulent flow: there is
the optimal 2nd stage length (about 180 mm).
1.3.1. Length of the 2nd stage (con’t 1)

31
Results for 2nd stage total length of L sum = 180 mm:
Conclusions (con’t):
1.3.1. Length of the 2nd stage (con’t 2)
3. For predominantly Laminar flow:
The 2nd stage without BT has a greater Cd total value than the stage
with BT, conical or parabolic (approximately 4-3 % respectively
greater).
For predominantly Laminar flow :
x t Cd fric Cd NC Cd BT Cd BS Cd fins Cd tot
No BT 1 0.047 -0.005 0 0.137 0.031 0.208
Parab BT 0.845 0.079 0.009 0.027 0.056 0.031 0.202
Conic BT 0.861 0.075 0.01 0.059 0.024 0.031 0.199
32
Results for 2nd stage total length of L sum = 180 mm:
Conclusions (con’t):
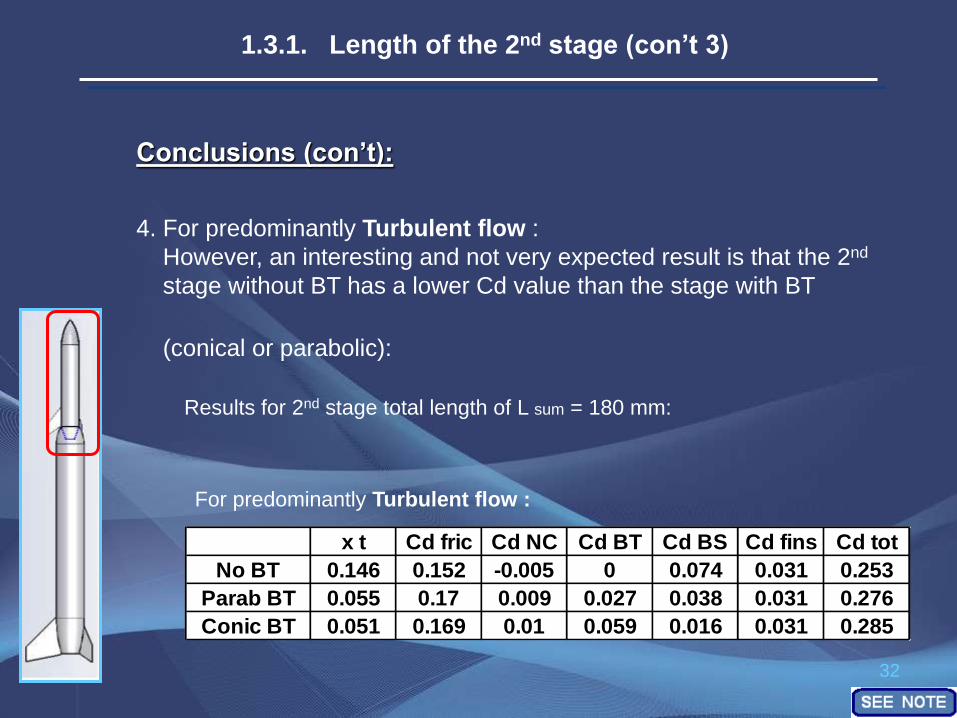
1.3.1. Length of the 2nd stage (con’t 3)
4. For predominantly Turbulent flow :
However, an interesting and not very expected result is that the 2nd
stage without BT has a lower Cd value than the stage with BT
(conical or parabolic):
For predominantly Turbulent flow :
x t Cd fric Cd NC Cd BT Cd BS Cd fins Cd tot
No BT 0.146 0.152 -0.005 0 0.074 0.031 0.253
Parab BT 0.055 0.17 0.009 0.027 0.038 0.031 0.276
Conic BT 0.051 0.169 0.01 0.059 0.016 0.031 0.285
33
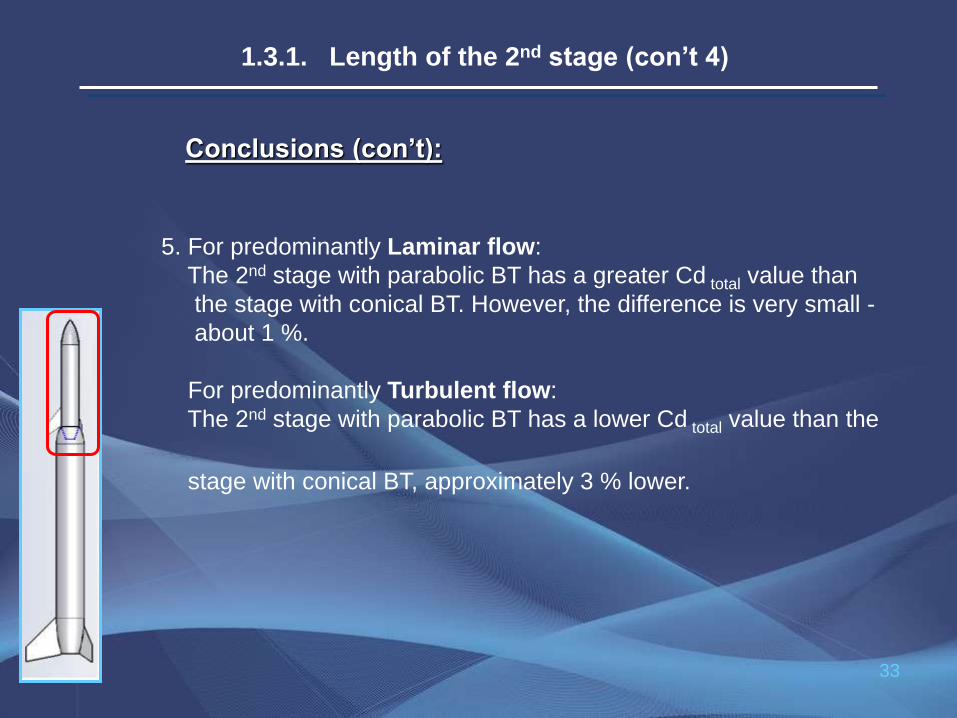
5. For predominantly Laminar flow:
The 2nd stage with parabolic BT has a greater Cd total value than
the stage with conical BT. However, the difference is very small -
about 1 %.
For predominantly Turbulent flow:
The 2nd stage with parabolic BT has a lower Cd total value than the
stage with conical BT, approximately 3 % lower.
Conclusions (con’t):
1.3.1. Length of the 2nd stage (con’t 4)

34
1.3.2. Length of the 2nd stage BT
35
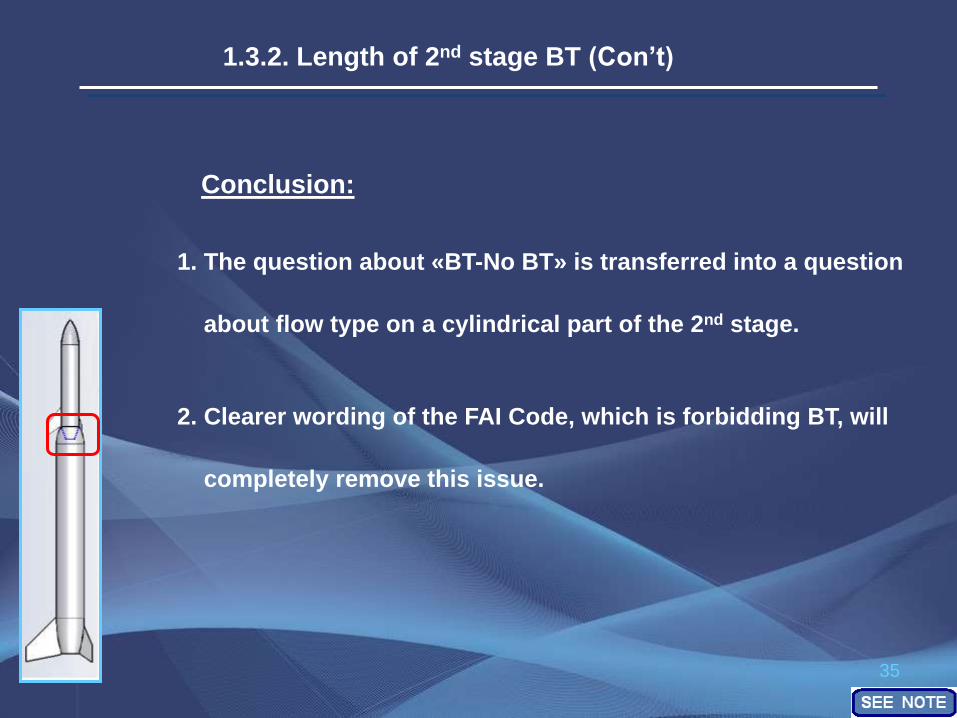
Conclusion:
1. The question about «BT-No BT» is transferred into a question
about flow type on a cylindrical part of the 2nd stage.
1.3.2. Length of 2nd stage BT (Con’t)
2. Clearer wording of the FAI Code, which is forbidding BT, will
completely remove this issue.
36
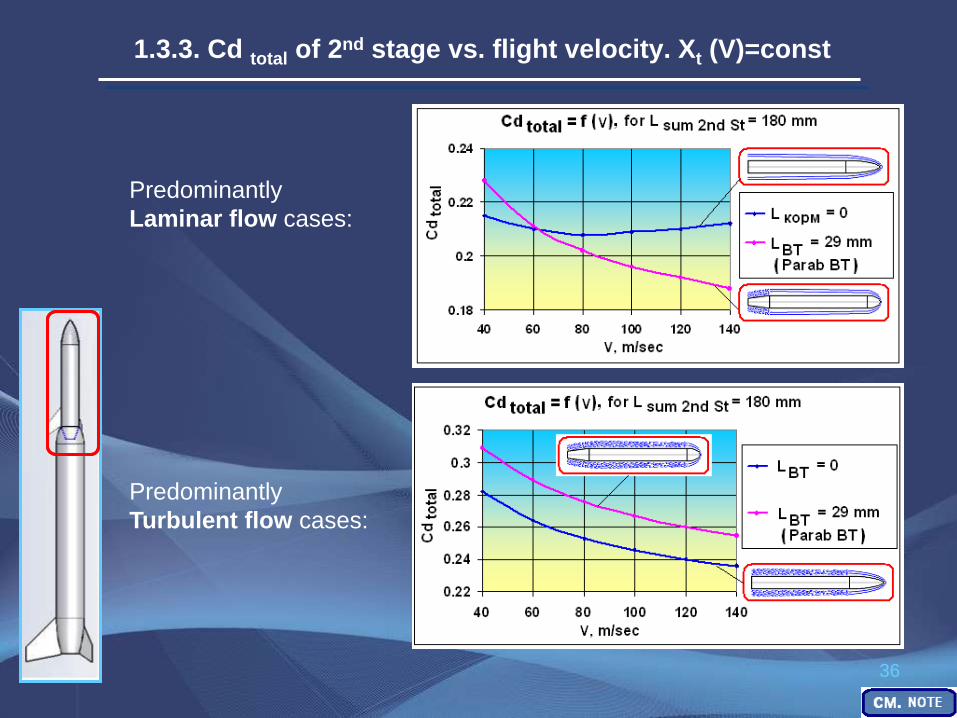
1.3.3. Cd total of 2nd stage vs. flight velocity. Xt (V)=const
Predominantly
Laminar flow cases:
Predominantly
Turbulent flow cases:
37
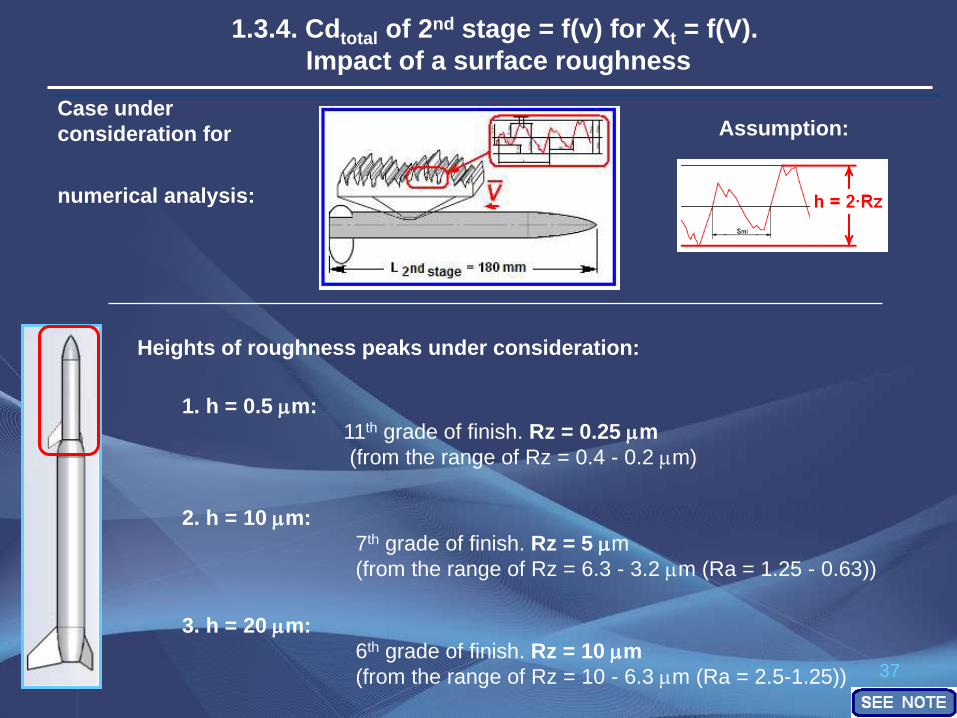
1.3.4. Cdtotal of 2nd stage = f(v) for Xt = f(V).
Impact of a surface roughness
Case under
consideration for
numerical analysis:
Heights of roughness peaks under consideration:
3. h = 20 mm:
6th grade of finish. Rz = 10 mm
(from the range of Rz = 10 - 6.3 mm (Ra = 2.5-1.25))
Assumption:
1. h = 0.5 mm:
11th grade of finish. Rz = 0.25 mm
(from the range of Rz = 0.4 - 0.2 mm)
2. h = 10 mm:
7th grade of finish. Rz = 5 mm
(from the range of Rz = 6.3 - 3.2 mm (Ra = 1.25 - 0.63))

38
1.3.4.1. Results of numerical analysis

39
1.3.4.2. Results review
1. Height of roughness peaks h = 20 mm:
A. For low V - fully Laminar flow:
Re < Ret , Xt =1
V Re Cdfric Cdtotal B. For V Vcrit (Re Ret) (Xt 1(-))
The minimum is occurred at the
Cdtotal =f(V) graph
i.e. Cdtotal (V) / V = 0 for Re Ret
V Re Xt Cdfric Cdtotal
C. For V Vcrit (Re Ret) (1> Xt >0)
V Re Cdfric Cdtotal D. For Ret=0 (Xt =0) - fully Turbulent flow:
V Re Cdfric Cdtotal
E. Fully Turbulent flow for Re Re* (Ret=0, Xt =0):
The maximum is occurred at the Cdtotal =f(V) graph
i.e. Cdtotal (V) / V = 0 for Xt =0
V Re Xt Cdfric Cdtotal

40
1.3.4.2. Results review (con't 1)
2. Height of roughness peaks h = 10 mm:
The minimum is occurred at the Cdtotal =f(V) graph,
i.e. Cdtotal (V) / V = 0 at some V
Qualitatively Cdtotal (V) plot for h = 10 mm is
similar to Cdtotal (V) plot for h = 20 mm.
However, Xt =0 only at V=240 m/sec
3. Height of roughness peaks h = 0.5 mm:
Fully Laminar flow (Xt =1) for the entire
range of V = 20 … 240 m/sec
However:
V Re Cdfric
CdBS
Cdtotal
41
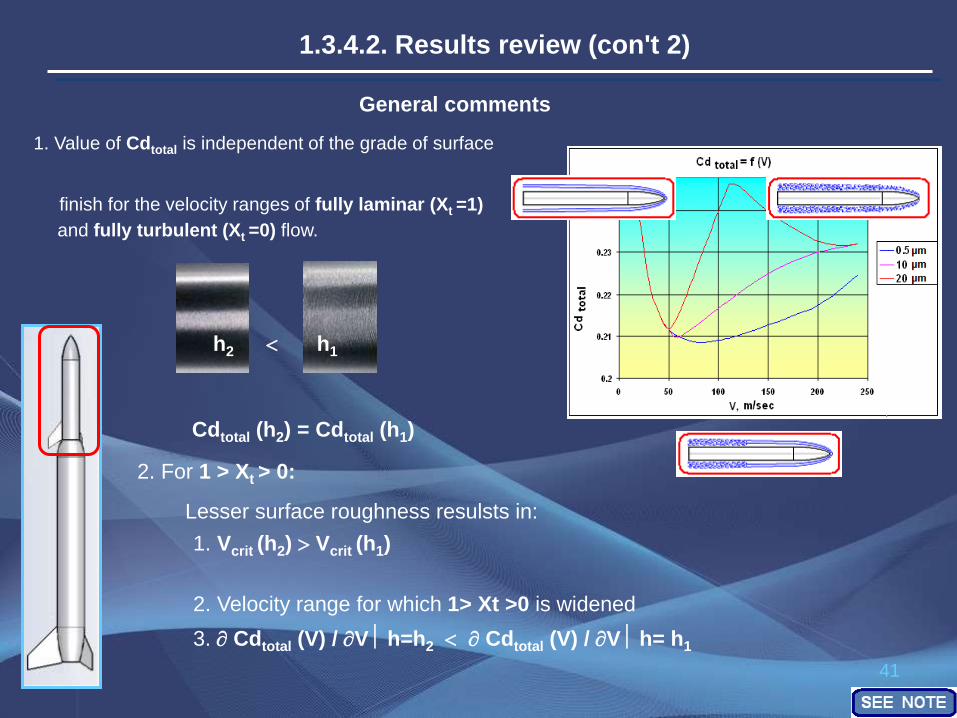
1.3.4.2. Results review (con't 2)
General comments
1. Value of Cdtotal is independent of the grade of surface
finish for the velocity ranges of fully laminar (Xt =1)
3. Cdtotal (V) / V h=h2 Cdtotal (V) / V h= h1
and fully turbulent (Xt =0) flow.
h2 h1
Cdtotal (h2) = Cdtotal (h1) 2. For 1 > Xt > 0:
Lesser surface roughness resulsts in:
1. Vcrit (h2) Vcrit (h1)
2. Velocity range for which 1> Xt >0 is widened
42
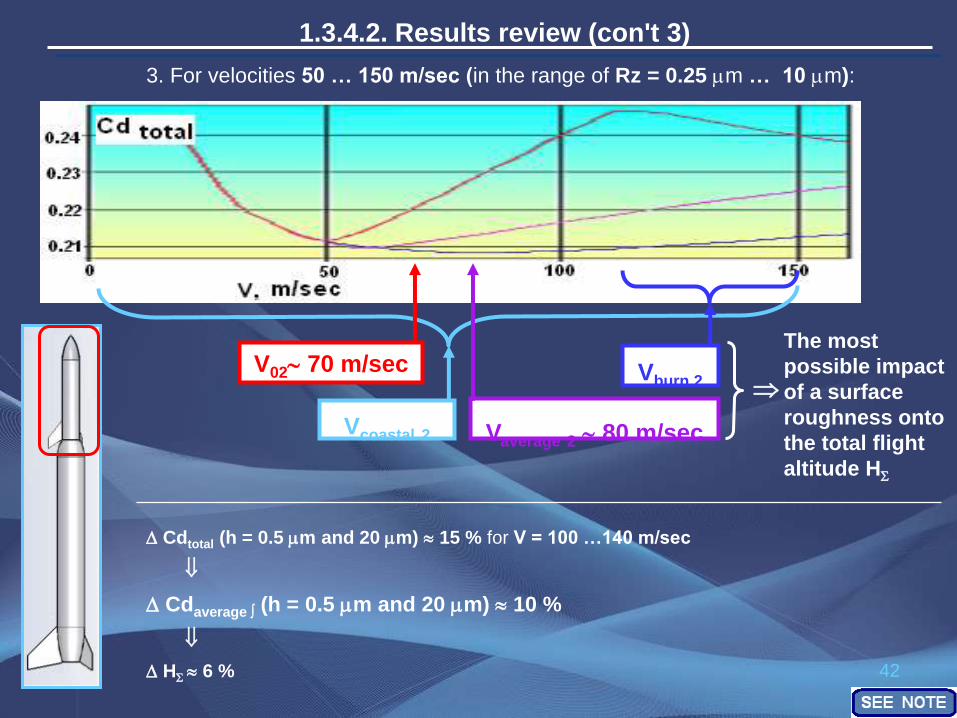
1.3.4.2. Results review (con't 3)
3. For velocities 50 … 150 m/sec (in the range of Rz = 0.25 mm … 10 mm):
V02 70 m/sec Vburn 2 Vcoastal 2 Vaverage 2 80 m/sec
The most
possible impact
of a surface
roughness onto
the total flight
altitude H
Cdtotal (h = 0.5 mm and 20 mm) 15 % for V = 100 …140 m/sec
Cdaverage (h = 0.5 mm and 20 mm) 10 %
H 6 %
43
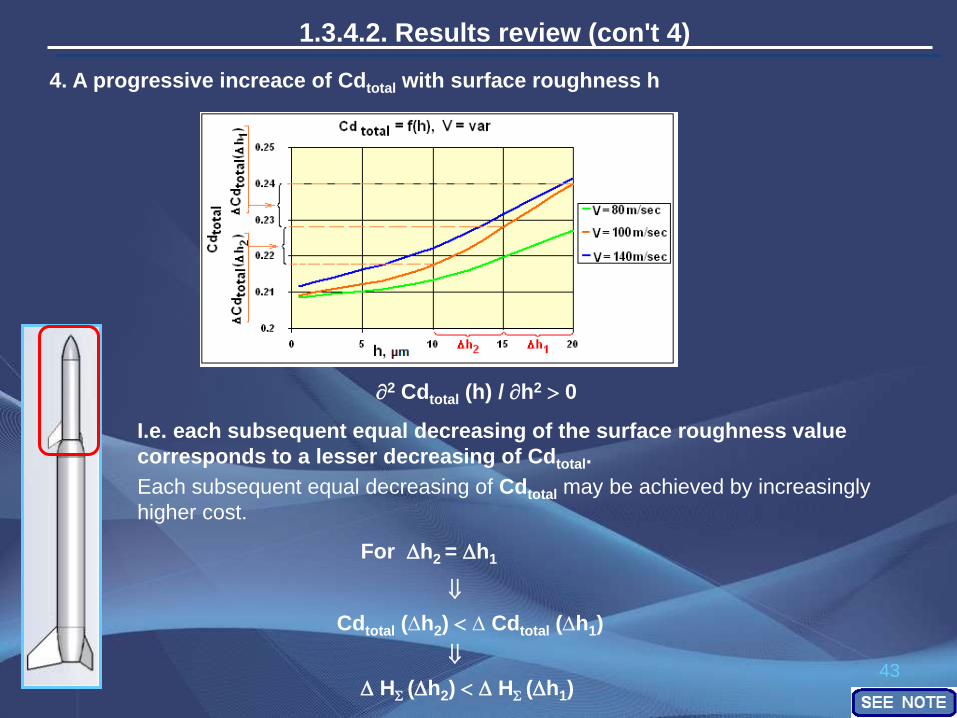
1.3.4.2. Results review (con't 4)
4. A progressive increace of Cdtotal with surface roughness h
2 Cdtotal (h) / h2 0
I.e. each subsequent equal decreasing of the surface roughness value
corresponds to a lesser decreasing of Cdtotal.
For h2 = h1
Cdtotal (h2) Cdtotal (h1)
H (h2) H (h1)
Each subsequent equal decreasing of Cdtotal may be achieved by increasingly
higher cost.

44
1.3.4.2. Results review (con't 5)
5. Paradox of an existence of the Cdtotal(h) curve minimum
h Cdfric
For fully laminar flow and V Vcrit
CdBS = 2 … 3 Cdfric significant impact of CdBS onto Cdtotal
h CdBS Cdtotal
The minimum is occurred at the Cdtotal =f(h) graph,
i.e. Cdtotal (h) / h = 0) for V Vcrit (+)
DESIGN and FABRICATION approaches combining
min Cdfric (at min h) and min CdBS is necessary

45
1.3.4.3. Practical conclusions
2. Take into a consideration the type of the dependence Cdtotal(V)
while selecting engines parameters (burn time) for 2nd stages.
1. Make the external surface as smooth as possible
(with the lowest surface rougness).
46
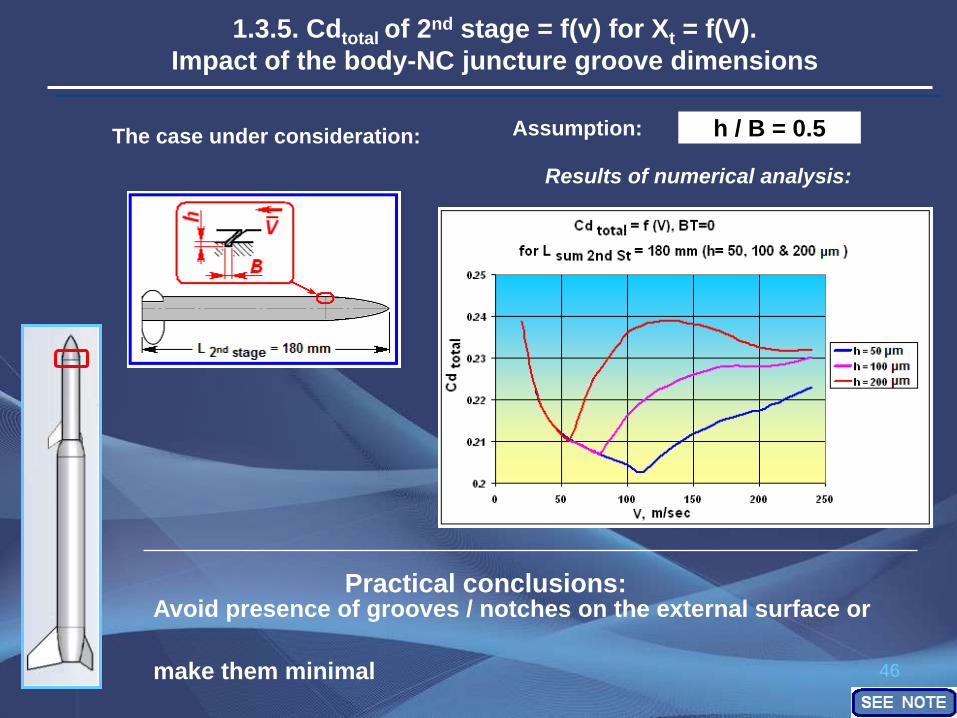
1.3.5. Cdtotal of 2nd stage = f(v) for Xt = f(V).
Impact of the body-NC juncture groove dimensions
Assumption:
Results of numerical analysis:
h / B = 0.5
Practical conclusions: Avoid presence of grooves / notches on the external surface or
make them minimal
The case under consideration:

47
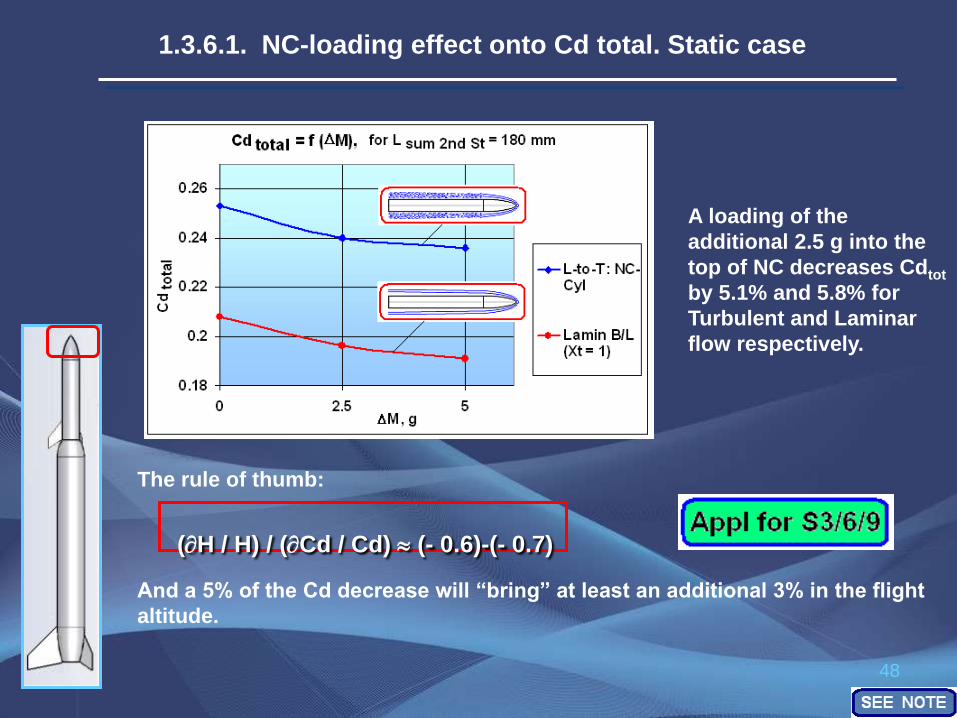
M Position of CG move forward S fins Cd fins Cd total
2. NC is loaded with lead, density Pb = 11.34 g/cm^3
1. M 2nd
Stage ( M =0) = 15.4 g
1.3.6. NC-loading effect onto Cd total
48
A loading of the
additional 2.5 g into the
top of NC decreases Cdtot
by 5.1% and 5.8% for
Turbulent and Laminar
flow respectively.
And a 5% of the Cd decrease will “bring” at least an additional 3% in the flight
altitude.
The rule of thumb:
(H / H) / (Cd / Cd) (- 0.6)-(- 0.7)
1.3.6.1. NC-loading effect onto Cd total. Static case
49
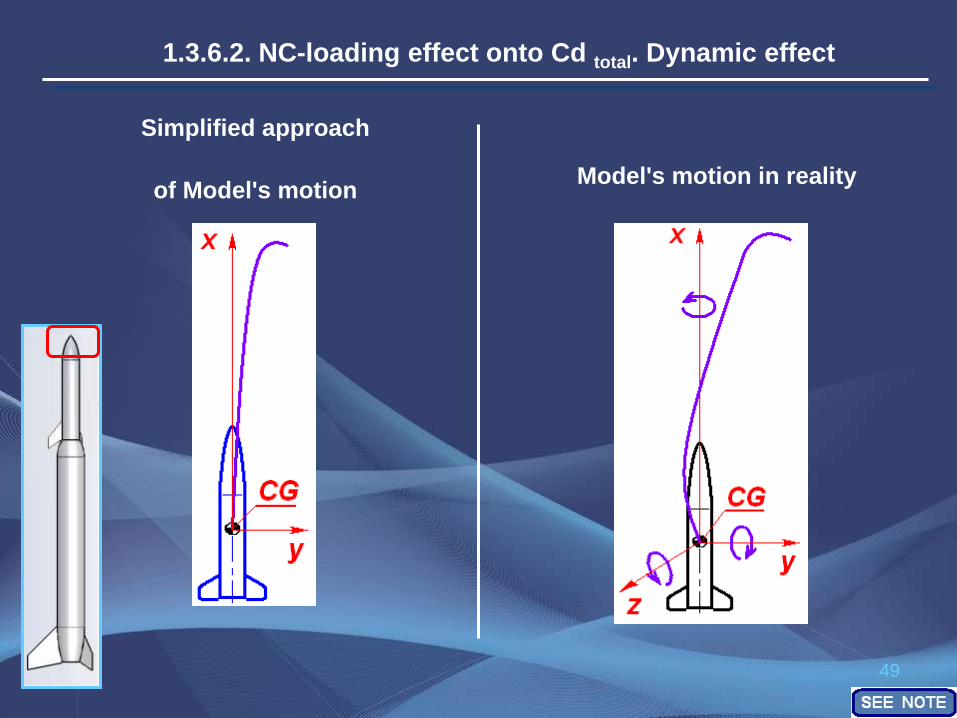
Simplified approach
of Model's motion
1.3.6.2. NC-loading effect onto Cd total. Dynamic effect
Model's motion in reality
50 50
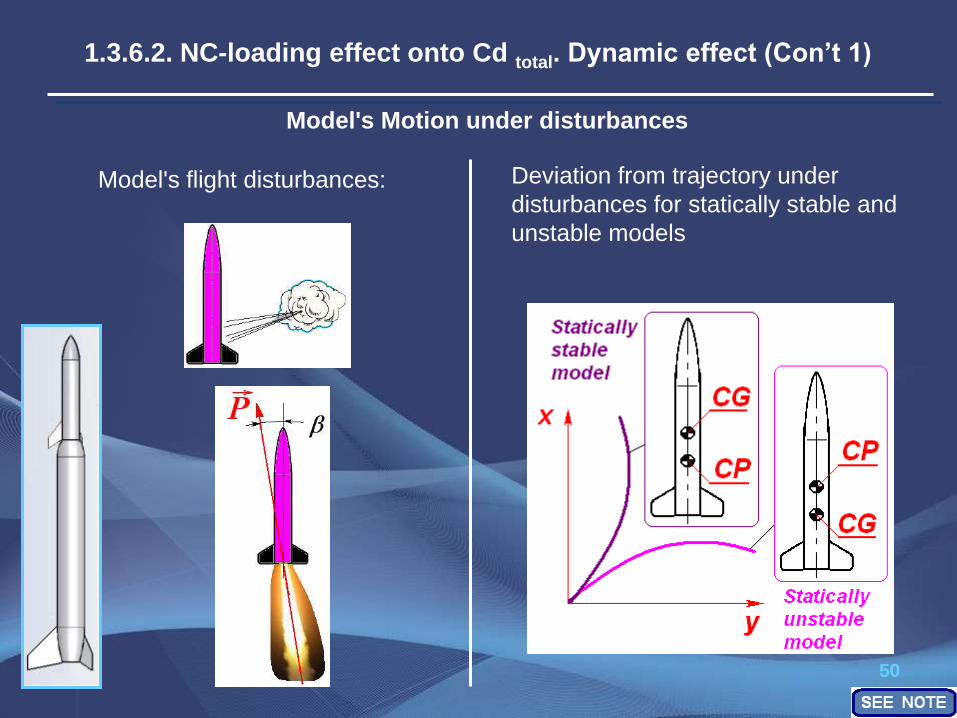
1.3.6.2. NC-loading effect onto Cd total. Dynamic effect (Con’t 1)
Model's Motion under disturbances
Model's flight disturbances: Deviation from trajectory under
disturbances for statically stable and
unstable models
51
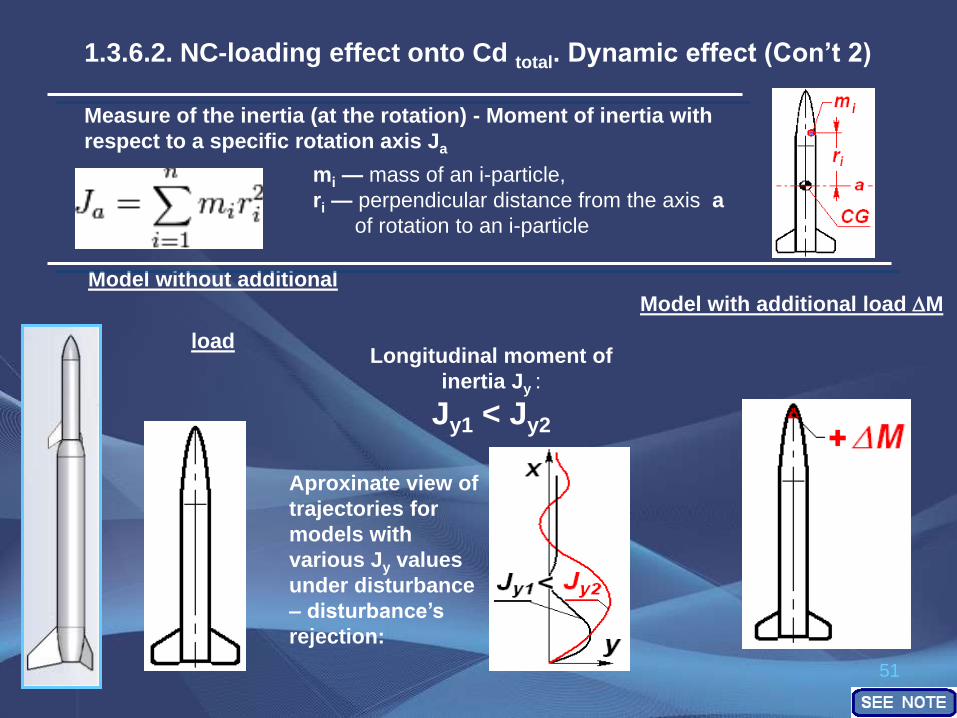
1.3.6.2. NC-loading effect onto Cd total. Dynamic effect (Con’t 2)
Measure of the inertia (at the rotation) - Moment of inertia with
respect to a specific rotation axis Ja
mi — mass of an i-particle,
ri — perpendicular distance from the axis a
of rotation to an i-particle
Model without additional
load Model with additional load M
Aproxinate view of
trajectories for
models with
various Jy values
under disturbance
– disturbance’s
rejection:
Longitudinal moment of
inertia Jy :
Jy1 < Jy2

52
1.3.6.2. NC-loading effect onto Cd total. Dynamic effect (Con’t 3)
Model without additional
load Model with additional load
M Jy1 < Jy2
Model's angle of rotation Δ :
Δ1 > Δ2
Average-integral value of Cd total ∫ during disturbance – disturbance’s rejection:
Cd total ∫ (t 1) < Cx total ∫ (t 2)
Angle-of-attack αmax:
α1 > α2
However: Disturbance rejection time interval t rej:
t rej 1 < t rej 2
Therefore: M - ?
53
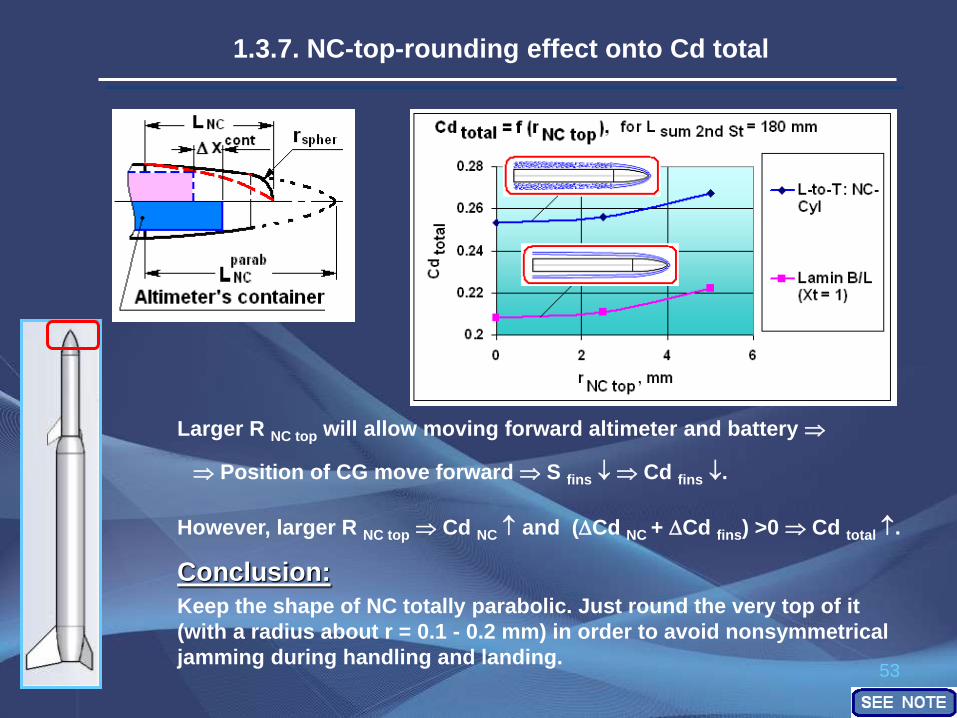
Larger R NC top will allow moving forward altimeter and battery
Keep the shape of NC totally parabolic. Just round the very top of it
(with a radius about r = 0.1 - 0.2 mm) in order to avoid nonsymmetrical
jamming during handling and landing.
Conclusion:
1.3.7. NC-top-rounding effect onto Cd total
However, larger R NC top Cd NC and (Cd NC + Cd fins) >0 Cd total .
Position of CG move forward S fins Cd fins .
54
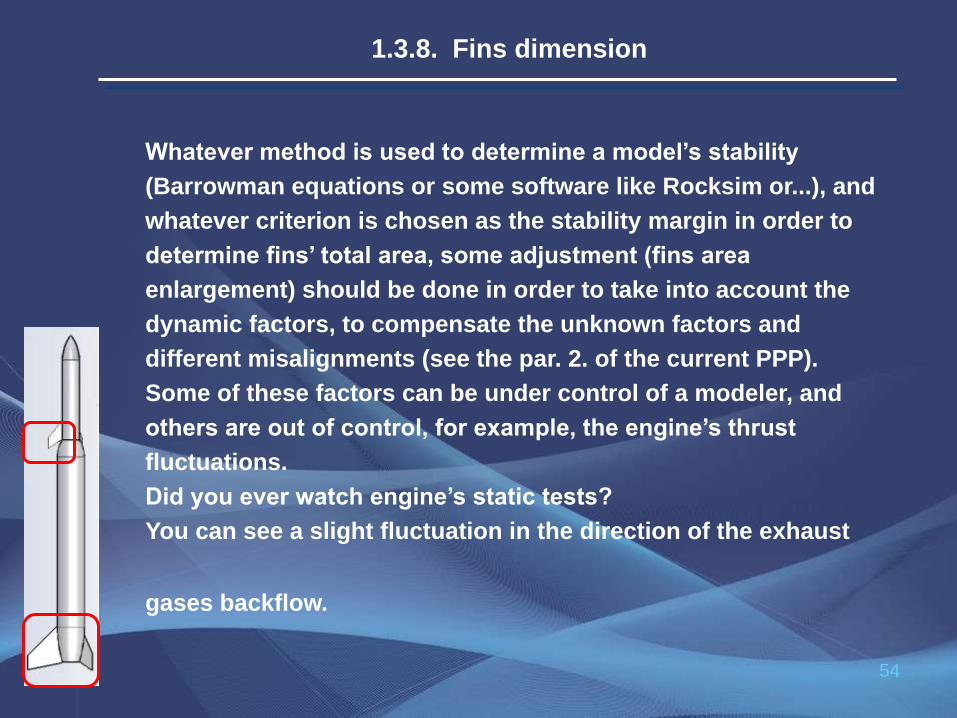
Whatever method is used to determine a model’s stability
(Barrowman equations or some software like Rocksim or...), and
whatever criterion is chosen as the stability margin in order to
determine fins’ total area, some adjustment (fins area
enlargement) should be done in order to take into account the
dynamic factors, to compensate the unknown factors and
different misalignments (see the par. 2. of the current PPP).
Some of these factors can be under control of a modeler, and
others are out of control, for example, the engine’s thrust
fluctuations.
Did you ever watch engine’s static tests?
You can see a slight fluctuation in the direction of the exhaust
gases backflow.
1.3.8. Fins dimension
55
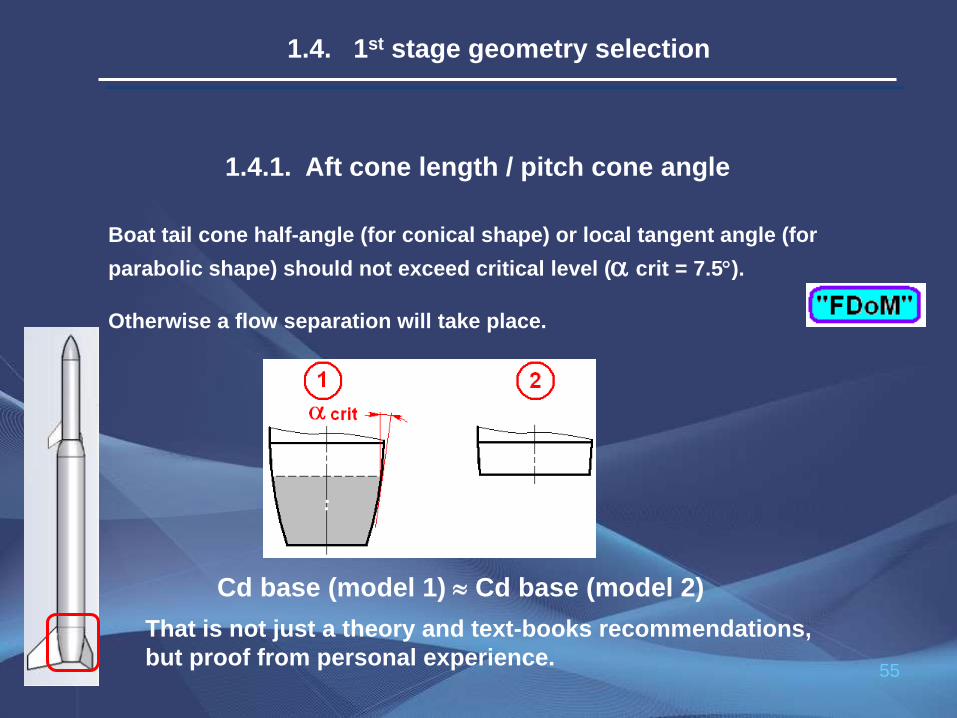
1.4.1. Aft cone length / pitch cone angle
Boat tail cone half-angle (for conical shape) or local tangent angle (for
parabolic shape) should not exceed critical level ( crit = 7.5).
Otherwise a flow separation will take place.
Cd base (model 1) Cd base (model 2)
That is not just a theory and text-books recommendations,
but proof from personal experience.
1.4. 1st stage geometry selection
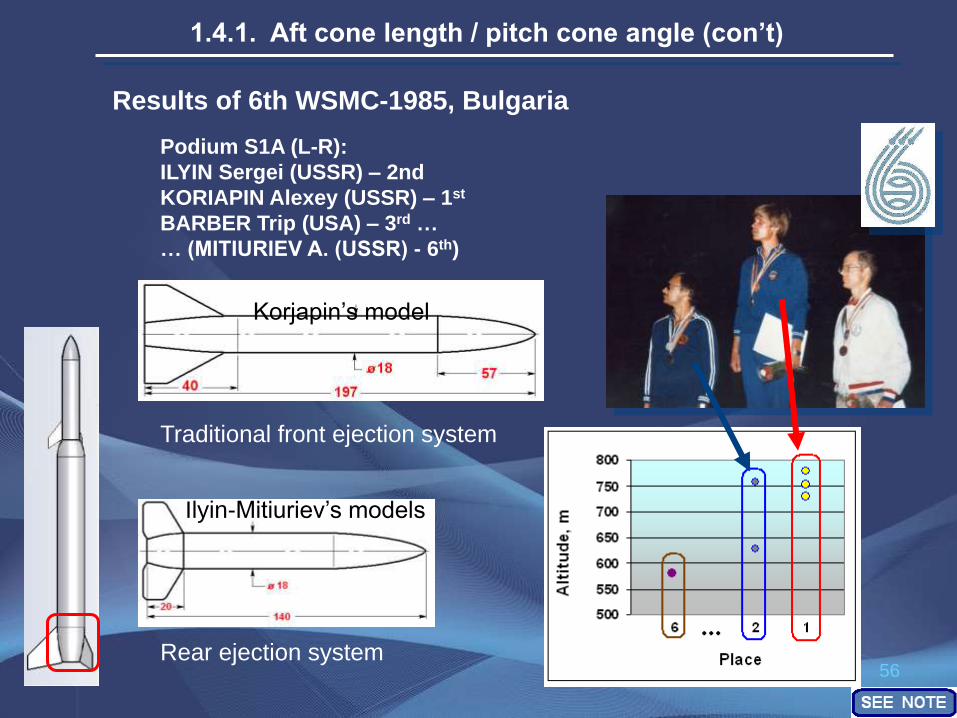
56 Rear ejection system
Ilyin-Mitiuriev’s models
Korjapin’s model
Traditional front ejection system
Podium S1A (L-R):
ILYIN Sergei (USSR) – 2nd
KORIAPIN Alexey (USSR) – 1st
BARBER Trip (USA) – 3rd …
… (MITIURIEV A. (USSR) - 6th)
Results of 6th WSMC-1985, Bulgaria
1.4.1. Aft cone length / pitch cone angle (con’t)
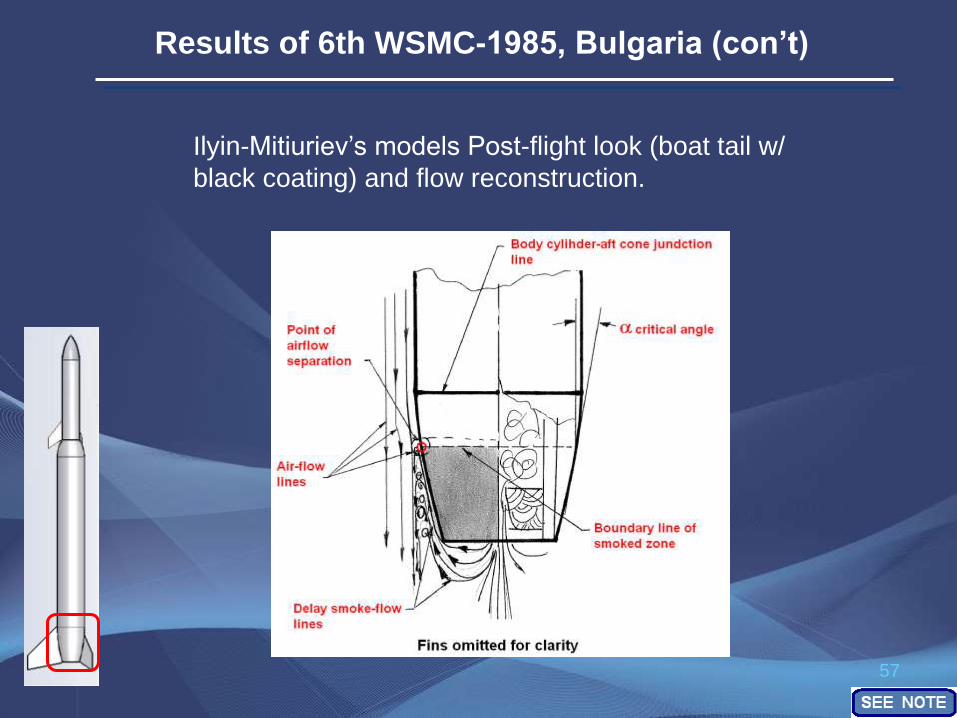
57
Results of 6th WSMC-1985, Bulgaria (con’t)
Ilyin-Mitiuriev’s models Post-flight look (boat tail w/
black coating) and flow reconstruction.

58
2. For Conical BT: Practically, the sharp edge of the Cylinder-Cone
juncture has to be rounded considering:
- Stress-Strength issues
- Airflow’s turn smoothing
con BT = max par BT = 7
Bullet’s BT pitch cone angle: 1. In order to have a safety margin:
Recommendations for BT
However, It will increase BT length (the body length with
a diameter < 40 mm).
59
“THERE ARE NO TRIFLES
IN THE AEROSPACE INDUSTRY !”
”lyrical digression”
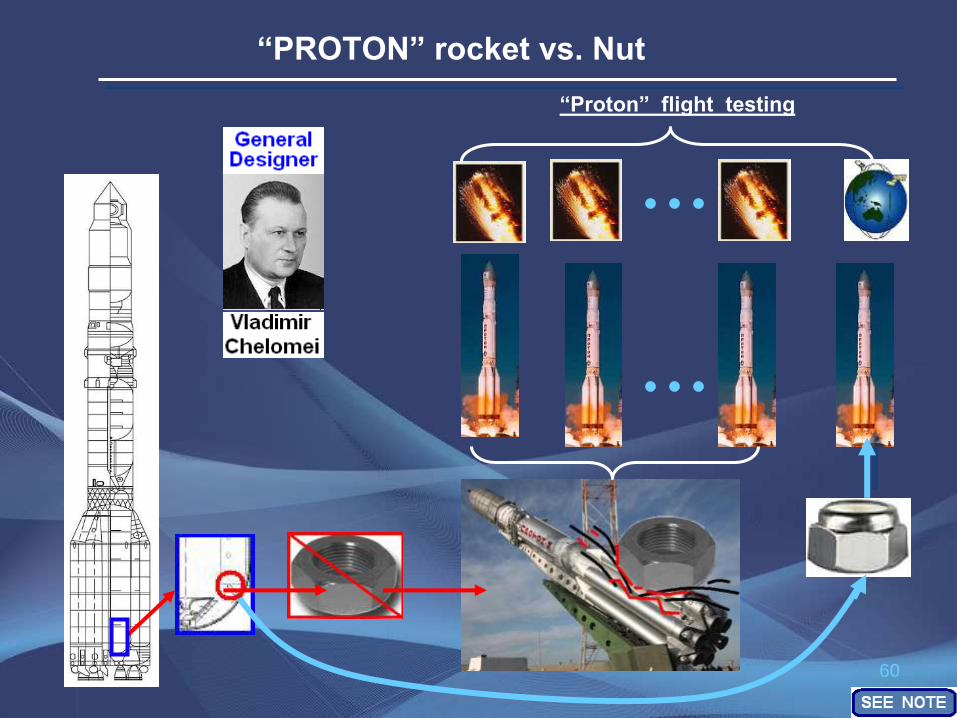
60
“Proton” flight testing
“PROTON” rocket vs. Nut
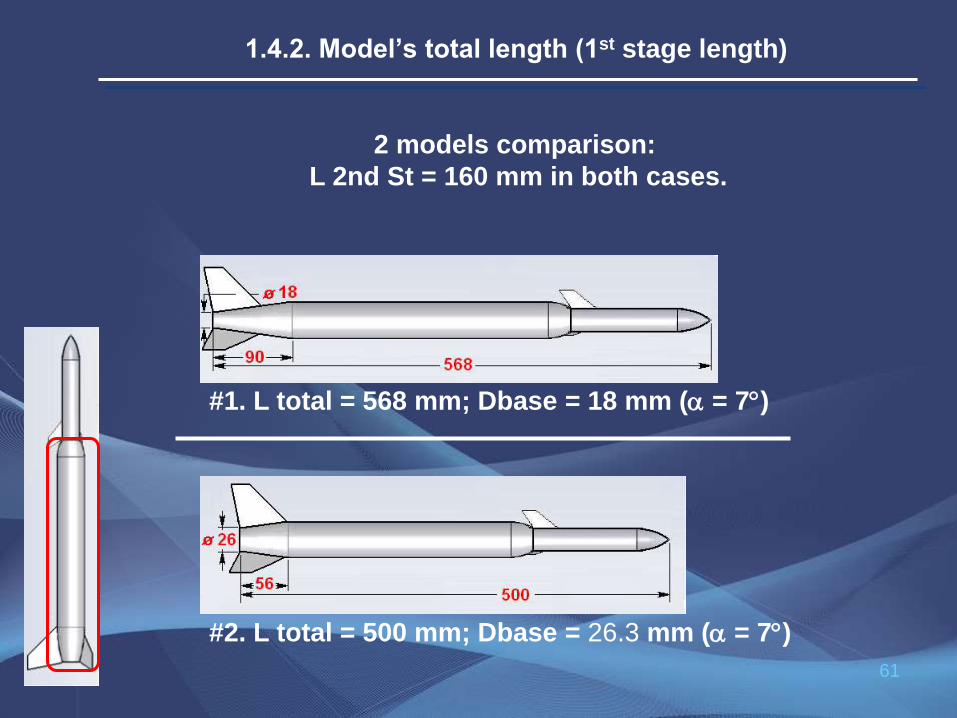
61
2 models comparison:
L 2nd St = 160 mm in both cases.
#2. L total = 500 mm; Dbase = 26.3 mm ( = 7)
#1. L total = 568 mm; Dbase = 18 mm ( = 7)
1.4.2. Model’s total length (1st stage length)
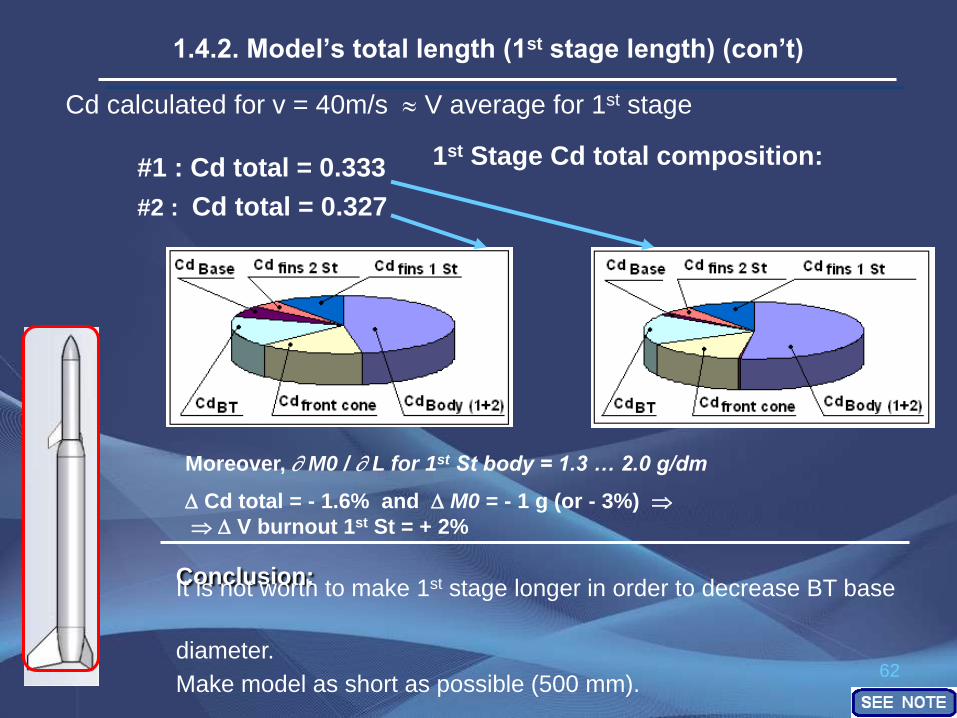
62
Moreover, M0 / L for 1st St body = 1.3 … 2.0 g/dm
#1 : Cd total = 0.333
Cd calculated for v = 40m/s V average for 1st stage
#2 : Cd total = 0.327
1st Stage Cd total composition:
Conclusion: It is not worth to make 1st stage longer in order to decrease BT base
diameter. Make model as short as possible (500 mm).
1.4.2. Model’s total length (1st stage length) (con’t)
Cd total = - 1.6% and M0 = - 1 g (or - 3%)
V burnout 1st St = + 2%
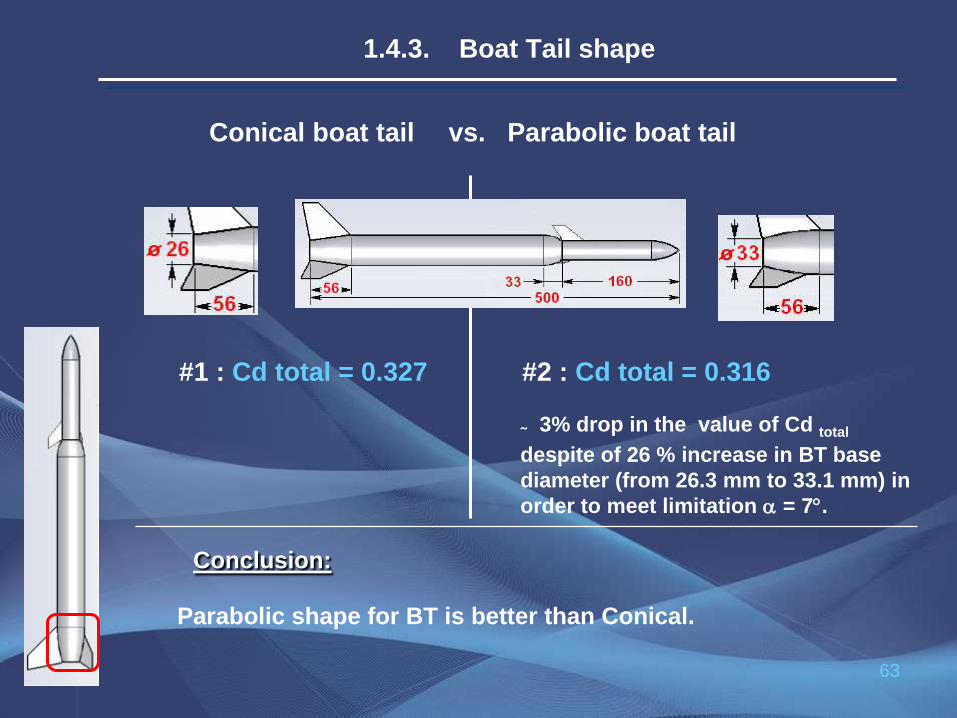
63
#1 : Cd total = 0.327 #2 : Cd total = 0.316
~ 3% drop in the value of Cd total
despite of 26 % increase in BT base
diameter (from 26.3 mm to 33.1 mm) in
order to meet limitation = 7.
Conclusion: Parabolic shape for BT is better than Conical.
Conical boat tail vs. Parabolic boat tail
1.4.3. Boat Tail shape
64
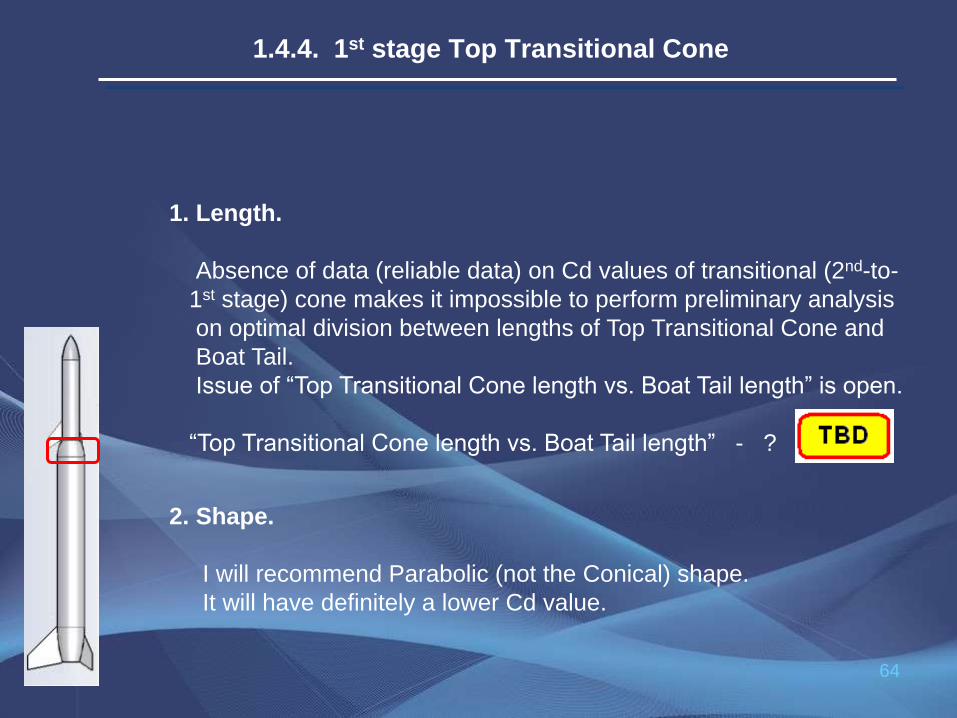
1. Length.
Absence of data (reliable data) on Cd values of transitional (2nd-to-
1st stage) cone makes it impossible to perform preliminary analysis
on optimal division between lengths of Top Transitional Cone and
Boat Tail.
Issue of “Top Transitional Cone length vs. Boat Tail length” is open.
“Top Transitional Cone length vs. Boat Tail length” - ?
2. Shape.
I will recommend Parabolic (not the Conical) shape.
It will have definitely a lower Cd value.
1.4.4. 1st stage Top Transitional Cone
65
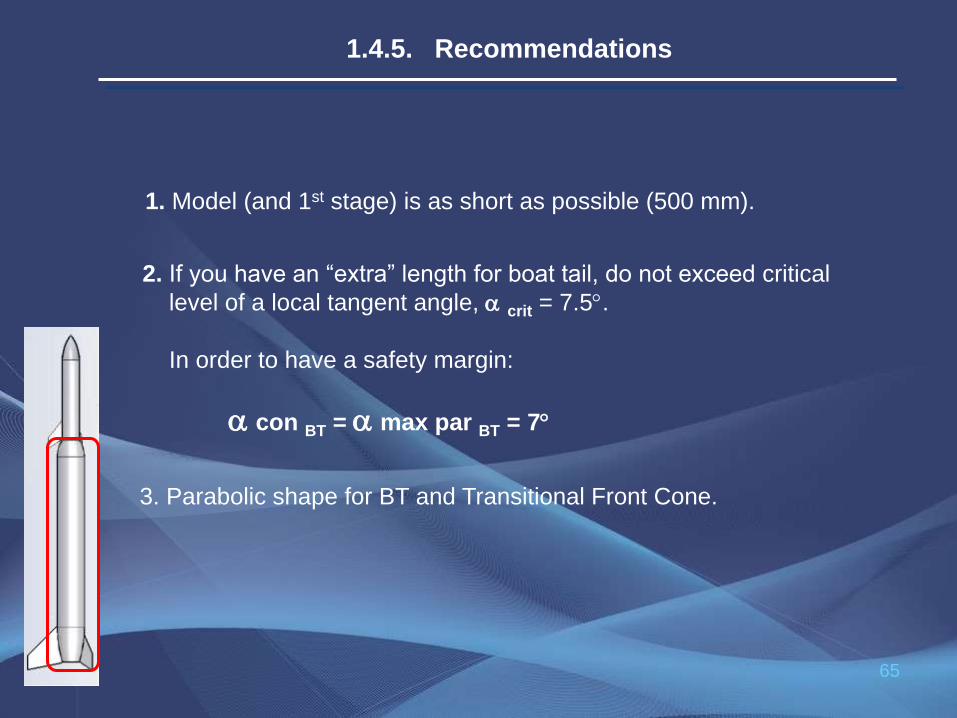
1. Model (and 1st stage) is as short as possible (500 mm).
2. If you have an “extra” length for boat tail, do not exceed critical
level of a local tangent angle, crit = 7.5.
In order to have a safety margin:
con BT = max par BT = 7
3. Parabolic shape for BT and Transitional Front Cone.
1.4.5. Recommendations
66
2. Alignment

67
- Do not glue fins to body
“by eye”. Use fin Jig
2.1. Fins plane - centerline alignment
68
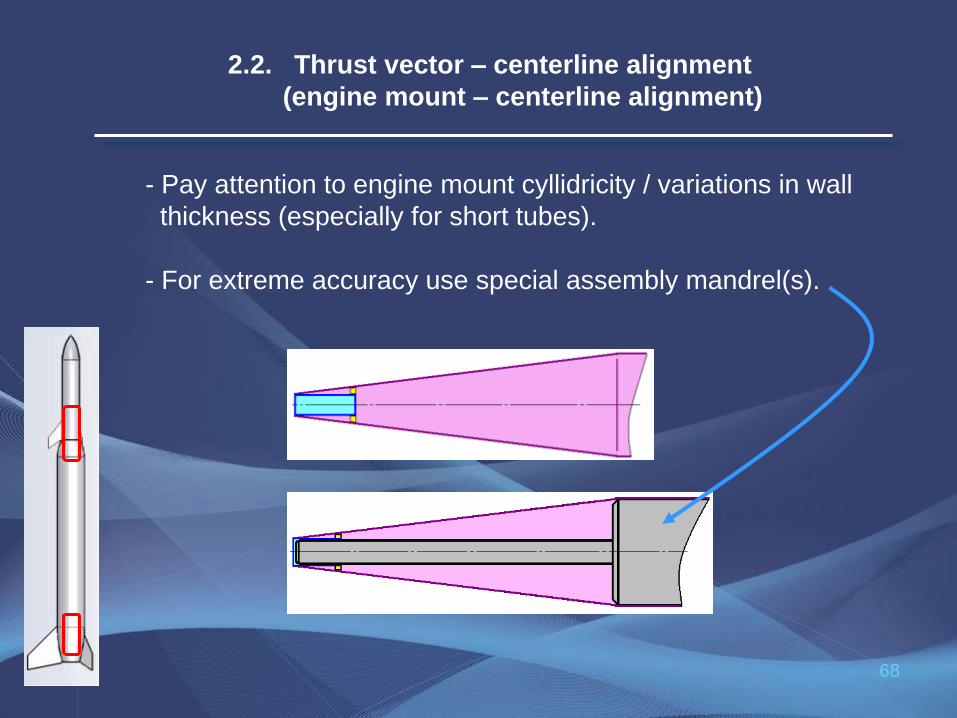
- Pay attention to engine mount cyllidricity / variations in wall
thickness (especially for short tubes).
- For extreme accuracy use special assembly mandrel(s).
2.2. Thrust vector – centerline alignment
(engine mount – centerline alignment)
69
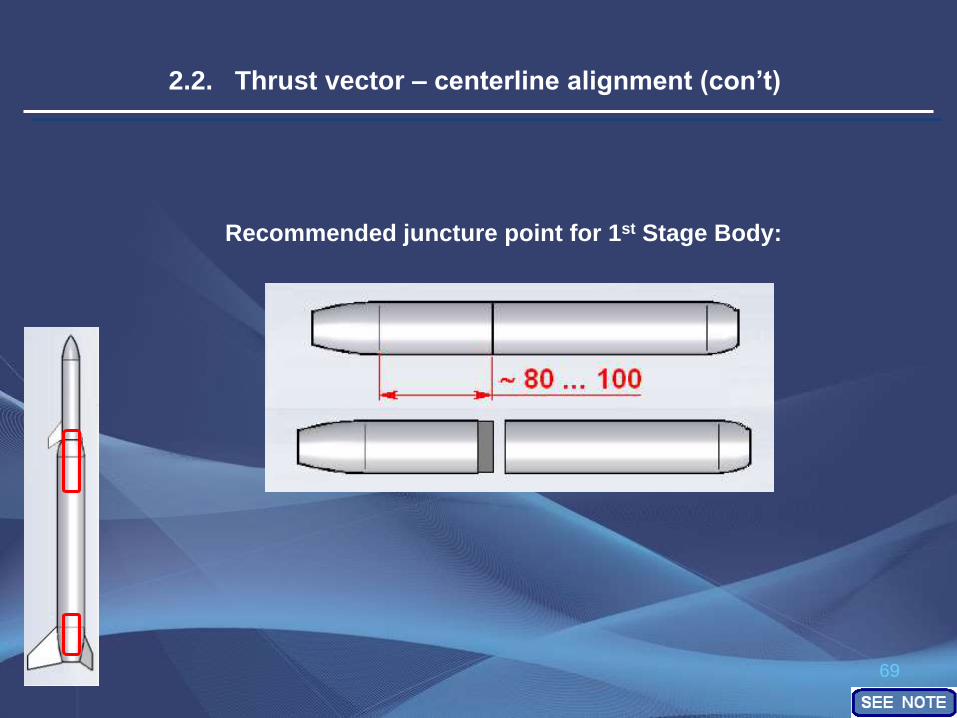
Recommended juncture point for 1st Stage Body:
2.2. Thrust vector – centerline alignment (con’t)
70
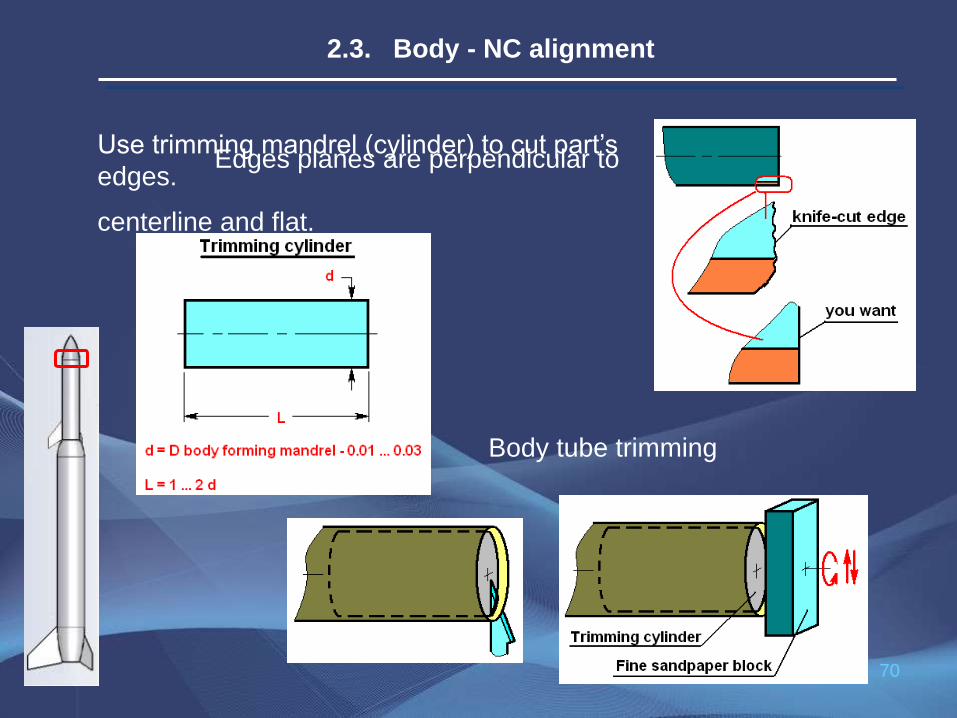
Use trimming mandrel (cylinder) to cut part’s
edges.
Body tube trimming
Edges planes are perpendicular to
centerline and flat.
2.3. Body - NC alignment

71
NC-NC shoulder assembly
NC trimming
2.3. Body - NC alignment (con’t)

72
Check CG location of altimeter + battery and streamer inside
of the body.
Parts should not be loose.
[ y (CG) 0 ]
[ (angle of attack) 0 ]
[ Cd ]
2.4. Mass distribution inside of a model. CG – centerline alignment
73
3. 2nd stage drag reduction
74
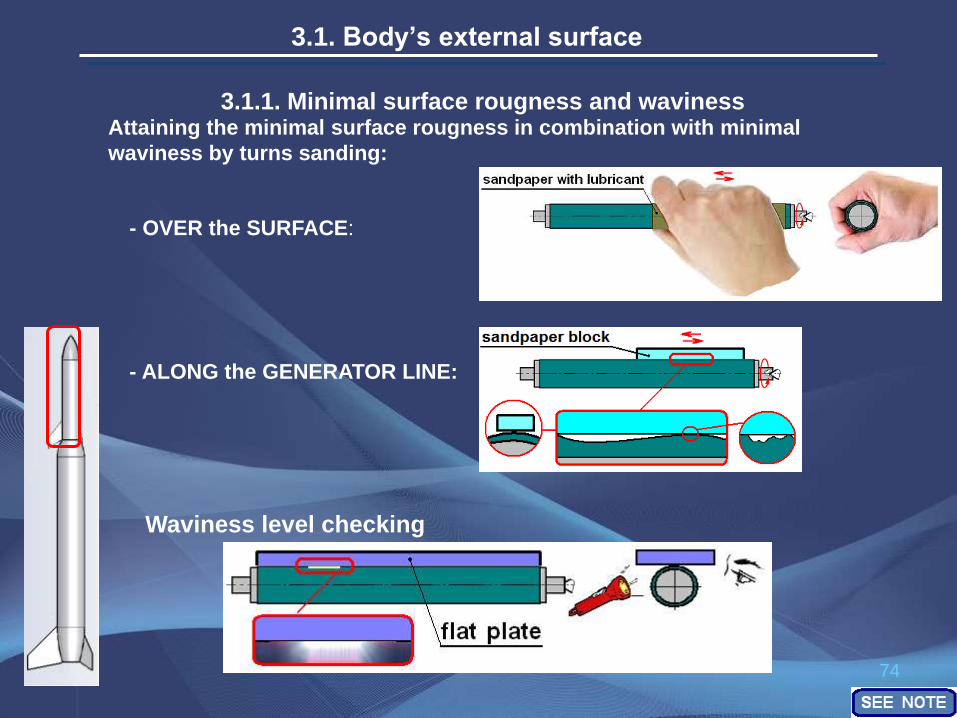
3.1. Body’s external surface
3.1.1. Minimal surface rougness and waviness Attaining the minimal surface rougness in combination with minimal
waviness by turns sanding:
- OVER the SURFACE:
- ALONG the GENERATOR LINE:
Waviness level checking

75
3.1.1. Minimal surface rougness and waviness (con’t)
Lacquer coating
Grinding / polishing
76
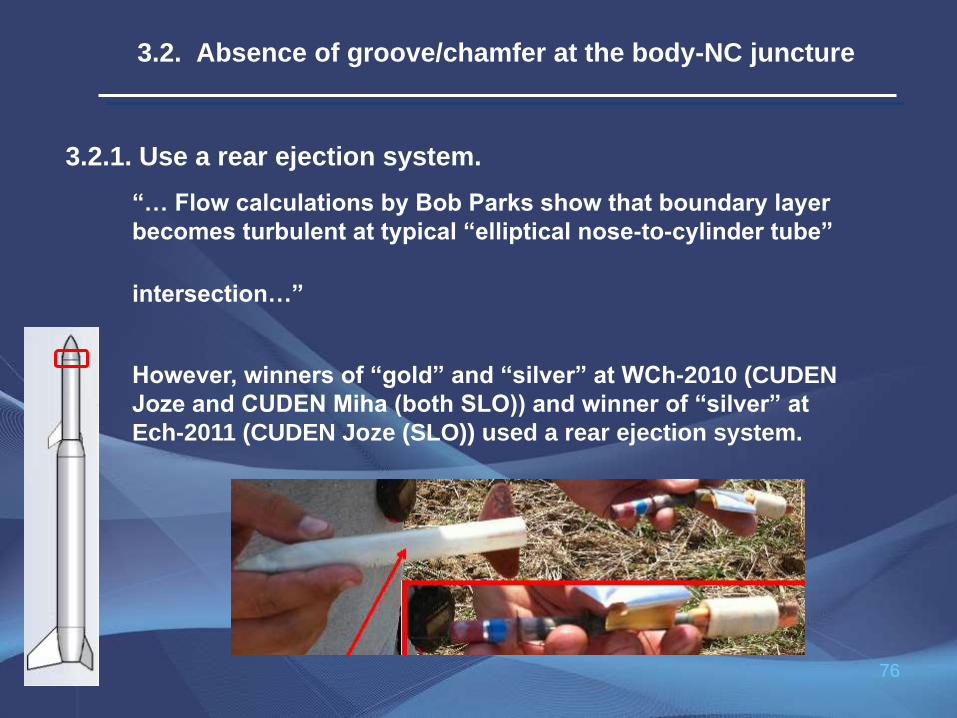
3.2.1. Use a rear ejection system.
“… Flow calculations by Bob Parks show that boundary layer
becomes turbulent at typical “elliptical nose-to-cylinder tube”
intersection…”
However, winners of “gold” and “silver” at WCh-2010 (CUDEN
Joze and CUDEN Miha (both SLO)) and winner of “silver” at
Ech-2011 (CUDEN Joze (SLO)) used a rear ejection system.
3.2. Absence of groove/chamfer at the body-NC juncture
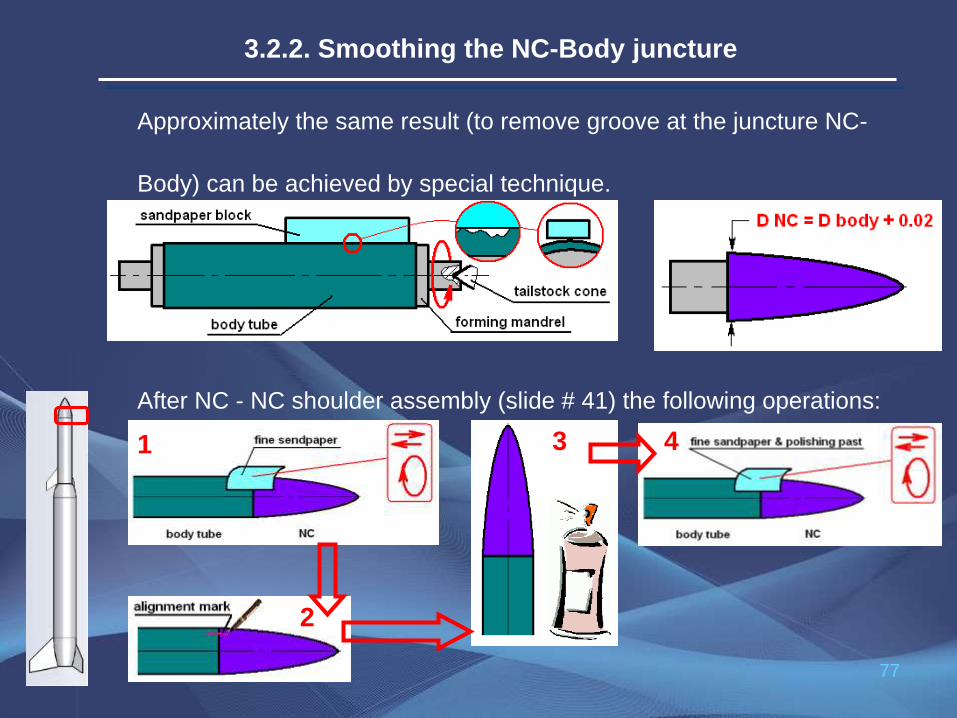
77
Approximately the same result (to remove groove at the juncture NC-
Body) can be achieved by special technique.
After NC - NC shoulder assembly (slide # 41) the following operations: 1
2
3 4
3.2.2. Smoothing the NC-Body juncture
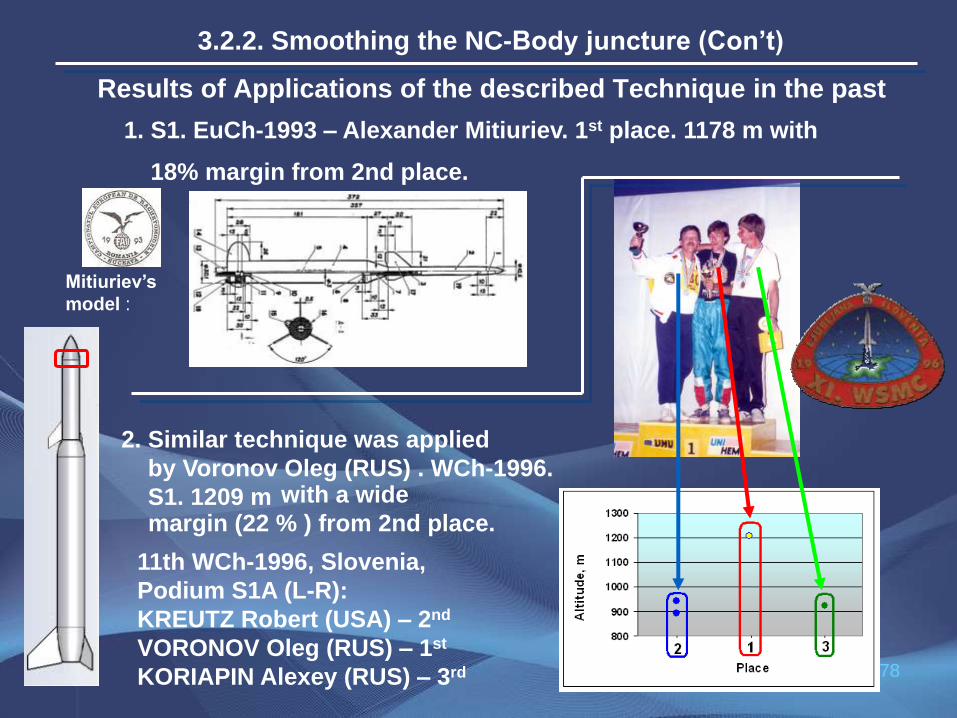
78
2. Similar technique was applied
by Voronov Oleg (RUS) . WCh-1996.
S1. 1209 m
with a wide
margin (22 % ) from 2nd place.
Mitiuriev’s
model :
11th WCh-1996, Slovenia,
Podium S1A (L-R):
KREUTZ Robert (USA) – 2nd
VORONOV Oleg (RUS) – 1st
KORIAPIN Alexey (RUS) – 3rd
1. S1. EuCh-1993 – Alexander Mitiuriev. 1st place. 1178 m with
18% margin from 2nd place.
Results of Applications of the described Technique in the past
3.2.2. Smoothing the NC-Body juncture (Con’t)
79
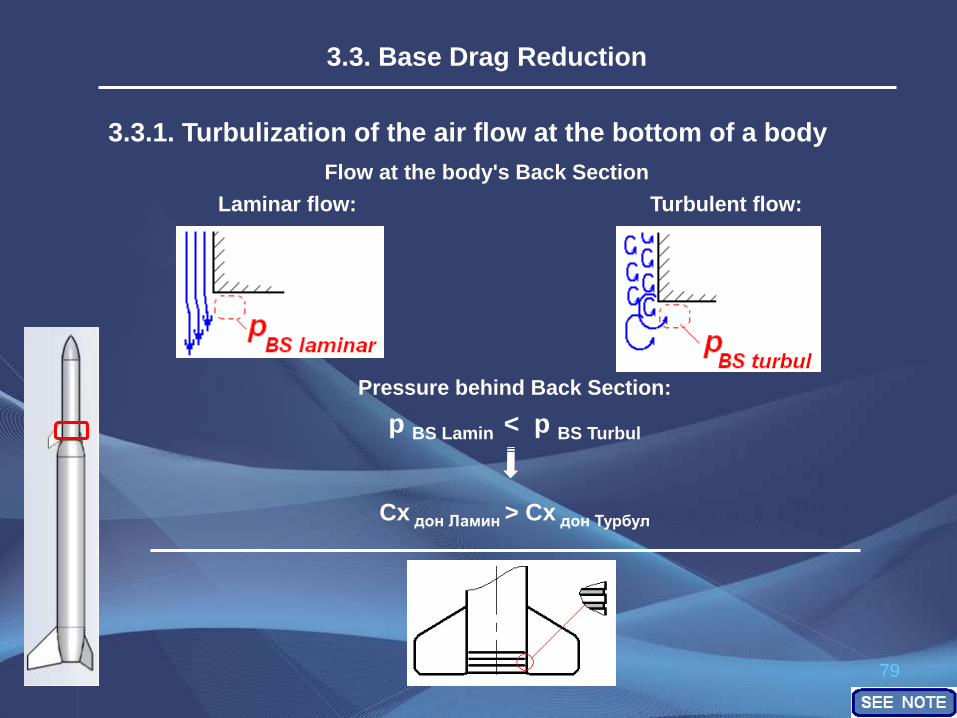
3.3.1. Turbulization of the air flow at the bottom of a body
3.3. Base Drag Reduction
Flow at the body's Back Section
Laminar flow: Turbulent flow:
Pressure behind Back Section:
p BS Lamin < p BS Turbul
Cx дон Ламин > Cx дон Турбул
80
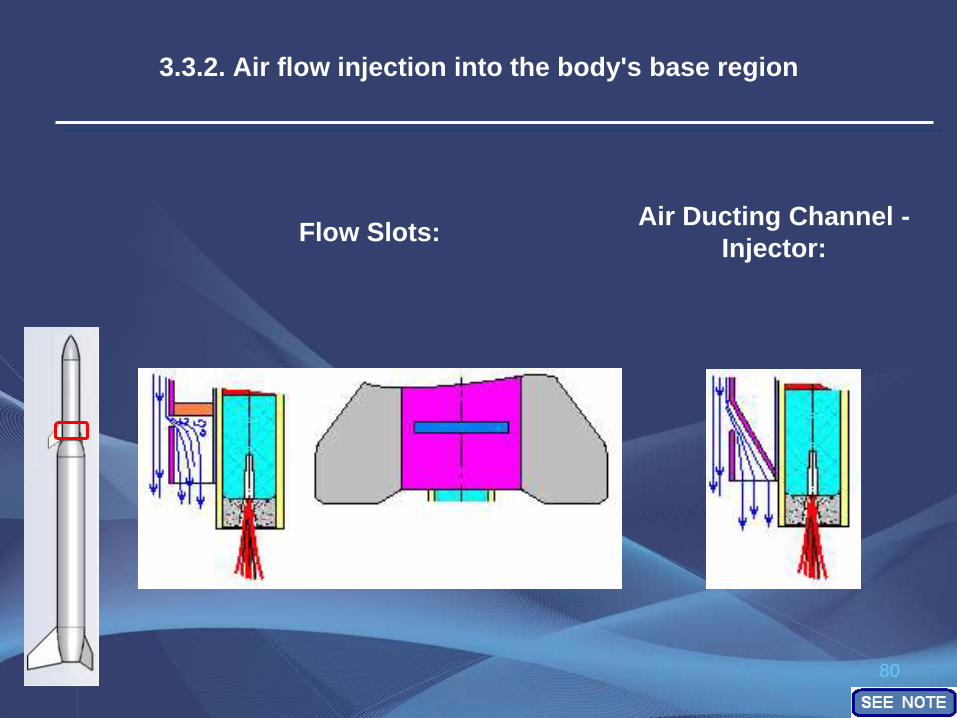
3.3.2. Air flow injection into the body's base region
Flow Slots: Air Ducting Channel -
Injector:
81
Biconvex profile:
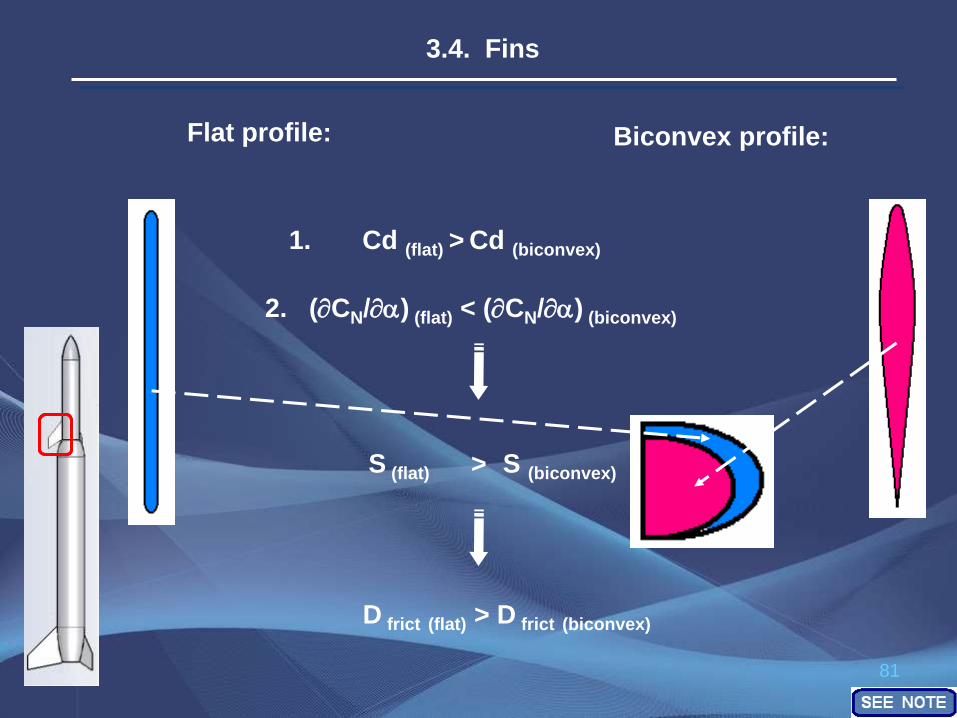
D frict (flat) > D frict (biconvex)
3.4. Fins
Flat profile:
1. Cd (flat) > Cd (biconvex) 2. (CN/) (flat) < (CN/) (biconvex)
S (flat) > S (biconvex)
82
Biconvex profile
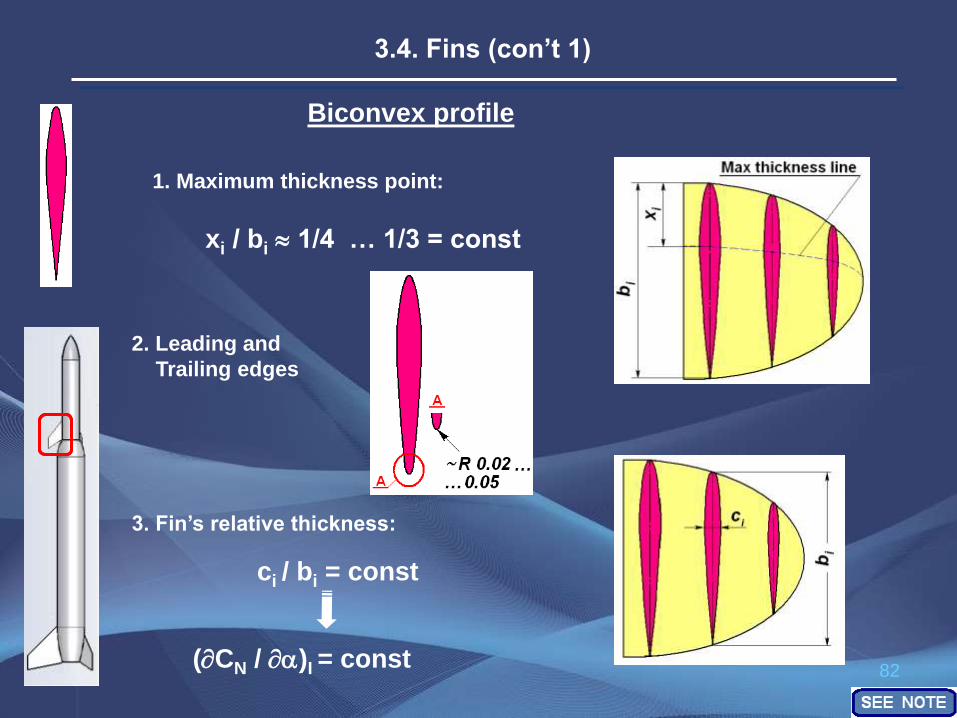
3.4. Fins (con’t 1)
1. Maximum thickness point:
3. Fin’s relative thickness:
2. Leading and
Trailing edges
(CN / )I = const
xi / bi 1/4 … 1/3 = const
ci / bi = const
83
3.4. Fins (con’t 2)
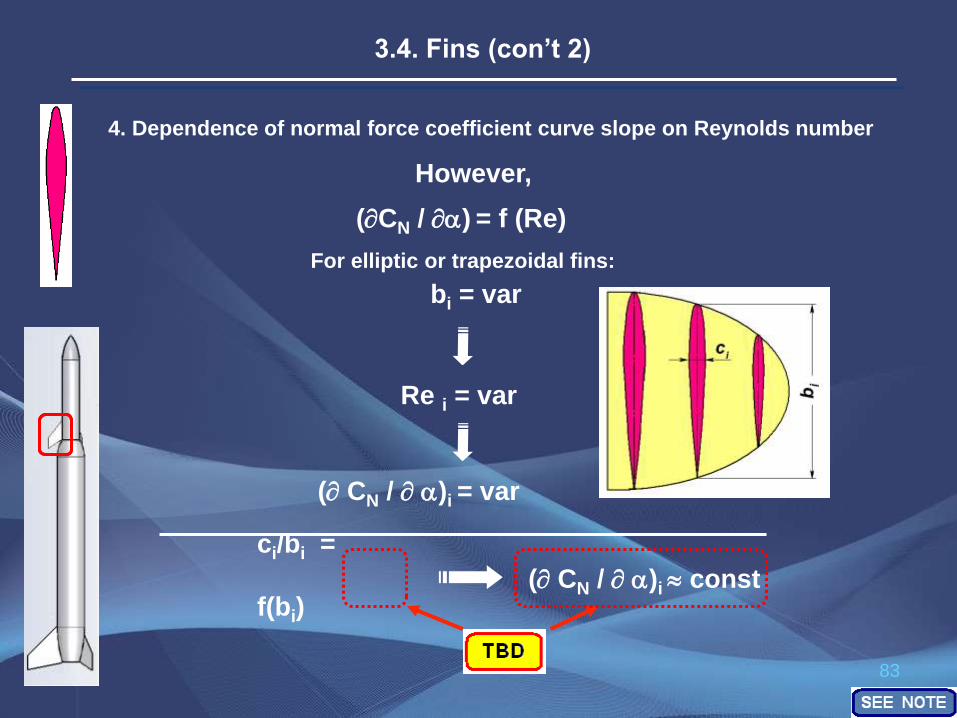
4. Dependence of normal force coefficient curve slope on Reynolds number
For elliptic or trapezoidal fins:
( CN / )i = var
However,
ci/bi =
f(bi)
Re i = var
( CN / )i const
bi = var
(CN / ) = f (Re)
84
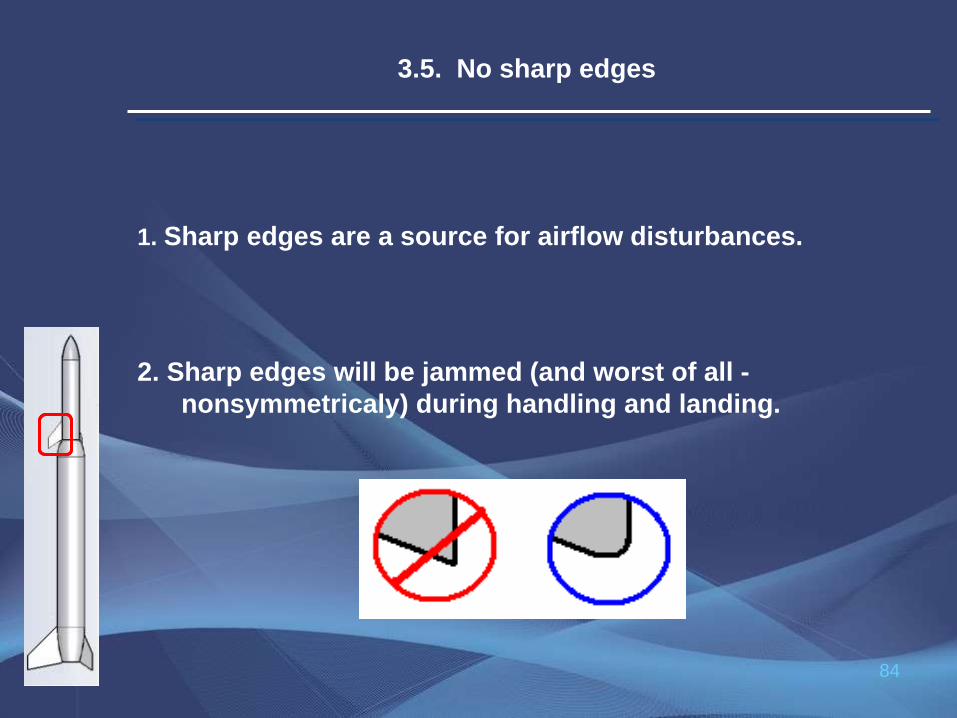
3.5. No sharp edges
1. Sharp edges are a source for airflow disturbances.
2. Sharp edges will be jammed (and worst of all -
nonsymmetricaly) during handling and landing.
85
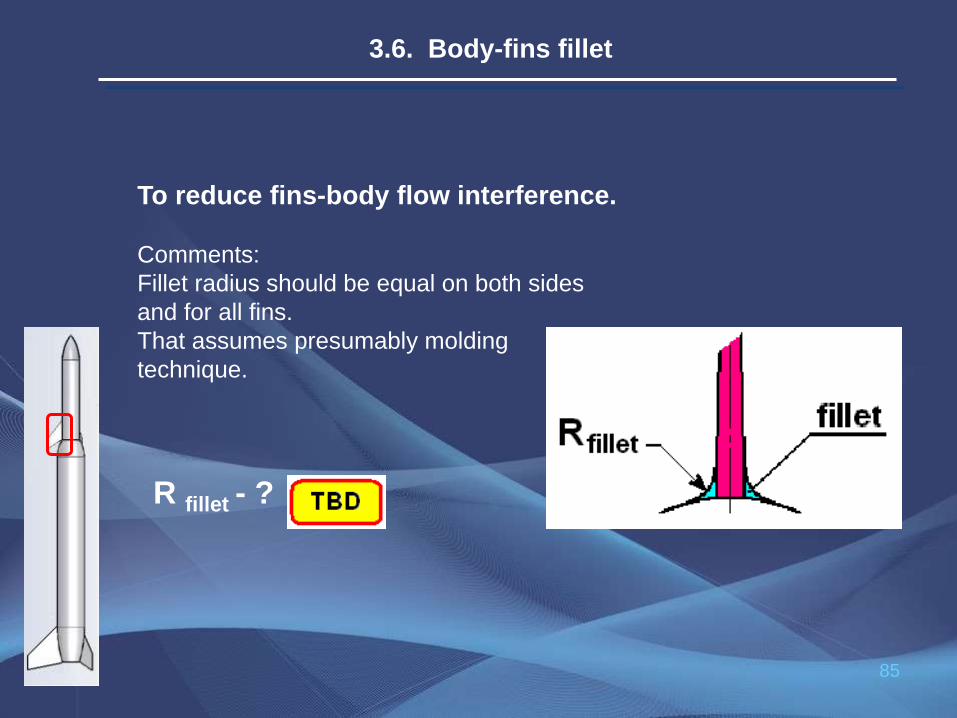
To reduce fins-body flow interference.
Comments:
Fillet radius should be equal on both sides
and for all fins.
That assumes presumably molding
technique.
R fillet - ?
3.6. Body-fins fillet
86
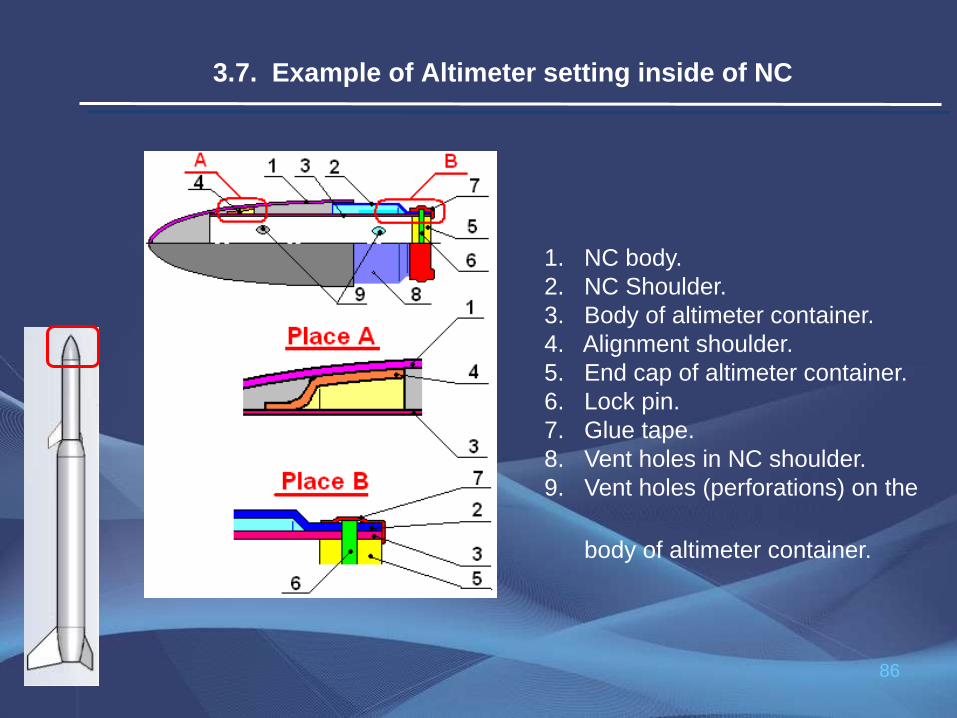
1. NC body.
2. NC Shoulder.
3. Body of altimeter container.
4. Alignment shoulder.
5. End cap of altimeter container.
6. Lock pin.
7. Glue tape.
8. Vent holes in NC shoulder.
9. Vent holes (perforations) on the
body of altimeter container.
3.7. Example of Altimeter setting inside of NC

87
4. Materials
88
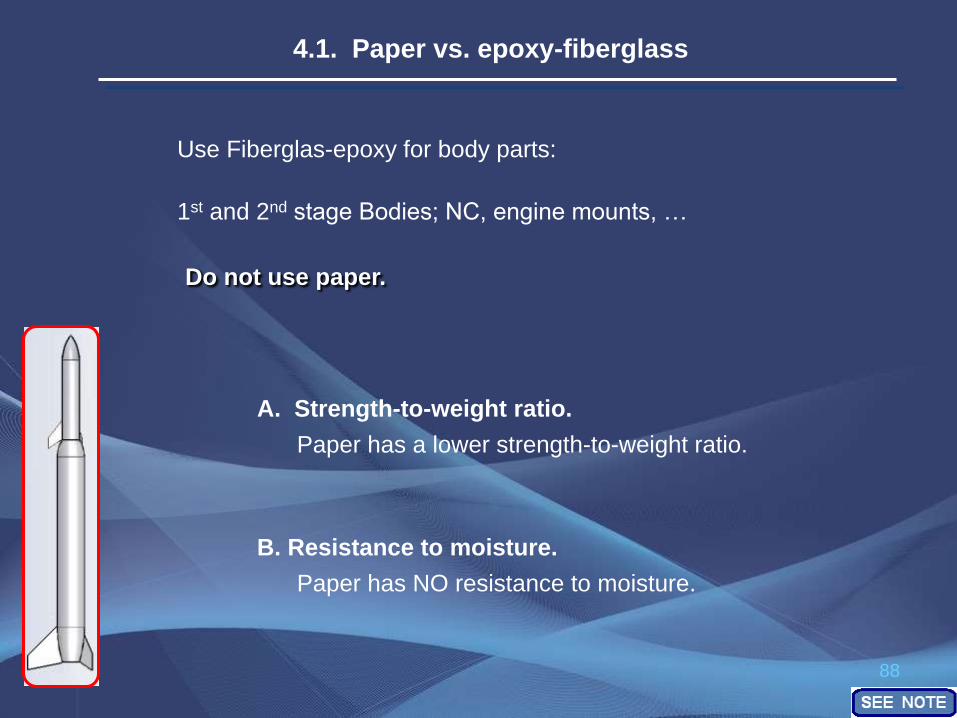
Use Fiberglas-epoxy for body parts:
1st and 2nd stage Bodies; NC, engine mounts, …
A. Strength-to-weight ratio.
Do not use paper.
4.1. Paper vs. epoxy-fiberglass
Paper has a lower strength-to-weight ratio.
B. Resistance to moisture.
Paper has NO resistance to moisture.

89
Recommended wall thickness of model body parts:
4.2. Fiberglas-epoxy parts wall thickness
Part
Number of
Fiberglass
layers
( = 0.025
mm)
Recommended
Wall Thickness,
mm
Measurement
instrument
Aft Cone 1 2 0.08 - 0.10 visual
2 2 0.08 - 0.10 micrometer
2 2 0.06 - 0.07 micrometer
2 2 0.08 - 0.10 micrometer
Transitional Cone 1 2 0.08 - 0.10 visual
2nd Stage body cylinder 3 4 0.15 micrometer
Nose Cone 3 4 0.15 micrometer
1st Stage engine mount 4 3 0.12 micrometer
Interstage fitting cylinder 4 3 0.12 micrometer
2nd Stage engine mount 4 3 0.12 micrometer
NC shoulder 4 3 0.12 micrometer
Ex
tern
al p
art
s
1st Stage body cylinder
Inte
rna
l
pa
rts
90
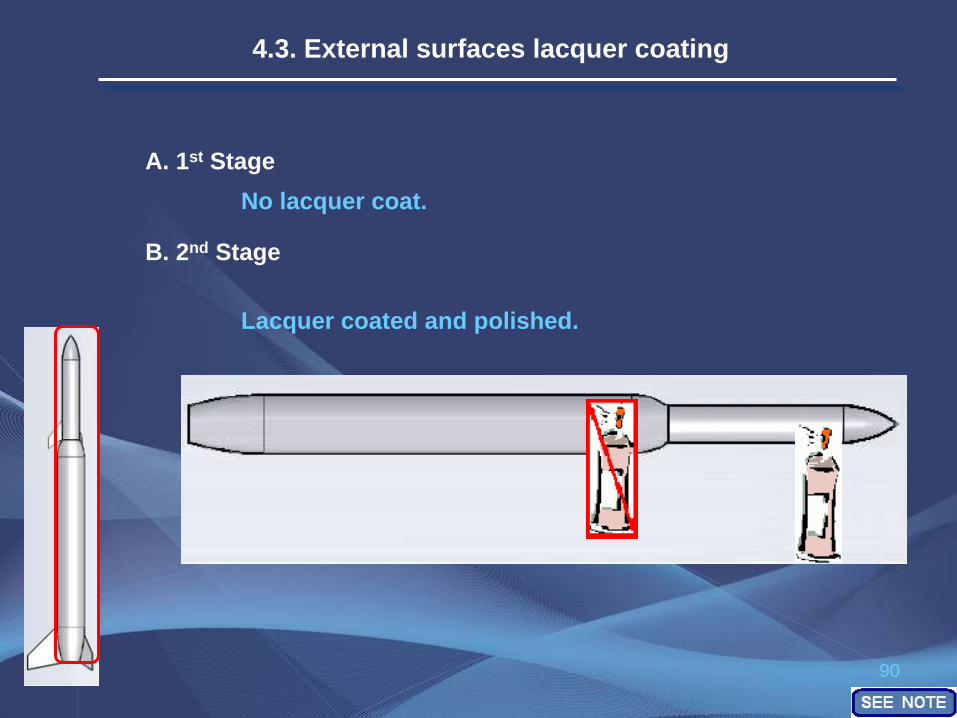
A. 1st Stage
B. 2nd Stage
No lacquer coat.
Lacquer coated and polished.
4.3. External surfaces lacquer coating
91
5. Engines
92
How fast an engine should be - ?
But then:
Burn time Engine’s OD
Engine’s wall thickness and Nozzle weight
Engine’s weight Burnout velocity
Possible
outcome of
optimization:
5.1.1. Engines Thrust diagram / burn time
Burn time Mass of fuel burned inside piston
Exhaust gas Pressure
(Piston + Model) velocity Burn-out velocity
5.1. 1st Stage Engine

93
BP or compound engine - ?
BP Fuel mass > Compound Fuel mass
Mass of BP burned inside piston > Mass of Compound burned inside piston
Exhaust BP gas Pressure > Exhaust Compound gas Pressure
(Piston + Model) BP velocity > (Piston + Model) Compound velocity
Burnout BP velocity > Burnout Compound velocity
5.1.2. BP engines vs. compound engines.
But then:
Exhaust BP gas Temperature < Exhaust Compound gas Temperature
Exhaust BP gas Pressure < Exhaust Compound gas Pressure
(Piston + Model) BP velocity < (Piston + Model) Compound velocity
Burnout BP velocity < Burnout Compound velocity
5.1. 1st Stage Engine (con’t)
94
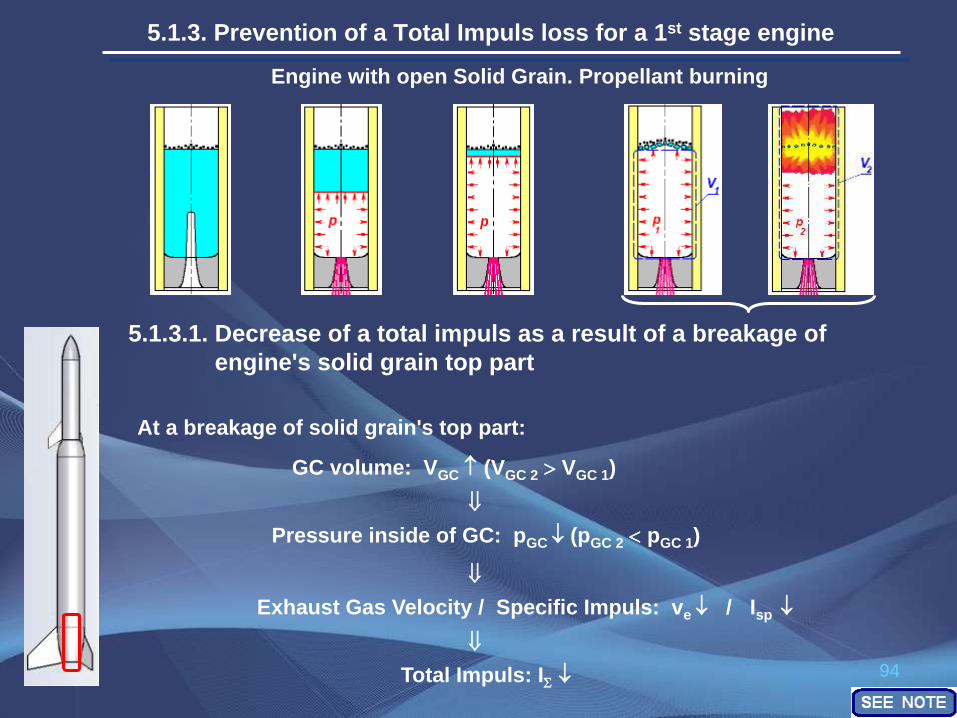
Engine with open Solid Grain. Propellant burning
5.1.3. Prevention of a Total Impuls loss for a 1st stage engine
At a breakage of solid grain's top part:
GC volume: VGC (VGC 2 VGC 1)
Pressure inside of GC: pGC (pGC 2 pGC 1)
Exhaust Gas Velocity / Specific Impuls: ve / Isp
Total Impuls: I
5.1.3.1. Decrease of a total impuls as a result of a breakage of
engine's solid grain top part
95
pm (GC – Nozzle) 1.1 pm (GC – Flash Tube)
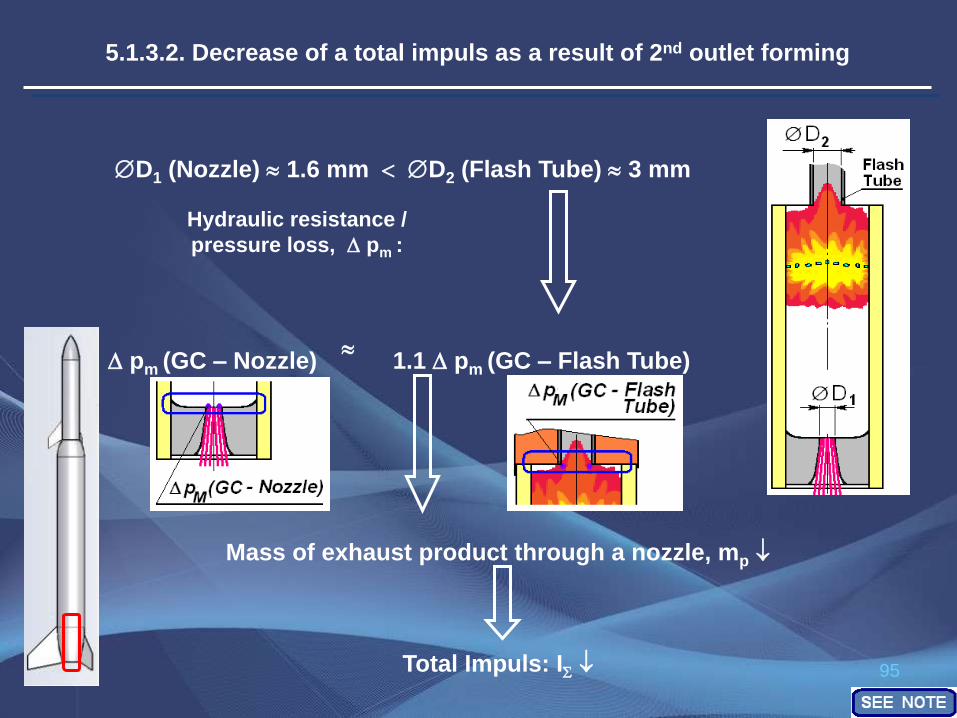
5.1.3.2. Decrease of a total impuls as a result of 2nd outlet forming
D1 (Nozzle) 1.6 mm D2 (Flash Tube) 3 mm Hydraulic resistance /
pressure loss, pm :
Mass of exhaust product through a nozzle, mp
Total Impuls: I

96
5.1.3.3. Reverse thrust
97
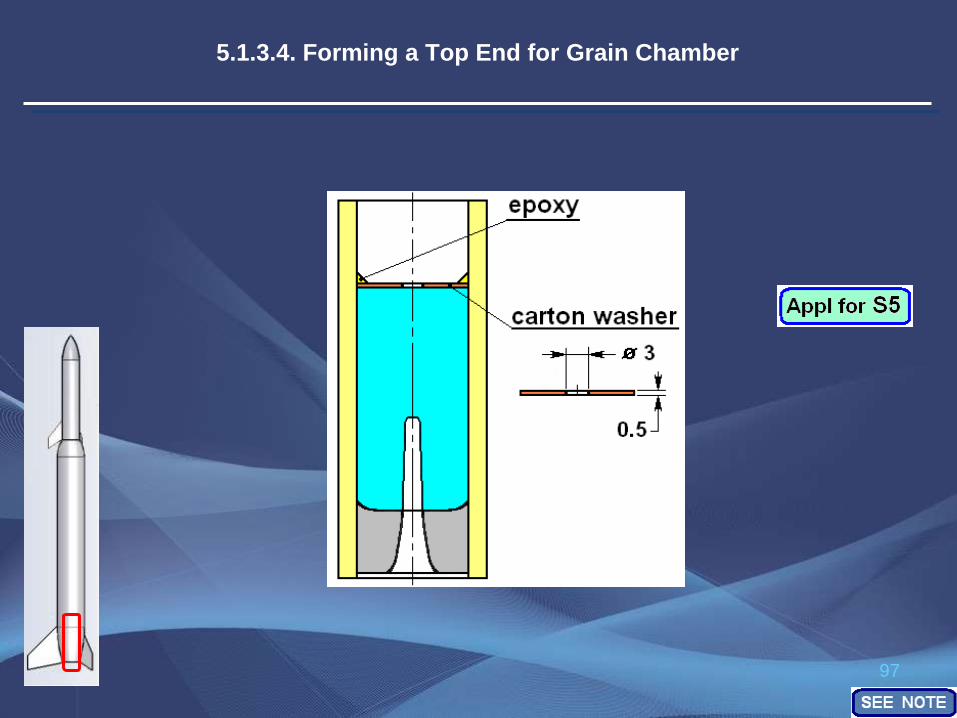
5.1.3.4. Forming a Top End for Grain Chamber
98
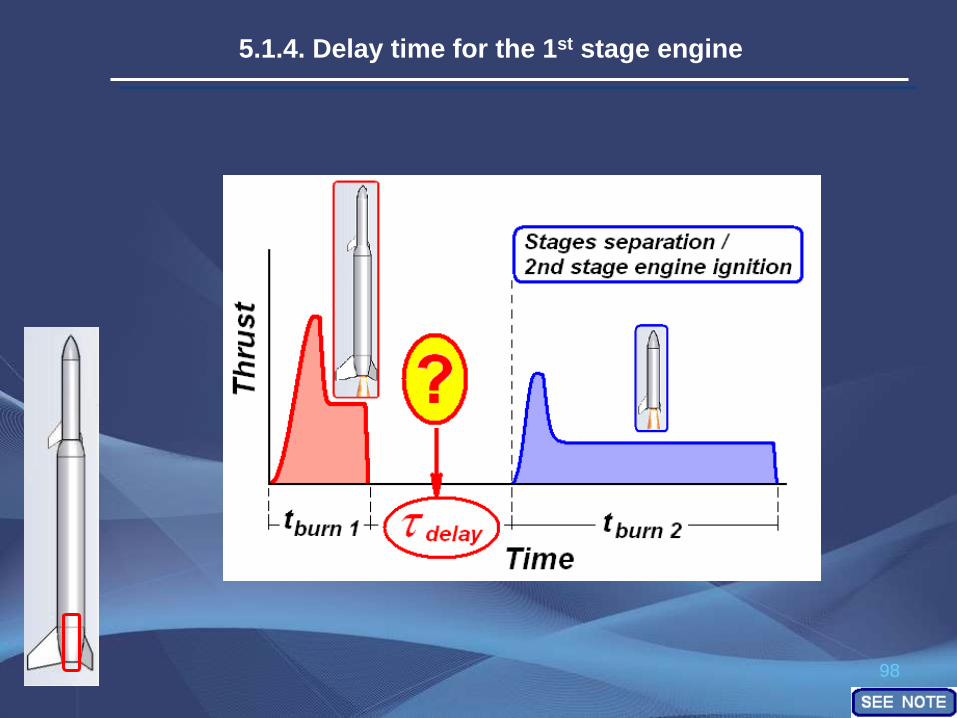
5.1.4. Delay time for the 1st stage engine

99
5.1.4.1. External ballistic
1. t delay 0 hcoast 1st stage 0 h 1st stage
aerodynamic loss of velocity, Va/d h model
The earlier the stages separation and the firing of the 2nd stage
engine will take place, the greater altitude a model will reach.
There is no need to have a delay on the 1st stage
engine (as far as external ballistic is concern).
2. t delay 0 V0 2nd stage h 2nd stage
100
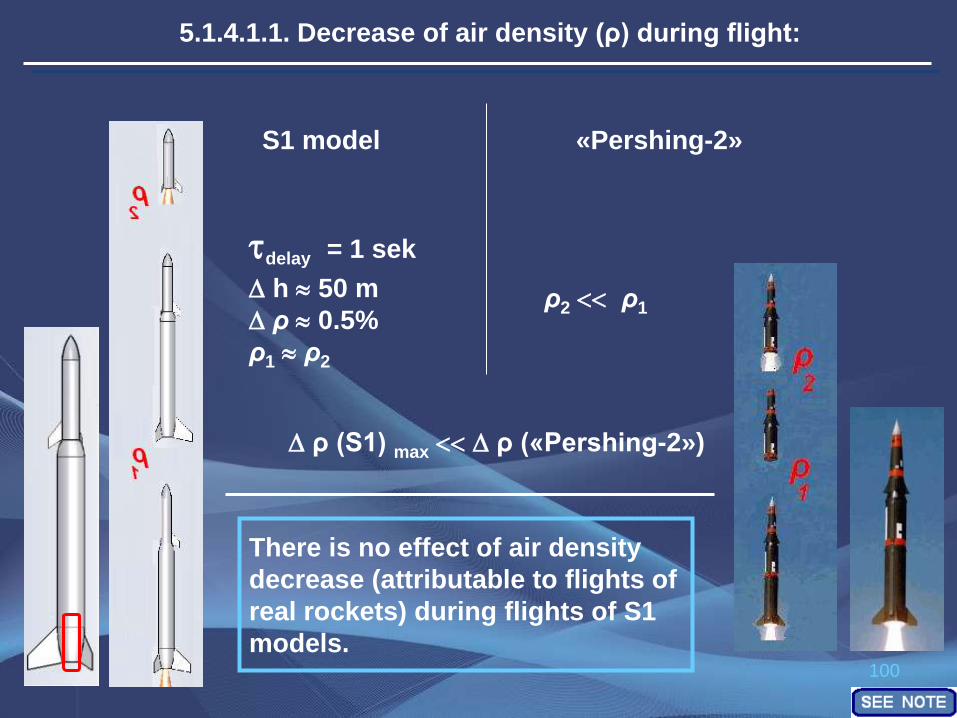
5.1.4.1.1. Decrease of air density (ρ) during flight:
«Pershing-2» S1 model
tdelay = 1 sek
h 50 m
ρ 0.5%
ρ1 ρ2
ρ2 ρ1
ρ (S1) max ρ («Pershing-2»)
There is no effect of air density
decrease (attributable to flights of
real rockets) during flights of S1
models.

101
5.1.4.1.2. Ballistic Coefficient (BC)
Ballistic Coefficients Values:
BC = (2 · m) / (Сx · S)
BC (S1 model) 1/300 BC («Pershing-2»)
Ballistic Coefficient (BC) of a body is a measure of its ability to
overcome air resistance in flight.
Models S1 are substantially less dence than real
rockets, and they decelerate very fast during a
coastal flight.
There is no similarity on Ballistic Coefficient
parameter between S1 models and real rockets.
«Pershing -2» S1 model

102
5.1.4.2. Internal ballistic
Solid Grain burning inside of a Grain Chamber:
103
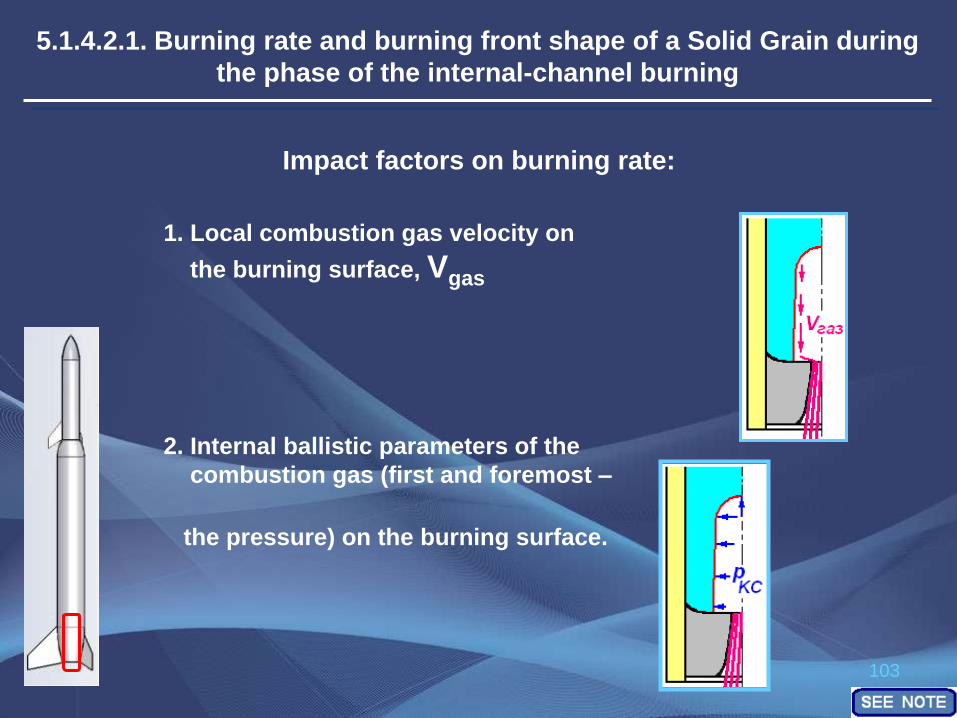
5.1.4.2.1. Burning rate and burning front shape of a Solid Grain during
the phase of the internal-channel burning
Impact factors on burning rate:
1. Local combustion gas velocity on
the burning surface, Vgas
2. Internal ballistic parameters of the
combustion gas (first and foremost –
the pressure) on the burning surface.

104
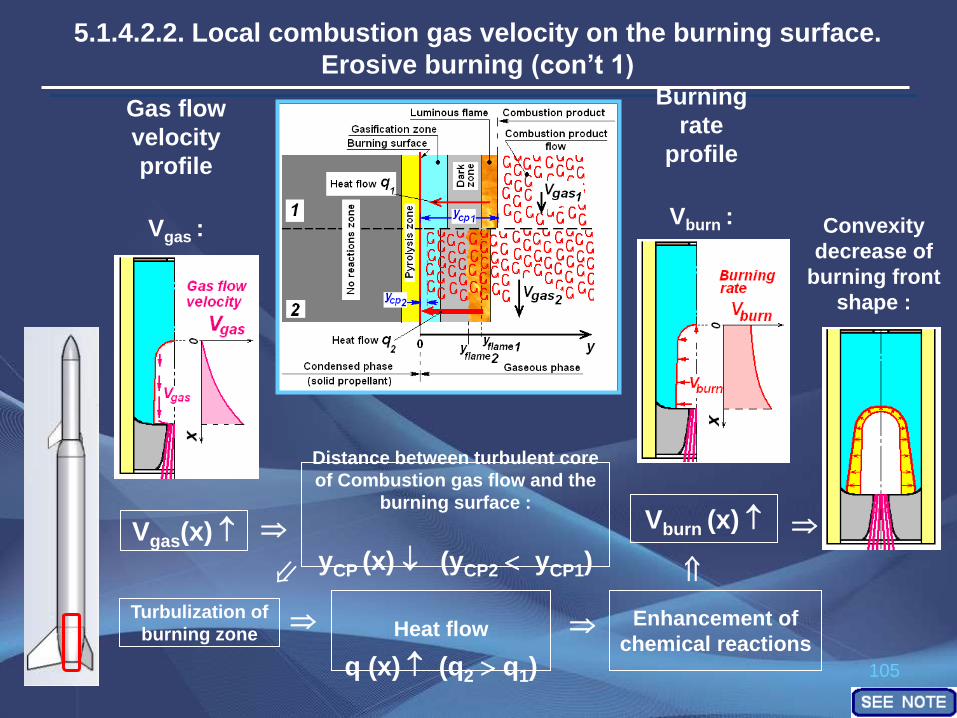
5.1.4.2.2. Local combustion gas velocity on the burning surface.
Erosive burning
Schematic of the propellant burning on the channel surface.
Combustion gas flow velocity
Where : Vgas - Local combustion gas velocity on the burning surface;
ycp – Distance between turbulent core of Combustion gas flow and
the burning surface (Propellant's solid surface);
yflame – Distance between Luminous (flaming) Burning zone and
the burning surface (propellant's solid surface)
105
5.1.4.2.2. Local combustion gas velocity on the burning surface.
Erosive burning (con’t 1)
Gas flow
velocity
profile
Vgas :
Vgas(x)
Burning
rate
profile
Vburn : Convexity
decrease of
burning front
shape :
Distance between turbulent core
of Combustion gas flow and the
burning surface :
yCP (x) (yCP2 yCP1) Vburn (x)
Turbulization of
burning zone Heat flow q (x) (q2 q1)
Enhancement of
chemical reactions

106
5.1.4.2.2. Local combustion gas velocity on the burning surface.
Erosive burning (con’t 2)
Condition of Erosive burning existence :
Solid Fuel Rocket Engines
(SFRE) of real rockets
Erosive burning in MRE
1. Vth – Threshold flow velocity: Vgas Vth
2. (th Vth) - Threshold mass flux velocity :
(gas Vgas) (th Vth) , where – dencity of Combustion
product in a flow
1. Vgas MRE Vgas SFRE
2. (gas MRE Vgas MRE) (gas SFRE Vgas SFRE )
(Vgas MRE) max Vth MRE
(gas MRE Vgas MRE) max ( V) th
?
?
?
Model Rocket Engines
(MRE)
-
-
-
107
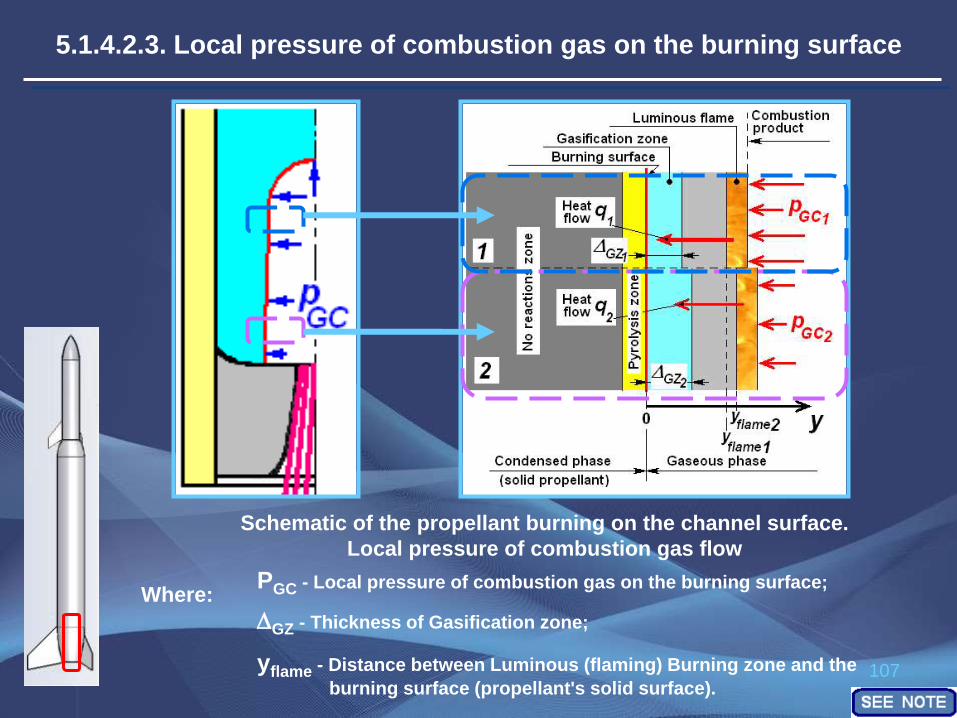
5.1.4.2.3. Local pressure of combustion gas on the burning surface
Schematic of the propellant burning on the channel surface.
Local pressure of combustion gas flow
Where: PGC - Local pressure of combustion gas on the burning surface;
GZ - Thickness of Gasification zone;
yflame - Distance between Luminous (flaming) Burning zone and the
burning surface (propellant's solid surface).

108
5.1.4.2.3. Local pressure of combustion gas on the burning surface (con’t)
Local pressure
profile pGC :
pGC (x)
Burning
rate
profile
Vburn :
Convexity
increase of
burning
front shape :
Vburn (x)
Heat flow
q (q2 q1)
Concentration
of gaseous
reactants (x)
Rate of chemical
reactions with
gas generation in
the Solid phase
(x)
Rate of exothermic reactions
in the Gaseous phase (x)
Thickness of
Gasification
zone GZ (x)
Distance
between
Luminous
flame and the
burning surface yCP (x)
vburn (p) = k pn,
where n > 0
109
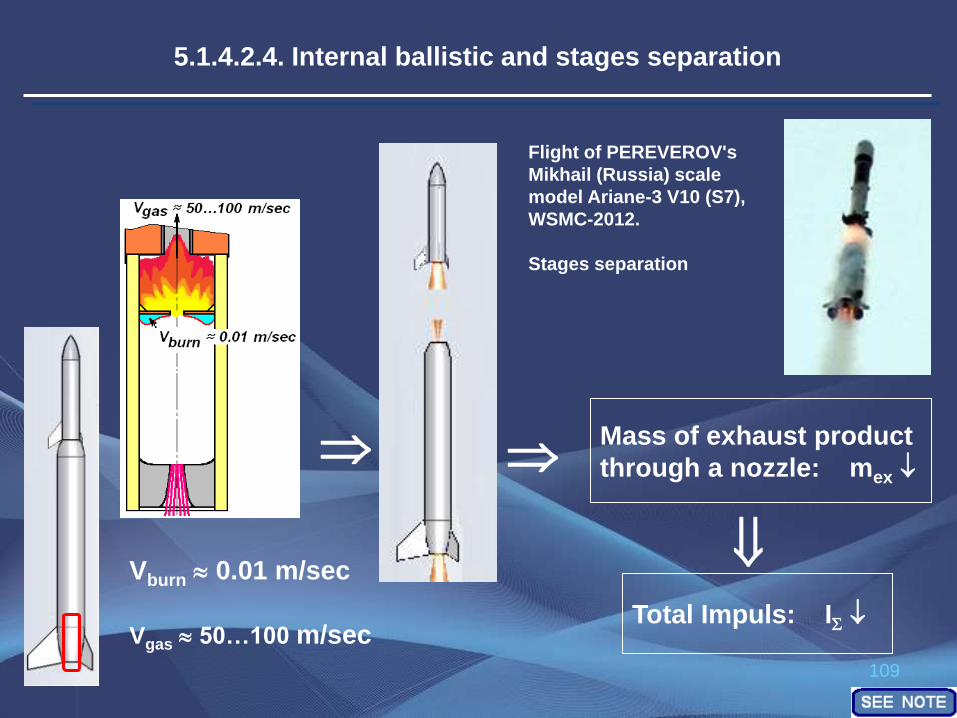
5.1.4.2.4. Internal ballistic and stages separation
Mass of exhaust product
through a nozzle: mex
Total Impuls: I
Vburn 0.01 m/sec
Vgas 50…100 m/sec
Flight of PEREVEROV's
Mikhail (Russia) scale
model Ariane-3 V10 (S7),
WSMC-2012.
Stages separation

110
5.1.4.3. Prevention of a Total Impuls loss for 1st stage engine
Suggested solutions:
1. Off center hole in a
washer
2. Small delay time for 1st stage engine
t delay = 0.3-0.5 sec
Similar solution usage in
the past:
111
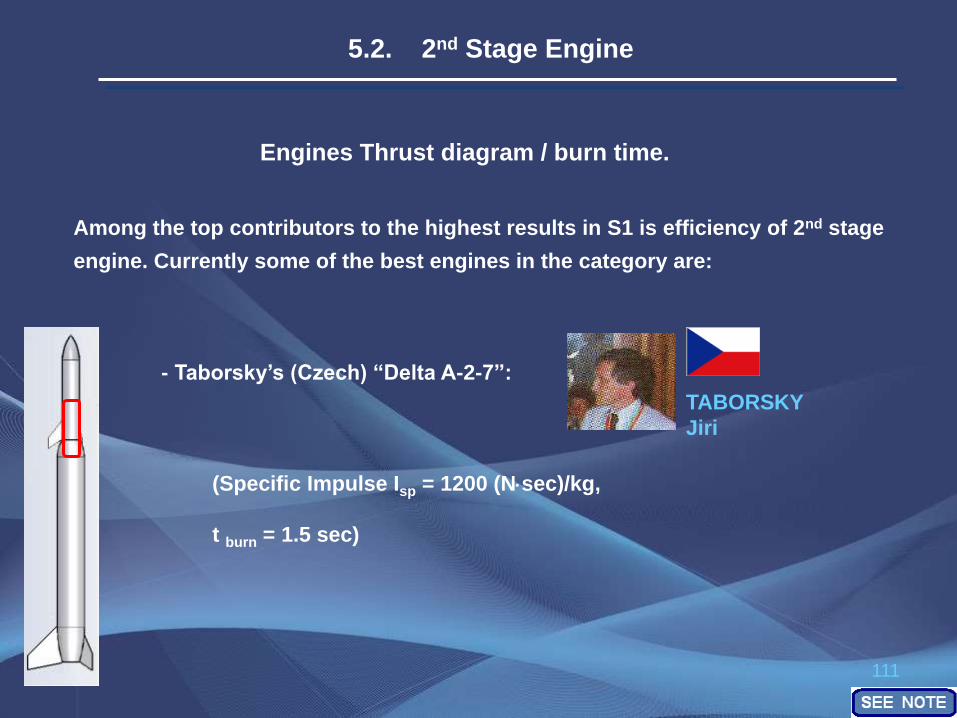
Engines Thrust diagram / burn time.
Among the top contributors to the highest results in S1 is efficiency of 2nd stage
engine. Currently some of the best engines in the category are:
- Taborsky’s (Czech) “Delta A-2-7”:
5.2. 2nd Stage Engine
(Specific Impulse Isp = 1200 (Nsec)/kg,
t burn = 1.5 sec)
TABORSKY
Jiri
112
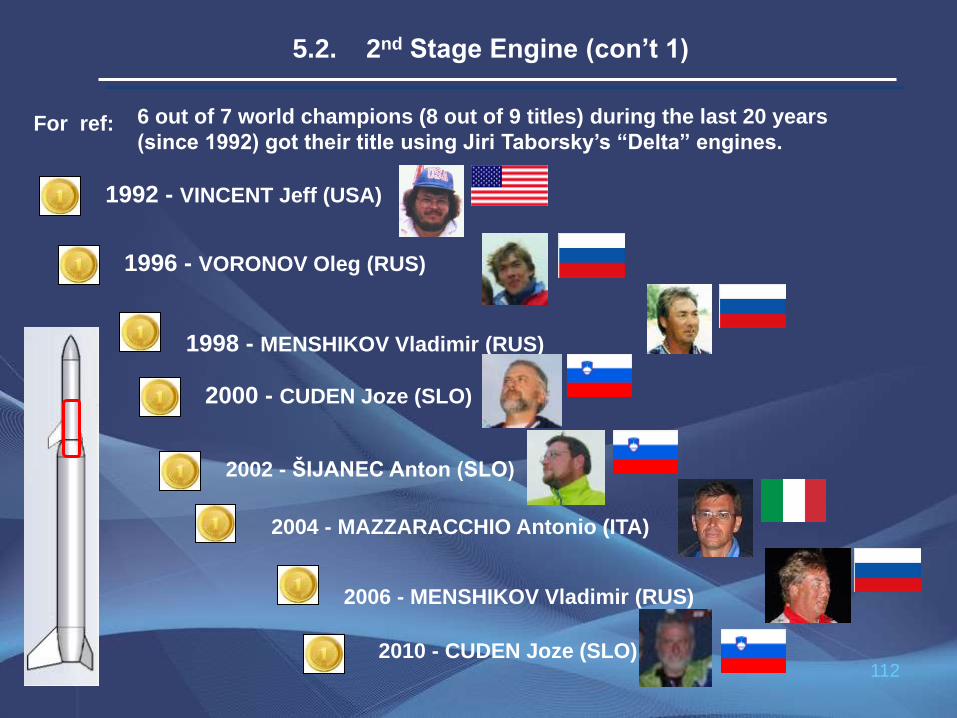
5.2. 2nd Stage Engine (con’t 1)
6 out of 7 world champions (8 out of 9 titles) during the last 20 years
(since 1992) got their title using Jiri Taborsky’s “Delta” engines. For ref:
1996 - VORONOV Oleg (RUS)
1998 - MENSHIKOV Vladimir (RUS) 2000 - CUDEN Joze (SLO)
2002 - ŠIJANEC Anton (SLO)
1992 - VINCENT Jeff (USA)
2004 - MAZZARACCHIO Antonio (ITA)
2006 - MENSHIKOV Vladimir (RUS) 2010 - CUDEN Joze (SLO)
113
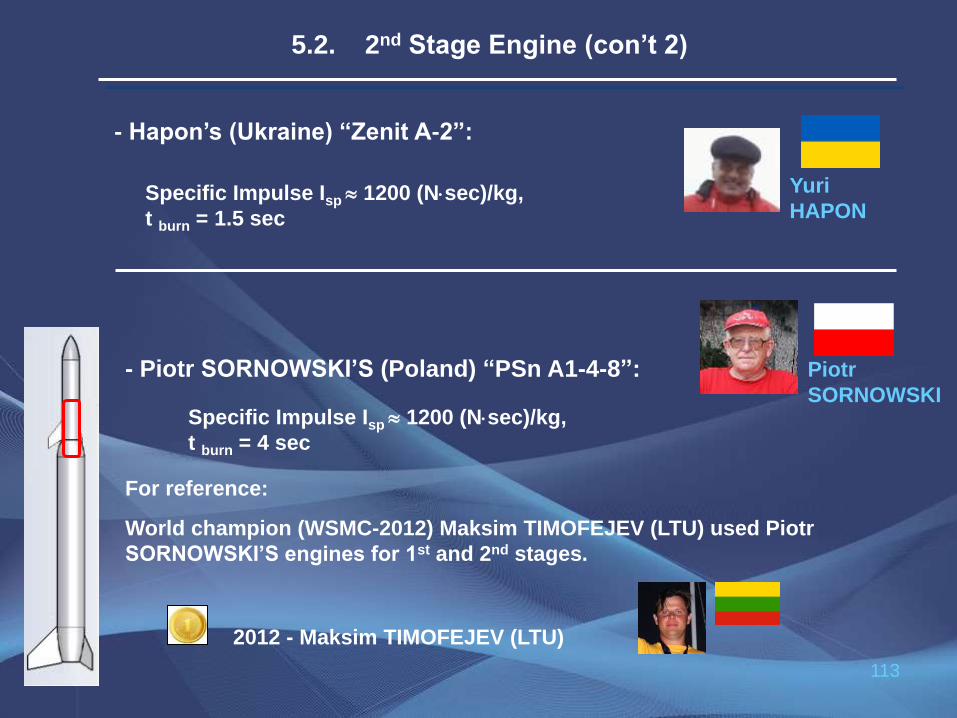
- Hapon’s (Ukraine) “Zenit A-2”:
Specific Impulse Isp 1200 (Nsec)/kg,
t burn = 1.5 sec
Yuri
HAPON
5.2. 2nd Stage Engine (con’t 2)
- Piotr SORNOWSKI’S (Poland) “PSn A1-4-8”: Specific Impulse Isp 1200 (Nsec)/kg,
t burn = 4 sec
For reference:
World champion (WSMC-2012) Maksim TIMOFEJEV (LTU) used Piotr
SORNOWSKI’S engines for 1st and 2nd stages.
2012 - Maksim TIMOFEJEV (LTU)
Piotr
SORNOWSKI
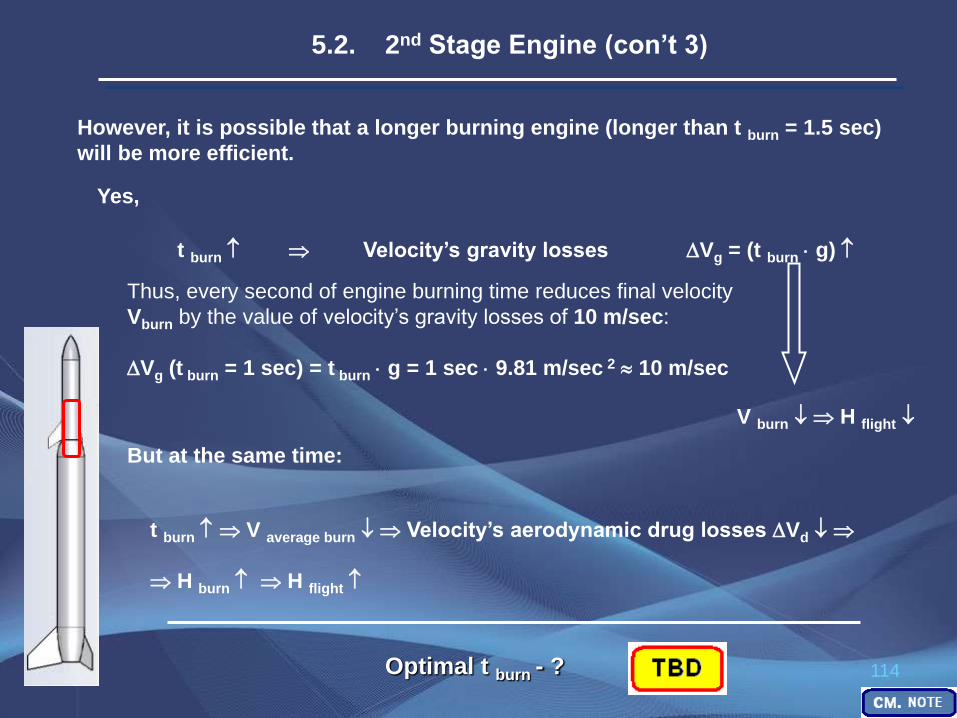
114 Optimal t burn - ?
However, it is possible that a longer burning engine (longer than t burn = 1.5 sec)
will be more efficient.
Yes,
t burn V average burn Velocity’s aerodynamic drug losses Vd
H burn H flight
5.2. 2nd Stage Engine (con’t 3)
t burn Velocity’s gravity losses Vg = (t burn g) Thus, every second of engine burning time reduces final velocity
Vburn by the value of velocity’s gravity losses of 10 m/sec:
Vg (t burn = 1 sec) = t burn g = 1 sec 9.81 m/sec 2 10 m/sec
V burn H flight
But at the same time:
115
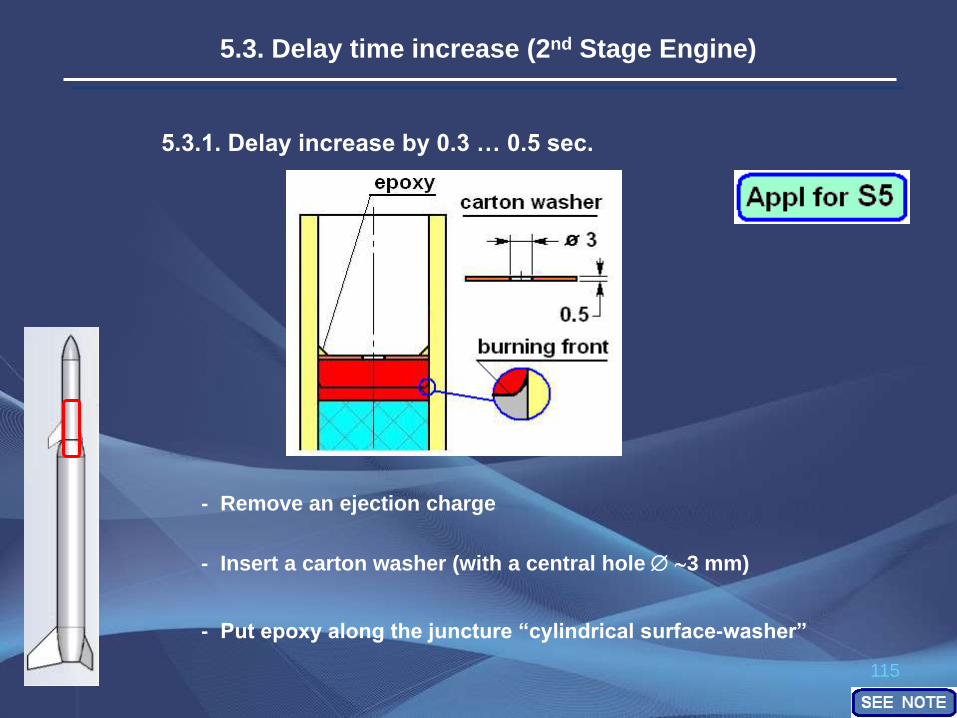
5.3.1. Delay increase by 0.3 … 0.5 sec.
- Remove an ejection charge
- Insert a carton washer (with a central hole 3 mm)
- Put epoxy along the juncture “cylindrical surface-washer”
5.3. Delay time increase (2nd Stage Engine)
116
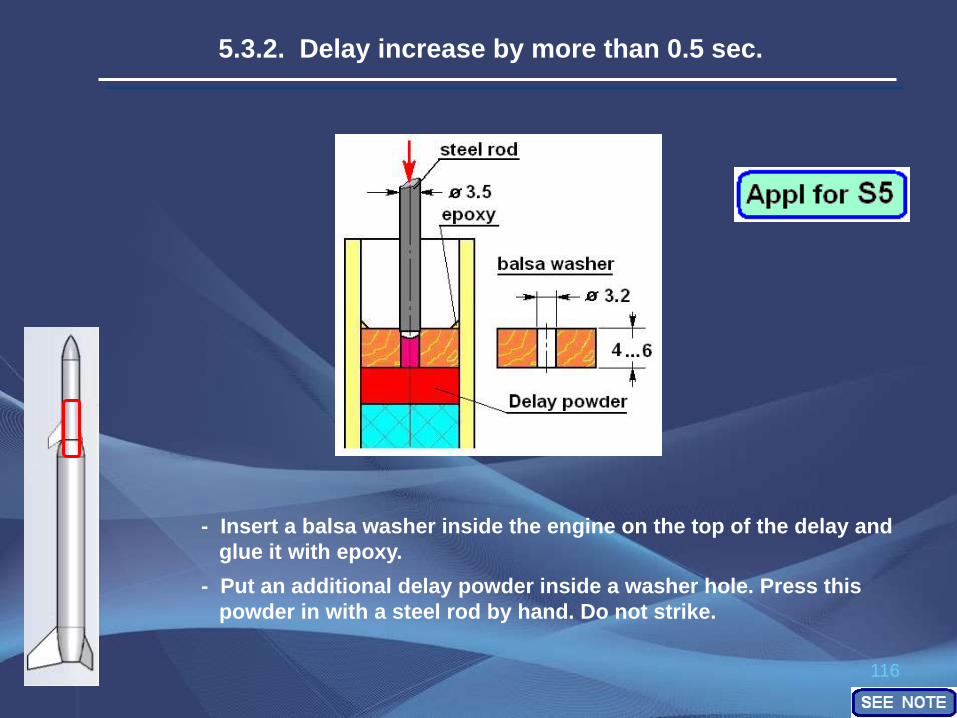
- Insert a balsa washer inside the engine on the top of the delay and
glue it with epoxy.
- Put an additional delay powder inside a washer hole. Press this
powder in with a steel rod by hand. Do not strike.
5.3.2. Delay increase by more than 0.5 sec.

117
Removing a traditional delay from an engine and replacing it
with an electronic device will visibly improve the model’s
performance.
Background: 1. The weight of the current traditional delays for
the engines used for 2nd stages is about 1 gram
(for engines with OD 10 - 11 mm and
t delay 4 - 6 sec).
2. It is possible now to make an electronic
delay device with a weight of about
“the same” 1 gram.
5.4. Delay replacement
118
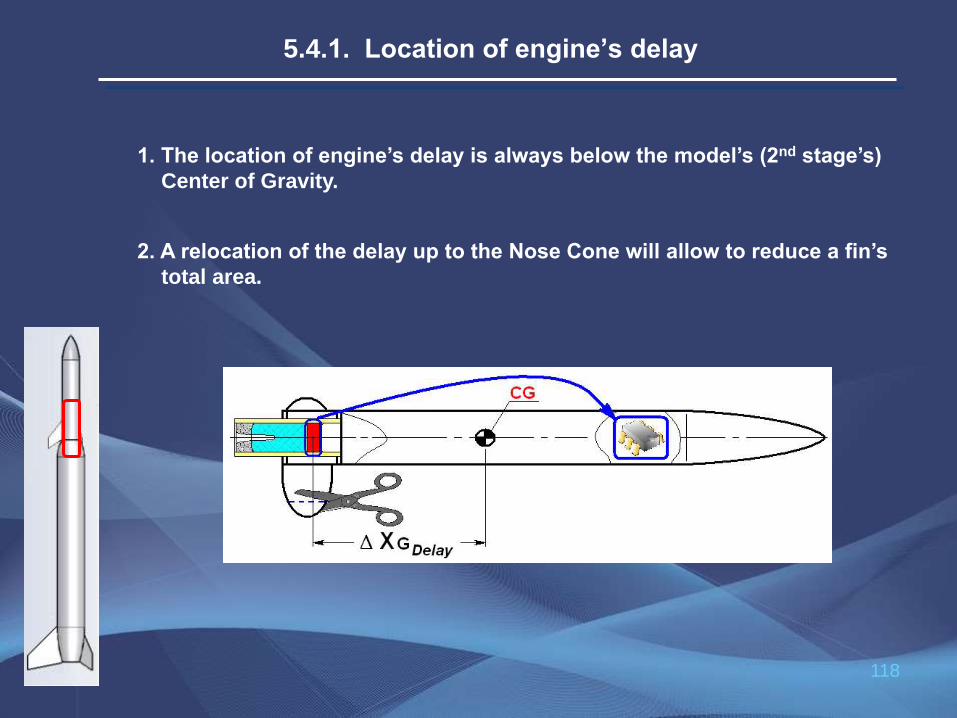
2. A relocation of the delay up to the Nose Cone will allow to reduce a fin’s
total area.
1. The location of engine’s delay is always below the model’s (2nd stage’s)
Center of Gravity.
5.4.1. Location of engine’s delay
119
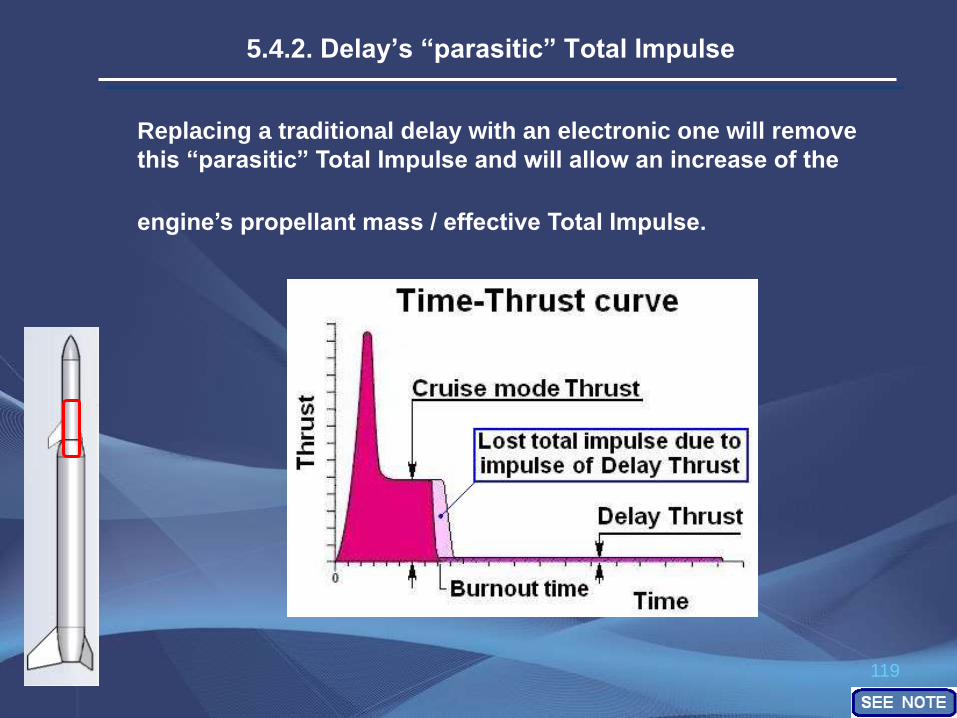
Replacing a traditional delay with an electronic one will remove
this “parasitic” Total Impulse and will allow an increase of the
engine’s propellant mass / effective Total Impulse.
5.4.2. Delay’s “parasitic” Total Impulse
120
Losing weight (about 0.8 g or 5% of coastal weight) during a coastal
flight leads to the coastal flight altitude decrease. Total altitude loss is at
least 1 %.
Removing weight-losing traditional delays will increase the total
altitude by at least 1%.
5.4.3. Delay and model’s ballistic coefficient

121
6. Piston

122
Consider the fact that the time interval (t on piston) between engine’s ignition and the
separation from a piston for relatively light models ( M (model + piston tube) = 30 - 50 gram):
t on piston 0.1 - 0.15 sec
Initial model’s weight m0 = 30 g
Let's estimate power and kinetic energy division between a model and exhaust gases during
this 0.1 sec for a model launched without a piston.
To be definite we will consider the following specific case:
Let’s consider “MRD-A-3” (Hapon & Co, Ukraine) (for example) as the engine
for a 1st stage:
Propellant – BP: Ve = 919 m/sec,
IΣ = 2.48 Nsec,
t burn= 1.3 sec,
m propellant = 2.7 g
Simplifying, thrust F(t) = const
F = 1.91 N
m t sec = 2.1 g/sec
m burn propellant (t=0.1 sec) 0.21 g
6.1. Some Physics and Math behind a Piston

123
N model (t=0.1 sec) = v (F – m g – D) – 0.5 m t sec V^2 = 8.7 W
K model (t=0.1 sec) = 0.5 m model (v model)^2 = 0.43 J
N exh g = 0.5 m t sec (V – Ve)^2 = 866 W
K exh g (t=0.1 sec) = 0.5 m exh g (v exh g)^2 = 88.1 J
N exh g = 100 N model
K exh g = 200 K model
Model’s velocity at the end of t = 0.1 sec IAW Tsyolkovsky’s second Problem:
V( t=0.1 sec) = - Ve ln (m1 / m0) – g t = 5.4 m/sec
Model’s Power and Kinetic energy :
Exhaust gases Power and Kinetic energy :
6.1. Some Physics and Math behind a Piston (con’t 1)
100 (!) times
200 (!) times
100 (!) times
200 (!) times
100 (!) times
200 (!) times
100 (!) times
200 (!) times
124
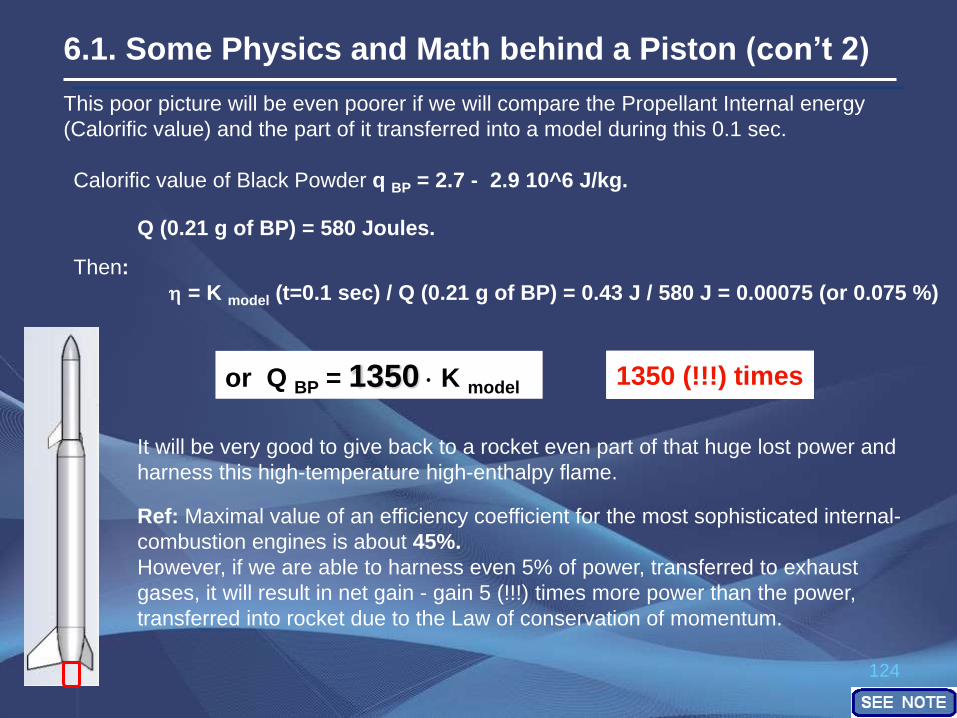
It will be very good to give back to a rocket even part of that huge lost power and
harness this high-temperature high-enthalpy flame.
1350 (!!!) times or Q BP = 1350 K model
This poor picture will be even poorer if we will compare the Propellant Internal energy
(Calorific value) and the part of it transferred into a model during this 0.1 sec.
Calorific value of Black Powder q BP = 2.7 - 2.9 10^6 J/kg.
Q (0.21 g of BP) = 580 Joules.
Then:
= K model (t=0.1 sec) / Q (0.21 g of BP) = 0.43 J / 580 J = 0.00075 (or 0.075 %)
Ref: Maximal value of an efficiency coefficient for the most sophisticated internal-
combustion engines is about 45%.
However, if we are able to harness even 5% of power, transferred to exhaust
gases, it will result in net gain - gain 5 (!!!) times more power than the power,
transferred into rocket due to the Law of conservation of momentum.
6.1. Some Physics and Math behind a Piston (con’t 2)
1350 (!!!) times 1350 (!!!) times 1350 (!!!) times

125
K = 0.5 m model (v model)^2 = 1.5 - 6 J
= K model (t=0.1 sec) / Q (0.21 g of BP) = (1.5 - 6) J / 580 J = 0.0025 - 0.010
Let's view something similar to a rocket modeling piston, a rifle’s cartridges / bullets.
Efficiency rate of the powder (smokeless in modern ammunition) in cartridges (from
the most popular 22LR to the more sophisticated (for example the Sierra 142 MK))
is about 25-33%.
By a very rough estimations of the model's velocity at the separation point from a piston
(for European/Russian piston type, see below) is in a range of 10 - 20 m/sec.
Thus, the model's Kinetic Energy is:
Yes, 0.25 - 1.0 % of the propellant internal energy is much less than the cartridge-
rifle-bullet's efficiency of 25-33%. However, these values are not microscopic
(0.075 %) of no-piston-case either.
Of course, the most powerful industry in the world, the military industry was able to
«squeeze» as much as possible from a few grains of powder during centuries.
A gargantuan gap between 0.075% (and even 1% for currently the most
sophisticated European style pistons) and 25-33% is an indicator that something
can be done for an improvement.
6.1. Some Physics and Math behind a Piston (con’t 3)
126
But to use efficiently what a rocket engine already has is a good idea.
Some ways for further piston improvement are described at the
end of this («Piston») chapter.
I do not encourage converting the ROCKET MODELLING competition into
RIFLE-VERTICAL-SHOOTING competition. It will be a perversion of
SPACEmodeling.
6.1. Some Physics and Math behind a Piston (con’t 4)
127
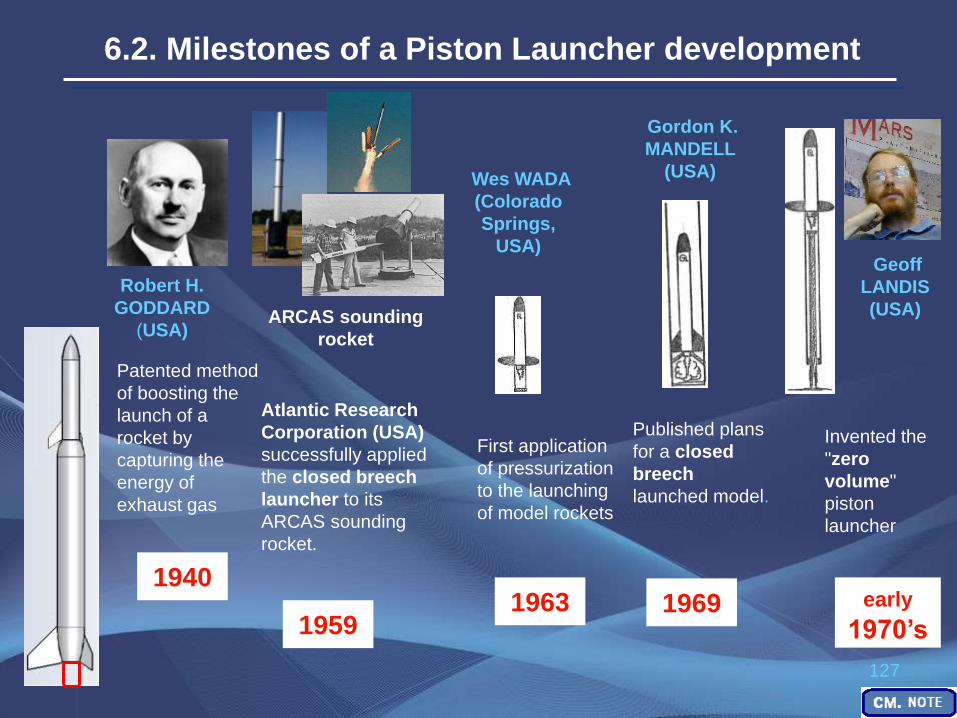
Robert H.
GODDARD
(USA)
6.2. Milestones of a Piston Launcher development
Geoff
LANDIS
(USA)
Wes WADA
(Colorado
Springs,
USA)
Patented method
of boosting the
launch of a
rocket by
capturing the
energy of
exhaust gas
1940
Atlantic Research
Corporation (USA)
successfully applied
the closed breech
launcher to its
ARCAS sounding
rocket.
1959
First application
of pressurization
to the launching
of model rockets
1963 early
1970’s
Invented the
"zero
volume"
piston
launcher
Gordon K.
MANDELL
(USA)
Published plans
for a closed
breech
launched model.
1969
ARCAS sounding
rocket
128
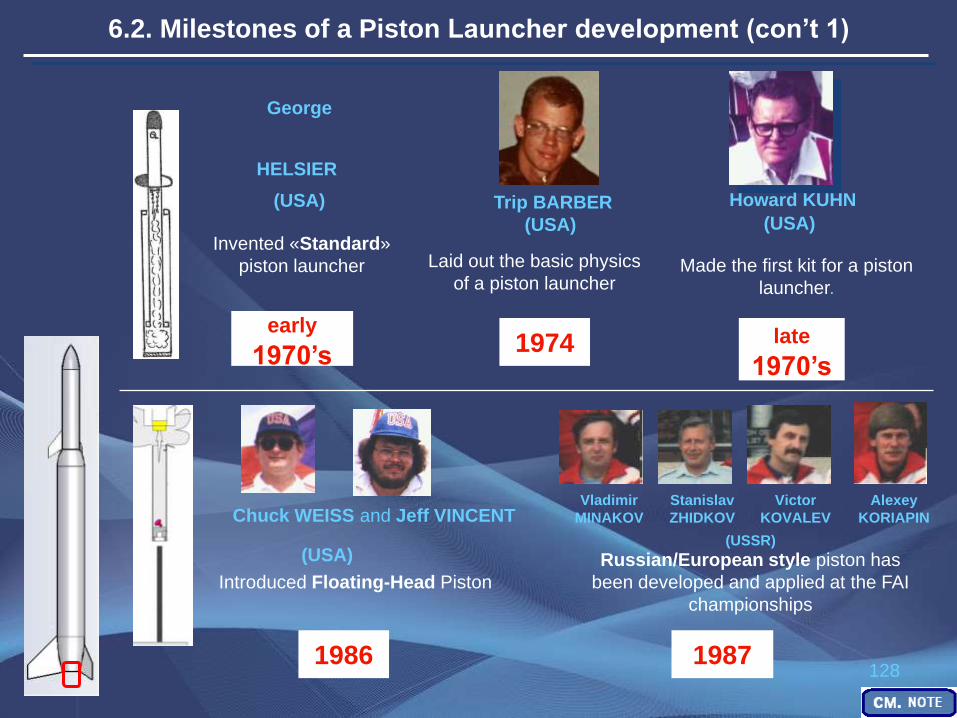
6.2. Milestones of a Piston Launcher development (con’t 1)
Howard KUHN
(USA)
(USA)
late
1970’s
Made the first kit for a piston
launcher.
Introduced Floating-Head Piston
1986
Russian/European style piston has
been developed and applied at the FAI
championships
1987
Trip BARBER
(USA)
Laid out the basic physics
of a piston launcher
1974
Vladimir
MINAKOV
Alexey
KORIAPIN
Victor
KOVALEV
Stanislav
ZHIDKOV
(USSR)
Chuck WEISS and Jeff VINCENT
George
HELSIER (USA)
Invented «Standard»
piston launcher
early
1970’s
129
Introduced “The Pacific Flying
Machines (PFM) Piston”
6.2. Milestones of a Piston Launcher development (con’t 2)
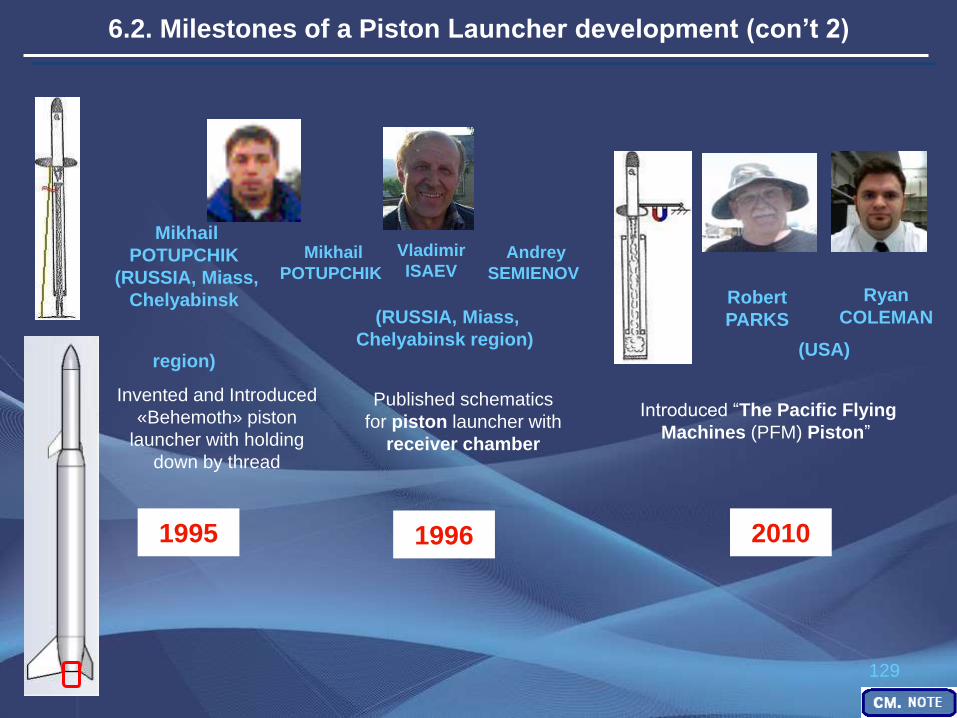
2010
Robert
PARKS
Ryan
COLEMAN
(USA)
Published schematics
for piston launcher with
receiver chamber
1995
Invented and Introduced
«Behemoth» piston
launcher with holding
down by thread
Mikhail
POTUPCHIK
(RUSSIA, Miass,
Chelyabinsk
region)
1996
(RUSSIA, Miass,
Chelyabinsk region)
Mikhail
POTUPCHIK
Vladimir
ISAEV Andrey
SEMIENOV

130
6.3. Schematic of original “zero volume” US piston
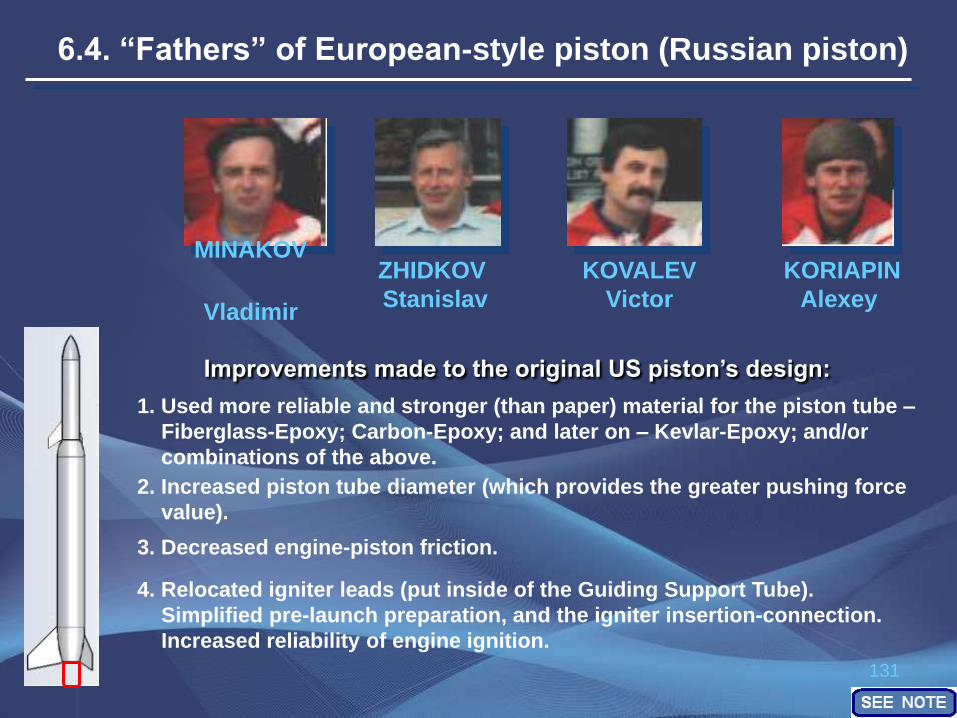
131
MINAKOV
Vladimir KORIAPIN
Alexey
KOVALEV
Victor
ZHIDKOV
Stanislav
Improvements made to the original US piston’s design: 1. Used more reliable and stronger (than paper) material for the piston tube –
Fiberglass-Epoxy; Carbon-Epoxy; and later on – Kevlar-Epoxy; and/or
combinations of the above.
2. Increased piston tube diameter (which provides the greater pushing force
value).
3. Decreased engine-piston friction.
4. Relocated igniter leads (put inside of the Guiding Support Tube).
Simplified pre-launch preparation, and the igniter insertion-connection.
Increased reliability of engine ignition.
6.4. “Fathers” of European-style piston (Russian piston)
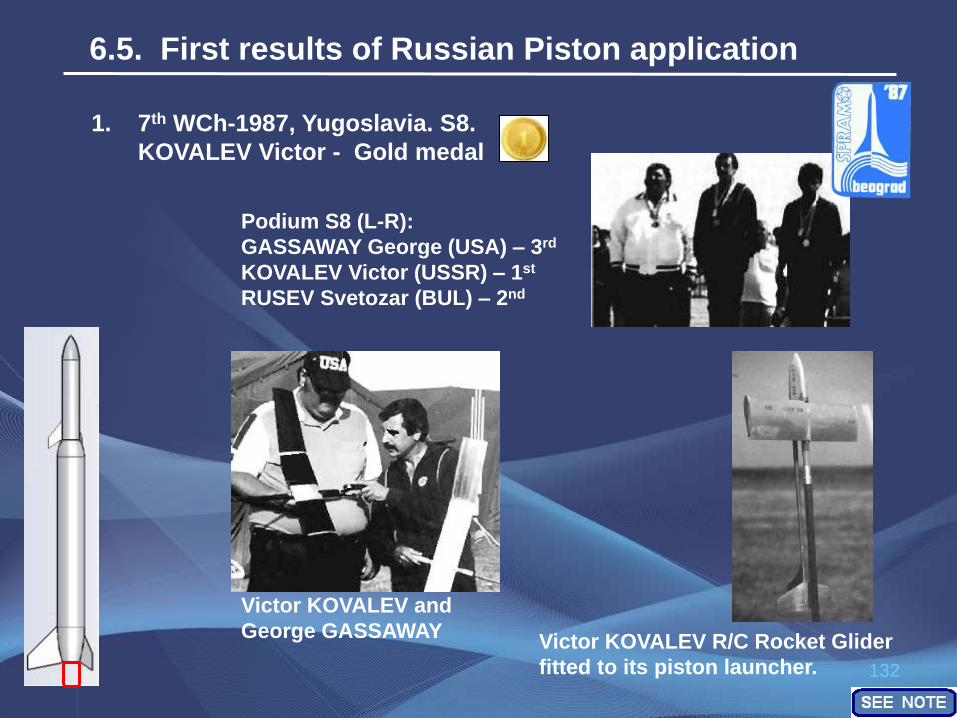
132
Victor KOVALEV R/C Rocket Glider
fitted to its piston launcher.
Podium S8 (L-R):
GASSAWAY George (USA) – 3rd
KOVALEV Victor (USSR) – 1st
RUSEV Svetozar (BUL) – 2nd
Victor KOVALEV and
George GASSAWAY
1. 7th WCh-1987, Yugoslavia. S8.
KOVALEV Victor - Gold medal
6.5. First results of Russian Piston application
133
MINAKOV
Vladimir ILYIN
Sergei
MMR-06 scale model fitted to piston launcher.
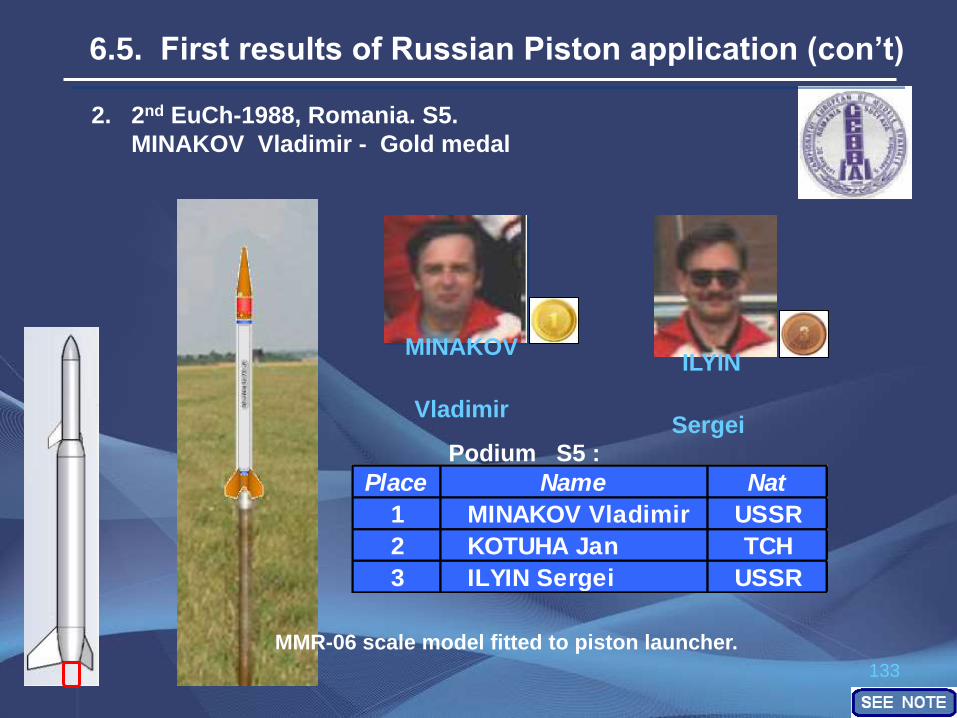
2. 2nd EuCh-1988, Romania. S5.
MINAKOV Vladimir - Gold medal
6.5. First results of Russian Piston application (con’t)
Podium S5 :
Place Name Nat
1 MINAKOV Vladimir USSR
2 KOTUHA Jan TCH
3 ILYIN Sergei USSR
134
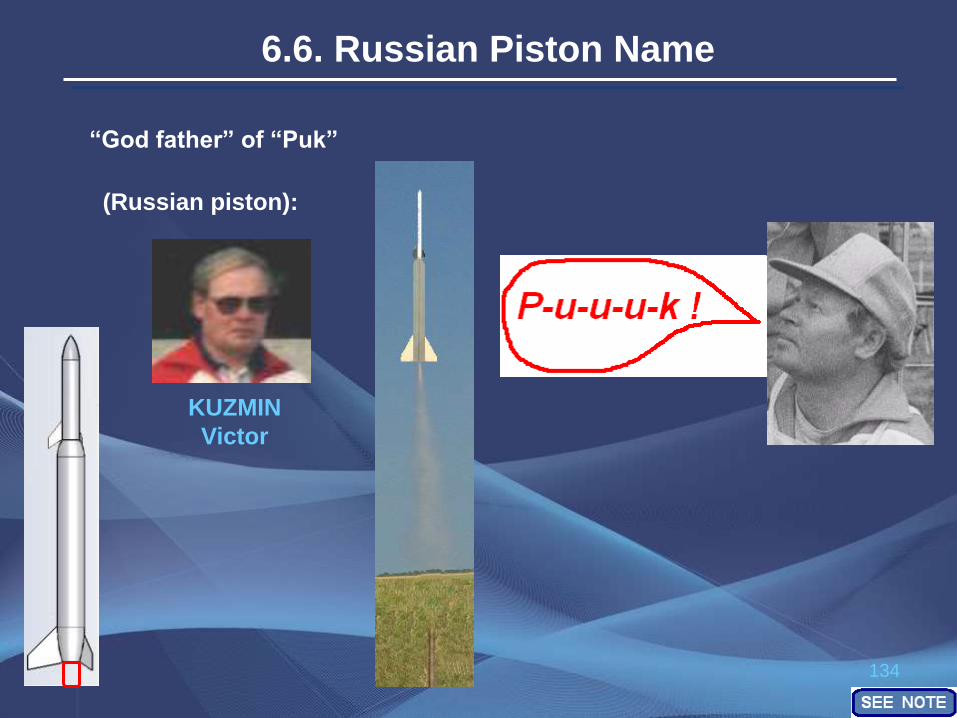
KUZMIN
Victor
“God father” of “Puk”
(Russian piston):
6.6. Russian Piston Name
135
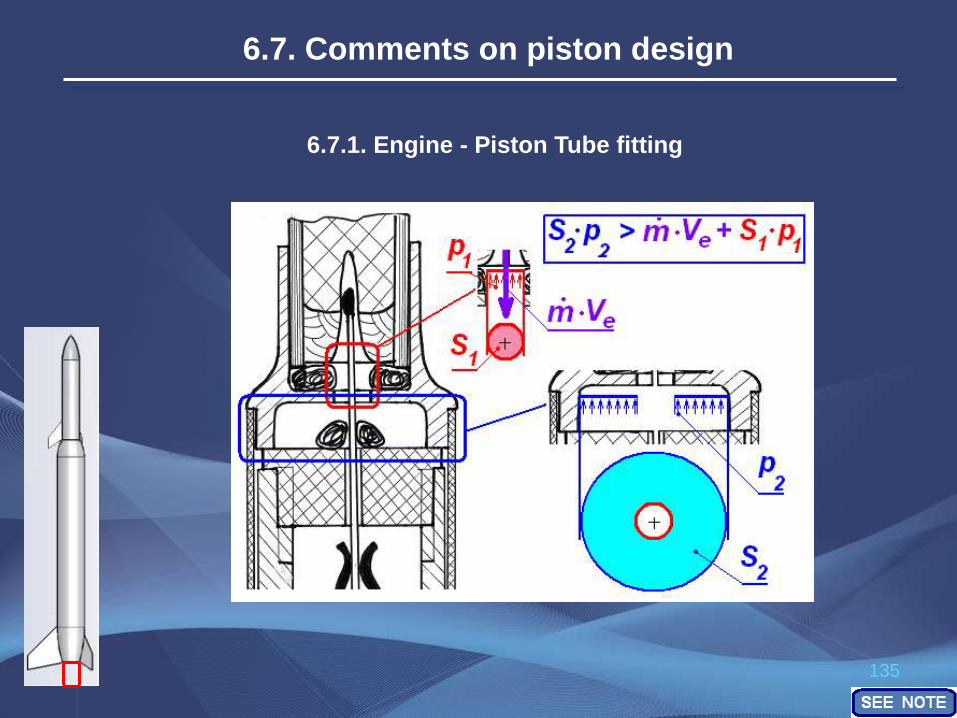
6.7.1. Engine - Piston Tube fitting
6.7. Comments on piston design
136
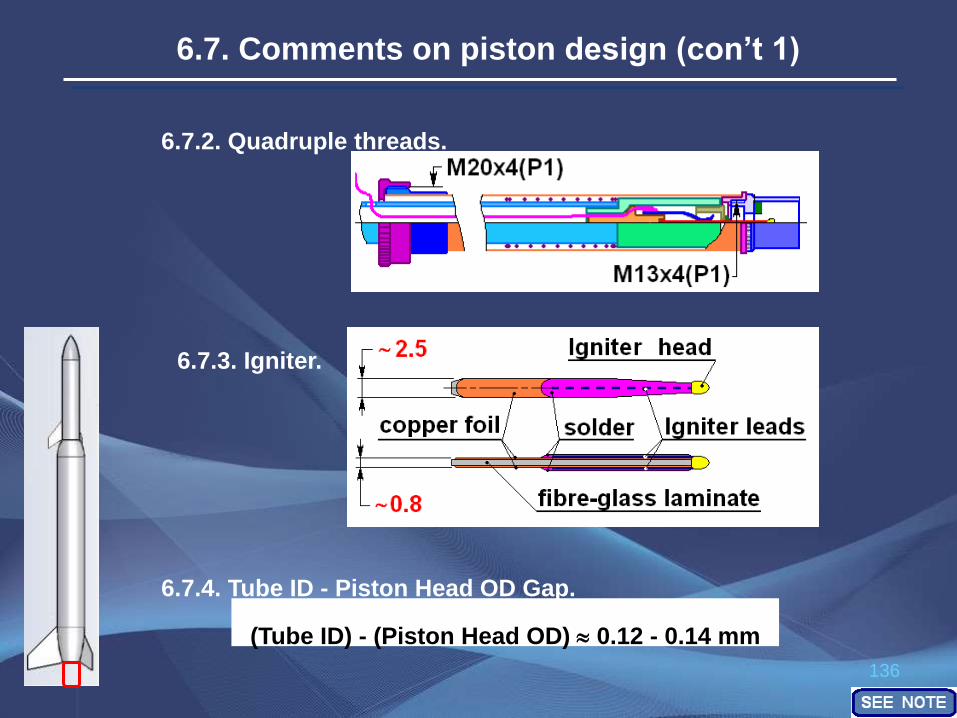
6.7.2. Quadruple threads.
6.7.3. Igniter.
6.7.4. Tube ID - Piston Head OD Gap. (Tube ID) - (Piston Head OD) 0.12 - 0.14 mm
6.7. Comments on piston design (con’t 1)

137
6.7.5. Tube’s vent holes location.
6.7. Comments on piston design (con’t 2)
6.7.6. Tube’s wall thickness.

138
Piston for models S1 / S3 / S4 / S5 / S6 / S9:
6.8. Basic dimensions
139
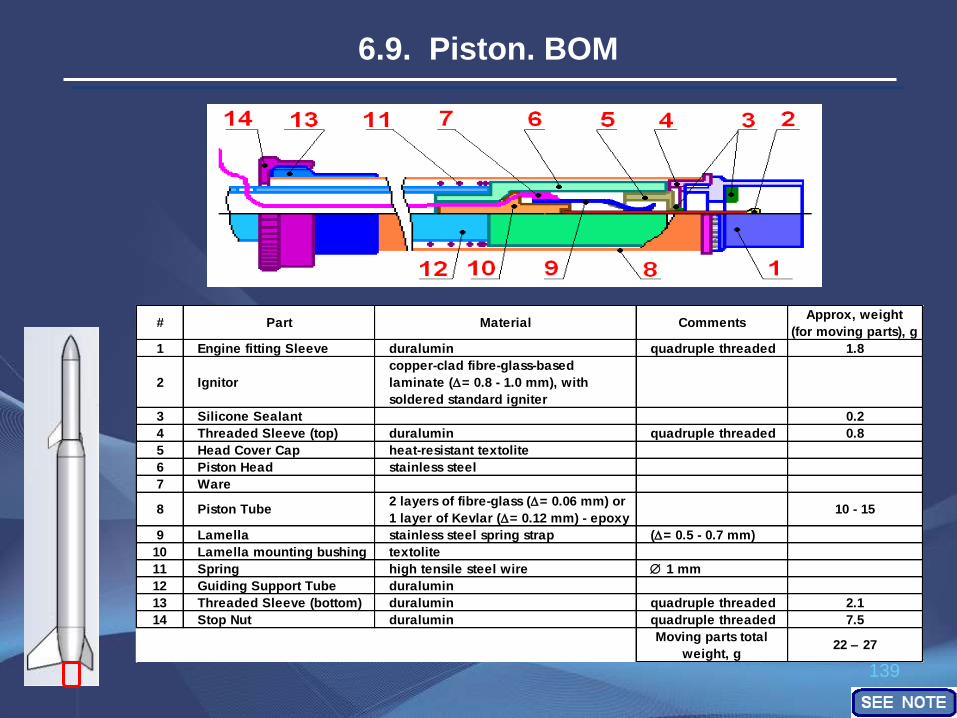
6.9. Piston. BOM
# Part Material CommentsApprox, weight
(for moving parts), g
1 Engine fitting Sleeve duralumin quadruple threaded 1.8
2 Ignitor
copper-clad fibre-glass-based
laminate (= 0.8 - 1.0 mm), with
soldered standard igniter
3 Silicone Sealant 0.2
4 Threaded Sleeve (top) duralumin quadruple threaded 0.8
5 Head Cover Cap heat-resistant textolite
6 Piston Head stainless steel
7 Ware
8 Piston Tube2 layers of fibre-glass (= 0.06 mm) or
1 layer of Kevlar (= 0.12 mm) - epoxy10 - 15
9 Lamella stainless steel spring strap (= 0.5 - 0.7 mm)
10 Lamella mounting bushing textolite
11 Spring high tensile steel wire 1 mm
12 Guiding Support Tube duralumin
13 Threaded Sleeve (bottom) duralumin quadruple threaded 2.1
14 Stop Nut duralumin quadruple threaded 7.5
Moving parts total
weight, g22 - 27
140
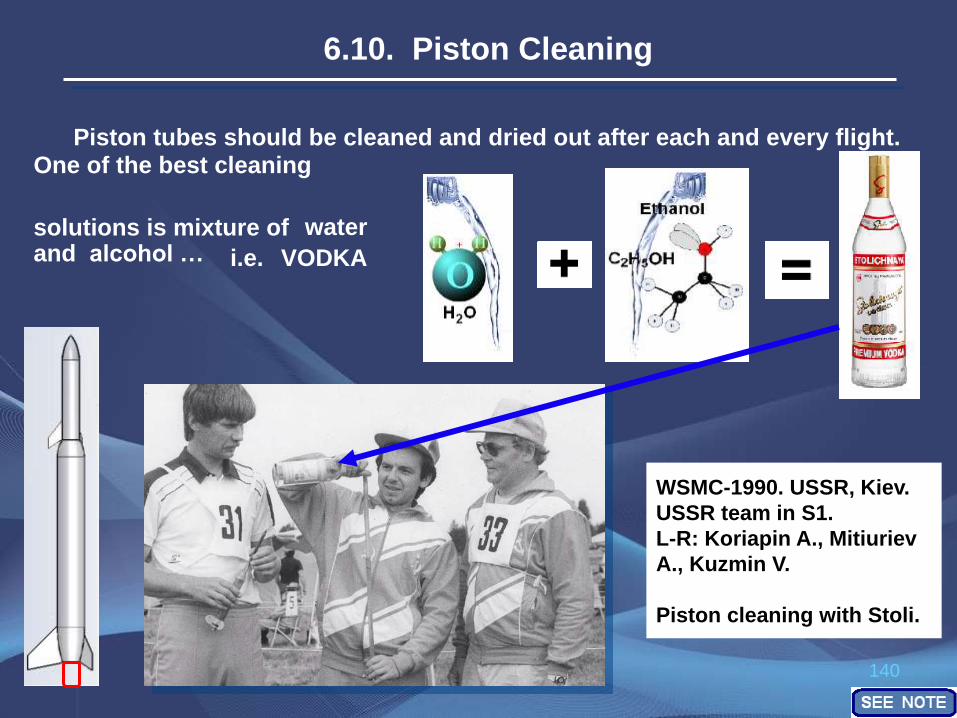
One of the best cleaning
solutions is mixture of
Piston tubes should be cleaned and dried out after each and every flight.
WSMC-1990. USSR, Kiev.
USSR team in S1.
L-R: Koriapin A., Mitiuriev
A., Kuzmin V.
Piston cleaning with Stoli.
water and alcohol …
6.10. Piston Cleaning
VODKA i.e.

141
6.11.1. Combined Engine-Piston optimization.
However, accurate and detailed R&D should be done in order to
determine the range of optimal Piston Tube geometry.
6.11. 2. Piston Tube diameter and length optimization.
Reduce 1st stage engine burn time – and it will increase the portion of
the engine’s exhaust gases working inside of a piston.
See subchapter “5.1. 1st Stage Engines”.
Back in late 1980’s when the basics of the current Russian piston design were
established, piston Tube ID (both for S8 and S1/5 (S3/4/6)) were chosen on the
basis of mandrel tubes availability:
ID 21-24 mm for S8 and ID 15 mm (diameter of ski poles)
At the same time, selection of tube ID also was driven by the empirical “Minakov’s
rule” – Piston’s Tube ID should be about 2 - 4 mm greater than Engine’s OD.
6.11. Further Piston Improvements
142
A. Replace relatively heavy duralumin ( = 2.8 g/cm^3) used for fastening parts
(see Piston’s BOM: Engine fitting Sleeve, Threaded Sleeves (top and bottom),
Stop Nut) with lighter but strong and shock loads resistant material(s) (for
example: Kevlar-Carbon-Epoxy).
B. Removing Threaded Sleeve (top) –
replace the Top fastening couple with
Engine fitting Sleeve glued temporary into
Piston Tube.
However, this change will result in
reduced mobility, and inconvenience of
piston parts assembling/disassembling for
cleaning-launch preparation purposes.
6.11.3. Reducing weight of Piston’s moving parts
143
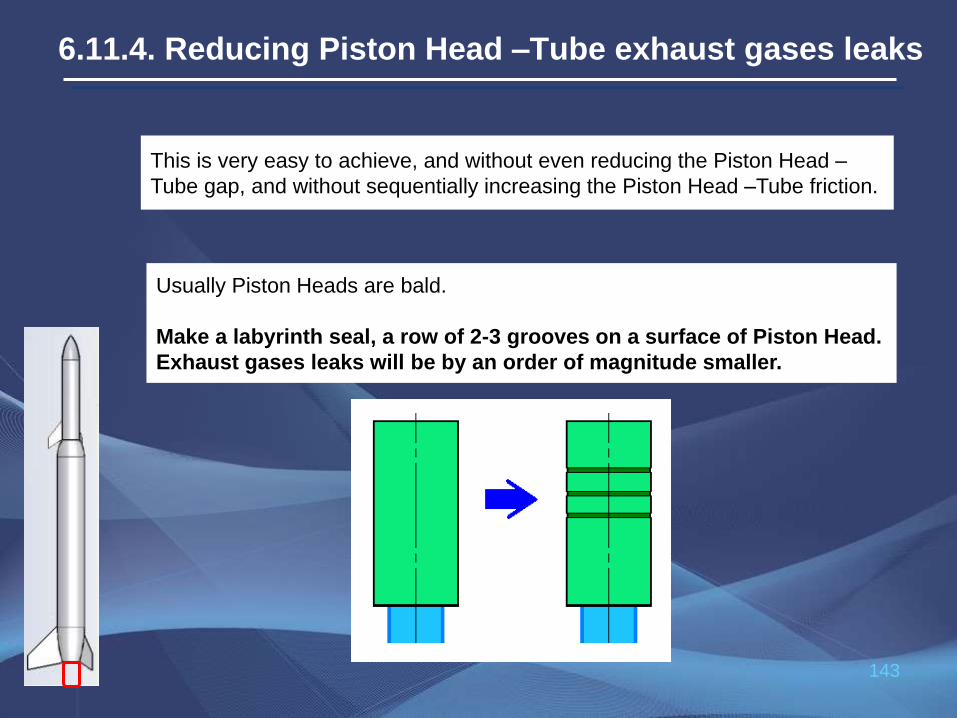
This is very easy to achieve, and without even reducing the Piston Head –
Tube gap, and without sequentially increasing the Piston Head –Tube friction.
Usually Piston Heads are bald.
Make a labyrinth seal, a row of 2-3 grooves on a surface of Piston Head.
Exhaust gases leaks will be by an order of magnitude smaller.
6.11.4. Reducing Piston Head –Tube exhaust gases leaks
144
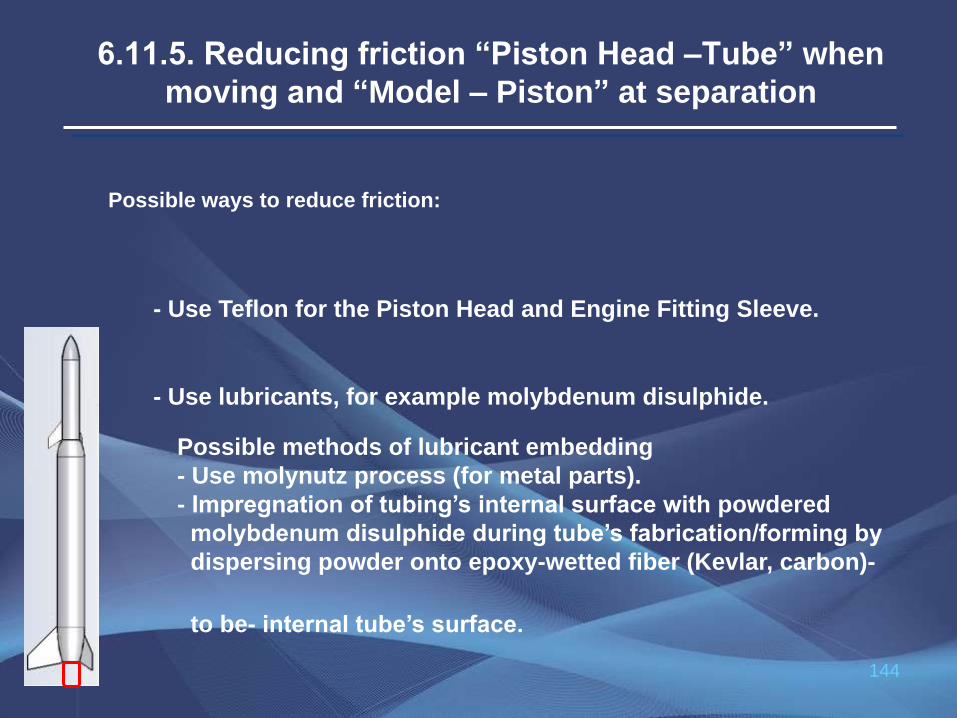
Possible ways to reduce friction:
- Use Teflon for the Piston Head and Engine Fitting Sleeve.
6.11.5. Reducing friction “Piston Head –Tube” when
moving and “Model – Piston” at separation
Possible methods of lubricant embedding
- Use molynutz process (for metal parts).
- Impregnation of tubing’s internal surface with powdered
molybdenum disulphide during tube’s fabrication/forming by
dispersing powder onto epoxy-wetted fiber (Kevlar, carbon)-
to be- internal tube’s surface.
- Use lubricants, for example molybdenum disulphide.

145
Developing and improving launch devices, which better utilize
energy of the exhaust gases, specifically devices which holding
down the model and piston to build up pressure before first motion.
6.11.6. Developing and improving new piston launcher devices
Example of this type launcher, PFM (of Robert Parks and Ryan
Coleman) showed a significant improvement in the flight altitude
(with accelerations of up to 90G (900 m/sec^2) at model-piston
separation point) compare to the traditional Pistons (“Zero
Volume” and Floating Head pistons).

146
7. Streamer
147
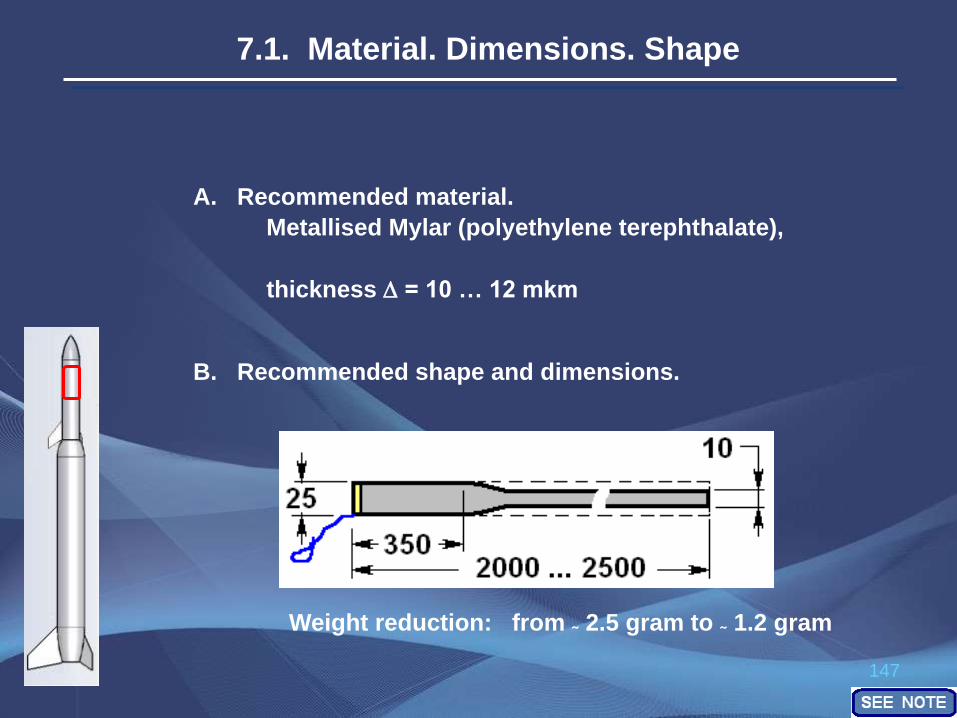
Metallised Mylar (polyethylene terephthalate),
thickness = 10 … 12 mkm
B. Recommended shape and dimensions.
Weight reduction: from ~ 2.5 gram to ~ 1.2 gram
A. Recommended material.
7.1. Material. Dimensions. Shape

148
Zero-rebound stroke shock-absorber:
Ejection shock absorption.
7.2. Body-NC-Streamer attaching
149
8. Reliability issues
150
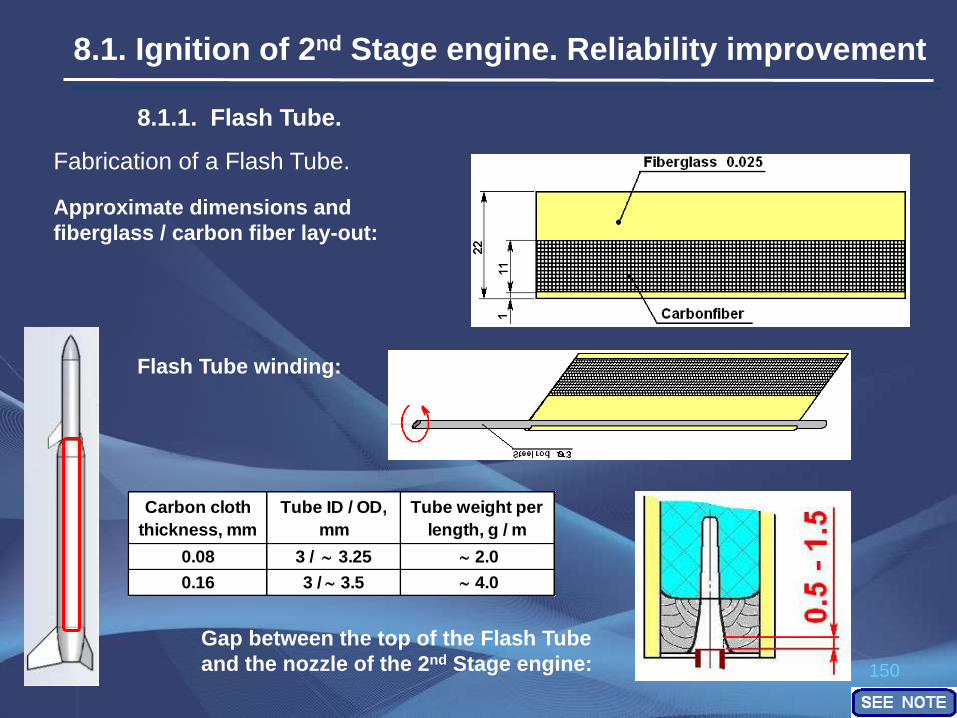
8.1.1. Flash Tube. Fabrication of a Flash Tube. Approximate dimensions and
fiberglass / carbon fiber lay-out:
Flash Tube winding:
8.1. Ignition of 2nd Stage engine. Reliability improvement
Carbon cloth
thickness, mm
Tube ID / OD,
mm
Tube weight per
length, g / m
0.08 3 / 3.25 2.0
0.16 3 / 3.5 4.0
Gap between the top of the Flash Tube
and the nozzle of the 2nd Stage engine:

151
8.1.2. Black Powder granules padding.
8.1.3. BP charge in a bottom stage engine.
8.1. Ignition of 2nd Stage engine (con’t)
Measuring gauge ID = 5.6 mm
Tube length, mm Measuring gauge length, mm
150 4
300 - 350 6
152
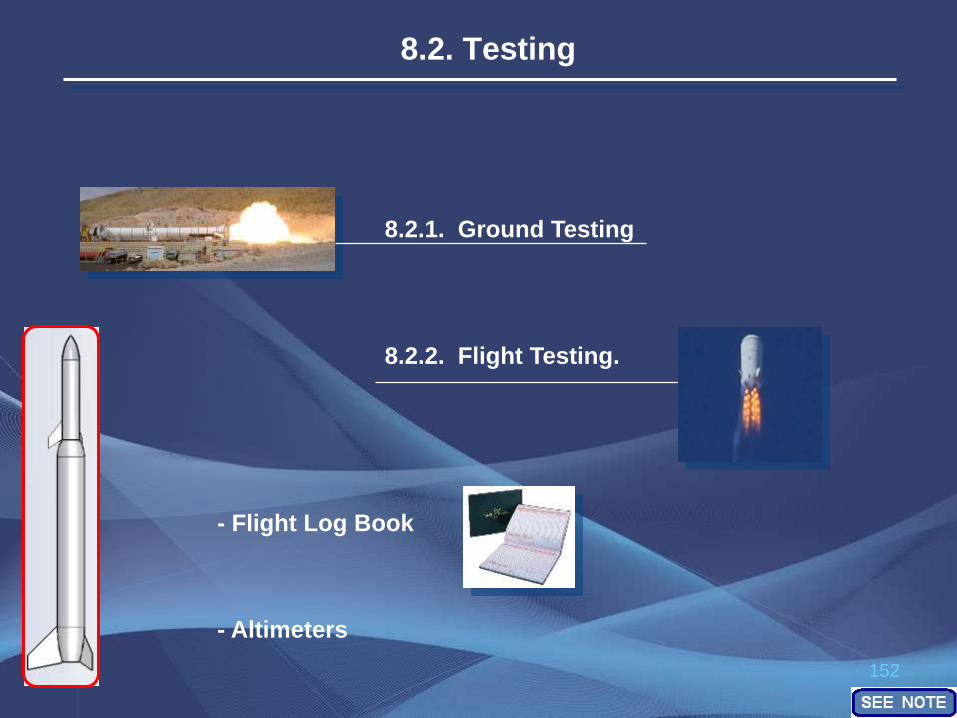
- Flight Log Book
8.2.2. Flight Testing.
8.2.1. Ground Testing
- Altimeters
8.2. Testing

153
8.2.3. Some recommendations for Flight Tests
preparation and conduction
8.2.3.1. Flights number
8.2.3.2. Test models quality and uniformity
8.2.3.3. Weather conditions during testing
- at least 3 flights for each compared option
154
8.2.3. Some recommendations for Flight Tests preparation
and conduction (con’t)
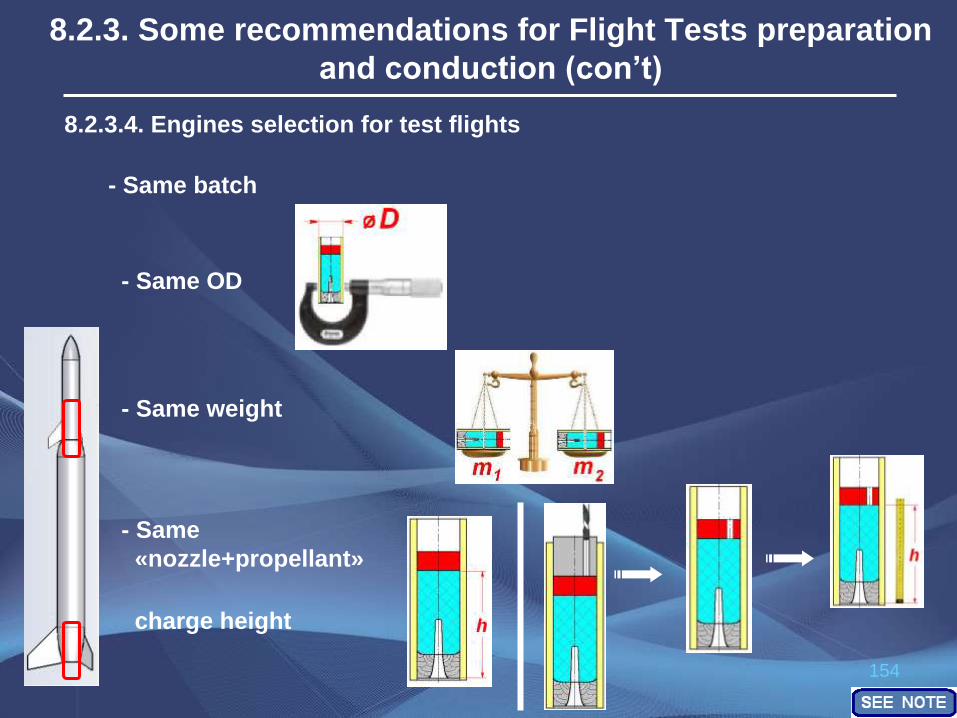
8.2.3.4. Engines selection for test flights
- Same batch
- Same OD
- Same weight
- Same
«nozzle+propellant»
charge height
155
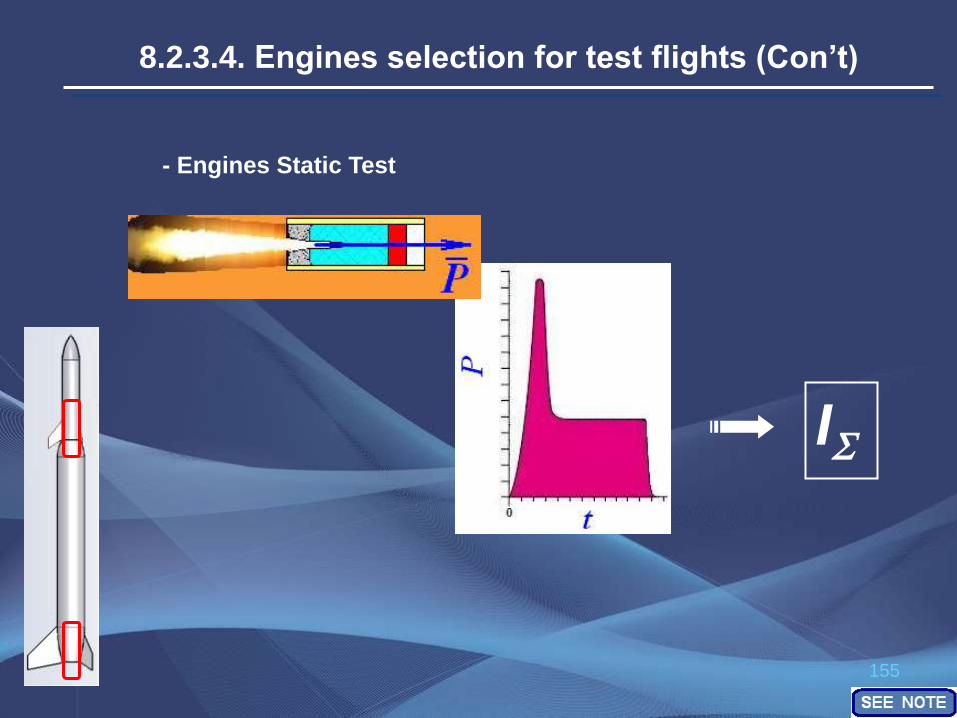
8.2.3.4. Engines selection for test flights (Con’t)
- Engines Static Test
I
156
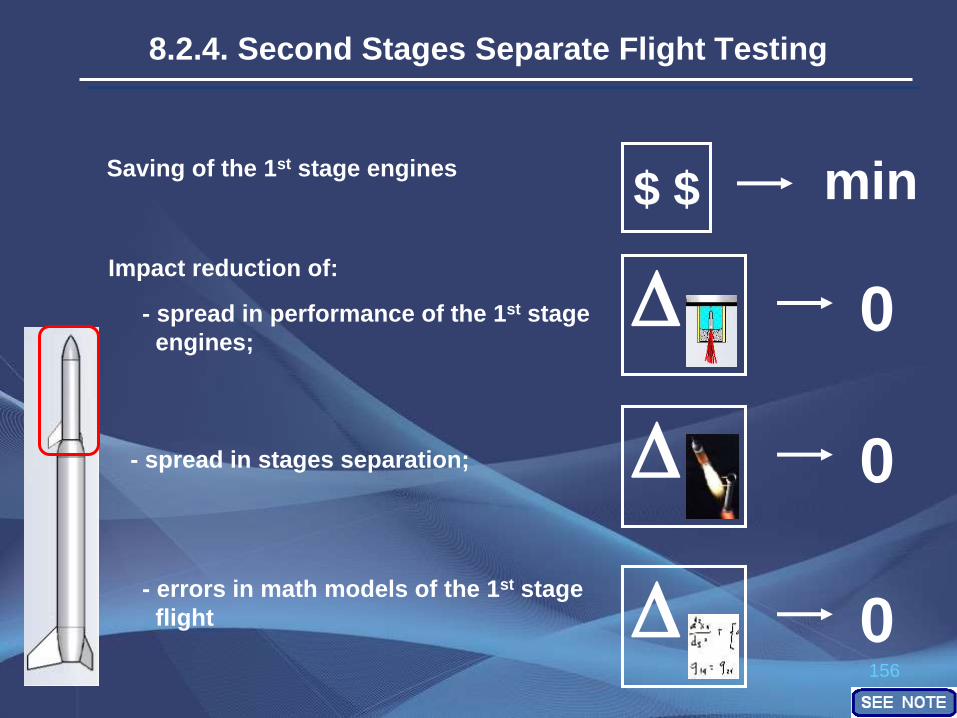
Saving of the 1st stage engines
- spread in performance of the 1st stage
engines;
- errors in math models of the 1st stage
flight
8.2.4. Second Stages Separate Flight Testing
- spread in stages separation;
$ $
0 Impact reduction of:
0
0
min
157
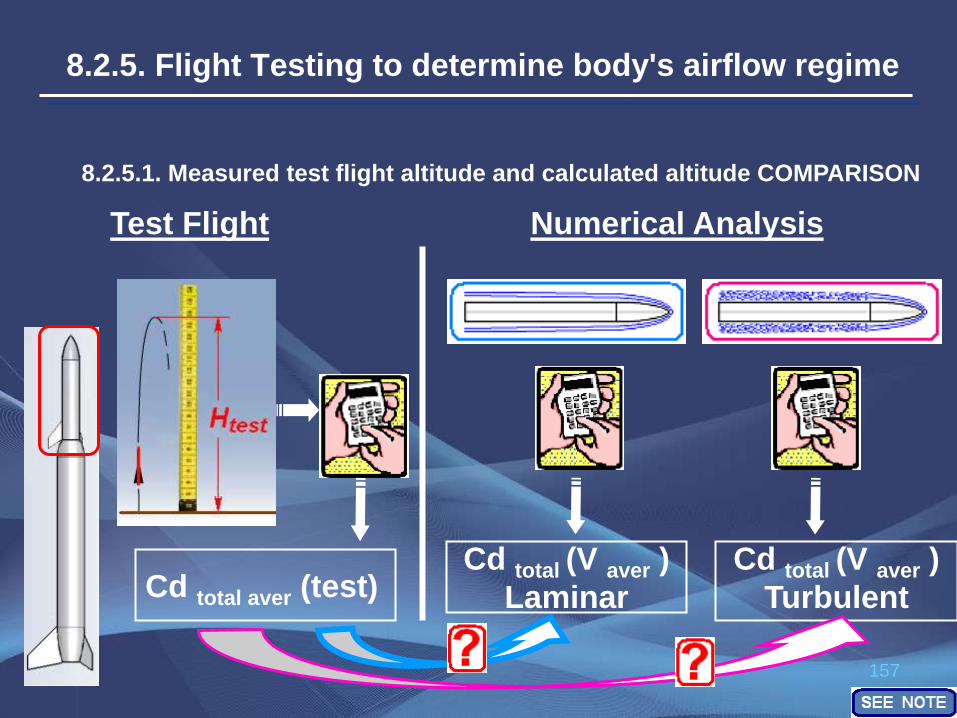
8.2.5. Flight Testing to determine body's airflow regime
8.2.5.1. Measured test flight altitude and calculated altitude COMPARISON
Cd total aver (test) Cd total (V aver )
Laminar
Cd total (V aver )
Turbulent
Test Flight Numerical Analysis
158
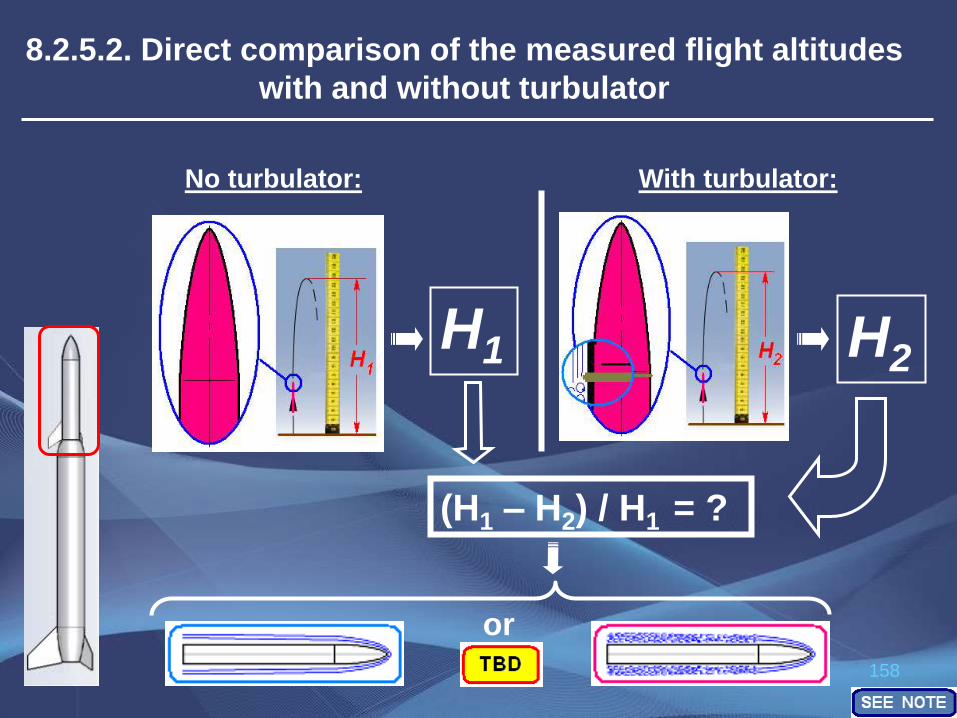
8.2.5.2. Direct comparison of the measured flight altitudes
with and without turbulator
(H1 – H2) / H1 = ?
or
No turbulator: With turbulator:
H1 H2

159
9. Technical results of the past World and
European Championships (top 10 contenders)
160
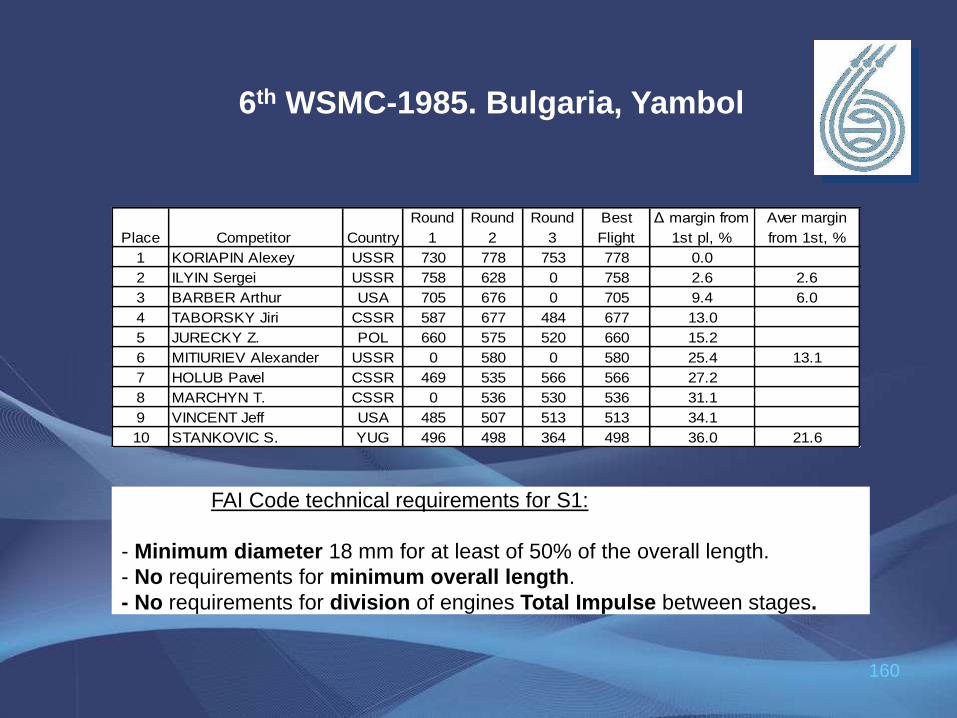
FAI Code technical requirements for S1:
- Minimum diameter 18 mm for at least of 50% of the overall length.
- No requirements for minimum overall length.
- No requirements for division of engines Total Impulse between stages.
Place Competitor Country
Round
1
Round
2
Round
3
Best
Flight
Δ margin from
1st pl, %
Aver margin
from 1st, %
1 KORIAPIN Alexey USSR 730 778 753 778 0.0
2 ILYIN Sergei USSR 758 628 0 758 2.6 2.6
3 BARBER Arthur USA 705 676 0 705 9.4 6.0
4 TABORSKY Jiri CSSR 587 677 484 677 13.0
5 JURECKY Z. POL 660 575 520 660 15.2
6 MITIURIEV Alexander USSR 0 580 0 580 25.4 13.1
7 HOLUB Pavel CSSR 469 535 566 566 27.2
8 MARCHYN T. CSSR 0 536 530 536 31.1
9 VINCENT Jeff USA 485 507 513 513 34.1
10 STANKOVIC S. YUG 496 498 364 498 36.0 21.6
6th WSMC-1985. Bulgaria, Yambol
161
Place Competitor Country
Round
1
Round
2
Round
3
Best
Flight
Δ margin from
1st pl, %
Aver margin
from 1st, %
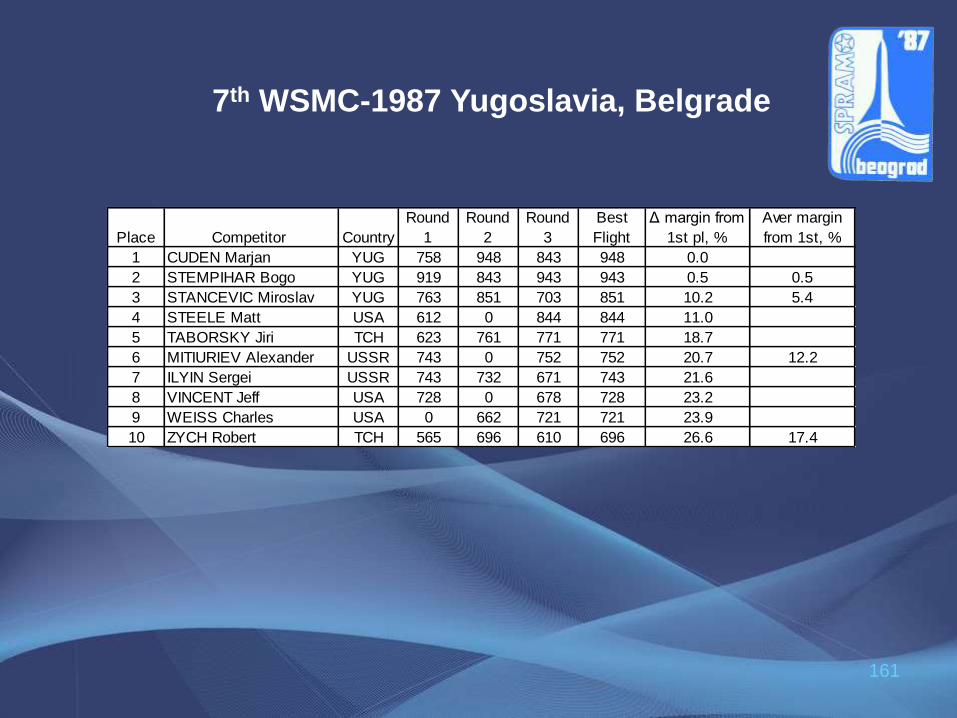
1 CUDEN Marjan YUG 758 948 843 948 0.0
2 STEMPIHAR Bogo YUG 919 843 943 943 0.5 0.5
3 STANCEVIC Miroslav YUG 763 851 703 851 10.2 5.4
4 STEELE Matt USA 612 0 844 844 11.0
5 TABORSKY Jiri TCH 623 761 771 771 18.7
6 MITIURIEV Alexander USSR 743 0 752 752 20.7 12.2
7 ILYIN Sergei USSR 743 732 671 743 21.6
8 VINCENT Jeff USA 728 0 678 728 23.2
9 WEISS Charles USA 0 662 721 721 23.9
10 ZYCH Robert TCH 565 696 610 696 26.6 17.4
7th WSMC-1987 Yugoslavia, Belgrade
162
Place Competitor Country
Round
1
Round
2
Round
3
Best
Flight
Δ margin from
1st pl, %
Aver margin
from 1st, %
1 KORIAPIN Alexey URS 784 0 0 784 0.0
2 MITIURIEV Alexander URS 754 661 0 754 3.8 3.8
3 SPASOV MARINOV DjulijanBUL 672 0 0 672 14.3 9.1
4 ZYCH Robert TCH 656 0 0 656 16.3
5 DRAGOV Tasko BUL 0 608 0 608 22.4
6 KOTUHA Jan TCH 556 0 0 556 29.1 17.2
7 CUDEN Joze YUG 536 0 0 536 31.6
8 ROSE Arthur USA 0 479 0 479 38.9
9 SORNOVSKY P. POL 0 454 0 454 42.1
10 KRIGER M. POL 359 314 450 450 42.6 26.8
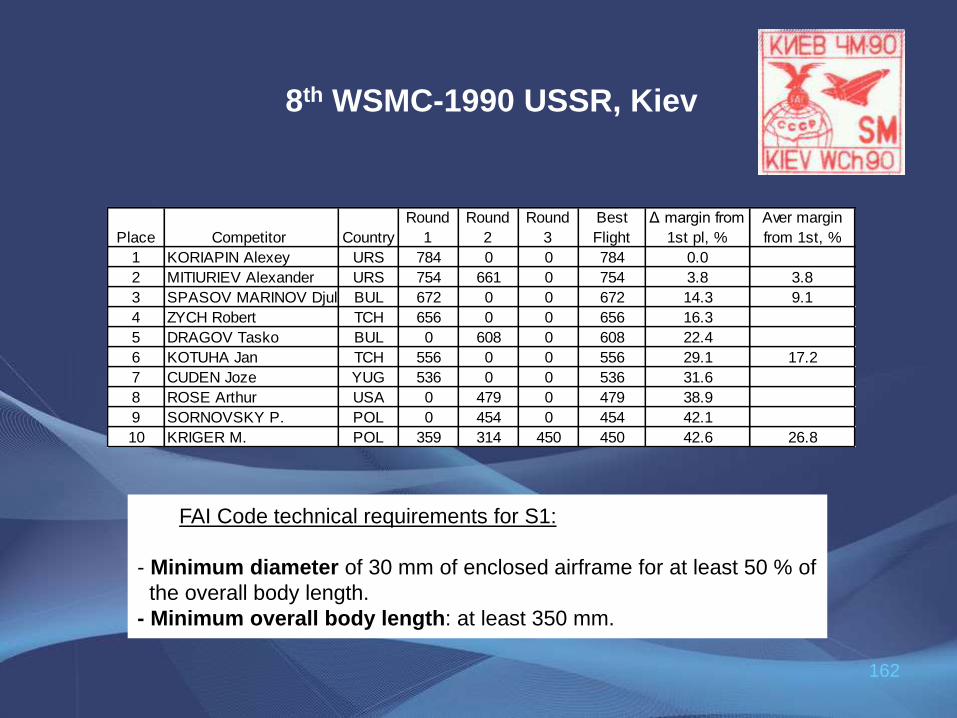
8th WSMC-1990 USSR, Kiev
FAI Code technical requirements for S1:
- Minimum diameter of 30 mm of enclosed airframe for at least 50 % of
the overall body length.
- Minimum overall body length: at least 350 mm.
163
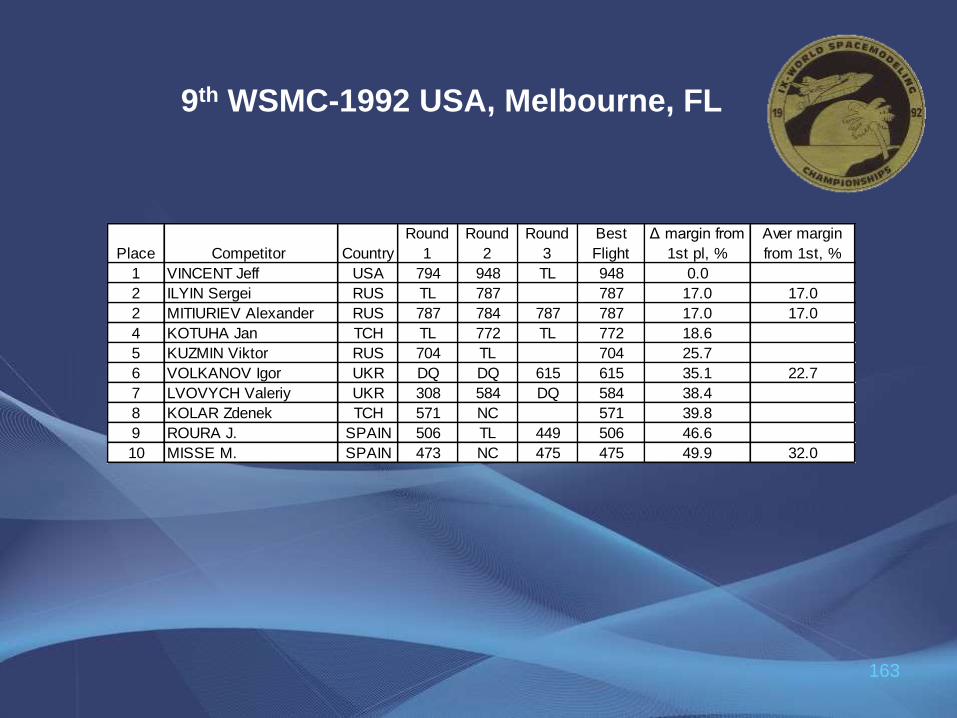
9th WSMC-1992 USA, Melbourne, FL
Place Competitor Country
Round
1
Round
2
Round
3
Best
Flight
Δ margin from
1st pl, %
Aver margin
from 1st, %
1 VINCENT Jeff USA 794 948 TL 948 0.0
2 ILYIN Sergei RUS TL 787 787 17.0 17.0
2 MITIURIEV Alexander RUS 787 784 787 787 17.0 17.0
4 KOTUHA Jan TCH TL 772 TL 772 18.6
5 KUZMIN Viktor RUS 704 TL 704 25.7
6 VOLKANOV Igor UKR DQ DQ 615 615 35.1 22.7
7 LVOVYCH Valeriy UKR 308 584 DQ 584 38.4
8 KOLAR Zdenek TCH 571 NC 571 39.8
9 ROURA J. SPAIN 506 TL 449 506 46.6
10 MISSE M. SPAIN 473 NC 475 475 49.9 32.0

164
4th EuSMC-1993 Romania, Suceava
Place Competitor Country
Best
Flight
Δ margin from
1st pl, %
Aver margin
from 1st, %
1 MITIURIEV Alexander RUS 1178 0.0
2 HAPON Juri UKR 966 18.0 18.0
3 VOLKANOV Igor UKR 829 29.6 23.8
4 ZYCH Robert TCH 823 30.1
5 LVOVYCH Valeriy UKR 812 31.1
6 ZARAKAUSKIS Vilnis LAT 784 33.4 28.5
7 KORIAPIN Alexey RUS 768 34.8

165
10th WSMC-1994 Poland, Leszno
Place Competitor Country
Round
1
Round
2
Round
3
Best
Flight
Δ margin from
1st pl, %
Aver margin
from 1st, %
1 KORIAPIN Alexey RUS 242 624 0 624 0.0
2 JIAN Li CHN 0 0 597 597 4.3 4.3
3 CUDEN Marjan SLO 377 354 577 577 7.5 5.9
4 SZUMSKY Boleslaw POL 365 0 573 573 8.2
5 OPOCZKA Antoni POL 552 269 0 552 11.5
6 FRIEDEL Ingo GER 0 528 0 528 15.4 9.4
7 VOLKANOV Igor UKR 524 0 0 524 16.0
8 BEDRICH Pavka CZE 396 389 518 518 17.0
9 LVOVYCH Valeriy UKR 0 0 492 492 21.2
10 MIANGUI Cheng CHN 0 416 481 481 22.9 13.8
166
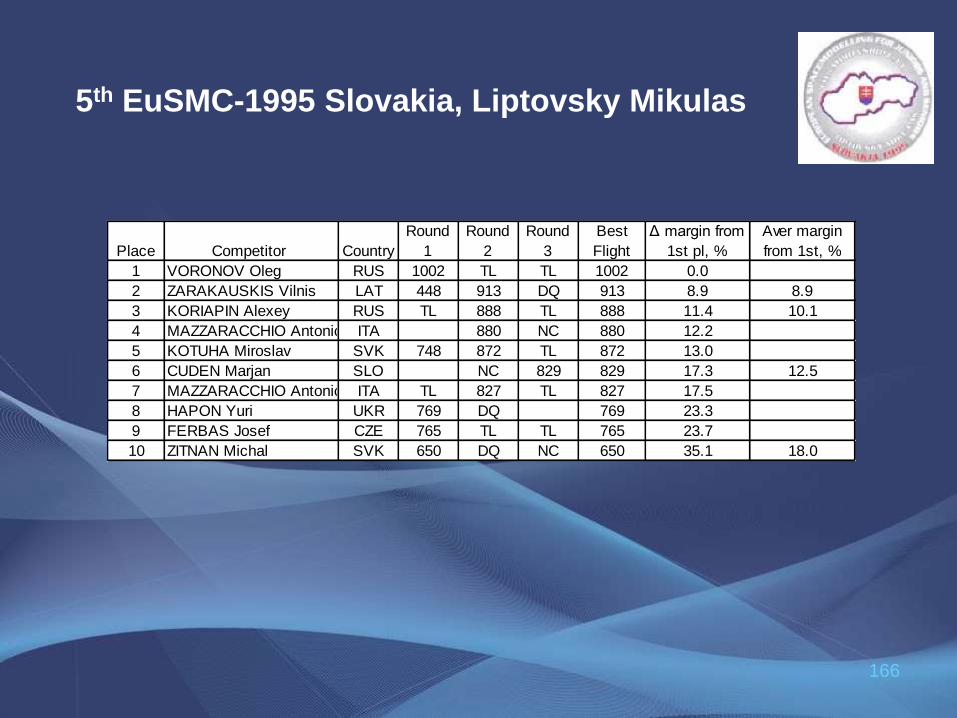
5th EuSMC-1995 Slovakia, Liptovsky Mikulas
Place Competitor Country
Round
1
Round
2
Round
3
Best
Flight
Δ margin from
1st pl, %
Aver margin
from 1st, %
1 VORONOV Oleg RUS 1002 TL TL 1002 0.0
2 ZARAKAUSKIS Vilnis LAT 448 913 DQ 913 8.9 8.9
3 KORIAPIN Alexey RUS TL 888 TL 888 11.4 10.1
4 MAZZARACCHIO Antonio ITA 880 NC 880 12.2
5 KOTUHA Miroslav SVK 748 872 TL 872 13.0
6 CUDEN Marjan SLO NC 829 829 17.3 12.5
7 MAZZARACCHIO Antonio ITA TL 827 TL 827 17.5
8 HAPON Yuri UKR 769 DQ 769 23.3
9 FERBAS Josef CZE 765 TL TL 765 23.7
10 ZITNAN Michal SVK 650 DQ NC 650 35.1 18.0
167
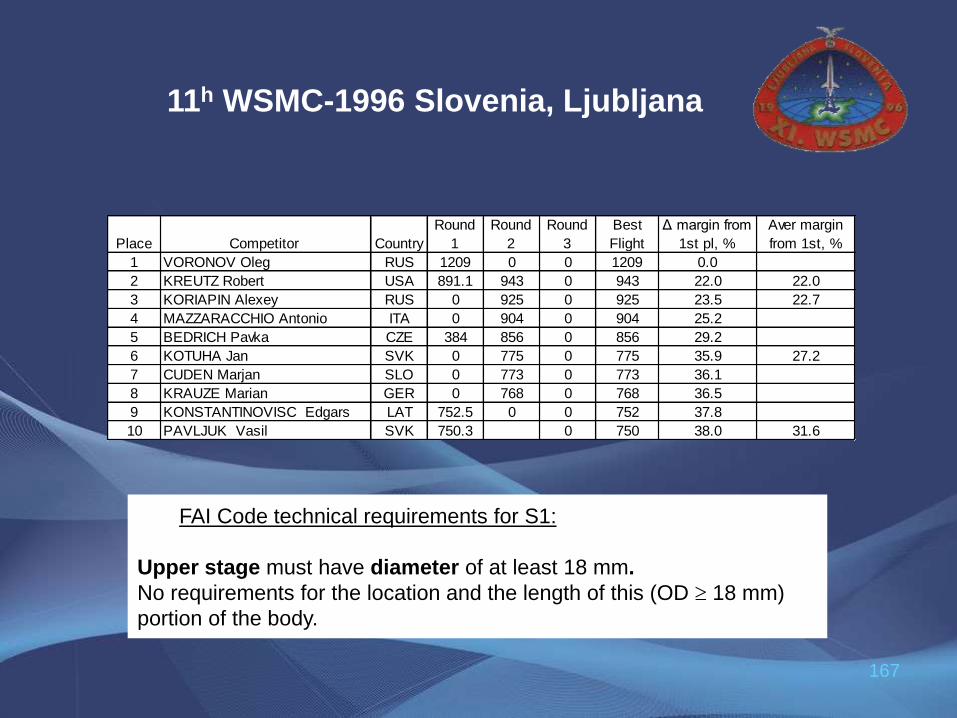
11h WSMC-1996 Slovenia, Ljubljana
Place Competitor Country
Round
1
Round
2
Round
3
Best
Flight
Δ margin from
1st pl, %
Aver margin
from 1st, %
1 VORONOV Oleg RUS 1209 0 0 1209 0.0
2 KREUTZ Robert USA 891.1 943 0 943 22.0 22.0
3 KORIAPIN Alexey RUS 0 925 0 925 23.5 22.7
4 MAZZARACCHIO Antonio ITA 0 904 0 904 25.2
5 BEDRICH Pavka CZE 384 856 0 856 29.2
6 KOTUHA Jan SVK 0 775 0 775 35.9 27.2
7 CUDEN Marjan SLO 0 773 0 773 36.1
8 KRAUZE Marian GER 0 768 0 768 36.5
9 KONSTANTINOVISC Edgars LAT 752.5 0 0 752 37.8
10 PAVLJUK Vasil SVK 750.3 0 750 38.0 31.6
FAI Code technical requirements for S1:
Upper stage must have diameter of at least 18 mm.
No requirements for the location and the length of this (OD 18 mm)
portion of the body.
168
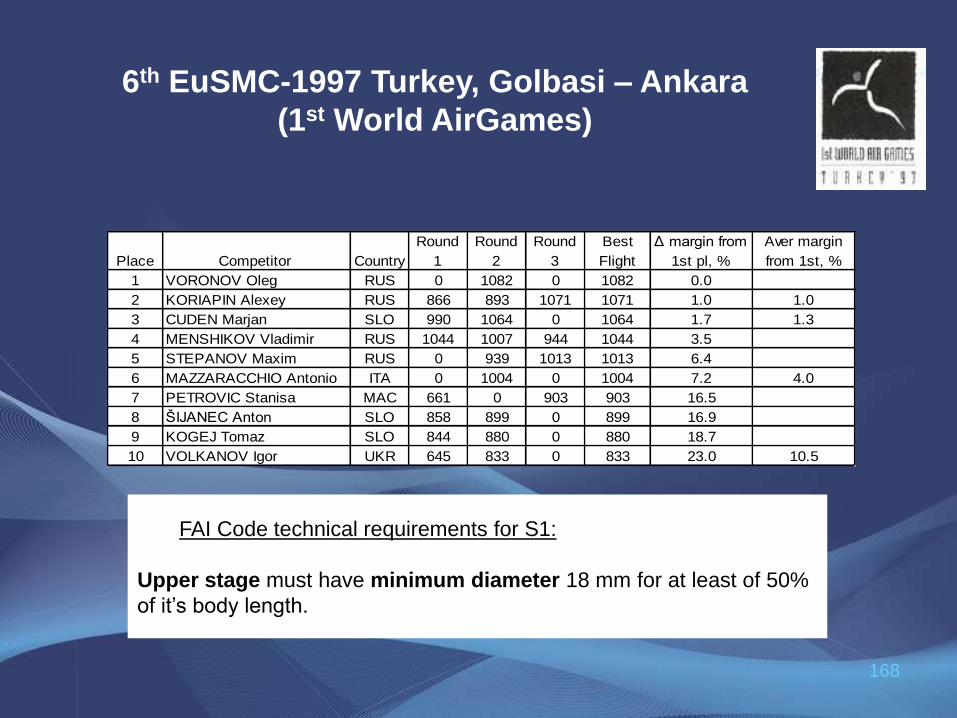
6th EuSMC-1997 Turkey, Golbasi – Ankara
(1st World AirGames)
Place Competitor Country
Round
1
Round
2
Round
3
Best
Flight
Δ margin from
1st pl, %
Aver margin
from 1st, %
1 VORONOV Oleg RUS 0 1082 0 1082 0.0
2 KORIAPIN Alexey RUS 866 893 1071 1071 1.0 1.0
3 CUDEN Marjan SLO 990 1064 0 1064 1.7 1.3
4 MENSHIKOV Vladimir RUS 1044 1007 944 1044 3.5
5 STEPANOV Maxim RUS 0 939 1013 1013 6.4
6 MAZZARACCHIO Antonio ITA 0 1004 0 1004 7.2 4.0
7 PETROVIC Stanisa MAC 661 0 903 903 16.5
8 ŠIJANEC Anton SLO 858 899 0 899 16.9
9 KOGEJ Tomaz SLO 844 880 0 880 18.7
10 VOLKANOV Igor UKR 645 833 0 833 23.0 10.5
FAI Code technical requirements for S1:
Upper stage must have minimum diameter 18 mm for at least of 50%
of it’s body length.
169
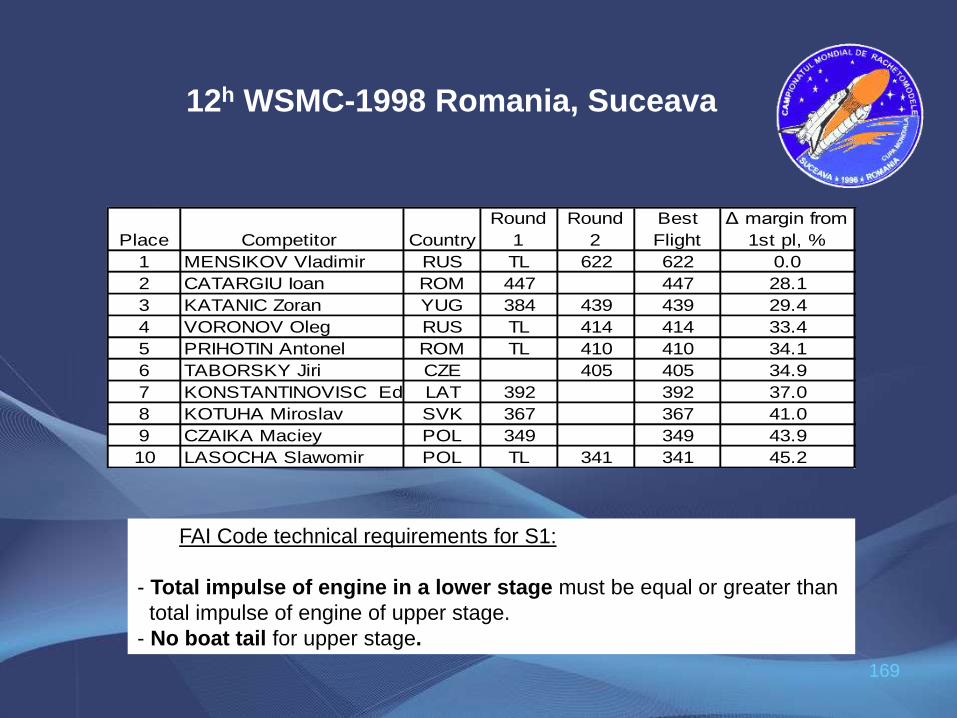
FAI Code technical requirements for S1:
- Total impulse of engine in a lower stage must be equal or greater than
total impulse of engine of upper stage.
- No boat tail for upper stage.
12h WSMC-1998 Romania, Suceava
Place Competitor Country
Round
1
Round
2
Best
Flight
Δ margin from
1st pl, %
1 MENSIKOV Vladimir RUS TL 622 622 0.0
2 CATARGIU Ioan ROM 447 447 28.1
3 KATANIC Zoran YUG 384 439 439 29.4
4 VORONOV Oleg RUS TL 414 414 33.4
5 PRIHOTIN Antonel ROM TL 410 410 34.1
6 TABORSKY Jiri CZE 405 405 34.9
7 KONSTANTINOVISC EdgarasLAT 392 392 37.0
8 KOTUHA Miroslav SVK 367 367 41.0
9 CZAIKA Maciey POL 349 349 43.9
10 LASOCHA Slawomir POL TL 341 341 45.2
170
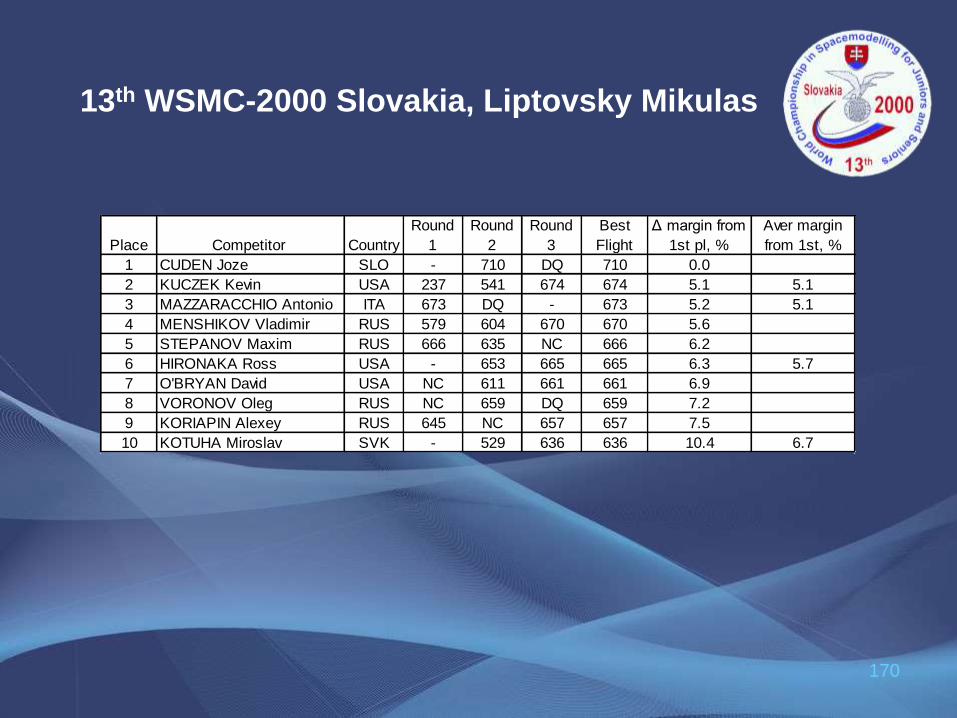
13th WSMC-2000 Slovakia, Liptovsky Mikulas
Place Competitor Country
Round
1
Round
2
Round
3
Best
Flight
Δ margin from
1st pl, %
Aver margin
from 1st, %
1 CUDEN Joze SLO - 710 DQ 710 0.0
2 KUCZEK Kevin USA 237 541 674 674 5.1 5.1
3 MAZZARACCHIO Antonio ITA 673 DQ - 673 5.2 5.1
4 MENSHIKOV Vladimir RUS 579 604 670 670 5.6
5 STEPANOV Maxim RUS 666 635 NC 666 6.2
6 HIRONAKA Ross USA - 653 665 665 6.3 5.7
7 O'BRYAN David USA NC 611 661 661 6.9
8 VORONOV Oleg RUS NC 659 DQ 659 7.2
9 KORIAPIN Alexey RUS 645 NC 657 657 7.5
10 KOTUHA Miroslav SVK - 529 636 636 10.4 6.7
171
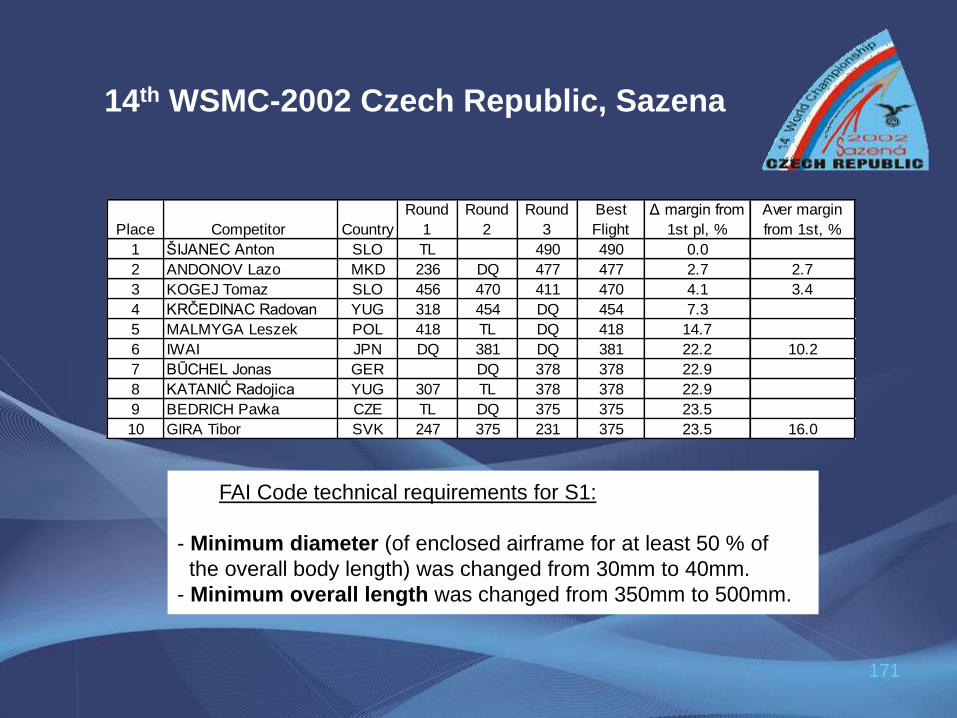
FAI Code technical requirements for S1:
- Minimum diameter (of enclosed airframe for at least 50 % of
the overall body length) was changed from 30mm to 40mm.
- Minimum overall length was changed from 350mm to 500mm.
14th WSMC-2002 Czech Republic, Sazena
Place Competitor Country
Round
1
Round
2
Round
3
Best
Flight
Δ margin from
1st pl, %
Aver margin
from 1st, %
1 ŠIJANEC Anton SLO TL 490 490 0.0
2 ANDONOV Lazo MKD 236 DQ 477 477 2.7 2.7
3 KOGEJ Tomaz SLO 456 470 411 470 4.1 3.4
4 KRČEDINAC Radovan YUG 318 454 DQ 454 7.3
5 MALMYGA Leszek POL 418 TL DQ 418 14.7
6 IWAI JPN DQ 381 DQ 381 22.2 10.2
7 BŨCHEL Jonas GER DQ 378 378 22.9
8 KATANIĆ Radojica YUG 307 TL 378 378 22.9
9 BEDRICH Pavka CZE TL DQ 375 375 23.5
10 GIRA Tibor SVK 247 375 231 375 23.5 16.0
172
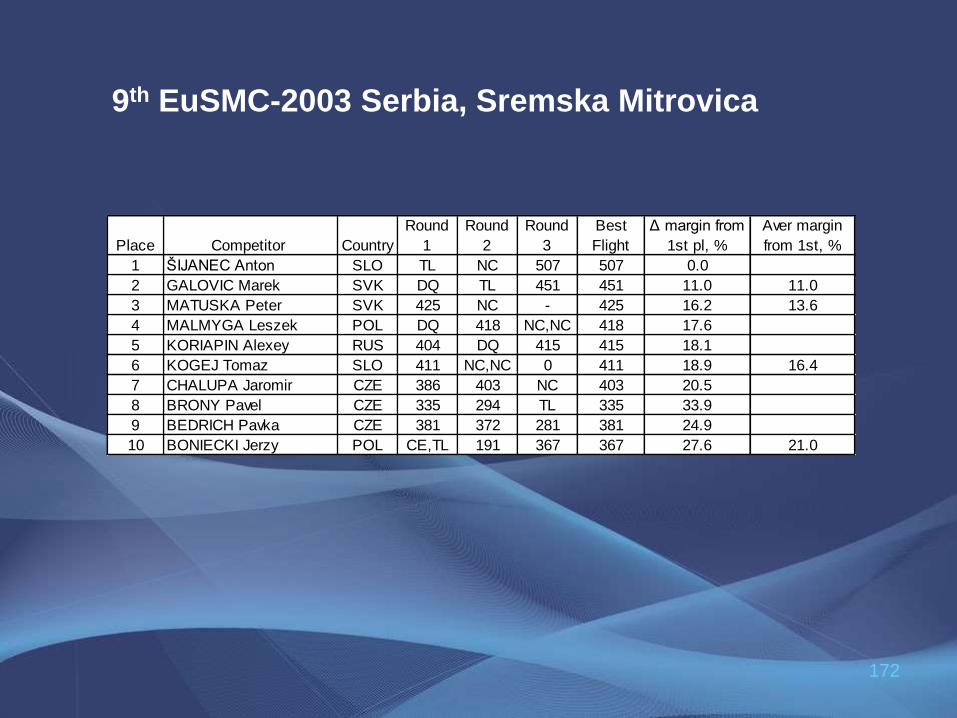
9th EuSMC-2003 Serbia, Sremska Mitrovica
Place Competitor Country
Round
1
Round
2
Round
3
Best
Flight
Δ margin from
1st pl, %
Aver margin
from 1st, %
1 ŠIJANEC Anton SLO TL NC 507 507 0.0
2 GALOVIC Marek SVK DQ TL 451 451 11.0 11.0
3 MATUSKA Peter SVK 425 NC - 425 16.2 13.6
4 MALMYGA Leszek POL DQ 418 NC,NC 418 17.6
5 KORIAPIN Alexey RUS 404 DQ 415 415 18.1
6 KOGEJ Tomaz SLO 411 NC,NC 0 411 18.9 16.4
7 CHALUPA Jaromir CZE 386 403 NC 403 20.5
8 BRONY Pavel CZE 335 294 TL 335 33.9
9 BEDRICH Pavka CZE 381 372 281 381 24.9
10 BONIECKI Jerzy POL CE,TL 191 367 367 27.6 21.0
173
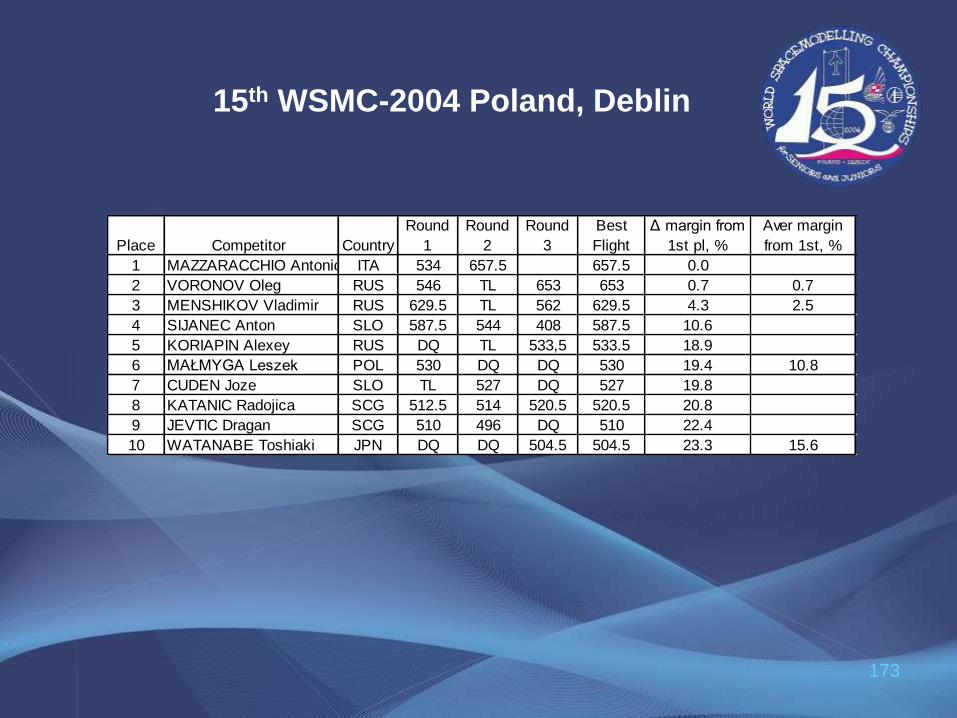
15th WSMC-2004 Poland, Deblin
Place Competitor Country
Round
1
Round
2
Round
3
Best
Flight
Δ margin from
1st pl, %
Aver margin
from 1st, %
1 MAZZARACCHIO Antonio ITA 534 657.5 657.5 0.0
2 VORONOV Oleg RUS 546 TL 653 653 0.7 0.7
3 MENSHIKOV Vladimir RUS 629.5 TL 562 629.5 4.3 2.5
4 SIJANEC Anton SLO 587.5 544 408 587.5 10.6
5 KORIAPIN Alexey RUS DQ TL 533,5 533.5 18.9
6 MAŁMYGA Leszek POL 530 DQ DQ 530 19.4 10.8
7 CUDEN Joze SLO TL 527 DQ 527 19.8
8 KATANIC Radojica SCG 512.5 514 520.5 520.5 20.8
9 JEVTIC Dragan SCG 510 496 DQ 510 22.4
10 WATANABE Toshiaki JPN DQ DQ 504.5 504.5 23.3 15.6
174
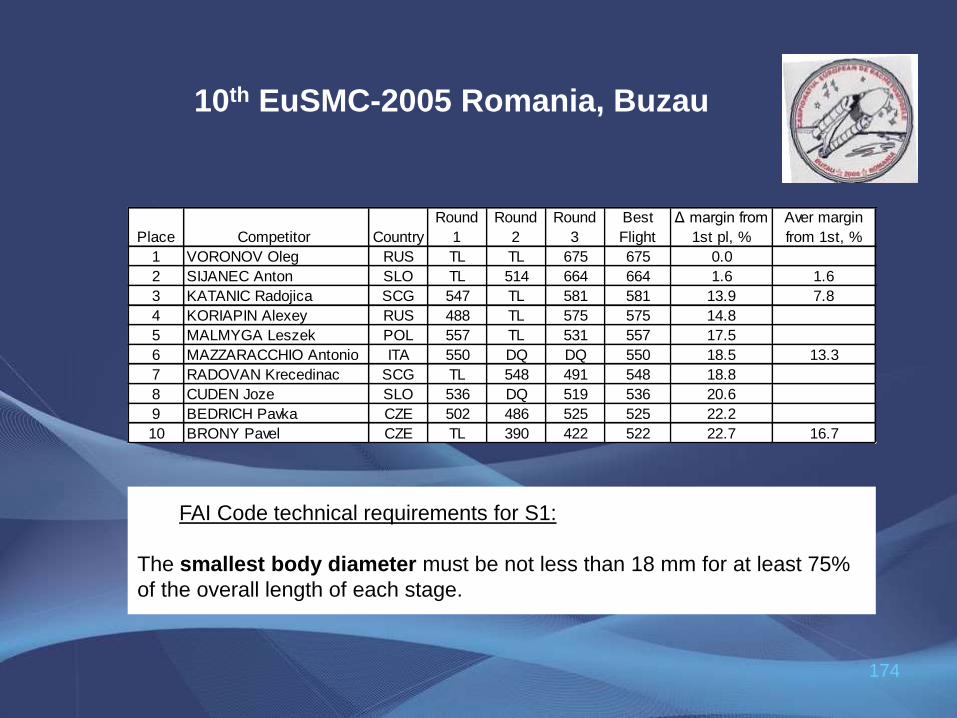
10th EuSMC-2005 Romania, Buzau
Place Competitor Country
Round
1
Round
2
Round
3
Best
Flight
Δ margin from
1st pl, %
Aver margin
from 1st, %
1 VORONOV Oleg RUS TL TL 675 675 0.0
2 SIJANEC Anton SLO TL 514 664 664 1.6 1.6
3 KATANIC Radojica SCG 547 TL 581 581 13.9 7.8
4 KORIAPIN Alexey RUS 488 TL 575 575 14.8
5 MALMYGA Leszek POL 557 TL 531 557 17.5
6 MAZZARACCHIO Antonio ITA 550 DQ DQ 550 18.5 13.3
7 RADOVAN Krecedinac SCG TL 548 491 548 18.8
8 CUDEN Joze SLO 536 DQ 519 536 20.6
9 BEDRICH Pavka CZE 502 486 525 525 22.2
10 BRONY Pavel CZE TL 390 422 522 22.7 16.7
FAI Code technical requirements for S1:
The smallest body diameter must be not less than 18 mm for at least 75%
of the overall length of each stage.
175
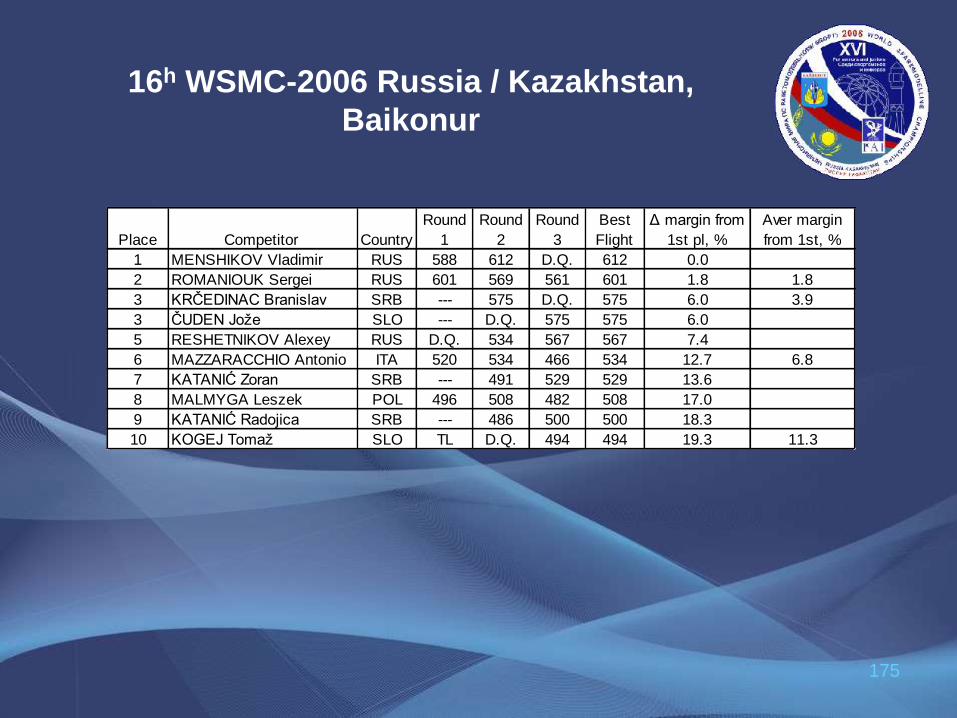
16h WSMC-2006 Russia / Kazakhstan,
Baikonur
Place Competitor Country
Round
1
Round
2
Round
3
Best
Flight
Δ margin from
1st pl, %
Aver margin
from 1st, %
1 MENSHIKOV Vladimir RUS 588 612 D.Q. 612 0.0
2 ROMANIOUK Sergei RUS 601 569 561 601 1.8 1.8
3 KRČEDINAC Branislav SRB --- 575 D.Q. 575 6.0 3.9
3 ČUDEN Jože SLO --- D.Q. 575 575 6.0
5 RESHETNIKOV Alexey RUS D.Q. 534 567 567 7.4
6 MAZZARACCHIO Antonio ITA 520 534 466 534 12.7 6.8
7 KATANIĆ Zoran SRB --- 491 529 529 13.6
8 MALMYGA Leszek POL 496 508 482 508 17.0
9 KATANIĆ Radojica SRB --- 486 500 500 18.3
10 KOGEJ Tomaž SLO TL D.Q. 494 494 19.3 11.3
176
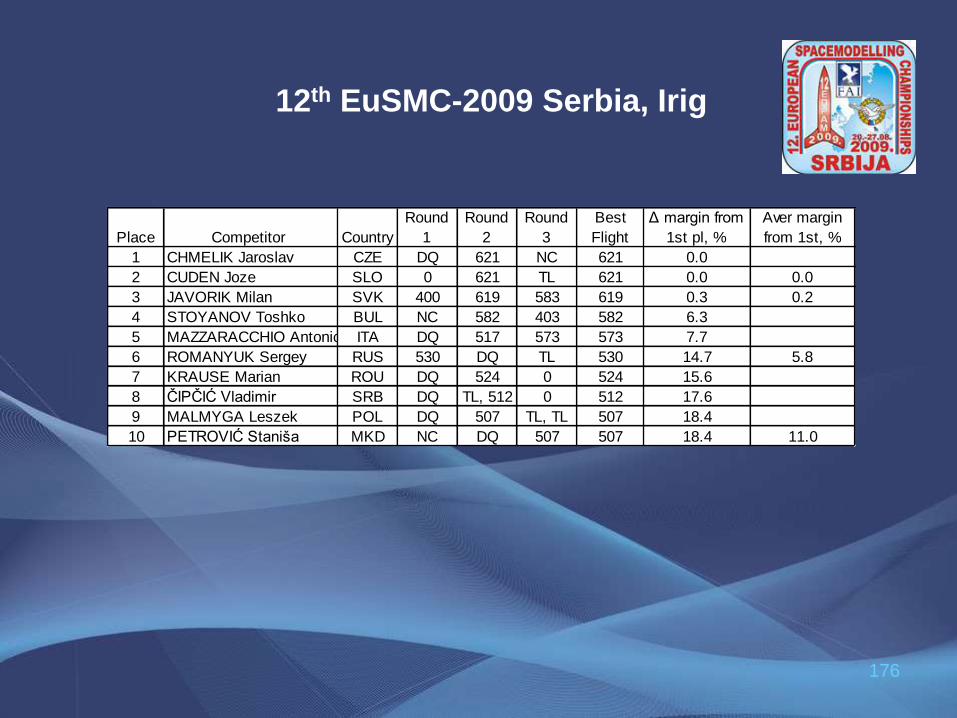
12th EuSMC-2009 Serbia, Irig
Place Competitor Country
Round
1
Round
2
Round
3
Best
Flight
Δ margin from
1st pl, %
Aver margin
from 1st, %
1 CHMELIK Jaroslav CZE DQ 621 NC 621 0.0
2 CUDEN Joze SLO 0 621 TL 621 0.0 0.0
3 JAVORIK Milan SVK 400 619 583 619 0.3 0.2
4 STOYANOV Toshko BUL NC 582 403 582 6.3
5 MAZZARACCHIO Antonio ITA DQ 517 573 573 7.7
6 ROMANYUK Sergey RUS 530 DQ TL 530 14.7 5.8
7 KRAUSE Marian ROU DQ 524 0 524 15.6
8 ČIPČIĆ Vladimir SRB DQ TL, 512 0 512 17.6
9 MALMYGA Leszek POL DQ 507 TL, TL 507 18.4
10 PETROVIĆ Staniša MKD NC DQ 507 507 18.4 11.0

177
18h WSMC-2010 Serbia, Irig
Place Competitor Country
Round
1
Round
2
Round
3
Best
Flight
Δ margin from
1st pl, %
Aver margin
from 1st, %
1 ČUDEN Jože SLO 698 0 698 0.0
2 ČUDEN Miha SLO 663 0 663 5.0 5.0
3 KRASNOV Pavel RUS 540 632 657 657 5.9 5.4
4 ROMANYUK Sergey RUS 649 641 649 7.0
5 RESHETNIKOV Alexey RUS 581 644 0 644 7.7
6 MAZZARACCHIO Antonio ITA 604 638 640 640 8.3 6.8
7 MENSHIKOV Vladimir RUS 635 0 635 9.0
8 ŠIJANEC Anton SLO 622 0 606 622 10.9
9 KRČEDINAC Mladen SRB 536 587 587 15.9
10 KATANIĆ Zoran SRB 574 574 17.8 9.7
178
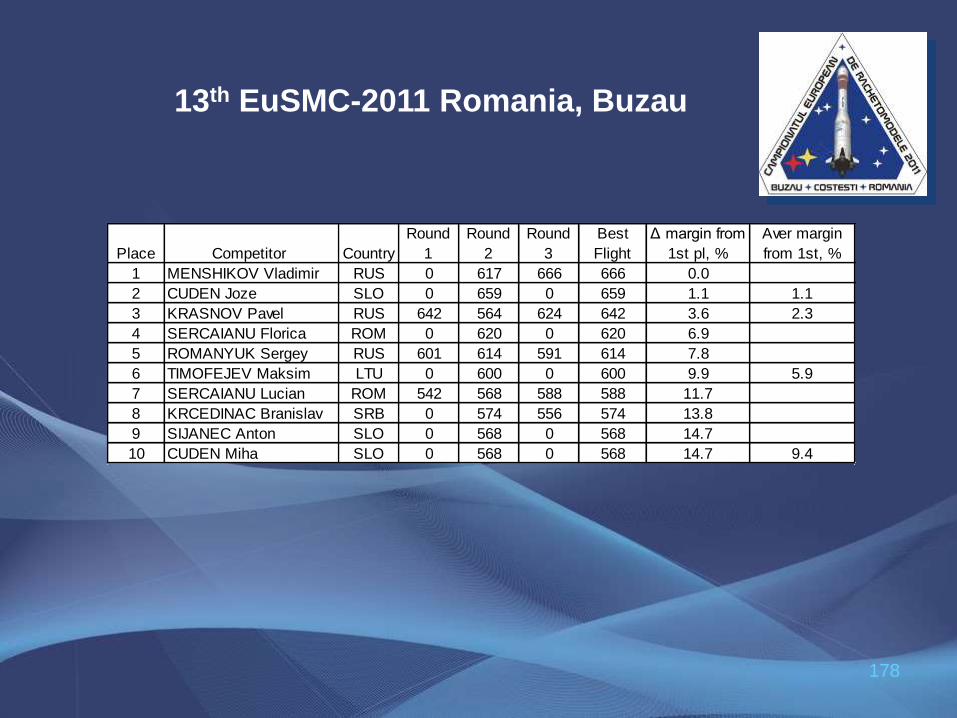
13th EuSMC-2011 Romania, Buzau
Place Competitor Country
Round
1
Round
2
Round
3
Best
Flight
Δ margin from
1st pl, %
Aver margin
from 1st, %
1 MENSHIKOV Vladimir RUS 0 617 666 666 0.0
2 CUDEN Joze SLO 0 659 0 659 1.1 1.1
3 KRASNOV Pavel RUS 642 564 624 642 3.6 2.3
4 SERCAIANU Florica ROM 0 620 0 620 6.9
5 ROMANYUK Sergey RUS 601 614 591 614 7.8
6 TIMOFEJEV Maksim LTU 0 600 0 600 9.9 5.9
7 SERCAIANU Lucian ROM 542 568 588 588 11.7
8 KRCEDINAC Branislav SRB 0 574 556 574 13.8
9 SIJANEC Anton SLO 0 568 0 568 14.7
10 CUDEN Miha SLO 0 568 0 568 14.7 9.4
179
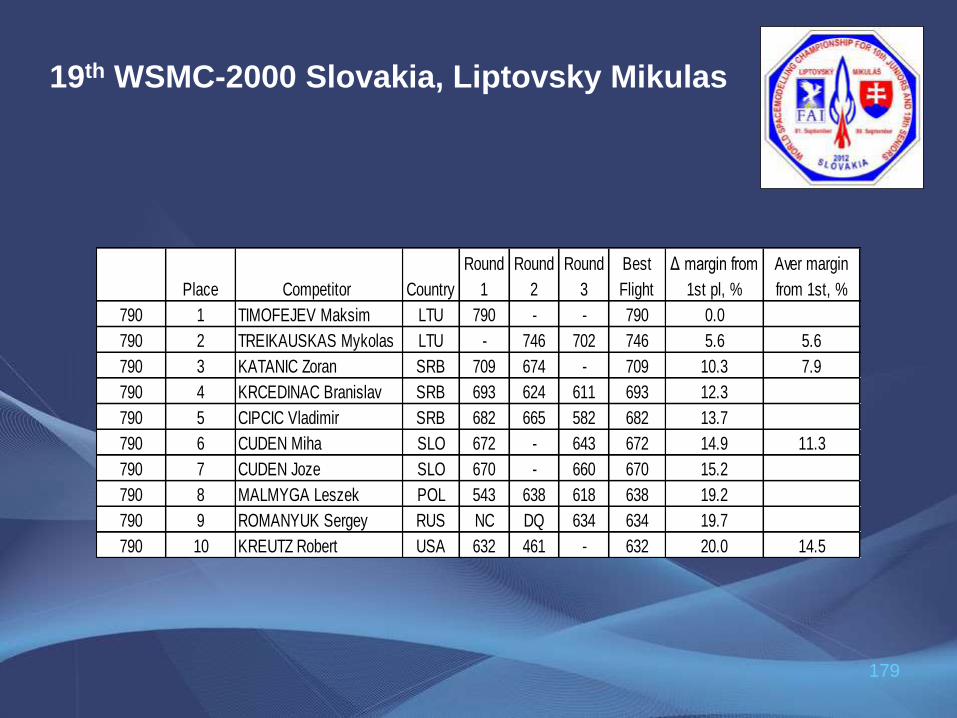
19th WSMC-2000 Slovakia, Liptovsky Mikulas
Place Competitor Country
Round
1
Round
2
Round
3
Best
Flight
Δ margin from
1st pl, %
Aver margin
from 1st, %
790 1 TIMOFEJEV Maksim LTU 790 - - 790 0.0
790 2 TREIKAUSKAS Mykolas LTU - 746 702 746 5.6 5.6
790 3 KATANIC Zoran SRB 709 674 - 709 10.3 7.9
790 4 KRCEDINAC Branislav SRB 693 624 611 693 12.3
790 5 CIPCIC Vladimir SRB 682 665 582 682 13.7
790 6 CUDEN Miha SLO 672 - 643 672 14.9 11.3
790 7 CUDEN Joze SLO 670 - 660 670 15.2
790 8 MALMYGA Leszek POL 543 638 618 638 19.2
790 9 ROMANYUK Sergey RUS NC DQ 634 634 19.7
790 10 KREUTZ Robert USA 632 461 - 632 20.0 14.5

180
10. Key success factors of the past World
Championships title-holders

181
Key winning factors:
Podium S1A (L-R):
ILYIN Sergei (USSR) – 2nd
KORIAPIN Alexey (USSR) – 1st
BARBER Trip (USA) – 3rd
1. Very good engines (Anatoly Sparish design & manufacturing):
2. Intelligent model design
3. Preparedness for competition; readiness during models preparation
for flights – was able to launch all 3 tractable flights.
BP; total Impulse - just under “red line” - I = 4.85 - 4.9 N sec;
with great for BP value of Isp 950 N sec / kg
10.1. WSMC-1985. Gold medal - KORIAPIN Alexey (USSR)
182
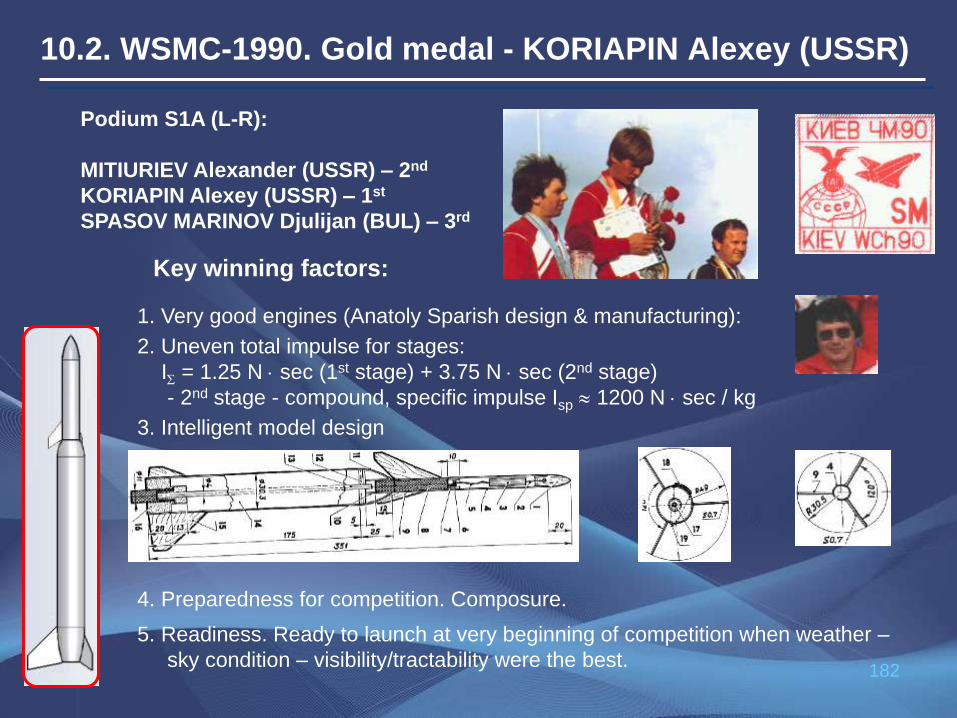
Key winning factors:
Podium S1A (L-R):
MITIURIEV Alexander (USSR) – 2nd
KORIAPIN Alexey (USSR) – 1st
SPASOV MARINOV Djulijan (BUL) – 3rd
1. Very good engines (Anatoly Sparish design & manufacturing):
3. Intelligent model design
5. Readiness. Ready to launch at very beginning of competition when weather –
sky condition – visibility/tractability were the best.
4. Preparedness for competition. Composure.
2. Uneven total impulse for stages:
I = 1.25 N sec (1st stage) + 3.75 N sec (2nd stage)
- 2nd stage - compound, specific impulse Isp 1200 N sec / kg
10.2. WSMC-1990. Gold medal - KORIAPIN Alexey (USSR)
183
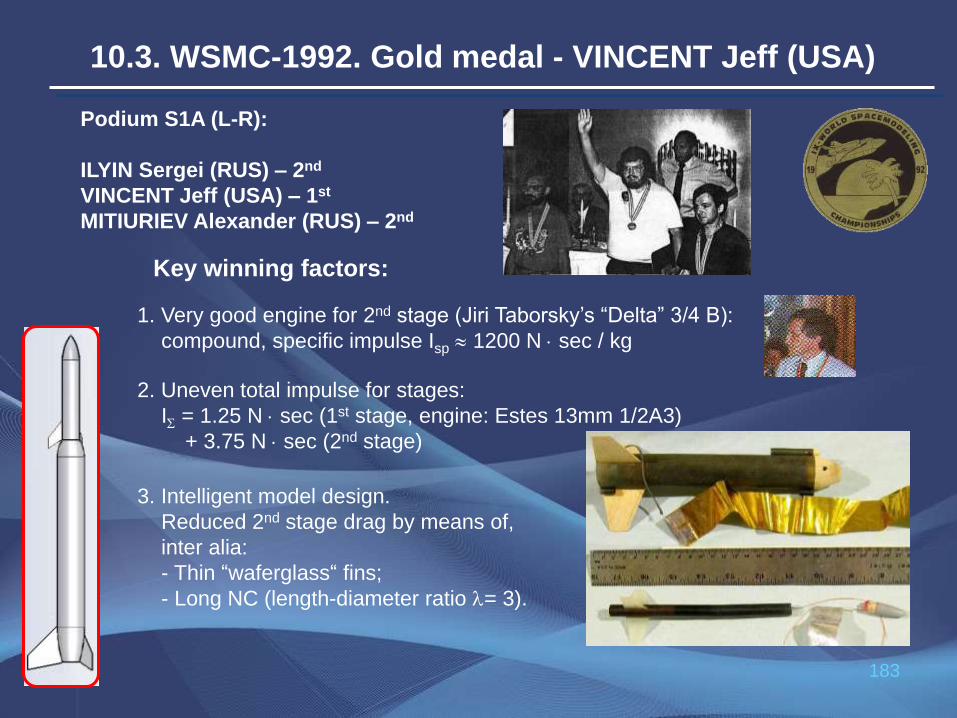
Key winning factors:
Podium S1A (L-R):
ILYIN Sergei (RUS) – 2nd
VINCENT Jeff (USA) – 1st
MITIURIEV Alexander (RUS) – 2nd
1. Very good engine for 2nd stage (Jiri Taborsky’s “Delta” 3/4 B):
compound, specific impulse Isp 1200 N sec / kg
2. Uneven total impulse for stages:
I = 1.25 N sec (1st stage, engine: Estes 13mm 1/2A3)
+ 3.75 N sec (2nd stage)
3. Intelligent model design.
Reduced 2nd stage drag by means of,
inter alia:
- Thin “waferglass“ fins;
- Long NC (length-diameter ratio = 3).
10.3. WSMC-1992. Gold medal - VINCENT Jeff (USA)
184
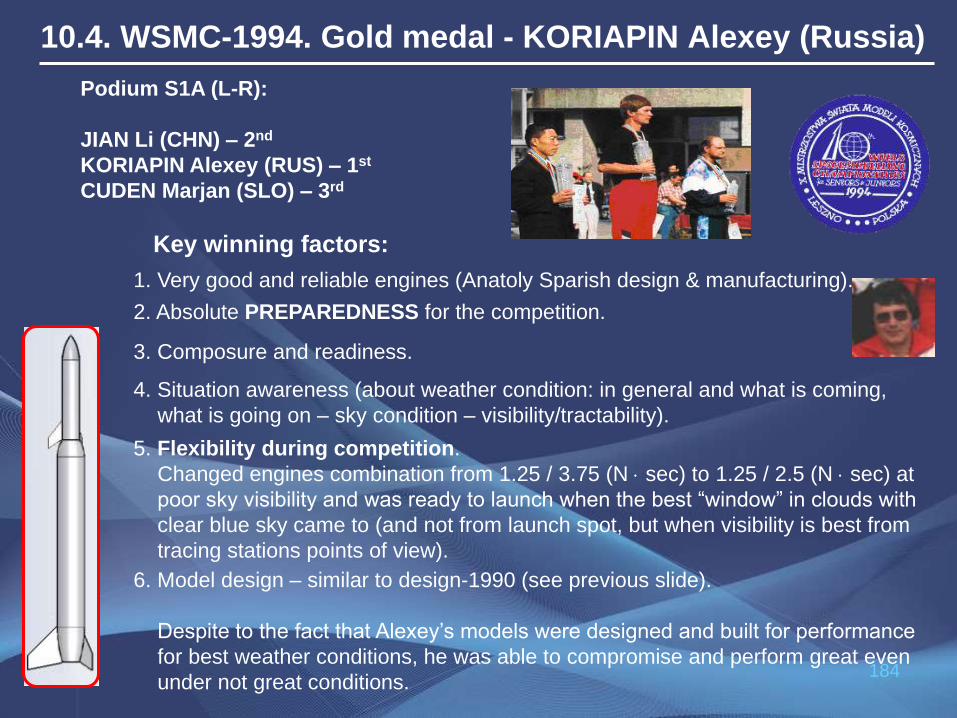
Key winning factors:
Podium S1A (L-R):
JIAN Li (CHN) – 2nd
KORIAPIN Alexey (RUS) – 1st
CUDEN Marjan (SLO) – 3rd
2. Absolute PREPAREDNESS for the competition.
3. Composure and readiness.
4. Situation awareness (about weather condition: in general and what is coming,
what is going on – sky condition – visibility/tractability).
5. Flexibility during competition.
Changed engines combination from 1.25 / 3.75 (N sec) to 1.25 / 2.5 (N sec) at
poor sky visibility and was ready to launch when the best “window” in clouds with
clear blue sky came to (and not from launch spot, but when visibility is best from
tracing stations points of view).
6. Model design – similar to design-1990 (see previous slide).
Despite to the fact that Alexey’s models were designed and built for performance
for best weather conditions, he was able to compromise and perform great even
under not great conditions.
1. Very good and reliable engines (Anatoly Sparish design & manufacturing).
10.4. WSMC-1994. Gold medal - KORIAPIN Alexey (Russia)

185
Key winning factors:
Podium S1A (L-R):
KREUTZ Robert (USA) – 2nd
VORONOV Oleg (RUS) – 1st
KORIAPIN Alexey (RUS) – 3rd
1. Very good engines (Jiri Taborsky’s “Delta”):
Uneven total impulse for stages: I = 0.6 N sec (1st stage) + 4.4 N sec (2nd stage)
1st and 2nd stage – “compound”, specific Impulse Isp 1200 N sec / kg. 2. Very intelligent model design.
Reduced 2nd stage drag by means of, inter alia:
- Smooth NC-Body juncture;
- Thin ( = 0.24 mm) carbon fins;
- Fins with rounded leading edge and sharp-pointed trailing edge (wedge width
of 3 mm);
- Body-fins fillet. R fillet 1.2 mm;
- Long NC (length-diameter ratio = 4,
greater than anybody's else).
3. Preparedness for competition. Composure.
V. Menshikov’s S1 model (1996)
Approximate image of O. Voronov’s S1 model:
10.5. WSMC-1996. Gold medal - VORONOV Oleg (Russia)

186
Key winning factors:
1. Very good engines:
J. Taborsky’s “Delta”. 1st and 2nd stage – “compound”,
specific Impulse Isp 1200 N sec / kg.
2. Intelligent model design.
3. Preparedness for competition; composure and readiness during models
preparation.
Podium S1A:
Place Name Nat
1 MENSHIKOV Vladimir RUS
2 CATARGIU Ion ROU
3 KATANIC Zoran YUG
10.6. WSMC-1998. Gold medal - MENSHIKOV Vladimir (Russia)

187
Key winning factors:
S1B 2004 World
Champion model
Podium S1A (L-R):
VORONOV Oleg (RUS) – 2nd
MAZZARACCHIO Antonio (ITA) – 1st
MENSHIKOV Vladimir (RUS) – 3rd
1. High-performance engines (J. Taborsky’s “Delta” A2-0, A1-7),
but no piston launcher.
2. Use of several numerical simulations for optimization.
3. Waiting for a launch window with excellent weather conditions.
10.7. WSMC-2004. Gold medal - MAZZARACCHIO Antonio (Italy)
188
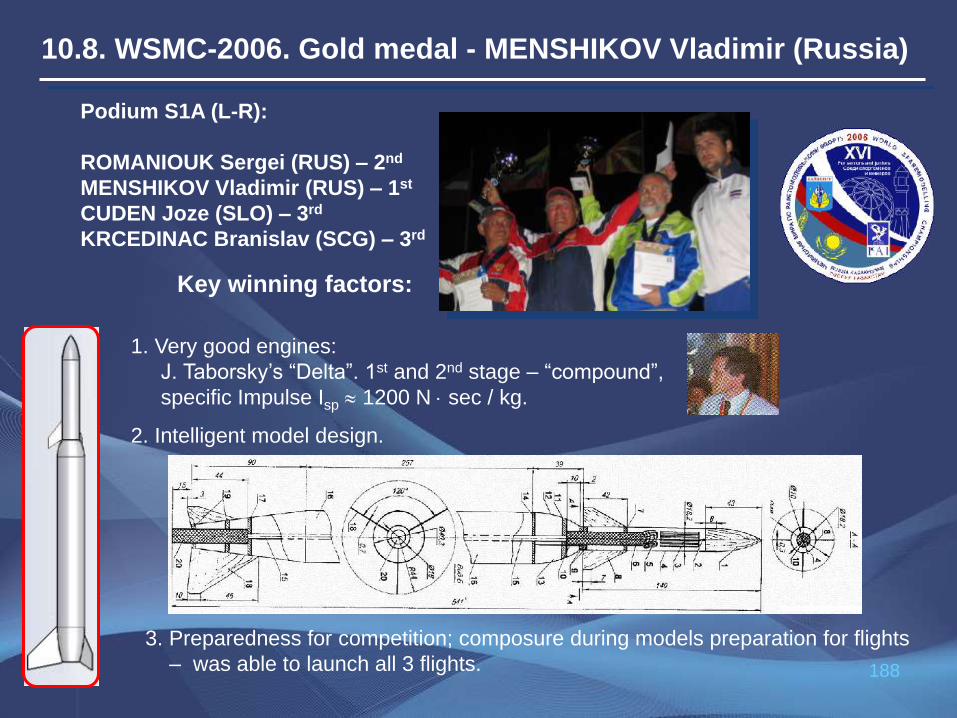
Key winning factors:
Podium S1A (L-R):
ROMANIOUK Sergei (RUS) – 2nd
MENSHIKOV Vladimir (RUS) – 1st
CUDEN Joze (SLO) – 3rd
KRCEDINAC Branislav (SCG) – 3rd
1. Very good engines:
J. Taborsky’s “Delta”. 1st and 2nd stage – “compound”,
specific Impulse Isp 1200 N sec / kg.
2. Intelligent model design.
3. Preparedness for competition; composure during models preparation for flights
– was able to launch all 3 flights.
10.8. WSMC-2006. Gold medal - MENSHIKOV Vladimir (Russia)

189
Key Winning factors: 1. Very good engines “Delta”:
1st and 2nd stage – “compound”, specific Impulse Isp 1200 N sec / kg.
2. Грамотный дизайн модели.
- Smooth NC-Body juncture - use a rear ejection system.
- Very smooth external surface of the 2nd stage body
10.9. WSMC-2010 S1. Gold medal - CUDEN Joze (SLO)
Podium S1A (L-R):
CUDEN Miha (SLO) – 2nd
CUDEN Joze (SLO) – 1st
KRASNOV Pavel (RUS) – 3rd
2nd stage photo
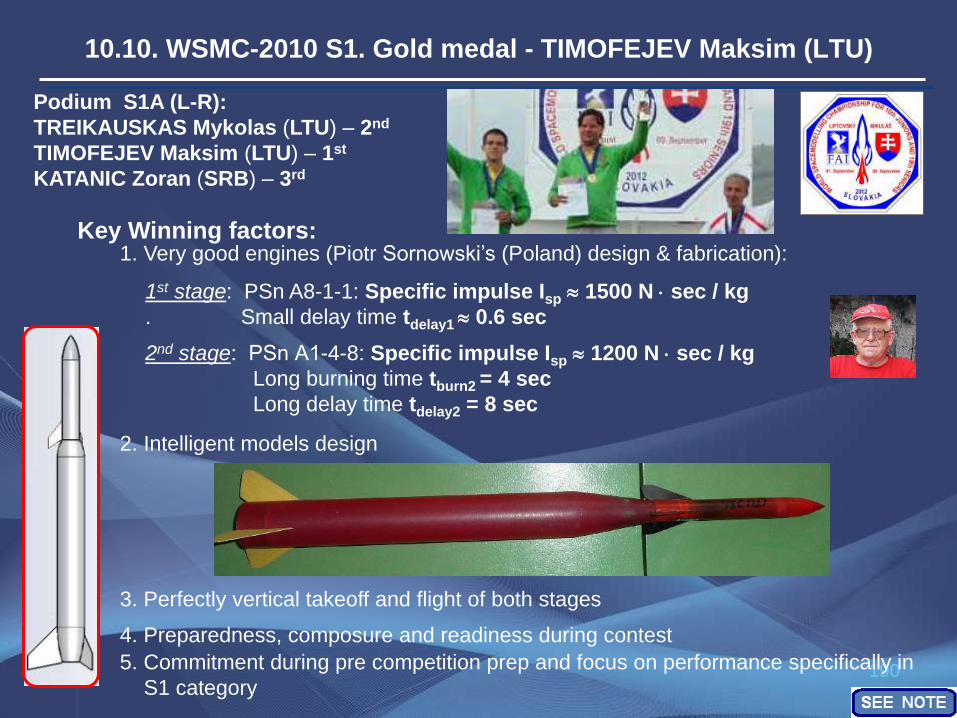
190
Key Winning factors: 1. Very good engines (Piotr Sornowski’s (Poland) design & fabrication):
3. Perfectly vertical takeoff and flight of both stages
5. Commitment during pre competition prep and focus on performance specifically in
S1 category
10.10. WSMC-2010 S1. Gold medal - TIMOFEJEV Maksim (LTU)
Podium S1A (L-R):
TREIKAUSKAS Mykolas (LTU) – 2nd
TIMOFEJEV Maksim (LTU) – 1st
KATANIC Zoran (SRB) – 3rd
1st stage: PSn A8-1-1: Specific impulse Isp 1500 N sec / kg
. Small delay time tdelay1 0.6 sec
2nd stage: PSn А1-4-8: Specific impulse Isp 1200 N sec / kg
Long burning time tburn2 = 4 sec
Long delay time tdelay2 = 8 sec
2. Intelligent models design
4. Preparedness, composure and readiness during contest

191
11. Modelers height vs.
models flight altitudes

192
They are HIGH because they are TALL
SOLDATOV
Yuri
KUZMIN
Victor
MITIURIEV
Alexander
Statistics of Soviet / Russian National teams: 1. European Championship –1981 (Bulgaria).
S1 results:
The most successful in S1 are tall (and even tallest) !
The same
identical models
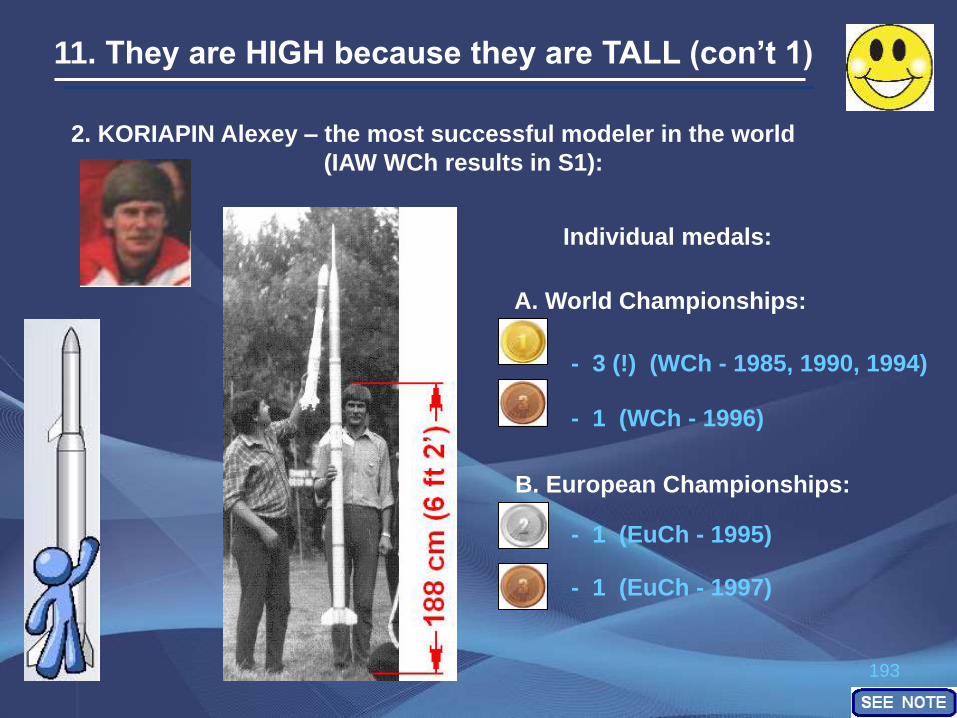
193
11. They are HIGH because they are TALL (con’t 1)
Individual medals: A. World Championships:
2. KORIAPIN Alexey – the most successful modeler in the world
(IAW WCh results in S1):
B. European Championships:
- 3 (!) (WCh - 1985, 1990, 1994)
- 1 (EuCh - 1995)
- 1 (WCh - 1996)
- 1 (EuCh - 1997)
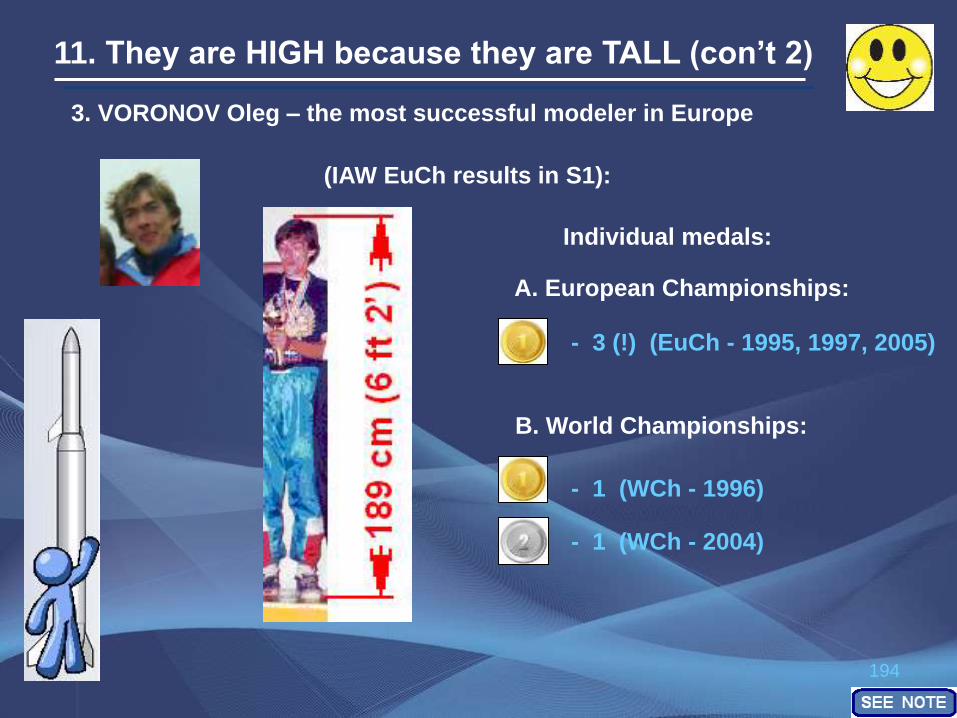
194
3. VORONOV Oleg – the most successful modeler in Europe
(IAW EuCh results in S1):
11. They are HIGH because they are TALL (con’t 2)
Individual medals: A. European Championships:
B. World Championships:
- 3 (!) (EuCh - 1995, 1997, 2005)
- 1 (WCh - 1996)
- 1 (WCh - 2004)

195
12. Conclusion
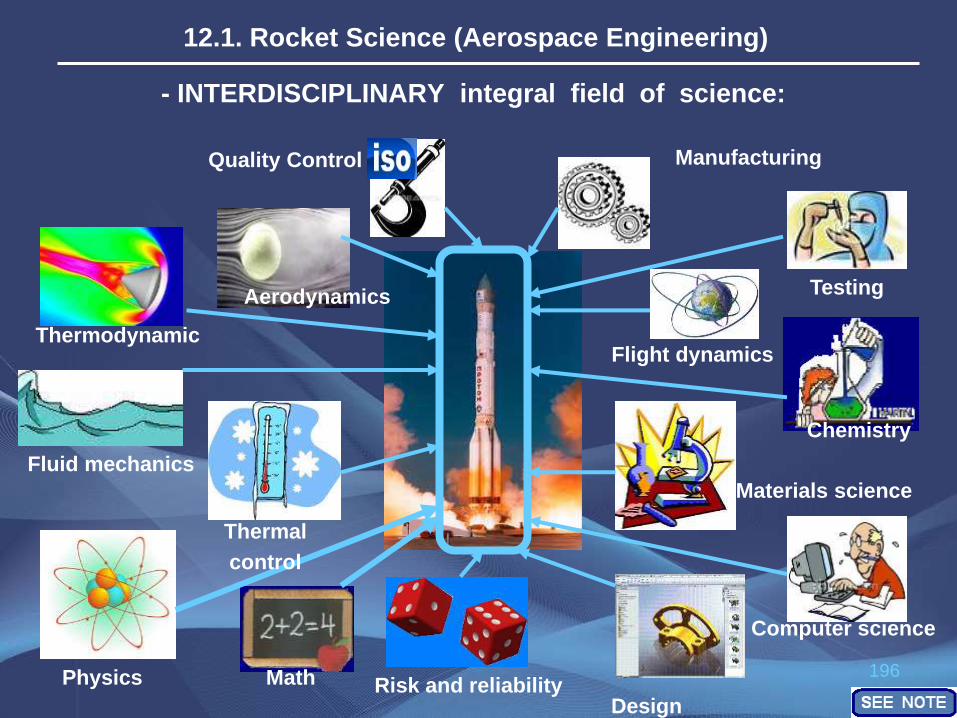
196
12.1. Rocket Science (Aerospace Engineering)
- INTERDISCIPLINARY integral field of science:
Fluid mechanics
Physics
Thermodynamic
Aerodynamics
Materials science
Chemistry
Math Risk and reliability
Computer science
Flight dynamics
Manufacturing
Testing
Design
Quality Control
Thermal
control
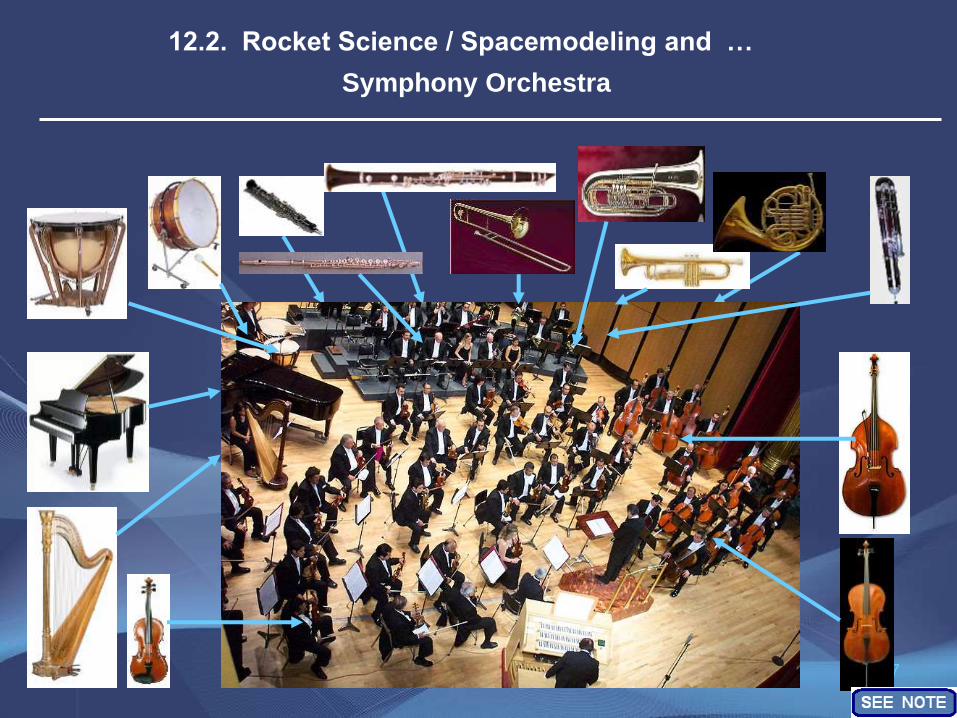
197
12.2. Rocket Science / Spacemodeling and …
Symphony Orchestra
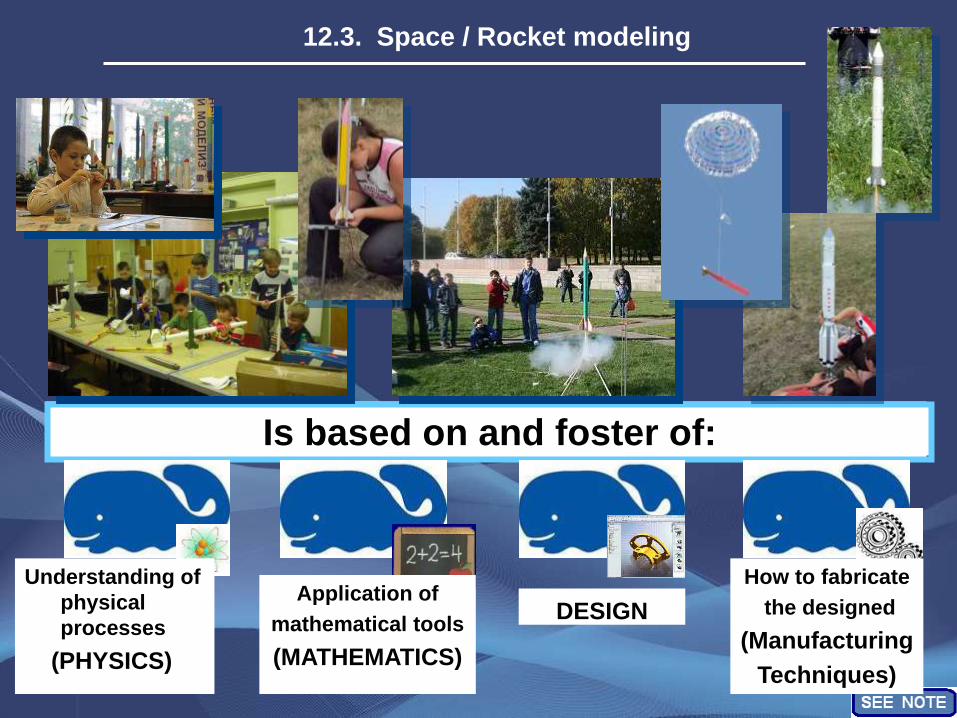
198
12.3. Space / Rocket modeling
Is based on and foster of:
DESIGN
Understanding of
physical
processes
(PHYSICS)
How to fabricate
the designed
(Manufacturing
Techniques)
Application of
mathematical tools
(MATHEMATICS)
199
- Result margins between 1st and 2nd places have been shrinked.
In these circumstances every, even small improvement can be decisive for a final
result.
But what if you can apply everything (and plus) I said above? … It is up to you!
- During last 6 years (last 5 championships) results of the 5 top contenders were
within 15% of the leader’s results.
12.4. Tabulated results of the World and European championships in
S1 during the last 28 years. Margin from 1st place
- Result margins between 1st place and average results of the top 10 contenders
have been shrinked also.
Margin from 1st place, %
0
5
10
15
20
25
30
35
40
1985 1990 1995 2000 2005 2010 2015
Year (World / European Championship)
Δ, %
Δ margin between 1-2 pl,
%
Aver margin 2-6 pl, %
Aver margin 2-10 pl, %
Linear (Δ margin
between 1-2 pl, %)
Linear (Aver margin 2-6
pl, %)
Linear (Aver margin 2-10
pl, %)
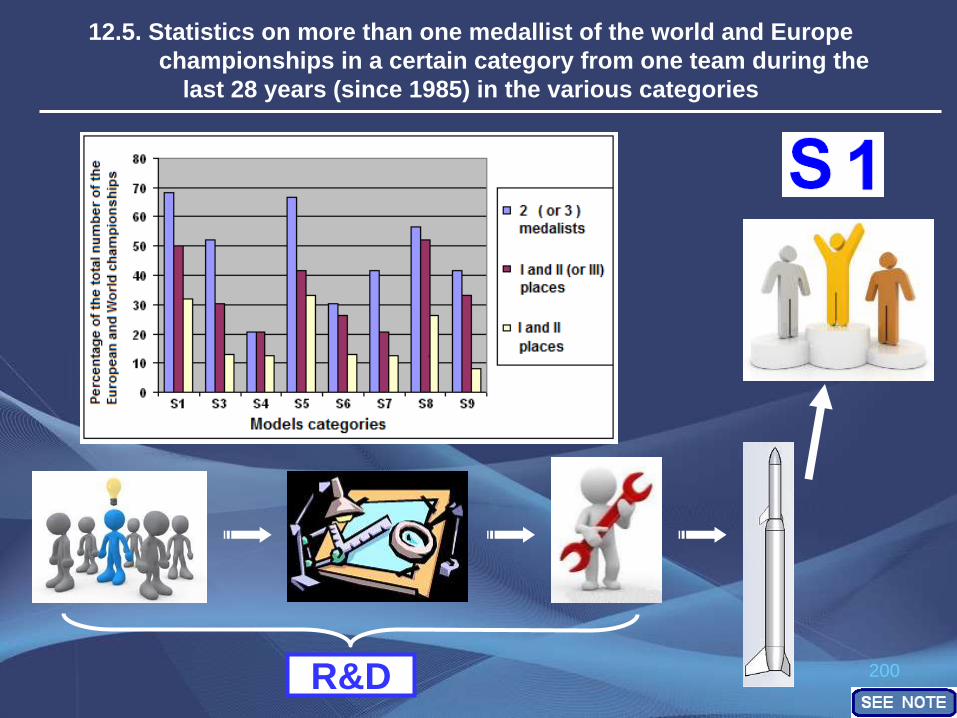
200
12.5. Statistics on more than one medallist of the world and Europe
championships in a certain category from one team during the
last 28 years (since 1985) in the various categories
R&D

201
12.6. Your Nobleness, Sir LUCK ...
Be aggressive and make it happened!
Turn the face of Sir LUCK towards you!

202
u
Collect as many aces, kings and trumps as you can for your
hand prior the game (competition)!
Make your own premium hand!
Don’t bet in the dark!
12.7. Everything is in your hands
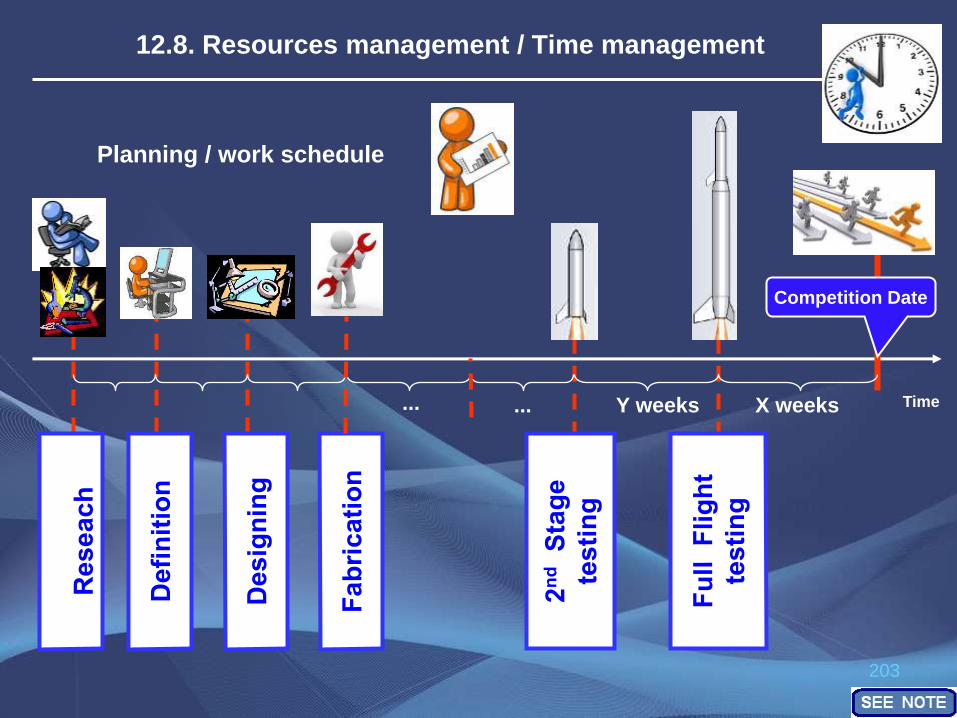
203
12.8. Resources management / Time management
Planning / work schedule
X weeks Y weeks ... ...
Competition Date
Time

204
12.8. Resources management / Time management (con’t)
Checking of the fulfillment of a schedule
Adjustment of a schedule
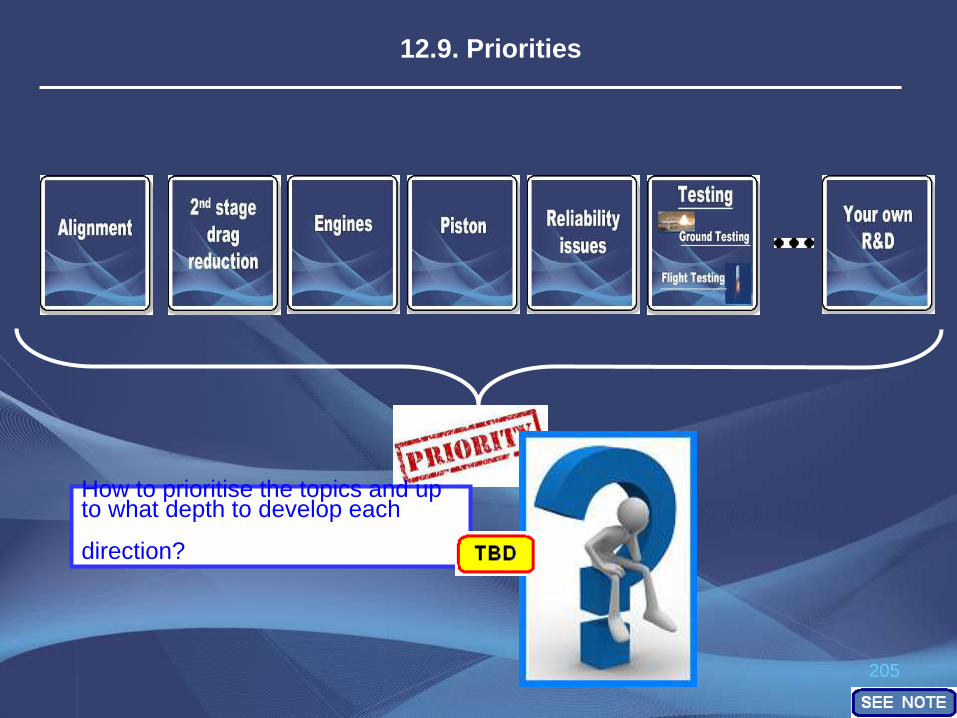
205
12.9. Priorities
How to prioritise the topics and up to what depth to develop each
direction?
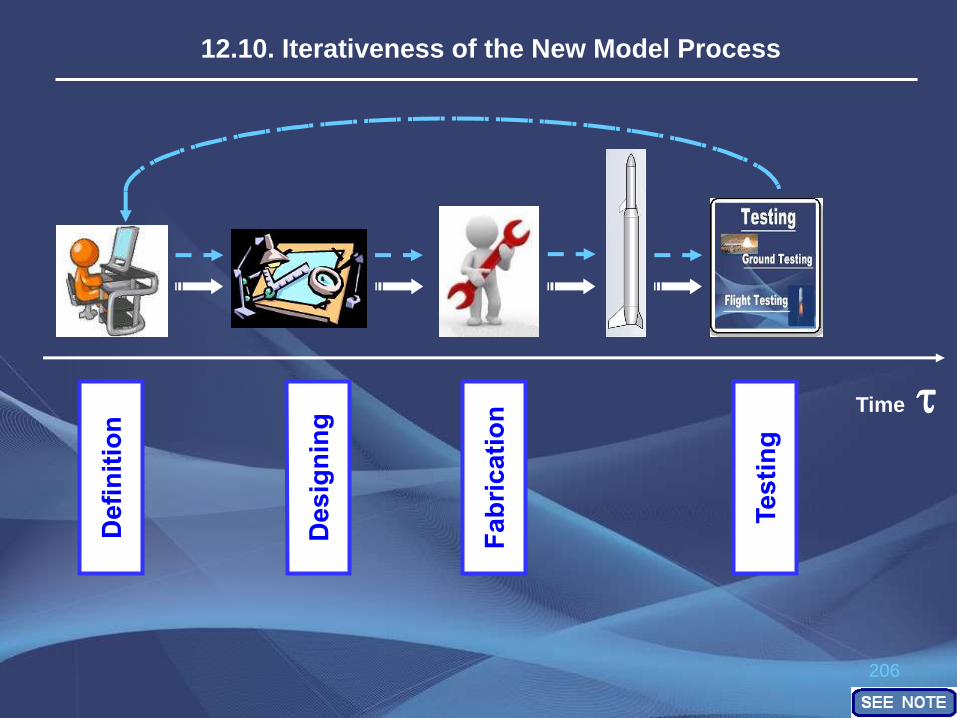
206
12.10. Iterativeness of the New Model Process
Time t

207
With all these optimizations, fabrications, testing, etc.
don’t forget about FUN part!
Enjoy what you are doing!
Have FUN!
208
Enjoy open sky “million by million”!
Enjoy that flying feeling. Something like what you
felt when you had launched your very first rocket!
GOOD LUCK! And GOOD SKY!

209
Afterward Notes
1. I hope you have found some points of interest in this
presentation.
2. I would be pleased if some of the described ideas or variation
of them will be applied on your future models. I would like as
well (or even more) if presented material will sparks / leads to
your own new ideas for performance improvement of your
altitude models.
3. Some of the presented material may not be absolutely correct.
Your responses / comments would be appreciated.
4. I hope the presented materials on S1 models will inspire rocketeers
to make similar presentation(s) on the other FAI model categories.

210

211

212
Acknowledgements
"What is hidden is lost. What is given becomes yours”
- Shota Rustaveli, Georgian poet
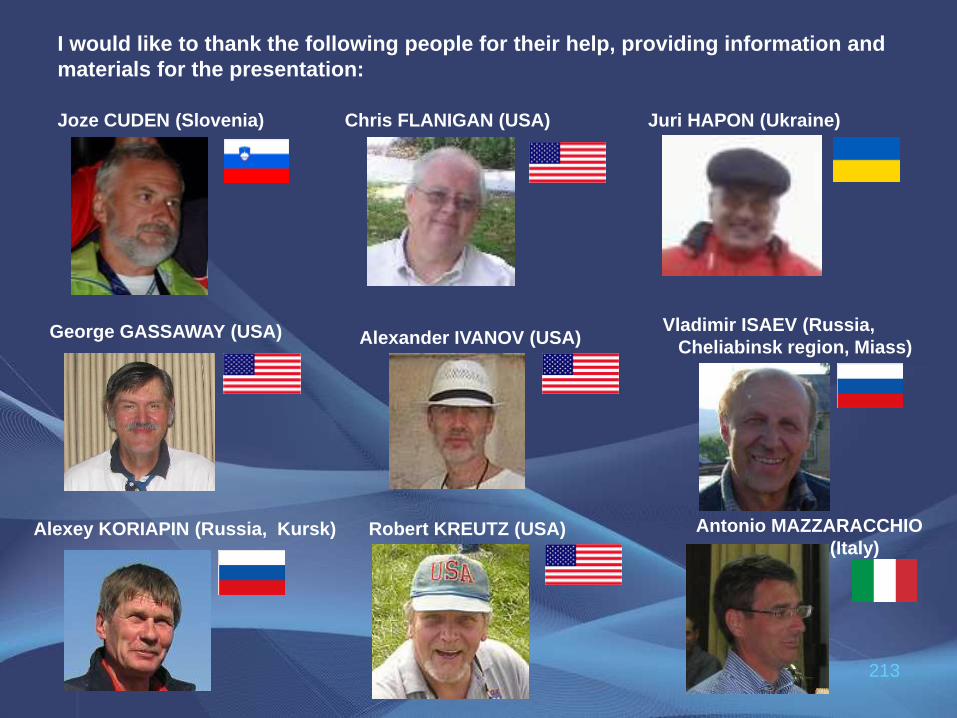
213
I would like to thank the following people for their help, providing information and
materials for the presentation:
Joze CUDEN (Slovenia) Chris FLANIGAN (USA)
Alexey KORIAPIN (Russia, Kursk) Antonio MAZZARACCHIO
(Italy) Robert KREUTZ (USA)
Juri HAPON (Ukraine)
Alexander IVANOV (USA) Vladimir ISAEV (Russia,
Cheliabinsk region, Miass) George GASSAWAY (USA)
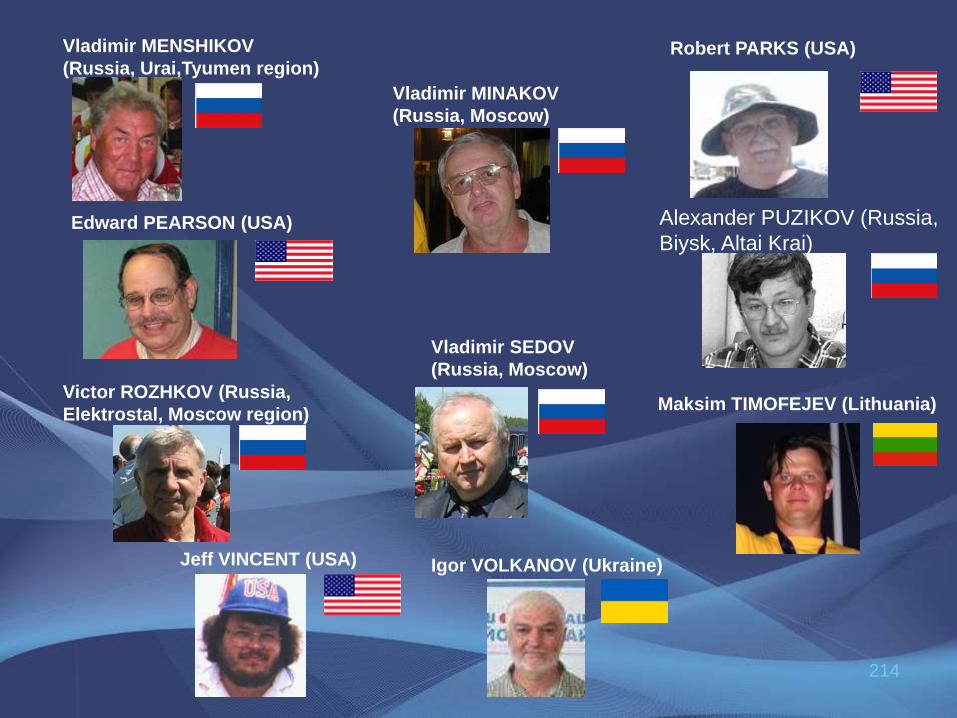
214
Vladimir MINAKOV
(Russia, Moscow)
Edward PEARSON (USA)
Robert PARKS (USA)
Alexander PUZIKOV (Russia,
Biysk, Altai Krai)
Victor ROZHKOV (Russia,
Elektrostal, Moscow region)
Jeff VINCENT (USA)
Vladimir SEDOV
(Russia, Moscow)
Vladimir MENSHIKOV
(Russia, Urai,Tyumen region)
Maksim TIMOFEJEV (Lithuania)
Igor VOLKANOV (Ukraine)

215
Oleg VORONOV (Russia, Moscow)
Mikhail YASHINSKIY (Russia, Kaliningrad)
Alexander ZAGORODNYI
(Russia, Pavlov Posad, Moscow region)

216
List of Changes
(for Rev 4. vs. Rev 3.)

217
List of Changes
(for Rev 4. vs. Rev 3.)
(con’t 1)