sabrina savage, signatures of magne(c reconnec(on in the extended corona sabrina savage, mahew j....
TRANSCRIPT

Observa(onalSignaturesofMagne(cReconnec(onintheExtendedCorona
SabriNASAvage,Ma>hewJ.West,DanielB.Seaton,AdamKobelski
[email protected] *Considerablecontribu(onsfromK.Reeves&D.McKenzie
https://ntrs.nasa.gov/search.jsp?R=20160005070 2018-05-20T17:38:49+00:00Z

Supra-ArcadeDownflows(SADs)Observa(ons
Fig1:McKenzie&Savage2009 Fig2:Savageetal.2011 Fig3:Savageetal.2012
Fig1
Fig2
Fig3
Fig4
2011Oct22,SDO/AIA
2011May9,SDO/AIA
Fig5
- Teardrop-shapedvoidsobserved
totravelsunwardthroughthebright,hotfanextendingoutwardalongthespineofdevelopingpost-flarearcades.
- Observedwithhigh-temperatureinstrumenta(on(EUV,X-ray)&white-lightcoronagraph(density)
- LONGDURATIONEVENTS
1999Jan20,Yohkoh/SXT
2002Apr21,TRACE
2010Nov4,SOHO/LASCO
Sadpoles,nottadpoles

Supra-ArcadeDownflowingLoops(SADLs)Observa(ons
Fig1:Savage&McKenzie2011
Fig1 2003Nov4,TRACE 2010Nov3,SDO/AIA
2000Jan1,LASCO
Fig5

Supra-ArcadeDownflowingLoops(SADLs)Observa(ons
Fig1:Savage&McKenzie2011 Fig2:Savageetal.2010
Fig1
Fig2
2003Nov4,TRACE
2008Apr9,Hinode/XRT
Behindthelimb

Supra-ArcadeDownflowingLoops(SADLs)Observa(ons
Fig1:Savage&McKenzie2011 Fig2:Savageetal.2010 Fig3:Savageetal.2012
Fig1
Fig2
Fig32003Nov4,TRACE
2008Apr9,Hinode/XRT
2010Nov3,SDO/AIA

DifferentfromPlasmoidObserva(ons
Fig1:Savageetal.2010
Fig3
Fig4
Fig2
Fig3:Takasaoetal.2012 Fig4:Linetal.2004Fig2:Koetal.2003
Fig1
- Coherent‘bubble’ofemiingplasmaheldtogetherbymagne(cfields.
- Observedwithbroadband-temperatureinstrumenta(on(EUV,X-ray,HardX-ray)&white-lightcoronagraph(density)
Ø Magne4cIslands

DifferentfromPlasmoidObserva(ons
Fig1,2:Daughtonetal.2012 Fig3:Nishizukaetal.2013
Fig1
Fig2
Fig3
- Thinfluxtubescreatedduringthereconnec(onprocessacrossthecurrentsheet.
- Plasmoidsa3-Dproductofreconnec(onconcurrenttosingleloopcrea(on.

SADs+SADLs
- HotAIAchannels.(2-10MK)
- Differenced
- Reverse-scaled

SADs+SADLs
Fig1:Savageetal.2012
Fig1 - SADsappeartobevoidscreatedbyloops(SADLs)shrinkingthroughthefanplasma.

SADs+SADLs
Fig1,2:Savageetal.2012
Fig1
Fig2
- SADsappeartobevoidscreatedbyloops(SADLs)shrinkingthroughthefanplasma.

Supra-ArcadeDownflowingLoops(SADLs)Observa(ons
2012Jan27,SDO/AIA

Par(cleAccelera(on&Hea(ng
Fig1:Asaietal.2004(Khan;Liu)
Fig1
RHESSI+TRACE
0
100
200
300
0
Dis
tanc
e (a
rcse
c)
0
100
200
300
0
Dis
tanc
e (a
rcse
c)
AIA 94 cut 4
Flux Rope Eruption
17:00 18:00 19:00 20:00
0
100
200
300
0
Dis
tanc
e (a
rcse
c)
17:00 18:00 19:00 20:00
0
100
200
300
0
Dis
tanc
e (a
rcse
c)
AIA 94 cut 4
18:45 19:00Start Time (03-Mar-12 17:50:00)
50
100
150
Dis
tanc
e (a
rcse
c)
18:45 19:00Start Time (03-Mar-12 17:50:00)
50
100
150
Dis
tanc
e (a
rcse
c)
AIA 94 cut 3RHESSI 6-10 keVVLA 1189 1317 1445
18:45 19:00
18:45 19:00
AIA 131 cut 3RHESSI 6-10 keVVLA 1189 1317 1445
18:00 18:15 18:30 18:45 19:00
50
100
150
Dis
tanc
e (a
rcse
c)
18:00 18:15 18:30 18:45 19:00
50
100
150
Dis
tanc
e (a
rcse
c)
Downflows
18:00 18:15 18:30 18:45 19:00
50
100
150
18:00 18:15 18:30 18:45 19:00
50
100
150
Downflows
VLA+AIA+RHESSI
Savage–2010Nov3flare
Fig3:Chenetal.2014;2015
Fig2
Fig3
RHESSI+AIA

DiagramModelsFig1 Fig2
Fig3
Fig1,2:Savageetal.2012 Fig3:Ohyama&Shibata2008

3DisPivotalFig1
Fig2
Fig3
Fig1,2:Savageetal.2012 Fig3:Ohyama&Shibata2008
Guidoni&Longcope2010

Fig1:Savageetal.2012
Fig1
- Basicreconnec(onscenario,postini(alfluxropeforma(onandrelease.
- Generalorganiza(onofthemagne(cfieldofthevariouscomponents(SADs,SADLs,plasmoids).
- Fieldlinesreconnectacrossthecurrentsheettoformouplowingfluxtubeswhileplasmoidsformalongthecurrentsheet.
- SADsareformedasthefluxtubes(SADLs)retractthroughhotplasmainthefan(otherwise,onlySADLsareobserved).

Fig1:Savageetal.2012
Strongpoten(alanalogywithmagnetotailsubstorms
Dipolarization Front/Bursty Bulk Flow
BBF Braking Region
South Pole** (ionosphere)
North Pole** (ionosphere)
Magnetotail current sheet
**Pole width exaggerated
Pre-substorm FieldLine Geometry
Wakes Behind Dipolarization Fronts
To Sun
Fig1 Fig2
Fig2:CourtesyofA.Kobelski,Reevesetal.2008

ModelConstraints
Fig1:Savage,McKenzie,&Reeves2012
OBSERVEDTEMPERATUREANDDENSITYALWAYSLOWERTHANFANFig1
Fig2:Hanneman&Reeves2014
Fig2
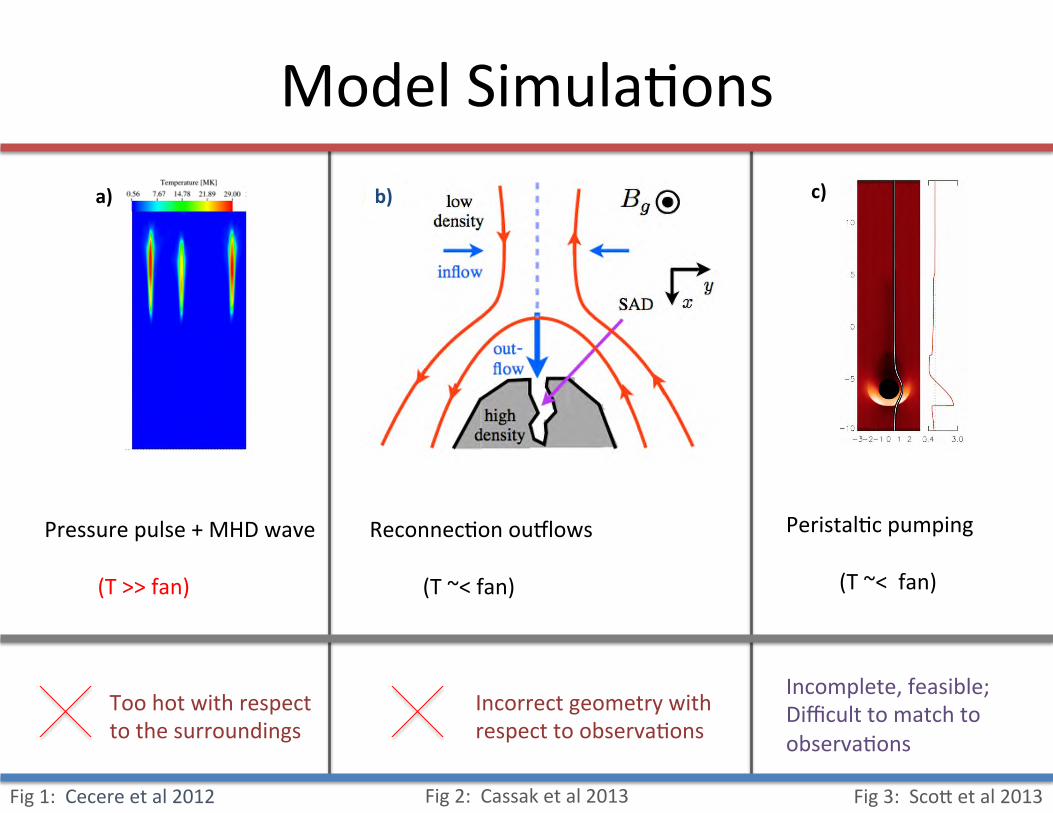
ModelSimula(onsa)
Pressurepulse+MHDwave(T>>fan)
c)
Peristal(cpumping(T~<fan)
b)
Reconnec(onouplows(T~<fan)
Toohotwithrespecttothesurroundings
Fig1:Cecereetal2012
Incorrectgeometrywithrespecttoobserva(ons
Fig3:Sco>etal2013Fig2:Cassaketal2013
Incomplete,feasible;Difficulttomatchtoobserva(ons

Fig1:Guoetal2014
Rayleigh-TaylorInstabili(esbehindretrac(ngfluxtubes(T>fan)
Toohotwithrespecttothesurroundings BUT Bestmatchtoobserva(onstodate(3D!!!)althoughearlyindevelopment
ModelSimula(ons

SADsintheExtendedCoronaFig1
Fig1:Sheeley,Warren,&Wang2007
Fig2
Fig2:Sheeley&Wang2007

SADsintheExtendedCorona…“GiantArches”Flare–2014Oct14
Fig1:West&Seaton2015
Fig1PROBA-2/SWAP–174Å
~1.45R¤
SADsinthelowercoronaaretypicallyobservedwellazerreconnec(onhasoccurred.Intheextendedcorona,wearebe>erabletoobservethemigra(ngreconnec(onsites.Coronagraphsallowustoseereconnec(ondevelopbehindtheCMEwhilelookingdirectlyatthedensity.

SADsintheExtendedCorona…
PROBA-2/SWAPGI
LASCOC2PROBA-2/SWAP AIA131Å
A:Fla>enedfromayear’sworthofdataCleaned(cosmicrays,backgroundstars,planets)A>enuateddiskB:Smooth-Differenced-Scaled
BA

SADsintheExtendedCorona…LASCOC2
PROBA-2/SWAP AIA131Å
C:Run-Mean-DifferencedD:Smooth-DifferencedExtracted-Scaled
C D

SADsintheExtendedCorona…
40FlowsTrackedMedian~-82km/s
Velocity[km/s]
#ofoccurrences

SADsintheExtendedCorona…
0 100 200 300 400Elapsed Flow Time [min]
1000
2000
3000
4000
5000
Hei
ght [
Mm
]
All Flows
-2000 0 2000 4000 6000 8000Elapsed Flow Time [min]
1000
2000
3000
4000
5000
6000
Hei
ght [
Mm
]
All FlowsHe
ight[M
m]
Height[M
m]
ElapsedFLOWTime[min]
ElapsedEVENTTime[min]
Individualflowprofile
Trendinini(alheights

SADsintheExtendedCorona…
TBD1. Correlate
flowsdirectlytolightcurveasdonefor2010Nov3rdevent
2. Spa4allyandtemporallycorrelateRHESSIandHinode/XRTX-raycontourswithouWlows.
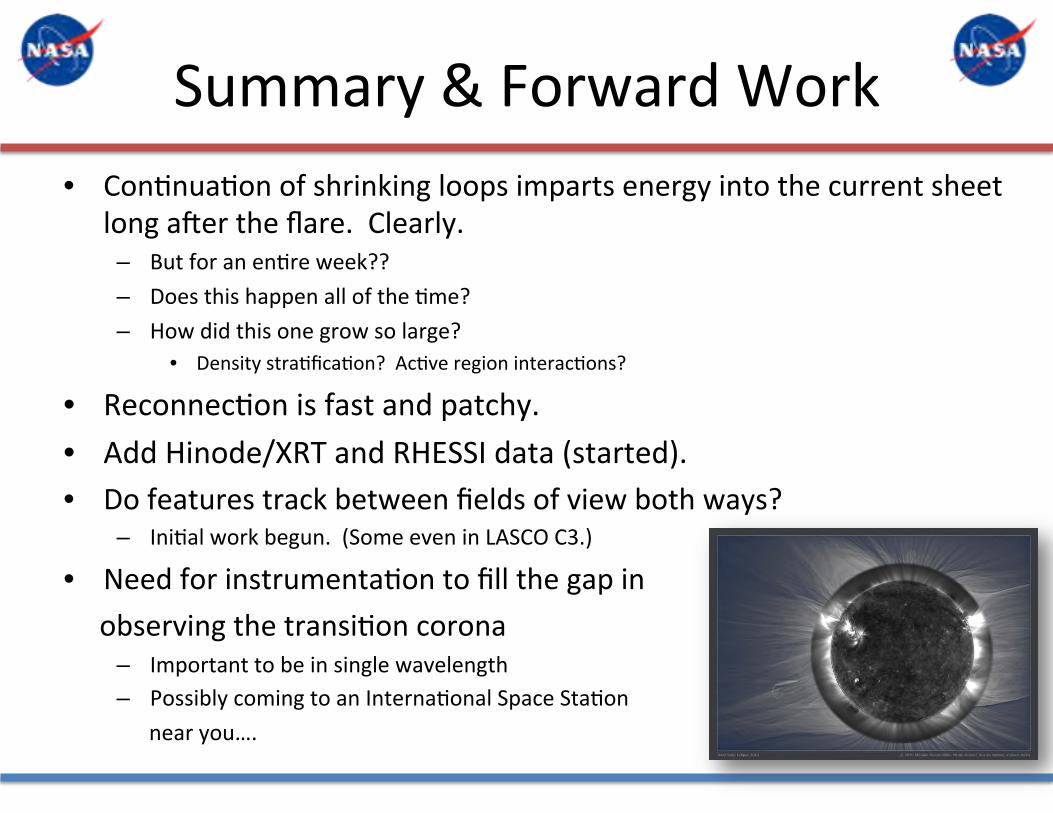
Summary&ForwardWork• Con(nua(onofshrinkingloopsimpartsenergyintothecurrentsheet
longazertheflare.Clearly.– Butforanen(reweek??– Doesthishappenallofthe(me?– Howdidthisonegrowsolarge?
• Densitystra(fica(on?Ac(veregioninterac(ons?
• Reconnec(onisfastandpatchy.• AddHinode/XRTandRHESSIdata(started).• Dofeaturestrackbetweenfieldsofviewbothways?
– Ini(alworkbegun.(SomeeveninLASCOC3.)
• Needforinstrumenta(ontofillthegapinobservingthetransi(oncorona
– Importanttobeinsinglewavelength– PossiblycomingtoanInterna(onalSpaceSta(onnearyou….