sadlier new york progress mathematics new york … 7: associated ratios and the value of a ratio (p)...
TRANSCRIPT

SADLIER
New York Progress Mathematics
William H. Sadlier, Inc.www.sadlierschool.com800-221-5175
2 Module 1: Ratios and Unit Rates
5 Module 2: Arithmetic Operations Including Division of Fractions
7 Module 3: Rational Numbers
11 Module 4: Expressions and Equations
18 Module 5: Area, Surface Area, and Volume Problems
20 Module 6: Statistics
Contents
Correlated to the
New York State Common CoreMathematics Curriculum
Grade 6

New York Sta te Common Core Mathemat i c s Cur r i cu lum – NYS CC S tanda rds f o r Mathemat i c s – Sad l ie r New York Prog res s Mathemat i c s Cor re la t ion
Lesson Structure Key: P–Problem Set Lesson, M–Modeling Cycle Lesson, E–Explorations Lesson, S–Socratic Lesson Copyright © William H. Sadlier, Inc. All rights reserved. 2
Module 1 • Ratios and Unit Rates NYS COMMON CORE MATHEMATICS CURRICULUM, GRADE 6 NYS COMMON CORE STANDARDS FOR MATHEMATICS, GRADE 6 SADLIER NEW YORK PROGRESS MATHEMATICS, GRADE 6
Topic A: Representing and Reasoning About Ratios
Instructional Days: 8
Lessons 1–2: Ratios (S, E)
Lessons 3–4: Equivalent Ratios (P, P)
Lessons 5–6: Solving Problems by Finding Equivalent Ratios (P, P)
Lesson 7: Associated Ratios and the Value of a Ratio (P)
Lesson 8: Equivalent Ratios Defined Through the Value of a Ratio (P)
6.RP.A.1
Understand the concept of a ratio and use ratio language to describe a ratio relationship between two quantities. For example, “The ratio of wings to beaks in the bird house at the zoo was 2:1, because for every 2 wings there was 1 beak.” “For every vote candidate A received, candidate C received nearly three votes.”
Lesson 1 Understand Ratios and Unit Rates—pp. 10–17
6.RP.A.3
Use ratio and rate reasoning to solve real‐world and mathematical problems, e.g., by reasoning about tables of equivalent ratios, tape diagrams, double number line diagrams, or equations.
6.RP.A.3a
Make tables of equivalent ratios relating quantities with whole‐number measurements, find missing values in the tables, and plot the pairs of values on the coordinate plane. Use tables to compare ratios.
Lesson 2 Use Ratio Tables to Find Equivalent Ratios—pp. 18–25
Lesson 8 Problem Solving: Ratios and Rates—pp. 66–73
Topic B: Collections of Equivalent Ratios
Instructional Days: 7
Lesson 9: Tables of Equivalent Ratios (P)
Lesson 10: The Structure of Ratio Tables—Additive and Multiplicative (E)
Lesson 11: Comparing Ratios Using Ratio Tables (P)
Lesson 12: From Ratios Tables to Double Number Line Diagrams (P)
Lesson 13: From Ratio Tables to Equations Using the Value of the Ratio (P)
6.RP.A.3
Use ratio and rate reasoning to solve real‐world and mathematical problems, e.g., by reasoning about tables of equivalent ratios, tape diagrams, double number line diagrams, or equations.
6.RP.A.3a
Make tables of equivalent ratios relating quantities with whole‐number measurements, find missing values in the tables, and plot the pairs of values on the coordinate plane. Use tables to compare ratios.
Lesson 2 Use Ratio Tables to Find Equivalent Ratios—pp. 18–25
Lesson 8 Problem Solving: Ratios and Rates—pp. 66–73

New York Sta te Common Core Mathemat i c s Cur r i cu lum – NYS CC S tanda rds f o r Mathemat i c s – Sad l ie r New York Prog res s Mathemat i c s Cor re la t ion
Lesson Structure Key: P–Problem Set Lesson, M–Modeling Cycle Lesson, E–Explorations Lesson, S–Socratic Lesson Copyright © William H. Sadlier, Inc. All rights reserved. 3
Module 1 • Ratios and Unit Rates NYS COMMON CORE MATHEMATICS CURRICULUM, GRADE 6 NYS COMMON CORE STANDARDS FOR MATHEMATICS, GRADE 6 SADLIER NEW YORK PROGRESS MATHEMATICS, GRADE 6
Lesson 14: From Ratio Tables, Equations, and Double Number Line Diagrams to Plots on the Coordinate Plane (S)
Lesson 15: A Synthesis of Representations of Equivalent Ratio Collections (E)
Mid‐Module Assessment and Rubric Topics A through B (assessment 1 day, return 1 day, remediation or further applications 1 day)
Topic C: Unit Rates
Instructional Days: 8
Lesson 16: From Ratios to Rates (E)
Lesson 17: From Rates to Ratios (S)
Lesson 18: Finding a Rate by Dividing Two Quantities (M)
Lessons 19–20: Comparison Shopping—Unit Price and Related Measurement Conversions (E, P)
Lessons 21–22: Getting the Job Done—Speed, Work, and Measurement Units (P, E)
Lesson 23: Problem‐Solving Using Rates, Unit Rates, and Conversions (S)
6.RP.A.2
Understand the concept of a unit rate a/b associated with a ratio a:b with b ≠ 0, and use rate language in the context of a ratio relationship. For example, “This recipe has a ratio of 3 cups of flour to 4 cups of sugar, so there is 3/4 cup of flour for each cup of sugar.” “We paid $75 for 15 hamburgers, which is a rate of $5 per hamburger.”
Lesson 1 Understand Ratios and Unit Rates—pp. 10–17
6.RP.A.3
Use ratio and rate reasoning to solve real‐world and mathematical problems, e.g., by reasoning about tables of equivalent ratios, tape diagrams, double number line diagrams, or equations.
6.RP.A.3b
Solve unit rate problems including those involving unit pricing and constant speed. For example, if it took 7 hours to mow 4 lawns, then at that rate, how many lawns could be mowed in 35 hours? At what rate were lawns being mowed?
Lesson 4 Solve Unit Rate Problems—pp. 34–41
Lesson 8 Problem Solving: Ratios and Rates—pp. 66–73
New York Sta te Common Core Mathemat i c s Cur r i cu lum – NYS CC S tanda rds f o r Mathemat i c s – Sad l ie r New York Prog res s Mathemat i c s Cor re la t ion
Lesson Structure Key: P–Problem Set Lesson, M–Modeling Cycle Lesson, E–Explorations Lesson, S–Socratic Lesson Copyright © William H. Sadlier, Inc. All rights reserved. 4
Module 1 • Ratios and Unit Rates NYS COMMON CORE MATHEMATICS CURRICULUM, GRADE 6 NYS COMMON CORE STANDARDS FOR MATHEMATICS, GRADE 6 SADLIER NEW YORK PROGRESS MATHEMATICS, GRADE 6
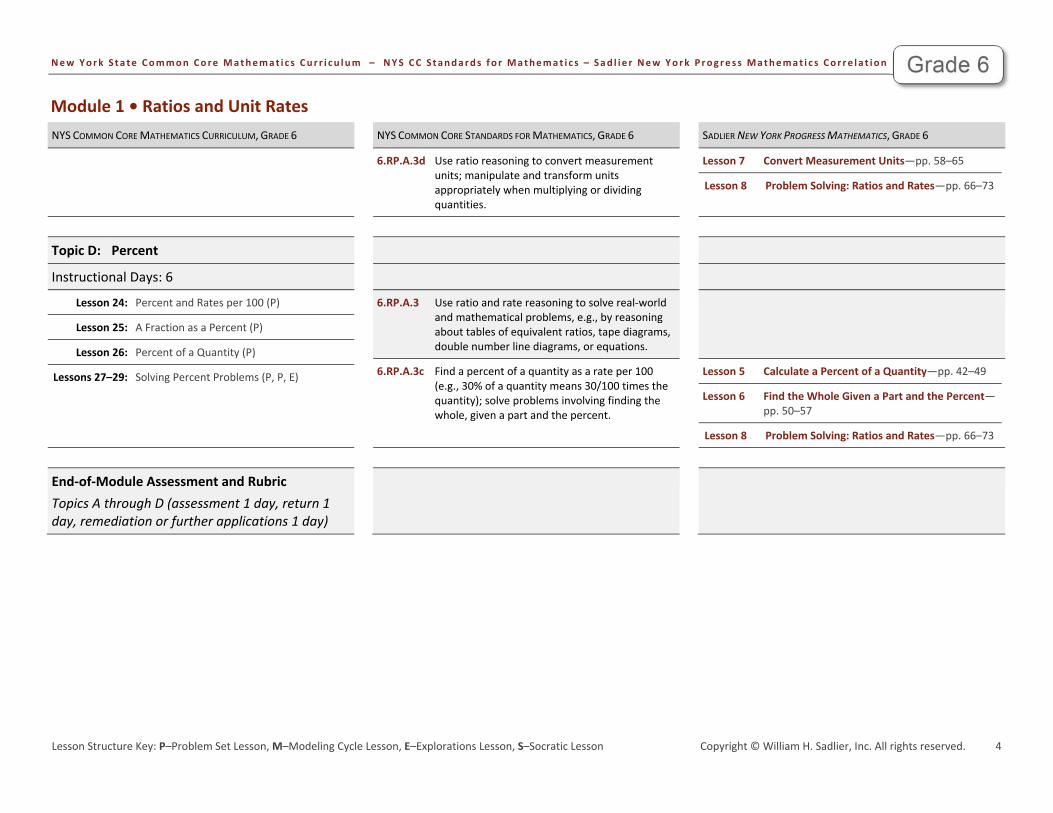
6.RP.A.3d
Use ratio reasoning to convert measurement units; manipulate and transform units appropriately when multiplying or dividing quantities.
Lesson 7 Convert Measurement Units—pp. 58–65
Lesson 8 Problem Solving: Ratios and Rates—pp. 66–73
Topic D: Percent
Instructional Days: 6
Lesson 24: Percent and Rates per 100 (P)
Lesson 25: A Fraction as a Percent (P)
Lesson 26: Percent of a Quantity (P)
Lessons 27–29: Solving Percent Problems (P, P, E)
6.RP.A.3
Use ratio and rate reasoning to solve real‐world and mathematical problems, e.g., by reasoning about tables of equivalent ratios, tape diagrams, double number line diagrams, or equations.
6.RP.A.3c
Find a percent of a quantity as a rate per 100 (e.g., 30% of a quantity means 30/100 times the quantity); solve problems involving finding the whole, given a part and the percent.
Lesson 5 Calculate a Percent of a Quantity—pp. 42–49
Lesson 6 Find the Whole Given a Part and the Percent—pp. 50–57
Lesson 8 Problem Solving: Ratios and Rates—pp. 66–73
End‐of‐Module Assessment and Rubric Topics A through D (assessment 1 day, return 1 day, remediation or further applications 1 day)

New York Sta te Common Core Mathemat i c s Cur r i cu lum – NYS CC S tanda rds f o r Mathemat i c s – Sad l ie r New York Prog res s Mathemat i c s Cor re la t ion
Lesson Structure Key: P–Problem Set Lesson, M–Modeling Cycle Lesson, E–Explorations Lesson, S–Socratic Lesson Copyright © William H. Sadlier, Inc. All rights reserved. 5
Module 2 • Arithmetic Operations Including Division of Fractions NYS COMMON CORE MATHEMATICS CURRICULUM, GRADE 6 NYS COMMON CORE STANDARDS FOR MATHEMATICS, GRADE 6 SADLIER NEW YORK PROGRESS MATHEMATICS, GRADE 6
Topic A: Dividing Fractions by Fractions
Instructional Days: 8
Lesson 1: Interpreting Division of a Fraction by a Whole Number—Visual Models (P)
Lesson 2: Interpreting Division of a Whole Number by a Fraction—Visual Models (P)
Lessons 3–4: Interpreting and Computing Division of a Fraction by a Fraction—More Models (P)
Lesson 5: Creating Division Stories (P)
Lesson 6: More Division Stories (P)
Lesson 7: The Relationship Between Visual Fraction Models and Equations (S)
Lesson 8: Dividing Fractions and Mixed Numbers (P)
6.NS.A.1
Interpret and compute quotients of fractions, and solve word problems involving division of fractions by fractions, e.g., by using visual fraction models and equations to represent the problem. For example, create a story context for (2/3) ÷ (3/4) and use a visual fraction model to show the quotient; use the relationship between multiplication and division to explain that (2/3) ÷ (3/4) = 8/9 because 3/4 of 8/9 is 2/3. (In general, (a/b) ÷ (c/d) = ad/bc.) How much chocolate will each person get if 3 people share 1/2 lb of chocolate equally? How many 3/4‐cup servings are in 2/3 of a cup of yogurt? How wide is a rectangular strip of land with length 3/4 mi and area 1/2 square mi?
Lesson 9 Divide a Fraction by a Fraction—pp. 80–87
Lesson 10 Problem Solving: Fraction Division—pp. 88–95
Topic B: Multi‐Digit Decimal Operations—
Adding, Subtracting, and Multiplying
Instructional Days: 3
Lesson 9: Sums and Differences of Decimals (P)
Lesson 10: The Distributive Property and the Products of Decimals (P)
Lesson 11: Fraction Multiplication and the Products of Decimals (E)
6.NS.B.3
Fluently add, subtract, multiply, and divide multi‐digit decimals using the standard algorithm for each operation.
Lesson 12 Add and Subtract Multi‐digit Decimals—pp. 104–111
Lesson 13 Multiply and Divide Multi‐digit Decimals—pp. 112–119
Mid‐Module Assessment and Rubric Topics A through B (assessment 1 day, return 1 day, remediation or further applications 1 day)

New York Sta te Common Core Mathemat i c s Cur r i cu lum – NYS CC S tanda rds f o r Mathemat i c s – Sad l ie r New York Prog res s Mathemat i c s Cor re la t ion
Lesson Structure Key: P–Problem Set Lesson, M–Modeling Cycle Lesson, E–Explorations Lesson, S–Socratic Lesson Copyright © William H. Sadlier, Inc. All rights reserved. 6
Module 2 • Arithmetic Operations Including Division of Fractions NYS COMMON CORE MATHEMATICS CURRICULUM, GRADE 6 NYS COMMON CORE STANDARDS FOR MATHEMATICS, GRADE 6 SADLIER NEW YORK PROGRESS MATHEMATICS, GRADE 6
Topic C: Dividing Whole Numbers and Decimals
Instructional Days: 4
Lesson 12: Estimating Digits in a Quotient (P)
Lesson 13: Dividing Multi‐Digit Numbers Using the Algorithm (P)
Lesson 14: The Division Algorithm—Converting Decimal Division into Whole Number Division Using Fractions (P)
Lesson 15: The Division Algorithm—Converting Decimal Division into Whole Number Division Using Mental Math (P)
6.NS.B.2
Fluently divide multi‐digit numbers using the standard algorithm.
Lesson 11 Divide Multi‐digit Numbers—pp. 96–103
6.NS.B.3
Fluently add, subtract, multiply, and divide multi‐digit decimals using the standard algorithm for each operation.
Lesson 12 Add and Subtract Multi‐digit Decimals—pp. 104–111
Lesson 13 Multiply and Divide Multi‐digit Decimals—pp. 112–119
Topic D: Number Theory—Thinking Logically
About Multiplicative Arithmetic
Instructional Days: 4
Lesson 16: Even and Odd Numbers (S)
Lesson 17: Divisibility Tests for 3 and 9 (S)
Lesson 18: Least Common Multiple and Greatest Common Factor (P)
Lesson 19: The Euclidean Algorithm as an Application of the Long Division Algorithm (P)
6.NS.B.4
Find the greatest common factor of two whole numbers less than or equal to 100 and the least common multiple of two whole numbers less than or equal to 12. Use the distributive property to express a sum of two whole numbers 1–100 with a common factor as a multiple of a sum of two whole numbers with no common factor. For example, express 36 + 8 as 4 (9 + 2).
Lesson 14 Find the Greatest Common Factor and Least Common Multiple—pp. 120–127
End‐of‐Module Assessment and Rubric Topics A through D (assessment 1 day, return 1 day, remediation or further applications 1 day)
New York Sta te Common Core Mathemat i c s Cur r i cu lum – NYS CC S tanda rds f o r Mathemat i c s – Sad l ie r New York Prog res s Mathemat i c s Cor re la t ion
Lesson Structure Key: P–Problem Set Lesson, M–Modeling Cycle Lesson, E–Explorations Lesson, S–Socratic Lesson Copyright © William H. Sadlier, Inc. All rights reserved. 7
Module 3 • Rational Numbers NYS COMMON CORE MATHEMATICS CURRICULUM, GRADE 6 NYS COMMON CORE STANDARDS FOR MATHEMATICS, GRADE 6 SADLIER NEW YORK PROGRESS MATHEMATICS, GRADE 6
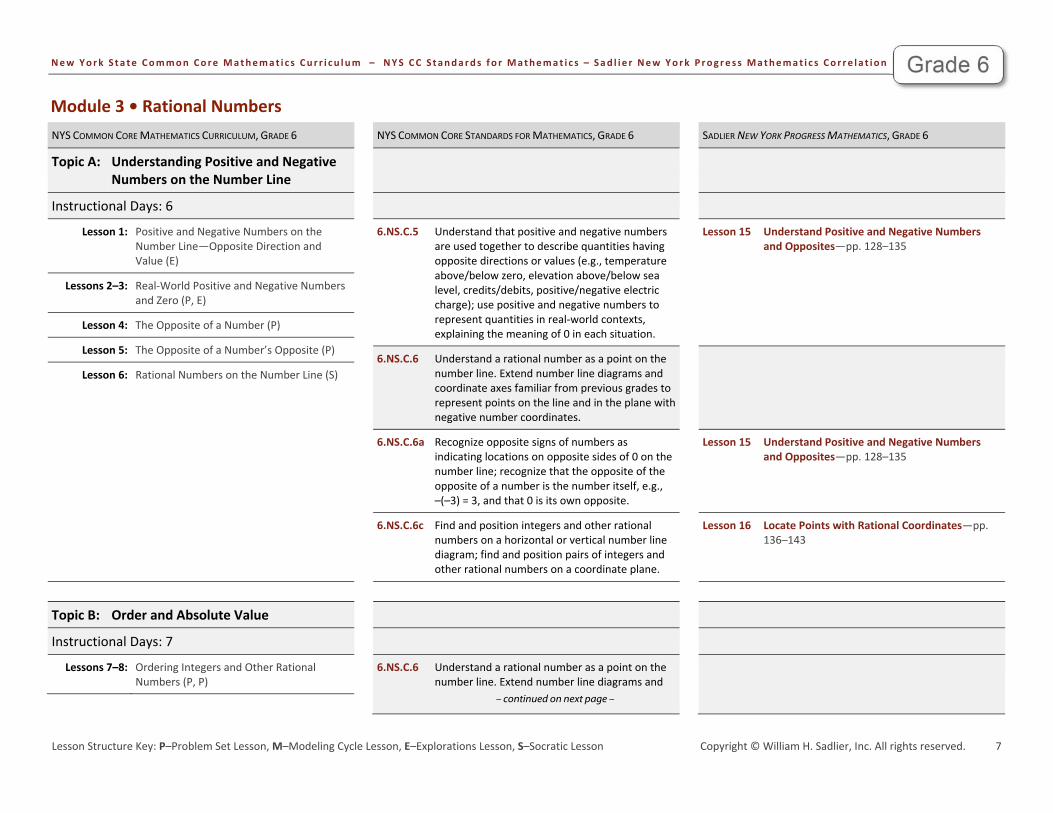
Topic A: Understanding Positive and Negative Numbers on the Number Line
Instructional Days: 6
Lesson 1: Positive and Negative Numbers on the Number Line—Opposite Direction and Value (E)
Lessons 2–3: Real‐World Positive and Negative Numbers and Zero (P, E)
Lesson 4: The Opposite of a Number (P)
Lesson 5: The Opposite of a Number’s Opposite (P)
Lesson 6: Rational Numbers on the Number Line (S)
6.NS.C.5
Understand that positive and negative numbers are used together to describe quantities having opposite directions or values (e.g., temperature above/below zero, elevation above/below sea level, credits/debits, positive/negative electric charge); use positive and negative numbers to represent quantities in real‐world contexts, explaining the meaning of 0 in each situation.
Lesson 15 Understand Positive and Negative Numbers and Opposites—pp. 128–135
6.NS.C.6
Understand a rational number as a point on the number line. Extend number line diagrams and coordinate axes familiar from previous grades to represent points on the line and in the plane with negative number coordinates.
6.NS.C.6a
Recognize opposite signs of numbers as indicating locations on opposite sides of 0 on the number line; recognize that the opposite of the opposite of a number is the number itself, e.g., –(–3) = 3, and that 0 is its own opposite.
Lesson 15 Understand Positive and Negative Numbers and Opposites—pp. 128–135
6.NS.C.6c
Find and position integers and other rational numbers on a horizontal or vertical number line diagram; find and position pairs of integers and other rational numbers on a coordinate plane.
Lesson 16 Locate Points with Rational Coordinates—pp.
136–143
Topic B: Order and Absolute Value
Instructional Days: 7
Lessons 7–8: Ordering Integers and Other Rational Numbers (P, P)
6.NS.C.6
Understand a rational number as a point on the number line. Extend number line diagrams and
– continued on next page –

New York Sta te Common Core Mathemat i c s Cur r i cu lum – NYS CC S tanda rds f o r Mathemat i c s – Sad l ie r New York Prog res s Mathemat i c s Cor re la t ion
Lesson Structure Key: P–Problem Set Lesson, M–Modeling Cycle Lesson, E–Explorations Lesson, S–Socratic Lesson Copyright © William H. Sadlier, Inc. All rights reserved. 8
Module 3 • Rational Numbers NYS COMMON CORE MATHEMATICS CURRICULUM, GRADE 6 NYS COMMON CORE STANDARDS FOR MATHEMATICS, GRADE 6 SADLIER NEW YORK PROGRESS MATHEMATICS, GRADE 6
Lesson 9: Comparing Integers and Other Rational Numbers (P)
Lesson 10: Writing and Interpreting Inequality Statements Involving Rational Numbers (P)
Lesson 11: Absolute Value—Magnitude and Distance (P)
Lesson 12: The Relationship Between Absolute Value and Order (P)
Lesson 13: Statements of Order in the Real World (P)
– continued from previous page –
coordinate axes familiar from previous grades to represent points on the line and in the plane with negative number coordinates.
6.NS.C.6c
Find and position integers and other rational numbers on a horizontal or vertical number line diagram; find and position pairs of integers and other rational numbers on a coordinate plane.
Lesson 16 Locate Points with Rational Coordinates—pp.
136–143
6.NS.C.7
Understand ordering and absolute value of rational numbers.
6.NS.C.7a
Interpret statements of inequality as statements about the relative position of two numbers on a number line diagram. For example, interpret –3 > –7 as a statement that –3 is located to the right of –7 on a number line oriented from left to right.
Lesson 17 Compare and Order Rational Numbers—pp. 144–151
6.NS.C.7b
Write, interpret, and explain statements of order for rational numbers in real‐world contexts. For example, write –3° C > –7° C to express the fact that –3° C is warmer than –7° C.
Lesson 17 Compare and Order Rational Numbers—pp.
144–151
6.NS.C.7c
Understand the absolute value of a rational number as its distance from 0 on the number line; interpret absolute value as magnitude for a positive or negative quantity in a real‐world situation. For example, for an account balance of –30 dollars, write |–30| = 30 to describe the size of the debt in dollars.
Lesson 18 Understand Absolute Value—pp. 152–159
6.NS.C.7d
Distinguish comparisons of absolute value from statements about order. For example, recognize that an account balance less than –30 dollars represents a debt greater than 30 dollars.
Lesson 18 Understand Absolute Value—pp. 152–159

New York Sta te Common Core Mathemat i c s Cur r i cu lum – NYS CC S tanda rds f o r Mathemat i c s – Sad l ie r New York Prog res s Mathemat i c s Cor re la t ion
Lesson Structure Key: P–Problem Set Lesson, M–Modeling Cycle Lesson, E–Explorations Lesson, S–Socratic Lesson Copyright © William H. Sadlier, Inc. All rights reserved. 9
Module 3 • Rational Numbers NYS COMMON CORE MATHEMATICS CURRICULUM, GRADE 6 NYS COMMON CORE STANDARDS FOR MATHEMATICS, GRADE 6 SADLIER NEW YORK PROGRESS MATHEMATICS, GRADE 6
Mid‐Module Assessment and Rubric Topics A through B (assessment 1 day, return 1 day, remediation or further applications 1 day)
Topic C: Rational Numbers and the Coordinate
Plane
Instructional Days: 4
Lesson 14: Ordered Pairs (P)
Lesson 15: Locating Ordered Pairs on the Coordinate Plane (P)
Lesson 16: Symmetry in the Coordinate Plane (P)
Lesson 17: Drawing the Coordinate Plane and Points on the Plane (P)
Lesson 18: Distance on the Coordinate Plane (P)
Lesson 19: Problem‐Solving and the Coordinate Plane (E)
6.NS.C.6
Understand a rational number as a point on the number line. Extend number line diagrams and coordinate axes familiar from previous grades to represent points on the line and in the plane with negative number coordinates.
6.NS.C.6b
Understand signs of numbers in ordered pairs as indicating locations in quadrants of the coordinate plane; recognize that when two ordered pairs differ only by signs, the locations of the points are related by reflections across one or both axes.
Lesson 17 Compare and Order Rational Numbers—pp. 144–151
6.NS.C.6c
Find and position integers and other rational numbers on a horizontal or vertical number line diagram; find and position pairs of integers and other rational numbers on a coordinate plane.
Lesson 18 Understand Absolute Value—pp. 152–159
6.NS.C.8
Solve real‐world and mathematical problems by graphing points in all four quadrants of the coordinate plane. Include use of coordinates and absolute value to find distances between points with the same first coordinate or the same second coordinate.
Lesson 19 Problem Solving: The Coordinate Plane—pp. 160–167

New York Sta te Common Core Mathemat i c s Cur r i cu lum – NYS CC S tanda rds f o r Mathemat i c s – Sad l ie r New York Prog res s Mathemat i c s Cor re la t ion
Lesson Structure Key: P–Problem Set Lesson, M–Modeling Cycle Lesson, E–Explorations Lesson, S–Socratic Lesson Copyright © William H. Sadlier, Inc. All rights reserved. 10
Module 3 • Rational Numbers NYS COMMON CORE MATHEMATICS CURRICULUM, GRADE 6 NYS COMMON CORE STANDARDS FOR MATHEMATICS, GRADE 6 SADLIER NEW YORK PROGRESS MATHEMATICS, GRADE 6
End‐of‐Module Assessment and Rubric Topics A through C (assessment 1 day, return 1 day, remediation or further applications 1 day)
New York Sta te Common Core Mathemat i c s Cur r i cu lum – NYS CC S tanda rds f o r Mathemat i c s – Sad l ie r New York Prog res s Mathemat i c s Cor re la t ion
Lesson Structure Key: P–Problem Set Lesson, M–Modeling Cycle Lesson, E–Explorations Lesson, S–Socratic Lesson Copyright © William H. Sadlier, Inc. All rights reserved. 11
Module 4 • Expressions and Equations NYS COMMON CORE MATHEMATICS CURRICULUM, GRADE 6 NYS COMMON CORE STANDARDS FOR MATHEMATICS, GRADE 6 SADLIER NEW YORK PROGRESS MATHEMATICS, GRADE 6
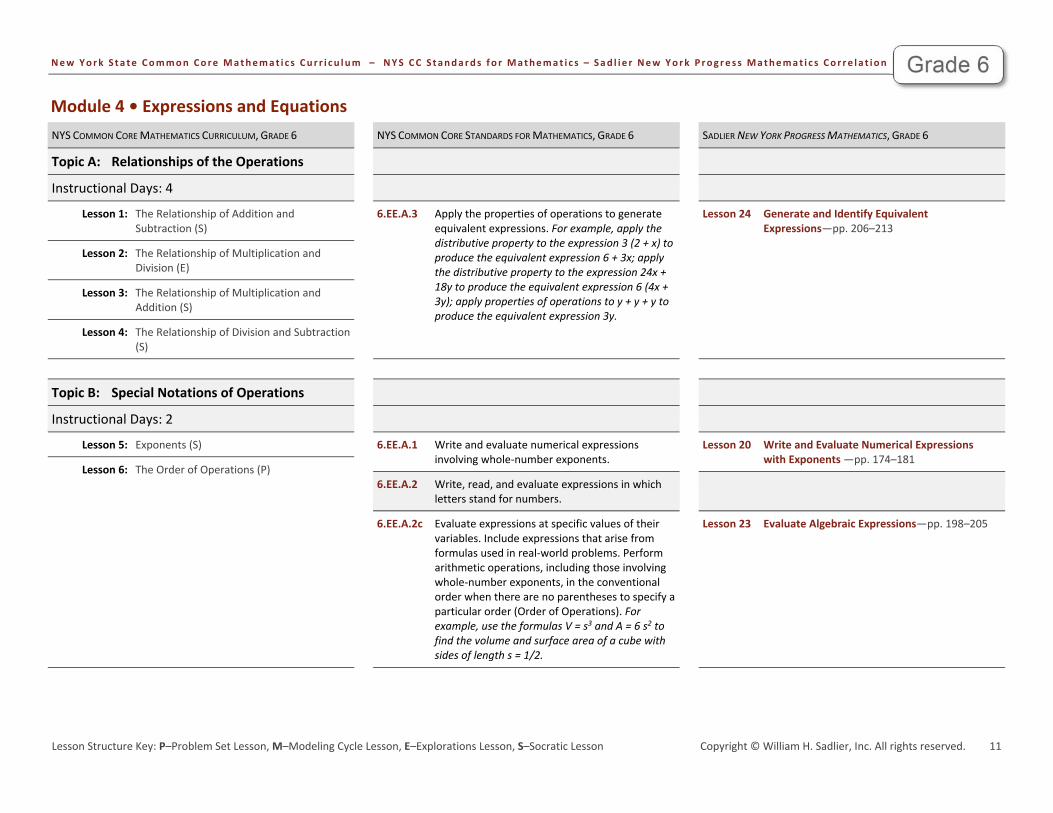
Topic A: Relationships of the Operations
Instructional Days: 4
Lesson 1: The Relationship of Addition and Subtraction (S)
Lesson 2: The Relationship of Multiplication and Division (E)
Lesson 3: The Relationship of Multiplication and Addition (S)
Lesson 4: The Relationship of Division and Subtraction (S)
6.EE.A.3
Apply the properties of operations to generate equivalent expressions. For example, apply the distributive property to the expression 3 (2 + x) to produce the equivalent expression 6 + 3x; apply the distributive property to the expression 24x + 18y to produce the equivalent expression 6 (4x + 3y); apply properties of operations to y + y + y to produce the equivalent expression 3y.
Lesson 24 Generate and Identify Equivalent Expressions—pp. 206–213
Topic B: Special Notations of Operations
Instructional Days: 2
Lesson 5: Exponents (S)
Lesson 6: The Order of Operations (P)
6.EE.A.1
Write and evaluate numerical expressions involving whole‐number exponents.
Lesson 20 Write and Evaluate Numerical Expressions with Exponents —pp. 174–181
6.EE.A.2
Write, read, and evaluate expressions in which letters stand for numbers.
6.EE.A.2c
Evaluate expressions at specific values of their variables. Include expressions that arise from formulas used in real‐world problems. Perform arithmetic operations, including those involving whole‐number exponents, in the conventional order when there are no parentheses to specify a particular order (Order of Operations). For example, use the formulas V = s3 and A = 6 s2 to find the volume and surface area of a cube with sides of length s = 1/2.
Lesson 23 Evaluate Algebraic Expressions—pp. 198–205
New York Sta te Common Core Mathemat i c s Cur r i cu lum – NYS CC S tanda rds f o r Mathemat i c s – Sad l ie r New York Prog res s Mathemat i c s Cor re la t ion
Lesson Structure Key: P–Problem Set Lesson, M–Modeling Cycle Lesson, E–Explorations Lesson, S–Socratic Lesson Copyright © William H. Sadlier, Inc. All rights reserved. 12
Module 4 • Expressions and Equations NYS COMMON CORE MATHEMATICS CURRICULUM, GRADE 6 NYS COMMON CORE STANDARDS FOR MATHEMATICS, GRADE 6 SADLIER NEW YORK PROGRESS MATHEMATICS, GRADE 6
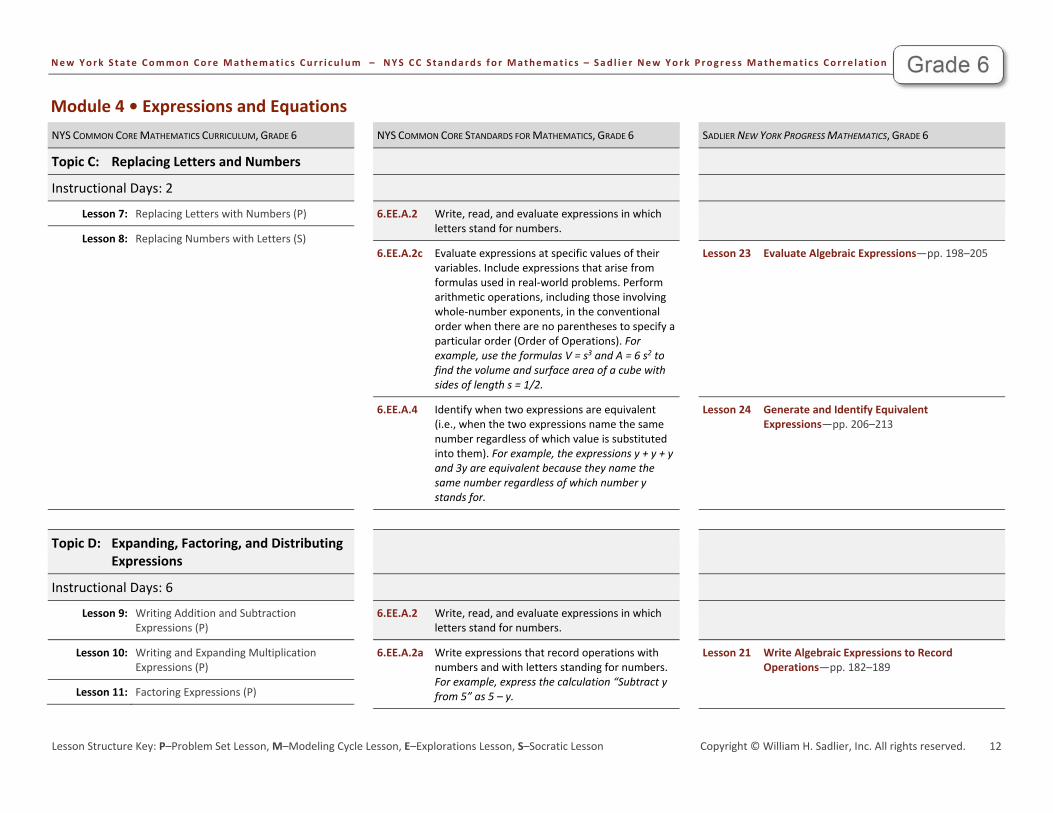
Topic C: Replacing Letters and Numbers
Instructional Days: 2
Lesson 7: Replacing Letters with Numbers (P)
Lesson 8: Replacing Numbers with Letters (S)
6.EE.A.2
Write, read, and evaluate expressions in which letters stand for numbers.
6.EE.A.2c
Evaluate expressions at specific values of their variables. Include expressions that arise from formulas used in real‐world problems. Perform arithmetic operations, including those involving whole‐number exponents, in the conventional order when there are no parentheses to specify a particular order (Order of Operations). For example, use the formulas V = s3 and A = 6 s2 to find the volume and surface area of a cube with sides of length s = 1/2.
Lesson 23 Evaluate Algebraic Expressions—pp. 198–205
6.EE.A.4
Identify when two expressions are equivalent (i.e., when the two expressions name the same number regardless of which value is substituted into them). For example, the expressions y + y + y and 3y are equivalent because they name the same number regardless of which number y stands for.
Lesson 24 Generate and Identify Equivalent Expressions—pp. 206–213
Topic D: Expanding, Factoring, and Distributing
Expressions
Instructional Days: 6
Lesson 9: Writing Addition and Subtraction Expressions (P)
Lesson 10: Writing and Expanding Multiplication Expressions (P)
Lesson 11: Factoring Expressions (P)
6.EE.A.2
Write, read, and evaluate expressions in which letters stand for numbers.
6.EE.A.2a
Write expressions that record operations with numbers and with letters standing for numbers. For example, express the calculation “Subtract y from 5” as 5 – y.
Lesson 21 Write Algebraic Expressions to Record
Operations—pp. 182–189

New York Sta te Common Core Mathemat i c s Cur r i cu lum – NYS CC S tanda rds f o r Mathemat i c s – Sad l ie r New York Prog res s Mathemat i c s Cor re la t ion
Lesson Structure Key: P–Problem Set Lesson, M–Modeling Cycle Lesson, E–Explorations Lesson, S–Socratic Lesson Copyright © William H. Sadlier, Inc. All rights reserved. 13
Module 4 • Expressions and Equations NYS COMMON CORE MATHEMATICS CURRICULUM, GRADE 6 NYS COMMON CORE STANDARDS FOR MATHEMATICS, GRADE 6 SADLIER NEW YORK PROGRESS MATHEMATICS, GRADE 6
Lesson 12: Distributing Expressions (P)
Lessons 13–14: Writing Division Expressions (P, P)
6.EE.A.2b
Identify parts of an expression using mathematical terms (sum, term, product, factor, quotient, coefficient); view one or more parts of an expression as a single entity. For example, describe the expression 2 (8 + 7) as a product of two factors; view (8 + 7) as both a single entity and a sum of two terms.
Lesson 22 Identify Parts of an Expression—pp. 190–197
6.EE.A.3
Apply the properties of operations to generate equivalent expressions. For example, apply the distributive property to the expression 3 (2 + x) to produce the equivalent expression 6 + 3x; apply the distributive property to the expression 24x + 18y to produce the equivalent expression 6 (4x + 3y); apply properties of operations to y + y + y to produce the equivalent expression 3y.
Lesson 24 Generate and Identify Equivalent Expressions—pp. 206–213
6.EE.A.4
Identify when two expressions are equivalent (i.e., when the two expressions name the same number regardless of which value is substituted into them). For example, the expressions y + y + y and 3y are equivalent because they name the same number regardless of which number y stands for.
Lesson 24 Generate and Identify Equivalent Expressions—pp. 206–213
Topic E: Expressing Operations in Algebraic
Form
Instructional Days: 3
Lesson 15: Read Expressions in Which Letters Stand for Numbers (P)
Lessons 16–17: Write Expressions in Which Letters Stand for Numbers (M, P)
6.EE.A.2
Write, read, and evaluate expressions in which letters stand for numbers.
6.EE.A.2a
Write expressions that record operations with numbers and with letters standing for numbers. For example, express the calculation “Subtract y from 5” as 5 – y.
Lesson 21 Write Algebraic Expressions to Record
Operations—pp. 182–189

New York Sta te Common Core Mathemat i c s Cur r i cu lum – NYS CC S tanda rds f o r Mathemat i c s – Sad l ie r New York Prog res s Mathemat i c s Cor re la t ion
Lesson Structure Key: P–Problem Set Lesson, M–Modeling Cycle Lesson, E–Explorations Lesson, S–Socratic Lesson Copyright © William H. Sadlier, Inc. All rights reserved. 14
Module 4 • Expressions and Equations NYS COMMON CORE MATHEMATICS CURRICULUM, GRADE 6 NYS COMMON CORE STANDARDS FOR MATHEMATICS, GRADE 6 SADLIER NEW YORK PROGRESS MATHEMATICS, GRADE 6
6.EE.A.2b
Identify parts of an expression using mathematical terms (sum, term, product, factor, quotient, coefficient); view one or more parts of an expression as a single entity. For example, describe the expression 2 (8 + 7) as a product of two factors; view (8 + 7) as both a single entity and a sum of two terms.
Lesson 22 Identify Parts of an Expression—pp. 190–197
Mid‐Module Assessment and Rubric Topics A through E (assessment 1 day, return 1 day, remediation or further applications 3 days)
Topic F: Writing and Evaluating Expressions
and Formulas
Instructional Days: 5
Lesson 18: Writing and Evaluating Expressions—Addition and Subtraction (P)
Lesson 19: Substituting to Evaluate Addition and Subtraction Expressions (P)
Lesson 20: Writing and Evaluating Expressions—Multiplication and Division (P)
Lesson 21: Writing and Evaluating Expressions—Multiplication and Addition (M)
Lesson 22: Writing and Evaluating Expressions—Exponents (P)
6.EE.A.2
Write, read, and evaluate expressions in which letters stand for numbers.
6.EE.A.2a
Write expressions that record operations with numbers and with letters standing for numbers. For example, express the calculation “Subtract y from 5” as 5 – y.
Lesson 21 Write Algebraic Expressions to Record
Operations—pp. 182–189
6.EE.A.2c
Evaluate expressions at specific values of their variables. Include expressions that arise from formulas used in real‐world problems. Perform arithmetic operations, including those involving whole‐number exponents, in the conventional order when there are no parentheses to specify a particular order (Order of Operations). For example, use the formulas V = s3 and A = 6 s2 to find the volume and surface area of a cube with sides of length s = 1/2.
Lesson 23 Evaluate Algebraic Expressions—pp. 198–205

New York Sta te Common Core Mathemat i c s Cur r i cu lum – NYS CC S tanda rds f o r Mathemat i c s – Sad l ie r New York Prog res s Mathemat i c s Cor re la t ion
Lesson Structure Key: P–Problem Set Lesson, M–Modeling Cycle Lesson, E–Explorations Lesson, S–Socratic Lesson Copyright © William H. Sadlier, Inc. All rights reserved. 15
Module 4 • Expressions and Equations NYS COMMON CORE MATHEMATICS CURRICULUM, GRADE 6 NYS COMMON CORE STANDARDS FOR MATHEMATICS, GRADE 6 SADLIER NEW YORK PROGRESS MATHEMATICS, GRADE 6
6.EE.B.6
Use variables to represent numbers and write expressions when solving a real‐world or mathematical problem; understand that a variable can represent an unknown number, or, depending on the purpose at hand, any number in a specified set.
Lesson 26 Write Algebraic Expressions to Represent Problems—pp. 222–229
Topic G: Solving Equations
Instructional Days: 7
Lessons 23–24: True and False Number Sentences (P, P)
Lesson 25: Finding Solutions to Make Equations True (P)
Lesson 26: One‐Step Equations—Addition and Subtraction (M)
Lesson 27: One‐Step Equations—Multiplication and Division (E)
Lesson 28: Two‐Step Problems—All Operations (M)
Lesson 29: Multi‐‐Step Problems—All Operations (P)
6.EE.B.5
Understand solving an equation or inequality as a process of answering a question: which values from a specified set, if any, make the equation or inequality true? Use substitution to determine whether a given number in a specified set makes an equation or inequality true.
Lesson 25 Identify Solutions to Equations and Inequalities—pp. 214–221
6.EE.B.6
Use variables to represent numbers and write expressions when solving a real‐world or mathematical problem; understand that a variable can represent an unknown number, or, depending on the purpose at hand, any number in a specified set.
Lesson 26 Write Algebraic Expressions to Represent Problems—pp. 222–229
6.EE.B.7
Solve real‐world and mathematical problems by writing and solving equations of the form x + p = q and px = q for cases in which p, q and x are all nonnegative rational numbers.
Lesson 27 Solve Equations of the Form x + p = q—pp. 230–237
Lesson 28 Solve Equations of the Form px = q—pp. 238–245
Topic H: Applications of Equations
Instructional Days: 5
Lesson 30: One‐Step Problems in the Real World (P)
Lesson 31: Problems in Mathematical Terms (P)
6.EE.B.5
Understand solving an equation or inequality as a process of answering a question: which values
– continued on next page –
Lesson 25 Identify Solutions to Equations and
Inequalities—pp. 214–221
New York Sta te Common Core Mathemat i c s Cur r i cu lum – NYS CC S tanda rds f o r Mathemat i c s – Sad l ie r New York Prog res s Mathemat i c s Cor re la t ion
Lesson Structure Key: P–Problem Set Lesson, M–Modeling Cycle Lesson, E–Explorations Lesson, S–Socratic Lesson Copyright © William H. Sadlier, Inc. All rights reserved. 16
Module 4 • Expressions and Equations NYS COMMON CORE MATHEMATICS CURRICULUM, GRADE 6 NYS COMMON CORE STANDARDS FOR MATHEMATICS, GRADE 6 SADLIER NEW YORK PROGRESS MATHEMATICS, GRADE 6
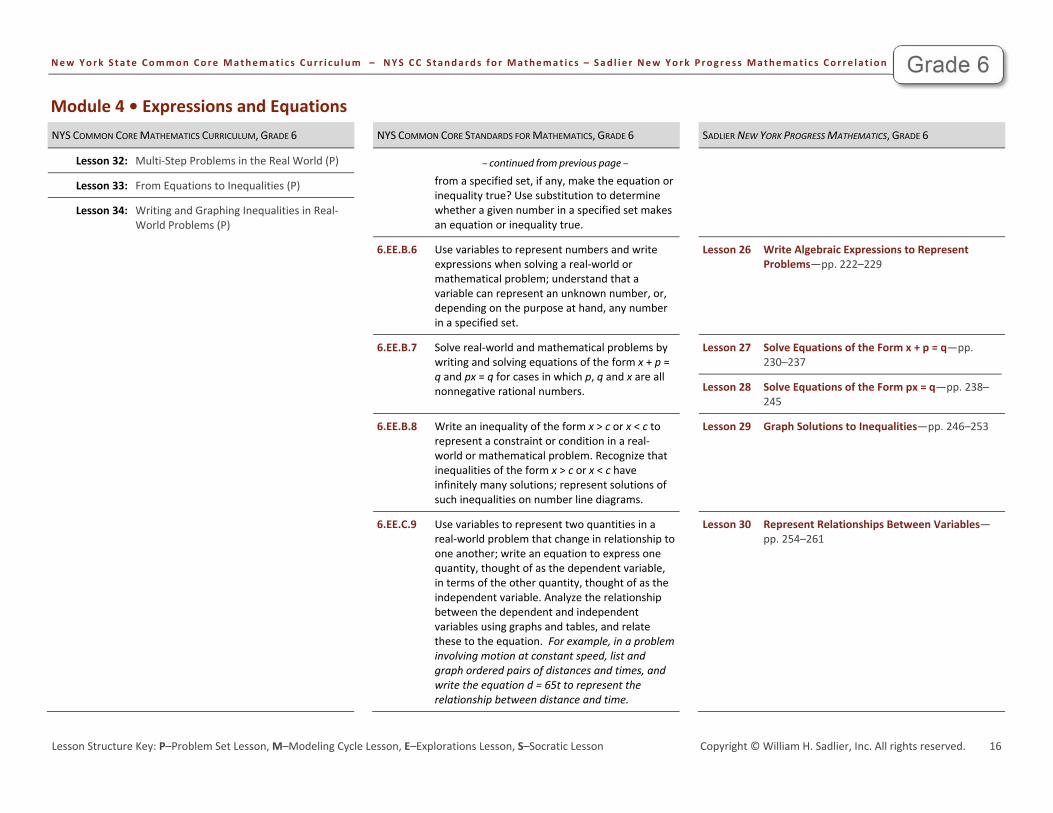
Lesson 32: Multi‐Step Problems in the Real World (P)
Lesson 33: From Equations to Inequalities (P)
Lesson 34: Writing and Graphing Inequalities in Real‐World Problems (P)
– continued from previous page –
from a specified set, if any, make the equation or inequality true? Use substitution to determine whether a given number in a specified set makes an equation or inequality true.
6.EE.B.6
Use variables to represent numbers and write expressions when solving a real‐world or mathematical problem; understand that a variable can represent an unknown number, or, depending on the purpose at hand, any number in a specified set.
Lesson 26 Write Algebraic Expressions to Represent Problems—pp. 222–229
6.EE.B.7
Solve real‐world and mathematical problems by writing and solving equations of the form x + p = q and px = q for cases in which p, q and x are all nonnegative rational numbers.
Lesson 27 Solve Equations of the Form x + p = q—pp. 230–237
Lesson 28 Solve Equations of the Form px = q—pp. 238–245
6.EE.B.8
Write an inequality of the form x > c or x < c to represent a constraint or condition in a real‐world or mathematical problem. Recognize that inequalities of the form x > c or x < c have infinitely many solutions; represent solutions of such inequalities on number line diagrams.
Lesson 29 Graph Solutions to Inequalities—pp. 246–253
6.EE.C.9
Use variables to represent two quantities in a real‐world problem that change in relationship to one another; write an equation to express one quantity, thought of as the dependent variable, in terms of the other quantity, thought of as the independent variable. Analyze the relationship between the dependent and independent variables using graphs and tables, and relate these to the equation. For example, in a problem involving motion at constant speed, list and graph ordered pairs of distances and times, and write the equation d = 65t to represent the relationship between distance and time.
Lesson 30 Represent Relationships Between Variables—pp. 254–261

New York Sta te Common Core Mathemat i c s Cur r i cu lum – NYS CC S tanda rds f o r Mathemat i c s – Sad l ie r New York Prog res s Mathemat i c s Cor re la t ion
Lesson Structure Key: P–Problem Set Lesson, M–Modeling Cycle Lesson, E–Explorations Lesson, S–Socratic Lesson Copyright © William H. Sadlier, Inc. All rights reserved. 17
Module 4 • Expressions and Equations NYS COMMON CORE MATHEMATICS CURRICULUM, GRADE 6 NYS COMMON CORE STANDARDS FOR MATHEMATICS, GRADE 6 SADLIER NEW YORK PROGRESS MATHEMATICS, GRADE 6
End‐of‐Module Assessment and Rubric Topics A through H (assessment 1 day, return 1 day, remediation or further applications 4 days)
New York Sta te Common Core Mathemat i c s Cur r i cu lum – NYS CC S tanda rds f o r Mathemat i c s – Sad l ie r New York Prog res s Mathemat i c s Cor re la t ion
Lesson Structure Key: P–Problem Set Lesson, M–Modeling Cycle Lesson, E–Explorations Lesson, S–Socratic Lesson Copyright © William H. Sadlier, Inc. All rights reserved. 18
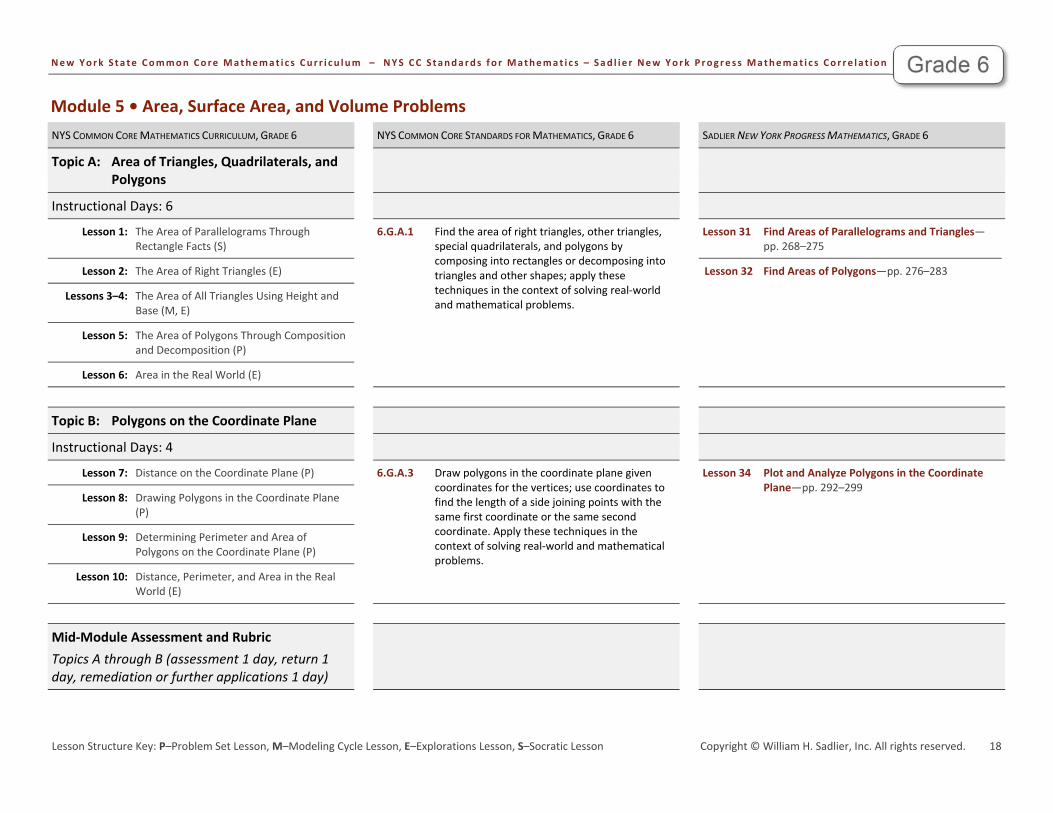
Module 5 • Area, Surface Area, and Volume Problems NYS COMMON CORE MATHEMATICS CURRICULUM, GRADE 6 NYS COMMON CORE STANDARDS FOR MATHEMATICS, GRADE 6 SADLIER NEW YORK PROGRESS MATHEMATICS, GRADE 6
Topic A: Area of Triangles, Quadrilaterals, and Polygons
Instructional Days: 6
Lesson 1: The Area of Parallelograms Through Rectangle Facts (S)
Lesson 2: The Area of Right Triangles (E)
Lessons 3–4: The Area of All Triangles Using Height and Base (M, E)
Lesson 5: The Area of Polygons Through Composition and Decomposition (P)
Lesson 6: Area in the Real World (E)
6.G.A.1 Find the area of right triangles, other triangles, special quadrilaterals, and polygons by composing into rectangles or decomposing into triangles and other shapes; apply these techniques in the context of solving real‐world and mathematical problems.
Lesson 31 Find Areas of Parallelograms and Triangles—pp. 268–275
Lesson 32 Find Areas of Polygons—pp. 276–283
Topic B: Polygons on the Coordinate Plane
Instructional Days: 4
Lesson 7: Distance on the Coordinate Plane (P)
Lesson 8: Drawing Polygons in the Coordinate Plane (P)
Lesson 9: Determining Perimeter and Area of Polygons on the Coordinate Plane (P)
Lesson 10: Distance, Perimeter, and Area in the Real World (E)
6.G.A.3 Draw polygons in the coordinate plane given coordinates for the vertices; use coordinates to find the length of a side joining points with the same first coordinate or the same second coordinate. Apply these techniques in the context of solving real‐world and mathematical problems.
Lesson 34 Plot and Analyze Polygons in the Coordinate Plane—pp. 292–299
Mid‐Module Assessment and Rubric Topics A through B (assessment 1 day, return 1 day, remediation or further applications 1 day)

New York Sta te Common Core Mathemat i c s Cur r i cu lum – NYS CC S tanda rds f o r Mathemat i c s – Sad l ie r New York Prog res s Mathemat i c s Cor re la t ion
Lesson Structure Key: P–Problem Set Lesson, M–Modeling Cycle Lesson, E–Explorations Lesson, S–Socratic Lesson Copyright © William H. Sadlier, Inc. All rights reserved. 19
Module 5 • Area, Surface Area, and Volume Problems NYS COMMON CORE MATHEMATICS CURRICULUM, GRADE 6 NYS COMMON CORE STANDARDS FOR MATHEMATICS, GRADE 6 SADLIER NEW YORK PROGRESS MATHEMATICS, GRADE 6
Topic C: Volume of Right Rectangular Prisms
Instructional Days: 4
Lesson 11: Volume with Fractional Edge Lengths and Unit Cubes (P)
Lesson 12: From Unit Cubes to the Formulas for Volume (P)
Lesson 13: The Formulas for Volume (P)
Lesson 14: Volume in the Real World (P)
6.G.A.2 Find the volume of a right rectangular prism with fractional edge lengths by packing it with unit cubes of the appropriate unit fraction edge lengths, and show that the volume is the same as would be found by multiplying the edge lengths of the prism. Apply the formulas V = l w h and V = b h to find volumes of right rectangular prisms with fractional edge lengths in the context of solving real‐world and mathematical problems.
Lesson 33 Find Volumes of Rectangular Prisms—pp. 284–291
Topic D: Nets and Surface Area
Instructional Days: 5
Lesson 15: Representing Three‐Dimensional Figures Using Nets (M)
Lesson 16: Constructing Nets (E)
Lesson 17: From Nets to Surface Area (P)
Lesson 18: Determining Surface Area of Three‐Dimensional Figures (P)
Lesson 19: Surface Area and Volume in the Real World (P)
Lesson 20: Addendum Lesson for Modeling―Applying Surface Area and Volume to Aquariums (Optional) (M)
6.G.A.2 Find the volume of a right rectangular prism with fractional edge lengths by packing it with unit cubes of the appropriate unit fraction edge lengths, and show that the volume is the same as would be found by multiplying the edge lengths of the prism. Apply the formulas V = l w h and V = b h to find volumes of right rectangular prisms with fractional edge lengths in the context of solving real‐world and mathematical problems.
Lesson 33 Find Volumes of Rectangular Prisms—pp. 284–291
6.G.A.4 Represent three‐dimensional figures using nets made up of rectangles and triangles, and use the nets to find the surface area of these figures. Apply these techniques in the context of solving real‐world and mathematical problems.
Lesson 35 Use Nets to Find Surface Area—pp. 300–307
End‐of‐Module Assessment and Rubric Topics C through D (assessment 1 day, return 1 day, remediation or further applications 1 day)
New York Sta te Common Core Mathemat i c s Cur r i cu lum – NYS CC S tanda rds f o r Mathemat i c s – Sad l ie r New York Prog res s Mathemat i c s Cor re la t ion
Lesson Structure Key: P–Problem Set Lesson, M–Modeling Cycle Lesson, E–Explorations Lesson, S–Socratic Lesson Copyright © William H. Sadlier, Inc. All rights reserved. 20
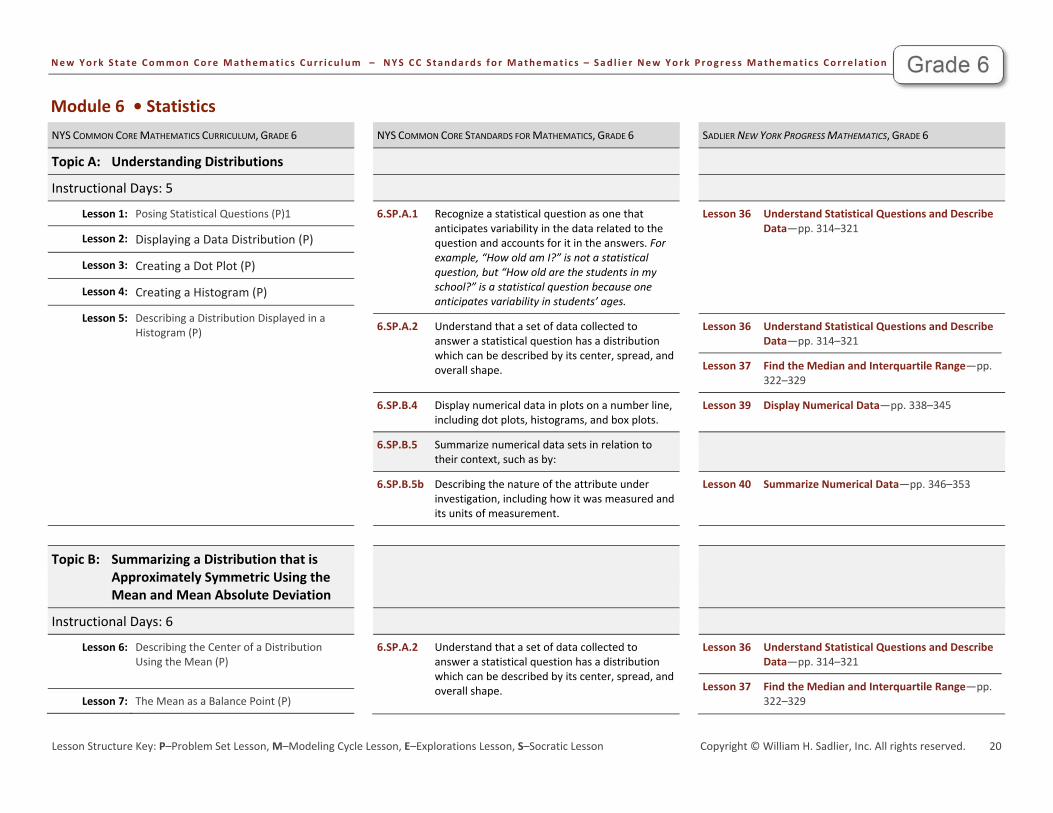
Module 6 • Statistics NYS COMMON CORE MATHEMATICS CURRICULUM, GRADE 6 NYS COMMON CORE STANDARDS FOR MATHEMATICS, GRADE 6 SADLIER NEW YORK PROGRESS MATHEMATICS, GRADE 6
Topic A: Understanding Distributions
Instructional Days: 5
Lesson 1: Posing Statistical Questions (P)1
Lesson 2: Displaying a Data Distribution (P)
Lesson 3: Creating a Dot Plot (P)
Lesson 4: Creating a Histogram (P)
Lesson 5: Describing a Distribution Displayed in a Histogram (P)
6.SP.A.1
Recognize a statistical question as one that anticipates variability in the data related to the question and accounts for it in the answers. For example, “How old am I?” is not a statistical question, but “How old are the students in my school?” is a statistical question because one anticipates variability in students’ ages.
Lesson 36 Understand Statistical Questions and Describe Data—pp. 314–321
6.SP.A.2
Understand that a set of data collected to answer a statistical question has a distribution which can be described by its center, spread, and overall shape.
Lesson 36 Understand Statistical Questions and Describe Data—pp. 314–321
Lesson 37 Find the Median and Interquartile Range—pp. 322–329
6.SP.B.4
Display numerical data in plots on a number line, including dot plots, histograms, and box plots.
Lesson 39 Display Numerical Data—pp. 338–345
6.SP.B.5
Summarize numerical data sets in relation to their context, such as by:
6.SP.B.5b
Describing the nature of the attribute under investigation, including how it was measured and its units of measurement.
Lesson 40 Summarize Numerical Data—pp. 346–353
Topic B: Summarizing a Distribution that is
Approximately Symmetric Using the Mean and Mean Absolute Deviation
Instructional Days: 6
Lesson 6: Describing the Center of a Distribution Using the Mean (P)
Lesson 7: The Mean as a Balance Point (P)
6.SP.A.2
Understand that a set of data collected to answer a statistical question has a distribution which can be described by its center, spread, and overall shape.
Lesson 36 Understand Statistical Questions and Describe Data—pp. 314–321
Lesson 37 Find the Median and Interquartile Range—pp. 322–329
New York Sta te Common Core Mathemat i c s Cur r i cu lum – NYS CC S tanda rds f o r Mathemat i c s – Sad l ie r New York Prog res s Mathemat i c s Cor re la t ion
Lesson Structure Key: P–Problem Set Lesson, M–Modeling Cycle Lesson, E–Explorations Lesson, S–Socratic Lesson Copyright © William H. Sadlier, Inc. All rights reserved. 21
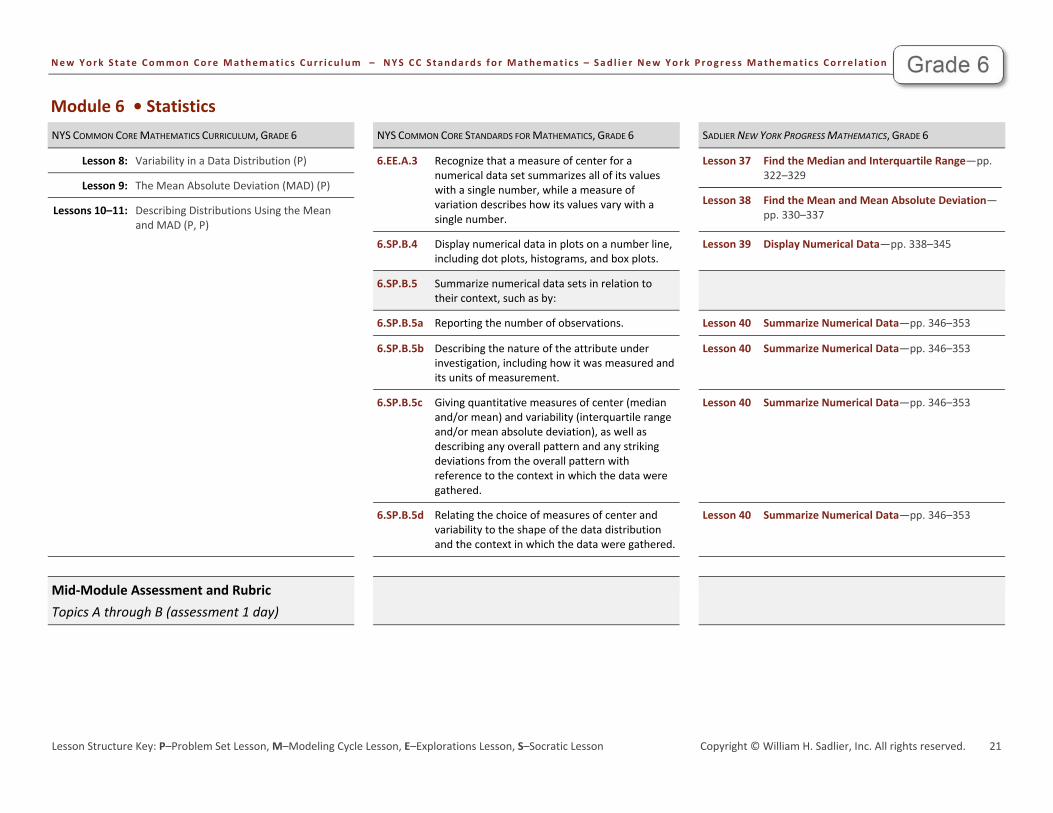
Module 6 • Statistics NYS COMMON CORE MATHEMATICS CURRICULUM, GRADE 6 NYS COMMON CORE STANDARDS FOR MATHEMATICS, GRADE 6 SADLIER NEW YORK PROGRESS MATHEMATICS, GRADE 6
Lesson 8: Variability in a Data Distribution (P)
Lesson 9: The Mean Absolute Deviation (MAD) (P)
Lessons 10–11: Describing Distributions Using the Mean and MAD (P, P)
6.EE.A.3
Recognize that a measure of center for a numerical data set summarizes all of its values with a single number, while a measure of variation describes how its values vary with a single number.
Lesson 37 Find the Median and Interquartile Range—pp. 322–329
Lesson 38 Find the Mean and Mean Absolute Deviation—pp. 330–337
6.SP.B.4
Display numerical data in plots on a number line, including dot plots, histograms, and box plots.
Lesson 39 Display Numerical Data—pp. 338–345
6.SP.B.5
Summarize numerical data sets in relation to their context, such as by:
6.SP.B.5a Reporting the number of observations.
Lesson 40 Summarize Numerical Data—pp. 346–353
6.SP.B.5b
Describing the nature of the attribute under investigation, including how it was measured and its units of measurement.
Lesson 40 Summarize Numerical Data—pp. 346–353
6.SP.B.5c
Giving quantitative measures of center (median and/or mean) and variability (interquartile range and/or mean absolute deviation), as well as describing any overall pattern and any striking deviations from the overall pattern with reference to the context in which the data were gathered.
Lesson 40 Summarize Numerical Data—pp. 346–353
6.SP.B.5d
Relating the choice of measures of center and variability to the shape of the data distribution and the context in which the data were gathered.
Lesson 40 Summarize Numerical Data—pp. 346–353
Mid‐Module Assessment and Rubric Topics A through B (assessment 1 day)
New York Sta te Common Core Mathemat i c s Cur r i cu lum – NYS CC S tanda rds f o r Mathemat i c s – Sad l ie r New York Prog res s Mathemat i c s Cor re la t ion
Lesson Structure Key: P–Problem Set Lesson, M–Modeling Cycle Lesson, E–Explorations Lesson, S–Socratic Lesson Copyright © William H. Sadlier, Inc. All rights reserved. 22
Module 6 • Statistics NYS COMMON CORE MATHEMATICS CURRICULUM, GRADE 6 NYS COMMON CORE STANDARDS FOR MATHEMATICS, GRADE 6 SADLIER NEW YORK PROGRESS MATHEMATICS, GRADE 6
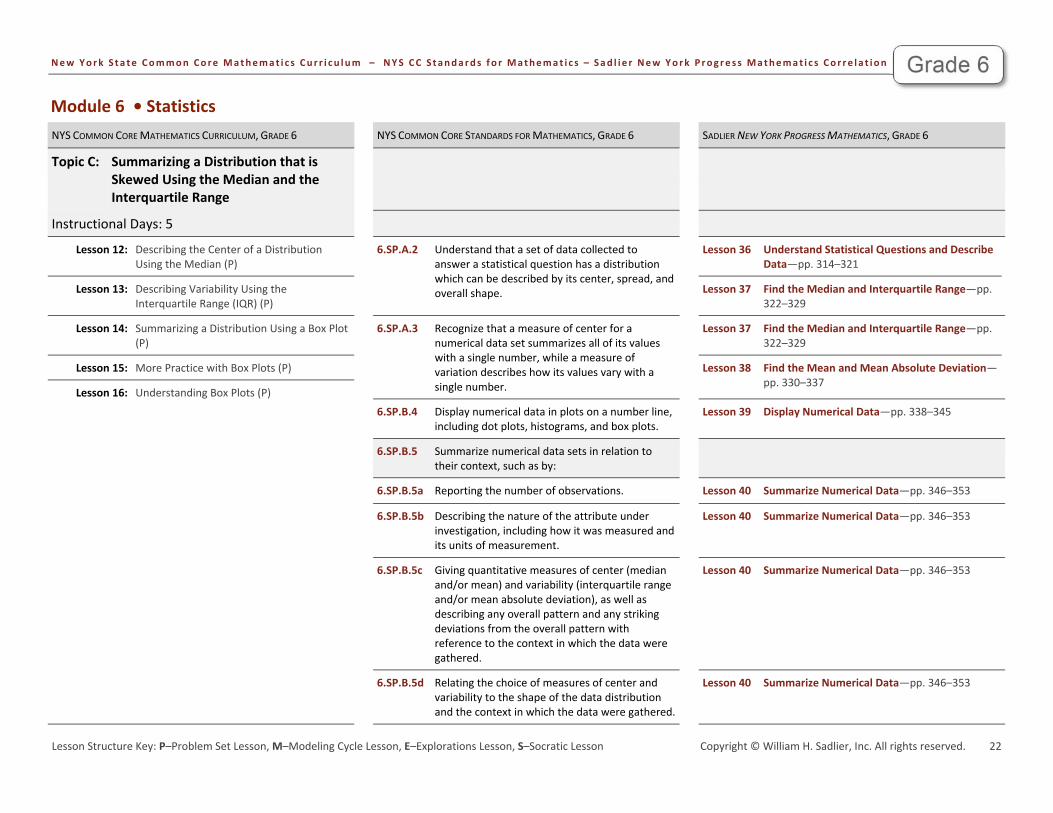
Topic C: Summarizing a Distribution that is Skewed Using the Median and the Interquartile Range
Instructional Days: 5
Lesson 12: Describing the Center of a Distribution Using the Median (P)
Lesson 13: Describing Variability Using the Interquartile Range (IQR) (P)
Lesson 14: Summarizing a Distribution Using a Box Plot (P)
Lesson 15: More Practice with Box Plots (P)
Lesson 16: Understanding Box Plots (P)
6.SP.A.2
Understand that a set of data collected to answer a statistical question has a distribution which can be described by its center, spread, and overall shape.
Lesson 36 Understand Statistical Questions and Describe Data—pp. 314–321
Lesson 37 Find the Median and Interquartile Range—pp. 322–329
6.SP.A.3
Recognize that a measure of center for a numerical data set summarizes all of its values with a single number, while a measure of variation describes how its values vary with a single number.
Lesson 37 Find the Median and Interquartile Range—pp. 322–329
Lesson 38 Find the Mean and Mean Absolute Deviation—pp. 330–337
6.SP.B.4
Display numerical data in plots on a number line, including dot plots, histograms, and box plots.
Lesson 39 Display Numerical Data—pp. 338–345
6.SP.B.5
Summarize numerical data sets in relation to their context, such as by:
6.SP.B.5a Reporting the number of observations.
Lesson 40 Summarize Numerical Data—pp. 346–353
6.SP.B.5b
Describing the nature of the attribute under investigation, including how it was measured and its units of measurement.
Lesson 40 Summarize Numerical Data—pp. 346–353
6.SP.B.5c
Giving quantitative measures of center (median and/or mean) and variability (interquartile range and/or mean absolute deviation), as well as describing any overall pattern and any striking deviations from the overall pattern with reference to the context in which the data were gathered.
Lesson 40 Summarize Numerical Data—pp. 346–353
6.SP.B.5d
Relating the choice of measures of center and variability to the shape of the data distribution and the context in which the data were gathered.
Lesson 40 Summarize Numerical Data—pp. 346–353
New York Sta te Common Core Mathemat i c s Cur r i cu lum – NYS CC S tanda rds f o r Mathemat i c s – Sad l ie r New York Prog res s Mathemat i c s Cor re la t ion
Lesson Structure Key: P–Problem Set Lesson, M–Modeling Cycle Lesson, E–Explorations Lesson, S–Socratic Lesson Copyright © William H. Sadlier, Inc. All rights reserved. 23
Module 6 • Statistics NYS COMMON CORE MATHEMATICS CURRICULUM, GRADE 6 NYS COMMON CORE STANDARDS FOR MATHEMATICS, GRADE 6 SADLIER NEW YORK PROGRESS MATHEMATICS, GRADE 6
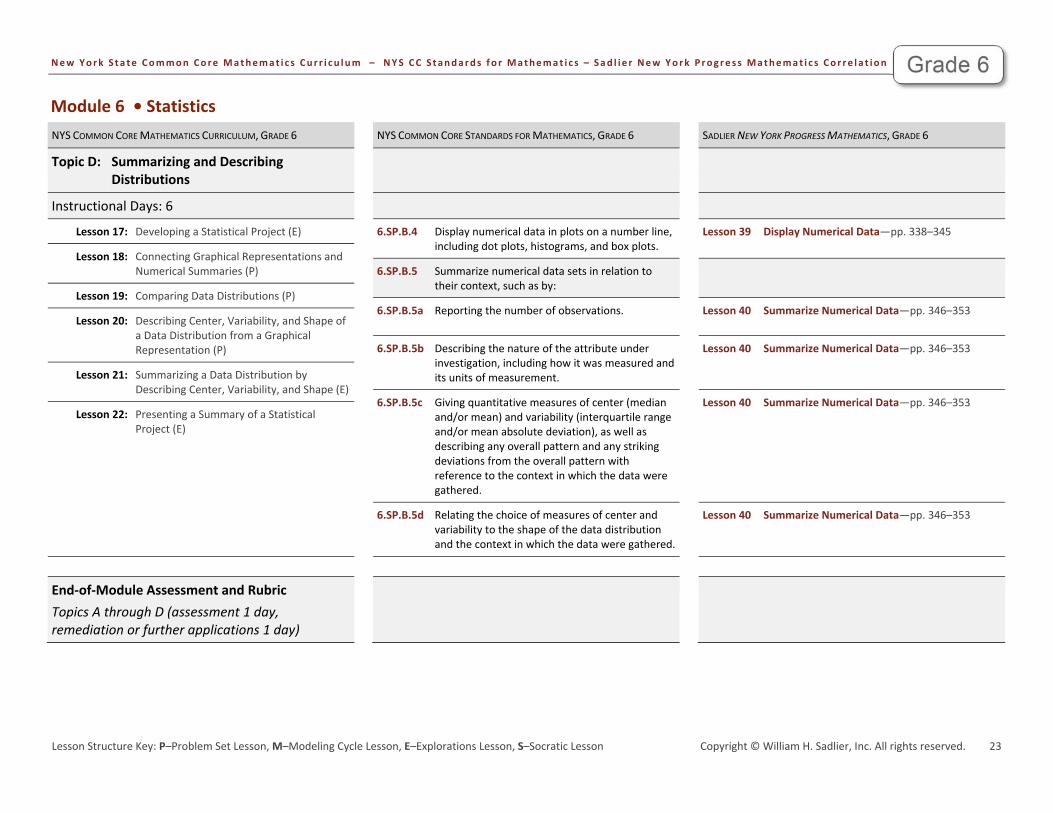
Topic D: Summarizing and Describing Distributions
Instructional Days: 6
Lesson 17: Developing a Statistical Project (E)
Lesson 18: Connecting Graphical Representations and Numerical Summaries (P)
Lesson 19: Comparing Data Distributions (P)
Lesson 20: Describing Center, Variability, and Shape of a Data Distribution from a Graphical Representation (P)
Lesson 21: Summarizing a Data Distribution by Describing Center, Variability, and Shape (E)
Lesson 22: Presenting a Summary of a Statistical Project (E)
6.SP.B.4
Display numerical data in plots on a number line, including dot plots, histograms, and box plots.
Lesson 39 Display Numerical Data—pp. 338–345
6.SP.B.5
Summarize numerical data sets in relation to their context, such as by:
6.SP.B.5a
Reporting the number of observations. Lesson 40 Summarize Numerical Data—pp. 346–353
6.SP.B.5b
Describing the nature of the attribute under investigation, including how it was measured and its units of measurement.
Lesson 40 Summarize Numerical Data—pp. 346–353
6.SP.B.5c
Giving quantitative measures of center (median and/or mean) and variability (interquartile range and/or mean absolute deviation), as well as describing any overall pattern and any striking deviations from the overall pattern with reference to the context in which the data were gathered.
Lesson 40 Summarize Numerical Data—pp. 346–353
6.SP.B.5d
Relating the choice of measures of center and variability to the shape of the data distribution and the context in which the data were gathered.
Lesson 40 Summarize Numerical Data—pp. 346–353
End‐of‐Module Assessment and Rubric Topics A through D (assessment 1 day, remediation or further applications 1 day)