safe and environmentally responsible development--america
TRANSCRIPT

Clean, Abundant, and Secure in the United States Safe and Environmentally Responsible Development America’s Shale Resources
Erik Milito, Group Director, API Upstream & Industry Operations Presented to the DOE Hydrogen and Fuel Cell Technology Advisory Committee
Washington DC, November, 2012
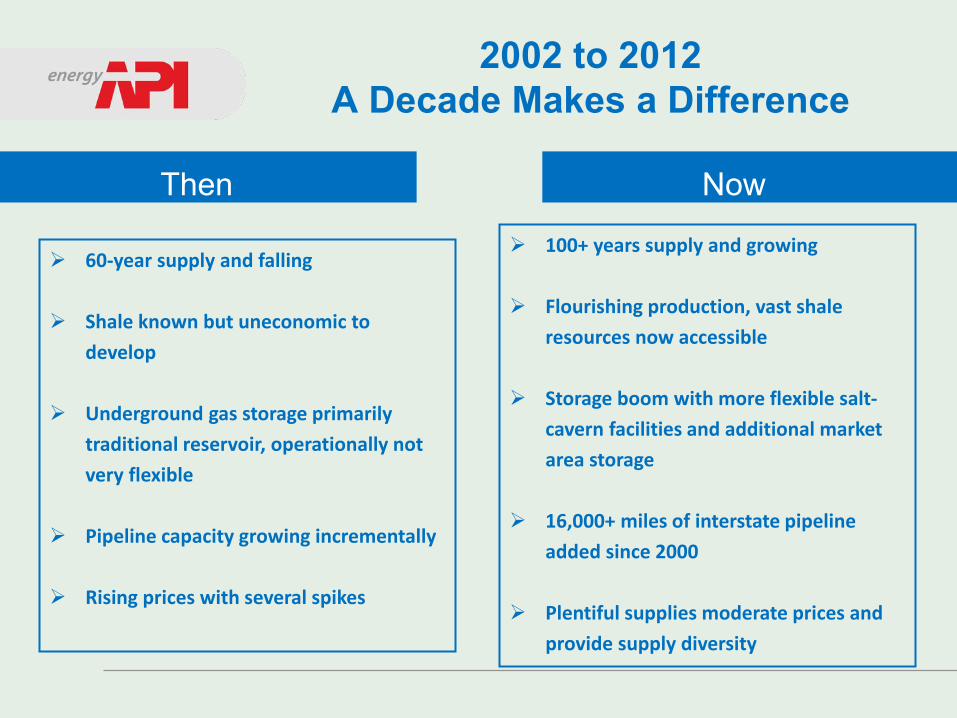
2002 to 2012 A Decade Makes a Difference
Then Now
60-year supply and falling
Shale known but uneconomic to develop
Underground gas storage primarily traditional reservoir, operationally not very flexible
Pipeline capacity growing incrementally
Rising prices with several spikes
100+ years supply and growing
Flourishing production, vast shale resources now accessible
Storage boom with more flexible salt-cavern facilities and additional market area storage
16,000+ miles of interstate pipeline added since 2000
Plentiful supplies moderate prices and provide supply diversity
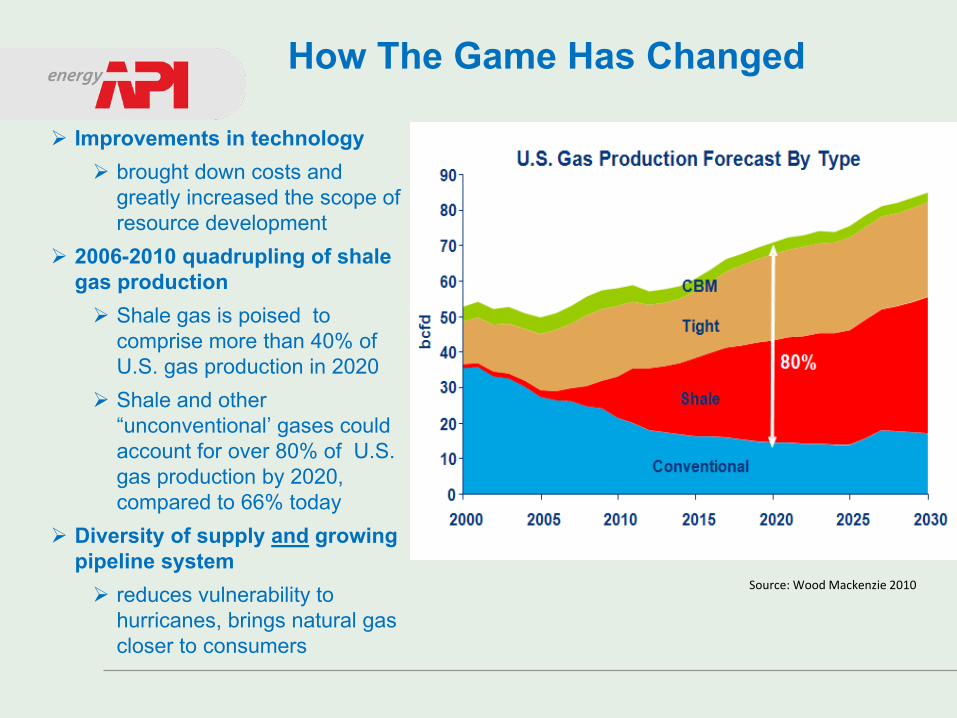
How The Game Has Changed
Improvements in technology brought down costs and
greatly increased the scope of resource development
2006-2010 quadrupling of shale gas production Shale gas is poised to
comprise more than 40% of U.S. gas production in 2020
Shale and other “unconventional’ gases could account for over 80% of U.S. gas production by 2020, compared to 66% today
Diversity of supply and growing pipeline system reduces vulnerability to
hurricanes, brings natural gas closer to consumers
Source: Wood Mackenzie 2010
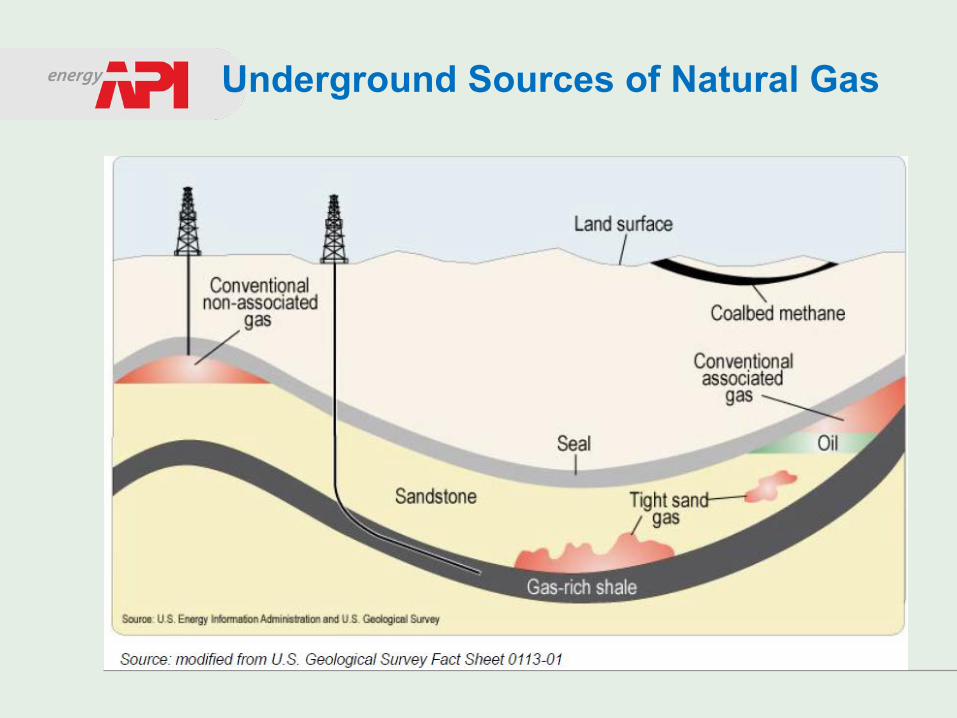
Underground Sources of Natural Gas
1220 L Street, NW • Washington, DC 20005-4070 • www.api.org
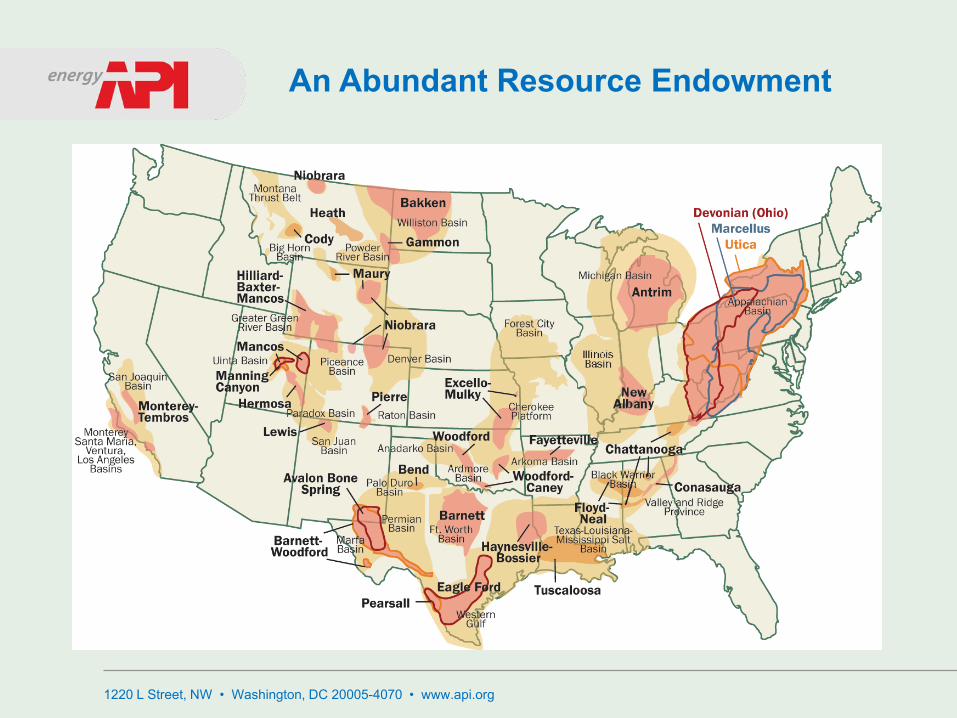
An Abundant Resource Endowment
1220 L Street, NW • Washington, DC 20005-4070 • www.api.org 6
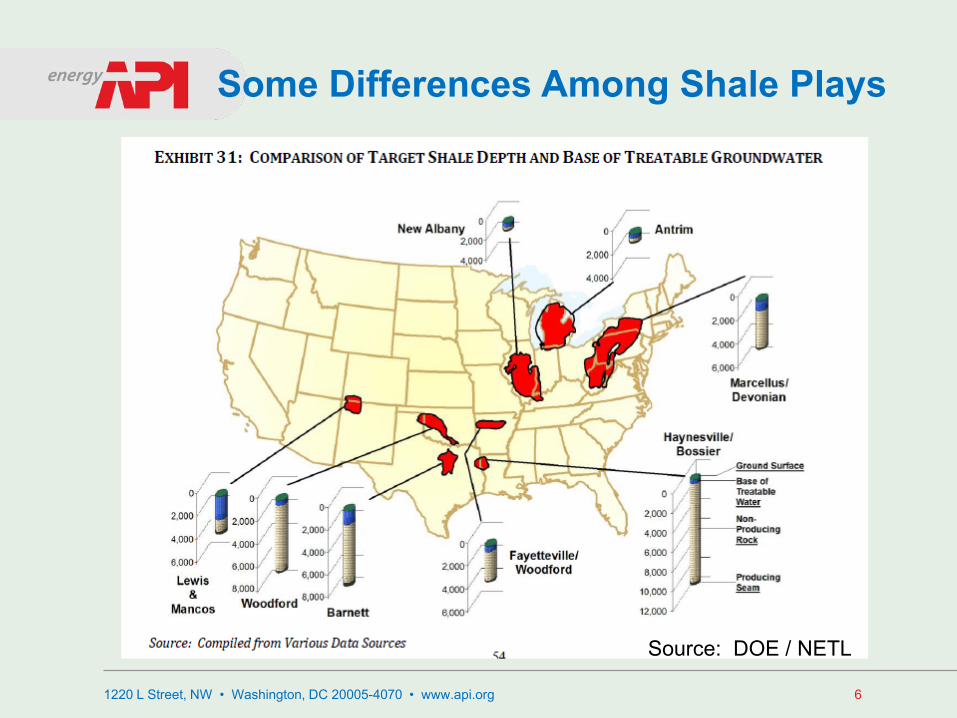
Some Differences Among Shale Plays
Source: DOE / NETL
1220 L Street, NW • Washington, DC 20005-4070 • www.api.org 7
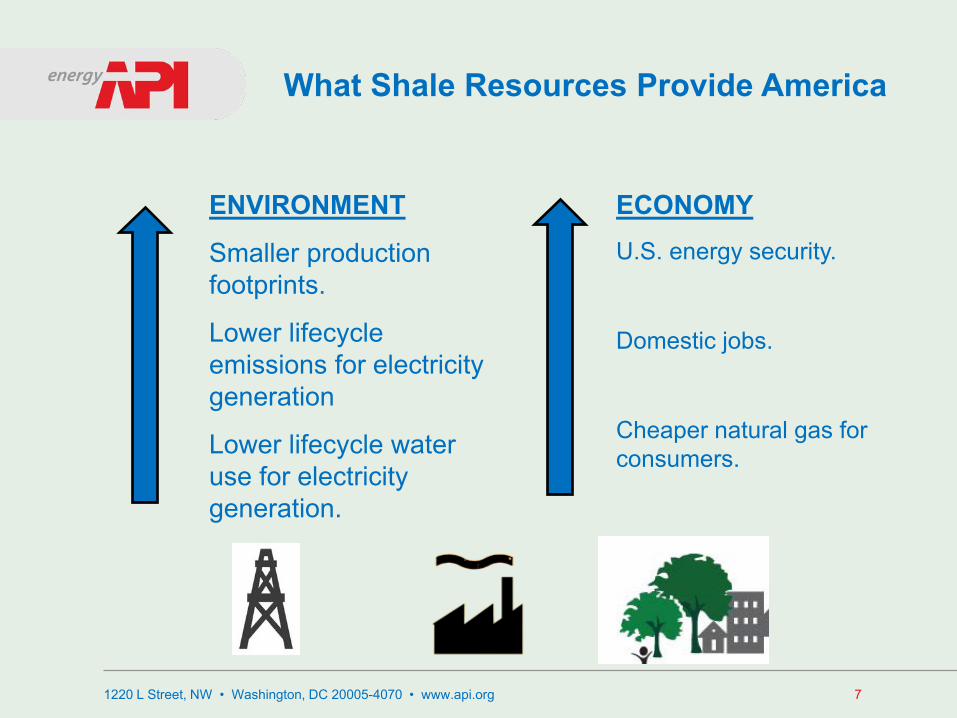
What Shale Resources Provide America
ENVIRONMENT
Smaller production footprints.
Lower lifecycle emissions for electricity generation
Lower lifecycle water use for electricity generation.
ECONOMY U.S. energy security.
Domestic jobs.
Cheaper natural gas for consumers.
Keys to Exploration Success
1220 L Street, NW • Washington, DC 20005-4070 • www.api.org
Proper Well Construction
Effective Community Engagement
Safe Operations
Prevention of Pollution Appropriate Site Footprint Impacts Controlled or Mitigated Efficient Development of Resource
Include:
1220 L Street, NW • Washington, DC 20005-4070 • www.api.org 9
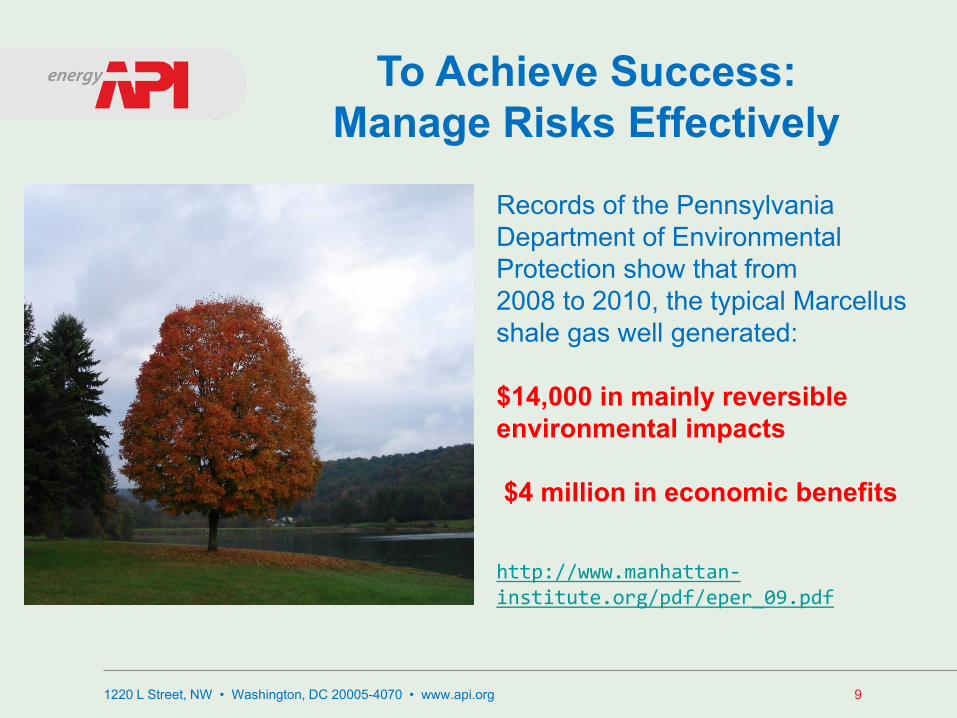
To Achieve Success: Manage Risks Effectively
Records of the Pennsylvania Department of Environmental Protection show that from 2008 to 2010, the typical Marcellus shale gas well generated: $14,000 in mainly reversible environmental impacts $4 million in economic benefits http://www.manhattan-institute.org/pdf/eper_09.pdf
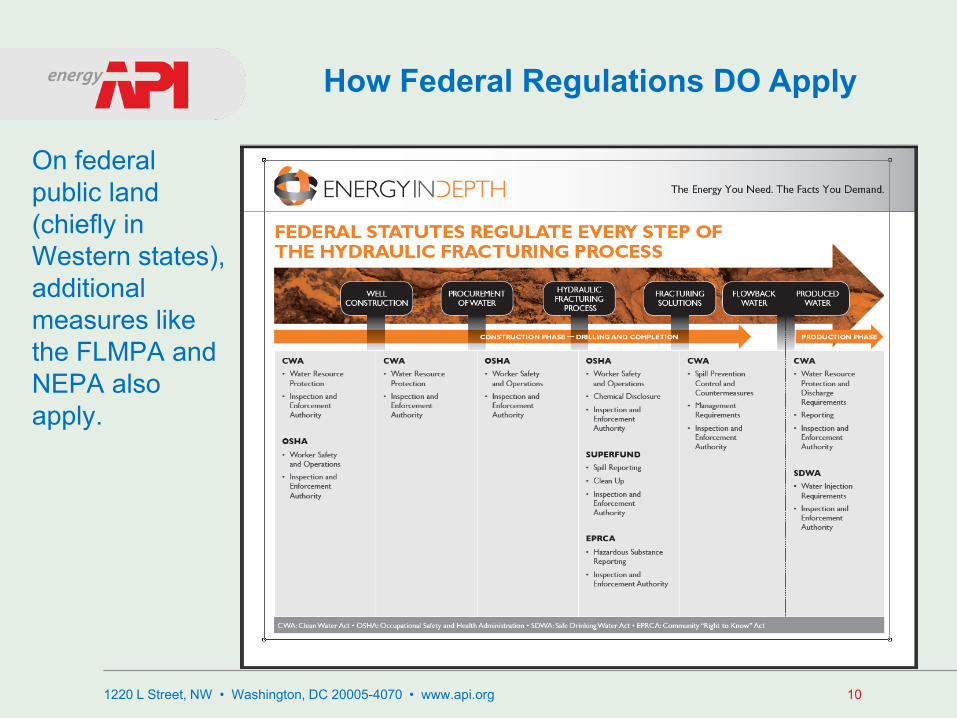
On federal public land (chiefly in Western states), additional measures like the FLMPA and NEPA also apply.
1220 L Street, NW • Washington, DC 20005-4070 • www.api.org 10
How Federal Regulations DO Apply
1220 L Street, NW • Washington, DC 20005-4070 • www.api.org 11
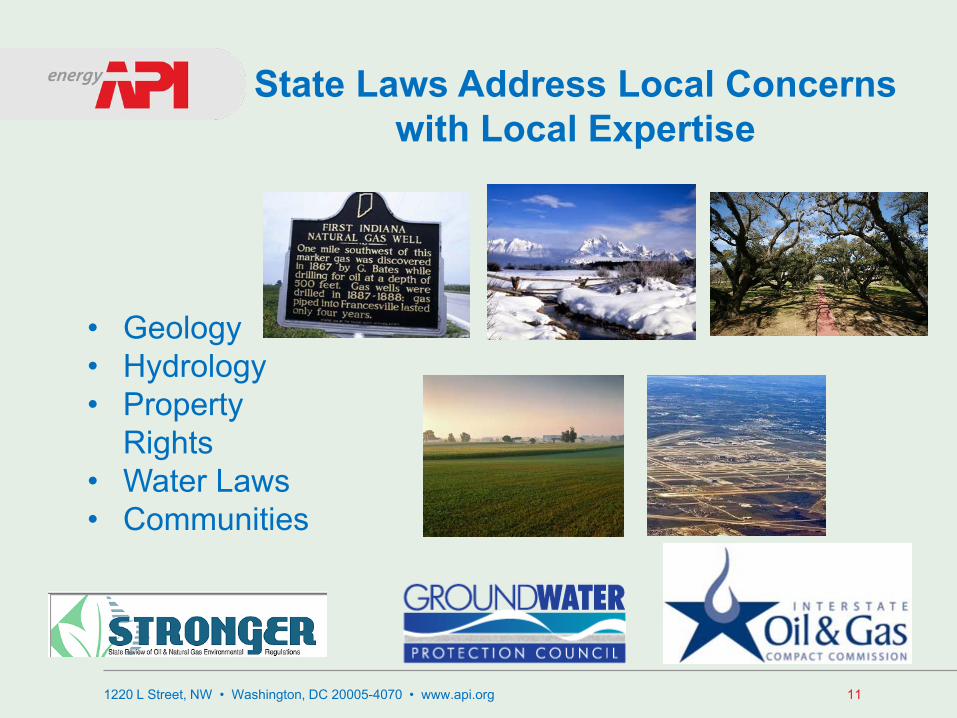
State Laws Address Local Concerns with Local Expertise
• Geology • Hydrology • Property
Rights • Water Laws • Communities
1220 L Street, NW • Washington, DC 20005-4070 • www.api.org 12
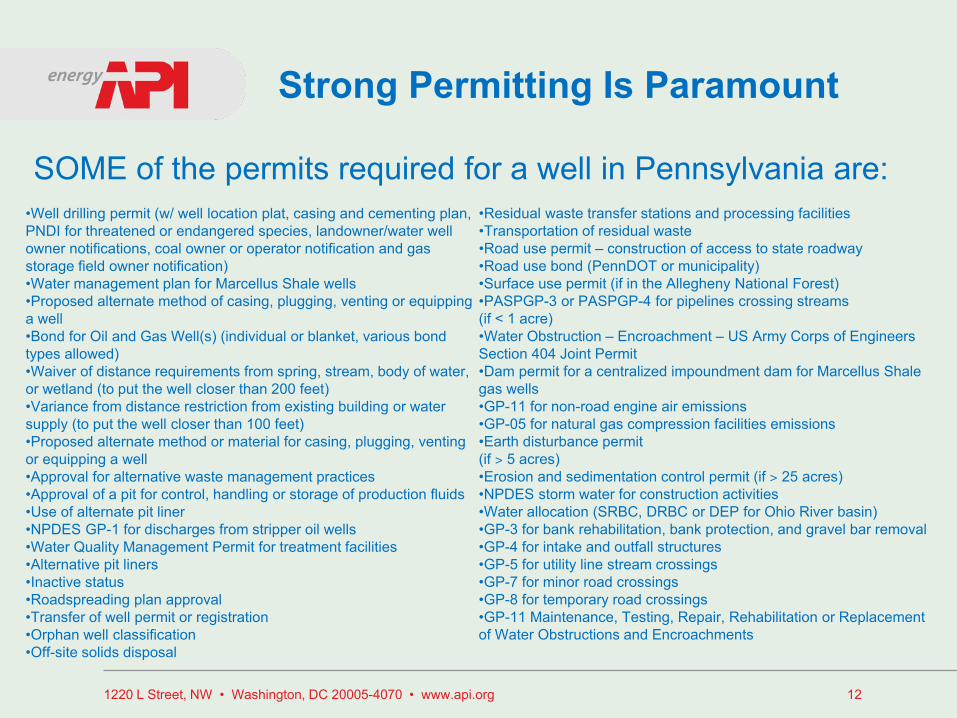
Strong Permitting Is Paramount
•Well drilling permit (w/ well location plat, casing and cementing plan, PNDI for threatened or endangered species, landowner/water well owner notifications, coal owner or operator notification and gas storage field owner notification) •Water management plan for Marcellus Shale wells •Proposed alternate method of casing, plugging, venting or equipping a well •Bond for Oil and Gas Well(s) (individual or blanket, various bond types allowed) •Waiver of distance requirements from spring, stream, body of water, or wetland (to put the well closer than 200 feet) •Variance from distance restriction from existing building or water supply (to put the well closer than 100 feet) •Proposed alternate method or material for casing, plugging, venting or equipping a well •Approval for alternative waste management practices •Approval of a pit for control, handling or storage of production fluids •Use of alternate pit liner •NPDES GP-1 for discharges from stripper oil wells •Water Quality Management Permit for treatment facilities •Alternative pit liners •Inactive status •Roadspreading plan approval •Transfer of well permit or registration •Orphan well classification •Off-site solids disposal
•Residual waste transfer stations and processing facilities •Transportation of residual waste •Road use permit – construction of access to state roadway •Road use bond (PennDOT or municipality) •Surface use permit (if in the Allegheny National Forest) •PASPGP-3 or PASPGP-4 for pipelines crossing streams (if < 1 acre) •Water Obstruction – Encroachment – US Army Corps of Engineers Section 404 Joint Permit •Dam permit for a centralized impoundment dam for Marcellus Shale gas wells •GP-11 for non-road engine air emissions •GP-05 for natural gas compression facilities emissions •Earth disturbance permit (if ˃ 5 acres) •Erosion and sedimentation control permit (if ˃ 25 acres) •NPDES storm water for construction activities •Water allocation (SRBC, DRBC or DEP for Ohio River basin) •GP-3 for bank rehabilitation, bank protection, and gravel bar removal •GP-4 for intake and outfall structures •GP-5 for utility line stream crossings •GP-7 for minor road crossings •GP-8 for temporary road crossings •GP-11 Maintenance, Testing, Repair, Rehabilitation or Replacement of Water Obstructions and Encroachments
SOME of the permits required for a well in Pennsylvania are:
API Standards: 88 Years of Describing Sound Practice
• ~600 technical standards covering all aspects of the oil and natural gas industry
• National Technology Transfer and Advancement Act
– NTTAA requires Federal Agencies to use voluntary consensus standards, encourages participation
• API standards are cited in regulations by agencies including OSHA, EPA, DOT and BSEE
• 100 API standards are cited over 270 times in the U.S. Code of Federal Regulations
– API Standards also widely cited by States
• 184 API standards are cited over 3300 times in state regulations
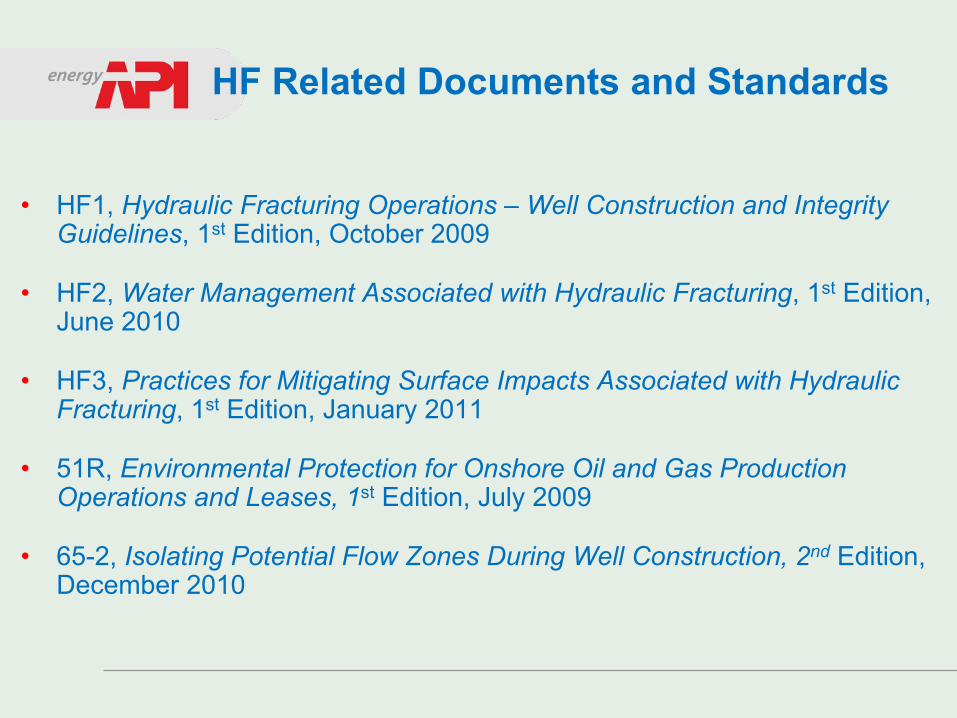
• HF1, Hydraulic Fracturing Operations – Well Construction and Integrity Guidelines, 1st Edition, October 2009
• HF2, Water Management Associated with Hydraulic Fracturing, 1st Edition, June 2010
• HF3, Practices for Mitigating Surface Impacts Associated with Hydraulic Fracturing, 1st Edition, January 2011
• 51R, Environmental Protection for Onshore Oil and Gas Production Operations and Leases, 1st Edition, July 2009
• 65-2, Isolating Potential Flow Zones During Well Construction, 2nd Edition, December 2010
HF Related Documents and Standards
Use of API Standards
• Future Actions: – API has begun work on a “stray gas migration” standard
(RP 90 Part 2) – HF1, HF2, and HF3 included on the 2012 Standards Plan – HF4, “Community Engagement”, is in planning stages – API has provided training on its standards to state
regulators
1220 L Street, NW • Washington, DC 20005-4070 • www.api.org 16
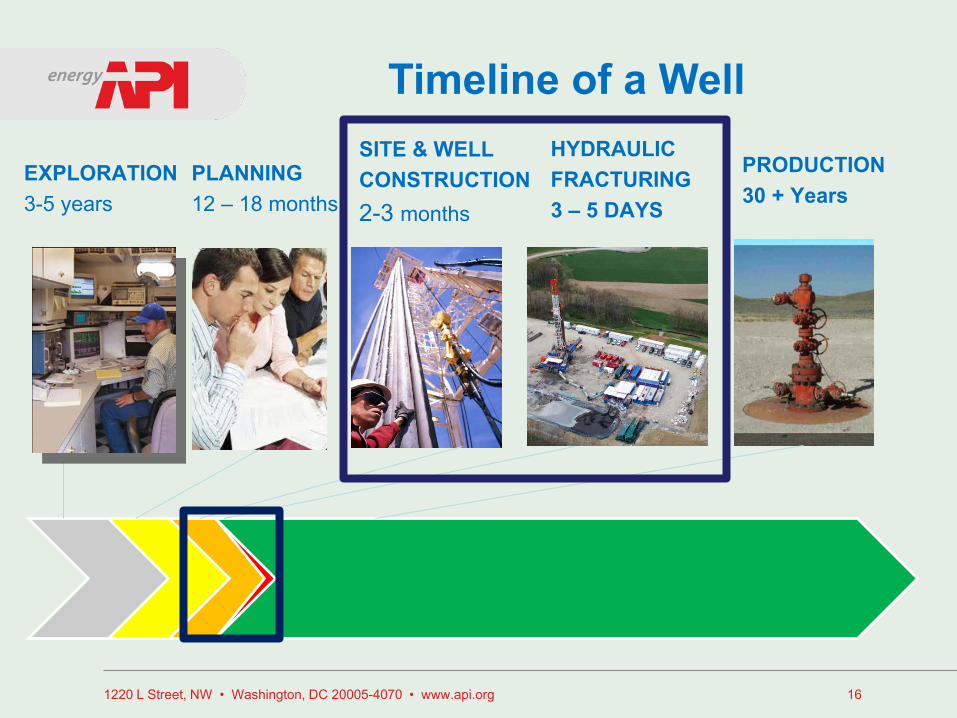
Timeline of a Well HYDRAULIC FRACTURING 3 – 5 DAYS
PLANNING 12 – 18 months
EXPLORATION 3-5 years
SITE & WELL CONSTRUCTION 2-3 months
PRODUCTION 30 + Years
1220 L Street, NW • Washington, DC 20005-4070 • www.api.org 17
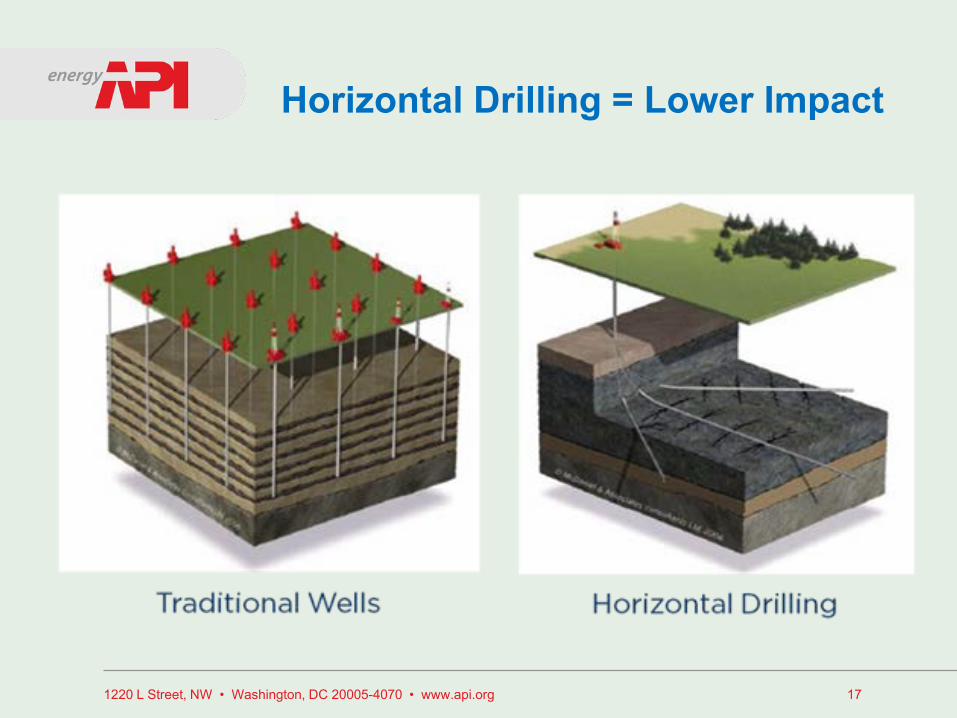
Horizontal Drilling = Lower Impact
1220 L Street, NW • Washington, DC 20005-4070 • www.api.org 18
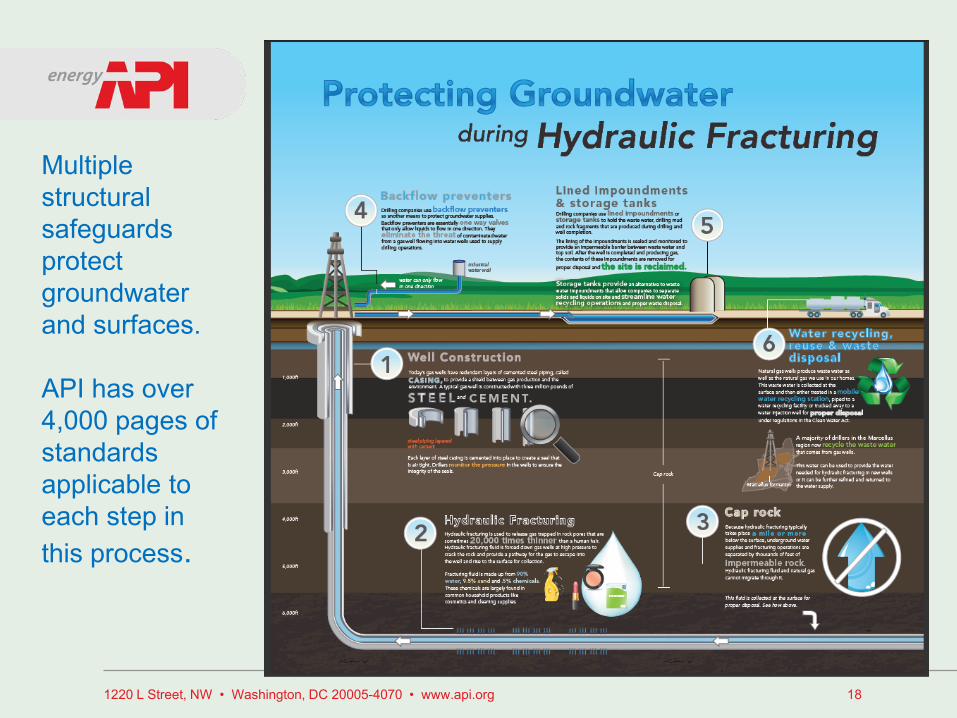
Multiple structural safeguards protect groundwater and surfaces. API has over 4,000 pages of standards applicable to each step in this process.
1220 L Street, NW • Washington, DC 20005-4070 • www.api.org 19
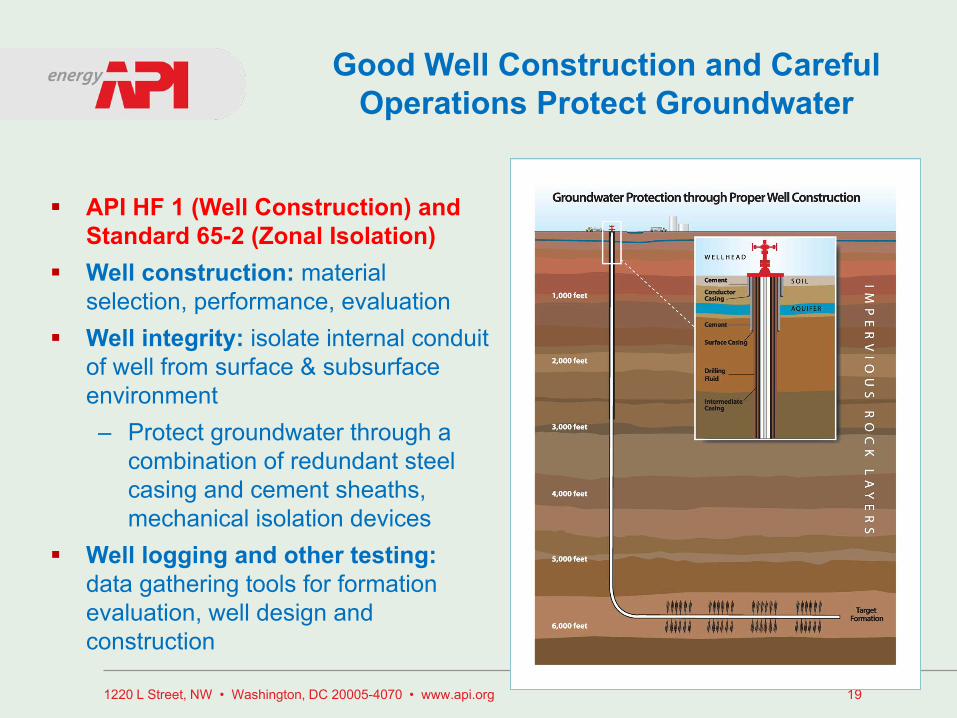
Good Well Construction and Careful Operations Protect Groundwater
API HF 1 (Well Construction) and
Standard 65-2 (Zonal Isolation) Well construction: material
selection, performance, evaluation Well integrity: isolate internal conduit
of well from surface & subsurface environment – Protect groundwater through a
combination of redundant steel casing and cement sheaths, mechanical isolation devices
Well logging and other testing: data gathering tools for formation evaluation, well design and construction
1220 L Street, NW • Washington, DC 20005-4070 • www.api.org 20
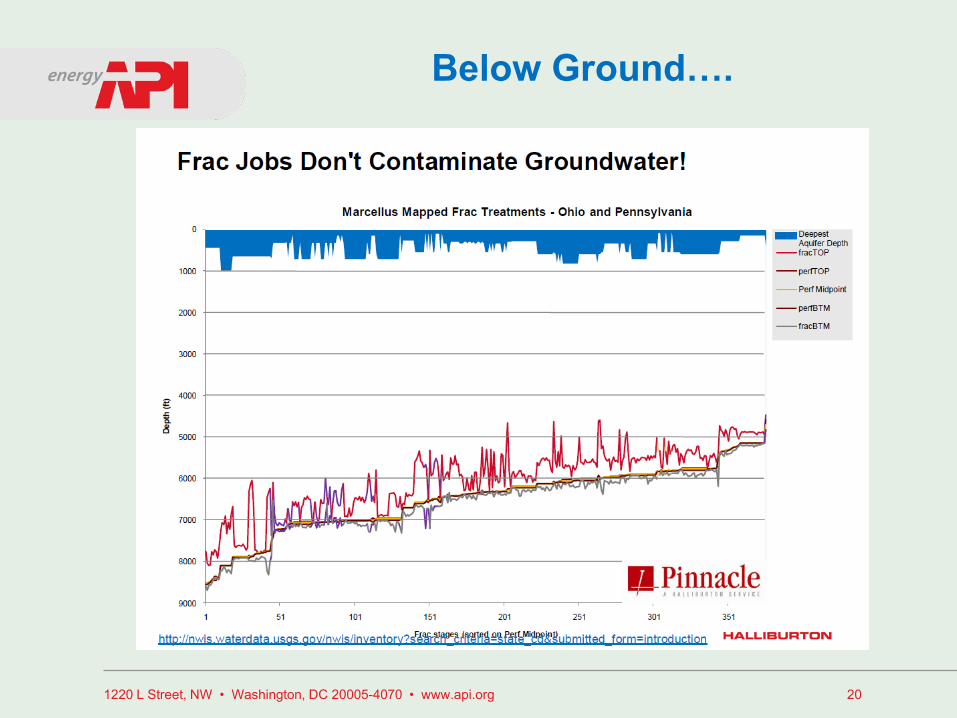
Below Ground….
1220 L Street, NW • Washington, DC 20005-4070 • www.api.org 21
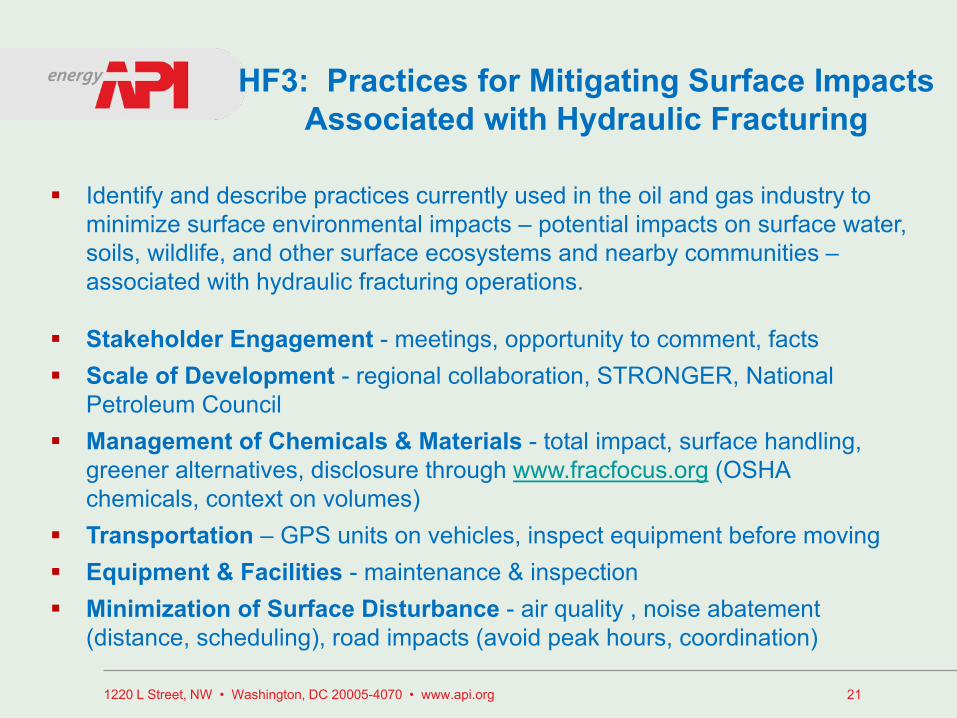
HF3: Practices for Mitigating Surface Impacts Associated with Hydraulic Fracturing
Identify and describe practices currently used in the oil and gas industry to minimize surface environmental impacts – potential impacts on surface water, soils, wildlife, and other surface ecosystems and nearby communities – associated with hydraulic fracturing operations.
Stakeholder Engagement - meetings, opportunity to comment, facts Scale of Development - regional collaboration, STRONGER, National
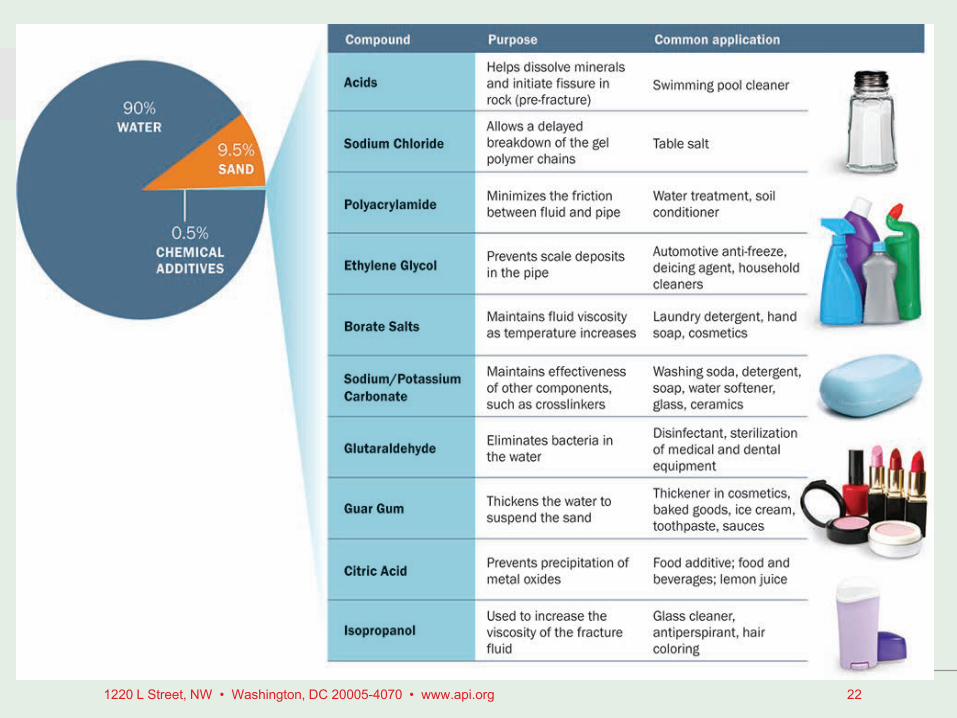
Petroleum Council Management of Chemicals & Materials - total impact, surface handling,
greener alternatives, disclosure through www.fracfocus.org (OSHA chemicals, context on volumes)
Transportation – GPS units on vehicles, inspect equipment before moving Equipment & Facilities - maintenance & inspection Minimization of Surface Disturbance - air quality , noise abatement
(distance, scheduling), road impacts (avoid peak hours, coordination)
1220 L Street, NW • Washington, DC 20005-4070 • www.api.org 22
1220 L Street, NW • Washington, DC 20005-4070 • www.api.org 23
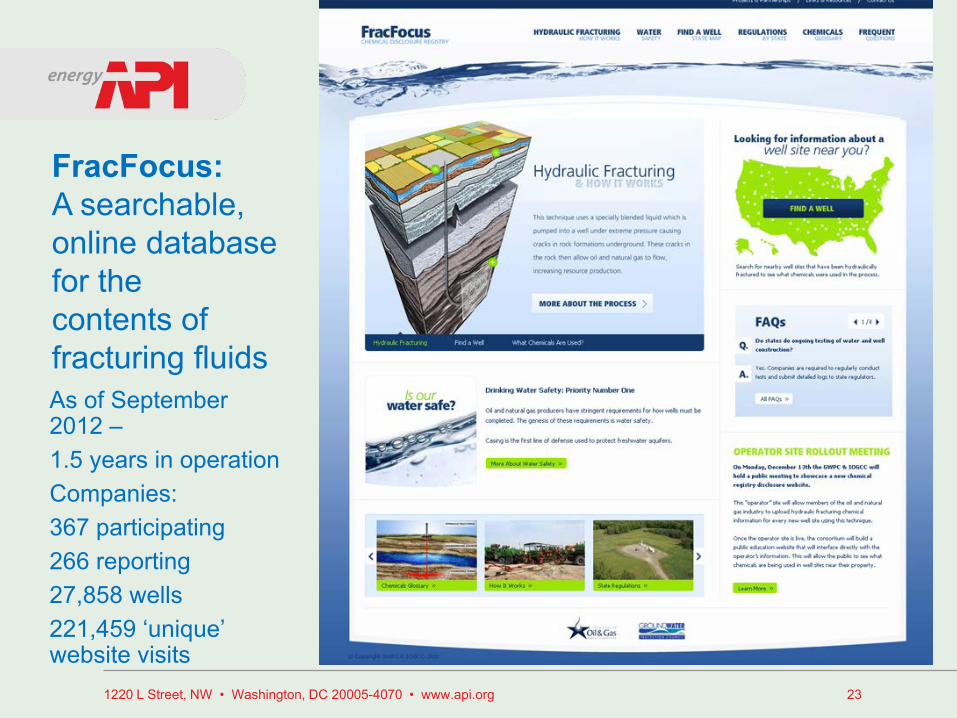
FracFocus: A searchable, online database for the contents of fracturing fluids As of September 2012 – 1.5 years in operation Companies: 367 participating 266 reporting 27,858 wells 221,459 ‘unique’ website visits
1220 L Street, NW • Washington, DC 20005-4070 • www.api.org 24
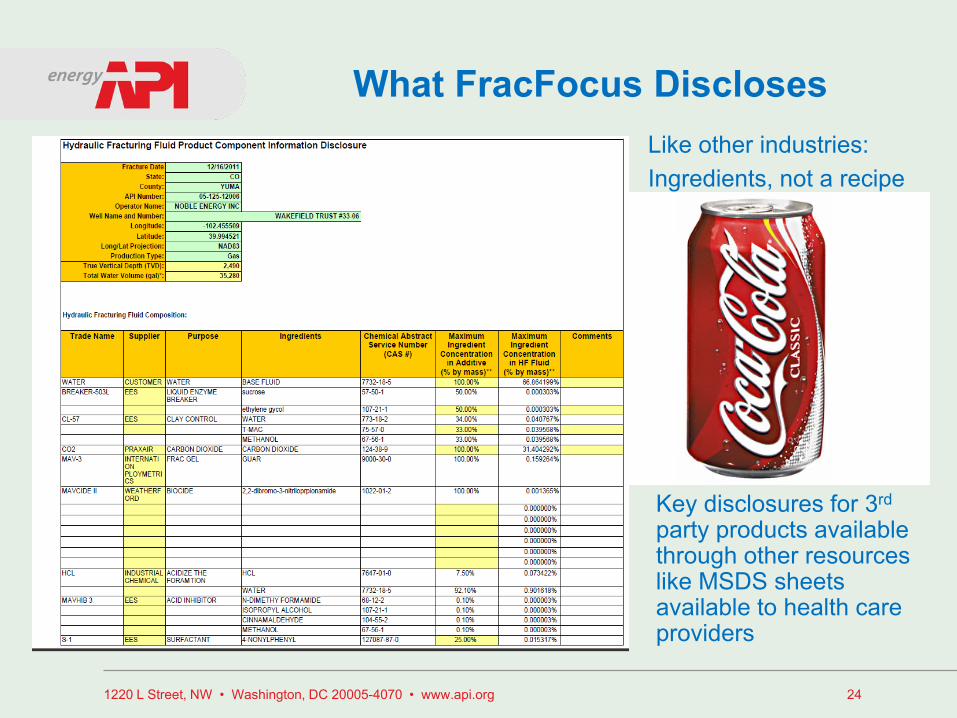
What FracFocus Discloses Like other industries: Ingredients, not a recipe
Key disclosures for 3rd party products available through other resources like MSDS sheets available to health care providers
1220 L Street, NW • Washington, DC 20005-4070 • www.api.org 25
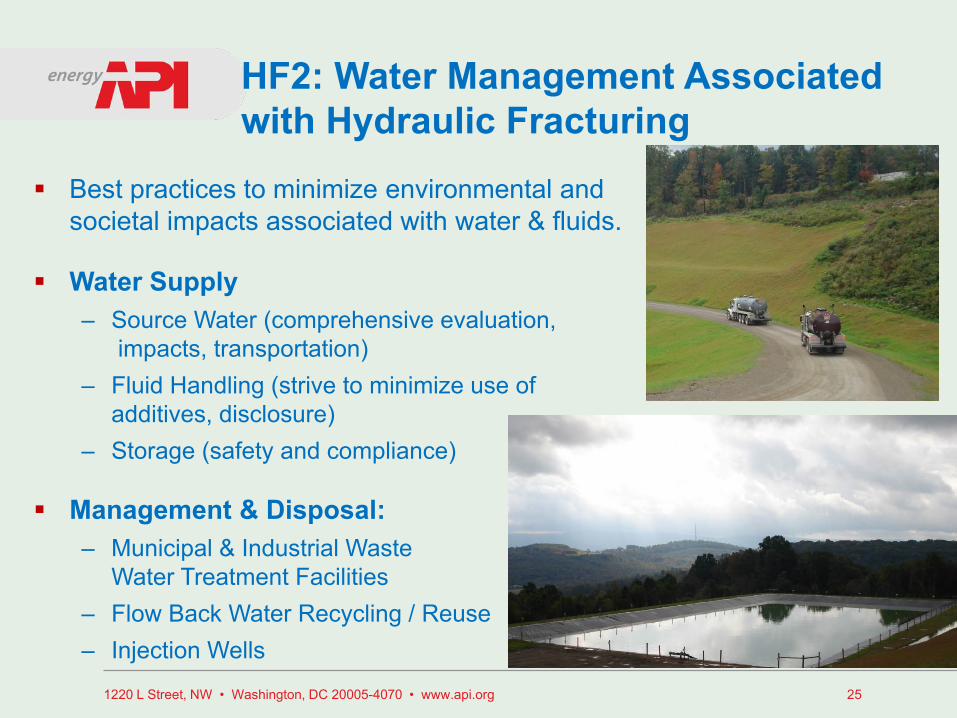
HF2: Water Management Associated with Hydraulic Fracturing
Best practices to minimize environmental and societal impacts associated with water & fluids.
Water Supply – Source Water (comprehensive evaluation,
impacts, transportation) – Fluid Handling (strive to minimize use of
additives, disclosure) – Storage (safety and compliance)
Management & Disposal: – Municipal & Industrial Waste
Water Treatment Facilities – Flow Back Water Recycling / Reuse – Injection Wells

1220 L Street, NW • Washington, DC 20005-4070 • www.api.org 26
Our Industry’s Water Use Is Comparatively Small
1220 L Street, NW • Washington, DC 20005-4070 • www.api.org 27
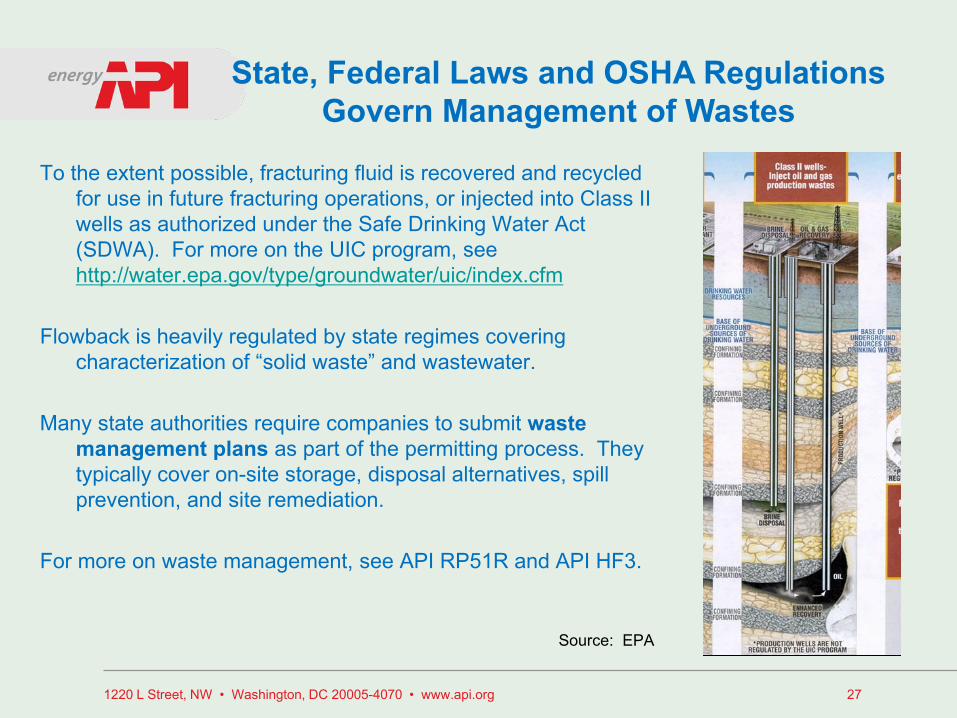
State, Federal Laws and OSHA Regulations Govern Management of Wastes
To the extent possible, fracturing fluid is recovered and recycled for use in future fracturing operations, or injected into Class II wells as authorized under the Safe Drinking Water Act (SDWA). For more on the UIC program, see http://water.epa.gov/type/groundwater/uic/index.cfm
Flowback is heavily regulated by state regimes covering
characterization of “solid waste” and wastewater. Many state authorities require companies to submit waste
management plans as part of the permitting process. They typically cover on-site storage, disposal alternatives, spill prevention, and site remediation.
For more on waste management, see API RP51R and API HF3.
Source: EPA
1220 L Street, NW • Washington, DC 20005-4070 • www.api.org 28
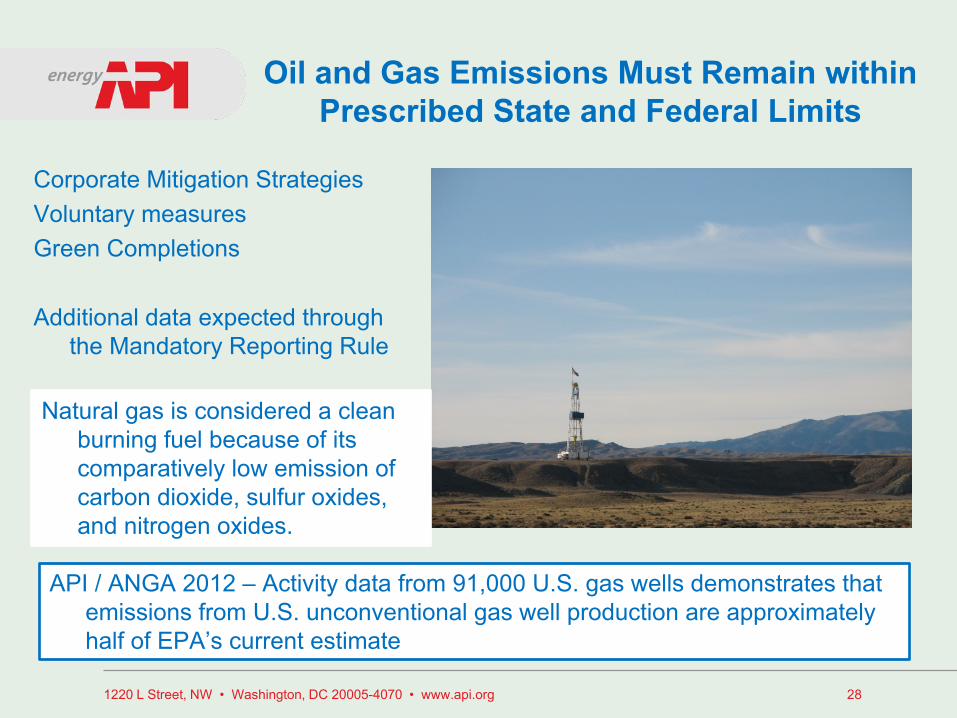
Oil and Gas Emissions Must Remain within Prescribed State and Federal Limits
Corporate Mitigation Strategies Voluntary measures Green Completions Additional data expected through
the Mandatory Reporting Rule
Natural gas is considered a clean burning fuel because of its comparatively low emission of carbon dioxide, sulfur oxides, and nitrogen oxides.
API / ANGA 2012 – Activity data from 91,000 U.S. gas wells demonstrates that emissions from U.S. unconventional gas well production are approximately half of EPA’s current estimate
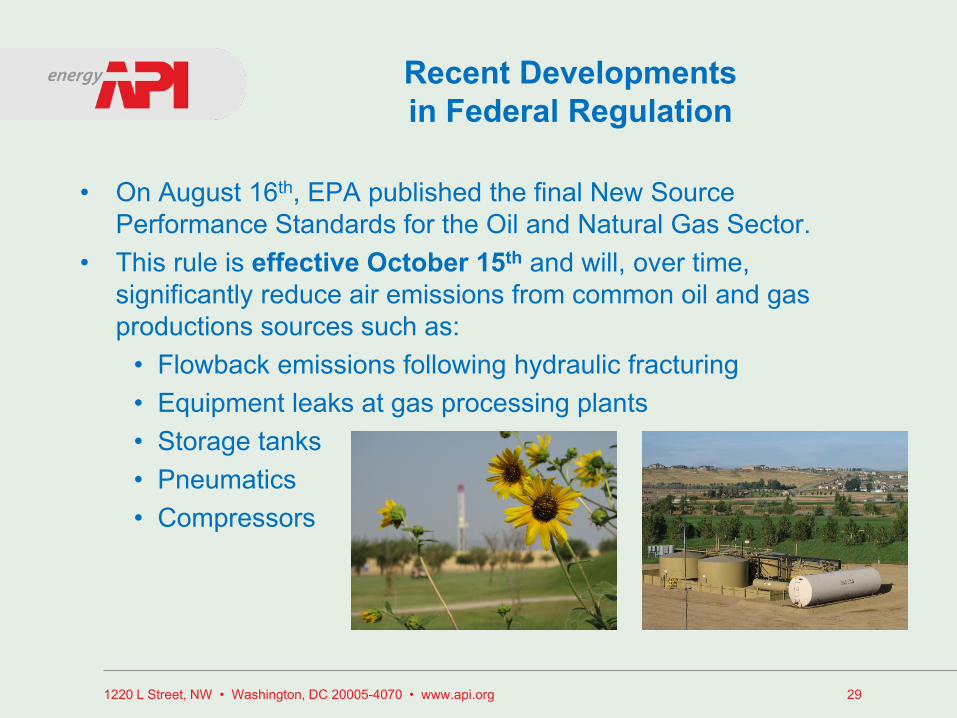
• On August 16th, EPA published the final New Source Performance Standards for the Oil and Natural Gas Sector.
• This rule is effective October 15th and will, over time, significantly reduce air emissions from common oil and gas productions sources such as:
• Flowback emissions following hydraulic fracturing • Equipment leaks at gas processing plants • Storage tanks • Pneumatics • Compressors
1220 L Street, NW • Washington, DC 20005-4070 • www.api.org 29
Recent Developments in Federal Regulation
1220 L Street, NW • Washington, DC 20005-4070 • www.api.org 30
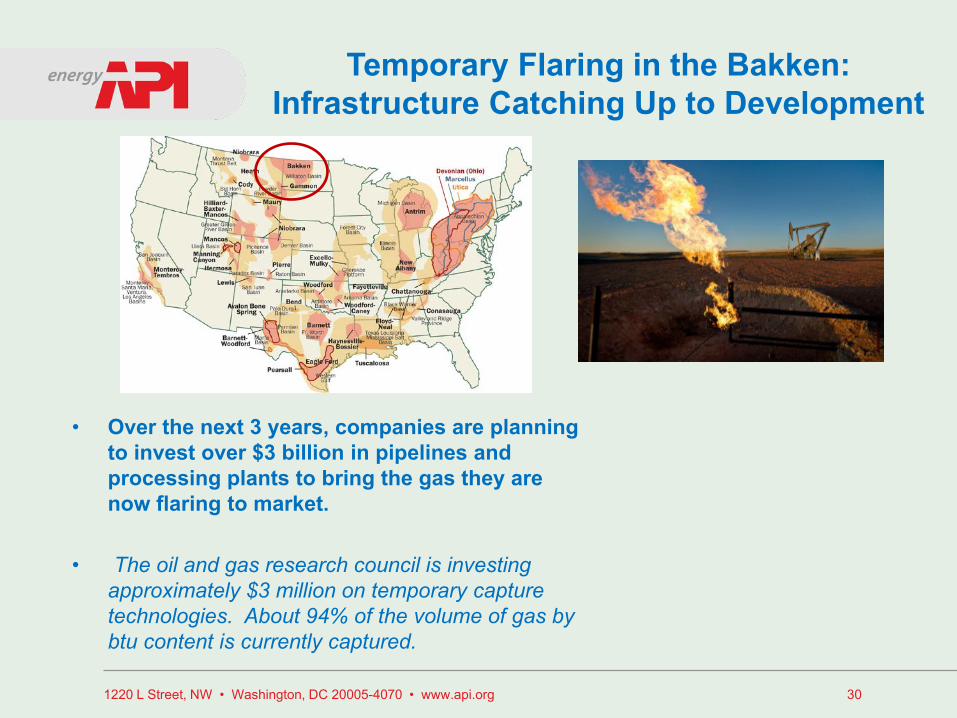
Temporary Flaring in the Bakken: Infrastructure Catching Up to Development
• Over the next 3 years, companies are planning
to invest over $3 billion in pipelines and processing plants to bring the gas they are now flaring to market.
• The oil and gas research council is investing approximately $3 million on temporary capture technologies. About 94% of the volume of gas by btu content is currently captured.
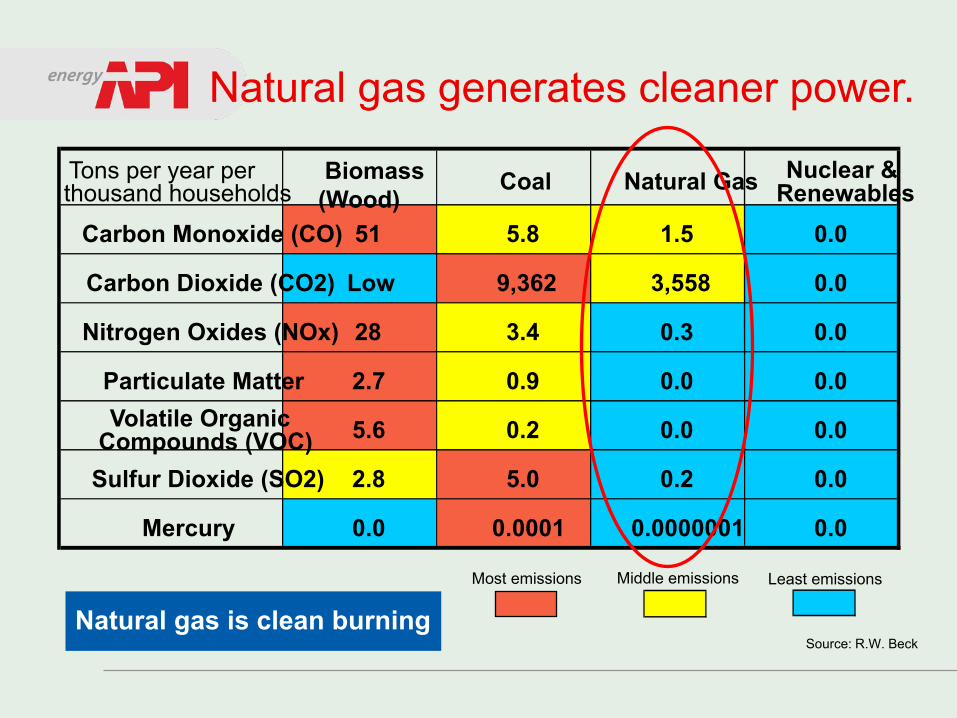
Natural gas is clean burning Most emissions Middle emissions Least emissions
Source: R.W. Beck
Tons per year per thousand households
Biomass (Wood)
Coal Natural Gas Nuclear & Renewables
Carbon Monoxide (CO) 51 5.8 1.5 0.0
Carbon Dioxide (CO2) Low 9,362 3,558 0.0
Nitrogen Oxides (NOx) 28 3.4 0.3 0.0
Particulate Matter 2.7 0.9 0.0 0.0 Volatile Organic
Compounds (VOC) 5.6 0.2 0.0 0.0
Sulfur Dioxide (SO2) 2.8 5.0 0.2 0.0
Mercury 0.0 0.0001 0.0000001 0.0
Natural gas generates cleaner power.
1220 L Street, NW • Washington, DC 20005-4070 • www.api.org 32
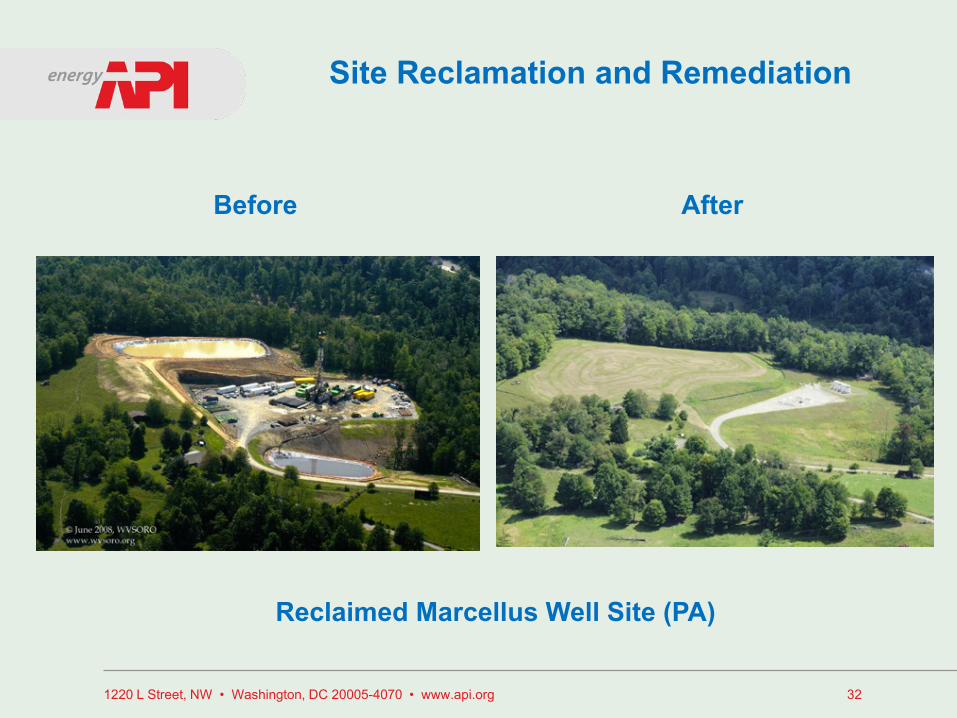
Site Reclamation and Remediation
Reclaimed Marcellus Well Site (PA)
Before After
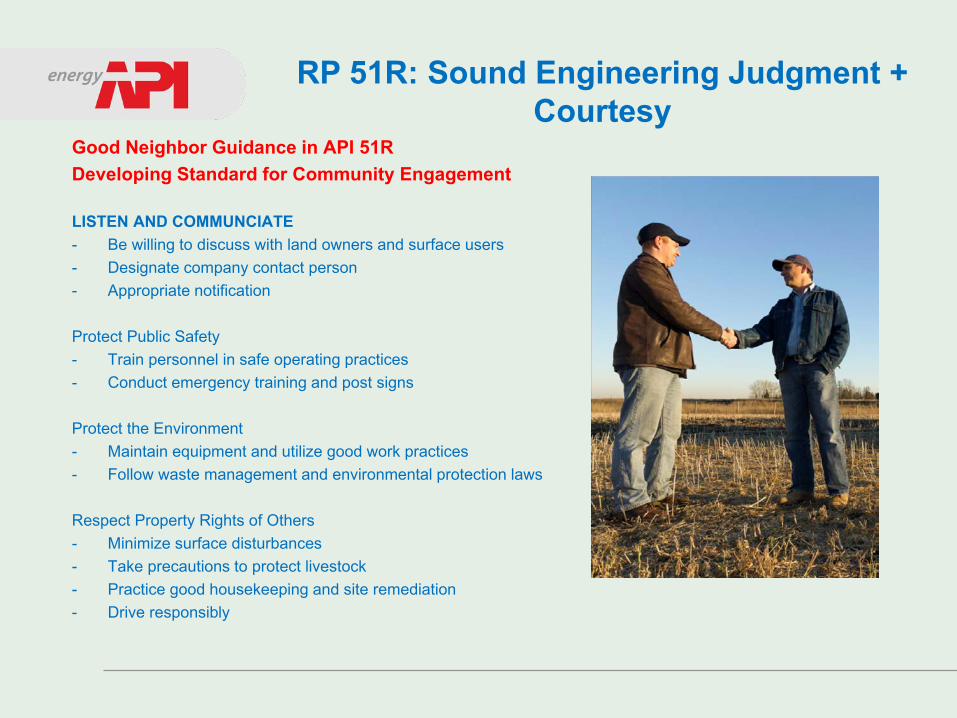
RP 51R: Sound Engineering Judgment + Courtesy
Good Neighbor Guidance in API 51R Developing Standard for Community Engagement LISTEN AND COMMUNCIATE - Be willing to discuss with land owners and surface users - Designate company contact person - Appropriate notification Protect Public Safety - Train personnel in safe operating practices - Conduct emergency training and post signs Protect the Environment - Maintain equipment and utilize good work practices - Follow waste management and environmental protection laws
Respect Property Rights of Others - Minimize surface disturbances - Take precautions to protect livestock - Practice good housekeeping and site remediation - Drive responsibly

1220 L Street, NW • Washington, DC 20005-4070 • www.api.org 34
Questions
Erik Milito Group Director, Upstream & Industry Ops API [email protected] (202) 682-8275 To Learn More:
www.api.org www.energyfromshale.org Drilling Video http://www.youtube.com/watch? v=AYQcSz27Xp8&feature=relmfu Fracturing Video http://www.youtube.com/watch?v=7ned5L04o8w