safe harbour disclosure - assets.corusent.com · creating value for shareholders 1. strong balance...
TRANSCRIPT


SAFE HARBOUR DISCLOSURE FORWARD-LOOKING STATEMENTS To the extent any statements made in this presentation contain information that is not historical; these statements are forward-looking statements within the meaning of applicable securities laws. These forward-looking statements related to, among other things, our objectives, goals, strategies, intentions, plans, estimates and outlook can generally be identified by the use of the words such as “believe”, “anticipate”, “expect”, “intend”, “plan”, “will”, “may” and other similar expressions. In addition, any statements that refer to expectations, projections or other characterizations of future events or circumstances are forward-looking statements. Although Corus believes that the expectations reflected in such forward-looking statements are reasonable, such statements involve risks and uncertainties and undue reliance should not be placed on such statements. Certain material factors or assumptions are applied in making forward-looking statements and actual results may differ materially from those expressed or implied in such statements. Important factors that could cause actual results to differ materially from these expectations include, among other things, our ability to attract and retain advertising revenues; audience acceptance of our television programs and cable networks; our ability to recoup production costs; the availability of tax credits and the existence of co-production treaties; our ability to compete in any of the industries in which we do business; the opportunities (or lack thereof) that may be presented to and pursued by us; conditions in the entertainment, information and communications industries and technological developments therein; changes in laws or regulations or the interpretation or application of those laws and regulations; our ability to integrate and realize anticipated benefits from our acquisitions and to effectively manage our growth; our ability to successfully defend ourselves against litigation matters arising out of the ordinary course of business; and changes in accounting standards. Additional information about these factors and about the material assumptions underlying such forward-looking statements may be found in our Annual Information Form. Corus cautions that the foregoing list of important factors that may affect future results is not exhaustive. When relying on our forward-looking statements to make decisions with respect to Corus, investors and others should carefully consider the foregoing factors and other uncertainties and potential events. Unless otherwise required by applicable securities laws, we disclaim any intention or obligation to publicly update or revise any forward-looking statements whether as a result of new information, events or circumstances that arise after the date thereof or otherwise.


Tom Peddie Executive Vice President and Chief Financial Officer
Corus Entertainment Investor Day 2014 Wednesday, January 29, 2014

Creating Value for Shareholders
1. Strong balance sheet
ü Completed refinancing Feb/Mar 2013 • Issued Cdn $550M 4.25% Senior Unsecured Guaranteed Notes due 2020 • Annual interest costs reduced by almost $15M
2. Focus on returning cash to shareholders with a strong dividend yield of 4%+ ü Dividend increased 6.9% to $1.09 per Class B Share in fiscal 2014
3. Excellent Free Cash Flow
ü Delivered $154M in Free Cash Flow in fiscal 2013
4. Disciplined use of leverage for acquisitions

Returning Cash to Shareholders With a Strong Dividend Yield of 4%+
0.03 0.04 0.13
0.53 0.56 0.60 0.60 0.74
0.92 1.00 1.06
2004 2005 2006 2007 2008 2009 2010 2011 2012 2013 2014E
Annual Dividend Payout History For the fiscal years ended August 31 ($CDN per Class B Share, Split Adjusted)
Dividend as % of Free Cash Flow
5 Year CAGR
12.1%

• Consistently positive Free Cash Flow driven by strong underlying performance
• Free Cash Flow totaled $154M in fiscal 2013
• Annual capital expenditures of $15M - $20M per year, with no significant capital investment on the horizon
Opera1ng and Free Cash Flow
Corus Delivers Strong Free Cash Flow
* Free Cash Flow normalized for business combinations, fiscals 2010 – 2011 adjusted for continuing operations
Fiscal Year
Mill
ions
($C
DN
)
Free Cash Flow
Pe
r Sha
re ($
CDN)
2015E (Guidance)

Net Debt and Leverage
Strong Balance Sheet and Credit Rating
Interest on Long-‐Term Debt ($M) $33 $29 $37 $45 $39 $33 $38
• Including pending amendment, unused lines of credit = $250M - $500M • Largely fixed rate financing to 2020 at 4.25% • DBRS Issuer Credit rating: BBB(low) • S&P Corporate Credit rating: BB+

Acquisition Impact on Corus: TELETOON, Historia and Séries+
Standalone ($M)
Acquisitions (2)
($M) Synergies
($M) Proforma
($M) % Change
Fiscal 2013 Revenue (1) 803.5 104.0 - 907.5 13%
Fiscal 2013 EBITDA (1) 270.0 48.0 12.0 – 15.0 330.0 22%
Adjusted Earnings per Share 1.65 2.04 24%
Proforma 2015E @ ~2% CAGR 2015E @ ~3% CAGR 2015E @ ~4% CAGR
2015E Segment Profit – CAGR Scenarios
$330M
$360M
$340M $350M
A great transaction for Corus shareholders
(1) Results not restated for IFRS 11 – Joint Arrangements (2) Net acquisition multiple of 8x

80
100
120
140
160
S&P/TSX Composite Index S&P/TSX Consumer Discretionary Index Corus (CJR.B)
$
Return on $100 invested August 31, 2010
Corus: 3 Year Total Shareholder Return = 13% CAGR (1)
Corus Delivered Exceptional 3 Year Performance
(1) Assumes reinvestment of dividends

$28 $32
$36
14x 16x 18x
Free Cash Flow Multiple
Share Price
Potential Share Value • Free Cash Flow = Increased Shareholder Value • Free Cash Flow of $170M using Free Cash Flow multiples of 14x to 18x would
equate to a CJR.B share price of $28 to $36

Consolidated EBITDA $340 million to $360 million Free Cash Flow $170 million +
Financial Guidance: Fiscal 2015

Doug Murphy Executive Vice President and Chief Operating Officer
Corus Entertainment Investor Day 2014 Wednesday, January 29, 2014

All Corus Brands Reel


KIDS 2 of the top 3 networks
MILLENNIALS 2 of the top 6 networks
FAMILIES (CO-VIEW) 2 of the top 3 networks
WOMEN 2 of the top 3 networks
Corus TV Owns the Podium
16 Source: BBM Canada TV Meter, August 26, 2013 to January 5, 2014 (19 wks), Kids = K2-‐11, Women = W25-‐54, Families = A18+ with children under 12, Millennials = A18-‐34. Ranking based on Commercial Canadian English Specialty and Digital Networks

Compelling and Exclusive Content
17

Canada’s Brand Steward
18

ü Best-in-class margins and strong Free Cash Flow ü Experienced management team
Canada’s only pure play media and entertainment company
19
Aligned and Focused on Growth
Photo: Richard Johnson

How Will Corus Grow?
20

21
Our Building Blocks for Growth

YTV Merry 6mas Reel

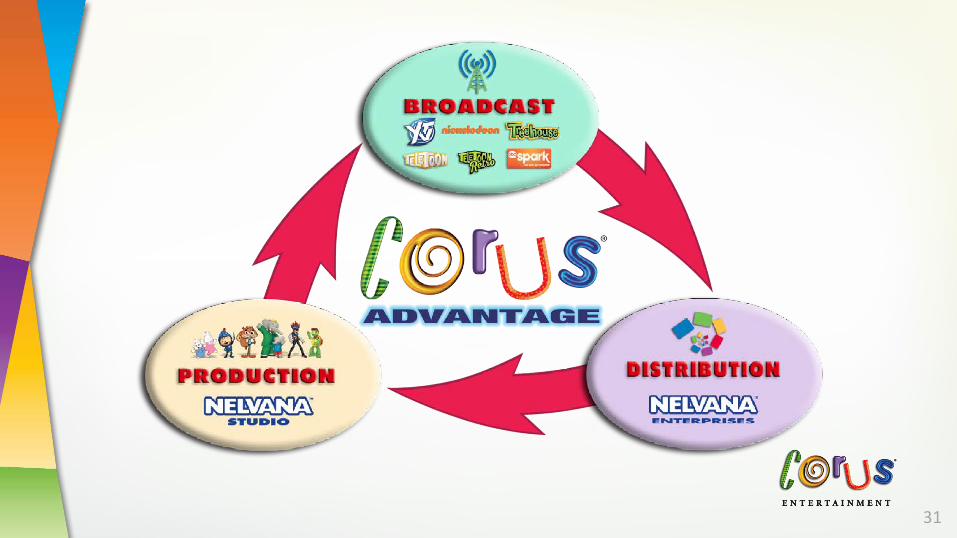
The Corus Advantage Works
23

Highest increase (11%) in the number of children aged 4 and under in 50 years!
Source(s): Statistics Canada, CANSIM table 102-4502, Births, Catalogue no. 84F0210X and Selected Historical Statistics, Canada, 1921-2009, Catalogue no. 82-553X Occasional.
Canada’s Mini Baby Boom
24
Pop
ulat
ion

All Roads Lead to Corus Kids
25

The entertainment and toy categories return to solid growth on Corus networks!
• Our category-specific research and insights create advertiser value
Growing Kids Advertising
26

15%
21%
13% 12% 11%
9% 11%
8% 3%
10%
5% 6%
4% 5% 5%
1%
3% 3% 6% 2% 2% 3%
1% 1%
24% 24% 22%
21% 20% 19% 19% 19% 18% 16% 16%
13% 13% 12% 10% 10% 10% 10% 10% 9% 8% 8%
6% 6%
Solo View Recall Co-View Recall
Co-View Works!
27 Source: DECODE Research, Oct 2011, English Canada Moms with Kids 2-12

F09 F10 F11 F12 F13
Ad
Rev
enue
Co-View Keeps Growing!
28
13% CAGR
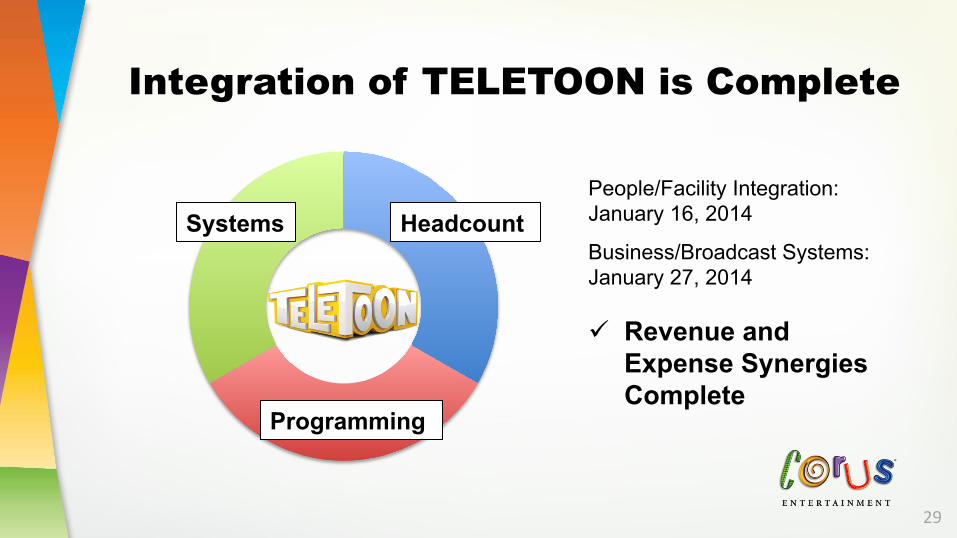
Systems
Programming
Headcount
Integration of TELETOON is Complete
29
People/Facility Integration: January 16, 2014
Business/Broadcast Systems: January 27, 2014 ü Revenue and
Expense Synergies Complete

Complementary Scheduling Maximizes Audiences
30
31

Leveraging our Strategic Partnerships
32

33
Content Pipeline Focused on Boys Action and Preschool

Mysticons Promo

We’re Excited About MYSTICONS
• Boys Action Property • Production 2014 • Broadcast 2015 • Retail 2016
35

Little Charmers Promo

• Girls Preschool Property • Production 2014 • Broadcast 2015 • Retail 2016
We’re Excited About LITTLE CHARMERS
37

Trucktown Promo

• Boys Preschool Property • Renowned author Jon Scieszka • Production 2014 • Broadcast 2015 • Retail 2016
We’re Excited About TRUCKTOWN
39
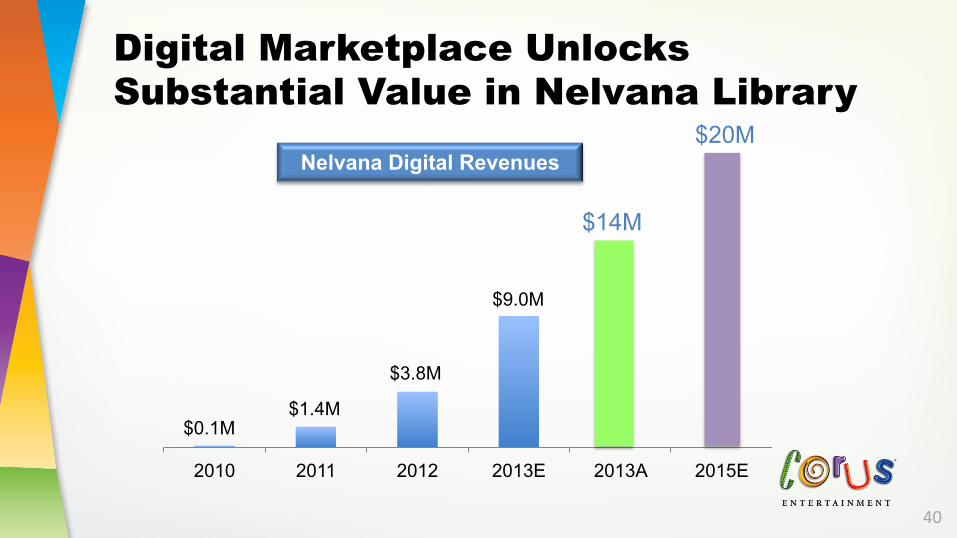
2010 2011 2012 2013E 2013A 2015E
Nelvana Digital Revenues
Digital Marketplace Unlocks Substantial Value in Nelvana Library
$20M
$14M
40
$9.0M
$3.8M
$1.4M $0.1M

41
Our Building Blocks for Growth
W Network / Family Reel

Source: BBM Canada TV Meter - Broadcast weeks 1-52(53), Total Canada, Women 25-54, M-Su 2a-2a, Average Minute Audience (000s).
Another Year of Growth
7% Growth Compared to F12
43
10
15 19 20 19 20 21
3 3
3 2 4
6 2
2
2
0
5
10
15
20
25
30
35
F02 F04 F06 F08 F10 F12 F13
Av
erag
e M
inut
e A
udie
nce
(000
s)
W Network Cosmo TV OWN W Movies
4%
36% 60%
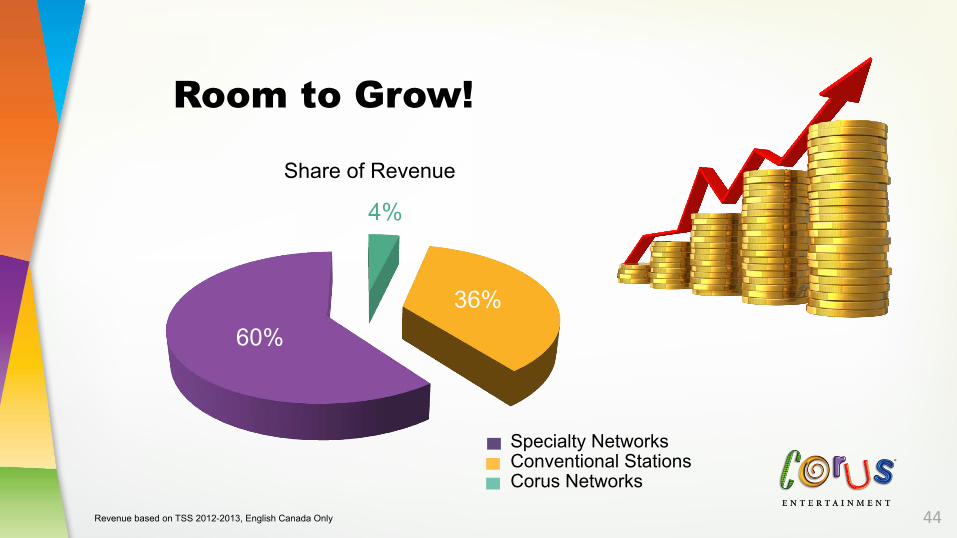
Revenue based on TSS 2012-2013, English Canada Only
Room to Grow!
44
Specialty Networks Conventional Stations Corus Networks
Share of Revenue
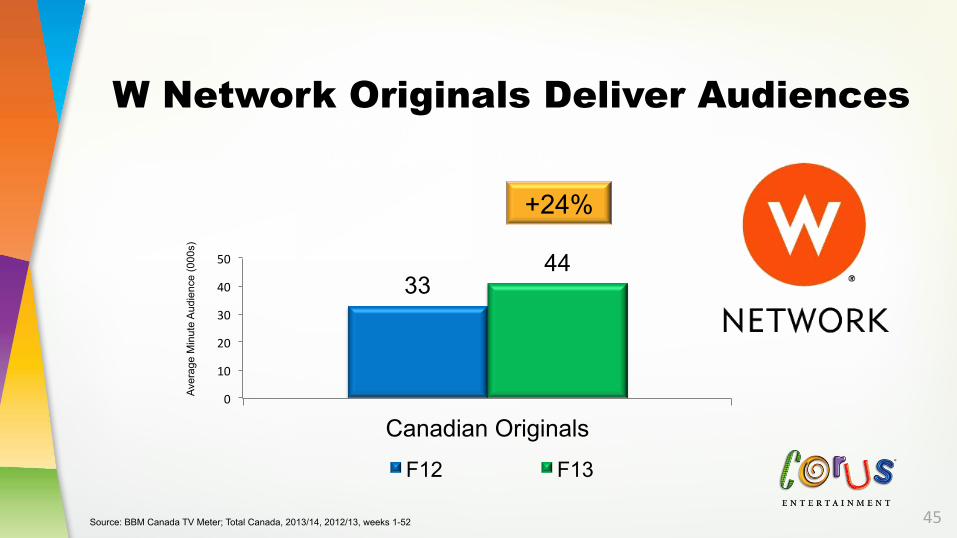
Mon-Thurs 8p-11p W25-54 AMA (000s)
+24%
Source: BBM Canada TV Meter; Total Canada, 2013/14, 2012/13, weeks 1-52
33 44
0
10
20
30
40
50
Canadian Originals
F12 F13
Aver
age
Min
ute
Aud
ienc
e (0
00s)
W Network Originals Deliver Audiences
45

46
Increasing Content Ownership in Women & Family
ü Original Programming Drives Ratings ü Focus on Unscripted Reality Series ü Ownership Creates International
Option Value ü Complete Control of All Rights

Tessa and Scott Promo Tori and Dean Promo

48
W Network Ratings Gains Ring the Cash Register
One Ratings Share Point is $20M in Revenue

0
2
4
6
8
10
12
Total Day (6a-6p) Prime (6p-12a)
F12 F13
OWN Delivers Gold! To
tal A
vera
ge M
inut
e A
udie
nce
(000
s)
+30%
+34%
49 Source: BBM Canada TV Meter, W25-34.Total Canada 2013/14, 2012/13, weeks 1-52
Ad
Rev
enue
+1
3%

W Movies Adds Audience and Revenue
0 0.5
1 1.5
2 2.5
3 3.5
Total Day (6a-6p) Prime (6p-12a)
F12 F13
+33%
+45%
Ad
Rev
enue
+
38%
Tota
l Ave
rage
Min
ute
Aud
ienc
e (0
00s)
50 Source: BBM Canada TV Meter, W25-34.Total Canada 2013/14, 2012/13, weeks 1-52

ABC Spark Promo

ABC Spark is a Hit with Millennials
0
2
4
6
8
10
12
14
Total Day (6a-6p) Prime (6p-12a)
F12 F13
+70%
+69%
Ad
Rev
enue
+1
00%
Tota
l Ave
rage
Min
ute
Aud
ienc
e (0
00s)
52 Source: BBM Canada TV Meter, A18-49, Total Canada 2013/14, 2012/13, weeks 1-52

53
Our Building Blocks for Growth

The Golden Age of Content on Pay TV
54

Movie Central Promo

Pay TV Service is a Strong Value Proposition
56
More than 1,000
Hours of HD On-Demand
Content, Anywhere,
Anytime, On Any Device!
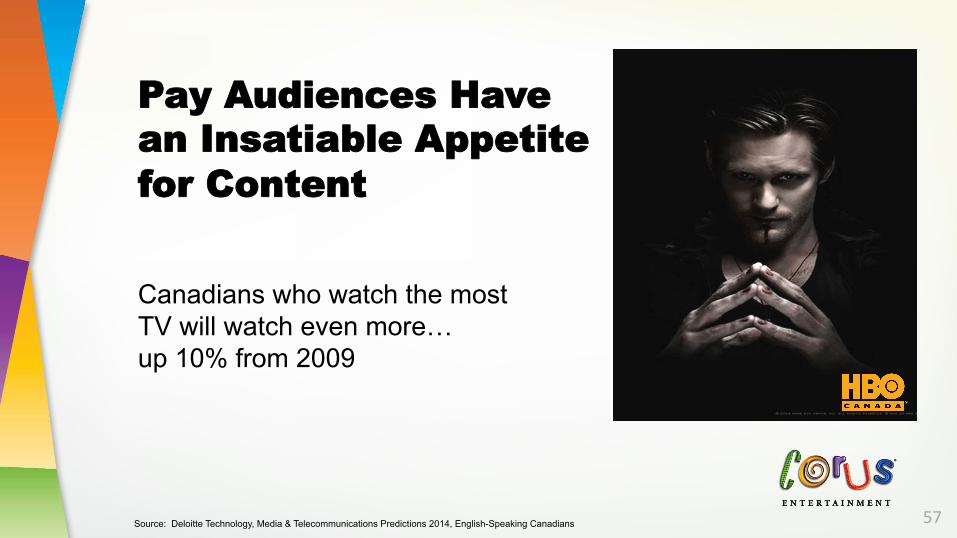
Canadians who watch the most TV will watch even more… up 10% from 2009
Pay Audiences Have an Insatiable Appetite for Content
57 Source: Deloitte Technology, Media & Telecommunications Predictions 2014, English-Speaking Canadians

Encore On-Demand Promo Movie Central On-Demand Promo

ü Collaboration with Bell on The Movie Network ü Packaging and Bundling Innovation ü The Best Exclusive Content
Pay TV Will Grow
59

60
Our Building Blocks for Growth

Radio is Important to Corus
61
TALK CLASSIC ROCK HOT AC/WOMEN
COUNTRY MODERN ROCK GREATEST HITS

Revenue Growth 2% 3% 4% 5% 6%
Exp
ense
Gro
wth
1% 4% 8% 11% 14% 18%
2% 2% 5% 9% 12% 15%
3% 0% 3% 6% 10% 13%
4% (3%) 1% 4% 7% 11%
Radio Has Significant Operating Leverage
62

$ M
illio
ns
Major Markets Offer Best Opportunity to Realize Operating Leverage
63
0
5
10
15
1 2 3 4 5
Share point increases deliver substantial revenue growth
Share Points

Q107 TV Spot Property Brothers Radio Spot

65

Born to Rock Promo

67
Our Building Blocks for Growth

Historia / Séries+ Reel

Corus Enters Quebec with a Portfolio of Strong Brands
69

Historia, Séries+ and TELETOON are Top Performers in Quebec
1 Source: BBM TV Meter. Based on audience share of all French-language specialty channels for viewers aged 25-54.
Bell 40.1%
Corus 21.3%
Québecor 18.4%
SRC/CBC 8.4%
Other 11.8%
Share of French Specialty Audience 25-54 (2012-2013)1
70
2012 2013 Revenue EBITDA
+12%
+7%
Historia & Séries+

Quebec is a Unique Market… Full of Potential
71

72
TELETOON integration and leveraging of Corus Advantage to launch new global kids properties
Corus Kids
Women &
Family
Pay TV
Radio
Corus Média
Corus Will Continue to Grow
Corus 2015
EBITDA Guidance $340M – $360M Free Cash Flow $170M
Driving ratings through more original owned content with global appeal
Targeted programs to acquire and retain subscribers
Focused on delivering ratings and building presence in Ottawa
Strong foundation for growth in the Quebec TV market
