safeguarding our genetic resources with libraries of … genotyping in five landraces of maize that...
TRANSCRIPT

1
Safeguarding our genetic resources with libraries of doubled-haploid lines
Albrecht E. Melchinger*, Pascal Schopp*, Dominik Müller*, Tobias A. Schrag*, Eva Bauer†,
Sandra Unterseer†, Linda Homann*, Wolfgang Schipprack*, Chris-Carolin Schön†
*Institute of Plant Breeding, Seed Science and Population Genetics, University of Hohenheim,
Fruwirthstraße 21, 70593 Stuttgart, Germany
†Technical University of Munich, TUM School of Life Sciences Weihenstephan,
Liesel- Beckmann-Straße 2, 85354 Freising, Germany
Genetics: Early Online, published on May 3, 2017 as 10.1534/genetics.115.186205
Copyright 2017.

2
Running Head: Doubled-haploid line libraries from landraces
Key Words: Allelic diversity, genetic load, haploidy linkage disequilibrium, maize
Corresponding Authors:
A. E. Melchinger ([email protected]) or C.-C. Schön ([email protected])

3
Abstract
Thousands of landraces are stored in seed banks as “gold reserve” for future use in plant
breeding. In many crops, their utilization is hampered because they represent heterogeneous
populations of heterozygous genotypes, which harbor a high genetic load. We show with high-
density genotyping in five landraces of maize that libraries of doubled-haploid (DH) lines
capture the allelic diversity of genetic resources in an unbiased way. By comparing allelic
differentiation between heterozygous plants from the original landraces and 266 derived DH
lines, we find conclusive evidence that in the DH production process sampling of alleles is
random across the entire allele frequency spectrum and purging of landraces from their
genetic load does not act on specific genomic regions. Based on overall process efficiency, we
show that generating DH lines is feasible for genetic material that has never been selected for
inbreeding tolerance. We conclude that libraries of DH lines will make genetic resources
accessible to crop improvement by linking molecular inventories of seed banks with
meaningful phenotypes.

4
Introduction
Genetic resources of domesticated species will play a key role in feeding future generations
(McCouch et al. 2013). Impressive examples exist, where introgressions of favorable alleles
from genetic resources into elite material have provided resistance to devastating diseases
(Plucknett and Smith 1987) or allowed revolutionary changes in management practices (Khush
2001). Despite these success stories, examples where genetic resources have successfully
been used to broaden and significantly improve the genetic base of modern breeding
germplasm for quantitative traits are scarce and molecular evidence suggests that most
genetic diversity has remained idle in seed banks (Hoisington 1999). Several reasons can be
held accountable for this: First, the gap in performance between genetic resources and elite
breeding material for agronomic traits widens steadily with continuous selection progress.
Second, passport data or genomic information collected by seed banks can predict an
individual’s membership to a specific race or accession (Yu et al. 2016) but has limited
predictive power with respect to breeding values of individuals. Third, unless a species is
strictly autogamous, accessions in gene banks represent collections of heterogeneous and
heterozygous individuals so that phenotypic evaluation in replicated multi-environment field
trials is only possible for the entire population but not for individual genotypes. Fourth,
maintaining allogamous species in gene banks is technically complex and resource demanding
and many reports have documented severe inbreeding, loss of diversity, admixture or
mislabeling of accessions (Chebotar et al. 2003; Bergelson et al. 2016). Thus, the value of gene
bank accessions can only be capitalized upon if efficient strategies for proper maintenance
and utilization of their genetic diversity will be devised.
Some of the difficulties mentioned above can be alleviated by developing inbred lines from
the original populations, to generate reproducible genetic units representing the diversity of

5
the source material. However, for many species, the development of inbred lines by recurrent
selfing is either not possible or extremely cumbersome due to self-incompatibility or high
genetic load (Hallauer et al. 2010) and the selective forces operating during the inbreeding
process are largely unknown. An alternative approach to tap the genetic diversity of genetic
resources is gamete capture (Stadler 1944), where elite genetic material is pollinated with a
random sample of gametes from the heterogeneous source material with subsequent
recurrent selfing of the offspring. Depending on the evaluation process of the offspring and
the performance gap between the parental germplasm, strong selection in favor of alleles
contributed by the elite parent is most probable, thus limiting the usefulness of the gamete
capture approach with respect to introducing novel genetic diversity (Sood et al. 2014).
A method to circumvent the recurrent selfing process is the in vitro or in vivo recovery of
haploid gametes from a source population with subsequent chromosome doubling to produce
fully homozygous doubled-haploid (DH) lines. In some crop species, DH technology is already
highly advanced and has largely replaced recurrent selfing in elite germplasm improvement
programs (Dwivedi et al. 2015). Thus, applying the DH technology to create libraries of
“immortalized” genetic units from genetic resources seems an obvious next step to make
them amenable to crop improvement. This applies in particular to genetic material that has
already undergone moderate anthropogenic selection such as landrace populations, which
are the ancestors of our elite breeding material.
To maintain the diversity of landraces with libraries of DH lines they need to represent random
gametic arrays of the source populations and expenditures for their development must not
be prohibitive. In this study, we address these topics using maize (Zea mays L.) landraces as a
model system for asking the following questions: (i) Is the allelic inventory and linkage
disequilibrium (LD) of landraces reflected in DH libraries derived from them? (ii) What is the
6
efficiency of DH production from landraces in comparison to elite breeding material? (iii)
During which phase of the DH production is the loss of gametes and presumably the genetic
load most pronounced? (iv) Does purging of the landraces from their genetic load via the
production of DH lines act on specific genomic regions? (v) How many DH lines are required
to capture a given proportion of the genetic variation in a landrace?
Materials and Methods
Genetic material. Seven European maize landraces were chosen for this study: Bugard (BU)
from France, Gelber Badischer (GB), Schindelmeiser (SC) and Strenzfelder (SF) from Germany,
Rheinthaler (RT) and Walliser (WA) from Switzerland, and Satu Mare (SM) from Romania. The
landraces were selected from a larger set of 70 European flint maize landraces on the basis of
(i) their adaptation to the agro-climatic conditions for maize cultivation in Central Europe
and/or (ii) evaluation of their testcross performance with two testers from the dent heterotic
pool (Böhm et al. 2014). Landraces were screened in two seasons for expression of the R1-nj
embryo marker in induction crosses with haploid inducer UH400 to reduce misclassification in
the identification of haploid seeds.
Production of doubled haploid (DH) lines. The landraces, together with nine intra-pool single
crosses between elite lines from the flint heterotic pool of the maize breeding program of the
University of Hohenheim, were used as source material for production of DH lines by the in
vivo haploid induction method (Prigge et al. 2012). The efficiency of DH line production was
evaluated in five landraces (GB, RT, SF, SM, WA) and compared with the elite flint crosses. To
accomplish this, the process of DH production was subdivided into eight steps detailed in
Supplementary Figure S1 and Supplementary Notes. In each of the eight steps we recorded
the number 𝑁𝑁𝑖𝑖 of units (seeds, seedlings, plants, D0 plants, D1 ears with seed set, propagated

7
DH lines) for each induction cross. The success rate for each working step i was determined
by calculating the ratio 𝑆𝑆𝑆𝑆𝑖𝑖 = 𝑁𝑁𝑖𝑖+1𝑁𝑁𝑖𝑖
. From these ratios, we calculated the haploid induction
rate (HIR) = proportion of haploid seeds in the total number of seeds harvested in induction
crosses, the survival rate (SR) = proportion of haploid seeds that germinated and survived until
flowering, the reproduction rate (RR) = proportion of DH plants from which D1 lines could be
produced, the overall success rate (OSR) = proportion of DH lines produced from the identified
haploid seeds (which corresponds to the product SR × RR), and the total production costs per
DH line for each material group (Supplementary Notes).
Genotyping. From five landraces (BU, GB, RT, SC, SF) leaf samples were collected from (i) bulks
of two to six seedlings from each of the DH lines developed from these landraces (36 ≤ NDH ≤
69, Supplementary Figure S2) and (ii) 23 individual seedlings of randomly chosen S0 plants per
landrace grown from the same seed lots used for induction crosses. Genomic DNA of these
samples was extracted using a modified CTAB protocol (Murray and Thompson 1980). The DH
lines were genotyped with the Illumina® MaizeSNP50 BeadChip (Ganal et al. 2011), the S0
individuals with the 600k Affymetrix Axiom® Maize Genotyping Array (Unterseer et al. 2014).
After quality control carried out for both SNP data sets with the R package GenABEL
(Aulchenko et al. 2007), a total of 266 DH lines genotyped for 57,840 SNPs and 114 S0 plants
genotyped for 616,201 SNPs remained (one individual from BU was deleted). In the rare event
of missing data, imputation was carried out with software Beagle version 3.3.2 (Browning and
Browning 2007). Since coding of SNP alleles may differ between the Illumina and the
Affymetrix platform, coding of the set of 45,655 SNPs common to both arrays was translated
from the Affymetrix to the Illumina coding scheme (see Supplementary Notes). In total, 28,133
SNPs fulfilled all quality criteria and were polymorphic across the entire set of 380 genotypes
and used in all subsequent analyses.
8
Statistical tests for differences in success rates of DH production. Success rates among the
five landraces and the elite germplasm for a given working step in the DH procedure were
tested for significant differences with the G-test of independence (Sokal and Rohlf 1969) using
the R-package “DescTools” (Signorell 2016). To account for multiple comparisons, P-values
were adjusted with the Bonferroni correction.
Molecular diversity analysis. Analyses of molecular diversity were conducted with SNP data
from the DH and S0 generations separately. Departure from Hardy-Weinberg equilibrium in
the sample of S0 plants from each landrace was tested for each polymorphic SNP. P-values
were derived from Fisher’s (1934) exact test using the R-package “genetics” (Warnes 2013).
In addition, we calculated the gene diversity statistic 𝐻𝐻𝑠𝑠 (Nei 1973) for each SNP. For graphical
representation, results were summarized for windows of 10 Mb width sliding in steps of 0.5
Mb. For a given window, 𝐻𝐻𝑠𝑠 or P-values were averaged across all SNPs and plotted at the
center of the window. An analysis of molecular variance (AMOVA) was performed using
Arlequin V.3.5 (Excoffier and Lischer 2010). The total molecular variance among entries was
partitioned between and within landraces. The phylogenetic structure of the five landraces
was depicted separately for the DH lines and the S0 plants by constructing neighbor-joining
trees based on Rogers’ distances (Rogers 1972) using the R package “ape” (Paradis et al. 2004)
and visualized with the software FigTree ("http://tree.bio.ed.ac.uk/").
Statistical tests for genetic differentiation of the DH and S0 generation. For each landrace,
the genetic differentiation of the DH from the S0 generation was examined by the FST statistic
(Holsinger and Weir 2009). FST was calculated per SNP and averaged (i) in windows of 10 Mb
width sliding in steps of 0.5 Mb and (ii) across the entire genome. P-values for testing whether
an observed FST value was significantly different from the null distribution, indicating genetic
differentiation between the DH and S0 generation, were determined with a permutation test.

9
To generate the distribution of the test statistic under the null hypothesis, we (i) generated
“pseudoS0” genotypes (PS0) from pairs of homozygous DH lines (see Supplementary Notes)
and (ii) calculated FST values for 10,000 random subdivisions of combined sets of S0 and PS0
genotypes. Significantly different FST values were determined at a genome-wise type I error
rate of 5% with a Bonferroni correction for multiple testing based on the number of non-
overlapping windows (200). For graphical representation, FST values were averaged across all
SNPs in a given window and plotted at the center of the window.
Linkage disequilibrium (LD) in the DH and S0 generation. Linkage disequilibrium estimates (r2)
between pairs of markers on the same chromosome were computed following Hill and
Robertson (1968). LD values were calculated separately for the DH and S0 generation from
each landrace using the R package “synbreed” (Wimmer et al. 2012). For the three landraces
with NDH > 46, calculation of r² values was based on randomly sampled subsets of nDH=46 to
keep the number of sampled gametes comparable to those in the S0 generation. Sampling was
repeated 100 times and results were averaged for each landrace over chromosomes and
repetitions. LD decay with increasing physical distance among markers was compared for the
DH and S0 generation by grouping the respective r2 values according to the physical distance
of marker pairs in steps of 0.05 Mb and averaging over all 10 chromosomes following Strigens
et al. (2013a).
Number of DH lines required for adequate sampling of landraces. We investigated the
molecular diversity of the source population captured by the DH lines as a function of sample
size (nDH) based on 𝐻𝐻𝑠𝑠. First, we calculated 𝐻𝐻𝑠𝑠 (averaged over all 28,133 common SNPs) in the
set of 23 (22 for BU) S0 individuals (corresponding to 46 (44) gametes), which served as
reference for the genetic diversity present in each landrace. Second, we sampled with
replacement nDH DH lines from each landrace, starting with nDH = 4 and increasing nDH in steps

10
of 2 up to the total number of DH lines available for the landrace. For each of these samples,
𝐻𝐻𝑠𝑠 was calculated with a total of 250 repetitions. Finally, we calculated for the different
samples of DH lines the ratio 𝐻𝐻𝑠𝑠 (𝐷𝐷𝐻𝐻) : 𝐻𝐻𝑠𝑠 (𝑆𝑆0) and for a given sample size averaged the
results over all repetitions.
Data availability. Genotypic data of S0 and DH imputed genotypes are available in the
supplemental files "snp_S0.txt" and "snp_DH.txt", respectively. Marker positions referring to
the physical map (B73 RefGen_v2) are described in the supplemental file "marker_map.txt".
Results
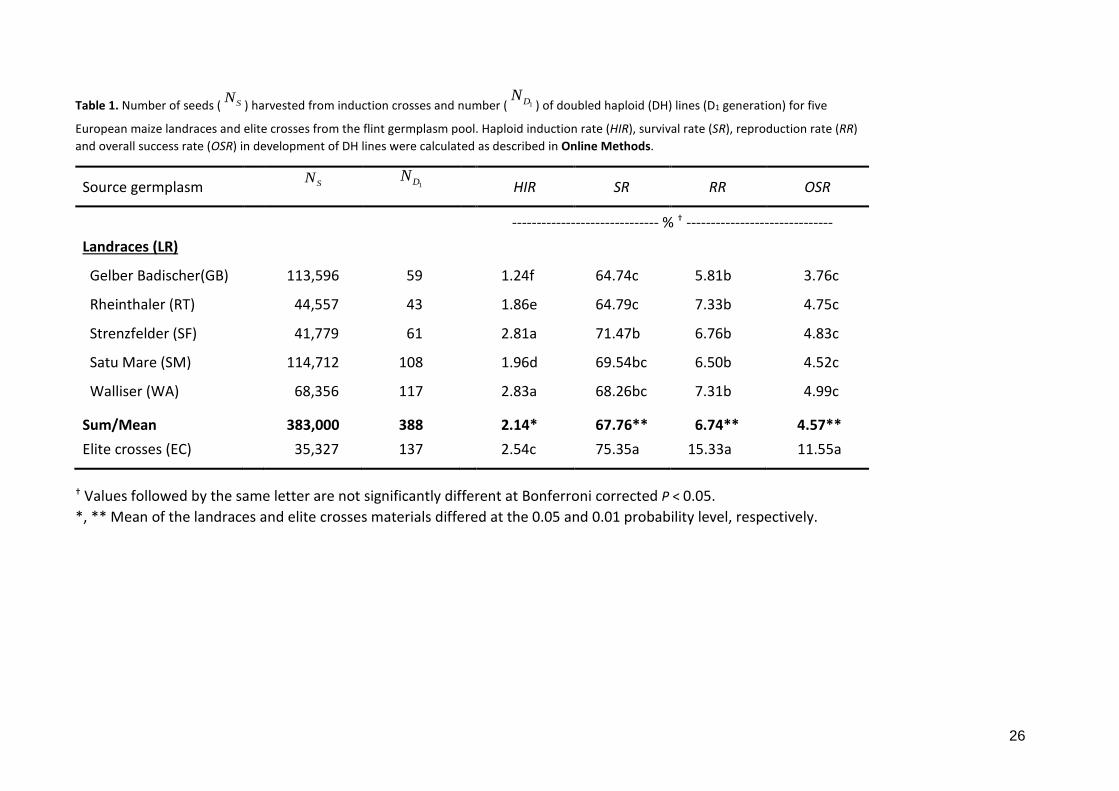
Efficiency of DH library production from maize landraces. A total of 383,000 and 35,327 seeds
were harvested from induction crosses of landraces and elite crosses, to result in a total of
388 and 137 DH lines, respectively (Table 1). Mean haploid induction rate (HIR) differed
significantly (P < 0.05) between landraces and elite material (Table 1, Supplementary Table
S1) but induction rates in two landraces (SF and WA) were even significantly higher than in
the elite material. Differences in HIR between landraces and elite material were small
compared to differences in overall success rate (OSR) of DH production. OSR was 2.5 times
higher in the elite material compared to the landraces. While HIR differed significantly, OSR
was stable across landraces. Subdividing OSR into survival rate during the juvenile phase (SR)
and reproduction rate (RR) (Table 1, Supplementary Table S1) yielded comparable SR for
landraces (67.8%) and elite germplasm (75.4%). On the other hand, RR was more than twice
as large in elite germplasm (15.3%) than in the landraces (6.0%). The reduction in RR in the
landraces was mainly due to failed or aborted seed set in D0 plants and D1 lines (N7/N6 and
N8/N7 in Supplementary Table S1).
Molecular diversity and LD in DH and S0 generations. The five landraces for which the S0
generation was sampled (BU, SC, GB, RT, SF) showed no significant deviations from Hardy-
11
Weinberg equilibrium (Supplementary Figure S3). Analyses of molecular diversity gave very
similar results for the DH and the S0 generation. The phylogenetic relationship of the five
landraces visualized with neighbor-joining trees showed a distinct grouping of the landraces
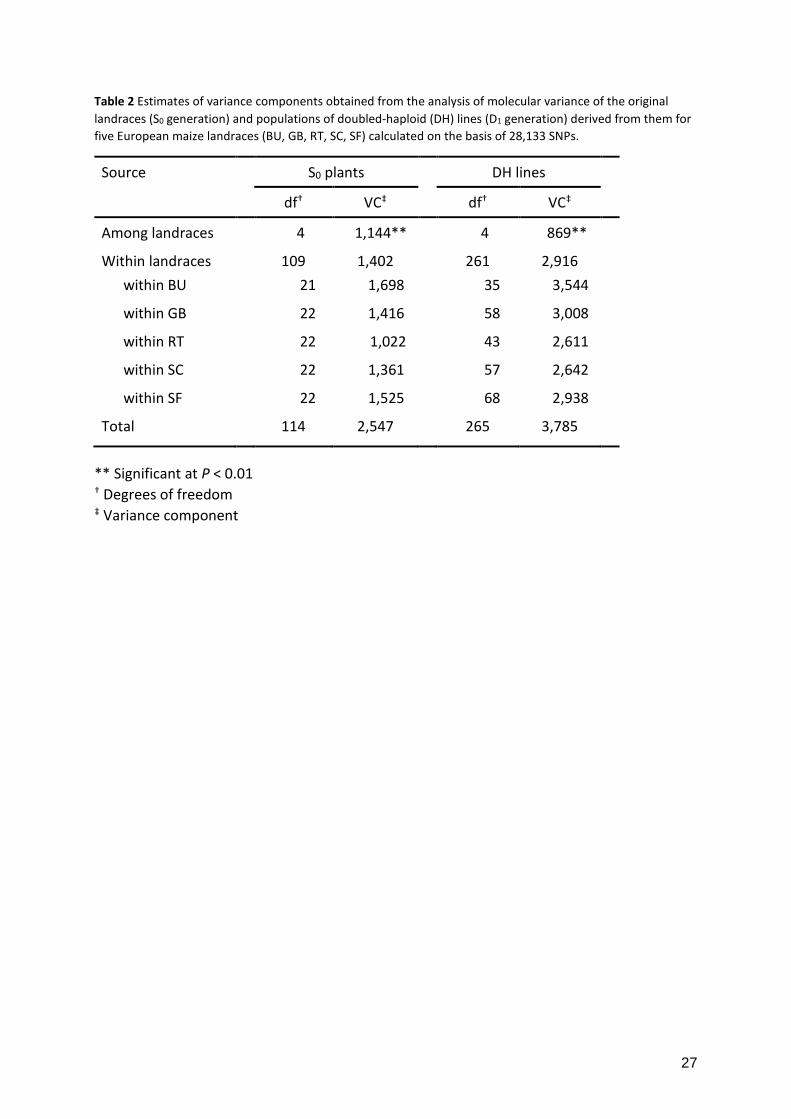
and was almost identical for the DH and S0 generation (Figure 1). Molecular variance
components obtained from the AMOVA were comparable for the two generations (Table 2),
when taking into account that S0 plants and DH lines are expected to differ by a factor of two
(Hallauer et al. 2010), and revealed that most of the molecular variance was found within
landraces and not between them. Gene diversity Hs corresponded well between the two
generations across the entire genome (Supplementary Figure S2).
Allele frequency distributions were similar for the two generations for all landraces
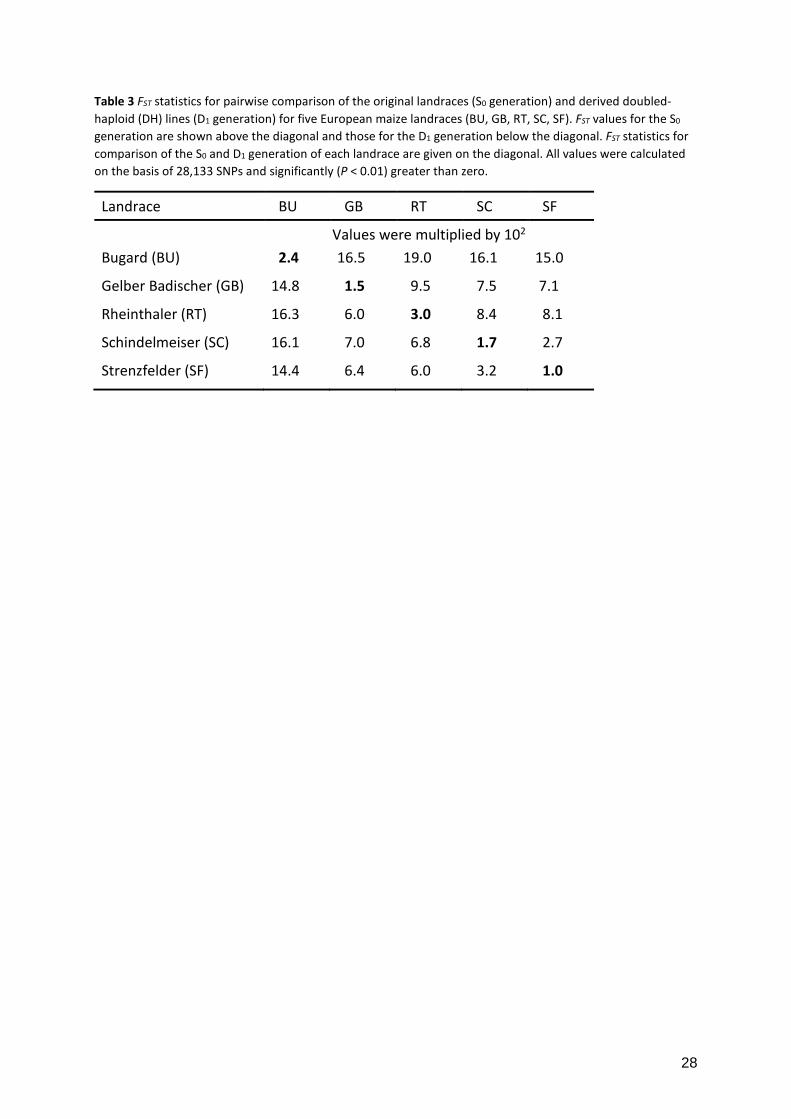
(Supplementary Figure S4). FST values for genome-wide subpopulation differentiation
between the DH and S0 generation of each landrace are given in Table 3. For all landraces, FST
values differentiating the S0 and D1 generation were significantly (P < 0.01) different from the
null distribution generated in the permutation test. However, the average FST of 0.019 was
small in relation to the FST statistics obtained from the pairwise comparison of landraces in the
S0 generation with an average FST of 0.110. The FST values for the two generations along the
ten maize chromosomes are given in Figure 2A. FST values never surpassed 0.05 in landrace SF
and only in one of the 200 non-overlapping windows in landraces SC and GB. In landraces BU
and RT, FST statistics ranged between 0.05 and 0.10 more often, but simultaneously surpassed
a value of 0.05 only in 5 of the 200 non-overlapping bins. Likewise, P-values for the FST statistic
determined by the permutation test were significant in several windows (Figure 2B), but never
in all landraces simultaneously and apart from windows on chromosomes 1, 3, 7, 9 in less than
four landraces.

12
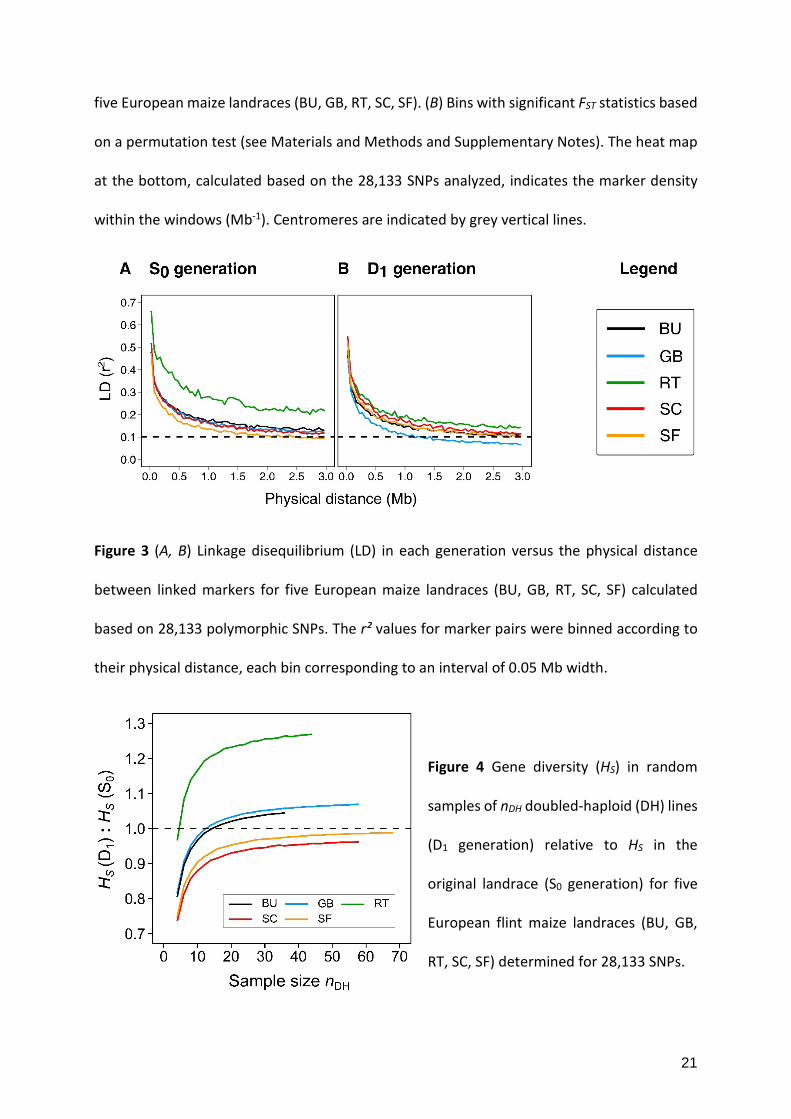
Curves for LD decay as a function of increasing physical distance between marker pairs were
almost identical for the DH and S0 generations (Figure 3). The r² values decayed rapidly and
approached 0.10 at a distance of 3.0 Mb. The only exception was the S0 generation of landrace
RT, where LD remained at a higher level than in the other landraces. RT also showed the
highest genome-wide and window based FST values for the comparison of the two generations
with strong differentiation across the entire genome (Table 3 and Figure 2).
The gene diversity Hs captured by random samples of DH lines of different size relative to the
S0 generation is given in Figure 4. For landraces SC and SF more than 30 DH lines were needed
to capture 95% of the gene diversity present in the sample of S0 plants, whereas only about
15 DH lines were needed for landraces BU and GB. For RT, the ratio Hs(DH) : Hs(S0) rapidly
exceeded 1.0, suggesting that gene diversity of the sample of S0 plants of RT was rather limited
in comparison with the DH lines extracted from this landrace as can also be seen from
Supplementary Figure S4.
Discussion
DH libraries represent the allelic inventory of landraces. We showed with high-density
genotyping in five landraces of maize originating from different geographic regions of Central
Europe that libraries of DH lines capture the molecular diversity of genetic resources in an
unbiased way. Both, the allelic inventory and LD of the DH and S0 generation were highly
congruent for four of the five landraces. Genome-wide FST values between pairs of landraces
varied and generally exceeded the FST values for the differentiation of the DH and S0
generation substantially (Table 3, Figure 2A). One pair of landraces (SF and SC) showed only
mild differentiation (FST = 2.7) which was expected because according to oral tradition by
breeders, SF was derived from other German landraces including SC. One landrace (RT)

13
showed a slightly elevated differentiation between the DH and S0 generation based on FST
values and LD decay distance but this was most likely the result of inappropriate sampling of
S0 plants rather than the effect of DH production or intrinsic genetic load, as the S0 plants from
RT showed a significantly reduced molecular variance and increased LD compared to the DH
sample and the other landraces (Table 2, Figure 3). We hypothesize that, had the DH lines
been derived directly from the sampled S0 plants, differentiation between the DH and S0
generation would have been even less pronounced.
In a study investigating the mechanism underlying in vivo haploid induction in maize, Zhao et
al. (2013) detected in one out of 42 haploids a 44-Mb heterozygous fragment from the inducer
parent. Contrary to this observation, we found no evidence for presence of inducer genome
in the 266 DH lines analyzed in our study, when comparing their DNA fingerprints to the
genotyping results of inducer UH400 obtained with the Illumina® MaizeSNP50 BeadChip (Hu
et al. 2016). Likewise, Han et al. (2016) detected no traces of the inducer genome in a study
with 633 DH lines derived from elite source germplasm. Thus, we hypothesize that either
genome fragments present in the haploid stage are eliminated during later phases in the
development of doubled haploids or transfer of the inducer genome occurs at such low
frequency that it is of no practical relevance.
No evidence for targeted selection caused by genetic load. In elite germplasm improvement
programs, the DH technology has been applied at large scale and no evidence for selection of
specific genomic regions has been observed (e.g., Bauer et al. 2013). Thus, it is mainly the
genetic load intrinsic to the landraces that might hamper their representation through the use
of DH libraries. Two scenarios may arise: (i) The genetic load is due to recessive alleles that
appear at low frequency but have large detrimental effects and/or (ii) the genetic load is the
cumulative result of many detrimental alleles with small effects (Willis 1999; Mezmouk and
14
Ross-Ibarra 2014). In this study, mostly random and/or small allele frequency differences were
observed for the DH and S0 generation (Supplementary Figure S4). For all five landraces, the
comparison of allele frequencies was consistent across the entire frequency spectrum and
obtaining fully homozygous DH lines in one generation gave no evidence for systematic
directional selection in specific genomic regions. With the given sample sizes and marker
density it cannot be excluded that selection against detrimental alleles with very low
frequency and/or small effects might have remained undetected in the comparison of the DH
and S0 generation. Nevertheless, the loss of favorable or neutral alleles through partial purging
of the genetic load during the DH production process seems rather unlikely. Directional
selection at one locus changes allele frequencies at a second, neutral locus proportional to
their LD. Averaged across the genome, LD was small (r2 ≤ 0.1) for pairs of marker loci spanning
a physical distance of 3 Mb or more. Even in peri-centromeric regions with low recombination
rate an overrepresentation of allelic differences between the DH and S0 generation was not
observed, as might have been expected from a recent study on maize, where an association
of recombination frequency and deleterious polymorphisms was found (Rodgers-Melnick et
al. 2015).
Our results on the molecular diversity of landraces and their derived DH libraries are in
agreement with a study on phenotypic diversity of DH lines derived from three of the
populations studied here (BU, GB, SC) (Strigens et al. 2013b). When DH lines were intermated
to re-synthesize their respective original landrace, the original and the re-synthesized landrace
showed significant differences in agronomic trait performance only in rare cases. Combined
with the results from this study, it seems justified to assume that the genetic load in maize
landraces is to a large extent the result of the cumulative action of many genes with small

15
effects distributed across the genome and, given the low LD prevalent in the landraces, does
not interfere with the unbiased sampling of diversity in the form of DH libraries.
Genetic load in landraces affects fertility traits. Assuming that differences in DH production
efficiency between flint elite germplasm and landraces are mainly the result of genetic load,
the rigorous analysis of the DH production process from haploid seeds to fertile DH lines
yielded insights during which development phase the loss of genotypes and presumably
genetic load in the landraces was most pronounced. While haploid induction rate and survival
during the juvenile phase did not differ substantially between landraces and elite germplasm,
fertility traits relevant for the last steps of DH production were significantly reduced and
variable across landraces (Table 1). It is those last steps of line establishment and propagation
that are common to all DH production systems, irrespective of the employed method.
Consequently, interpolation of our results should be possible to other allogamous crops such
as sugar beet, rape seed and a number of vegetable species (Dwivedi et al. 2015; Murovec and
Bohanec 2012). Moreover, development of efficient in vivo haploid induction systems in other
cereals are within reach by the recent cloning of MATRILINEAL, a gene encoding a pollen-
specific phospholipase, that triggers haploid induction in maize (Gilles et al. 2017; Kelliher et
al. 2017; Lui et al. 2017).
Optimal representation of the intrinsic diversity of a landrace. The generation of a DH library
is a onetime investment providing immortal, ready to use genetic units that represent the
diversity of the source material and recover ancestral recombination. DH lines derived from
landraces can be readily used for establishing pre-breeding programs bridging non-elite and
elite germplasm as proposed by Gorjanc et al. (2016). Generating DH libraries from landraces
capitalizes upon the fact that in allogamous species a large proportion of the genetic variation
lies within landraces and not between them (Sood et al. 2014). Depending on the genetic
16
material studied, up to 80% of the molecular and phenotypic variation can lie within landraces
while only 20% differentiate the respective populations (Sanchez et al. 2000). The AMOVA of
the DH and S0 generations of the five landraces in this study corroborated these findings (Table
2). Thus, for improvement of quantitative traits, it seems more appropriate to sample the
diversity of a few pre-selected landraces comprehensively rather than sampling few
individuals from each of a large number of landraces. Under the naïve assumption that each
SNP corresponds to a QTL with equal additive effects and absence of dominance effects as
applies to DH lines, gene diversity Hs should be proportional to the additive genetic variance
of the population of S0 plants as well as DH lines derived from it (Falconer and Mackay 1996).
Whether Hs can be used as a proxy to choose landraces, that are expected to release the
largest amount of genetic variation in the DH library produced from them, warrants further
investigation. Nevertheless, this information can be used to determine the number of DH lines
that warrant adequate sampling of the genetic variation in the original landrace. From the
results obtained in this study (Figure 4), it seems safe to conclude that equivalent numbers of
independent gametes sampled in the DH or S0 generation lead to comparable representation
of the genetic diversity of the original landrace.
DH libraries - a tool for maintaining genetic resources. Expenditures for the generation of a
representative DH library vary among crops and source populations. When landraces are
maintained as DH lines rather than in the form of heterozygous populations additional
expenses are incurred through the DH production process and increased space requirements
in seed banks for storing individual lines. Based on the efficiency of the DH production process
in maize, the cost for a representative DH library of 40 lines was estimated to be less than
3,000 Dollars per landrace (Supplementary Table S2). These costs seem small considering the
large investments currently spent to establish molecular inventories of seed bank accessions.

17
Costs for storage of DH libraries will exceed those of heterozygous populations but not
necessarily at a linear rate, because fewer seeds would be required to preserve the genetic
integrity of the material. Multiplication costs will be higher for heterozygous populations
because far more than 100 full-sib families need to be generated through controlled crossings
in each round of multiplication to avoid loss of alleles due to drift (Falconer and Mackay 1996).
With DH lines, the multiplication process is simplified requiring the self-pollination of about
10 plants per line. Taking the expenditure of the currently practiced multiplication process in
seed banks as a base line (Taba et al. 2004), about 50 DH lines per landrace can be maintained
and multiplied without increase in costs. Our data show that already 40 DH lines represent
the genetic diversity of a landrace to a large extent and in comparison to the current
maintenance practice, there is no risk of changes in allele frequencies due to unintentional
selection, assortative mating or drift. Linking molecular inventories to meaningful phenotypes
is the most challenging and complex task when mining biodiversity for useful alleles (McCouch
et al. 2013). Since the genotypes of DH lines are genetically fixed, they can be reproduced ad
libitum which allows their immediate evaluation for breeding with any degree of precision
required. We believe that for pre-selected landraces this gain in information overcompensates
the moderate additional costs associated with the production and storage of DH libraries.
Moreover, the generated DH libraries offer additional advantages as they can be readily used
to investigate research questions such as the intrinsic genetic load in open-pollinated
populations. Due to their high reproducibility they can also be instrumental in investigating
diversity not captured by SNP data such as epigenetic modifications or plant-microbe
interactions and their role in phenotypic variation of genetic resources. When extending their
sample size to a few hundred, they are an excellent biological resource for high-resolution
18
association mapping of quantitative trait loci as they fully recover the ancestral recombination
events of their source populations.
It seems realistic to assume that production costs of DH libraries will fall with advances in
biotechnology based on CENH3, MATRILINEAL or other methods (Ravi and Chan 2010; Kelliher
et al. 2017; Melchinger et al. 2013). For (partially) allogamous species such as maize, sugar
beet, rape seed and rye, the DH method has already started its success in improvement of
elite germplasm (Dwivedi et al. 2015). Building libraries of “immortalized”, homozygous
genotypes from ancestral populations will be a major step forward in making genetic
resources directly accessible for crop improvement.
ACKNOWLEDGEMENTS
We thank the staff of (a) the experimental research station of the University of Hohenheim
for assistance in production of the DH lines and (b) the group of Hans-Rudolf Fries, Technical
University of Munich for providing genotyping facilities. We acknowledge the advice of H.P.
Piepho for the statistical analyses, calculations of M. Winter, and language corrections of
W. Molenaar. This research was in part funded by the German Ministry of Education and
Research (BMBF) within the AgroClustEr ‘Synbreed – Synergistic plant and animal breeding’
(FKZ: 0315562D) and the project “MAZE: Accessing the genomic and functional diversity of
maize to improve quantitative traits, FKZ: 031B0195F”).
AUTHOR CONTRIBUTIONS
A.E.M. and C.C.S designed the experiments and supervised the research. W.S. produced the
DH lines. E.B. and S.U. conducted the SNP assays. P.S., T.A.S., D. M., and L.H. contributed to

19
the statistical analyses and preparation of figures and tables. C.C.S. and A.E.M. wrote the
manuscript.
COMPETING FINANCIAL INTERESTS
The authors declare no competing financial interests.

20
FIGURES
Figure 1 (A, B) Neighbor-joining tree constructed from Rogers’ distances for five European
maize landraces (BU, GB, RT, SC, SF) based on 28,133 polymorphic SNPs.
Figure 2 (A) FST statistic for evaluating genetic differentiation between the original landrace
(S0 generation) and the population of doubled-haploid (DH) lines (D1 generation) derived from
it averaged across all markers in a sliding window of 10 Mb width along the chromosomes for
21
five European maize landraces (BU, GB, RT, SC, SF). (B) Bins with significant FST statistics based
on a permutation test (see Materials and Methods and Supplementary Notes). The heat map
at the bottom, calculated based on the 28,133 SNPs analyzed, indicates the marker density
within the windows (Mb-1). Centromeres are indicated by grey vertical lines.
Figure 3 (A, B) Linkage disequilibrium (LD) in each generation versus the physical distance
between linked markers for five European maize landraces (BU, GB, RT, SC, SF) calculated
based on 28,133 polymorphic SNPs. The r² values for marker pairs were binned according to
their physical distance, each bin corresponding to an interval of 0.05 Mb width.
Figure 4 Gene diversity (HS) in random
samples of nDH doubled-haploid (DH) lines
(D1 generation) relative to HS in the
original landrace (S0 generation) for five
European flint maize landraces (BU, GB,
RT, SC, SF) determined for 28,133 SNPs.
22
References
Aulchenko, Y. S., S. Ripke, A. Isaacs, and C. M. van Duijn, 2007 GenABEL: an R library for genome-wide association analysis. Bioinformatics 23: 1294-1296.
Bauer, E., M. Falque, H. Walter, C. Bauland, C. Camisan et al., 2013 Intraspecific variation of recombination rate in maize. Genome Biology 14: R103.
Bergelson, J., E. S. Buckler, J. R. Ecker, M. Nordborg, and D. Weigel, 2016 A Proposal Regarding Best Practices for Validating the Identity of Genetic Stocks and the Effects of Genetic Variants. Plant Cell 28: 606-609.
Böhm, J., W. Schipprack, V. Mirdita, H. F. Utz, and A. E. Melchinger, 2014 Breeding Potential of European Flint Maize Landraces Evaluated by their Testcross Performance. Crop Sci. 54: 1665-1672.
Browning, S. R., and B. L. Browning, 2007 Rapid and Accurate Haplotype Phasing and Missing-Data Inference for Whole-Genome Association Studies By Use of Localized Haplotype Clustering. Am J Hum Genet 81: 1084-1097.
Chebotar, S., M. S. Röder, V. Korzun, B. Saal, W. E. Weber et al. 2003 Molecular studies on genetic integrity of open-pollinating species rye (Secale cereale L.) after long-term genebank maintenance. Theor. Appl. Genet. 107: 1469-1476.
Dwivedi, S. L., A. B. Britt, L. Tripathi, S. Sharma, H. D. Upadhyaya et al., 2015 Haploids: Constraints and opportunities in plant breeding. Biotechnology Advances 33: 812-829.
Excoffier, L., and H. E. L. Lischer, 2010 Arlequin suite ver 3.5: a new series of programs to perform population genetics analyses under Linux and Windows. Molecular Ecology Resources, 10: 564-567.
Falconer, D. S., and T. F. C. Mackay, 1996 Introduction to Quantitative Genetics, Ed. 4. Pearson, Essex.
Fisher, R. A., 1934 Statistical Methods for Research Workers. Oliver and Boyd Edinburgh.
Ganal, M. W., G. Durstewitz, A. Polley, A. Bérard, E. S. Buckler et al., 2011 A Large Maize (Zea mays L.) SNP Genotyping Array: Development and Germplasm Genotyping and Genetic Mapping to Compare with the B73 Reference Genome. PLOS ONE 6: e28334.
Gilles, L. M., A. Khaled, J.-B. Laffaire, S. Chaignon, G. Gendrot et al., 2017 Loss of pollen-specific phospholipase NOT LIKE DAD triggers gynogenesis in maize. The EMBO Journal 36: 707-717.
Gorjanc, G., J. Jenko, S. J. Hearne, and J. M. Hickey, 2016 Initiating maize pre-breeding programs using genomic selection to harness polygenic variation from landrace populations. BMC Genomics 17: 30.
23
Hallauer, A. R., M. J. Carena, and J. B. Miranda Filho, 2010 Quantitative Genetics in Maize Breeding. Springer-Verlag New York.
Han, S., H. F. Utz, W. Liu, T. A. Schrag, M. Stange et al., 2016 Choice of models for QTL mapping with multiple families and design of the training set for prediction of Fusarium resistance traits in maize. Theor. Appl. Genet. 129: 431-444.
Hill, W. G., and A. Robertson, 1968 Linkage Disequilibrium in Finite Populations. Theor. Appl. Genet. 38: 226-231.
Hoisington, D., M. Khairallah, T. Reeves, J.-M. Ribaut, B. Skovmand et al., 1999 Plant genetic resources: What can they contribute toward increased crop productivity? Proc. Natl. Acad. Sci. U.S.A. 96: 5937-5943.
Holsinger, K. E., and B. S. Weir, 2009. Genetics in geographically structured populations: defining, estimating and interpreting FST. Nat. Rev. Genet. 10: 639–650.
Hu, H., T. A. Schrag, R. Peis, S. Unterseer, W. Schipprack et al., 2016 The Genetic Basis of Haploid Induction in Maize Identified with a Novel Genome-Wide Association Method. Genetics 202: 1267-1276.
Kelliher, T. D. Starr, L. Richbourg, S. Chintamanani, B. Delzer et al., 2017 MATRILINEAL, a sperm – specific phospholipase, triggers maize haploid induction. Nature 542: 105-109.
Khush, G. S., 2001 Green revolution: the way forward. Nature Reviews Genetics 2: 815-822.
Liu, C., X. Li, D. Meng, Y. Zhong, C. Chen et al., 2017 A 4-bp Insertion at ZmPLA1 Encoding a Putative Phospholipase A Generates Haploid Induction in Maize. Molecular Plant 10: 520-522.
McCouch, S., G. J. Baute, J. Bradeen, P. Bramel, P. K. Bretting et al., 2013 Agriculture: Feeding the future. Nature 499: 23-24.
Melchinger, A. E., W. Schipprack, T. Würschum, S. Chen, and F. Technow, 2013 Rapid and accurate identification of in vivo-induced haploid seeds based on oil content in maize. Scientific Reports 3: 02129.
Mezmouk, S., and J. Ross-Ibarra, 2014 The Pattern and Distribution of Deleterious Mutations in Maize. G3 4: 163-171.
Murovec, J., and B. Bohanec, 2012 Haploids and doubled haploids in plant breeding, pp. 87 – 106, in Plant Breeding, edited by I. Abdurakhmonov. InTech Europe, Croatia
Murray, M. G., and W. F. Thompson, 1980 Rapid isolation of high molecular weight plant DNA. Nucleic Acids Res 8: 4321-4326.
Nei, M., 1973 Analysis of Gene Diversity in Subdivided Populations. Proc. Nat. Acad. Sci. U.S.A. 70: 3321-3323.

24
Paradis, E., J. Claude, and K. Strimmer, 2004 APE: Analyses of Phylogenetics and Evolution in R language. Bioinformatics 20: 289-290.
Plucknett, D. L., and N. J. H. Smith, 1987 Gene Banks and the World’s Food. Princeton University Press.
Prigge, V., and A. E. Melchinger, 2012 Production of Haploids and Doubled Haploids in Maize, pp. 161-172 in: Plant Cell Culture Protocols, Methods in Molecular Biology 3rd edition, edited by V. M. Loyola-Vargas, and N. Ochoa-Alejo. Humana Press, Totowa.
Ravi, M., and S. W. L. Chan, 2010 Haploid plants produced by centromere-mediated genome elimination. Nature 464: 615-619.
Rodgers-Melnick, E., P. J. Bradbury, R. J. Elshire, J. C. Glaubitz, C. B. Acharya et al., 2015 Recombination in diverse maize is stable, predictable, and associated with genetic load. Proc. Natl. Acad. Sci. 112: 3823-3828.
Rogers, J. S., 1972 Measures of similarities and genetics distances, pp. 145-153 in: Studies in genetics VII edited by M. R. Wheeler. The University of Texas at Austin.
Sanchez G., J. J., M. M. Goodman, and C. W. Stuber, 2000 Isozymatic and Morphological Diversity in the Races of Maize of Mexico. Econ Bot 54: 43-59.
Signorell, A. et al., 2016 DescTools: Tools for Descriptive Statistics. R package version 0.99.18. https://cran.r-project.org/package=DescTools.
Sokal, R. R., and J. F. Rohlf, 1969 Biometry: The Principles and Practice of Statistics in Biological Research. W.H. Freeman and Company, New York.
Sood, S., S. Flint-Garcia, M. C. Willcox, and J. B. Holland, 2014 Mining Natural Variation for Maize Improvement: Selection on Phenotypes and Genes pp. 617-640 in Genomics of Plant Genetic Resources, edited by R. Tuberosa, A. Graner and E. Frison. Springer Netherlands.
Stadler, L. J., 1944 Gamete selection in corn breeding. J Am Soc Agron 36: 988-989.
Strigens, A., N. M. Freitag, X. Gilbert, C. Grieder, C. Riedelsheimer et al., 2013a Association mapping for chilling tolerance in elite flint and dent maize inbred lines evaluated in growth chamber and field experiments. Plant, Cell & Environment 36: 1871-1887.
Strigens, A., W. Schipprack, J. C. Reif, A. E. Melchinger 2013b Unlocking the Genetic Diversity of Maize Landraces with Doubled Haploids Opens New Avenues for Breeding. PLOS ONE 8: e57234.
Taba, S., M. van Ginkel, D. Hoisington, and D. Poland, 2004 Wellhausen-Anderson Plant Genetic Resources Center: Operations Manual. El Batan, Mexico: CIMMYT.
Unterseer, S., E. Bauer, G. Haberer, M. Seidel, C. Knaak et al., 2014 A powerful tool for genome analysis in maize: development and evaluation of the high density 600 k SNP genotyping array. BMC Genomics 15: 823.

25
Warnes G., with contributions from G. Gorjanc, F. Leisch, and M. Man, 2013 genetics: Population Genetics. https://CRAN.R-project.org/package=genetics. R package version 1.3.8.1.
Willis, J. H., 1999 The Role of Genes of Large Effect on Inbreeding Depression in Mimulus guttatus. Evolution 53: 1678-1691.
Wimmer, V., T. Albrecht, H.-J. Auinger, and C.-C. Schön, 2012 synbreed: a framework for the analysis of genomic prediction data using R. Bioinformatics 28: 2086-2087.
Yu, X., X. Li, T. Guo, C. Zhu, Y. Wu et al., 2016 Genomic prediction contributing to a promising global strategy to turbocharge gene banks. Nature Plants 2:16150.
Zhao, X., X. Xu, H. Xie, S. Chen, and W. Jin, 2013 Fertilization and Uniparental Chromosome Elimination during Crosses with Maize Haploid Inducers. Plant Physiology 163: 721-731.
26
Table 1. Number of seeds ( SN ) harvested from induction crosses and number ( 1DN) of doubled haploid (DH) lines (D1 generation) for five
European maize landraces and elite crosses from the flint germplasm pool. Haploid induction rate (HIR), survival rate (SR), reproduction rate (RR) and overall success rate (OSR) in development of DH lines were calculated as described in Online Methods.
Source germplasm SN 1DN
HIR SR RR OSR
------------------------------ % † ------------------------------ Landraces (LR)
Gelber Badischer(GB) 113,596 59 1.24f 64.74c 5.81b 3.76c
Rheinthaler (RT) 44,557 43 1.86e 64.79c 7.33b 4.75c
Strenzfelder (SF) 41,779 61 2.81a 71.47b 6.76b 4.83c
Satu Mare (SM) 114,712 108 1.96d 69.54bc 6.50b 4.52c
Walliser (WA) 68,356 117 2.83a 68.26bc 7.31b 4.99c
Sum/Mean 383,000 388 2.14* 67.76** 6.74** 4.57** Elite crosses (EC) 35,327 137 2.54c 75.35a 15.33a 11.55a
† Values followed by the same letter are not significantly different at Bonferroni corrected P < 0.05. *, ** Mean of the landraces and elite crosses materials differed at the 0.05 and 0.01 probability level, respectively.
27
Table 2 Estimates of variance components obtained from the analysis of molecular variance of the original landraces (S0 generation) and populations of doubled-haploid (DH) lines (D1 generation) derived from them for five European maize landraces (BU, GB, RT, SC, SF) calculated on the basis of 28,133 SNPs.
Source S0 plants DH lines
df† VC‡ df† VC‡
Among landraces 4 1,144** 4 869**
Within landraces 109 1,402 261 2,916
within BU 21 1,698 35 3,544
within GB 22 1,416 58 3,008
within RT 22 1,022 43 2,611
within SC 22 1,361 57 2,642
within SF 22 1,525 68 2,938
Total 114 2,547 265 3,785
** Significant at P < 0.01 † Degrees of freedom ‡ Variance component
28
Table 3 FST statistics for pairwise comparison of the original landraces (S0 generation) and derived doubled-haploid (DH) lines (D1 generation) for five European maize landraces (BU, GB, RT, SC, SF). FST values for the S0 generation are shown above the diagonal and those for the D1 generation below the diagonal. FST statistics for comparison of the S0 and D1 generation of each landrace are given on the diagonal. All values were calculated on the basis of 28,133 SNPs and significantly (P < 0.01) greater than zero.
Landrace BU GB RT SC SF
Values were multiplied by 102 Bugard (BU) 2.4 16.5 19.0 16.1 15.0
Gelber Badischer (GB) 14.8 1.5 9.5 7.5 7.1
Rheinthaler (RT) 16.3 6.0 3.0 8.4 8.1
Schindelmeiser (SC) 16.1 7.0 6.8 1.7 2.7
Strenzfelder (SF) 14.4 6.4 6.0 3.2 1.0