safety and justice challenge
TRANSCRIPT

Submitted to: Chantell JohnsonMaurice SamuelsJohn D. and Catherine T. MacArthur Foundation
Submitted by:Center for Courts and Corrections ResearchDivision for Applied Justice ResearchRTI International
Matthew DeMichelePamela K. LattimoreMegan Comfort Samuel ScaggsChristopher InkpenAlison Levin-Rector
Debbie DawesKelle BarrickRose WerthMonica SheppardKasey JonesVenita Embry
Safety and JusticeChallengeEvaluation Report2015–2017
December 2018

Safety and Justice ChallengeEvaluation Report
2015–2017
RTI International is a registered trademark and a trade name of Research Triangle Institute. The RTI logo is a registered trademark of Research Triangle Institute.
John D. and Catherine T. MacArthur FoundationMacArthur seeks impact, including policy change where appropriate, in accordance with identified goals for each program area and subject to legal limitations imposed on private foundations by law. Ongoing evaluation by a learning partner is integral to MacArthur’s work throughout the strategy life cycle and periodic reports; case studies and other assessments are issued to track our progress toward milestones and assess impact.
This report assesses the policy and other impacts achieved by MacArthur grantees in its criminal justice programmatic work. Grantees also received funds from a variety other sources and attribution of results or impact to specific sources of funds is not generally possible. Other organizations not funded by MacArthur also contributed to the results.
MacArthur carefully reviews proposed grants to be sure that MacArthur grant funds are used only for permitted purposes. No MacArthur grant funds were used to influence legislation except as permitted by applicable regulations and MacArthur’s grant agreement and no MacArthur grant funds were used by grantees to participate in any political campaigns.
MacArthur funds may also have been appropriately used for other lawful advocacy and educational purposes, including non-partisan analysis and research as permitted under the grant agreement.

Safety and Justice ChallengeEvaluation Report (2015–2017)
Executive Summary . . . . . . . . . . . . . . . . . . . . . . . . . . . . . . . . . . . . . . . . . . . . . . . . . . . . . . . . . . . . . . . . . . . . . . . . . . . . . . . . . . . . . . . . . . . . . . . . .1
Key Findings . . . . . . . . . . . . . . . . . . . . . . . . . . . . . . . . . . . . . . . . . . . . . . . . . . . . . . . . . . . . . . . . . . . . . . . . . . . . . . . . . . . . . . . . . . . . . . . . . . . . . . . . .2
National and Implementation Site Landscape. . . . . . . . . . . . . . . . . . . . . . . . . . . . . . . . . . . . . . . . . . . . . . . . . . . . . . . . . . . . . . . . . . . . . . . .3
National and Implementation Site Polling Results. . . . . . . . . . . . . . . . . . . . . . . . . . . . . . . . . . . . . . . . . . . . . . . . . . . . . . . . . . . . . . . . . . . .3
Media Reporting of Jail and Related Issues . . . . . . . . . . . . . . . . . . . . . . . . . . . . . . . . . . . . . . . . . . . . . . . . . . . . . . . . . . . . . . . . . . . . . . . . . .4
Crime Rates and Criminal Justice Costs . . . . . . . . . . . . . . . . . . . . . . . . . . . . . . . . . . . . . . . . . . . . . . . . . . . . . . . . . . . . . . . . . . . . . . . . . . . . . .4
Safety and Justice Challenge Implementation Site Planning Processes. . . . . . . . . . . . . . . . . . . . . . . . . . . . . . . . . . . . . . . . . . . . . .4
Baseline Outcome Findings . . . . . . . . . . . . . . . . . . . . . . . . . . . . . . . . . . . . . . . . . . . . . . . . . . . . . . . . . . . . . . . . . . . . . . . . . . . . . . . . . . . . . . . . . .5
Early Implementation Outcome Findings . . . . . . . . . . . . . . . . . . . . . . . . . . . . . . . . . . . . . . . . . . . . . . . . . . . . . . . . . . . . . . . . . . . . . . . . . . . .5
Conclusions. . . . . . . . . . . . . . . . . . . . . . . . . . . . . . . . . . . . . . . . . . . . . . . . . . . . . . . . . . . . . . . . . . . . . . . . . . . . . . . . . . . . . . . . . . . . . . . . . . . . . . . . . . .5
Background: MacArthur’s 30 Years of Investments to Improve U .S . Justice Systems . . . . . . . . . . . . . . . . . . . . . . . . . . . . . .6
Introduction . . . . . . . . . . . . . . . . . . . . . . . . . . . . . . . . . . . . . . . . . . . . . . . . . . . . . . . . . . . . . . . . . . . . . . . . . . . . . . . . . . . . . . . . . . . . . . . . . . . . . . . . .7
MacArthur Invests Over $117 Million in the Safety and Justice Challenge . . . . . . . . . . . . . . . . . . . . . . . . . . . . . . . . . . . . . . . . . .8
Report Roadmap: Prologue, Start-up, and Early Implementation . . . . . . . . . . . . . . . . . . . . . . . . . . . . . . . . . . . . . . . . . . . . . . . . . . . .9
Summary . . . . . . . . . . . . . . . . . . . . . . . . . . . . . . . . . . . . . . . . . . . . . . . . . . . . . . . . . . . . . . . . . . . . . . . . . . . . . . . . . . . . . . . . . . . . . . . . . . . . . . . . . . . 10
Section 1 . . . . . . . . . . . . . . . . . . . . . . . . . . . . . . . . . . . . . . . . . . . . . . . . . . . . . . . . . . . . . . . . . . . . . . . . . . . . . . . . . . . . . . . . . . . . . . . . . . . . . . . . . . . 11
Prologue: Overincarceration Is More Than Prisons . . . . . . . . . . . . . . . . . . . . . . . . . . . . . . . . . . . . . . . . . . . . . . . . . . . . . . . . . . . . . . . 11
The Problem: The Overuse and Misuse of Incarceration. . . . . . . . . . . . . . . . . . . . . . . . . . . . . . . . . . . . . . . . . . . . . . . . . . . . . . . . . . . 11
MacArthur’s Response to Overincarceration: Promote a Fairer, More Just, and Equitable Use of Jails . . . . . . . . . . . 14
MacArthur’s Approach to Systems Reform: Models of Local Reforms . . . . . . . . . . . . . . . . . . . . . . . . . . . . . . . . . . . . . . . . . . . . 19
Comprehensive Communications: Amplify Solutions and Spread Reforms. . . . . . . . . . . . . . . . . . . . . . . . . . . . . . . . . . . . . . . . 22
Research and Knowledge Development . . . . . . . . . . . . . . . . . . . . . . . . . . . . . . . . . . . . . . . . . . . . . . . . . . . . . . . . . . . . . . . . . . . . . . . . . . . 25
Summary . . . . . . . . . . . . . . . . . . . . . . . . . . . . . . . . . . . . . . . . . . . . . . . . . . . . . . . . . . . . . . . . . . . . . . . . . . . . . . . . . . . . . . . . . . . . . . . . . . . . . . . . . . . 26
Section 2 . . . . . . . . . . . . . . . . . . . . . . . . . . . . . . . . . . . . . . . . . . . . . . . . . . . . . . . . . . . . . . . . . . . . . . . . . . . . . . . . . . . . . . . . . . . . . . . . . . . . . . . . . . . 27
Evaluation Design and Key Criminal Justice Impact Indicators . . . . . . . . . . . . . . . . . . . . . . . . . . . . . . . . . . . . . . . . . . . . . . . . . . . . 27
Evaluation Design: RTI as Evaluation and Learning Partner. . . . . . . . . . . . . . . . . . . . . . . . . . . . . . . . . . . . . . . . . . . . . . . . . . . . . . . . 27
Landscape and Context: Reduced Jail Populations and Disparity, but Growing Pretrial Populations . . . . . . . . . . . . . 28
Summary . . . . . . . . . . . . . . . . . . . . . . . . . . . . . . . . . . . . . . . . . . . . . . . . . . . . . . . . . . . . . . . . . . . . . . . . . . . . . . . . . . . . . . . . . . . . . . . . . . . . . . . . . . . 34
Section 3 . . . . . . . . . . . . . . . . . . . . . . . . . . . . . . . . . . . . . . . . . . . . . . . . . . . . . . . . . . . . . . . . . . . . . . . . . . . . . . . . . . . . . . . . . . . . . . . . . . . . . . . . . . . 35
Public Opinion and Media Reporting . . . . . . . . . . . . . . . . . . . . . . . . . . . . . . . . . . . . . . . . . . . . . . . . . . . . . . . . . . . . . . . . . . . . . . . . . . . . . . 35
Impact Indicator 2: Attitudes and Media Reporting about Local Criminal Justice Systems. . . . . . . . . . . . . . . . . . . . . . . . 35
Impact Indicator 2.1: Perceptions About Racial and Ethnic Disparities in Local Criminal Justice Systems . . . . . . . . 36
Impact Indicator 2.2: Perceptions of Fairness of Local Criminal Justice Systems . . . . . . . . . . . . . . . . . . . . . . . . . . . . . . . . . . 38
Conversation Growth: Increased Reporting on Criminal Justice Issues, Nationally and in the
Implementation Sites . . . . . . . . . . . . . . . . . . . . . . . . . . . . . . . . . . . . . . . . . . . . . . . . . . . . . . . . . . . . . . . . . . . . . . . . . . . . . . . . . . . . . . . . . . . . . . . 39
Summary . . . . . . . . . . . . . . . . . . . . . . . . . . . . . . . . . . . . . . . . . . . . . . . . . . . . . . . . . . . . . . . . . . . . . . . . . . . . . . . . . . . . . . . . . . . . . . . . . . . . . . . . . . . 42
Section 4 . . . . . . . . . . . . . . . . . . . . . . . . . . . . . . . . . . . . . . . . . . . . . . . . . . . . . . . . . . . . . . . . . . . . . . . . . . . . . . . . . . . . . . . . . . . . . . . . . . . . . . . . . . . 44
Tracking Crime Rates and Criminal Justice Costs . . . . . . . . . . . . . . . . . . . . . . . . . . . . . . . . . . . . . . . . . . . . . . . . . . . . . . . . . . . . . . . . . 44
Impact Indicator 3: Track the Unintended Consequences of Change . . . . . . . . . . . . . . . . . . . . . . . . . . . . . . . . . . . . . . . . . . . . . . 44
Impact Indicator 3.2: Total Local Criminal Justice Expenditures . . . . . . . . . . . . . . . . . . . . . . . . . . . . . . . . . . . . . . . . . . . . . . . . . . . 46
Summary . . . . . . . . . . . . . . . . . . . . . . . . . . . . . . . . . . . . . . . . . . . . . . . . . . . . . . . . . . . . . . . . . . . . . . . . . . . . . . . . . . . . . . . . . . . . . . . . . . . . . . . . . . . 47
Contents

Safety and Justice ChallengeEvaluation Report (2015–2017)
Section 5 . . . . . . . . . . . . . . . . . . . . . . . . . . . . . . . . . . . . . . . . . . . . . . . . . . . . . . . . . . . . . . . . . . . . . . . . . . . . . . . . . . . . . . . . . . . . . . . . . . . . . . . . . . . 49
Moving Beyond the Numbers . . . . . . . . . . . . . . . . . . . . . . . . . . . . . . . . . . . . . . . . . . . . . . . . . . . . . . . . . . . . . . . . . . . . . . . . . . . . . . . . . . . . . 49
Systems Change Requires Changing Organizational Cultures . . . . . . . . . . . . . . . . . . . . . . . . . . . . . . . . . . . . . . . . . . . . . . . . . . . . . 50
Planning Phase . . . . . . . . . . . . . . . . . . . . . . . . . . . . . . . . . . . . . . . . . . . . . . . . . . . . . . . . . . . . . . . . . . . . . . . . . . . . . . . . . . . . . . . . . . . . . . . . . . . . . 50
Change Over Time: Planning and Implementation . . . . . . . . . . . . . . . . . . . . . . . . . . . . . . . . . . . . . . . . . . . . . . . . . . . . . . . . . . . . . . . . . 52
Summary . . . . . . . . . . . . . . . . . . . . . . . . . . . . . . . . . . . . . . . . . . . . . . . . . . . . . . . . . . . . . . . . . . . . . . . . . . . . . . . . . . . . . . . . . . . . . . . . . . . . . . . . . . . 57
Section 6 . . . . . . . . . . . . . . . . . . . . . . . . . . . . . . . . . . . . . . . . . . . . . . . . . . . . . . . . . . . . . . . . . . . . . . . . . . . . . . . . . . . . . . . . . . . . . . . . . . . . . . . . . . . 58
Early Implementation Outcome Findings . . . . . . . . . . . . . . . . . . . . . . . . . . . . . . . . . . . . . . . . . . . . . . . . . . . . . . . . . . . . . . . . . . . . . . . . . 58
Most Sites Reduced ADP and Bookings and Increased Pretrial Populations . . . . . . . . . . . . . . . . . . . . . . . . . . . . . . . . . . . . . . 58
Outcome Indicator: Early Implementation Changes in ADP . . . . . . . . . . . . . . . . . . . . . . . . . . . . . . . . . . . . . . . . . . . . . . . . . . . . . . . 59
Outcome Indicator: Early Implementation Changes in Bookings . . . . . . . . . . . . . . . . . . . . . . . . . . . . . . . . . . . . . . . . . . . . . . . . . . 60
Outcome Indicator: Early Implementation Changes in Length of Stay (LOS) . . . . . . . . . . . . . . . . . . . . . . . . . . . . . . . . . . . . . . 60
Outcome Indicator: Early Implementation Changes in Pretrial/Awaiting Action . . . . . . . . . . . . . . . . . . . . . . . . . . . . . . . . . . 61
Summarizing the Trends in Outcomes at Early Implementation . . . . . . . . . . . . . . . . . . . . . . . . . . . . . . . . . . . . . . . . . . . . . . . . . . . 63
Contextualizing Numbers . . . . . . . . . . . . . . . . . . . . . . . . . . . . . . . . . . . . . . . . . . . . . . . . . . . . . . . . . . . . . . . . . . . . . . . . . . . . . . . . . . . . . . . . . . 64
Summary and Conclusions . . . . . . . . . . . . . . . . . . . . . . . . . . . . . . . . . . . . . . . . . . . . . . . . . . . . . . . . . . . . . . . . . . . . . . . . . . . . . . . . . . . . . . . . . 66
Conclusions . . . . . . . . . . . . . . . . . . . . . . . . . . . . . . . . . . . . . . . . . . . . . . . . . . . . . . . . . . . . . . . . . . . . . . . . . . . . . . . . . . . . . . . . . . . . . . . . . . . . . . . . 67
References . . . . . . . . . . . . . . . . . . . . . . . . . . . . . . . . . . . . . . . . . . . . . . . . . . . . . . . . . . . . . . . . . . . . . . . . . . . . . . . . . . . . . . . . . . . . . . . . . . . . . . . . . 70
Appendix A . Data Selection . . . . . . . . . . . . . . . . . . . . . . . . . . . . . . . . . . . . . . . . . . . . . . . . . . . . . . . . . . . . . . . . . . . . . . . . . . . . . . . . . . . . . . . 71
Description of Criminal Justice Data . . . . . . . . . . . . . . . . . . . . . . . . . . . . . . . . . . . . . . . . . . . . . . . . . . . . . . . . . . . . . . . . . . . . . . . . . . . . . . . 71
Key Indicators . . . . . . . . . . . . . . . . . . . . . . . . . . . . . . . . . . . . . . . . . . . . . . . . . . . . . . . . . . . . . . . . . . . . . . . . . . . . . . . . . . . . . . . . . . . . . . . . . . . . . . 71
Appendix B . Media Monitoring Methods . . . . . . . . . . . . . . . . . . . . . . . . . . . . . . . . . . . . . . . . . . . . . . . . . . . . . . . . . . . . . . . . . . . . . . . . . 74
Appendix C . Public Opinion Polling Methodology . . . . . . . . . . . . . . . . . . . . . . . . . . . . . . . . . . . . . . . . . . . . . . . . . . . . . . . . . . . . . . . . . 80
Appendix D . Glossary of Key Terms . . . . . . . . . . . . . . . . . . . . . . . . . . . . . . . . . . . . . . . . . . . . . . . . . . . . . . . . . . . . . . . . . . . . . . . . . . . . . . . 85
Contents

Safety and Justice ChallengeEvaluation Report (2015–2017)
Figure 1 . U .S . Rate of Prison and Jail Populations, 1925–2016, per 100,000 . . . . . . . . . . . . . . . . . . . . . . . . . . . . . . . . . . . . . . 12
Figure 2 . Theory of Change . . . . . . . . . . . . . . . . . . . . . . . . . . . . . . . . . . . . . . . . . . . . . . . . . . . . . . . . . . . . . . . . . . . . . . . . . . . . . . . . . . . . . . . . 16
Figure 3 . Twenty Initial Safety and Justice Challenge Network Sites . . . . . . . . . . . . . . . . . . . . . . . . . . . . . . . . . . . . . . . . . . . . . . 19
Figure 4 . Total MacArthur Investments in Implementation Sites and Partners, 2015–2017 . . . . . . . . . . . . . . . . . . . . . . 22
Figure 5 . Safety and Justice Challenge Strategic Allies as of 2017 . . . . . . . . . . . . . . . . . . . . . . . . . . . . . . . . . . . . . . . . . . . . . . . . . 24
Figure 6 . Impact Indicator 1 .1a: Average Daily Number of People in Jail, National Data 2010–2016 . . . . . . . . . . . . . 29
Figure 7 . Impact Indicator 1 .1b: Average Daily Number of People in Jail, Safety and Justice Challenge
Implementation Sites, 2010–2015 . . . . . . . . . . . . . . . . . . . . . . . . . . . . . . . . . . . . . . . . . . . . . . . . . . . . . . . . . . . . . . . . . . . . . . . . . . 30
Figure 8 . Impact Indicator 1 .2: Jail Population Disparity Gap Measure, 2010–2015 . . . . . . . . . . . . . . . . . . . . . . . . . . . . . . 32
Figure 9 . Impact Indicator 1 .3: Percentage of Jail Populations Unconvicted, 2010–2015 . . . . . . . . . . . . . . . . . . . . . . . . . 33
Figure 10 . Impact Indicator 2 .1: Perceptions About Reasons for Racial and Ethnic Disparities in Local
Criminal Justice Systems . . . . . . . . . . . . . . . . . . . . . . . . . . . . . . . . . . . . . . . . . . . . . . . . . . . . . . . . . . . . . . . . . . . . . . . . . . . . . . . . . . . . 37
Figure 11 . Impact Indicator 2 .1: Perceptions About Racial and Ethnic Disparities in Local
Criminal Justice Systems . . . . . . . . . . . . . . . . . . . . . . . . . . . . . . . . . . . . . . . . . . . . . . . . . . . . . . . . . . . . . . . . . . . . . . . . . . . . . . . . . . . . 37
Figure 12 . Impact Indicator 2 .2: Perceptions of Fairness of Local Criminal Justice Systems . . . . . . . . . . . . . . . . . . . . . . 38
Figure 13 . Media Reporting about Criminal Justice Issues, 2013–2017 . . . . . . . . . . . . . . . . . . . . . . . . . . . . . . . . . . . . . . . . . . . 40
Table 1 . Media Reporting Changes in Narrative, National Media 2013–2017 . . . . . . . . . . . . . . . . . . . . . . . . . . . . . . . . . . . . . 41
Figure 14 . Changes in National Narrative Continued, 2013–2017 . . . . . . . . . . . . . . . . . . . . . . . . . . . . . . . . . . . . . . . . . . . . . . . . . 41
Figure 15 . Front-End Criminal Justice System Topics in National Narrative, 2013–2017 . . . . . . . . . . . . . . . . . . . . . . . . . . 42
Figure 16 . Impact Indicator 3 .1a: Violent Crime Rates, 2010–2015 . . . . . . . . . . . . . . . . . . . . . . . . . . . . . . . . . . . . . . . . . . . . . . . 45
Figure 17 . Impact Indicator 3 .1b: Homicide Rates per 100,000, 2010–2015 . . . . . . . . . . . . . . . . . . . . . . . . . . . . . . . . . . . . . . 45
Figure 18 . Impact Indicator 3 .2: Local Criminal Justice Expenditures, 2010–2015 . . . . . . . . . . . . . . . . . . . . . . . . . . . . . . . . 46
Figure 19 . Implementation Site Summary of Trends between 2010 and 2015 Implementation Sites . . . . . . . . . . . . . 48
Figure 20 . Participation in Planning Phase Activities . . . . . . . . . . . . . . . . . . . . . . . . . . . . . . . . . . . . . . . . . . . . . . . . . . . . . . . . . . . . . . .51
Figure 21 . Trends in Stakeholder Perceptions about Team Functioning . . . . . . . . . . . . . . . . . . . . . . . . . . . . . . . . . . . . . . . . . . . 53
Figure 22. Staffing and Coordination Activities Pose Increasing Challenges . . . . . . . . . . . . . . . . . . . . . . . . . . . . . . . . . . . . . . 54
Figure 23 . Challenges Facing the Implementation Teams . . . . . . . . . . . . . . . . . . . . . . . . . . . . . . . . . . . . . . . . . . . . . . . . . . . . . . . . . 55
Figure 24 . Site Implementation Strategies . . . . . . . . . . . . . . . . . . . . . . . . . . . . . . . . . . . . . . . . . . . . . . . . . . . . . . . . . . . . . . . . . . . . . . . . . 57
Figure 25 . Implementation Site Summary of Trends between 2015 and 2017 . . . . . . . . . . . . . . . . . . . . . . . . . . . . . . . . . . . . 59
Figure 26 . Changes in ADP, 2015–2017, for Implementation Sites . . . . . . . . . . . . . . . . . . . . . . . . . . . . . . . . . . . . . . . . . . . . . . . . 60
Figure 27 . Changes in Bookings, 2015–2017, for Implementation Sites . . . . . . . . . . . . . . . . . . . . . . . . . . . . . . . . . . . . . . . . . . . 61
Figure 28 . Changes in Length of Stay, 2015–2017, for Implementation Sites . . . . . . . . . . . . . . . . . . . . . . . . . . . . . . . . . . . . . . 62
Figure 29 . Changes in Unconvicted Populations, 2015–2017, for Implementation Sites . . . . . . . . . . . . . . . . . . . . . . . . . . 62
Table 2 . Summary of Changes in Outcome Indicators Through Early Implementation, 2015–2017 . . . . . . . . . . . . . . . 63
Table A-1 . Percentage of County-Level Jail Data by Year, Variable, and Source . . . . . . . . . . . . . . . . . . . . . . . . . . . . . . . . . . . 73
Table B-1 . Media Scan: Table of Search Terms . . . . . . . . . . . . . . . . . . . . . . . . . . . . . . . . . . . . . . . . . . . . . . . . . . . . . . . . . . . . . . . . . . . . . 75
Table B-2. Number of Articles Identified Each Month: CustomScoop . . . . . . . . . . . . . . . . . . . . . . . . . . . . . . . . . . . . . . . . . . . . . 76
Table B-3. Number of Articles Identified Each Month: LexisNexis . . . . . . . . . . . . . . . . . . . . . . . . . . . . . . . . . . . . . . . . . . . . . . . . 77
Table B-4 . Articles Received from CustomScoop and Diffbot . . . . . . . . . . . . . . . . . . . . . . . . . . . . . . . . . . . . . . . . . . . . . . . . . . . . . 78
Table B-5 . Confusion Matrix . . . . . . . . . . . . . . . . . . . . . . . . . . . . . . . . . . . . . . . . . . . . . . . . . . . . . . . . . . . . . . . . . . . . . . . . . . . . . . . . . . . . . . . 79
Table C-1 . Local Criminal Justice Survey Samples . . . . . . . . . . . . . . . . . . . . . . . . . . . . . . . . . . . . . . . . . . . . . . . . . . . . . . . . . . . . . . . . . 82
Table C-2 . SJC Site Samples by Year . . . . . . . . . . . . . . . . . . . . . . . . . . . . . . . . . . . . . . . . . . . . . . . . . . . . . . . . . . . . . . . . . . . . . . . . . . . . . . . 83
Table C-3 . Descriptive Statistics by Sample . . . . . . . . . . . . . . . . . . . . . . . . . . . . . . . . . . . . . . . . . . . . . . . . . . . . . . . . . . . . . . . . . . . . . . . . 84
List of Figures & Tables

1Safety and Justice ChallengeEvaluation Report (2015–2017)
In 2015, the John D. and Catherine T. MacArthur Foundation (MacArthur) launched an initiative to tackle one of America’s greatest social problems—overincarceration in local jurisdictions. This overreliance on jails has disproportionately impacted communities of color, those too poor to post bail, nonviolent offenders, and persons with mental illness. Through the Safety and Justice Challenge, MacArthur supports cities and counties across the country to safely reduce the use and misuse of jails. With an understanding that the U.S. jail population more than tripled and the associated expenditures to facilitate this mass incarceration increased over 200% since the 1980s (Subramanian, Delaney, Roberts, Fishman, & McGary, 2015), MacArthur has made a long-term commitment to identify, support, and demonstrate the possibility for local criminal justice reforms aimed at reducing overincarceration.
Between 2015 and 2017, MacArthur invested over $117 million in this initiative to provide financial and technical support to local jurisdictions’ efforts to rethink justice systems and implement data-driven strategies to safely reduce jail populations. In addition to funding Implementation Sites, they have engaged
Executive Summary
The overreliance on incarceration is one of the greatest challenges facing America. The United States has come to rely on incarceration as a response to a host of problems.
The overreliance onincarceration is one of the greatest challenges facing America. The United States has come to rely on incarceration as a response to a host of problems.

Safety and Justice ChallengeEvaluation Report (2015–2017)
Executive Summary
strategic allies and community stakeholders to investigate the key drivers of overincarceration, improve local criminal justice systems, and build infrastructure for data tracking and performance monitoring. The infrastructure for the Safety and Justice Challenge includes site coordinators and strategic allies to provide training and technical assistance, the City University of New York (CUNY) Institute for State and Local Governance (ISLG) to provide data analysis and performance metrics, and the JFA Institute to assist with population projections and assessments. Communication activities, such as support for the Marshall Project and assistance with local stories in the Implementation Sites, are also being supported. An independent evaluator, RTI International, has been engaged to assess implementation, outcomes, and impacts. MacArthur acknowledges the complexity of local criminal justice systems and reform efforts necessary to make demonstrable change as explicated in their theory of change and is committed to provide the support to ensure success.
The purpose of this report is to describe the context and baseline trends related to the Safety and Justice Challenge. To this end, the report introduces the evaluation design for assessing the implementation process, outcomes, and impacts. To begin this story, the following sections include baseline trends for key criminal justice indicators, including jail populations, crime rates, criminal justice system expenditures; firsthand accounts of accomplishments and challenges relayed by on-the-ground stakeholders; and initial site-level findings across key outcome indicators. The conclusion highlights the accomplishments of the Safety and Justice Challenge across sites and describes the challenges of implementing an initiative of this magnitude.
Key FindingsThe key findings provide a landscape for understanding the Safety and Justice Challenge. Much of the information in this report describes baseline trends nationally and in the Implementation Sites in public opinion, key outcome indicators, and results from media scans to measure the impact of reform efforts. The baseline period spanned from 2010 to 2015. Between 2015 and 2017, MacArthur invested
2

3Safety and Justice ChallengeEvaluation Report (2015–2017)
Executive Summary
more than $117 million in the Safety and Justice Challenge, including providing support to 20 Implementation Sites (initially 10 Core Sites and 10 Partner Sites with all converted to Implementation Sites as the start-up continued); two sites subsequently withdrew from the Challenge Network. Much of the data were obtained from public sources, but some were obtained specifically for this evaluation, including some site-level outcome data collected by the ISLG.1
National and Implementation Site Landscape
• The national average daily population (ADP) of people in jail decreased nearly 4% between 2010 and 2015.
• The ADP of people in jail decreased by 14% in the 18 Safety and Justice Challenge Implementation Sites between 2010 and 2015.2
• Implementation Sites had higher percentages of confined individuals who were unconvicted than the national percentage throughout the 2010–2015 period.
• Racial and ethnic disparity of jail populations at the national level and within Implementation Sites decreased between 2010 and 2015.
National and Implementation Site Polling Results
• There were consistent racial differences with respect to perceptions of fairness in the criminal justice system both nationally and within Implementation Sites, with non-white respondents less likely than white respondents to view the criminal justice system as fair.
• Nationally, perceptions that local criminal justice systems are fair increased between 2015 and 2017, although there was little change in the Implementation Sites.
• White and non-white respondents nationally and in Implementation Sites agreed that higher poverty rates for people of color influence jail disparity.
• In the Implementation Sites and nationally, non-white respondents were more likely than white respondents to view (1) over-policing of people of color and (2) harsher sentences for people of color as reasons for racial and ethnic disparities in jail populations.
• The percentage of white respondents nationally who reported that racial and ethnic disparities in jail populations were due to people of color committing
1 Acquiring county-level data on key criminal justice metrics has been a challenge for this evaluation. The trend analyses use publicly available county-level data collected by the Bureau of Justice Statistics (BJS) and the Uniform Crime Reporting system (UCR). There is at least a year-long lag between when these organizations collect the data and when they are publicly released by the Inter-University Consortium of Political and Social Research (ICPSR). For example, as of late summer 2018, UCR and BJS county-level data for 2016 have not been made available from ICPSR. Where feasible, supplemental data have been acquired from web searches, ISLG, and direct data requests.
2 Early in this initiative, 2 of the original 20 Implementation Sites withdrew from the Safety and Justice Challenge. As a result, outcome findings from only 18 Implementation Sites are summarized in this report.

4Safety and Justice ChallengeEvaluation Report (2015–2017)
Executive Summary
more crimes declined from 51% to 45% between 2015 and 2017, while there was little change in the perception among non-white respondents that disparity was due to minorities committing more crime (29% in 2015 compared with 28% in 2017).
Media Reporting of Jail and Related Issues
• Between 2013 and 2015, news coverage of jail-related issues increased nationally and in Implementation Sites.
• In general, the most popular topics referenced in relevant criminal justice articles were consistent between 2013 and 2015.3 For example, “criminal justice,” “law enforcement,” “mental health,” and “public safety” were each among the top 10 topics in both 2013 and 2015.
• “Justice reform” received increased attention over time—moving from the 100th most popular topic in 2013 to the 6th most popular topic in 2015.
Crime Rates and Criminal Justice Costs
• Violent crime decreased 5% across the nation and 8% in the Implementation Sites between 2010 and 2014.
• Nationally, homicide rates increased by 0.2 per 100,000 between 2010 and 2015 but decreased by 1.7 per 100,000 in the Implementation Sites.
• Between 2010 and 2015, state and local governments spent annually, $23 billion, $28 billion, and $89 billion on courts, corrections, and policing, respectively.
• In 2010, total local criminal justice costs were $131 billion, increasing to $140 billion in 2015.
Safety and Justice Challenge Implementation Site Planning Processes
• There was overwhelming participation by the Implementation Sites in key planning phase activities, with nearly 90% of stakeholders who responded to a web-based survey reporting that they were highly involved with activities related to strategy development for reducing their local jail populations and racial/ethnic disparities.
• Although there was consensus that the planning and implementation teams’ role clarity, cohesion, and agreement on strategies are strong in general, there was some decrease in agreement as work moved from the planning phase to the implementation phase.
• The top challenges reported by stakeholders were the need for additional funding (90% “very” or “moderately” challenging) and the national political climate (86%).
3 Popularity here is measured by the number of articles that include the term, ranked in order by year. The media scan begins with articles published in 2013.

5Safety and Justice ChallengeEvaluation Report (2015–2017)
Executive Summary
• The original cohort of 10 Safety and Justice Challenge Implementation Sites planned a total of 84 distinct strategies or projects.
Baseline Outcome Findings
• Prior to Safety and Justice Challenge implementation (between 2010 and 2015), the following trends in outcome indicators occurred in the Implementation Sites:
ʳ Average daily jail population and admissions decreased in 15 of 18 sites.
ʳ Percentage of jail populations unconvicted increased in 12 sites.
ʳ Non-white proportion in the confined population decreased in 11 sites.
ʳ Violent and homicide crime rates decreased in 10 and 13 sites, respectively.
Early Implementation Outcome Findings
• Between 2015 and late 2017, the following trends in outcome indicators occurred in the Implementation Sites:
ʳ Average daily jail population decreased in 10 sites.
ʳ Bookings decreased in 13 sites.
ʳ Length of stay decreased in 7 sites.
ʳ Percentage of confined population that is unconvicted decreased in 5 sites.
• Four sites had improvements in three of four key criminal justice indicators between 2015 and 2017.
• Two sites had no reductions in key criminal justice indicators between 2015 and 2017.

6Safety and Justice ChallengeEvaluation Report (2015–2017)
Conclusions
• As of 2017, MacArthur has invested more than $117 million in the Safety and Justice Challenge to reduce the overuse and misuse of jails, providing funding and support to 18 Implementation Sites and spreading the word more broadly through a series of communication and dissemination strategies.
• During the 2010–2015 baseline period (prior to the Safety and Justice Challenge), average daily jail populations and racial and ethnic disparity declined nationally and in the Implementation Sites, while violent crime rates also fell. Local criminal justice expenditures were mostly flat across that period.
• During early implementation (2015–2017), most Implementation Sites had decreases in average daily jail populations and bookings, although some had increases. Some sites also saw decreases in length of stay and the percentage of confined population that was unconvicted.
• Poll results suggest that between 2015 and 2017, the percentage of respondents who viewed their local criminal justice systems as fair increased.
• Justice reform emerged as a “top 5” topic in media reporting between 2013 (when it was the 100th most popular topic) and 2015 (when it was 6th).
Executive Summary

7Safety and Justice ChallengeEvaluation Report (2015–2017)
Background: MacArthur’s 30 Years of Investments to Improve U .S . Justice Systems In February 2015, the MacArthur Foundation (MacArthur) announced the Safety and Justice Challenge—a major initiative to support local criminal justice system reforms across the United States. MacArthur’s current investment is part of nearly three decades of investments to create a more fair, effective, and humane justice system in America. This report explores MacArthur’s contributions to reforming local criminal justice systems through the Safety and Justice Challenge.
MacArthur has developed an approach that invests in local solutions to reduce jail populations that alleviate the negative impact of local criminal justice systems on communities of color, low-income people, and people with mental health and substance abuse issues. These local solutions are expected to spread and achieve national reductions in jail populations without increasing overall costs or weakening public safety.
Throughout the late 1990s and early 2000s, MacArthur’s justice programs supported several seminal criminal justice projects. For instance, the Project on Human Development in Chicago Neighborhoods (PHDCN) found that collective efficacy (e.g., shared norms, social support, and trusting relationships) is a major
The Safety and JusticeChallenge is MacArthur’sresponse to the problem ofoverincarceration.
The Safety and JusticeChallenge is MacArthur’sresponse to the problem ofoverincarceration.
Introduction

8Safety and Justice ChallengeEvaluation Report (2015–2017)
Introduction
“protective factor” (i.e., community-level trust reduces crime) for neighborhoods (Sampson, Raudenbush, & Earls, 1997). PHDCN is one of the more frequently cited studies in criminological research, and, according to the Inter-University Consortium on Political and Social Research, the PHDCN data have been used in more than 550 publications, many of which demonstrate the relationship between neighborhood development and the psychological well-being of young people. MacArthur also funded the influential Research Network on Adolescent Development and Juvenile Justice (from 1997 to 2009). The work of this Network established that juveniles are developmentally different than adults and broadened the base of knowledge about juvenile crime and delinquency.
Building on this work, MacArthur invested over $120 million into juvenile justice reforms with Models for Change (MfC). Through MfC, MacArthur spearheaded foundational research and policy networks in more than 35 states. This knowledge has been used to make policy and legal changes (e.g., Roper v. Simmons, 2005, 543 U.S. 551) that have contributed to large decreases in juvenile incarceration rates.
With the Safety and Justice Challenge, MacArthur is investing in a series of local criminal justice systems reforms to reduce jail incarceration, reduce racial/ethnic disparities, and maintain public safety. In 2014, the National Academies of Sciences (NAS) released a report funded by MacArthur and the National Institute of Justice that summarized the research about the more than fivefold increase in incarceration rates since the 1970s, making the United States the world leader in incarceration rates (Travis, Western, and Redburn, 2014).4 The NAS report serves as an authoritative statement about the causes and consequences of overincarceration and highlights that the U.S. landscape since the mid-1970s has been characterized by decades of increasing incarceration rates and, since the 1990s, decreasing crime rates.
MacArthur Invests Over $117 Million in the Safety and Justice Challenge
MacArthur’s criminal justice investments identified several systemic problems with criminal justice systems in the United States. At the heart of these problems is the overreliance on incarceration as a response to social problems. MacArthur launched the Safety and Justice Challenge with an initial commitment of $75 million with the mission “to reduce overincarceration by changing the way America thinks about and uses jails.” This investment has grown to over $117 million as of 2017. The launch of the Safety and Justice Challenge was a call to action for criminal justice agencies, policy makers, and practitioners across the country and was timed alongside the MacArthur-funded Vera Institute of Justice’s release of their report Incarceration’s front door: The misuse of jails in America.
With the launch of the Safety and Justice Challenge, MacArthur simultaneously joined existing reform efforts underway and provided a new lens to view justice
4 Although the term “mass incarceration” has been widely used to describe the historic increase in correctional populations in the United States since 1970, MacArthur uses the term “overincarceration” to emphasize that the amount of incarceration in the United States is disproportionate to that of other western democracies when compared with crime rates.

9Safety and Justice ChallengeEvaluation Report (2015–2017)
Introduction
reforms. That is, notable organizations such as the Pew Charitable Trusts and the Open Society Foundations (among others) were investing in sentencing reforms mostly by focusing on changing sentencing structures, eliminating mandatory minimums, and reducing prison time for drug and nonviolent crimes.5 These reforms are worthwhile, meaningful, and insightful, but as the NAS report hinted and the Vera report fully exposed, the misuse and overuse of incarceration begins in county jails.
The Safety and Justice Challenge is MacArthur’s response to the problem of overincarceration. The strategic approach is informed through decades of investments by MacArthur, builds on more recent findings from the NAS and Vera reports, and provides an alternative yet complementary approach to systems change efforts brought about by others in the philanthropic community.
Report Roadmap: Prologue, Start-up, and Early Implementation
This report tells the initial story of the Safety and Justice Challenge. The report is divided into the following sections. Section 1 is the Prologue and sets the stage for the need for criminal justice systems reforms. We introduce the problem of overincarceration and MacArthur’s response with local systems reforms that are detailed within their theory of change. In Section 2, we introduce the evaluation design and provide baseline measures of key criminal justice indicators. Section 3 reports results from multiple waves of a public opinion survey and assesses trends in media reporting about criminal justice issues. Section 4 reviews trends in violent crime and homicide rates, as well as spending on local criminal justice systems. Section 5 reports firsthand accounts of accomplishments and challenges as understood by stakeholders in the local criminal justice jurisdictions funded to
5 Numerous philanthropies are investing in criminal justice efforts; others include the Laura and John Arnold Foundation, Ford Foundation, Public Welfare Foundation, Open Society Foundations, and Atlantic Philanthropies. Some of these foundations provide relatively small investments in jail activities, with less emphasis on systems change initiatives, whereas others are making large investments in criminal justice reforms.
10Safety and Justice ChallengeEvaluation Report (2015–2017)
Introduction
implement reforms. Section 6 details initial findings during the early implementation of site-level reforms across key outcome indicators.
Summary
The findings reveal the Safety and Justice Challenge as an initiative that has energy, ambition, and potential to develop local models of reform that may spread to inform a national movement. The findings also confirm MacArthur’s theory of change that implementing key local reforms is possible, although challenging. Data show that systems reform is moving slower than planned thus far. After 2 years of implementation funding between 2015 and 2017, some jurisdictions have made serious reductions in jail populations, whereas others are struggling to fully implement their reforms, and other jurisdictions have seen their jail populations grow. Additionally, in 2016, there was a nontrivial increase in national jail populations. Generating meaningful community engagement and reducing racial and ethnic disparities have proven to be challenges in nearly all sites.
The MacArthur Foundation has responded to these initial results with several adjustments. The phenomenon of overincarceration developed over the course of 40 years and created operational norms, expectations, and practices that are still in place. The stakeholders in the Implementation Sites and MacArthur jointly are demonstrating that they are committed to systems reform and appear to have the patience, ambition, and creativity to work toward local systems reforms (Garduque, 2017).

11Safety and Justice ChallengeEvaluation Report (2015–2017)
Prologue: Overincarceration Is More Than Prisons
The Problem: The Overuse and Misuse of Incarceration
Over the past 40 years, local criminal justice systems have responded with arrest and incarceration to homelessness, substance abuse, and other social disorders. The overreliance on incarceration disproportionately affects vulnerable populations including communities of color, the poor, and people with mental health and substance abuse issues. Increasing reliance on incarceration began in the mid-1970s and the financial, social, and moral costs of high incarceration rates have led policymakers, activists, and citizens to question whether the extensive use of incarceration is appropriate.
Figure 1 shows two important national trends related to overincarceration. First, it is evident that the United States has had significant growth in correctional populations since the 1970s. Second, this growth was a stark break with nearly a half-century of correctional trends. The NAS report highlighted that the United States had incarceration rates around 100 to 125 per 100,000 population from the 1920s to the early 1970s. The increase in incarceration took place alongside rising crime and violence rates from the 1960s to the early 1990s. Despite more recent reductions in crime rates, incarceration rates continued to increase. The NAS authors drew the conclusion that policy changes set in motion by these earlier crime spikes made it difficult to stop political momentum and public support for tougher punishments.
Despite more recent reductionsin crime rates, incarcerationrates continued to increase.
Section 1
Despite more recent reductionsin crime rates, incarcerationrates continued to increase.

12Safety and Justice ChallengeEvaluation Report (2015–2017)
The Overuse and Misuse of Incarceration Begin in JailsIn 1970, there were just over 325,000 federal and state prisoners and jail inmates. By 2015, there were around 719,500 individuals incarcerated in jails alone, with an additional 1.5 million adults in federal and state prisons. Explosive growth of jail and prison populations peaked in the late 2000s at about 259 per 100,000 population for jails and 463 per 100,000 population for state prisons.
People of Color and Other Vulnerable Populations Are More Likely to be JailedNationally, people of color are disproportionately impacted by overincarceration. Black Americans are jailed at nearly four times the rate of white Americans. Although non-Hispanic whites are 63% of the population, they account for 47% of jail populations, whereas non-Hispanic blacks are 13% of the population and account for nearly 35% of jail populations (for a complete review, see Subramanian et al., 2015).6 In addition, individuals who are poor and who have mental health and substance abuse issues are disproportionately likely to be arrested and incarcerated.
6 These statistics come from the Bureau of Justice Statistics’ Annual Survey of Jails and Census of Jails. Readers are encouraged to see Subramanian et al. (2015), as it contextualizes these changes in jail populations.
Figure 1 . U .S . Rate of Prison and Jail Populations, 1925–2016, per 100,000
0
100
200
300
400
500
Local Jails
State Prisons
Federal Prisons
2015201020052000199519901985198019751970196519601955195019451940193519301925
Rat
e p
er 1
00,0
00 R
esid
ents
74
6
102
12
82
13
100
12
98
11
100
194
108
11 17
387
191
38
453
253
63
416
227
61
Section 1

13Safety and Justice ChallengeEvaluation Report (2015–2017)
Most People in Jail Are Unconvicted and NonviolentThere are approximately 12 million annual admissions to jail. On a given day, about 63% of jail populations are unconvicted of a crime, as they are being held while awaiting trial and are legally presumed innocent. Most pretrial release decisions are based on whether an individual can afford bond money. Further, of those confined in jail, 75% are there for a nonviolent charge, with about 68% being held for a felony charge.
The ultimate goal for MacArthur is not merely to reduce jail populations and disparities, but rather to demonstrate that through a series of innovations, a fairer, more effective, and fiscally responsible form of justice is possible.
The Financial Costs of IncarcerationBetween 2005 and 2013, local governments spent an average of $26.8 billion, $82.4 billion, and $22.4 billion each year for corrections, policing, and judicial-legal services, respectively. Nearly 84% of corrections spending by local governments went to support jails and other correctional institutions, with the remainder used to cover community supervision, maintenance and operation of nonresidential facilities, and other alternatives. Although there is no national average estimate for daily jail costs, a low estimate is about $50 per bed per day, suggesting that it costs at least $18,000 annually to house one individual in jail.7
Overincarceration Weakens CommunitiesFinancial costs are only one type of cost of incarceration. Jail misuse separates families, weakens communities, and threatens the legitimacy of government.8 Even
7 This $50 estimate is on the lower end of estimates of average daily jail costs, with many daily jail rates ranging between $150 and $200. In New York City, the Independent Budget Office estimated jail costs at nearly $460 per day, suggesting that it costs taxpayers $168,000 per year to jail one person (New York City Independent Budget Office, 2013).
8 Readers are encouraged to visit the MacArthur-funded Justice Collaboratory at Yale Law School. Researchers there have demonstrated the importance of trust and legitimacy of criminal justice institutions. https://law.yale.edu/justice-collaboratory
Section 1

14Safety and Justice ChallengeEvaluation Report (2015–2017)
short jail stays have negative impacts on peoples’ lives, including loss of employment, housing, and family. The financial, social, and moral costs of high incarceration rates have led policymakers, activists, and citizens to question whether the extensive use of incarceration is appropriate. Governments and foundations began seeking solutions to reduce overreliance on incarceration—first with prisons and, more recently, with local jails. These efforts have accompanied an emerging trend of slightly lower—but still extremely high by historical standards—incarceration rates.
MacArthur’s Response to Overincarceration: Promote a Fairer, More Just, and Equitable Use of Jails
The Safety and Justice Challenge is MacArthur’s response to the problem of overincarceration. This initiative targets excessive and unfair local incarceration in jails, as both a crucial component and a major driver of overincarceration. Its strategic approach is to support systems change efforts aimed at safely reducing jail incarceration and racial and ethnic disparities in jail usage in a nationwide network of local jurisdictions, complementing and amplifying their efforts with investments in research and communications. Over time, it is hoped that notable progress in reducing incarceration and disparities in Implementation Sites will demonstrate the viability of alternatives to jail incarceration as usual, generating better public safety returns at lower individual, social, and economic costs. These results, thoroughly studied, documented, and disseminated, will help to stimulate national demand for a fairer and more balanced set of responses to crime and social disorder.
MacArthur’s Guiding Assumptions to the Safety and Justice ChallengeMacArthur’s Safety and Justice Challenge is based on four key assumptions. First, MacArthur assumes that jails are not only overused, but also misused. MacArthur assumes that the overuse and misuse of jails have delegitimized jails as an appropriate tool for justice intervention. Creating nationwide systems reform includes reducing jail populations, but also requires changing the composition of jail populations. An intention of the Safety and Justice Challenge is to promote the use of jails to primarily hold individuals who present some threat to public safety.
Section 1

15Safety and Justice ChallengeEvaluation Report (2015–2017)
Second, MacArthur assumes that with appropriate incentives and help in the form of funding and technical assistance, communities can safely achieve big reductions in jail usage. Third, MacArthur assumes that successful local reforms can be spread to other jurisdictions across the country. Fourth, MacArthur assumes that reduced reliance on jail incarceration and reduced racial and ethnic disparities will not compromise public safety and may even generate more safety. These assumptions guide MacArthur’s theory of change.
Success for the Safety and Justice Challenge means that jails hold only those for whom secure detention is necessary—according to a different and more careful conception of necessity that aligns with jailing’s public safety purposes, and that is supported by an array of other, less costly and harmful means to ensure court attendance and protect the public.
Keeping Eyes on What We Don’t Know Embedded within these assumptions is what is unknown. MacArthur is dedicated to learning and continuous improvement, which necessitates an awareness that—despite intention and planning—there is much that is unknown about local criminal justice reforms. The Safety and Justice Challenge was designed to allow jurisdictions to design locally developed reform strategies. For instance, it may be that the local reforms that jurisdictions have selected to implement do not work, or perhaps they work in some jurisdictions, but not others. Or, it is possible that if the reforms are successfully implemented and protocols are followed, they do not result in reductions in local jail populations or racial/ethnic disparities. It could be that the reforms work to change local systems, but these local efforts are not translated nationwide. More problematic, it is possible that the reforms result in weakened public safety, with higher crime and violence rates. MacArthur’s theory of change allows for ongoing critical assessment of assumptions, scrutiny of what is not known, and realignment of strategies.
Theory of Change: Planned, Intentional, and FlexibleMacArthur recognizes that social problems and conditions are not static but evolve within complex environments. Changing complex systems requires understanding the relationships and interactions among individuals, organizations, and institutions, as well as developing dynamic approaches to achieve desired impacts. The theory of change behind the Safety and Justice Challenge acknowledges the complexity of local criminal justice systems and of the approaches to reforming them.
The theory of change (Figure 2) asserts that local reforms can be documented and spread to produce a national demand for alternative responses to crime through three mutually reinforcing components:
• Safety and Justice Challenge Network Sites develop and maintain a network of model sites seeking to change their systems to reduce jail use. These sites are provided with the training, technical assistance, and data support they need to succeed.
Section 1

16Safety and Justice ChallengeEvaluation Report (2015–2017)
DECISION POINTS
IMPACT
ELEMENTS
ACTIONS
Research and
knowledge
development
ChallengeNetwork Sites Comprehensive
Communications
Media
Relations
ReportsDigital Media
Learning
Network
Technical
Assistance
Conferences
StrategicAllies
Community
Engagement
Reduce Racial and
Ethnic Disparities of
Jail Population
Foster Pro-reform
Public Opinion
and Efforts
Reduce Jail Population
LOCAL MODELS OF SYSTEMS REFORM
RESEARCH AND EXPERIMENT
AMPLIFY THE RESULTS
The Theory of ChangeChanging the way Americansthink about and use jails.
Criminal justice system changes implemented at the local level can leverage nationwide transformation. The theory of change for facilitating reform builds on rigorous research, committed network sites, and the amplification of innovations through comprehensive communications.
Arrest(law enforcement)
Charge(prosecutor)
Defense(counsel)
Pretrial Disposition(judge, prosecutor, jail)
Court Processing(prosecutor)
Sentencing(judge)
Post-Conviction Disposition(judge)
DECISION POINTS
191Applications
20Implementation Sites
20Innovation Sites
Section 1
Figure 2 . Theory of Change

17Safety and Justice ChallengeEvaluation Report (2015–2017)
• Comprehensive Communications designed to increase public awareness and understanding of the problem of jail overuse and the need and possibilities for local solutions. Communications includes a dissemination strategy to amplify the local models of reform, share innovations, and build national momentum for reform. This component encompasses media strategies to amplify the messages and successes of the Safety and Justice Challenge, as well as partnerships with a diverse group of key stakeholder organizations (Strategic Allies) that communicate the benefits of reform to different audiences.
• Research and Knowledge Development generate new and better knowledge about what works to change local criminal justice systems and reduce jail use.
These components are connected through reinforcing, interdependent pathways that work toward the overall strategic goal to reduce overincarceration by eliminating the misuse and overuse of jails nationwide. Local stakeholders in Challenge Network Sites come together to envision criminal justice reform that reflects local needs supported by technical assistance providers. The comprehensive communications strategy consists of
• direct support to local jurisdictions, helping them to design and execute communications plans to advance their implementation work;
• national communications initiatives including media relations, social media, and digital media to raise awareness of the messages of the Safety and Justice Challenge and to amplify the work of the jurisdictions;
• public and stakeholder events; and
• coordinating, counseling, and mobilizing the network of Strategic Allies to ensure that professional groups, such as prosecutors and police, are aware of and involved with the progress of the Safety and Justice Challenge and to further amplify the work of Challenge Network jurisdictions.
The communications strategy also includes grants for media and other organizations to support amplification strategies among key audiences. MacArthur is investing in several research projects but has yet to fully develop their plans for research and knowledge development. 9
Infrastructure to Support the Safety and Justice ChallengeMacArthur has established a vigorous infrastructure to implement and support the Safety and Justice Challenge. This infrastructure includes the City University of New York (CUNY) Institute for State and Local Governance (ISLG), which provides data analysis and performance metrics, and the JFA Institute, which assists with population projections and assessments. Communication efforts on issues relevant to the Challenge are led by MacArthur with support from the communications firms Berlin Rosen and M+R; these efforts include support for “spreading the word” through forums such as the Marshall Project and StoryCorps, as well as assistance
9 MacArthur funded ISLG to identify areas needing research by conducting interviews with 30 experts.
Section 1

18Safety and Justice ChallengeEvaluation Report (2015–2017)
with local stories in the Implementation Sites. Bennett Midland provides administrative support and was crucial in launching the Challenge, including supporting the proposal solicitation and review process.
The infrastructure also includes site coordinators who work with the Challenge Network Sites to help them plan and achieve their reform strategies. These site coordinators are organizations with long histories of providing justice-related technical assistance to jurisdictions. The Challenge site coordinators are the Center for Court Innovation, Justice Management Institute, Justice System Partners, and the Vera Institute of Justice. These organizations are supported by strategic service providers, including the Pretrial Justice Institute, the Burns Institute for assistance on issues related to disparity, and new partners such as Everyday Democracy for assistance on community engagement issues.
In addition, MacArthur is partnering with a growing body of Strategic Allies—organizations that represent key audiences and embrace similar reform goals. These stakeholder organizations include those representing prosecutors, police chiefs, public defenders, court officials, and city and county leaders and are in the best position to articulate the message of reform to their specific constituent groups. The Strategic Allies work with MacArthur by sharing news and lessons learned with their membership, and by championing reforms. They also engage with peers in the Challenge Network Sites and nationally to spread Challenge messages and counter critical voices through op-eds and interviews.
RTI International was engaged as the Challenge was launched to serve as a learning partner and evaluator of the Safety and Justice Challenge. In 2017, MacArthur added to the resources available through the Safety and Justice Challenge by launching their Innovation Fund that provides grant funds to support local innovations. The Innovation Fund is a creative way to broaden the Network by incorporating additional jurisdictions that are interested in improving their local criminal justice systems. Innovation Fund jurisdictions may prove to have the potential to receive additional implementation funding in the future. MacArthur brought on the Urban Institute to coordinate the Innovation Fund sites and to
America’s overreliance on jail incarceration is one of the biggest issues facing our society, and it starts in our local communities.
Section 1
19Safety and Justice ChallengeEvaluation Report (2015–2017)
provide “light touch” technical assistance to assist these sites with their projects and to report performance measurement data. As the Challenge evolves, MacArthur plans to add additional partners.
MacArthur’s Approach to Systems Reform: Models of Local Reforms
The February 2015 launch announced the opportunity for jurisdictions to compete for the 20 Network spots in the Safety and Justice Challenge. The request for proposals (RFP) solicited applications from any governmental authority with a local jail or jail system with at least 50 beds, including states, cities, counties, judicial districts, and tribal territories. MacArthur received 191 applications from 45 states and territories in response to the RFP—greatly exceeding MacArthur’s goal of 100. MacArthur developed a set of objective review criteria and engaged external partners to score each application. This rigorous review process identified 20 jurisdictions to receive $150,000 grants to participate in the Phase I planning period as part of the Challenge Network.
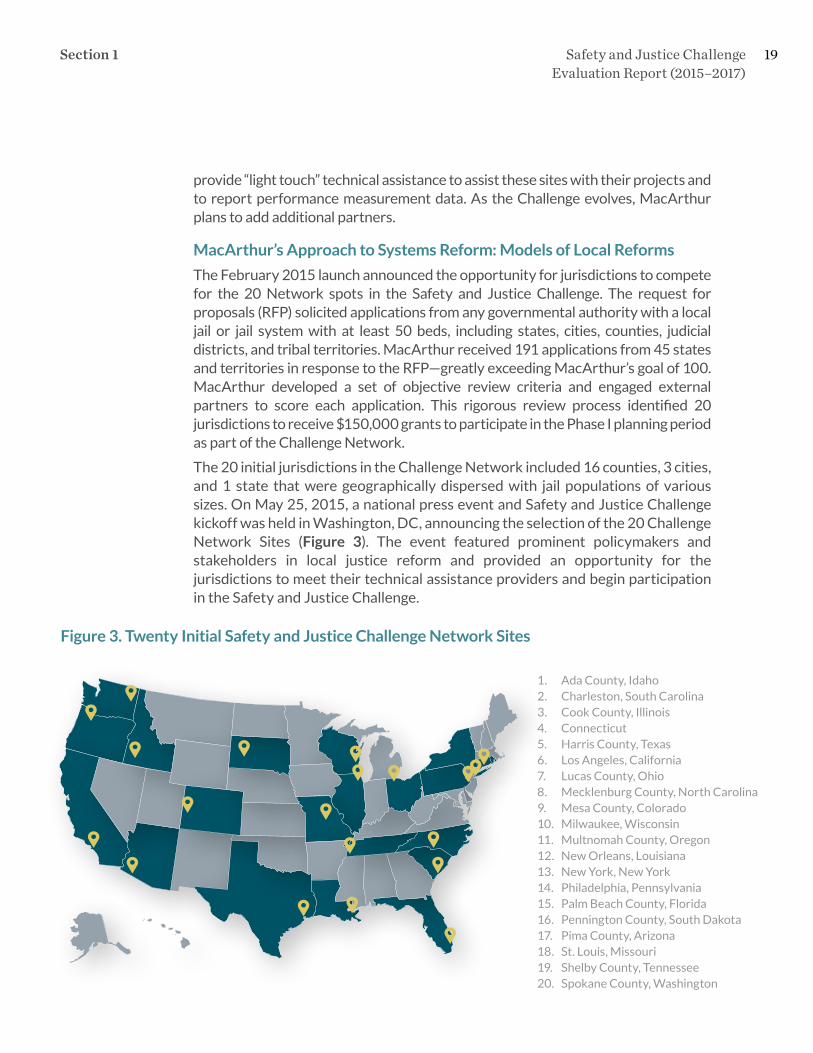
The 20 initial jurisdictions in the Challenge Network included 16 counties, 3 cities, and 1 state that were geographically dispersed with jail populations of various sizes. On May 25, 2015, a national press event and Safety and Justice Challenge kickoff was held in Washington, DC, announcing the selection of the 20 Challenge Network Sites (Figure 3). The event featured prominent policymakers and stakeholders in local justice reform and provided an opportunity for the jurisdictions to meet their technical assistance providers and begin participation in the Safety and Justice Challenge.
1. Ada County, Idaho2. Charleston, South Carolina3. Cook County, Illinois4. Connecticut5. Harris County, Texas6. Los Angeles, California7. Lucas County, Ohio8. Mecklenburg County, North Carolina9. Mesa County, Colorado10. Milwaukee, Wisconsin11. Multnomah County, Oregon12. New Orleans, Louisiana13. New York, New York14. Philadelphia, Pennsylvania15. Palm Beach County, Florida16. Pennington County, South Dakota17. Pima County, Arizona18. St. Louis, Missouri19. Shelby County, Tennessee20. Spokane County, Washington
Figure 3 . Twenty Initial Safety and Justice Challenge Network Sites
Section 1

20Safety and Justice ChallengeEvaluation Report (2015–2017)
Selecting Network Jurisdictions: The Core and Partner StructureThe initial 20 jurisdictions worked with technical assistance providers to develop proposals to apply for larger grants in a second-round application process. The original structure of the Safety and Justice Challenge planned to provide large grants to 10 Core jurisdictions and smaller grants to the remaining 10 Partner jurisdictions. The 20 proposals were evaluated with systematic criteria to assess the feasibility, impact, and ability of each jurisdiction to accomplish its proposal and to comply with data reporting requirements. Although it was originally anticipated that implementation funding would be awarded to only 10 sites, the second-round plans proved to be exceptionally strong. Accordingly, MacArthur provided grants for deep implementation funding in 11 jurisdictions, with smaller grants going to the other 9 jurisdictions.10
Network Jurisdictions: Adapting the StructureMost projects, especially those as complex as systems reform, have adaptation and attrition, and the Safety and Justice Challenge is no different. MacArthur has built into their theory of change a dynamic structure to support and document the Network Sites and their progress toward achieving the aims of the Safety and Justice Challenge. Being a member of the Network comes with a host of benefits that include technical assistance, peer-to-peer learning, and web-based sharing and learning opportunities.11 But, these benefits come with the expectation for real commitment to reform. These commitments are not necessarily easy, and as such, some jurisdictions have found that they needed to change, limit, or end their involvement with the Challenge.
The Network Sites were selected to include a diverse group of jurisdictions representing different geographic, political, and administrative types. For example, Connecticut was selected as an original Core Network Site, bringing to the initiative the potential of experimenting with local reforms within a statewide correctional system.12 Although this was an ambitious undertaking, there were several political and administrative challenges that resulted in Connecticut needing to scale back its participation in the Network. Similarly, New York City did not adapt to the requirements of being a Core Site, and they chose to remain involved in the Network as a Partner Site. In addition, Mesa County (Colorado), a Partner Site, also struggled to fully engage in the Safety and Justice Challenge due to capacity issues and opted out of the Challenge.
10 The Core and Partner structure detailed here was set in place by MacArthur with the March 2016 Strategy Status Update prepared for the MacArthur Foundation Board of Directors. However, MacArthur intended this structure to be flexible, and it has been adapted as needed.
11 The Pretrial Justice Institute (PJI) leads many of the outreach and planning activities with the Network Sites. For instance, PJI convenes the semi-annual All-Sites meetings, and they developed and maintain the Safety and Justice Challenge Exchange website (a password protected secure web portal to allow Network members opportunities to connect).
12 In most states, jails are operated as a county/city function, with prisons being separate state-run facilities. In six states—Alaska, Connecticut, Delaware, Hawaii, Rhode Island, and Vermont—jails are part of the centralized correctional system (Zeng, 2018).
Section 1

21Safety and Justice ChallengeEvaluation Report (2015–2017)
Implementation Sites: No Longer Core and Partner SitesAs the Challenge has unfolded, MacArthur has witnessed the Network Sites work toward achieving their benchmarks for jail population reductions.13 The distinction between the Core and Partner Sites was eliminated in 2017 when all of the original Partner sites, except for Mesa County and Connecticut, submitted successful applications to MacArthur for full implementation funding. There are variations in the amount of grant support going to each jurisdiction (e.g., larger jurisdictions tend to receive larger grants), but nevertheless, the remaining 18 Core and Partner Sites have been reorganized into a single group referred to as Implementation Sites. These sites are working on challenging, transformative, and meaningful reforms as equal members of the Network.
Expanding the Network: Supporting Innovation Fund SitesIn 2017, MacArthur added to the resources available through the Safety and Justice Challenge and launched their Innovation Fund to allow applicant sites from the 191 that originally applied in 2015 the chance to compete for grant funds to support local innovations. These grants were not necessarily meant to support systems change but are to provide a creative way to broaden the Network by incorporating additional jurisdictions that are interested in improving their local criminal justice systems. The 20 jurisdictions selected as Innovation Sites may prove to have the potential to receive additional implementation funding in the future. MacArthur brought on the Urban Institute to coordinate the Innovation Fund sites and to provide “light touch” technical assistance to assist these sites with their projects and to report performance measurement data. With the Urban Institute’s guidance, these sites demonstrate much potential.
MacArthur Foundation’s Investment to DateFigure 4 shows that MacArthur’s total investments in the Challenge exceed $117 million through 2017. The Network Sites have received more than $38 million to plan and implement their local strategies. Support to the sites through training and technical assistance by the site coordinators and other providers exceeds $37 million (32%), while the additional assistance and activities provided by the Strategic Allies is nearly $10 million (8%). Nearly $11 million (9%) in grants to increase public awareness through communications and support of outlets like the Marshall Project and StoryCorps have been issued to date, and support for research to generate new knowledge is approaching $12 million (10%). MacArthur is also supporting pretrial reform activities in its home town of Chicago; grants to support “strategy to ground” in Chicago exceed $9 million (8%) through 2017.
Performance MeasurementISLG is the Network partner charged with working with the Implementation Sites to collect data for the Challenge. ISLG is tracking two types of performance metrics: (1) cross-site measures that reflect the broad goals and objectives of the Challenge
13 The jail benchmarks were set through collaboration among the sites, JFA Institute, and ISLG.
Section 1

22Safety and Justice ChallengeEvaluation Report (2015–2017)
(e.g., reducing average daily jail population, reducing unnecessary admissions), and (2) site-specific measures that reflect the specific strategies each site is employing to achieve its goals and objectives (e.g., increasing diversion of low-level misdemeanants or increasing release on recognizance for low-risk defendants).
Comprehensive Communications: Amplify Solutions and Spread Reforms
MacArthur’s theory of change includes comprehensive communications to create conversations about the need for local criminal justice systems reform, advance local site work and spread local reform nationally. This work supports the Network Sites’ efforts to disseminate their local efforts at reform and national efforts to amplify the local models of reform, share innovations, and build national momentum. In practice, communications includes (1) working with external communications firms; (2) promoting local and national messages (e.g., reforms being implemented locally by the sites and overarching messages that are national in scope); and (3) relying on Strategic Allies to help communicate with stakeholders.
Communications is directed by MacArthur’s communications and program staff, with support from external communication partners, BerlinRosen (which focuses on communications at the national level) and M+R (which focuses on the local level). MacArthur’s and the communication firms’ activities include national outreach and
Section 1
Figure 4 . Total MacArthur Investments in Implementation Sites and Partners, 2015–2017
Network of Model Sites
Training and TA
Increase Public Awareness
Generate New Knowledge
Strategic Allies
Strategy to Ground
Dollars
$34,155,000
$37,829,251$10,172,500
$8,063,251
$12,885,000
$9,202,000

23Safety and Justice ChallengeEvaluation Report (2015–2017)
engagement, local site support, strategic ally activities, and fostering communication throughout the Challenge Network.
Grantees are able to work with communications firms to develop locally relevant messaging. The grantees share stories about the impact of overincarceration and speak to audiences that have different perspectives on the need for and nature of criminal justice reform. Some of the communications grantees include the following:
• The Atlantic, which is supporting a criminal justice editorial track that focuses on the overuse of jails and provides a multimedia platform investigating the impact of overincarceration, including disparate impact on communities of color.
• The Marshall Project, which is producing stories related to criminal justice issues online, including an expansive investigative reach into local stories with national relevance.
• The R Street Institute, which is developing op-eds, blog posts, and other media content to elevate awareness and draw attention to low-cost alternatives to incarceration being implemented by Challenge Network Sites.
• StoryCorps, which is producing stories of individuals whose lives have been touched by jails, which are being broadcast and archived with the American Folklife Center at the Library of Congress.
The Safety and Justice Challenge has the overall goal of nationwide criminal justice reform. This requires a vigilant progression of innovation, experimentation, learning, and sharing. Numerous events have been held to support local activities and Network communications and collaborations. More than 25 partnership collaborations have been supported. Three communications workshops have been conducted, including one for the Challenge’s Strategic Allies. Major events have been hosted, including those focused on overincarceration in America (Chicago), Race and Justice Summit (Los Angeles and Charlotte), Reforming Criminal Justice (St. Louis), and Rethinking Crime and Punishment (Philadelphia).
Section 1

24Safety and Justice ChallengeEvaluation Report (2015–2017)
The communications team continues to develop a host of tools to support the Challenge Network Sites—including event templates, press releases, and social media guidance—and the team is simultaneously working to share, educate, and inform external key audiences about information, events, and new findings related to the problem of the overreliance on jails and the potential of local solutions.
Strategic Allies MacArthur is partnering with an array of Strategic Allies—membership organizations that represent key stakeholders and audiences, embrace similar reform goals, and have their own communication vehicles. These stakeholder organizations include those representing prosecutors, police chiefs, public defenders, court officials, and city and county leaders and are in the best position to articulate the message of reform to their constituent groups. These organizations may have different reasons to embrace reform, but their members often agree on solutions. For instance, police officers, judges, and county officials can agree that criminal justice reforms promoting law enforcement practices that divert attention away from low-level, nonviolent criminal behavior can allow officers to concentrate efforts on dangerous individuals, improve safety, and potentially lead to cost savings and justice reinvestments.
The Strategic Allies (Figure 5) work with MacArthur by sharing news and lessons learned with their membership and by championing reforms. They also engage with peers in the Challenge Network Sites and nationally to spread Safety and Justice Challenge messages and counter critical voices through op-eds and interviews. The Strategic Allies translate core messages of the Safety and Justice Challenge for their
• Association of Prosecuting Attorneys
• Center for American Progress
• Council of State Governments
• International Association of Chiefs of Police
• JustLeadershipUSA
• National Association of Counties Foundation
• National Center for State Courts
• National Center for Victims of Crime
• National Conference of State Legislatures
• National League of Cities Institute
• National Legal Aid & Defender Association
Figure 5 . Safety and Justice Challenge Strategic Allies as of 2017
Section 1

25Safety and Justice ChallengeEvaluation Report (2015–2017)
constituent groups using organization newsletters, listservs, social media, and blogs to publicize events, findings, and future opportunities to champion support from the different groups.
The Challenge Network Sites face challenges and barriers to reform, and the Strategic Allies provide a powerful voice to overcome such obstacles. Sometimes critical voices may need simply to hear from a trusted known source. MacArthur’s theory of change includes such voices by working with the Strategic Allies to develop a spokesperson bank that includes leaders to review and address emergent problems related to local reform activities. This crisis communications support can include providing counter-narratives to opposition, providing sites with media messages to respond to negative press, and positioning site-level responses to challenging events in the strategic ally’s publications.
The Strategic Allies provide a bridge between MacArthur and various stakeholder groups. Fostering these relationships requires creating mutual opportunities to learn from and share with one another. MacArthur’s theory of change identifies the need for all partners to learn from one another, and the Challenge is an opportunity to create a series of learning communities for collective impact. MacArthur hosts regular learning and sharing events with the Strategic Allies in which MacArthur provides updates, background information about decisions, and an overview of the communication plans for the Strategic Allies; reviews the messaging architecture; and co-creates ways in which Strategic Allies engage with stakeholders. The Strategic Allies, MacArthur, and other partners are supported through online tools (e.g., Basecamp) that provide a centralized location for key documents, resources, and messages. The purpose of the learning community is to develop multiple avenues of learning, so MacArthur can find out how different practitioner groups view reform. This knowledge guides MacArthur’s ability to demonstrate the importance, relevance, and benefits to various actors in the criminal justice system.
Research and Knowledge Development
MacArthur has a history of investing in seminal research and policy projects.14 The Safety and Justice Challenge was informed by much of this work, such as the National Academy of Science’s report and Vera’s jail report. In keeping with this ongoing commitment to learning, MacArthur included as an application criterion the ability and willingness of local sites and partners to provide a variety of data to be used in performance measurement, research, and evaluation.
Emergent Research to Understand What Works and Doesn’t WorkRigorous research by MacArthur’s learning partners (e.g., RTI International, ISLG, the Urban Institute, JFA Institute) establishes what is effective, what is ineffective, and why. The Challenge Network Sites are engaged in innovative and experimental
14 MacArthur has a dedicated webpage to resources related to the Safety and Justice Challenge (see http://www.safetyandjusticechallenge.org/resources/).
Section 1

26Safety and Justice ChallengeEvaluation Report (2015–2017)
reform agendas. As such, some of their approaches have unexpected results—emergent research takes advantage of these surprises. MacArthur’s theory of change includes ongoing research to better understand and share examples of successful reforms, uncover adjustments to less successful reforms, and share these lessons learned through effective communication.
External Research Network to Foster Knowledge DevelopmentIn addition to learning about the impact of reforms implemented through the Safety and Justice Challenge, MacArthur is supporting research and knowledge development through a series of grants to research partners (e.g., Columbia University, Stanford University). These researchers are focused on identifying evidence-based practices, learning about drivers of jail incarceration, and developing new knowledge.
JFA Institute’s Stress Tests to Understand Local Drivers of Jail PopulationMacArthur recognizes that sites face challenges in reducing their jail populations. As the Safety and Justice Challenge has progressed, some sites have been implementing reforms, but not witnessing population reductions. In response, MacArthur increased the JFA Institute’s involvement by having them conduct localized investigations of jail populations for all Implementation Sites. These stress tests provide an empirical assessment of the likely drivers of local jail incarceration to show stakeholders potential ways to reduce their jail populations (e.g., identify ways to speed case processing).
Summary
This section describes the lead up to and infrastructure of the Safety and Justice Challenge. MacArthur recognizes the complexity of promoting reform to reverse decades of unfair and ineffective criminal justice practices. By engaging with the Challenge Network Sites—both Implementation and Innovation Sites—and with the relevant stakeholder communities, and by demonstrating adaptability to innovate as the Challenge unfolds, MacArthur hopes to not only reduce overincarceration locally but to use communications and outreach to spread reform nationally. To assess attainment of these ambitious goals, MacArthur has engaged both evaluation and research partners to monitor this journey.
Section 1

27Safety and Justice ChallengeEvaluation Report (2015–2017)
Evaluation Design and Key Criminal Justice Impact Indicators
Evaluation Design: RTI as Evaluation and Learning Partner
The evaluation of the Safety and Justice Challenge is designed to ascertain the extent to which the Safety and Justice Challenge contributes to local criminal justice reforms over the long term. Measuring the contributions of the Safety and Justice Challenge to the spread of systems reform is also an evaluation objective.
RTI’s approach is to evaluate the Safety and Justice Challenge as an initiative rather than a single program or set of programs. In doing so, the evaluation seeks to understand “the big picture” and to increase knowledge about how the Safety and Justice Challenge is designed to contribute to long-lasting and sustainable social change within a complex and dynamic social landscape. This systems orientation provides the evaluation with an overarching conceptual lens to examine the relationships among the different elements of the Safety and Justice Challenge. This evaluation design is strengthened by a mixed-methods approach that uses quantitative and qualitative data collection and analysis techniques. The evaluation design includes activities to measure the (local) outcomes, processes, and (national) impact of the initiative:
The Safety and Justice Challenge is designed tocontribute to long-lasting and sustainable social change within a complex and dynamic social landscape.
Section 2
The Safety and Justice Challenge is designed tocontribute to long-lasting and sustainable social change within a complex and dynamic social landscape.

28Safety and Justice ChallengeEvaluation Report (2015–2017)
• The focus of the outcome evaluation is to assess the effects of the Safety and Justice Challenge’s activities on criminal justice metrics within the Implementation Sites relative to comparison sites.
• The focus of the process evaluation is to understand how change happens at the ground level in the Implementation Sites and to gain a firsthand account of planning, implementation, and program delivery from stakeholders.
• The focus of the impact evaluation is to document contributions from the Safety and Justice Challenge as translated from the local interventions into broader national changes in jail populations and the program’s broader goals of changing the national conversation about jail use and reform.
These evaluation activities are documenting and tracking trends, patterns, and relationships among local- and national-level measures to identify to what extent changes occur. Although MacArthur expects that national impacts will not be realized for many years, the impact evaluation will monitor trends, examining shifts in the Implementation Sites to identify specific contributions from the Safety and Justice Challenge. Public opinion polling, media monitoring, and publicly available criminal justice data will also be used to illustrate trends, patterns, and relationships as they change over time. The outcome evaluation assesses the effects of the Safety and Justice Challenge’s activities on criminal justice metrics within the Implementation Sites, relative to a series of comparison sites. These metrics are tracked for seven key decision points: (1) arrest, (2) prosecutorial charging, (3) assignment of counsel, (4) pretrial release, (5) case processing, (6) disposition or sentencing, and (7) postconviction process.
Landscape and Context: Reduced Jail Populations and Disparity, but Growing Pretrial Populations
This section introduces key criminal justice impact indicators to provide baseline measures nationally and for Implementation Sites (summed for the 18 Implementation Sites). MacArthur’s guiding assumptions are that jails are not only overused but also misused. Overuse is tracked by documenting trends in the overall jail population by using an average daily population (ADP) figure (see Appendix A for description of data selection).15 The misuse of jails is tracked with data on the racial and ethnic composition of jail populations and the percentage of jail populations that are unconvicted.
The Safety and Justice Challenge planning phase ended in December 2015, with implementation beginning in mid-year 2016. This section provides baseline (2010–2015) data for three impact indicators.
15 ADPs are calculated by agencies summing their total number of inmates over a period—in this case 1 year—and dividing by the total number of days within that time period (e.g., 365 days).
Section 2

29Safety and Justice ChallengeEvaluation Report (2015–2017)
Impact Indicator 1.1: Average Daily Population or ADPThis indicator addresses the following question: How has the jail population changed over time nationally and within the Implementation Sites in the lead up to the Safety and Justice Challenge?
Figure 6, Impact Indicator 1 .1a, shows the total national ADP jail populations from 2010 through 2016, with 2015 indicated as the end of the baseline period. National ADP decreased nearly 4% between 2010 and 2015.16
Figure 7, Impact Indicator 1 .1b, shows the SJC Implementation Site ADP jail populations from 2010 through 2015 for the 18 Implementation Sites. ADP decreased by 14% in the 18 Implementation Sites over this period. Future reports will compare trends for the Implementation and comparison sites.
16 Jail ADP increased for 25 consecutive years (since the Bureau of Justice Statistics started collecting these data in 1983) until an initial 1% decrease in 2009.
Figure 6 . Impact Indicator 1 .1a: Average Daily Number of People in Jail, National Data 2010–2016
0
100,000
200,000
300,000
400,000
500,000
600,000
700,000
800,000
748,600 737,400
National Average Daily Population (ADP)
731,300
2016201520142013201220112010
End of Baseline
739,000
Section 2

30Safety and Justice ChallengeEvaluation Report (2015–2017)
MacArthur is continuing to assess the amount and type of change that may be generated through the Safety and Justice Challenge. Identifying realistic levels of national change that are feasible and meaningful is difficult due to competing forces at play.17 The evaluation is tracking relevant policy changes, state-specific fluctuations, and relevant unforeseen social changes to better contextualize and measure the contribution of the Safety and Justice Challenge.
Impact Indicator 1.2: The Composition of Jails: Racial and Ethnic Distribution of Jail PopulationsThis indicator addresses the following question: How has the racial/ethnic composition of jail populations changed over time nationally and in the Implementation Sites in the lead up to the Safety and Justice Challenge?
17 MacArthur had originally hoped for a 30% decrease after 5 years of the Challenge, but these projections have been scaled back. MacArthur has yet to define projected national or aggregated Implementation Site targets for jail population decreases. Success could take different forms including larger reductions in the Implementation Sites with more modest reductions nationally. And, of course, any increases in jail populations would signal a setback for the Challenge that would require investigations to understand potential contributing factors.
Figure 7 . Impact Indicator 1 .1b: Average Daily Number of People in Jail, Safety and Justice Challenge Implementation Sites, 2010–2015
0
10,000
20,000
30,000
40,000
50,000
60,000
70,000
80,000
90,000
82,502
77,326 76,95079,589 78,261
70,907
SJC Implementation SiteAverage Daily Population (ADP)
201520142013201220112010
SJC = Safety and Justice Challenge
Section 2
31Safety and Justice ChallengeEvaluation Report (2015–2017)
Impact Indicator 1.2 tracks changes in the racial and ethnic disparity of jail populations, measured as the disparity gap (defined below). The available data allow for accurately tracking only white and non-white populations. Although tracking white and non-white classifications is an imperfect measure of racial and ethnic composition, Impact Indicator 1.2 provides a consistent measure of compositional changes to jail populations nationwide.
The disparity gap measure is a way to compare the rates of incarceration between non-white individuals and white individuals (or other specified groups).18 This measure is a relative rate index that compares the rate of jail incarceration for non-white individuals relative to the rate of jail incarceration for white individuals. The disparity gap provides a measure of racial and ethnic disparity because it shows the relative likelihood of jail incarceration for non-white individuals compared with white persons. For example, a disparity gap ratio of 3 would mean that a non-white person is three times more likely than a white person to be incarcerated.
The disparity gap measures in Figure 8 show that racial/ethnic disparity decreased nationally and in the Implementation Sites between 2010 and 2015. Nationally, in 2010, non-white people were 2.6 times more likely to be in jail compared with white people. By 2015, this likelihood had decreased to 2.0 times. The Implementation Sites’ disparity measure is higher than the national disparity gap, but these sites also saw a decrease between 2010 and 2015, dropping from 3.0 to 2.4.
Impact Indicator 1.3: The Composition of Jail Populations: Percentage of Confined Population that Is UnconvictedOne driving concern about overincarceration is the number of individuals who are detained in jail while awaiting trial. This indicator addresses the following question: How have pretrial populations changed nationally and within the Implementation Sites in the lead up to (and in the aftermath of) the Safety and Justice Challenge?
18 This approach follows the Office of Juvenile Justice and Delinquency Prevention (OJJDP) approach to show the relative differences in juvenile minority contact with the justice system (https://www.ojjdp.gov/ojstatbb/dmcdb/asp/whatis.asp). For specific uses of this approach, readers are encouraged to visit the Burns Institute’s website http://data.burnsinstitute.org/about/measurements.
Section 2
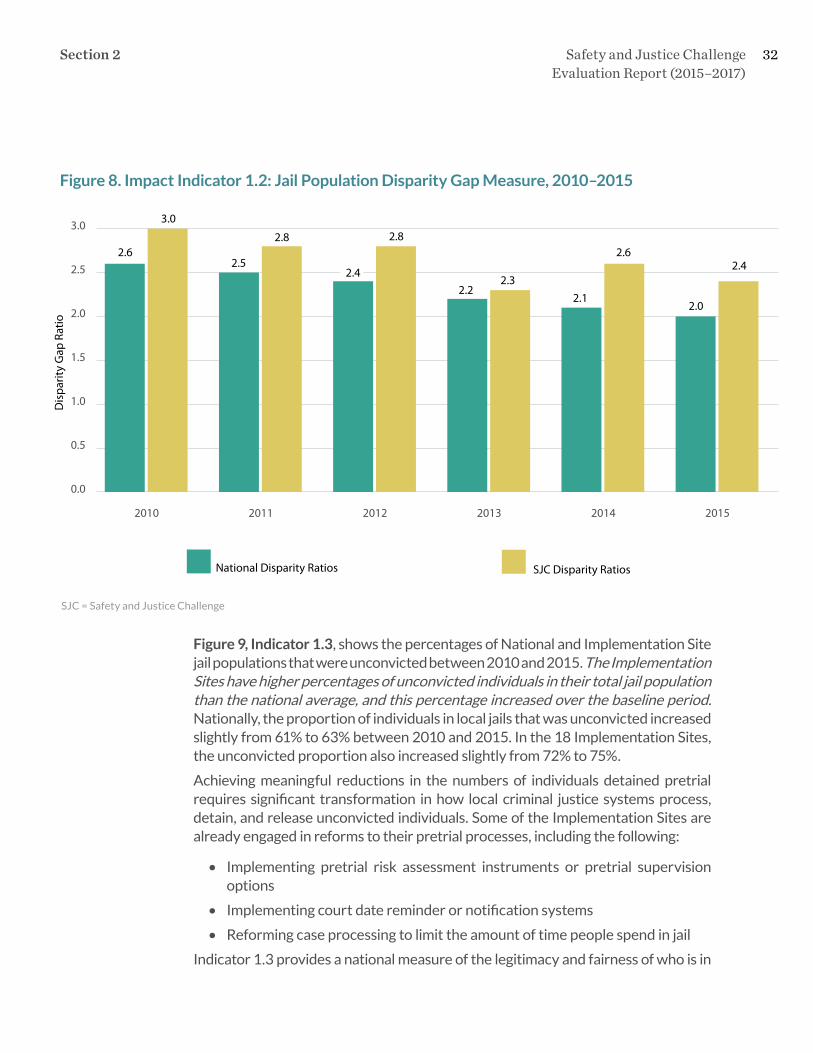
32Safety and Justice ChallengeEvaluation Report (2015–2017)
Figure 9, Indicator 1 .3, shows the percentages of National and Implementation Site jail populations that were unconvicted between 2010 and 2015. The Implementation Sites have higher percentages of unconvicted individuals in their total jail population than the national average, and this percentage increased over the baseline period. Nationally, the proportion of individuals in local jails that was unconvicted increased slightly from 61% to 63% between 2010 and 2015. In the 18 Implementation Sites, the unconvicted proportion also increased slightly from 72% to 75%.
Achieving meaningful reductions in the numbers of individuals detained pretrial requires significant transformation in how local criminal justice systems process, detain, and release unconvicted individuals. Some of the Implementation Sites are already engaged in reforms to their pretrial processes, including the following:
• Implementing pretrial risk assessment instruments or pretrial supervision options
• Implementing court date reminder or notification systems
• Reforming case processing to limit the amount of time people spend in jail
Indicator 1.3 provides a national measure of the legitimacy and fairness of who is in
Section 2
Figure 8 . Impact Indicator 1 .2: Jail Population Disparity Gap Measure, 2010–2015
0.0
0.5
1.0
1.5
2.0
2.5
3.0
3.5
SJC Disparity RatiosNational Disparity Ratios
201520142013201220112010
Dis
par
ity
Gap
Rat
io
2.4
2.0
2.6
2.1
2.32.2
2.8
2.4
2.8
2.5
3.0
2.6
SJC = Safety and Justice Challenge

33Safety and Justice ChallengeEvaluation Report (2015–2017)
jails by tracking the proportion of jail populations who are unconvicted.19 Reducing pretrial populations is crucial to maximizing impact for the Safety and Justice Challenge, as the Bureau of Justice Statistics estimated that nearly 95% of the growth in jail populations since 2000 was due to the increase in the numbers of people being held pretrial (Minton & Zeng, 2015).
MacArthur and their partners are grappling with how to effect meaningful reductions in pretrial populations. There are reasons to be optimistic about the potential of pretrial risk assessments, court reminders, or improved case processing. If recent increases in pretrial populations account for most of the growth in jail populations, one would expect to see large reductions in the numbers detained pretrial to effectively drive down jail populations.20
19 Data from the Bureau of Justice Statistics’ Census of Jails and Annual Survey of Jails are also being used to track the proportion of jailed individuals who are unconvicted. An alternative indicator would be data on the proportion of jail populations held pretrial because they could not afford bail, but such a measure does not exist at the national level. More detailed and fine-grained data collections will be conducted using ISLG’s performance measurement, JFA Institute’s ongoing forecasting, and other research projects that may permit more detailed representation of pretrial detention in the Implementation Sites.
20 As a direct response to reducing pretrial populations, MacArthur decided to step up JFA’s stress tests to determine the drivers of local jail populations. JFA suggests that one issue with most jails is the length of time individuals wait in jail for their trial. Very often these stays are due to continuances, with Pfaff (2017) reporting that it is a common prosecutorial tactic to delay trials until someone either confesses, pleads, or enough time has passed that the prosecution thinks they should be released.
Figure 9 . Impact Indicator 1 .3: Percentage of Jail Populations Unconvicted, 2010–2015
0%
10%
20%
30%
40%
50%
60%
70%
80%
SJCNational
201520142013201220112010
74.8
62.7
71.7
62.8
74.2
62.0
70.3
60.6
74.6
60.6
71.9
61.1
SJC = Safety and Justice Challenge
Section 2

34Safety and Justice ChallengeEvaluation Report (2015–2017)
Summary
MacArthur’s Safety and Justice Challenge is being implemented as multiple sectors raise concerns about overincarceration in the United States. MacArthur has chosen to focus on America’s jail populations—with goals of reducing the numbers of people incarcerated, racial and ethnic disparities among jail populations, and the number of individuals confined pretrial.
This initial report provides measures—nationally and for the 18 Implementation Sites—for three Impact Indicators for the baseline period, 2010–2015, preceding the implementation of the Safety and Justice Challenge. Between 2010 and 2015, the following occurred:
• The average daily jail population decreased 4% nationally and 14% in the 18 Implementation Sites.
• Racial and ethnic disparity, as measured by the disparity gap ratio, also declined nationally and in the 18 Implementation Sites.
• The proportions of jail populations that were unconvicted increased slightly both nationally and in the 18 Implementation Sites.
Many of the Implementation Sites are focused on reforms that are intended to reduce pretrial detentions and result in less overincarceration and smaller jail populations. The results of these strategies will be monitored and described in future reports.
Section 2

35Safety and Justice ChallengeEvaluation Report (2015–2017)
Public Opinion and Media Reporting
Impact Indicator 2: Attitudes and Media Reporting about Local Criminal Justice Systems
This section focuses on public opinion and media coverage about criminal justice reforms. MacArthur has aligned the Challenge and its goals with the hopes of “changing how America thinks about and uses jails.” Public opinions are dependent on many factors, and the Safety and Justice Challenge represents one effort to change attitudes toward the use of jails and those incarcerated in them.
The section above reviewed data about how jails are used. This section focuses on what Americans think about local criminal justice systems. Indicators are derived from multiple waves of survey data collected nationally (2015 to 2017) and in the Implementation Sites (2016 and 2017)21 to assess attitudes (see Appendix C). Additional findings are derived from analyses of an extensive collection of articles from the print media about criminal justice issues that was assembled for the evaluation.
21 The survey was developed for this evaluation. The survey administration was handled by Zogby Analytics. Each wave of the national survey included about 3,000 respondents, and the 2016 and 2017 surveys included more than 9,000 respondents from the Implementation Sites. Full survey analyses are provided to MacArthur in a separate report.
These baseline findings show significant differences between white and non-white respondents’ perceptions of jail disparities.
Section 3
These baseline findings show significant differences between white and non-white respondents’ perceptions of jail disparities.

36Safety and Justice ChallengeEvaluation Report (2015–2017)
Impact Indicator 2 .1: Perceptions About Racial and Ethnic Disparities in Local Criminal Justice Systems
Impact Indicator 1.2 (Figure 8) revealed a persistent—if somewhat diminishing—disparity gap in local jail populations nationally and in the Implementation Sites. This indicator examines perceptions of why these disparities exist and addresses the following question: How do attitudes about the reasons for jail disparity change over time nationally and in the Implementation Sites?
Figures 10 and 11 show the responses nationally and from the Implementation Sites to a question about why there are racial/ethnic disparities in jail populations. Respondents were provided with the following prompt: “Statistics show that African Americans, Native Americans, and Latinos/Hispanics are more likely to end up in jail than other groups.” And asked: “Why do you think this is?”
These baseline findings show significant differences between white and non-white respondents’ perceptions of jail disparities. There are three key insights. First, there are significant differences between white and non-white respondents in the proportions endorsing three of the four responses. Specifically, white respondents are more likely than non-white respondents to report that disparities exist because “minorities commit more crimes,” while non-white respondents were more likely than white respondents to report that “minorities are targeted by police” and “minorities receive harsher sentences.” The only response choice that did not differ by race/ethnicity is the view that poverty impacts jail disparity—white and non-white respondents nationally and in the Implementation Sites agreed that higher poverty rates for people of color influence jail disparity.
Second, there are three significant changes in responses over time for white respondents between the waves, but no significant changes for non-white respondents. Nationally, fewer white respondents cited that people of color commit more crimes as a reason for disparity in 2017 than 2015. In the Implementation Sites, white respondents were more likely in 2017 than 2016 to report that minorities were targeted by police as a reason for disparity. And, white respondents in the Implementation Sites were more likely in 2017 than 2016 to cite harsher sentences for people of color as a reason for disparities.
Section 3

37Safety and Justice ChallengeEvaluation Report (2015–2017)
Non-White White
0%
10%
20%
30%
40%
50%
60%
70%
201720162015201720162015National SJC National SJC National SJC National SJC
Minorities Commit More Crimes Minorities Targeted by Police
Resp
onde
d “Y
es”
2926
28
4542
33 3432
36
5759
5659
26
51
43
SJC = Safety and Justice Challenge
Figure 10 . Impact Indicator 2 .1: Perceptions About Reasons for Racial and Ethnic Disparities in Local Criminal Justice Systems
Non-White White
0%
10%
20%
30%
40%
50%
60%
70%
201720162015201720162015National SJC National SJC National SJC National SJC
Minorities Tend to Be Poorer Minorities Receive Harsher Sentences
Resp
onde
d “Y
es” 40
3836 37
57 57
2928 26 25
59 5958
55 55 55
Figure 11 . Impact Indicator 2 .1: Perceptions About Racial and Ethnic Disparities in Local Criminal Justice Systems
Section 3

38Safety and Justice ChallengeEvaluation Report (2015–2017)
Third, although white and non-white respondents differed significantly on most explanations for disparity, majorities of both white and non-white respondents agreed about the role that poverty plays. All races reported strong support for poverty as an explanation for disparity.
Impact Indicator 2 .2: Perceptions of Fairness of Local Criminal Justice Systems
In addition to examining why racial disparities exist in local jail populations, a broader issue is the degree to which individuals believe that their local criminal justice systems are fair. This indicator addresses the following question: How do attitudes about the fairness of local criminal justice systems change over time nationally and in the Implementation Sites?
Figure 12 shows the public’s perception of fairness within their local criminal justice system, based on responses to “How fair do you believe your local criminal justice system is?”22 As can be seen, there are significant differences between white and non-white individuals’ responses. Two things stand out about these results.
First, there are consistent racial differences in perceptions of fairness with white respondents more likely than non-white respondents to report that the justice system is fair. There are few things more important to a well-functioning democracy than a legitimate system of law and justice. In general, the surveys find high levels of
22 A fifth category of “don’t know” was included as an answer choice but excluded from the analysis.
Non-White White
0%
10%
20%
30%
40%
50%
60%
70%
201720162015National SJC National SJC
Thin
k th
at th
e C
rimin
al J
ustic
e Sy
stem
Is F
air
55
63
49
65
40
5348
66
Figure 12 . Impact Indicator 2 .2: Perceptions of Fairness of Local Criminal Justice Systems
SJC = Safety and Justice ChallengeNote: White/non-white responses are significantly different within each source and year. For the national sample, from 2015 to 2017, white and non-white responses increase significantly.
Section 3

39Safety and Justice ChallengeEvaluation Report (2015–2017)
perceived fairness. However, these levels of perceived fairness differ significantly between white and non-white respondents. Although the survey was not designed to identify the reasons for these differences, attitudes may be shaped by different experiences and contact with criminal justice systems.
Second, both white and non-white respondents were more likely to report in 2017 than 2015 that the justice system was fair in the national sample. Although perceptions of fairness did not change in the Implementation Sites, there were significant increases in the proportions of respondents reporting that they believed the criminal justice system was fair in the national sample. These increases for white (from 53% to 63%) and non-white (from 40% to 55%) respondents are large.23
These data confirm a significant gap between the views of white respondents and non-white respondents about the treatment of communities of color and the fairness of local criminal justice systems, although this gap appears to have narrowed nationally. Future reports will continue to assess any changes between ethno-racial groups, over time, and between the National and Implementation Site samples.
Impact Indicator 2.3: Media Reporting of Jail and Related IssuesThe media both informs about and reflects issues of importance to the public. This indicator addresses the following question: How does media reporting about local criminal justice systems change over time nationally and in the local media markets for the Implementation Sites?
In this section, we use data from a media scan24 to identify trends in reporting about criminal justice systems to track trends over time nationally and in the Implementation Sites. The scan covers the period from January 2013 through December 2017—providing a snapshot of part of the baseline (2013–2015) and an initial look at changes during early implementation (2016–2017). Although the media scan approach allows for opportunities to assess nuanced aspects of the national conversation, the evaluation focuses on patterns of reporting about criminal justice issues broadly to provide a general sense of changes in the media reporting.25 Appendix B describes the methodology for this work.
Conversation Growth: Increased Reporting on Criminal Justice Issues, Nationally and in the Implementation Sites
As shown in Figure 13, reporting on local and national criminal justice systems (defined as counts of articles relevant to the Challenge) grew between 2013 and
23 These differences are so large that they raised concern that the differences could be due to survey error. We reviewed the descriptive analyses and found that a majority of this change in the national sample for white respondents comes from fewer people selecting “I don’t know.” For the non-white respondents, in 2017, fewer people indicate that their local criminal justice system is “very unfair” and more select “somewhat fair.”
24 News stories were collected by applying more than 300 search terms to the Lexis-Nexis archival print repository beginning in January 2013 and continuing throughout the Challenge. A total of 319,797 relevant articles were identified nationally and 38,118 were identified in Implementation Sites through 2017. For information on relevance classification and article collection, see Appendix B.
25 A separate, more thorough report has been developed for MacArthur that addresses additional aspects of the national conversation about criminal justice systems revealed in the print media.
Section 3

40Safety and Justice ChallengeEvaluation Report (2015–2017)
2017. 26 News coverage spiked in 2015 with a 24% growth over the previous year for national articles and a 42% increase for justice-related articles in the Implementation Sites. Although there was a decline from the 2015 peak starting in the first quarter of 2016, by the end of 2017, reporting on criminal justice issues had grown by 28% nationally and 79% in the Implementation Sites since 2013. Although we do not posit causality, Figure 13 shows how the overall growth in criminal justice reporting occurred in the context of increased media attention to fatal police interactions and reporting covering the 2016 presidential campaign.
In general, the most popular topics—measured as the number of articles including a specific term—among relevant criminal justice articles remained consistent between 2013 and 2017. For example, “criminal justice,” “law enforcement,” “mental health,” and “public safety” were each among the top 10 topics in 2013, 2015, and 2017. “Justice reform,” however, was the 104th most popular topic in 2013 and rose to be the 6th most popular topic in 2015 and the 5th most popular in 2017 (see Table 1).
26 Similar analyses conducted on Spanish-language media are not featured in this report. However, analysis of relevant Spanish-language articles showed an emphasis on immigration-related issues that was mostly absent in English-language articles.
Section 3
National
Implementation Sites
Nu
mb
er o
f Art
icle
s (t
ho
usa
nd
s)
0
5
10
15
20
25
2017/Q12016/Q12015/Q12014/Q12013/Q1
Eric Garner choking July 17, 2014Michael Brown shootingAugust 9, 2014 “Police,” “prison,” and “law” are the most
commonly mentioned topics from Q3-2014 to Q1-2016
SJC planning starts
SJC starts
SJC implementation
Post-primary presidential election cycle
Figure 13 . Media Reporting about Criminal Justice Issues, 2013–2017
SJC = Safety and Justice Challenge

41Safety and Justice ChallengeEvaluation Report (2015–2017)
References to Justice Reform and Prison Population Changed in the Media between 2013 and 2017, whereas the coverage of many topics appeared static over this period; references to “justice reform” and “prison population” saw large changes over time. Articles addressing “justice reform” increased by over 300%, while those addressing “prison population” dropped 27% (see Figure 14). This may suggest that the national conversation is moving from what the problem is (i.e., overincarceration) to potential solutions.
2013 2015 2017
Topics Articles Rank Articles Rank Articles Rank
Criminal justice 15,579 1 32,411 1 28,746 1Law enforcement 12,771 3 23,567 2 20,172 2Mental health 14,844 2 22,300 3 17,469 3Public safety 12,233 4 16,050 4 16,674 4Justice reform 2,465 104 12,168 6 12,717 5Substance abuse 10,160 5 14,064 5 11,483 6Attorney general 7,145 12 10,497 13 11,207 7County jail 8,770 9 10,773 12 10,796 8Department corrections 9,804 7 10,292 14 10,120 9Prison population 9,930 6 11,954 8 9,242 10
Table 1 . Media Reporting Changes in Narrative, National Media 2013–2017
0
5
10
15
20
25
30
Justice ReformCounty JailPrison PopulationPublic SafetyMental Health
-8%+6%
-27%
-4%
+302%
2013 2017
Cov
erag
e Pe
rcen
tage
Figure 14 . Changes in National Narrative Continued, 2013–2017
Section 3

42Safety and Justice ChallengeEvaluation Report (2015–2017)
Emerging Issues: A Drastic Increase in Bail Reform DiscussionFigure 15 presents findings on three trending issues. Discussion in the media around bail changed drastically from 2013 to 2017, especially around topics related to bail reform.27 The topic “bail reform” was barely mentioned in 2013. It was the 496th most popular topic with mentions in 80 articles. Yet in 2017, “bail reform” was mentioned in over 4,900 articles, ranking it as the 36th most popular topic in criminal justice articles. Other front-end Criminal Justice System topics were also common. “Mental health” and “diversion” were each in approximately 30% and 8% of all articles, respectively.
Summary
The Safety and Justice Challenge evaluation team is collecting survey data and print media reports relevant to criminal justice issues to assess public attitudes about justice issues and the nature of reporting about issues relevant to the justice system. These will be monitored throughout the Challenge to identify changes.
The poll results suggest differences between white and non-white respondents in why minority populations are overrepresented in jail populations with white
27 MacArthur has been provided with additional media scan analyses, including a special report on bail in the media.
Cri
min
al J
ust
ice
Art
icle
s
1 in 3 relevant articles are about “mental health”
“Bail reform” spikes mid-2016
0%
5%
10%
15%
20%
25%
30%
35%
40%
2017/Q1
Mental Health
Bail Reform
Diversion
2016/Q12015/Q12014/Q12013/Q1
Post-primary presidential election cycle
Figure 15 . Front-End Criminal Justice System Topics in National Narrative, 2013–2017
Section 3
43Safety and Justice ChallengeEvaluation Report (2015–2017)
respondents more likely to say that “minorities commit more crimes” and non-white respondents more likely to say that “minorities are targeted by police” and that “minorities receive harsher sentences.” However, similar (and majority) percentages of both groups agree that poverty among minority populations was a factor in the disparity gap. There were small changes over time in several of the measures among white respondents—with the proportion of white respondents nationally saying “minorities commit more crimes” decreasing (51% to 45%) and the proportion of white respondents in the Implementation Sites saying “minorities are targeted by police” increasing (34% to 36%) and the proportion saying “minorities receive harsher sentences” also increasing (26% to 29%).
Perceptions of the fairness of the local criminal justice system were also measured by the polls. White respondents were more likely than non-white respondents both nationally and in the Implementation Sites to report that the criminal justice system was fair. There was no difference in perceived fairness between the 2016 and 2017 polls in the Implementation Sites, but the proportions of white and non-white respondents who reported that their local criminal justice system was fair increased substantially in the national samples between 2015 and 2017—from 40% to 55% among non-white respondents and 53% to 63% among white respondents.
The media scan is monitoring the national conversation about criminal justice topics and has identified more than 300,000 relevant articles between January 2013 and December 2017. “Law enforcement,” “mental health,” and “public safety” were among the most popular topics over this period. Topics gaining prominence over this period included “justice reform” and “bail reform.”
Section 3

44Safety and Justice ChallengeEvaluation Report (2015–2017)
Tracking Crime Rates and Criminal Justice CostsA leading assumption for MacArthur is that local criminal justice reforms result in fewer people in jail, without compromising public safety and increasing costs. The impact evaluation tracks contextual indicators related to violent crime rates, homicide rates, and public funds spent on criminal justice services.
Impact Indicator 3: Track the Unintended Consequences of Change
Of paramount importance to MacArthur is assuring that reform does not reduce public safety. The first indicators track violent crime and homicide rates and address the following question: How have crime rates changed nationally and in the Implementation Sites?
Impact Indicator 3.1a: Tracking Violent Crime Rates, 2010–2015Indicator 3.1a documents and tracks violent crime rates. Violent crime includes manslaughter or murder, forcible rape, robbery, and aggravated assault. Figure 16 shows decreases in the violent crime rates (crimes per 100,000 people) from 2010 to 2015 for the nation and the Implementation Sites. Violent crime declined by 5% across the nation and by 8% in the Implementation Sites between 2010 and 2014/2015.
Impact Indicator 3.1b: Tracking Homicide Rates, 2010–2015Homicide receives extensive media coverage that can influence public and official concerns about overall crime patterns and public safety. Figure 17 shows homicide
Of paramount importance toMacArthur is assuring thatreform does not reduce public safety.
Section 4
Of paramount importance toMacArthur is assuring thatreform does not reduce public safety.

45Safety and Justice ChallengeEvaluation Report (2015–2017)
Rate
per
100
,000
0
2
4
6
8
10
SJC National
201520142013201220112010
8.4
7.7 7.8
6.9 6.7
4.8 4.7 4.7 4.5 4.54.9
Figure 17 . Impact Indicator 3 .1b: Homicide Rates per 100,000, 2010–2015
SJC = Safety and Justice ChallengeNote: As of December 19th 2018, ICPSR has not publicly released county-level UCR crime data for 2015.
Rate
per
100
,000
SJC National
0
200
400
600
800
201520142013201220112010
629
405
600
387
608 582
369
580
366 386388
Figure 16 . Impact Indicator 3 .1a: Violent Crime Rates, 2010–2015
SJC = Safety and Justice ChallengeNote: As of December 19th 2018, ICPSR has not publicly released county-level UCR crime data for 2015.
Section 4
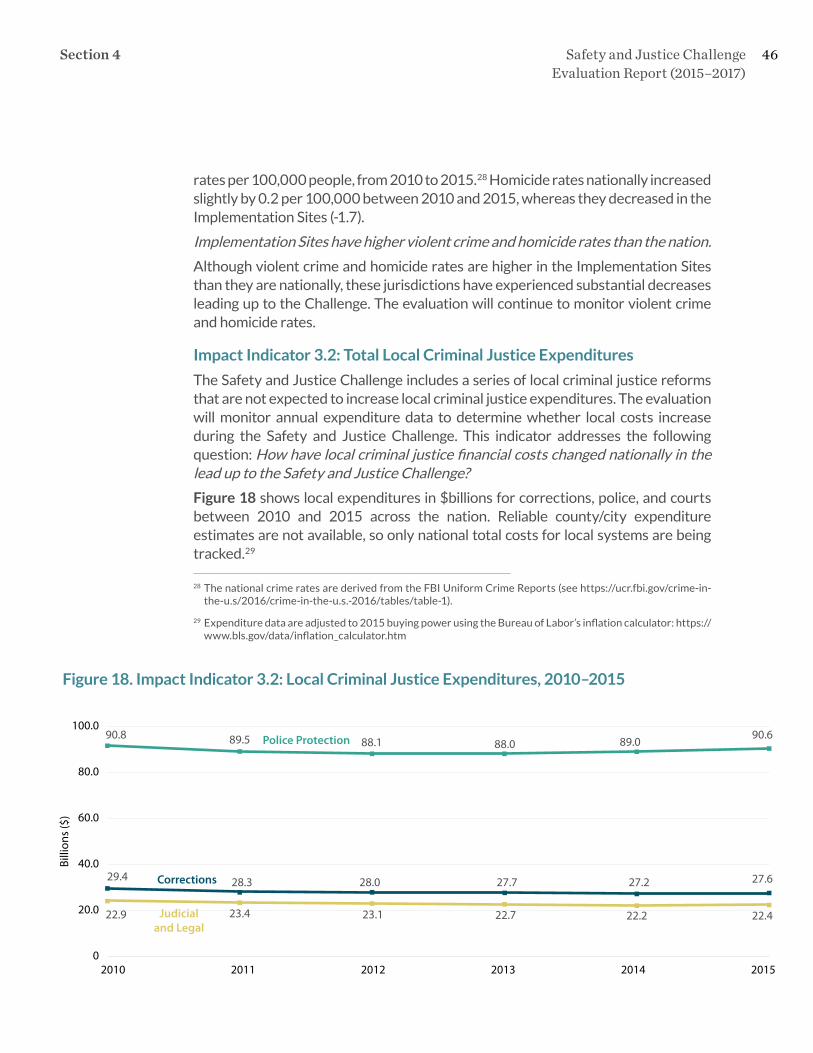
46Safety and Justice ChallengeEvaluation Report (2015–2017)
rates per 100,000 people, from 2010 to 2015.28 Homicide rates nationally increased slightly by 0.2 per 100,000 between 2010 and 2015, whereas they decreased in the Implementation Sites (-1.7).
Implementation Sites have higher violent crime and homicide rates than the nation.
Although violent crime and homicide rates are higher in the Implementation Sites than they are nationally, these jurisdictions have experienced substantial decreases leading up to the Challenge. The evaluation will continue to monitor violent crime and homicide rates.
Impact Indicator 3 .2: Total Local Criminal Justice Expenditures
The Safety and Justice Challenge includes a series of local criminal justice reforms that are not expected to increase local criminal justice expenditures. The evaluation will monitor annual expenditure data to determine whether local costs increase during the Safety and Justice Challenge. This indicator addresses the following question: How have local criminal justice financial costs changed nationally in the lead up to the Safety and Justice Challenge?
Figure 18 shows local expenditures in $billions for corrections, police, and courts between 2010 and 2015 across the nation. Reliable county/city expenditure estimates are not available, so only national total costs for local systems are being tracked.29
28 The national crime rates are derived from the FBI Uniform Crime Reports (see https://ucr.fbi.gov/crime-in-the-u.s/2016/crime-in-the-u.s.-2016/tables/table-1).
29 Expenditure data are adjusted to 2015 buying power using the Bureau of Labor’s inflation calculator: https://www.bls.gov/data/inflation_calculator.htm
Section 4Bi
llion
s ($
)
0
20.0
40.0
60.0
80.0
100.0
Judicialand Legal
Police Protection
Corrections
201520142013201220112010
90.8
29.4
23.422.9 23.1 22.7 22.2 22.4
89.5
28.3
88.1 88.0
27.7
89.090.6
27.2 27.628.0
Figure 18 . Impact Indicator 3 .2: Local Criminal Justice Expenditures, 2010–2015

47Safety and Justice ChallengeEvaluation Report (2015–2017)
Between 2010 and 2015, state and local governments spent, on average, $23 billion, $28 billion, and $89 billion on courts, corrections, and policing, respectively. The average, annual, combined expenditure for these criminal justice services is over $140 billion (in inflation-adjusted dollars). When accounting for inflation, 2010 local criminal justice costs totaled $143 billion, decreasing to $140 billion in 2015.
Understanding Implementation Site Trends, 2010–2015Previous sections compared the 18 Implementation Sites overall with national trends. This section provides more detailed information about the Implementation Sites’ jail populations and crime trends.
Four key jail measures and two crime measures are being tracked to assess change in the size and composition of jail populations and crime. Figure 19 shows the numbers of Implementation Sites that experienced any increases or decreases (or no change) between 2010 and 2015 in each of the following measures:
• Jail Average Daily Population
• Jail Average Daily Admissions
• Percentage of Jail Population Unconvicted
• Racial and Ethnic Distribution of Jail Populations
• Violent Crime Rate
• Homicide Rate
Figure 19 shows that between 2010 and 2015 the average daily jail populations and jail admissions30 decreased in 15 of 18 Implementation Sites, with 3 sites increasing for both measures during this time. Consistent with the increasing trend in the proportion jailed unconvicted in the Implementation Sites (Figure 6), 12 of 18 sites had increases in their unconvicted populations between 2010 and 2015. Although disparity gap measures are decreasing overall for the Implementation Sites (Figure 7), seven sites had increases in the non-white proportion of their jail populations.
Summary
The Safety and Justice Challenge is premised on the idea that local criminal justice systems can be reformed to be more effective, more humane, and fairer. These reforms would demonstrate ways to reduce the overuse and misuse of jails without negatively impacting public safety and costs. The evaluation is tracking several measures of local and national trends in key indicators of public safety and expenditures.
Violent crime and homicide rates were higher in the Implementation Sites than the
30 Admissions are not being tracked for the national impact study, but they are being tracked for the local outcome study.
Section 4

48Safety and Justice ChallengeEvaluation Report (2015–2017)
nation overall between 2010 and 2015. During this period, violent crime rates declined nationally and overall within the Implementation Sites. The trends diverged with respect to the homicide rate, as the nation saw a small increase in the homicide rate, and the Implementation Sites experienced a meaningful decrease. Over this period, local criminal justice expenditures decreased slightly from $143 billion to $140 billion.
Six measures are being tracked at the site level to assess change in the size and composition of jail populations and crime. Most of the Implementation Sites saw reductions in average daily jail population, jail admissions, and racial disparity, as well as in their violent crime and homicide rates. These improvements were not matched for the measure of pretrial detention, as most sites had increases in the proportion of their jail populations that were unconvicted.
Section 4N
umb
er o
f Site
s
0
2
4
6
8
10
12
14
16
18
No ChangeIncreaseReduction
Homicide Crime Rate
Violent Crime Rate
Non-White Unconvicted AdmissionsAverage Daily Population
3 3
1515
12
11
6
75
7
1
10
13
Figure 19 . Implementation Site Summary of Trends between 2010 and 2015 Implementation Sites

49Safety and Justice ChallengeEvaluation Report (2015–2017)
Moving Beyond the NumbersSuccess can take many forms. Although quantitative measures are necessary evaluative metrics, learning from the individuals participating in the Safety and Justice Challenge is integral to overall program success. This section describes how judges, police officers, prosecutors, defense attorneys, and other local stakeholders are experiencing the Safety and Justice Challenge.
The findings are derived from surveys, interviews, and observations intended to document the following key questions of the Safety and Justice Challenge:
• What did stakeholders do?
• What challenges did stakeholders face?
• What were their overall impressions of participating in the Safety and Justice Challenge?
The Safety and Justice Challenge included an initial 6-month planning phase in which jurisdictions worked with technical assistance providers from four site coordinator agencies—the Center for Court Innovation, the Justice Management Institute, Justice System Partners, and the Vera Institute of Justice. During this planning phase, the jurisdictions used local data to identify the drivers of jail
For the Safety and JusticeChallenge, changing normalbusiness practices withinlocal criminal justice systems is paramount to success.
Section 5
For the Safety and JusticeChallenge, changing normalbusiness practices withinlocal criminal justice systems is paramount to success.
50Safety and Justice ChallengeEvaluation Report (2015–2017)
populations and racial/ethnic disparity in their jurisdictions and developed initial reform goals and strategies.
The following section tells the story of how stakeholders in the Implementation Sites have experienced the Safety and Justice Challenge through early implementation. Their voices provide stories of discovery, struggle, and potential. Systems change is not easy when successes are hard to achieve, and victories may be difficult to detect or not focused upon.
Systems Change Requires Changing Organizational Cultures
Achieving systems reforms requires changing organizational cultures by adjusting norms and behaviors.31 For the Safety and Justice Challenge, changing normal business practices within local criminal justice systems is paramount to success. RTI conducted multiple forms of data collection to better understand stakeholders’ experiences of these shifts. Stakeholders from all 20 Network Sites participated in a web-based survey that was conducted in early 2016, after sites had submitted their applications for second-round funding but before they learned whether they would become Core or Partner Sites; this survey focused on experiences from the planning phase. A second web-based survey was conducted in late 2017; stakeholders from the 19 remaining Network Sites (all except Mesa, CO) were invited to participate, and this survey focused on the first 18 months of the implementation phase. In addition, site visits were conducted in the spring of 2017 to the 10 original Core Network Sites.32
Findings are described below.
Planning Phase
Team Work, Buy-in, and OwnershipThere was overwhelming participation in key planning phase activities, with nearly 90% of stakeholders who responded to the first web-based survey reporting that they were highly involved with activities related to strategy development for reducing their local jail populations and racial/ethnic disparities (Figure 20). These activities—planning meetings, system mapping, data gathering, strategic planning, racial/ethnic diversity strategic planning, and proposal development—were important for laying the groundwork for each site’s participation in the Safety and Justice Challenge. The high level of stakeholder involvement points to the organizational cohesion stimulated by the planning phase.
In interviews conducted during the site visits, a common refrain was how working together during the planning phase brought a new level of energy and commitment
31 For more on systems change in the criminal justice system, see the MacArthur-funded JSP report http://www.safetyandjusticechallenge.org/wp-content/uploads/2015/08/10-Steps-To-System-Change_JSP-Brief.pdf
32 These 10 were selected at the time when MacArthur distinguished between Core and Partner Sites; as noted earlier, this distinction was subsequently eliminated. This structure influenced the evaluation design in that we only visited the Core Sites.
Section 5

51Safety and Justice ChallengeEvaluation Report (2015–2017)
to stakeholders’ interactions and strengthened their efforts to effect reform by building collaborative partnerships. Sometimes these relationships were novel and brought together systems actors who had not worked together previously: rarely do prosecutors and defense attorneys, judges and police officers, or sheriffs and pretrial officers come together to discuss system reform. As one stakeholder noted, “We all speak different dialects…” but the Safety and Justice Challenge provided “…an opportunity to try to reconcile some of that.” Another stakeholder noted, “We had never worked so closely, [but through the Safety and Justice Challenge] we got to know each other that much more. We have each other on speed dial now. … [And] forging these relationships made us more efficient at our day-to-day jobs.”
Understanding How Systems WorkHaving a better sense of the interconnectedness of criminal justice agencies and how systems issues, as opposed to criminal behavior, could increase the jail population, motivated stakeholders to identify and pursue systemic reforms. Nearly 85% of respondents to the planning phase survey indicated high involvement in developing a local criminal justice system map.33 Some stakeholders noted that the
33 The four site coordinators worked closely with the sites to develop systems maps, logic models, data forms, and proposals.
0%
20%
40%
60%
80%
100%
RarelyAlways/Frequently
ProposalRED StrategyStrategyData TemplateSystem MapPlanning Meetings
1016
9084
27
92
73
8 815
8592
Figure 20 . Participation in Planning Phase Activities
RED = racial and ethnic disparity
Section 5

52Safety and Justice ChallengeEvaluation Report (2015–2017)
exercise to develop a local system map helped them to realize important features of how processes operated in their jurisdiction. For instance, one interviewee told of learning details about failures to appear within their court system. This person was astonished at “how complicated everything was” and realized that the system made it more difficult for individuals to navigate requirements such as managing multiple court appearances in various locations.
Using Data to Reduce Jail PopulationsMacArthur has emphasized a strong commitment to evidence-based decision-making, the need for testing, and research. Yet, at this point in the Safety and Justice Challenge, there is substantial variability among the sites in their ability to collect and share data. To identify data availability and needs, stakeholders were required as part of the planning phase to provide a completed aggregate data template that reported key measures across each part of the criminal justice system.34
This activity created an opportunity for stakeholders to better understand the data their agency collects, and, more importantly, to gain the trust required to fully share these data with others in the jurisdiction. Relying on data gave stakeholders confidence in the likelihood that their strategies would be successful. Stakeholders reported that collecting and sharing data were useful to foster collaboration and conversation. These data, according to one stakeholder, take “the personality out of the room” by generating a greater reliance on facts, and not on opinions, about the drivers of jail populations or disparities.
Change Over Time: Planning and Implementation
The Implementation Sites are involved in a long-term effort, and measuring changes over time provides information that can be used to address needs as they emerge. Comparing results from the planning phase survey and the implementation phase survey yields insight into areas in which sites may need additional technical assistance and support.
Clear Roles but Weakening Team Cohesion and AgreementFigure 21 provides data from stakeholders about their perceptions of the nature of their planning teams and implementation teams. The bars represent the percentage of stakeholders in the planning phase and implementation phase surveys who reported that they “strongly agree” or “agree” with the following statements regarding their site’s core team:
• Has clear role assignments and expectations
• Has a feeling of cohesiveness and team spirit
• Agrees on the approach that your jurisdiction is using in pursuing the goal of reducing the use of jails
34 ISLG developed the data template and worked closely with sites to complete, review, and update the template.
Section 5

53Safety and Justice ChallengeEvaluation Report (2015–2017)
Results from both surveys show that the planning and implementation teams agreed that roles were clear, the teams were cohesive, and that there was agreement on strategy. However, levels of agreement decreased slightly from the planning to the implementation phases, suggesting the importance of ongoing support and technical assistance. One stakeholder identified the potential for “initiative fatigue,” since this jurisdiction had undertaken reform initiatives prior to the Safety and Justice Challenge.
Staffing Emerges as a Challenge as Efforts Transition from Planning to ImplementationThe Safety and Justice Challenge was undertaken knowing that those working to implement systems reforms would face many challenges. In surveys and interviews, most stakeholders identified the need for more staff as a salient challenge they were facing. During the planning phase, as sites tried to move the work forward quickly, 83% of stakeholders identified “need for more support staff” as “very” or “moderately” challenging (Figure 22). This proportion increased to 88% during the implementation phase with most of the increase due to the number reporting staffing to be “very challenging.”
Multiple Efforts within the Jurisdiction Detracts from the ChallengeStakeholders consistently reported that local reforms take time and require a lot of staff effort. Not surprisingly, the coordination of multiple reform initiatives in a
0%
20%
40%
60%
80%
100%
ImplementationPlanning
Strategic AgreementCohesivenessClear Roles
91
83
95
87 89
96
Figure 21 . Trends in Stakeholder Perceptions about Team Functioning
Section 5

54Safety and Justice ChallengeEvaluation Report (2015–2017)
single jurisdiction was identified as another difficult challenge (Figure 19). During the planning phase, 87% of stakeholders reported this as “very” or “moderately” challenging, increasing to 93% in the implementation phase—again the increase was greatest in the proportion of respondents saying coordinating multiple efforts was “very challenging.”
These results are supported by findings from site visit interviews during which stakeholders spoke about the challenges of time pressures and feeling overburdened by Safety and Justice Challenge responsibilities, while also managing other criminal justice reform initiatives. Despite these concerns, nearly all stakeholders reported a high level of enthusiasm and excitement about their jurisdiction’s participation in the Safety and Justice Challenge.
Funding, Politics, and Leadership Posed Challenges during Implementation Based on information gathered during the site visits, RTI added questions about funding, political climate, and leadership to the implementation phase survey (Figure 23). Most of the respondents indicated that funding was challenging (91% said “very” or “moderately” challenging), and the national political climate (86%) also emerged as a top issue for stakeholders. In addition, the need for stronger local leadership of the Safety and Justice Challenge was identified as “moderately challenging” by just over half of respondents.
Staffing Coordinating Multiple Efforts
0%
20%
40%
60%
80%
100%
Not Challenging Moderately Challenging Very Challenging
Implementation PlanningImplementation Planning
17
66
17
13
65
22
7
56
38
14
64
22
Figure 22. Staffing and Coordination Activities Pose Increasing Challenges
Section 5

55Safety and Justice ChallengeEvaluation Report (2015–2017)
Synergy among ChallengesThe challenges reported by stakeholders are potentially linked. For example, during the site visits, some stakeholders reported wanting additional funding for staffing. People also voiced concerns that the new federal administration would encourage a return to “tough on crime” policies, which could result in decreased funding for criminal justice reform. Although some of these challenges are difficult to tackle within the scope of the Safety and Justice Challenge, the need for “stronger local SJC leadership” (which may connect to reported slippage in the sense of clear role assignments and expectations) can be addressed through technical assistance.
Strategies by Original Implementation SitesAcross the 10 original Safety and Justice Challenge Implementation Sites, teams planned a total of 84 distinct strategies or projects.35 Figure 24 summarizes the common strategies across the original Implementation Sites.
Key findings with respect to the initial strategies include the following:
• Two sites developed deflection strategies that explore alternatives to arrest.
• Two sites developed or plan to implement pretrial risk assessments such as the Laura and John Arnold Foundation’s pretrial risk assessment tool.
35 RTI analyzed the implementation plans for the 10 sites originally considered the Core Sites in the Safety and Justice Challenge and categorized them according to strategy type and focus. ISLG provided the data needed to develop Figure 21 (information was not available on the 10 Partner Sites).
0%
20%
40%
60%
80%
100%
Not Challenging Moderately Challenging Very Challenging
SJC LeadershipPoliticsFunding
1024
53
43
51
5
23
58
33
Figure 23 . Challenges Facing the Implementation Teams
SJC = Safety and Justice Challenge
Section 5

56Safety and Justice ChallengeEvaluation Report (2015–2017)
• Four sites proposed other pretrial diversion strategies, many involving expansions to pretrial service programs.
• Two sites developed jail diversion strategies that involve an intentional review of jail populations for diversion opportunities or expanded coordination of mental health services.
• Three sites are working on diversion strategies with prosecutors or specialized courts that move defendants into services and reduce jail stays.
• Four sites are reforming bail/bond setting and review processes in their jurisdiction.
• One site is expanding the use of electronic monitoring for pretrial or probation/parole populations.
• One site is planning to put court date reminder systems in place.
• One site is planning other strategies beyond court reminder systems to reduce warrants for failure to appear.
• Two sites developed strategies that aim to increase the efficiency of case processing.
• Three sites have strategies that aim to increase public defender representation at bail-setting or first appearances.
• Two sites are reforming their probation/parole practices to reduce bookings or length of stay (LOS) for violations.
• One site developed specific strategies around community engagement (although other sites may be using community engagement tactics as part of other Safety and Justice Challenge strategies or efforts).
• One site developed strategies to reduce racial and ethnic disparities in its jail population through training or data analysis (although other sites may be targeting racial and ethnic disparities in other ways throughout the Safety and Justice Challenge).
Of note, many of the strategies focus on diversion to behavioral health services or increased coordination with the behavioral health system. Seven of the ten original Implementation Sites focus at least one of their strategies explicitly on strengthening behavioral health services.
The Safety and Justice Challenge is a dynamic effort that takes place within shifting local landscapes. As such, strategies and projects originally planned are expected to change over time. Based on an October 2017 assessment of site progress, 29 projects or strategies were fully operational across the original Implementation Sites. The remaining strategies were in various phases of planning, delay, reevaluation, or their status was unknown. Future reports will examine more closely what site-level factors are affecting implementation and in turn how that may be impacting jail outcome indicators.
Section 5

57Safety and Justice ChallengeEvaluation Report (2015–2017)
Summary
Throughout planning and early implementation of the Safety and Justice Challenge, site stakeholders have reported high levels of commitment and support for the undertaking while acknowledging challenges. The need for additional resources—funding and staff—is a commonly cited challenge as the teams have worked to realize their strategies. These strategies include diversion and deflection at various points in the system, bail or bond reform, risk assessment, options to address failure to appear, and means to improve case processing. The evaluation will monitor the progress toward and the evolution of these strategies as the Challenge continues.
Section 5
Figure 24 . Site Implementation Strategies
Defl
ecti
on
Pre
tria
l Ris
k
Ass
essm
ents
Pre
tria
l D
iver
sio
n
Jail
D
iver
sio
n
Div
ersi
on
(Co
urt
s/P
rose
cuti
on
)
Bai
l/B
on
d
Ref
orm
Ele
ctro
nic
M
on
ito
rin
g
Co
urt
R
emin
der
s
Oth
er F
ailu
re t
o
Ap
pea
r St
rate
gies
Cas
e
Pro
cess
ing
Def
end
ant
R
epre
sen
tati
on
Pro
bat
ion
/Par
ole
Co
mm
un
ity
En
gage
men
t
Trai
nin
g
Charleston, SC
Harris County, TX
Lucas County, OH
Milwaukee County, WI
New Orleans, LA
Philadelphia, PA
Pima County, AZ
Spokane, WA
St. Louis County, MO
Connecticut

58Safety and Justice ChallengeEvaluation Report (2015–2017)
Early Implementation Outcome FindingsThis section presents initial findings for four outcome indicators during the early implementation phase (January 2016–December 2017) of the Safety and Justice Challenge. These findings are related to jail population metrics and were developed using data collected by ISLG.36 Results show the trend (increase or decrease) between the 6-month average value at the beginning of the Challenge and the final month in 2017 for which data were available.37
Most Sites Reduced ADP and Bookings and Increased Pretrial Populations
The early implementation data show that 10 out of 17 sites reported a reduction in their ADP while 7 had increases (Figure 25) although in some cases the amount of change was small. Jail bookings or admissions decreased in 13 of 16 jurisdictions reporting, with 3 jurisdictions reporting increases. Length of Stay increased in 10 of 17 and decreased in 7 of 17 jurisdictions. The percentage of the jail population that was unconvicted increased in 9 jurisdictions and decreased in 5 of 14
36 Change is estimated from data provided by ISLG as the difference between ISLG’s calculations for the 6-month average (November 2015–April 2016) prior to implementation and the most recent year of non-missing data. Some sites had varying degrees of missing data during this period. Three sites (Ada, Los Angeles, and Shelby Counties) had missing data for all metrics during the 6-month period. For Ada and Los Angeles County, ISLG used the first available month of data, which was May 2016; for Shelby County, the first available month of data was October 2016.
37 Data were available for December 2017 for most jurisdictions. However, the last month of reporting for Milwaukee’s measure for ADP, and all metrics for Cook and Los Angeles Counties, was November 2017. For Milwaukee County, October 2017 was the last month of reporting for average LOS and percentage of the confined population that was unconvicted. The last month of reporting for Shelby County was October 2017, for Ada County was September 2017, and for Philadelphia was August 2017.
A reduction in jail populationsis an important outcome for the Safety and Justice Challenge.
Section 6
A reduction in jail populations is an important outcome for the Safety and Justice Challenge.

59Safety and Justice ChallengeEvaluation Report (2015–2017)
jurisdictions. Thus, most sites were on the right trajectories for two of the metrics—ADP and bookings—whereas most did not show progress on the percentage who were unconvicted. Additional detail is provided below.
Outcome Indicator: Early Implementation Changes in ADP
A reduction in jail populations is an important outcome for the Safety and Justice Challenge. This Outcome Indicator uses site-specific data to address the following question: How has ADP changed in the Implementation Sites since baseline?
There was a net reduction of ADP across 17 Implementation Sites of 4,075 jail inmates. Figure 26 shows the percent changes in ADP since baseline—expanding on the summary information that was presented in Figure 25. As can be seen, some of the changes were modest. However, some of the largest jurisdictions (e.g., Cook County, Harris County, and Philadelphia) reduced their ADP by more than 10% between the 6-month period preceding implementation and late 2017. The seven jurisdictions that increased their ADP include some of the smaller jurisdictions in the Challenge and added 824 jail inmates. The 10 jurisdictions with lower ADP decreased their jail populations by 4,899 individuals.
Num
ber
of S
ites
0
2
4
6
8
10
12
14
16
18
Increase Reduction
Unconvicted LOSBookingsAverage Daily Population
7
3
13
10
7
9
5
10
Figure 25 . Implementation Site Summary of Trends between 2015 and 2017
Note: New York City did not provide data for Average Daily Population, Bookings, Length of Stay (LOS), and Unconvicted; Shelby County did not provide data for Bookings and Unconvicted; and Philadelphia did not provide data on Unconvicted.
Section 6

60Safety and Justice ChallengeEvaluation Report (2015–2017)
Outcome Indicator: Early Implementation Changes in Bookings
Many of the jurisdictions have identified diversion or deflection strategies as part of their reform efforts. As a result, the evaluation is tracking the number of bookings in the Implementation Sites. This indicator addresses the following question: How has booking changed in the Implementation Sites since baseline?
Fewer People Entering JailsFigure 27 shows that 13 of 17 jurisdictions reduced their jail bookings between 2015 and 2017. Reductions in admissions may be related to changes in law enforcement decisions about making arrests.
Outcome Indicator: Early Implementation Changes in Length of Stay (LOS)
LOS is being monitored, although assessing the meaning of changes in LOS is complicated. For example, LOS would be expected to increase as the proportion of people detained in jail are higher risk or sentenced.38 On the other hand, speeding case processing would be expected to reduce the LOS for the pretrial population. This indicator addresses the following question: How has LOS changed in the Implementation Sites since baseline?
38 For example, Cook County had lower ADP, bookings, and pretrial, while LOS increased.
-25% -20% -15% -10% -5% 0% 5% 10% 15% 20% 25%
% Decrease in ADP % Increase in ADP
St. Louis County
Spokane County
Shelby County
Pima County
Philadelphia
Pennington County
Palm Beach County
Orleans Parish
Multnomah County
Milwaukee County
Mecklenburg County
Lucas County
Los Angeles County
Harris County
Cook County
Charleston County
Ada County
0%
-12%
-13%-4%
-19%
-17%-23%
0%
6%3%
-2%
-11%
21%
5%
2%
10%
13%
Figure 26 . Changes in ADP, 2015–2017, for Implementation Sites
Note: New York City is missing data for average daily population (ADP).
Section 6

61Safety and Justice ChallengeEvaluation Report (2015–2017)
LOS increased in 10 jurisdictions and decreased in 7 jurisdictions since the beginning of the Challenge (Figure 28). As with ADP and bookings, some of the changes are modest. Multiple jurisdictions, however, had increases in LOS of greater than 10% and two had reductions greater than 10%.
Outcome Indicator: Early Implementation Changes in Pretrial/Awaiting Action
One goal of the Safety and Justice Challenge is to safely reduce the number of people held pretrial or unconvicted. This indicator addresses the following question: How have unconvicted populations changed in the Implementation Sites since baseline?
Nine jurisdictions had increases in the percentage of people being detained pretrial (or awaiting action for a probation or parole violation) since they began the Challenge (Figure 29). Although some of these changes are modest, six sites had increases of 5% or more. Five sites reported decreases in the proportion of their confined populations that are pretrial.
% Decrease in Bookings % Increase in Bookings
-35% -25% -15% -5% 5% 15% 25% 35%
St. Louis County
Spokane County
Shelby County
Pima County
Philadelphia
Pennington County
Palm Beach County
Orleans Parish
Multnomah County
Milwaukee County
Mecklenburg County
Lucas County
Los Angeles County
Harris County
Cook County
Charleston County
Ada County
-7%
-14%-11%
-13%
-18%-30%
-12%-14%
-13%
-16%
-12%
-2%-8%
8%11%
0%
6%
Figure 27 . Changes in Bookings, 2015–2017, for Implementation Sites
Note: New York City and Shelby County are missing data for bookings.
Section 6

62Safety and Justice ChallengeEvaluation Report (2015–2017)
-20% -15% -10% -5% 0% 5% 10% 15% 20% 25% 30% 35%
% Decrease in LOS % Increase in LOS
St. Louis County
Spokane County
Shelby County
Pima County
Philadelphia
Pennington County
Palm Beach County
Orleans Parish
Multnomah County
Milwaukee County
Mecklenburg County
Lucas County
Los Angeles County
Harris County
Cook County
Charleston County
Ada County
-6%
18%
-9%
-4%
7%
12%
-4%35%
-3%
3%
9%
19%
-20%
9%
20%
19%
-14%
-6% -3% 0% 3% 6% 9% 12% 15%
% Decrease in Pretrial Population % Increase in Pretrial Population
St. Louis County
Spokane County
Shelby County
Pima County
Philadelphia
Pennington County
Palm Beach County
Orleans Parish
Multnomah County
Milwaukee County
Mecklenburg County
Lucas County
Los Angeles County
Harris County
Cook County
Charleston County
Ada County
-5%
8%
7%
3%
3%6%
10%
14%
5%
4%
-1%
-6%
-5%
-1%
Figure 28 . Changes in Length of Stay, 2015–2017, for Implementation Sites
Figure 29 . Changes in Unconvicted Populations, 2015–2017, for Implementation Sites
Note: New York City is missing data for Length of Stay (LOS).
Note: New York City and Shelby County are missing data for pretrial population.
Section 6

63Safety and Justice ChallengeEvaluation Report (2015–2017)
Summarizing the Trends in Outcomes at Early Implementation
Table 2 summarizes the early implementation results for the four outcome variables across the 17 sites that reported data. Entries indicate whether a jurisdiction reduced an indicator (= 1) or increased an indicator (= 0). The total column provides that sum (i.e., the number of reductions across the four indicators) for each jurisdiction and each outcome. The higher the total score, the more metrics a site reduced.
Four Jurisdictions Showed Few Improvements in Jail-Related Outcomes Ada County and Shelby County score 0 as they did not report any reductions across the four indicators. Los Angeles County and Pennington County scored 1 as neither jurisdiction reduced its ADP, but Los Angeles reduced bookings and Pennington County reduced the percentage held pretrial.
Site ADP Bookings LOS Pretrial Total
Ada County 0 0 0 0 0
Shelby County 0 No data 0 No data 0
Los Angeles County 0 1 0 No change 1
Pennington County 0 0 0 1 1
Mecklenburg County 0 1 0 1 2
Spokane County 0 1 0 1 2
Orleans Parish 1 1 0 0 2
Pima County 1 1 0 0 2
St. Louis County 1 1 0 0 2
Philadelphia 1 0 1 No data 2
Charleston County 0 1 1 1 3
Cook County 1 1 0 1 3
Harris County 1 1 1 0 3
Lucas County 1 1 1 0 3
Milwaukee County 1 1 1 0 3
Multnomah County 1 1 1 0 3
Palm Beach County 1 1 1 0 3
Total 10 13 7 5
Table 2 . Summary of Changes in Outcome Indicators Through Early Implementation, 2015–2017
1 = decreased this indicator0 = increased this indicatorNote: This chart assumes that reducing Length of Stay (LOS) is not necessarily an indicator of positive change. As noted previously, the implications of change in this indicator depend on the reason for the change. For example, LOS would be expected to increase if the proportion of the jail population unconvicted declined while the proportion that was convicted and serving sentences increased. ADP = average daily population.
Section 6

64Safety and Justice ChallengeEvaluation Report (2015–2017)
Six Jurisdictions Reduced Two Jail-Related OutcomesSix jurisdictions reduced two of the four outcome indicators during the early implementation period. These jurisdictions fall into three categories. Mecklenburg County and Spokane County increased ADP and LOS, but they reduced bookings and pretrial populations. Orleans Parish, Pima County, and St. Louis County reduced ADP and bookings into the jail, but they increased LOS and pretrial. Philadelphia decreased ADP and LOS, but increased bookings.
Seven Jurisdictions Reduced Three Jail-Related OutcomesThe remaining seven jurisdictions providing early implementation data reduced three of the four outcomes. These jurisdictions fit into three groups. Five of the jurisdictions—Harris County, Lucas County, Milwaukee County, Multnomah County, and Palm Beach County—decreased ADP, bookings, and LOS, with pretrial populations being the only indicator to increase. Cook County reduced ADP, bookings, and pretrial, with LOS the only indicator that increased. Although Charleston County experienced increases in ADP, and bookings, LOS, and pretrial decreased during early implementation.
A Strong Relationship between ADP and Bookings During Early ImplementationFigure 28 shows that 9 of the 10 Implementation Sites that reduced their ADP also reduced their bookings. Philadelphia was the only jurisdiction that reduced ADP but increased their bookings.
A Weak Relationship between ADP and Pretrial Population During Early ImplementationOnly 1 of the 10 Implementation Sites reduced their ADP and also reduced their pretrial population. Cook County is the only jurisdiction that reduced ADP and their pretrial population.
Contextualizing Numbers
Of the four sites that show performance indicators scores of 0-1, none was included among the sites that RTI was allowed to visit, which limits the ability to understand specific contextual factors that might be influencing strategy implementation and outcomes. Information gleaned from visits to the original 10 Core Sites suggests that the following issues may be factors:
• A clearly identified “Safety and Justice Challenge champion”—a charismatic leader, a dedicated project manager, or both—increases morale and the sense of collective organization, whereas not having this champion can dampen enthusiasm and contribute to a lack of cohesion.
• “Neutral” agents (researchers, unaffiliated Criminal Justice Coordinating Council members) can be beneficial in helping to organize and mediate collaboration among criminal justice stakeholders.
Section 6
65Safety and Justice ChallengeEvaluation Report (2015–2017)
• Sites with established cultures of collaboration and multiple shared initiatives can draw on a sense of buy-in for criminal justice reform overall. This can result in the stakeholders proposing fewer strategies (because there is a sentiment of shared ownership) and a more focused sense of purpose.
• Sites that have a large number of strategies may need a dedicated Safety and Justice Challenge project manager to keep efforts on track.
• Sites that have a history of tension or disconnect among agencies cannot rely on strategy ownership to create a culture of collaboration. Shared ownership with mutual benefits to building partnerships may be more productive.
• Engaging technical assistance providers from within the same region as a site with a strong sense of local identity may increase buy-in and rapport with stakeholders in those regions.
The following other factors may also be in play:
• Other local criminal justice reform efforts (which could add momentum to Safety and Justice Challenge implementation strategies or siphon energy away from the Safety and Justice Challenge)
• Other local criminal justice requirements (e.g., consent decrees, federal court orders, federal lawsuits)
• Local infrastructure (the absence of which hindered Safety and Justice Challenge implementation strategy progress)
• Local politics (in particular, changes in elected officials who may be more or less supportive of the Safety and Justice Challenge than their predecessors)
• High-profile events (e.g., natural disasters, police shootings, major accidents)
• The opioid crisis (which could drive the number of jail detentions higher but also contribute to system actors’ and the public’s understanding of the need for criminal justice reform)
Among the seven sites with the highest performance indicators (scores of 3), RTI conducted site visits to Charleston, Harris, Lucas, and Milwaukee counties:
• In Charleston, stakeholders enthusiastically identified that the Safety and Justice Challenge marked the first time that a robust and truly cooperative Criminal Justice Coordinating Council had been formed, and they conceptualized the Safety and Justice Challenge as part of a comprehensive reform effort in the county. The shooting of Walter Scott and the hate crime of Dylann Roof intensified conversations around race and injustice, adding momentum to Safety and Justice Challenge efforts.
• In Harris, stakeholders expressed broad consensus that the time was right to embark on a criminal justice initiative like the Safety and Justice Challenge, and they articulated a shared vision for change. Several key hires had been made just before RTI’s site visit, and enthusiasm was high about these people, who were new to Harris County, bringing fresh ideas for systems
Section 6

66Safety and Justice ChallengeEvaluation Report (2015–2017)
improvements. Although Hurricane Harvey occurred after the RTI site visit, our general observation that high-profile events play a role in Safety and Justice Challenge implementation makes this an important contextual factor for the county.
• In Lucas, a strong degree of collaboration had been forged through efforts to meet the county’s 2014 federal court order to reduce its jail population. The Safety and Justice Challenge was seen as synergistic with the county’s ongoing criminal justice reform efforts and helped to seed other system improvements.
• In Milwaukee County, it was noted that there was a bit of a leadership vacuum as well as a need for a dedicated Safety and Justice Challenge project manager. Although stakeholders said that they worked together well, they also said they needed someone to actively coordinate moving the Safety and Justice Challenge strategies forward. Milwaukee’s slow progress implementing Safety and Justice Challenge strategies is therefore not surprising and underscores the need to uncover what other factors are affecting a decrease in jail population.
Summary and Conclusions
As would be expected during the early implementation of Safety and Justice Challenge strategies, there are mixed findings with respect to the indicators that are being tracked. It should also be noted that the systems changes being attempted are occurring in complex local environments that may be changing for reasons other than the Challenge. Thus, although no direct chain of causality can be made between the Challenge and observed changes, tracking these indicators provides MacArthur, the site coordinators, and, importantly, the sites with information as to whether they are “moving in the right direction.” This information can promote reassessment of strategies and the need for additional changes or resources. Most sites have seen reductions in both their jail populations and the numbers of bookings into their jails. More stubborn is the goal to reduce pretrial detention, but many of the sites have identified strategies—bail reform or pretrial risk assessment—that would be expected as implementation continues to address this goal.
Section 6

67Safety and Justice ChallengeEvaluation Report (2015–2017)
ConclusionsThe MacArthur Foundation has invested more than $117 million between 2015 and 2017 to promote local criminal justice reform through its Safety and Justice Challenge with a goal of reducing overincarceration in American jails. MacArthur used a competitive process to identify 20 sites that were original Challenge Network Sites. A second round of competition resulted in the identification of Core and Partner Sites among these original 20 sites. These sites are being provided grant funding, technical assistance, and other support through MacArthur-funded site coordinators and technical assistance providers. The growing Safety and Justice Challenge Network includes communication partners, including important media outlets such as the Atlantic and StoryCorps, and Strategic Allies such as the International Association of Chiefs of Police, to spread the message of reform.
MacArthur’s infrastructure for the Challenge includes the ISLG, which provides data analysis and performance metrics, and the JFA Institute, which assists with population projections and assessments. RTI was engaged as the Challenge was launched to serve as a learning partner and evaluator of the Safety and Justice Challenge.
As expected, the Safety and Justice Challenge has adapted as the Network transitioned through planning and early implementation. Important changes include (1) consolidating the original 20 Core and Partner Sites into Implementation Sites with the number reduced to 18, as two sites withdrew; (2) identifying Innovation Sites that are being provided small grants and “light touch” technical assistance to address specific challenges, as well as the long-term opportunity to become Implementation Sites; (3) increasing support to promote reforms that address racial
As expected, the Safety and Justice Challenge hasadapted as the Network transitioned...
Conclusions
As expected, the Safety and Justice Challenge hasadapted as the Network transitioned...

68Safety and Justice ChallengeEvaluation Report (2015–2017)
and ethnic disparity and community engagement; and (4) engaging research partners to improve knowledge.
This report provides baseline and early implementation findings from the evaluation of the Safety and Justice Challenge. The evaluation assesses national impact, as well as local outcomes and implementation in the Implementation Sites. The 5-year period preceding the launch of the Challenge was identified as the baseline period for most impact measures. Focusing on key metrics between 2010 and 2015, the average daily jail population decreased nationally and in the 18 Implementation Sites. Racial and ethnic disparity, as measured by the disparity gap ratio, also declined nationally and in the 18 Implementation Sites. Baseline trends for the proportions of jail populations that were unconvicted showed that these increased slightly both nationally and in the 18 Implementation Sites during this baseline period.
The Safety and Justice Challenge evaluation team is collecting survey data and print media reports relevant to criminal justice issues to assess public attitudes toward justice issues and the nature of reporting about issues relevant to the justice system. Polls conducted in 2015, 2016, and 2017 suggest differences between white and non-white respondents in why minority populations are overrepresented in jail populations and in perceptions of the fairness of local criminal justice systems. White respondents were more likely to say that “minorities commit more crimes” and non-white respondents more likely to say that “minorities are targeted by police” and that “minorities receive harsher sentences.” Over time, the proportion of white respondents nationally saying “minorities commit more crimes” decreased. White respondents were more likely than non-white respondents both nationally and in the Implementation Sites to report that the criminal justice system was fair. The proportions of white and non-white respondents who reported that their local criminal justice system was fair increased substantially in the national samples between 2015 and 2017.
The media scan is monitoring the national conversation about criminal justice topics and identified more than 300,000 relevant articles between January 2013 and December 2016. “Law enforcement,” “mental health,” and “public safety” were among the most popular topics over this period. Topics gaining prominence over this period included “justice reform” and “bail reform.”
The Safety and Justice Challenge is not expected to impact either public safety or the cost of local criminal justice. During the baseline period, between 2010 and 2015, violent crime rates declined nationally and in the 18 Implementation Sites, while homicide rates declined in the Implementation Sites and increased slightly nationally. Local criminal justice expenditures were relatively flat over this period.
Most of the Implementation Sites saw reductions between 2010 and 2015 in average daily jail population, jail admissions (bookings), and racial disparity, as well as in violent crime and homicide rates. Over this period, however, most Implementation Sites showed increases in the proportion of their jail populations who were unconvicted.
Conclusions

69Safety and Justice ChallengeEvaluation Report (2015–2017)
Throughout planning and early implementation of the Safety and Justice Challenge, site stakeholders reported high levels of commitment and support for the undertaking while acknowledging challenges. The need for additional resources—funding and staff—was a commonly cited challenge as the teams worked to realize their strategies. These strategies include diversion and deflection at various points in the system, bail or bond reform, risk assessment, options to address failure to appear, and means to improve case processing.
As would be expected during the early implementation of Safety and Justice Challenge strategies, there are mixed findings with respect to the outcome indicators that are being tracked. The systems changes are being attempted in complex local environments that may be changing for reasons other than the Challenge. Thus, although no direct chain of causality can be made between the Challenge and observed changes, tracking these indicators provides MacArthur, the site coordinators, and, importantly, the sites with information as to whether they are “moving in the right direction.”
Most sites have seen reductions in both their jail populations and the numbers of bookings into their jails. More stubborn is the goal to reduce pretrial detention, but many of the sites have identified strategies—bail reform or pretrial risk assessment—that would be expected as implementation continues to address this goal. This information is being used to encourage reassessment of strategies and the need for additional changes or resources.
MacArthur has adapted as the Challenge has evolved—adding new partners and encouraging changes in strategies as sites fall short of goals. The information being gathered through numerous partners is providing the data to promote reassessment of strategies and the need for additional resources or changes. These activities will be reported in future reports along with updates to trends in outcome and impact indicators.
Conclusions

70Safety and Justice ChallengeEvaluation Report (2015–2017)
ReferencesGarduque, L. (2017). Criminal justice reform for the long haul: Director’s reflection. https://www.macfound.org/press/directors-reflection/criminal-justice-reform-long-haul/ Retrieved February 22, 2018.
Minton, T. D. (2011). Jail inmates at midyear 2010. Washington, DC: Bureau of Justice Statistics.
Minton, T. & Zeng, Z. (2015). Jail inmates at midyear 2014. Washington, DC: U.S. Department of Justice, Office of Justice Programs, Bureau of Justice Statistics.
New York City Independent Budget Office. (2013). NYC’s jail population: Who’s there and why? http://ibo.nyc.ny.us/cgi-park2/2013/08/nycs-jail-population-whos-there-and-why/ Retrieved October 10, 2018.
Pfaff, J. F. (2017). Criminal Punishment and the Politics of Place. Fordham Urb. LJ, 45: 571.
Sampson, R., Raudenbush, S., & Earls, F. (1997). Neighborhoods and violent crime: A multilevel study of collective efficacy. Science, 277 (5328): 918-924.
Subramanian, R., Delaney, R., Roberts, S., Fishman, N., & McGarry, P. (2015). Incarceration’s front door: The misuse of jails in America. New York: Vera Institute of Justice.
Travis, J., Western, B., & Redburn, S. (2014). The growth of incarceration in the United States: Exploring the causes and consequences. Washington, DC: National Academies Press.
Zeng, Z. (2018). Jail inmates in 2016. Washington, DC: U.S. Department of Justice, Office of Justice Programs, Bureau of Justice Statistics.

71Safety and Justice ChallengeEvaluation Report (2015–2017)
Appendix A . Data Selection
Description of Criminal Justice Data
The baseline outcome report uses data from multiple sources. First, aggregate-level administrative data were provided by the City University of New York’s Institute of State and Local Governance (ISLG) to investigate total jail, confined, and released population characteristics. These data also allowed RTI to assess counts at several stages in the criminal justice process (e.g., arrest, charging, disposition). This information was collected and stored in data templates and provided to RTI.
The comparison analyses used aggregate-level administrative and publicly available crime data provided by the Bureau of Justice Statistics (BJS). RTI uses information from the Annual Survey of Jails (ASJ) for years 2010 through 2015 and the 2013 Census of Jails (COJ) to supplement the detailed information collected from sites by ISLG.
Several key indicators embody the issues that MacArthur is focused on addressing.
Key Indicators
• Average Daily Population (ADP) is derived by the sum of inmates in jail each day for a year, divided by the number of days in the year (Minton, 2011).
• Annual Admissions are calculated by dividing one week’s admissions by 7 and multiplying that value by 365.
• Expected average length of stay is calculated by dividing the ADP by the number of annual admissions and multiplying by 365.
• Total Unconvicted Confined (Pretrial) Population is the percentage of the confined jail population that is not convicted of a crime.
• Total Non-White Confined Population is the percentage of the confined population that is not non-Hispanic white.
• Total arrest rate is the number of arrests per 10,000 population.
• Total crime rate is the number of offenses per 1,000 population.
A complete time series between 2010 and 2014–2015 was created for each of the indicators listed above using the ASJ, the COJ, and UCR Program Data.
For jail indicator data, we used the ASJ data between 2010 and 2015. For jail jurisdictions that were not included in the sample of ~800 counties that are covered by the survey, we used data from the 2005 and 2013 COJ as end points and linearly interpolated between them. In 2013, a year in which both the COJ and ASJ was conducted, we favored COJ data, except where it was found to be of low quality or incompletely reported (e.g., outliers or missing facilities within a county), which was rare. If data were missing or of low quality for a county in the 2013 COJ, we used data collected in the 2013 ASJ. After completing as much of the time series as possible using the COJ and ASJ data, we linearly interpolated using the closest surrounding years where data were still missing or of low quality. If missing data existed at the beginning or end of the time series, we held the most recent prior or subsequent year constant.
The crime rate data were created using the county-level arrest and offense data series, which was processed by the National Archive of Criminal Justice Data between 2010 and 2014. The 2015 dataset has not yet been publicly released.

72Safety and Justice ChallengeEvaluation Report (2015–2017)
The arrest data were created by aggregating to the county and year using arrests reported by jurisdiction, month, and offense type. County-years with less than 85% coverage of the total county population were set to missing and linearly interpolated using surrounding years or held constant from the closest prior or subsequent year if missing data occurred at the end or beginning of the time series, respectively.
Jail Indicators DataBJS conducts the COJ every 5–6 years. The COJ provides the sampling frame for the ASJ, which is conducted in the years between censuses. The ASJ is a nationally representative survey of all jail jurisdictions in the United States, and its sample is drawn at the jurisdiction level. A jail jurisdiction can have multiple jails, which are the reporting units (i.e., facilities) for the survey. When a jail jurisdiction is included in the sample, data are collected from all jails within that jurisdiction. Jail jurisdictions were selected using a stratified probability sample in which jurisdictions were stratified based on their ADP and whether the jurisdiction held at least one juvenile. Some strata were certainty strata from which all jails were included in the sample. Although inclusion criteria for certainty strata changed slightly over time, it always consisted of multijurisdictional jails and the largest jails based on ADP and juvenile presence in the system in the most recent COJ. The 2015 ASJ sample included 876 jail jurisdictions and represented 2,851 active jail jurisdictions in the United States. The COJ collects data from all jails across all jail jurisdictions. In 2013, there were 3,163 jail facilities across 2,872 jurisdictions in the United States.
Annual county-level jail indicator data were created by synthesizing and aggregating data collected in the 2006–2015 ASJ and the 2005 and 2013 COJ. Because not every jail jurisdiction is included in the ASJ, the use of imputation strategies between the 2005 and 2013 COJ was necessary to produce an annual county-level time series that is as complete as possible for county-level analyses. Using as much existing data as possible, a time series between 2010 and 2015 for 2,663 U.S. counties was created.
Developing a complete time series between 2010 and 2015 required thorough inspection of data sources and important decision rules. Values were set to missing if they were deemed unreasonable by manual review (e.g., values of 0, other unreasonable values based on surrounding years of data) or if there was incomplete reporting for all jail facilities in a county/year. At most, 87 (out of the 2,663) counties were set to missing for a variable/year due to unreasonable values. When data were missing for certain counties in a given year, either because they were not included in the ASJ sampling frame or because they had unreasonable values, we used linear interpolation to impute missing data using values from surrounding years or held values constant if missing data occurred at the beginning or end of the time series.
BJS conducted both the COJ and ASJ in 2013, which allowed us to conduct comparisons (unreported here) to understand the differences between these data sources. The complete coverage of the census led us to favor the COJ for all indicators other than annual admissions. For annual admissions in 2013, we favored the ASJ because the COJ asked for annual admissions in a slightly different way than in other years. In 2015, the reference date used in the ASJ changed from the last weekday in June to December 31. Proportions should be comparable in 2015 despite this change, but ADP and annual admissions may be subject to seasonal variations, and this should be considered when observing trends.
Table A-1 summarizes the percentage of county data that was sourced from the COJ, the ASJ, or was imputed by year and for every variable that was an input for our five jail indicators: ADP, annual admissions, expected average length of stay (calculated from ADP and annual admissions), the proportion of the confined jail population that was not convicted, and the proportion of the confined jail population that was a non-white race/ethnicity.

73Safety and Justice ChallengeEvaluation Report (2015–2017)
Table A-1 . Percentage of County-Level Jail Data by Year, Variable, and Source
ADP Annual Admissions Confined PopulationUnconvicted Jail
Population White Jail Population
Year COJ ASJ Imputed COJ ASJ Imputed COJ ASJ Imputed COJ ASJ Imputed COJ ASJ Imputed2005 100 0 0 92 0 8 99 0 1 94 0 6 94 0 6
2006 0 32 68 0 28 72 0 32 68 0 31 69 0 31 69
2007 0 32 68 0 28 72 0 32 68 0 31 69 0 30 70
2008 0 32 68 0 29 71 0 32 68 0 31 69 0 31 69
2009 0 32 68 0 29 71 0 32 68 0 28 72 0 28 72
2010 0 32 68 0 28 72 0 32 68 0 27 73 0 27 73
2011 0 31 69 0 30 70 0 31 69 0 28 72 0 28 72
2012 0 30 70 0 29 71 0 30 70 0 27 73 0 27 73
2013 91 2 7 64 29 7 90 2 7 91 2 7 80 3 17
2014 0 30 70 0 29 71 0 30 70 0 28 72 0 27 73
2015 0 31 69 0 31 69 0 31 69 0 31 69 0 29 71
Note: ADP = Average Daily Population; ASJ = Annual Survey of Jails; COJ = Census of Jails. Imputed indicates the counties for which annual data must be imputed.

74Safety and Justice ChallengeEvaluation Report (2015–2017)
Appendix B . Media Monitoring Methods The media scan strategy casts a wide net with keywords and sources to establish a comprehensive database of stories about criminal justice issues. An extensive list of search terms (n=356; see Table B-1) that cover each of the seven decision points (arrest, charge, counsel, pretrial, case processing, sentencing, and post-conviction) and provide a more general contextual understanding of issues related to justice reform was developed by RTI in consultation with MacArthur.
The media monitoring covers January 1, 2013, through December 31, 2017, and was conducted using LexisNexis’ database of articles. LexisNexis historical archive includes print sources only; approximately 36,000 sources covering the last 35 years are included in the archives.
Originally, the article collection was conducted through a contract with CustomScoop, a media monitoring firm, to identify articles containing search terms on a nearly real-time basis. CustomScoop searches over 500,000 web sources, including traditional (e.g., 3,200 newspapers, 12,000 magazines, 1,800 trade publications) and new media (e.g., Huffington Post, Politico, over 300,000 blogs) outlets.
Starting in 2018, the media monitoring shifted from collecting articles from both LexisNexis and CustomScoop to only using LexisNexis articles. LexisNexis has a historical archive of articles, which allowed us to search for criminal justice articles as far back as January 2013. We only had access to CustomScoop articles starting at the time we began our contract (2015Q4).
A consequence of the broad nature of the search is that many articles contained one or more keywords without being relevant to this task. In fact, a review of a sample of articles suggested that approximately 5% of identified articles were relevant. With the total number of articles in the millions, a human review of every article to assess relevance was not feasible. Therefore, we developed a statistical relevancy model to predict the relevance of each article based on the words contained within it. The relevancy model allows us to reduce the “noise” in the data introduced by irrelevant articles.
The relevance model was built using articles that were from CustomScoop sources. However, we determined that approximately 40% of the relevant articles used in the relevance model were also found in the LexisNexis article set.

75Safety and Justice ChallengeEvaluation Report (2015–2017)
Table B-1 . Media Scan: Table of Search Terms
Core Word Additional Words Combined with Core Word Decision Point(s) Covered
Police militarization, shootings, killings, intimidation, “reform,” “use of force,” “excessive force,” “resistance,” “death by cop,” “racial profiling,” racial disparity, ethnic disparity, ethnicity, implicit bias, “pattern or practice” (of unconstitutional policing), nonlethal weapons, “broken windows,” “zero tolerance,” traffic stops, “MacArthur Foundation,” “quality-of-life,” “quality of life,” “order maintenance,” aggressive, frisk, “community trust,” “minority communities,” “de-escalation,” “predictive policing”
Arrest
Court prosecutorial misconduct, prosecutorial staffing, “defense attorney,” “public defender,” “public defense,” “plea deals,” “plea bargain,” “legal fees,” “fines,” “day fine,” restitution, indigent defense, “sentencing reform,” “mandatory minimum,” “tried as adult,” life sentence, enhancements, diversion, incarceration, racial disparity, racial bias, ethnic disparity, ethnicity, implicit bias, family support, mandatory minimums, habitual offender laws, risk assessment, wait times, “first appearance,” “community service,” “MacArthur Foundation,” “race gap,” delays, charging, overcharging, over-charging, “minority communities,” “selective prosecution”
Charge, counsel, case processing
Pretrial screening, “risk,” assessment, diversion, detainees, intervention, legal representation, services, supervision, detention, release, probation, “electronic monitoring,” inmate, freedom, custody, contract, detainment, admissions, population, facility, “mental illness,” “mental health,” “mentally ill,” programs, homeless, indigent, nonviolent, death, “reform,” “restorative justice,” family involvement, juvenile, “MacArthur Foundation,” hold, holding, “minority communities”
Pretrial
Jail crowding, population, mental illness, mental health, pretrial, pretrial, diversion, alternatives to incarceration, reform, overcrowd, deterioration, conditions, violence, abuse, treatment, deterrence, rehabilitation, reduction, racial disparity, disparity, ethnic disparity, ethnicity, implicit bias, “private probation,” indigent debtor, “legal fees,” “fines,” restitution, criminal justice debt, debtors’ prisons, collateral consequences, cost, visitation, phone calls, family contact, pipeline, “MacArthur Foundation,” “race gap,” suicide, immigration, immigrant, “minority communities”
Pretrial, sentencing
Bail bonds, bondsman, “cost,” “fees,” financial obligation, “reform,” supervision, money, “cash,” low-risk, nonviolent, indigent, disparity, scam, misinformation, predatory, “MacArthur Foundation,” “right to,” bounty, “minority communities”
Pretrial
Sentencing excessive, disproportionate, “reform,” disparity, ethnic disparity, ethnicity, diversion, alternatives to incarceration, racial bias, “MacArthur Foundation,” manipulation, entrapment
Sentencing

76Safety and Justice ChallengeEvaluation Report (2015–2017)
Core Word Additional Words Combined with Core Word Decision Point(s) Covered
Prison mandatory sentencing, overcrowding, abuse, treatment, “mental illness,” “mentally ill,” “mental health,” deterrence, rehabilitation, diversion, alternatives to incarceration, racial disparity, disparity, ethnic disparity, ethnicity, implicit bias, “reform,” overcrowding, deterioration, conditions, abuse, three strikes, corrections, reincarceration, recidivism, reentry, “collateral consequences,” parole, visitation, phone calls, family contact, costs, “MacArthur Foundation,” “race gap,” incapacitation, “mass incarceration,” decarceration, de-carceration, “minority communities”
Sentencing, post-conviction
Crime “war on crime,” “crime war,” “war on drugs,” “drug war,” drug legalization, legal reform, sentencing reform, marijuana possession laws, recreational marijuana/cannabis laws, medical marijuana/cannabis laws, “mandatory minimum,” “MacArthur Foundation,” wave, skyrocketing, “minority communities”
Additional context
Standalone terms
“Safety and Justice Challenge,” “Safety + Justice Challenge,” “Safety & Justice Challenge,” “criminal justice reform,” “criminal justice system reform,” “justice reform,” “justice reinvestment,” “Ferguson effect,” “overpolice,” “graduated sanctions,” “intensive supervision,” “Cut50”
Additional context
Table B-2 shows the number of articles identified as relevant to local criminal justice reform during each quarter in 2016 from CustomScoop. As can be seen, there is substantial variation—from almost 80,000 articles in 2016Q1 to fewer than 50,000 2016Q4. Table B-3 shows the number of relevant articles from LexisNexis for the same time period. The number of relevant articles is slightly more consistent for LexisNexis.
Table B-2. Number of Articles Identified Each Month: CustomScoop
Quarter Relevant Count Total Articles Relevant Percentage2016Q1 77,805 801,149 9.71%
2016Q2 58,654 739,717 7.93%
2016Q3 67,032 926,536 7.23%
2016Q4 45,822 547,213 8.37%

77Safety and Justice ChallengeEvaluation Report (2015–2017)
Table B-3. Number of Articles Identified Each Month: LexisNexis
Quarter Relevant Count Total Articles Relevant Percentage2016Q1 20,250 109,251 18.54%
2016Q2 17,710 103,497 17.11%
2016Q3 17,148 121,255 14.14%
2016Q4 15,888 96,301 16.50%
Relevancy ModelThe purpose of the relevancy model is to determine whether each article is relevant to a theme associated with the Safety and Justice Challenge. The most accurate way to make this determination involves a subject matter expert reading the article and assessing its relevance. However, due to the volume of articles, the labor required for a manual approach is not feasible. Therefore, we turned to machine learning, a family of methods in which algorithms detect patterns in data and then apply those patterns to make predictions for new, unseen cases.
This exercise is a classification problem. Classification is an attempt to label each observation with a category, or “class.” The observations are media articles, which need to be classified as either relevant or irrelevant. Classification algorithms require a set of training observations in which the true category labels are already known. From this training set, the algorithms produce a model that can be used to predict the category for new observations. Thus, the implementation of the relevancy model proceeds in the following steps:
1. Obtain media articles.
2. Produce a set of training articles.
3. Create a classification model.
4. Use the classification model to predict the relevance for the remaining articles.
Each of these steps is discussed in more detail in the next sections.
Obtain ArticlesCustomScoop provided RTI with URLs, or web addresses, for media articles matching the search terms listed in Table B-1. They provided other details, including the date the article was published, the title of the article, a summary, and the source type (e.g., newspaper, television, or online outlet). However, CustomScoop did not provide the full text of the article. To obtain the full text, RTI contracted with another vendor, Diffbot, to take the lists of URLs and extract the text of the articles at those addresses, attempting to exclude any extraneous information.
In some cases, Diffbot was unable to provide the full text for an article, most likely because of dead links (i.e., URLs which were no longer valid by the time Diffbot accessed the page, typically a day or so after the page was indexed by CustomScoop); parsing errors (the text of the page was in a format that Diffbot did not recognize); and pages containing video or audio without a text equivalent. We excluded from our analysis all articles for which Diffbot failed to return the full text.
Many articles Diffbot returned are exact duplicates of other articles. This is common, as different media

78Safety and Justice ChallengeEvaluation Report (2015–2017)
outlets run the same story. We excluded duplicate articles when fitting the relevancy model, but we included them when reporting topic frequencies. Table B-4 summarizes the number of articles received from CustomScoop and Diffbot from January 1, 2016, through June 30, 2017.
Table B-4 . Articles Received from CustomScoop and Diffbot
Number of article URLs received from CustomScoop 2,043,507
Number of articles for which Diffbot failed to return the full text 135,249
Number of duplicate articles identified 924,914
Number of available articles for model fitting 983,344
Produce Training DataBased on experience with previous classification models, we set a goal of labeling at least 500 relevant and 500 irrelevant articles. We labeled 10,118 total articles, 500 of which we labeled as relevant.
Create a Classification ModelMany classification algorithms are available. For machine learning, the primary goal is predictive power. Before fitting the model, 10% of the articles were randomly removed from the training set. This hold-out set was used to evaluate the chosen model’s performance on a set of articles that were not used during model fitting.
The remaining 90% of the articles were divided into five equally sized groups. Each model was fit five times, each time holding out one of the five groups and evaluating the model on the held-out group. Results from the five held-out groups were averaged.
We employed algorithms from the scikit-learn package for Python programming language, using the following classification algorithms: logistic regression, naive Bayes, random forest, AdaBoost, linear support vector machines, and majority vote. The following were used as model features:
• number of words in the article
• CustomScoop keywords matching the article
• number of times each word/bigram appeared in the article title
• number of times each word/bigram appeared in the article body
• number of times each word/bigram appeared in the first 50 words of the article body
• number of times each word/bigram appeared in the article title, with outliers truncated
• number of times each word/bigram appeared in the article body, with outliers truncated
• binary indicator of whether each word/bigram appeared in the article title
• binary indicator of whether each word/bigram appeared in the article body
• term frequency-inverse document frequency (TF-IDF) weight for each word/bigram in the article title
• TF-IDF weight for each word/bigram in the article body

79Safety and Justice ChallengeEvaluation Report (2015–2017)
The following feature selection methods were used: 50, 100, and 1,000 best features, based on Chi-squared statistics; and linear support vector machine (SVM) model with an L1-penalty (for producing sparse model coefficients), with penalty parameters of 1, 0.1, and 0.01. The final selection for our relevancy model was a logistic regression algorithm. The included features were the number of words in the article, the CustomScoop keywords, the number of times each word or bigram appeared in the article title, and the number of times each word or bigram appeared in the article body. The best features, based on a linear SVM model with a penalty parameter of 0.1 (reducing the feature count from about 110,000 to about 500), were retained.
The 10 features most predictive of relevance were the following:
• article token: incarceration
• article token: population
• title token: reform
• article token: overcrowding
• keyword: prison pipeline
• keyword: criminal justice reform or system reform
• article token: afford
• title token: police reform
• article token: kill police
• article token: initiative
When evaluating the chosen model’s performance on the 10% hold-out set, the resulting classification matrix (“confusion” matrix) is shown in Table B-5.
Table B-5 . Confusion Matrix
SMEs Labeled Relevant?
Model Predicted Relevant?
No Yes Total
No 760 28 798
Yes 11 31 42
Total 771 59 830
SME = subject matter expert
From the confusion matrix, we can calculate the precision to be 53% and the recall to be 74%. Precision measures how many of the predicted relevant articles were truly relevant. Recall measures how many of the truly relevant articles were predicted relevant.

80Safety and Justice ChallengeEvaluation Report (2015–2017)
Appendix C . Public Opinion Polling MethodologyPublic opinion indicators (impact indicators 2.1 & 2.2) from this report are derived from the MacArthur Foundation’s Safety and Justice Challenge Local Criminal Justice Survey. The Local Criminal Justice Survey (hereafter LCJS) is a nationally representative polling effort designed and tested by RTI International and administered by Zogby Analytics. The survey has been administered to a national sample and within Safety and Justice Challenge Implementation sites. The survey broadly measures knowledge about local criminal justice systems and perceptions of racial and ethnic disparities and fairness. This appendix provides background for the survey sampling methods and general demographic characteristics for the national and Safety and Justice Challenge site samples. Versions of this poll have been administered nationally from 2015 to 2017 and within Safety and Justice Challenge sites in 2016 and 2017.
The LCJS covers various aspects of local interaction with the criminal justice system, including general knowledge questions and public opinion on the purpose of jail, sentencing, diversion, police legitimacy, and perceptions of racial and ethnic disparities and fairness. The 2017 iteration also includes questions regarding the overlap between federal immigration enforcement and local law enforcement as well as responses to the opioid crisis. Zogby Analytics administered the most recent version of the survey in fall 2017 using members of an online panel.
Collecting pertinent sociodemographic information allows researchers to analyze how answers to questions vary based on race and ethnicity, education, income, and other key measures. Given that certain sub-populations are difficult to recruit, Zogby corrects for under- and over-sampling using weighting based on the U.S. Census Bureau population estimates. The firm weights its samples to account for differences primarily in gender, age, race, income, education, and region to provide a representative sample at the national and site level.39 In addition, in 2017 Zogby oversampled for Hispanic and black respondents as well as respondents with less than a high school education to ensure appropriate coverage of hard-to-recruit populations in the national sample.
MethodsThe 2017 national survey was “soft launched” on November 9, 2017, to receive 162 completed surveys to conduct preliminary tests to determine evidence of any potential problems (e.g., excessive missingness, skip patterns). Preliminary analyses (by Zogby and RTI) led to revisions for a subset of new questions, and the survey was completed by 3,064 online panelists (November 19, 2017). With a confidence interval of 95%, the margin of error is +/- 1.8 percentage points. The polling mechanism is a flexible framework that allows us to describe a baseline measurement of public opinion about jails over time while allowing for the inclusion of additional measurements.
RecruitmentZogby site-specific and national samples use a variety of methods to recruit panelists into their online polls. Designed to avoid “professional panelists,” these methods include online, print, and radio advertisements, telephone and mail recruitment, and referral programs. In creating a broad sample, Zogby aims at capturing a representative slice of the American population to start. Zogby uses a double opt-in online panel to randomly select potential survey respondents. Potential respondents are sent an
39 Online polls require general familiarity with the Internet and computers, and thus the sample of panelists exhibits slightly higher overall educational attainment levels.
81Safety and Justice ChallengeEvaluation Report (2015–2017)
email invitation to participate in the survey. When panel participants respond to the email invitation to participate in the poll, they are taken via a secure link to a website to complete the survey.
Survey Methods The survey instrument was developed to ease respondent burden, enhance item clarity and precision, and recognize the contributions of existing surveys (namely, the GSG instrument completed for MacArthur). Two items from the GSG survey were included in the draft instrument for the jail poll. The domains of interest included awareness and knowledge of jails; attitudes/opinions toward the use of jails; opinions about the need for reform; and respondents’ personal experiences with the criminal justice system. Additional questions collected respondent information including race, ethnicity, level of education, household income, gender, age, and political behavior. The initial target length of time for completing the original survey was about 10 minutes.
The survey development was an iterative process between RTI (survey methodologists and subject matter experts), MacArthur’s Criminal Justice Team, and cognitive interviews. RTI’s original survey was reviewed through a standardized review process using our Questionnaire Appraisal System (QAS) to assess the cognitive demands (i.e., respondent burden) of each item by evaluating the required reading level and comprehension with an objective of keeping items between a sixth- and eighth-grade level. Next, we conducted cognitive interviews with nine individuals unconnected to RTI or the Safety and Justice Challenge to understand how the general public might perceive each item in the instrument. The interviewees were recruited through online advertisements; interviews lasted nearly one hour and provided a good understanding of how the general public would interpret each question. The revised instrument was reviewed by MacArthur, further revisions were made, and a second round of cognitive interviews with a new sample of nine individuals was completed.40 MacArthur provided a second review, and we finalized the instrument for administration.
Survey ModulesLCJS includes questions about the following topics:
• Awareness and knowledge of local jails
• Attitudes/opinions toward the use of local jails and sentencing
• Community awareness
• Police/citizen engagement
• Opinion on the need for reform
The 2017 survey also included questions on the role of local law authorities in enforcing federal immigration law and local responses to the opioid crisis. The survey instrument also queries respondents on their experience with the criminal justice system and collects personal sociodemographic characteristics.
40 Reports from the QAS and both rounds of cognitive interviews are available to MacArthur upon request.

82Safety and Justice ChallengeEvaluation Report (2015–2017)
National and Safety and Justice Challenge Site Sample DescriptionTable C-1 shows the number of respondents for each survey wave.41 Table C-2 shows the distribution of respondents from Safety and Justice Challenge sites by year, illustrating that sample sizes are tied to overall population and availability within the Zogby online panel. Table C-2 also shows that sample sizes within Safety and Justice Challenge sites are consistent across years.
Sample selection for both national and Safety and Justice Challenge samples was guided by demographic indicators to ensure sufficient coverage by ethno-racial group, age, and educational attainment.42 The weighted national samples, tied to U.S. census estimates, were mostly white (65%–68%), with similar representation of Hispanic (13%–16%) and black (12%) respondents. A plurality of respondents in each sample were between 30 and 49 years of age, and between 45% and 50% of respondents reported a household income less than $50,000. The Safety and Justice Challenge samples are more diverse, given that they pull from primarily metropolitan counties. White respondents comprise approximately 56% of the Safety and Justice Challenge samples, compared with 18% for both Hispanic and black respondents and 6% for Asian respondents. A total of 41% of the Safety and Justice Challenge samples report having a post-secondary degree, and between 45% and 47% indicate making less than $50,000 annually.
Table C-1 . Local Criminal Justice Survey Samples
N
National 2015 3,066
National 2016 3,007
National 2017 3,064
SJC Sites 2016 10,507
SJC Sites 2017 10,544
Total 30,188
41 SJC site analyses omit responses from Pennington as the sample size generated by Zogby in Pennington was too small to generate probability weights and representative sample statistics.
42 The 2017 national sampling strategy included an oversample of Latino and African-American respondents as well as an oversample of respondents with less than a high school education so that post-survey probability weights would not place undue emphasis on respondents with low educational attainment.

83Safety and Justice ChallengeEvaluation Report (2015–2017)
Table C-2 . SJC Site Samples by Year
Sample Size
Site 2016 2017 Total
Ada 80 84 164
Charleston 398 401 799
Connecticut 802 797 1,599
Cook 903 900 1,803
Harris 599 603 1,202
Los Angeles 1,196 1,228 2,424
Lucas 351 352 703
Mecklenburg 202 202 404
Milwaukee 698 698 1,396
Multnomah 200 198 398
New Orleans 799 795 1,594
New York 1,195 1,190 2,385
Palm Beach 195 200 395
Philadelphia 991 997 1,988
Pima 599 598 1,197
Shelby 202 203 405
Spokane 500 500 1,000
St. Louis 597 598 1,195
Total 10,507 10,544 21,051

84Safety and Justice ChallengeEvaluation Report (2015–2017)
Table C-3 . Descriptive Statistics by Sample
National Samples (%) SJC Site Samples (%)
2015 2016 2017 2016 2017
Race and Ethnicity
White 68 68 65 56 56
Hispanic 13 13 16 18 18
African American 12 12 12 18 18
Asian 5 4 5 6 6
Other 2 3 3 2 2
Total 100 100 100 100 100
Educational Attainment
Less than high school 3 2 13 3 3
High school or equivalent 22 31 28 27 29
Some college 37 29 21 28 27
Post-secondary degree 38 38 38 41 41
Don’t know 0 0 1 0 0
Total 100 100 100 100 100
Income
Less than $50k 50 50 45 47 45
$50-100k 29 29 30 30 30
$100k+ 21 21 25 23 25
Total 100 100 100 100 100
Age in Categories
Missing/Not Specified 1 3 5 4 5
18-29 22 21 21 22 21
30-49 36 35 32 36 35
50-64 25 25 24 23 23
65+ 17 17 18 16 16
Total 100 100 100 100 100

85Safety and Justice ChallengeEvaluation Report (2015–2017)
Appendix D . Glossary of Key Terms
Term Definition
Admissions Persons who are officially booked and housed in jails by formal legal document and the authority of the courts or some other official agency. Jail admissions include persons sentenced to weekend programs and those who are booked into the facility for the first time. Excluded from jail admissions are inmates reentering the facility after an escape, work release, medical appointment or treatment facility appointment, and bail and court appearances.
Arrest rate An estimate that is calculated by dividing the number of reported arrests by the total population; the result is multiplied by 100,000.
Average Daily Admissions (ADA) The average is derived from the sum of all persons booked into and housed in a facility each day, divided by the number of days in the year.
Average Daily Population (ADP) The average is derived from the sum of inmates in jail each day for a year, divided by the number of days in the year.
Average length of stay The average number of days from date of intake to date of release among all inmates in a jurisdiction regardless of changes in classification, housing, or sentencing status during that period.
Bail Security, such as cash, a bond, or property, pledged or given to a court by or on behalf of one accused of committing a crime, to obtain release from incarceration and to ensure the person’s future appearance in court when required during the criminal proceeding.
Bail reform The procedures for a judicial officer to order the release or detention of an arrested person pending trial, sentence, and appeal. Rather than having to adhere to stringent bail requirements, judges would be allowed to use risk assessments (consider family and community ties, employment history, and past record of court appearances) as part of bail determinations. An alternative option is giving courts the ability to eliminate bail for defendants accused of low-level offenses. Low-risk individuals would be able to be released before trial and are not disproportionately punished; whereas, high-risk individuals would remain jailed.
Booking The procedure at a jail or police station following an arrest in which information about the arrest, including the time, the name of the arrested person, and the crime for which the arrest was made, is entered in the police register.
Communications tools Announcements, media coverage, digital communications, toolkits.
Communities of color Communities made up of non-white citizens, particularly African Americans and Latinos.
Community engagement The process of working collaboratively with community groups to address issues that impact the well-being of those groups. Activities that help firms engage the community include credible and transparent reporting, town hall meetings, and collaborative decision-making.
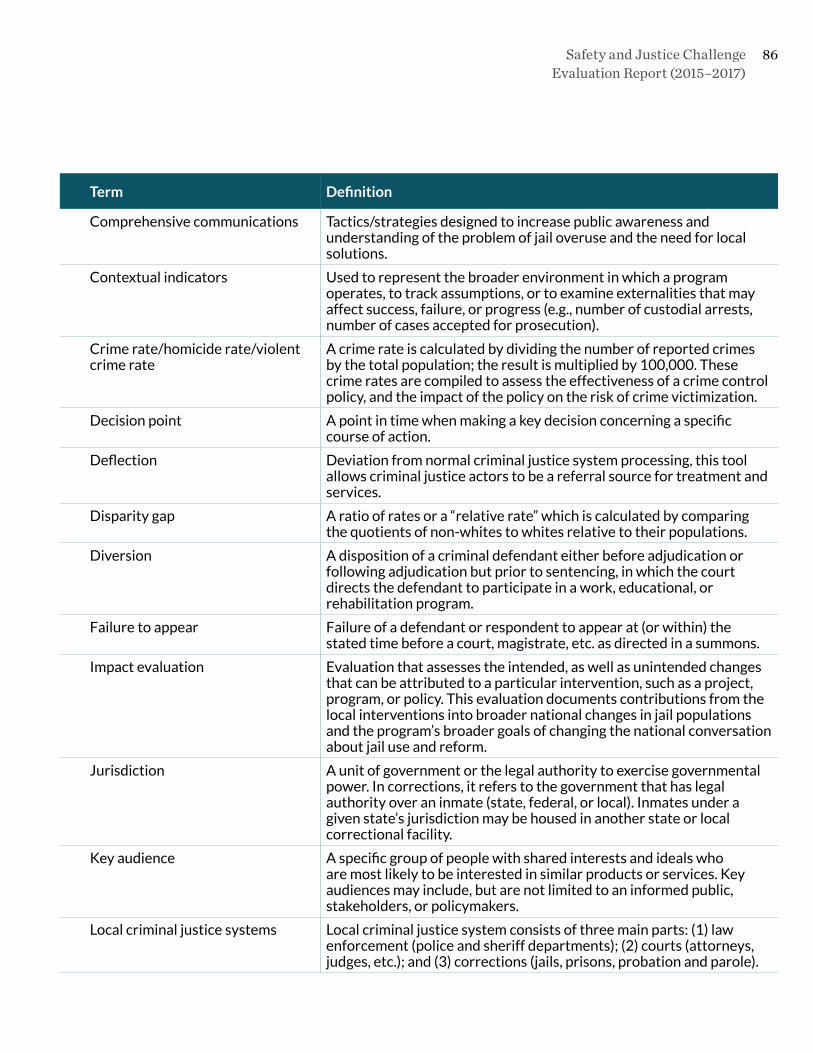
86Safety and Justice ChallengeEvaluation Report (2015–2017)
Term Definition
Comprehensive communications Tactics/strategies designed to increase public awareness and understanding of the problem of jail overuse and the need for local solutions.
Contextual indicators Used to represent the broader environment in which a program operates, to track assumptions, or to examine externalities that may affect success, failure, or progress (e.g., number of custodial arrests, number of cases accepted for prosecution).
Crime rate/homicide rate/violent crime rate
A crime rate is calculated by dividing the number of reported crimes by the total population; the result is multiplied by 100,000. These crime rates are compiled to assess the effectiveness of a crime control policy, and the impact of the policy on the risk of crime victimization.
Decision point A point in time when making a key decision concerning a specific course of action.
Deflection Deviation from normal criminal justice system processing, this tool allows criminal justice actors to be a referral source for treatment and services.
Disparity gap A ratio of rates or a “relative rate” which is calculated by comparing the quotients of non-whites to whites relative to their populations.
Diversion A disposition of a criminal defendant either before adjudication or following adjudication but prior to sentencing, in which the court directs the defendant to participate in a work, educational, or rehabilitation program.
Failure to appear Failure of a defendant or respondent to appear at (or within) the stated time before a court, magistrate, etc. as directed in a summons.
Impact evaluation Evaluation that assesses the intended, as well as unintended changes that can be attributed to a particular intervention, such as a project, program, or policy. This evaluation documents contributions from the local interventions into broader national changes in jail populations and the program’s broader goals of changing the national conversation about jail use and reform.
Jurisdiction A unit of government or the legal authority to exercise governmental power. In corrections, it refers to the government that has legal authority over an inmate (state, federal, or local). Inmates under a given state’s jurisdiction may be housed in another state or local correctional facility.
Key audience A specific group of people with shared interests and ideals who are most likely to be interested in similar products or services. Key audiences may include, but are not limited to an informed public, stakeholders, or policymakers.
Local criminal justice systems Local criminal justice system consists of three main parts: (1) law enforcement (police and sheriff departments); (2) courts (attorneys, judges, etc.); and (3) corrections (jails, prisons, probation and parole).

87Safety and Justice ChallengeEvaluation Report (2015–2017)
Term Definition
Media scan The process of providing clients with copies and analyses of media content, specific to the interest and subject required. Algorithm developed to determine which media content covers criminal justice issues.
Models for Change (MfC) Juvenile justice reform initiative that partners with selected states to advance reforms that effectively hold young people accountable for their actions, provide for their rehabilitation, protect them from harm, increase their life chances, and manage the risk they pose to themselves and to public safety.
Nonresidential facility A building that is not used for people to live in but that offers services, counseling, programs, and treatment to its occupants.
Outcome evaluation Evaluation that assesses the effects of activities on criminal justice metrics within the locally funded Implementation Sites relative to a series of comparison sites.
Percentage of the confined population that is non-white
Percentage of racial and ethnic minorities who are incarcerated, particularly African Americans and Latinos.
Percentage of the confined population that is pretrial (or unconvicted)
Percentage of people incarcerated who are awaiting trial or release and who have not been formerly adjudicated.
Planning phase The process of defining the scope of the work and setting goals.
Pretrial population Detainees who have been charged with committing a crime but not yet adjudicated.
Pretrial risk The probability of failure to appear at trial or to commit another crime if released.
Process evaluation Evaluation that seeks to understand how events happen and gain a firsthand account of planning, implementation, and program delivery from participants.
Project on Human Development in Chicago Neighborhoods (PHDCN)
Interdisciplinary study of how families, schools, and neighborhoods affect child and adolescent development. This project was designed to advance the understanding of the developmental pathways of both positive and negative human social behaviors.
Racial and ethnic disparity (RED) The higher rate that non-whites are incarcerated compared to whites.
Strategic allies Membership organizations that represent key stakeholders and audiences, embrace similar reform goals, and have their own communication vehicles.
Stress tests An empirical assessment of the likely drivers of local jail incarceration used to show stakeholders potential ways to reduce their jail populations (e.g., identify ways to speed case processing).
Theory of Change (ToC) Theories that define all building blocks required to bring about a given long-term goal and used to explain how a program might achieve desired goals/outcomes.
Warrant A legal document issued authorizing the police or some other body to make an arrest, search premises, or carry out some other action relating to the administration of justice.