safety and occupational health action plan, team 14 baseline … · baseline assessment of employee...
TRANSCRIPT

DRAFT REPORT | DO NOT CITE OR DISTRIBUTE April 1, 2016
Safety and Occupational Health Action Plan, Team 14
Baseline Assessment of Employee Perceptions of Safety Culture
2 of 31
Executive Summary In 2012, the U.S. Department of the Interior’s Office of Occupational Safety and Health conducted a review of the U.S. Bureau of Reclamation’s (Reclamation) Safety and Occupational Health (SOH) Program. Conclusions no.1-2 of their December 2013 Evaluation Report states: “A degree of complacency exists in Reclamation that results in the acceptance of workplace hazards and contributes to the presence of uncorrected hazards, non-compliances, and incomplete SOH program implementation.”
Reclamation established a Rapid Improvement Work Team to address concerns raised in the Department’s review. This team identified that, “Organizationally, we are not consistently recognizing hazards and properly assessing risk...before doing the job.”
In Reclamation’s May 2014 SOH Action Plan, Program Action Plan Teams were created to address the deficiencies documented in the Evaluation Report. Team 14 was given the assignment to develop a survey to collect data for a baseline assessment of employee perceptions of safety and health in their work environment.
Team 14 worked through a methodical process to develop survey questions to gauge the safety perception of employees at all levels within Reclamation (i.e. workers, supervisors and managers). The questions were ordered in a specific manner to measure employee attitudes of safety from three different perspectives: (1) communication, (2) safety behaviors and (3) reporting and responsiveness.
The electronic survey was distributed to 5,996 Reclamation employees and contractors and 45.9% of the recipients (2,751 employees) completed the survey. Results of the assessment indicate that agency-wide respondents agree that safety is an important facet of our workplace, that working safely is supported by management and that the training received is effective. Respondents also identified areas for improvement. Areas for improvement include:
(1) Communication - Respondents identified a need to improve internal communications regarding best practices and lessons learned so we can alter procedures from high producing offices, and prevent similar incidents from occurring in other locations. Another area for improved communication is to allow employees to be more engaged in decisions about safety that directly affect their work.
(2) Reporting Safety Incidents - Sixty-two employee responses indicate they have not reported safety violations or near misses in the past due to concerns of negative reactions from coworkers and/or fear of reprisal from managers. There has been some improvement in reporting incidents, however, there still appears to be some concern about fear of reprisal and misunderstanding of reporting responsibility.

3 of 31
(3) Implementation of Safety Program - Overall there is strong agreement that the Safety Program is well defined and implemented, but that there is a lack of consistency in how safety policies and practices are implemented, and variability in how management in different regional/area offices prioritizes and budgets for safety-related items.
(4) “Soft Safety” vs “Hard Safety” - The survey addressed clearly defined safety rules but did not adequately address nonspecific office hazards thoroughly.
Information in this report provides insight to Reclamation employees’ perceptions of safety in their work environment. Using these results as a baseline for comparison of future assessments allows for continued improvement in Reclamation’s safety culture because Reclamation believes safety is a lifetime value.

4 of 31
Introduction Over the past two decades, there has been a shift in focus to “leading indicators” of safety conditions: those organizational, managerial and human factors that may contribute to the occurrence of frequency of safety incidents (Flin 2000). Generally, these predictive indicators have been gathered into the constructs of safety culture and climate, essentially measures of perceptions of the importance of safety in their organization and those core organizational values that affect safety-related outcomes (DeJoy 2004).
There is no broadly accepted definition of safety culture. Most measures focus on the role of managers and supervisors, the formal safety system at institutions (policies and procedures), risk, work pressure, and competence (Flin 2000). Generally, the safety culture perception assessment tool broadly measured these themes and subthemes across managerial, supervisory, and individual levels. For ease of organization, we have gathered these themes into four links of a “safety chain.” The safety chain seeks to track safety culture from 1) high-level organizational drivers of policy and procedure; 2) communication between organizational and individual levels; 3) drivers of individual attitudes and behavior; and 4) the ability of the organization to obtain feedback in the form of accident and near miss reporting. Figure 1 shows how different themes were organized within the safety chain.
Figure 1. The Safety Chain

5 of 31
Methods
The intent of questions was to form a baseline on the safety perception of workers, supervisors, and managers. The survey was also intended to be able to discern the difference in attitude between General Schedule employees, and Wage Grade employees.
To develop the survey, Team 14 members brainstormed questions along several safety culture factors and reused questions from prior safety culture assessments (Notably the Snake River Safety Culture Assessment ). The team then grouped these questions by factor, category, and employee and selected the clearest questions for use in a beta test survey. The survey was released for beta testing by ten volunteers from each region and Denver during the period Sep, 4-11, 2015. The beta survey received 49 responses. Small corrections were made to a few questions based on beta tester feedback. On November 9, 2015, the Team invited 5,996 Reclamation employees and contractors to complete the survey. The survey closed on December 9, 2015.
Who completed the survey.
Overall 51.4% of the invitees began the survey, with 45.9% completing the survey in its entirety. Of the 3,083 who began the survey, the average survey completion rate was 89%. While the survey was anonymous, the team collected coarse scale demographic data on the respondent's region, their pay system, whether they manage or supervise employees, their length of service and the amount of time they spend in office, outdoor, industrial and construction workplaces.
Figure 2. Regional Response
6 of 31
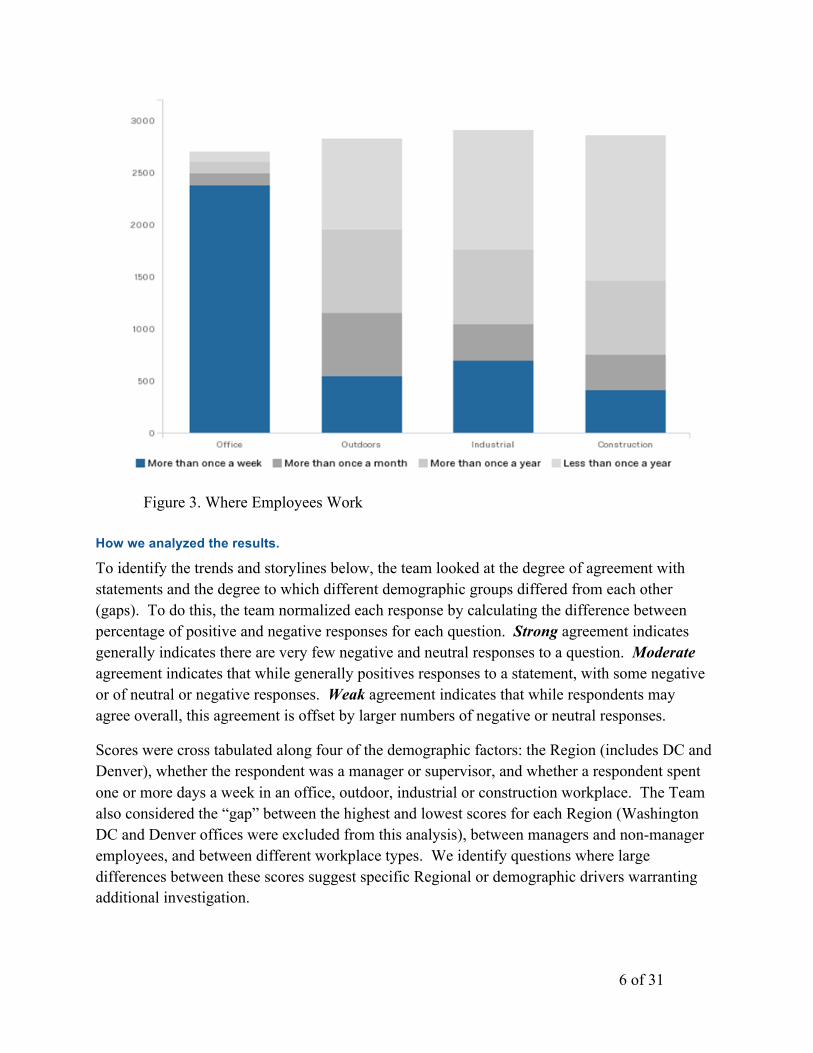
Figure 3. Where Employees Work
How we analyzed the results.
To identify the trends and storylines below, the team looked at the degree of agreement with statements and the degree to which different demographic groups differed from each other (gaps). To do this, the team normalized each response by calculating the difference between percentage of positive and negative responses for each question. Strong agreement indicates generally indicates there are very few negative and neutral responses to a question. Moderate agreement indicates that while generally positives responses to a statement, with some negative or of neutral or negative responses. Weak agreement indicates that while respondents may agree overall, this agreement is offset by larger numbers of negative or neutral responses.
Scores were cross tabulated along four of the demographic factors: the Region (includes DC and Denver), whether the respondent was a manager or supervisor, and whether a respondent spent one or more days a week in an office, outdoor, industrial or construction workplace. The Team also considered the “gap” between the highest and lowest scores for each Region (Washington DC and Denver offices were excluded from this analysis), between managers and non-manager employees, and between different workplace types. We identify questions where large differences between these scores suggest specific Regional or demographic drivers warranting additional investigation.
7 of 31
How to Use This Report
The data presented in this report can be useful in three ways 1) to provide a comparison along demographic factors to identify potential trends in safety culture; 2) as baseline values for which Reclamation might compare the results from subsequent surveys to gauge progress in efforts to change safety culture; and 3) as a comparison to other safety metrics to identify whether and which questions in this survey can serve as leading indicators of safety performance.
This report begins the inquiry of the first of the factors above by summarizing baseline data on employee perception of Reclamation’s safety culture along different factors of the safety chain. This report can hopefully help identify potential trends or storylines in the data that can be useful in subsequent, more focused analysis. For each of the four links of the safety chain a list of storylines is provided. These summarize the results for each factor within that link. Brief narrative descriptions of the results, highlighting potentially significant gaps among the four demographic factors above, are also provided.
The values presented in this report should not be interpreted as absolute indicators of safety culture, the importance of safety at Reclamation, nor leading indicators of safety performance. Further, the scale for the index values presented for each question can vary; a low score for one question can very well represent a very good score on another. Conversely, very high scores may not indicate a strong safety culture.
To foster additional analysis, cross tabulated data via region for most questions in the survey is provided in Appendix A.
If raw data for additional analysis is desired, please contact Chris Eder at [email protected] or Brian Kitt at [email protected]
Organizational Factors Organizational factors measure employee perceptions of Reclamation’s formal safety policies and programs, training, implementation, and management support for the safety program. On average employees have favorable opinions of all organizational factors. Employees had the most favorable views of training and competency and supervisory support, and the less favorable views of the policy and safety program.
Storylines
● Training is a strength, with strong agreement that training is effective and employees are competent. There is some regional variability in the availability of training, however.
● Management support is a strength overall, but there is substantial variability the trust of management between Regions and within different workplace types.

8 of 31
● Implementation is inconsistent across regions, and there is some misalignment between employee and management perceptions on PPE availability.
● There were large differences between regions on the favorability of policies and the safety program.
Policy & Safety Program
The policy and safety program component measures those things Reclamation does officially to direct the safety practices of the organization. Specifically, this factor measures employee perceptions of whether written policies and practices are made by qualified people to effectively address the risks they face in the workplace. This is an important part of safety culture because it most clearly represents Reclamation’s official positions on safety and it is the primary means by which Reclamation can create safe practices.
Overall, regions exhibited large differences in employee perception of safety policies and programs. The best scores showed strong agreement with policies and programs, while the worst scores on these questions showed weak agreement with policies and programs, and were uniformly below average for the survey. These differences indicate an opportunity to replicate successful implementation of safety policy and programs in some Regions more broadly throughout Reclamation.
Survey Question Number of Responses
No Don’t Know
Yes
10.3 The safety committee helps makes my workplace safer.
1,822 8% 27% 66%
Survey Question Number of Responses
No Don’t Know
Yes
10.2 My workplace has a safety committee
2,727 5% 28% 67%
Survey Question Number of Responses
Disagree Neutral Agree
10.1.10 Reclamation's safety policies are effective at providing a safe workplace
2710 8% 25% 66%

9 of 31
Survey Question Number of Responses
Disagree Neutral Agree
10.1.7 - Safety decisions at my workplace are made by qualified people.
2715 10% 26% 64%
Survey Question Number of Responses
Disagree Neutral Agree
10.1.6 - My workplace's safety program addresses the risks I encounter on a day-to-day basis.
2,717 10% 29% 61%
There were also noteworthy demographic differences. Managers and supervisors were slightly more likely to agree that workplace safety programs address the risks faced by workers (Question 10.1.6) and were also slightly more likely to be aware of their workplaces safety committee. Employees in industrial workplaces were substantially less likely to agree that whether safety decisions were made by qualified people (Question 10.1.7,) and less likely to agree that safety committees (Question 10.3,) and Reclamation’s safety policies (Question 10.1.10,) were effective.
Employees were asked for narrative responses on how they would improve their workplace safety programs. A small sample of responses are presented in the table below. A full record of employee responses is located in Appendix B.
"Make supervisors and managers more responsible (e.g., part of their performance appraisals; salaries and promotions tied to safety performance of their groups). Better and faster communication of accidents and near misses."
“Make the program aware to employees. Make it easy to provide suggestions on how to make the workplace safer. Have safety inspections. Follow OSHA regulations”
“Staffing is a concern with me. Having the adequate amount of qualified people to perform a job is important and ties into safety every which way you look at it.”
“Reorder priorities to give more emphasis to things like doing proper JHAs and quality of work rather than the primary emphasis on quantity and turn-around.”

10 of 31
Ensure employees that reporting an injury is the right thing to do. That there would be no stigma against an employee when reporting the injury.
Employees were also asked if they had anything to say about safety or the safety culture at BOR. A small sample of responses are presented in the table below. A full record of employee responses is located in Appendix C.
“Safety is an attitude. It should be a part of everybody's performance evaluation.”
“Reclamation's office facilities are not managed by people with the proper skills. They are more worried about cost and appearances than they are about employee safety.”
"Safety needs to come from the top. Many offices that I work with have a great respect for safety. However there are still a few out there that ignore safety regulations due to employee pushback, cost and deadlines."
“Better CONSISTENCY and communication on letting the field offices know about safety accidents or near misses that's happening around the region.”
“This is an ongoing conversation that needs input from multiple sources. Review of safety plans is key and helps keep fresh concerns and insights in the forefront keeping people safe.”
Training, Competency and Knowledge
The training, competency and knowledge component measures employee access to safety training, the effectiveness of that training at addressing workplace risk, and how the general competency of employees may affect safety. Overall, employees expressed strong agreement across all but one question in this factor. While managers and supervisors were slightly more likely to agree than non-supervisory workers, differences between workplaces were slight.
When asked whether workplace safety professionals make safety information and training available to employees (Question 10.1.8), employees expressed less agreement, with very large differences between regions and at industrial workplaces. It appears that while satisfied with the training they have received, employees in some circumstances may experience barriers to training. This theme continued in the narrative responses, with a plurality of respondents mentioning training as a way of improving their workplace’s safety program.
Survey Question Number of Disagree Neutral Agree

11 of 31
Responses
10.1.8 My workplace safety professional makes safety information and training opportunities available to me.
2717 9% 22% 68%
Survey Question Number of Responses
Disagree Neutral Agree
7.2.2 My coworkers have received training on how to do their jobs safely.
2,827 6% 18% 76%
Survey Question Number of Responses
Disagree Neutral Agree
9.4.5 I have received training on how to do my job safely
2,741 4% 15% 80%
Survey Question Number of Responses
Disagree Neutral Agree
9.4.6 The safety training I have received addressed the risks I face in my workplace
2,738 7% 19% 74%
Survey Question Number of Responses
Disagree Neutral Agree
7.2.3 My coworkers have the qualifications, skill and knowledge to perform their jobs safely.
2,828 4% 15% 81%

12 of 31
Implementation
The implementation factor tests employee perception of whether or not safety is incorporated into workplace planning, the availability of personal protective equipment, the implementation of safety practices at on-site workplaces, and general opinions about the health and safety of office workplaces.
Generally, employees expressed strong agreement that safety is considered in planning (Question 3.4.1) and that their workplaces have adequate personal protective equipment (Question 3.4.9). When asked more specific questions regarding planning and PPE, some interesting differences emerged. Employees had moderate agreement that their workplace has an adequate budget for safety equipment. (Question 3.4.8) while Managers had strong agreement.
Survey Question Number of Responses
Disagree Neutral Agree
3.4.1 My workplace considers safety when planning activities or projects.
2,939 5% 11% 84%
Survey Question Number of Responses
Disagree Neutral Agree
3.4.9 My workplace has the personal protective equipment I need to do my job safely.
2,935 5% 16% 79%
Survey Question Number of Responses
Disagree Neutral Agree
3.4.8 My workplace has adequate budget for safety equipment.
2,933 7% 26% 67%
Survey Question Number of Responses
Disagree Neutral Agree

13 of 31
10.1.4 My workplace uses job hazard analysis on all jobs.
2,717 9% 29% 62%
With respect to the implementation of job hazard analysis JHA (Question 10.1.4), scores showed moderate agreement with substantial differences between region and industrial workers to have somewhat less favorable perceptions Narrative responses expressed mixed feelings about JHAs. While some respondents wished for more implementation, others expressed that JHAs were too formal, intended to reduce legal risk, or not relevant to their workplace.
Some interesting patterns emerge with respect to implementation of safety policies at on-site workplaces. While employees had a generally favorable perception of the availability of PPE at on-site workplaces (Question 4.3.5,), when asked to discuss specific types of more general PPE such as the availability of sunscreen, water, or insect repellant (Question 4.3.3) or weather appropriate clothing (Question 4.3.7) employees showed weak agreement with PPE availability. and supervisors showed strong agreement about PPE availability and office workers weak agreement compared to employees who perform weekly field work . This may suggest a gap in Reclamation safety practices among employees who perform field work on a less routine basis.
Management Support
The management support factor measures how much employees trust management and perceive that managers care, pay attention, and consistently address safety issues in their workplace. Questions in this factor were asked separately for both managers and the employee’s direct supervisor.
Employees expressed strong agreement when asked whether their immediate supervisor cares about their safety (Question 6.3.1,), pays attention to safety issues (Question 6.4,) whether they trust their supervisor (Question 8.1.2,), and moderate agreement that their supervisor was consistent in addressing safety issues (Question 6.3.9,). While, there was slight variation between regions and workplaces on these questions, these trends were relatively consistent across demographic dimensions.
Employees expressed moderate agreement when asked similar questions about managers in their Region. Most notably on factors considering attention (Question 5.4,) trust (Question 8.1.1,) and consistency (Question 5.3.4,), managers scored somewhat lower than supervisors. Substantial differences in perceptions of management between Regions and between industrial and office workplaces suggest these differences at least partially reflect differences in specific workplaces’ safety culture as opposed to a general bias in favor of one’s supervisor over management.

14 of 31
Survey Question Number of Responses
Disagree Neutral Agree
5.3.1 Managers in my Region care about my safety.
2,866 5% 12% 83%
Survey Question Number of Responses
Disagree Neutral Agree
6.3.1 My supervisor cares about my safety.
2,862 3% 8% 89%
Survey Question Number of Responses
Disagree Neutral Agree
5.3.4 Managers are consistent in addressing safety issues.
2,883 12% 23% 65%
Survey Question Number of Responses
Disagree Neutral Agree
5.3.4 Managers are consistent in addressing safety issues.
2,883 12% 23% 65%
Survey Question Number of Responses
Disagree Neutral Agree
6.3.9 My supervisor is consistent in addressing safety issues.
2,852 6% 20% 74%

15 of 31
Survey Question Number of Responses
Disagree Neutral Agree
5.3.7 Managers follow safety processes and rules.
2,873 8% 24% 68%
Survey Question Number of Responses
Disagree Neutral Agree
6.3.10 My supervisor follows safety processes and rules.
2,842 4% 16% 80%
Survey Question Number of Responses
Disagree Neutral Agree
5.3.5 Managers apply the same safety rules to everyone.
2,879 11% 20% 69%
Survey Question Number of Responses
Too Little
About Right
Too Much
5.4 How much attention do managers in your region pay to safety issues?
2,863 15% 77% 7%
Survey Question Number of Responses
Too Little
About Right
Too Much
6.4 How much attention is your supervisor paying to safety issues?
2,850 10% 86% 4%
Survey Question Number of Responses
Lower Trust
Neutral Higher Trust
<5 5 >5

16 of 31
8.1.1 How much do you trust management?
2,510 15% 3% 82%
Survey Question Number of Responses
Lower Trust
Neutral Higher Trust
<5 500% >5
8.1.2 How much do you trust your supervisor?
2549 7% 2% 91%
Communication Factors Communication factors measure how effectively safety related information is transferred within Reclamation both as an expression of safety policy and process from management to employees and as feedback on safety from employees to management. Communication is a critical component of the safety chain.
Storylines.
● Employees feel encouraged to work safely in almost all regions and workplaces. ● Inter-office communication of best practices and lessons learned shows room for
improvement, especially at industrial workplaces. ● Managers may overestimate the degree to which they seek employee input on safety.
Manager and Supervisor Communication
The management to employee communication factor measures how effectively managers and supervisors communicate to their employees and each other about safety. Overall, employees expressed strong agreement that they are encouraged to work safely (Question 6.3.3,), and report injuries, near misses and safety violations (Question 3.4.3, 76). There was moderate agreement that managers communicate with employees on safety issues (Question 3.4.3,). While employees expressed strong agreement that they were encouraged to participate in safety programs overall (Question 10.1.1,), there was somewhat variation between regions with managers and supervisors being somewhat more likely to express strong agreement than non-supervisory employees .

17 of 31
Survey Question Number of Responses
Disagree Neutral Agree
10.1.1 I am encouraged to participate in workplace safety programs.
2,723 6 % 17 % 78%
Survey Question Number of Responses
Disagree Neutral Agree
10.1.3 Best practices and lessons learned are shared across offices in my region.
2,716 17 % 31 % 52 %
Survey Question Number of Responses
Disagree Neutral Agree
3.4.3 I am encouraged to report injuries, near misses, unsafe behavior and safety violations in my workplace.
2,936 6% 12% 82%
Survey Question Number of Responses
Disagree Neutral Agree
5.3.2 Managers communicate with workers on safety issues.
2,885 8% 16% 75%
Survey Question Number of Responses
Disagree Neutral Agree
6.3.3 My supervisor encourages me to work safely.
2,859 3% 10% 87%
Employees expressed only weak agreement on whether lessons learned and best practices are shared among offices within their Region (Question 10.1.3). There were substantial differences between Regions with workers in industrial locations considerably less likely to agree than office workers . This is consistent with narrative responses requesting increased

18 of 31
communication of near-misses, lessons learned, incident reporting, and the results of safety meetings.
Employee to Management Communication
The employee communication factor measures how effectively employees can communicate to their supervisor and management. Employees expressed moderate agreement to the following questions: their supervisor seeks their input on safety topics (Question 6.3.5;); their supervisor consistently explains their safety concerns to management (Question 6.3.4,); they are encouraged to share new ideas on accomplishing their work more safely (Question 10.1.9); and that their suggestions contribute to making their workplace safer (Question 3.4.5). However, employees expressed only weak agreement when asked whether they were included on decisions that directly affected their work generally(Question 3.4.2,).
Survey Question Number of Responses
Disagree Neutral Agree
10.1.9 Employees are encouraged to share new ideas on accomplishing their work more safely.
2,713 9.3 24.5 68.4
Survey Question Number of Responses
Disagree Neutral Agree
3.4.2 Employees are included in decisions that directly affect their work.
2,934 18% 20% 62%
Survey Question Number of Responses
Disagree Neutral Agree
3.4.5 Employee suggestions contribute to making my workplace safer.
2,933 11% 24% 65%
Survey Question Number of Responses
Disagree Neutral Agree
19 of 31
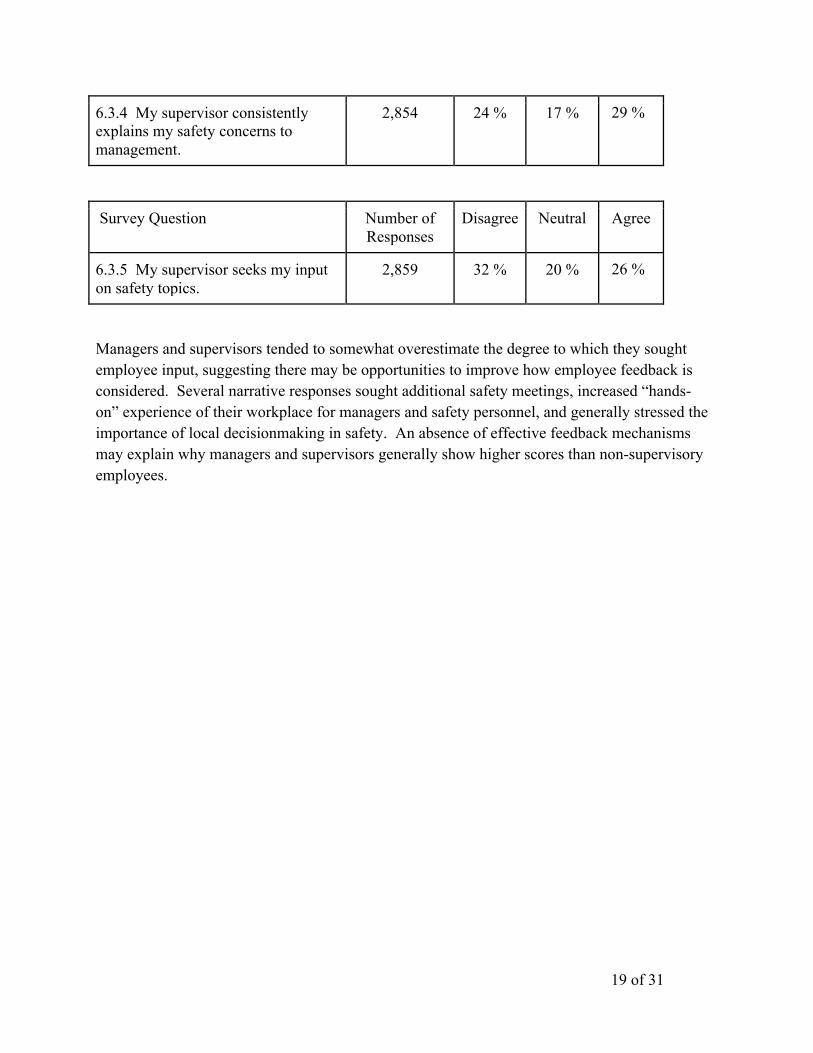
6.3.4 My supervisor consistently explains my safety concerns to management.
2,854 24 % 17 % 29 %
Survey Question Number of Responses
Disagree Neutral Agree
6.3.5 My supervisor seeks my input on safety topics.
2,859 32 % 20 % 26 %
Managers and supervisors tended to somewhat overestimate the degree to which they sought employee input, suggesting there may be opportunities to improve how employee feedback is considered. Several narrative responses sought additional safety meetings, increased “hands-on” experience of their workplace for managers and safety personnel, and generally stressed the importance of local decisionmaking in safety. An absence of effective feedback mechanisms may explain why managers and supervisors generally show higher scores than non-supervisory employees.

20 of 31
Individual Attitudes & Behavior Individual factors measure employee attitudes towards safety and risk, their self-assessed behaviors, and their perception of work pressure and priorities that may compete with safety for their attention. Collectively, these factors can indicate the degree to which individual attitudes, behavior, and capabilities are aligned with organizational safety policy and goals and may serve as a leading indicator of the likelihood that organizational policy will be implemented.
Storylines
● Employees self-assess as risk averse, but assess coworkers as more willing to take risks to complete tasks.
● Use of PPE and stop work policies are well supported, especially in outdoor, industrial and construction workplaces. Specific policies, particularly those related to driving, are not as widely adopted.
● Overall, employees express feelings of work pressure and associated behaviors. These perceptions are most pronounced among supervisors, managers and office workers.
Attitudes towards Safety & Risk
The individual attitude factor measures knowledge of workplace risk and willingness to take risks during work activities. Employees were asked to answer similar questions about themselves and their coworkers to evaluate the degree to which employees might self assess more favorably than their coworkers.
Survey Question Number of Responses
Disagree Neutral Agree
9.4.1 Working safely is more important than meeting deadlines
2,743 1 7 92
Survey Question Number of Responses
Disagree Neutral Agree
9.4.2 I will not perform a work activity unless I know it is safe.
2,743 1% 7% 92%

21 of 31
Survey Question Number of Responses
Disagree Neutral Agree
9.4.12 I understand the safety risks in my workplace.
2,738 2% 9% 90%
Survey Question Number of Responses
Disagree Neutral Agree
9.4.16 I follow similar safety precautions at home as I do at work.
2,734 3% 13% 84%
Survey Question Number of Responses
Disagree Neutral Agree
7.2.5 My coworkers understand the safety risks in our workplace.
2,832 4% 14% 82%
Survey Question Number of Responses
Disagree Neutral Agree
7.2.1 My coworkers will take risks to complete a task.
2,833 45% 31% 24%
Overall employees expressed strong agreement when asked whether they believed working safely is more important than meeting deadlines (Question 9.4.1,), whether they would perform a work activity unless they knew it was safe (Question 9.4.2,) and whether they follow similar safety precautions at home as at work (Question 9.4.16,). Employees express similarly strong agreement when asked whether they (Question 9.4.12) and their coworkers (7.2.5) understood the risks in their workplace.
It is not clear whether this indicates genuinely risk averse attitudes or a bias to rate one’s own performance more highly. For example, when asked whether their coworkers take risks to complete a task the score was substantially lower than questions on individual risk attitudes. (Question 7.2.1). Subsequent surveys should investigate this issue in greater detail with additional parallel questions of individual and coworker attitudes towards risk.

22 of 31
Influence & Receptiveness
The influence and receptiveness factor measures what influences individual behavior and attitudes and to what kinds of input employees are most likely to be receptive. This factor was measured in two ways. In Question 9.2, employees were asked to rate the top three factors that influenced their attitudes towards safety (See below). In Question 9.3, employees were asked to score what factors were most important in performing their job safely.
The top three most influential factors were safety procedures and rules, (highest rated factor), personal opinion on safety, and safety related training. The lowest rated factors were friends and family, supervisor, and management (lowest rated factor). When asked what is most important to doing their job safely, employees scored information and individual behaviors ahead of training and other forms of advice.
9.2 The top three factors that influence your attitude towards workplace safety Count
9.3 On a scale of one to ten, how important are the following in performing your job safely? Avg Score
Safety procedures and rules 1649 Common sense 9.08
Personal opinion on safety 1562 Following safety rules and procedures 8.44
Safety related training 1158 Attention to detail 8.38
Practices at my workplace 1057 Basic job-related skills 7.99
My co-workers 730 On-job-training 7.83
Friends or family 704 Advice from co-workers 7.33
My supervisor 681 Classroom training 7.06
Management 559 Advice from the safety office 6.80
Behavior
The behavior factors test the degree to which employees comply or are willing to comply with safety practices related to PPE use, stop work policies, and specific behaviors related to driving. Employees were asked to rate both themselves and their coworkers on similar questions.
Employees expressed relatively moderate agreement as to whether they or their coworkers used PPE (Question 9.4.15,; Question 7.2.8,) and and stop work to avoid an injury (Question 7.2.7).
23 of 31
However they showed strong agreement whether their coworkers were willing to ask for PPE if not offered (Question 7.2.6) . Workers in industrial and construction workplaces were substantially more likely to agree that they used PPE than office workers , but also tended to rate their own PPE use higher than that of their coworkers. This may reflect stronger familiarity and safety culture surrounding PPE use in these workplaces.
When asked specific questions about driving behaviors, there was considerably less agreement. Numbers of employees reporting they drove to or from a worksite after more than 12 hours equaled those who did not, with 11% of respondents reporting they did so more than 5 times per year. (Question 4.5.4). Office workers were somewhat less likely to report driving after 12 hours of work than those who work more frequently in construction, industrial or outdoor locations. Employees reported similar patterns with respect to driving in severe storms, snow or freezing rain, though these reports are influenced by climatic differences between Regions (Question 4.5.1).
Overall, scores show that employees have strong agreement about their coworkers’ safety behavior. However, the response to “coworkers will take risks to complete a task” has 45% of employees disagreeing with the statement, 24% of employees agree with the statement indicating that almost a quarter of Reclamation employees believe their coworkers will take risks to complete a task.
Priorities & Work Pressure
The priorities and work pressure factor gauges how safety measures with respect to other work drivers and perceptions of work pressure may act as counter pressures to safe work practices. The survey measured priorities and work pressure separately.
Priorities & Workplace Drivers
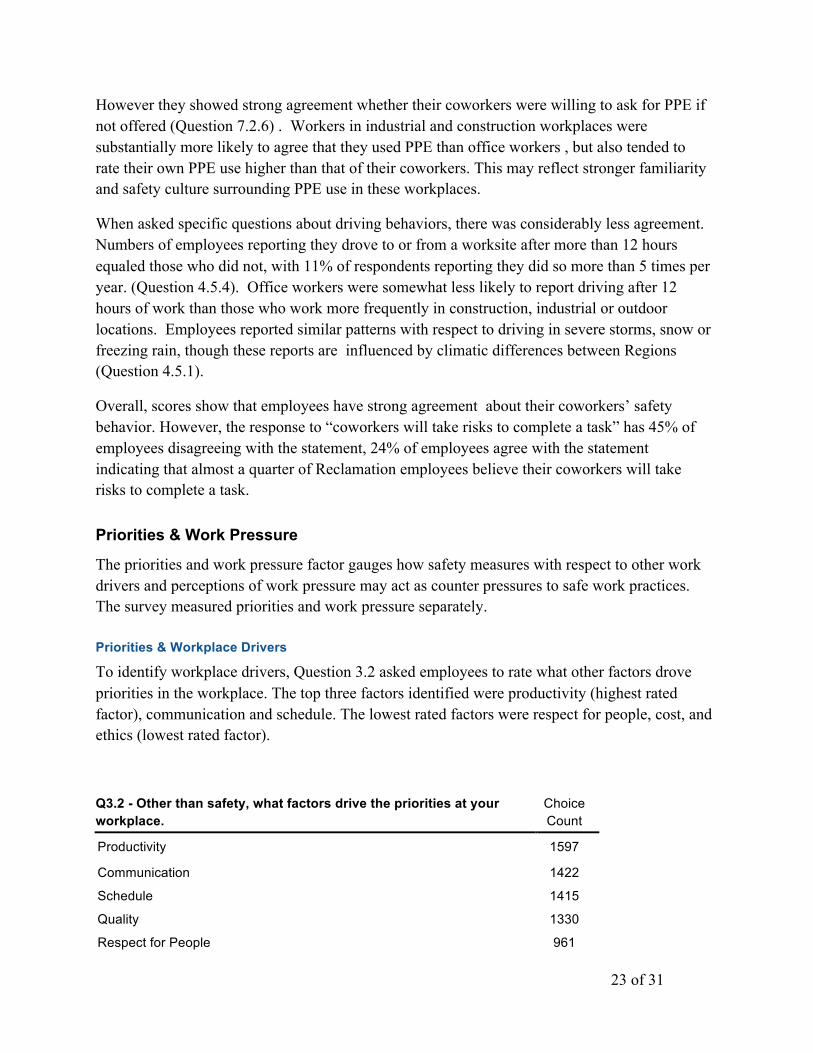
To identify workplace drivers, Question 3.2 asked employees to rate what other factors drove priorities in the workplace. The top three factors identified were productivity (highest rated factor), communication and schedule. The lowest rated factors were respect for people, cost, and ethics (lowest rated factor).
Q3.2 - Other than safety, what factors drive the priorities at your workplace.
Choice Count
Productivity 1597 Communication 1422 Schedule 1415 Quality 1330 Respect for People 961
24 of 31
Cost 956 Ethics 777 Other 251
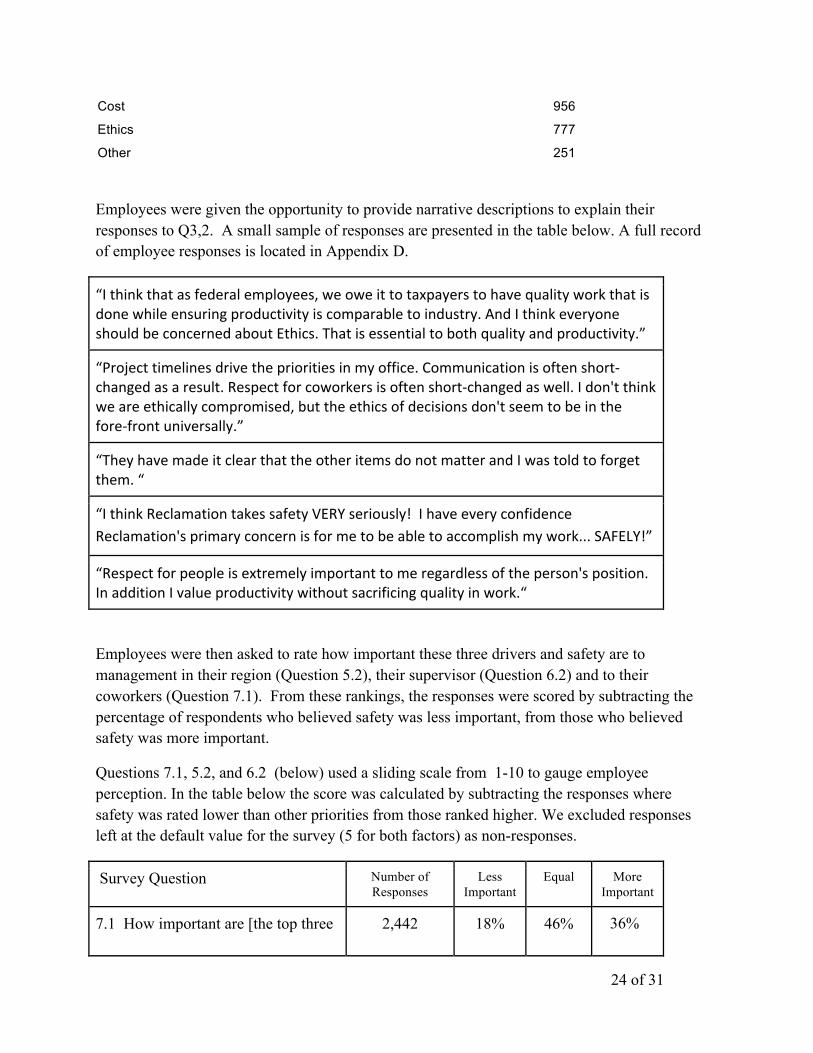
Employees were given the opportunity to provide narrative descriptions to explain their responses to Q3,2. A small sample of responses are presented in the table below. A full record of employee responses is located in Appendix D.
“Ithinkthatasfederalemployees,weoweittotaxpayerstohavequalityworkthatisdonewhileensuringproductivityiscomparabletoindustry.AndIthinkeveryoneshouldbeconcernedaboutEthics.Thatisessentialtobothqualityandproductivity.”
“Projecttimelinesdrivetheprioritiesinmyoffice.Communicationisoftenshort-changedasaresult.Respectforcoworkersisoftenshort-changedaswell.Idon'tthinkweareethicallycompromised,buttheethicsofdecisionsdon'tseemtobeinthefore-frontuniversally.”
“TheyhavemadeitclearthattheotheritemsdonotmatterandIwastoldtoforgetthem.“
“IthinkReclamationtakessafetyVERYseriously!IhaveeveryconfidenceReclamation'sprimaryconcernisformetobeabletoaccomplishmywork...SAFELY!”
“Respectforpeopleisextremelyimportanttomeregardlessoftheperson'sposition.InadditionIvalueproductivitywithoutsacrificingqualityinwork.“
Employees were then asked to rate how important these three drivers and safety are to management in their region (Question 5.2), their supervisor (Question 6.2) and to their coworkers (Question 7.1). From these rankings, the responses were scored by subtracting the percentage of respondents who believed safety was less important, from those who believed safety was more important.
Questions 7.1, 5.2, and 6.2 (below) used a sliding scale from 1-10 to gauge employee perception. In the table below the score was calculated by subtracting the responses where safety was rated lower than other priorities from those ranked higher. We excluded responses left at the default value for the survey (5 for both factors) as non-responses.
Survey Question Number of Responses
Less Important
Equal More Important
7.1 How important are [the top three 2,442 18% 46% 36%

25 of 31
priorities in your workplace] and safety to your coworkers.
Survey Question Number of Responses
Less Important
Equal More Important
5.2 How important are [the top three priorities in your workplace] and safety to managers in your region.
2,603 22% 39% 39%
Survey Question Number of Responses
Less Important
Equal More Important
6.2 How important are [the top three priorities in your workplace] and safety to your supervisor.
2,572 19% 49% 32%
Respondents expressed very weak agreement that safety was more important than other workplace drivers. This was true across Reclamation and scores were similar for managers, supervisors and coworkers (Q 6.2, Q3.2). Narrative responses on this question have a number of employees stating that other work factors come before safety at their location. Managers and supervisors were more likely to believe managers prioritized safety over other workplace drivers. On the other hand, workers in outdoor, industrial, and construction locations were substantially more likely to agree that their coworkers prioritized safety over other workplace drivers.
These data suggest that the priority of safety, relative to other work drivers, is not always clear. Further investigation is warranted to determine if this lack of clarity impacts employee behavior.
Work Pressure
To measure whether other pressures might distract from safety, the questionnaire asked whether respondents felt pressure to get work done quickly, feel they have more work than they can accomplish in a day, sometimes skip lunch to get work done, and arrive tired to work more than once a week.
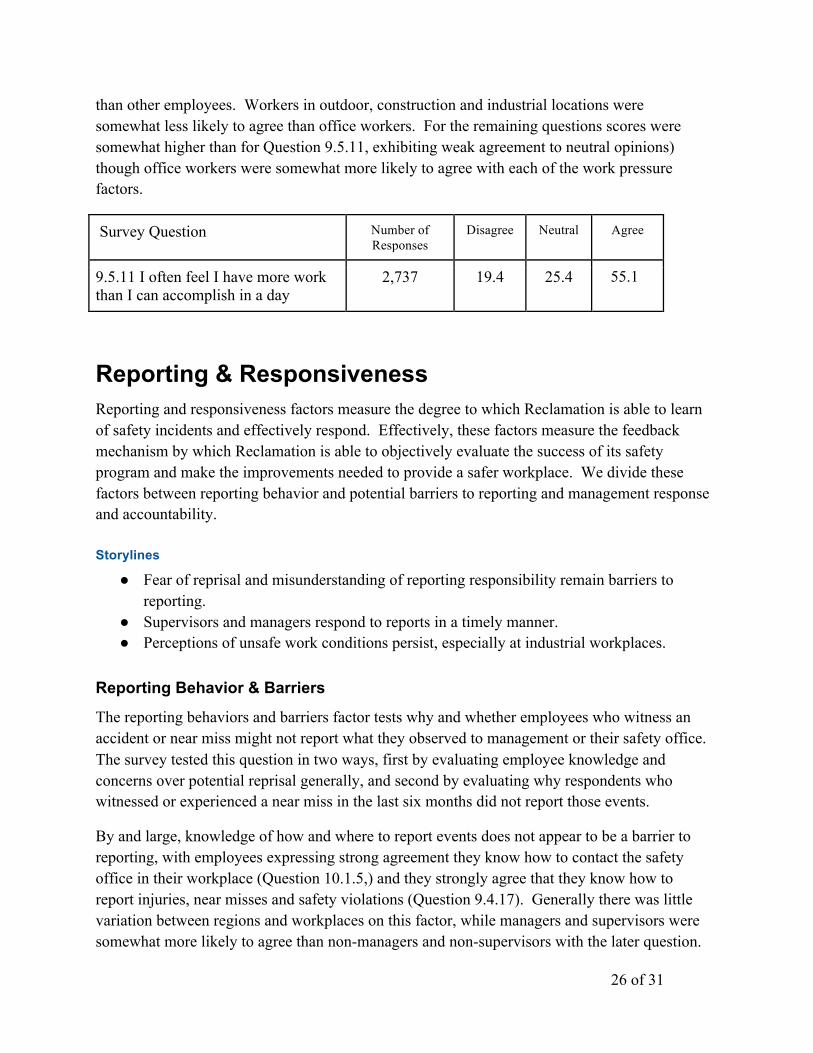
Overall, employees expressed weak to moderate agreement to feeling work pressure. Across Reclamation employees expressed weak agreement that they had more work than they could accomplish in a day (Question 9.5.11). There was substantial variation between regions on this question. Managers and supervisors were substantially more likely to agree with this statement
26 of 31
than other employees. Workers in outdoor, construction and industrial locations were somewhat less likely to agree than office workers. For the remaining questions scores were somewhat higher than for Question 9.5.11, exhibiting weak agreement to neutral opinions) though office workers were somewhat more likely to agree with each of the work pressure factors.
Survey Question Number of Responses
Disagree Neutral Agree
9.5.11 I often feel I have more work than I can accomplish in a day
2,737 19.4 25.4 55.1
Reporting & Responsiveness Reporting and responsiveness factors measure the degree to which Reclamation is able to learn of safety incidents and effectively respond. Effectively, these factors measure the feedback mechanism by which Reclamation is able to objectively evaluate the success of its safety program and make the improvements needed to provide a safer workplace. We divide these factors between reporting behavior and potential barriers to reporting and management response and accountability.
Storylines
● Fear of reprisal and misunderstanding of reporting responsibility remain barriers to reporting.
● Supervisors and managers respond to reports in a timely manner. ● Perceptions of unsafe work conditions persist, especially at industrial workplaces.
Reporting Behavior & Barriers
The reporting behaviors and barriers factor tests why and whether employees who witness an accident or near miss might not report what they observed to management or their safety office. The survey tested this question in two ways, first by evaluating employee knowledge and concerns over potential reprisal generally, and second by evaluating why respondents who witnessed or experienced a near miss in the last six months did not report those events.
By and large, knowledge of how and where to report events does not appear to be a barrier to reporting, with employees expressing strong agreement they know how to contact the safety office in their workplace (Question 10.1.5,) and they strongly agree that they know how to report injuries, near misses and safety violations (Question 9.4.17). Generally there was little variation between regions and workplaces on this factor, while managers and supervisors were somewhat more likely to agree than non-managers and non-supervisors with the later question.

27 of 31
Employees expressed moderate agreement that their coworkers would not judge them negatively for reporting a safety violation (Question 7.2.9) and that a clear majority of people in their workplace can report accidents and near misses without fear of reprisal from managers (Question 3.6).
Survey Question Number of Responses
Disagree Neutral Agree
7.2.9 My coworkers would not judge me negatively for reporting a safety violation.
2,835 11% 21% 68%
Survey Question Number of Responses
Disagree Neutral Agree
9.4.17 I know how to report injuries, near misses, and safety violations.
2,738 6% 12% 83%
Survey Question Number of Responses
Disagree Neutral Agree
9.4.17 I know how to report injuries, near misses, and safety violations.
2,738 6% 12% 83%
Survey Question Number of Responses
Disagree Neutral Agree
3.6 People in my workplace can report accidents or near misses without fear of reprisal from managers.
2,938 7% 17% 76%
Nonetheless, of the 442 respondents who had witnessed an injury (Question 11.1), near miss or other safety violation, only 65% reported all of the events to a supervisor or their safety office, 20% reported some, and 15% did not report at all (Question 11.2). The top three reasons people

28 of 31
did not report were concern coworkers, managers and supervisors would react negatively to them (48), a sense that they lacked adequate knowledge of the event (30), and the belief that someone else had reported or would report the event (22). Most respondents (60) expressed other reasons for not reporting: futility or a lack of management response (15) and the event was handled informally (10) were the most common responses in the “other” category.
Responsiveness & Accountability
The responsiveness and accountability factor measures how effectively Reclamation responds to accidents, near misses and unsafe conditions, whether there is accountability for safety, and the degree to which safety issues persist within a workplace.
Employees expressed strong agreement that their supervisor (Question 6.3.7) and managers in their Region (Question 5.3.3) respond to injuries and near misses. While there was relatively little variability in perceptions of supervisor responsiveness, there was moderate variability between regions with managers somewhat more likely and workers in industrial and construction workplaces somewhat less likely to agree. These general perceptions of moderate agreement are consistent with reports of actual responses to safety incidents, with 82% of responses resolved within one week (Question 11.4,). Critically however, responses varied somewhat between regions , with reports that were never responded to with somewhat higher numbers ranging between 8% and 19%.
Perceptions of accountability for workplace safety differed substantially between questions about supervisors (Question 6.3.8) and managers (Question 5.3.6). With respect to managers and supervisors, perceptions of accountability ranged somewhat by region with workers in industrial workplaces substantially less likely to perceive management as accountable for safety than office workers.
Survey Question Number of Responses
Disagree Neutral Agree
6.3.8 My supervisor is held accountable for workplace safety.
2,851 6% 27% 68%
Survey Question Number of Responses
Disagree Neutral Agree
5.3.6 Managers are held accountable for an unsafe workplace.
2,873 13% 34% 53%
Finally, respondents expressed only weak agreement that their workplace contains safety issues that have not been resolved (Question 3.5). Again these scores ranged substantially between

29 of 31
Regions and workplaces with industrial workers expressing very slight (possibly insignificant) disagreement.
Survey Question Number of Responses
Yes No
3.5 My workplace contains safety issues that have not been resolved.
2,888 27% 73%
Findings and Recommendations
Safety Program Successes
Results of this survey clearly show that agency-wide, respondents agree that safety is an important part of the workplace. Support of management and supervisors in developing and implementing safety policies and procedures as well as providing relevant training opportunities are keys to this success. Survey respondents indicated for the most part they are aware of the safety policies and procedures applicable to their job tasks, have access to personal protective equipment and know and understand the risks in their workplace. Employees strongly agreed their immediate supervisors care about their safety, pay attention to safety issues, and are consistent in how they address safety issues. These attitudes and actions of the supervisors fosters a trust relationship between supervisors and employees.
Areas for Improvement
While the survey results demonstrate Reclamation has successfully established a climate of safety within the agency, it also identifies areas in which improvements can be made to continue fostering and promoting this climate. Effective communication and consistency in implementing the program and best practices are key to a successful program in the future.
Managers overestimate safety climate.
Overall, managers and supervisors are overestimating the safety climate factors. Interestingly, this misperception generally tracks the

30 of 31
performance of the best-performing regions. This has critical implications for safety climate as it suggests that those responsible for implementing safety policy and improvements may be less aware of the opportunities to improve their workplace than their employees.
There are two potential reasons for this. First, managers and supervisors are likely to harbor at least some favorable bias of their own performance. To the extent safety climate factors are reflective of managers’ and supervisors’ performance, this bias may skew scores upwards. Second, managers may lack feedback data to measure safety climate metrics. This is somewhat consistent with more moderate scores on the employee to management communication factor.
Communications.
Overall, communication from management to employees appears to clearly communicate the importance and value of safety to Reclamation; however this communication could be improved by taking steps to engage employees more in discussing safety decisions that directly affect employees’ work. valuations of how communication is working when it begins at the employee level and works its way up to managers through the direct supervisor indicate that employees have a high level of trust with their direct supervisor, but may not have that same degree of trust with other levels of management. Some employees responded that: their safety risks are not fully addressed, their safety concerns are not consistently explained to management by their supervisors, and that Reclamation could do a better job of sharing safety information across regions in the form of “lessons learned” from incidents and near misses
Reporting Safety Incidents.
Learning from one another’s successes or lessons learned, as mentioned above in the Communication section, is useful to everyone at all levels of the organization. However,lessons learned cannot be shared if safety violations and near misses are not being reported. Across Reclamation, out of 442 employees responding they witnessed safety events, 62 employees responded that many of these instances go unreported due to the employee’s fear of their coworkers reaction and/or fear of reprisal from management. Eliminating the perception of these fears or addressing this behavior should it exist is necessary to accomplish improvements in this area.
Safety Program Implementation.
Reclamation has been successful in developing many safety policies and procedures, yet there seems to be some degree of inconsistency in this implementation from region to region along with a perception that managers are inconsistent in how they hold employees and themselves accountable for following these policies and procedures. Respondents also reported inconsistencies in how offices prioritize and budget for safety related items.

31 of 31
“Soft Safety” VS “Hard Safety”
Many respondents commented that they felt that the survey did not address the safety in their workplace in a significant way. Examples of this include (1) an indication that employee driving habits deviate from Reclamation practices. 11% of employees report driving in excess of an 8 hour day, and (2) ”soft safety” viewed as more of the nonspecific office hazards go unrecognized within the safety discussions, while “hard safety” such as wearing a hard hat while in an industrial area, is clearly defined and addressed in policies and procedures.