safety evaluation of yield-to- pedestrian … evaluation of yield-to-pedestrian channelizing devices...
TRANSCRIPT

Safety Evaluation of Yield-to-Pedestrian Channelizing
Devices
FINAL REPORT
OCTOBER 2006
Western Transportation InstituteMontana State University
COMMONWEALTH OF PENNSYLVANIADEPARTMENT OF TRANSPORTATION
CONTRACT # 05-01-14


SAFETY EVALUATION OF YIELD-TO-PEDESTRIAN CHANNELIZING DEVICES
Final Report
By
Christopher Strong, P.E. and
Manjunathan Kumar, P.E.
of the
Western Transportation Institute College of Engineering
Montana State University
Prepared for the
Pennsylvania Department of Transportation Bureau of Planning and Research
Harrisburg, PA
October 2006


Technical Report Documentation Page 1. Report No. FHWA-PA-2006-010-050114
2. Government Accession No.
3. Recipient’s Catalog No.
5. Report Date October 2006
4. Title and Subtitle Safety Evaluation of Yield-To-Pedestrian Channelizing Devices: Final Report
6. Performing Organization Code
7. Author(s) Christopher Strong and Manjunathan Kumar
8. Performing Organization Report No. CE/ST 29 10. Work Unit No. (TRAIS)
9. Performing Organization Name and Address Western Transportation Institute Montana State University PO Box 174250 Bozeman, MT 59717-4250
11. Contract or Grant No. 13. Type of Report and Period Covered Final Report, February 2006 – October 2006
12. Sponsoring Agency Name and Address The Pennsylvania Department of Transportation Bureau of Planning and Research Commonwealth Keystone Building 400 North Street, 6th Floor Harrisburg, PA 17120-0064
14. Sponsoring Agency Code
15. Supplementary Notes Research performed in cooperation with the Pennsylvania Department of Transportation and the US Department of Transportation, Federal Highway Administration. 16. Abstract This report analyzes motorist and pedestrian behavior to determine the effectiveness of yield-to-pedestrian channelizing devices (YTPCD) in improving pedestrian safety. YTPCD are placed on the centerline of a roadway in advance of marked crosswalks to remind motorists of the necessity of yielding to pedestrians. Behavioral data were collected at five sites in each of four different community types (urban, suburban, small city and college town) before and after installation of those devices. Sites included crosswalks at unsignalized intersections and mid-block locations, with and without the devices, to measure both direct and potential spillover effects. Data were analyzed with respect to three hypotheses: whether motorists were more likely to yield to pedestrians, whether pedestrians were less likely to yield to motorists (implying greater pedestrian security), and whether pedestrians were more likely to use crosswalks. The analysis generally showed statistically significant support for all three hypotheses, suggesting improvements in pedestrian safety. The effects were more evident at intersections than at mid-block crossings, and did not appear to be related to community type. Spillover effects were comparable at intersections, but less pronounced at mid-block crossings. The report recommends consideration of YTPCD where local design conditions and pedestrian safety concerns warrant, and provides recommendations for future research. 17. Key Words Pedestrian safety, motorist behavior, pedestrian behavior, Yield-to-Pedestrian Channelizing Devices, marked crosswalks
18. Distribution Statement No restrictions. This document is available from the National Technical Information Service, Springfield, VA 22161
19. Security Classif. (of this report) Unclassified
20. Security Classif. (of this page) Unclassified
21. No. of Pages 97
22. Price
Form DOT F 1700.7 (8-72) Reproduction of completed page authorized


Safety Evaluation of Yield-to-Pedestrian Channelizing Devices Disclaimer and Acknowledgments
iii
DISCLAIMER
The opinions, findings and conclusions expressed in this publication are those of the authors and not necessarily those of the Pennsylvania Department of Transportation, the Federal Highway Administration, or Montana State University.
Alternative accessible formats of this document will be provided upon request. Persons with disabilities who need an alternative accessible format of this information, or who require some other reasonable accommodation to participate, should contact Kate Heidkamp, Assistant Director for Communications and Information Systems, Western Transportation Institute, Montana State University, PO Box 174250, Bozeman, MT 59717-4250, telephone number 406-994-7018, e-mail: [email protected].
ACKNOWLEDGMENTS
The authors are indebted to Dave Bachman and Matt Bochanski of the Pennsylvania Department of Transportation (PennDOT), for their extensive support and cooperation in working with communities to ensure that the field testing was successful. The authors thank the technical panel, coordinated by PennDOT project manager Lisa Karavage, for their advice and guidance throughout the project. The authors also thank the communities of Manayunk, Haverford Township, Pottstown and West Chester for their cooperation in the testing.
Data collection was a critical component of this project, and the authors appreciate the help that Catherine Leatherman and the staff of Snelling Personnel Services (King of Prussia, PA) provided. The authors also thank Dr. Kristen Sanford Bernhardt of Lafayette College for her desire to support student research through this project, and Daniel DeGraft-Johnson of Widener University for his help in field data collection.
The authors thank Dr. Michael Kelly and Dr. Ahmed Al-Kaisy, who provided valuable insight and review of these findings. The authors also thank Carla Little for her editorial assistance on this final report and earlier technical memoranda.

Glossary of Abbreviations Safety Evaluation of Yield-to-Pedestrian Channelizing Devices
iv
GLOSSARY OF ABBREVIATIONS
MOE Measure of Effectiveness PennDOT Pennsylvania Department of Transportation YTPCD Yield-to-Pedestrians Channelizing Device
Safety Evaluation of Yield-to-Pedestrian Channelizing Devices Table of Contents
v
TABLE OF CONTENTS
Disclaimer ...................................................................................................................................... iii
Acknowledgments.......................................................................................................................... iii
Glossary of Abbreviations ............................................................................................................. iv
List of Tables ................................................................................................................................. vi
List of Figures ............................................................................................................................... vii
Executive Summary ....................................................................................................................... ix
1. Introduction..............................................................................................................................1
2. Background ..............................................................................................................................2 2.1. Pedestrian Safety Challenges...........................................................................................2 2.2. Yield-to-Pedestrian Channelizing Devices (YTPCD) .....................................................4 2.3. Comparative Studies ........................................................................................................5
3. Methodology ............................................................................................................................6 3.1. Project Goal .....................................................................................................................6 3.2. Data Collection ................................................................................................................7 3.3. Analysis..........................................................................................................................18
4. Summary of Observations......................................................................................................21 4.1. General Observations.....................................................................................................21 4.2. Site-Specific Observations.............................................................................................22
5. Results....................................................................................................................................25 5.1. Direct Effects .................................................................................................................25 5.2. Spillover Effects.............................................................................................................33
6. Summary and Recommendations ..........................................................................................41 6.1. Summary of Research Findings .....................................................................................41 6.2. Recommendations..........................................................................................................42
References......................................................................................................................................43
Appendix A: Site Photos................................................................................................................45
Appendix B: Data Collection Forms..............................................................................................66
Appendix C: “After” Training Presentation ..................................................................................68
Appendix D: Summary of Observational Data .............................................................................72
Appendix E: Plots of Confidence Intervals ...................................................................................78
List of Tables Safety Evaluation of Yield-to-Pedestrian Channelizing Devices
vi
LIST OF TABLES Table 2-1: Evaluation Results of Devices Similar to YTPCD in Other States............................... 5 Table 3-1: Number of Tested Locations ......................................................................................... 7 Table 3-2: List of Selected Intersections and Mid-Block Crossing Sites ....................................... 8 Table 3-3: Data Collection Schedule ............................................................................................ 13 Table 5-1: Statistical Results of Motorist Behavior Hypotheses (Direct Testing, Excluding Beech
Street) .................................................................................................................................... 27 Table 5-2: Statistical Results of Pedestrian Security Hypothesis (Direct Testing, Excluding
Beech Street) ......................................................................................................................... 29 Table 5-3: Statistical Results of Pedestrian Security Hypothesis (Direct Testing, by Location) . 30 Table 5-4: Statistical Results of Use of Crosswalks Hypothesis (Direct Testing, Excluding Beech
Street) .................................................................................................................................... 32 Table 5-5: Statistical Results of Use of Crosswalks Hypothesis (Direct Testing, by Location) .. 32 Table 5-6: Statistical Results of Motorist Behavior Hypotheses (Spillover Effects) ................... 35 Table 5-7: Statistical Results of Motorist Behavior Hypotheses (Spillover Effects by Location)35 Table 5-8: Statistical Results of Pedestrian Security Hypotheses (Spillover Effects).................. 37 Table 5-9: Statistical Results of Pedestrian Security Hypothesis (Spillover Effects by Location)
............................................................................................................................................... 37 Table 5-10: Statistical Results of Use of Crosswalks Hypotheses (Spillover Effects)................. 39 Table 5-11 Statistical Results of Use of Crosswalks Hypotheses (Spillover Effects by Location)
............................................................................................................................................... 39
Safety Evaluation of Yield-to-Pedestrian Channelizing Devices List of Figures
vii
LIST OF FIGURES Figure 2-1: Pedestrian Fatalities in Pennsylvania, 1997-2005........................................................ 2 Figure 2-2: Pedestrian Crashes and Major Injuries in Pennsylvania, 1997-2005........................... 3 Figure 2-3: Example of YTPCD..................................................................................................... 4 Figure 2-4: Example YTPCD Installation ...................................................................................... 4 Figure 3-1: Map of Study Locations (Philadelphia/Manayunk) ..................................................... 9 Figure 3-2: Map of Study Locations (Haverford Township)........................................................ 10 Figure 3-3: Map of Study Locations (Pottstown) ......................................................................... 11 Figure 3-4: Map of Study Locations (West Chester).................................................................... 12 Figure 3-5: Pedestrian Crossing Flow Chart................................................................................. 15 Figure 3-6: Sample Data Collection Form.................................................................................... 15 Figure 4-1: Example of YTPCD Damaged by Vehicle ................................................................ 22 Figure 5-1: Percentage of “First Motorists” Yielding (Direct Testing, Excluding Beech Street) 26 Figure 5-2: Percentage of Pedestrians Yielding (Direct Testing, Excluding Beech Street) ......... 28 Figure 5-3: Percentage of Pedestrians Using Crosswalk When Vehicles are Present (Direct
Testing, Excluding Beech Street) ......................................................................................... 31 Figure 5-4: Percentage of “First Motorists” Yielding (Spillover Effects) .................................... 34 Figure 5-5: Percentage of Pedestrians Yielding (Spillover Effects) ............................................. 36 Figure 5-6: Percentage of Pedestrians Using Crosswalk When Vehicles are Present (Spillover
Effects) .................................................................................................................................. 38 Figure E-1: Confidence Interval for Change in Percentage of "First Motorists" Yielding (Direct
Testing) ................................................................................................................................. 78 Figure E-2: Confidence Interval for Change in Percentage of Pedestrians Yielding (Direct
Testing) ................................................................................................................................. 79 Figure E-3: Confidence Interval for Change in Percentage of Pedestrians Using Crosswalk When
Vehicles are Present (Direct Testing) ................................................................................... 80 Figure E-4: Confidence Interval for Change in Percentage of "First Motorists" Yielding
(Spillover Effects) ................................................................................................................. 81 Figure E-5: Confidence Interval for Change in Percentage of Pedestrians Yielding (Spillover
Effects) .................................................................................................................................. 82 Figure E-6: Confidence Interval for Change in Percentage of Pedestrians Using Crosswalk When
Vehicles are Present (Spillover Effects) ............................................................................... 83

List of Figures Safety Evaluation of Yield-to-Pedestrian Channelizing Devices
viii

Safety Evaluation of Yield-to-Pedestrian Channelizing Devices Executive Summary
ix
EXECUTIVE SUMMARY
Highway safety is an ongoing challenge throughout the United States, including in Pennsylvania, where more than 1,600 people died in motor vehicle crashes in 2005. Of that number, approximately 10 percent were pedestrians. Highway improvements to address pedestrian safety are difficult because of the cost associated with many potential solutions, along with the geographically dispersed nature of vehicle-pedestrian crashes.
The Pennsylvania Department of Transportation (PennDOT) has adopted a new approach to improving pedestrian safety in recent years through the installation of Yield-to-Pedestrian Channelizing Devices (YTPCD). These devices combine text with commonly accepted symbology to read, “STATE LAW YIELD TO PEDESTRIANS WITHIN CROSSWALK”. YTPCD are placed prior to painted marked crosswalks in the center of the road. It is hoped that these signs, by being in the driver’s immediate field of view, will improve motorist awareness of pedestrians who may be crossing, and prompt them to slow down when pedestrians are present. With PennDOT having made a significant investment in these low-cost devices, it is important to know how effective they are in Pennsylvania, and where they would be most effective.
PennDOT contracted with the Western Transportation Institute to test the effectiveness of YTPCD by examining motorist and pedestrian behavior. This research project examined both direct effects and spillover effects, i.e. how the devices would affect motorists’ behavior at the location where they were deployed as well as at other marked crosswalks in the same community where devices were not deployed. The devices were tested in four types of communities (urban, suburban, small city, and college town), as well as at two types of locations (unsignalized intersections and mid-block crossings). To ensure that permutations of all these factors were considered, testing for direct effects was conducted at three sites and measurement of spillover effects at two sites within each community type, with each testing including both types of crossing locations.
The research team focused on four communities within District 6-0: Manayunk (NW Philadelphia), Haverford Township, Pottstown and West Chester. Data were collected in two periods: “before” data (i.e. no locations had YTPCD) were collected May 4-12, 2006; and “after” data (i.e. direct testing locations had YTPCD) were collected June 12-15, 2006. Motorist and pedestrian behavioral data were collected on weekdays during daylight time, often including part of the peak traffic period. Behavioral data were collected under the supervision of the research team. The data were compiled in a spreadsheet, with various quality control checks to ensure the quality of the data.
To analyze the behavioral data, the research team focused on testing three hypotheses related to YTPCD installation: 1) motorists are more likely to yield to pedestrians; 2) pedestrians are less likely to yield to motorists (i.e. pedestrians are more secure); and 3) pedestrians are more likely

Executive Summary Safety Evaluation of Yield-to-Pedestrian Channelizing Devices
x
to use crosswalks. The research team compared before and after data at the locations where YTPCD were employed looking at overall effects across groups of sites, and then looking at individual sites to see if YTPCD effectiveness was impacted by community type (urban, suburban, small city, college town); location type (intersection or mid-block); or intersection traffic control (all-way stop control, or partial stop control). Similar analyses were conducted for other sites in the same communities to examine the presence of spillover effects. A 90 percent confidence level was used in all these analyses.
In terms of direct effects, i.e. examining behavior at crosswalks before and after YTPCD were deployed at those locations, the analysis showed generally positive and statistically significant effects of the YTPCD. A few findings in support of the previous statement are provided below:
• The likelihood of the first motorist arriving at a crosswalk yielding to a waiting pedestrian increased 30-34 percent at intersections and 17-24 percent at mid-block crosswalks.
• The percentage of pedestrians who yielded to motorists decreased by 11-16 percent at intersections and 8-13 percent at mid-block crossings, suggesting increased pedestrian security when the devices were in place.
• There was a small (1-4 percent) but statistically significant increase in the percentage of pedestrians who used crosswalks, which should also correlate with pedestrian safety.
The YTPCD were generally found more effective at intersections than at mid-block locations, and effects did not seem to exhibit any bias with respect to community type.
In general, the spillover effects seemed to be positive primarily at intersections and on corridors or streets where the YTPCD were installed at nearby crosswalks. The effects of YTPCD at spillover intersections were comparable to those observed at intersections where YTPCD were deployed, while the effects at mid-block crossings were unclear.
The research concluded that the YTPCD have a significant and positive effect on surrogate measures for pedestrian safety, including the motorists’ willingness to yield, pedestrian security, and pedestrian use of crosswalks. To the extent these surrogate measures correlate with vehicle-pedestrian crash rates, YTPCD should reduce the number of vehicle-pedestrian crashes and improve pedestrian safety. The research found that the devices were most effective at intersections but also provided benefits at mid-block crossings. The research recommended that future YTPCD deployments consider the effects of narrow lane widths and the need for regular monitoring and replacement of devices as needed.
The recommendation for continued use of YTPCD is tempered by a couple of caveats. The long-term effectiveness of YTPCD may be different than what was observed in this research. It is unclear whether the devices might produce a false sense of security among pedestrians. A long-term analysis of pedestrian crash data at locations with and without YTPCD would be a better way to measure the ultimate effectiveness of these signs than relying solely on surrogate measures evaluated in this study. Nonetheless, based on the findings of this research, communities should consider deployment of YTPCD at locations where local design conditions and pedestrian safety concerns warrant them.

Safety Evaluation of Yield-to-Pedestrian Channelizing Devices 1 Introduction
1
1. INTRODUCTION
The road system serves a variety of users, including passenger vehicles, commercial vehicles, motorcycles, bicycles, and pedestrians. Because they are not protected by a vehicle frame, pedestrians are more vulnerable in motor vehicle accidents than other roadway users. In Pennsylvania, approximately 10 percent of Pennsylvania’s highway fatalities in 2005 were pedestrians (1, 2).
In an effort to improve pedestrian safety, the Pennsylvania Department of Transportation (PennDOT) has procured Yield-to-Pedestrian Channelizing Devices (YTPCD). These portable signs are mounted on a hard rubber base on the centerline of a road in advance of a marked crosswalk. They serve to remind motorists of Pennsylvania law, which requires that motorists yield to pedestrians who are in the crosswalk.
PennDOT has distributed thousands of YTPCDs for installation by interested communities across the commonwealth. Given the number of devices that have been distributed, it is important to know whether these devices have any positive effects on pedestrian safety. Because pedestrian crashes are geographically dispersed and occur relatively infrequently at a given location, analysis of crash data would be unlikely to yield any useful conclusions. By examining motorist and pedestrian behavior with and without the devices, however, it may be possible to quantify potential safety benefits from these devices.
This report summarizes the findings of a research project, conducted under contract with the Pennsylvania Department of Transportation Bureau of Planning and Research, which sought to examine the safety effects of YTPCD. Chapter 2 provides additional background on pedestrian safety challenges and the design and installation of YTPCD. Chapter 3 reviews the methodology that was employed in this research project, for both data collection and data analysis. Chapter 4 provides anecdotal information on motorist and pedestrian behavior as observed in the field. Quantitative information on motorist and pedestrian behavior is analyzed in Chapter 5 with respect to motorist behavior, pedestrian security, and crosswalk use hypotheses. The report concludes with a summary of findings and recommendations in Chapter 6.
2 Background Safety Evaluation of Yield-to-Pedestrian Channelizing Devices
2
2. BACKGROUND
2.1. Pedestrian Safety Challenges
Highway safety is an ongoing challenge throughout the United States, including in the Commonwealth of Pennsylvania. In 2004, there were 137,410 reportable traffic crashes in Pennsylvania, which resulted in 1,490 fatalities and over 105,000 injuries (3). The economic loss associated with these crashes is in the billions of dollars, aside from the grief and suffering experienced by numerous families and loved ones. Reductions in the number and severity of highway crashes are achieved through addressing the interrelated factors that may contribute to crashes, including characteristics of the driver, the vehicle and the roadway environment. Consequently, efforts to improve highway safety often focus on specific types or groups of crashes.
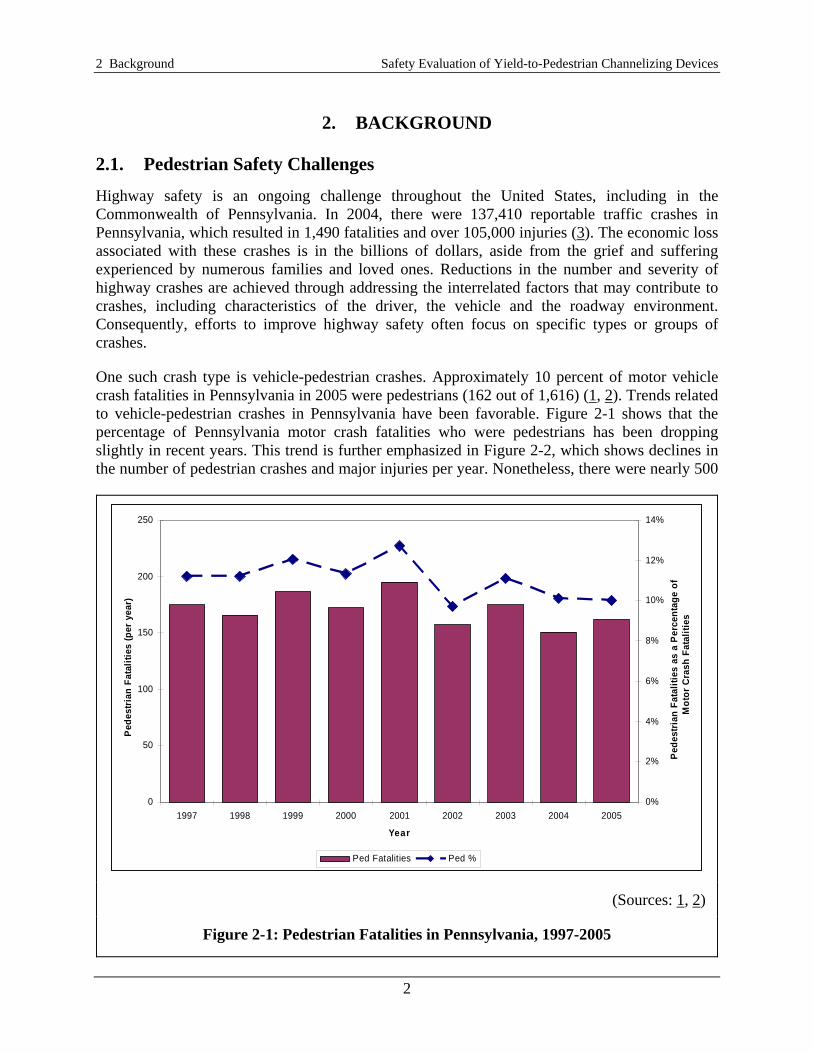
One such crash type is vehicle-pedestrian crashes. Approximately 10 percent of motor vehicle crash fatalities in Pennsylvania in 2005 were pedestrians (162 out of 1,616) (1, 2). Trends related to vehicle-pedestrian crashes in Pennsylvania have been favorable. Figure 2-1 shows that the percentage of Pennsylvania motor crash fatalities who were pedestrians has been dropping slightly in recent years. This trend is further emphasized in Figure 2-2, which shows declines in the number of pedestrian crashes and major injuries per year. Nonetheless, there were nearly 500
0
50
100
150
200
250
1997 1998 1999 2000 2001 2002 2003 2004 2005
Year
Pede
stri
an F
atal
ities
(per
yea
r)
0%
2%
4%
6%
8%
10%
12%
14%
Pede
stria
n Fa
talit
ies
as a
Per
cent
age
of
Mot
or C
rash
Fat
aliti
es
Ped Fatalities Ped %
(Sources: 1, 2)
Figure 2-1: Pedestrian Fatalities in Pennsylvania, 1997-2005

Safety Evaluation of Yield-to-Pedestrian Channelizing Devices 2 Background
3
pedestrians who were killed or severely injured in motor vehicle crashes in Pennsylvania in 2005. Vehicle crashes involving pedestrians are often more severe than other crashes because pedestrians are unprotected and are hence more likely to suffer injuries or death if struck by a motor vehicle.
Highway safety improvements are often classified into engineering, enforcement and education measures. In addressing pedestrian safety, each of these types of improvements has some limitations because of the cost associated with many solutions, along with the geographically dispersed nature of vehicle-pedestrian crashes.
0
1,000
2,000
3,000
4,000
5,000
6,000
7,000
1997 1998 1999 2000 2001 2002 2003 2004 2005
Year
Cras
hes
Invo
lvin
g P
edes
tria
ns (p
er y
ear)
0
100
200
300
400
500
600
Tota
l Maj
or In
juri
es (p
er y
ear)
Crashes Involving Peds Ped Injuries
(Source: 1; no data available for 2002)
Figure 2-2: Pedestrian Crashes and Major Injuries in Pennsylvania, 1997-2005
2 Background Safety Evaluation of Yield-to-Pedestrian Channelizing Devices
4
2.2. Yield-to-Pedestrian Channelizing Devices (YTPCD)
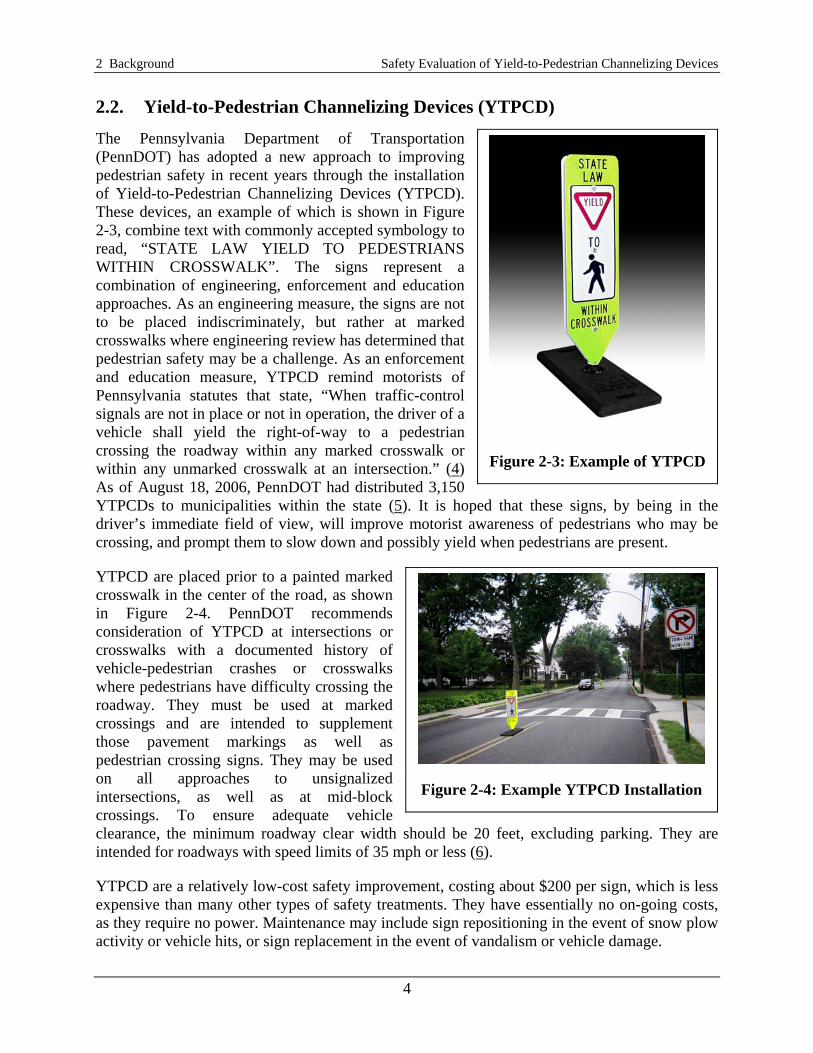
The Pennsylvania Department of Transportation (PennDOT) has adopted a new approach to improving pedestrian safety in recent years through the installation of Yield-to-Pedestrian Channelizing Devices (YTPCD). These devices, an example of which is shown in Figure 2-3, combine text with commonly accepted symbology to read, “STATE LAW YIELD TO PEDESTRIANS WITHIN CROSSWALK”. The signs represent a combination of engineering, enforcement and education approaches. As an engineering measure, the signs are not to be placed indiscriminately, but rather at marked crosswalks where engineering review has determined that pedestrian safety may be a challenge. As an enforcement and education measure, YTPCD remind motorists of Pennsylvania statutes that state, “When traffic-control signals are not in place or not in operation, the driver of a vehicle shall yield the right-of-way to a pedestrian crossing the roadway within any marked crosswalk or within any unmarked crosswalk at an intersection.” (4) As of August 18, 2006, PennDOT had distributed 3,150 YTPCDs to municipalities within the state (5). It is hoped that these signs, by being in the driver’s immediate field of view, will improve motorist awareness of pedestrians who may be crossing, and prompt them to slow down and possibly yield when pedestrians are present.
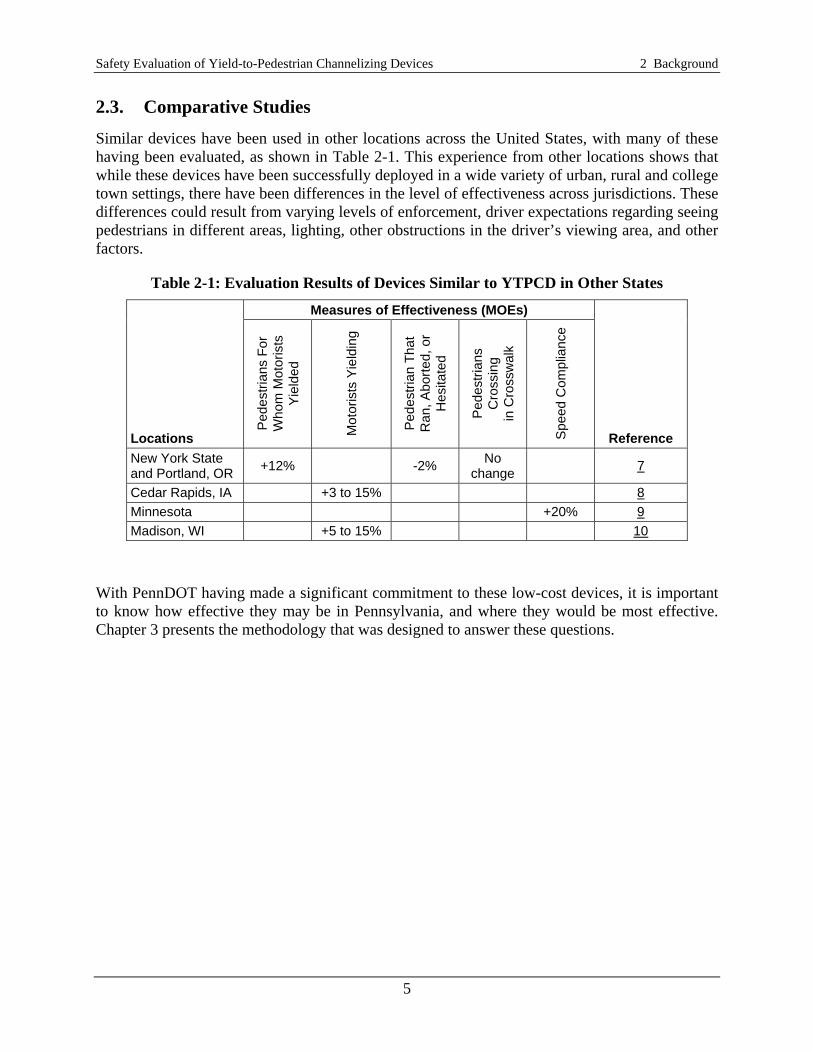
YTPCD are placed prior to a painted marked crosswalk in the center of the road, as shown in Figure 2-4. PennDOT recommends consideration of YTPCD at intersections or crosswalks with a documented history of vehicle-pedestrian crashes or crosswalks where pedestrians have difficulty crossing the roadway. They must be used at marked crossings and are intended to supplement those pavement markings as well as pedestrian crossing signs. They may be used on all approaches to unsignalized intersections, as well as at mid-block crossings. To ensure adequate vehicle clearance, the minimum roadway clear width should be 20 feet, excluding parking. They are intended for roadways with speed limits of 35 mph or less (6).
YTPCD are a relatively low-cost safety improvement, costing about $200 per sign, which is less expensive than many other types of safety treatments. They have essentially no on-going costs, as they require no power. Maintenance may include sign repositioning in the event of snow plow activity or vehicle hits, or sign replacement in the event of vandalism or vehicle damage.
Figure 2-3: Example of YTPCD
Figure 2-4: Example YTPCD Installation
Safety Evaluation of Yield-to-Pedestrian Channelizing Devices 2 Background
5
2.3. Comparative Studies
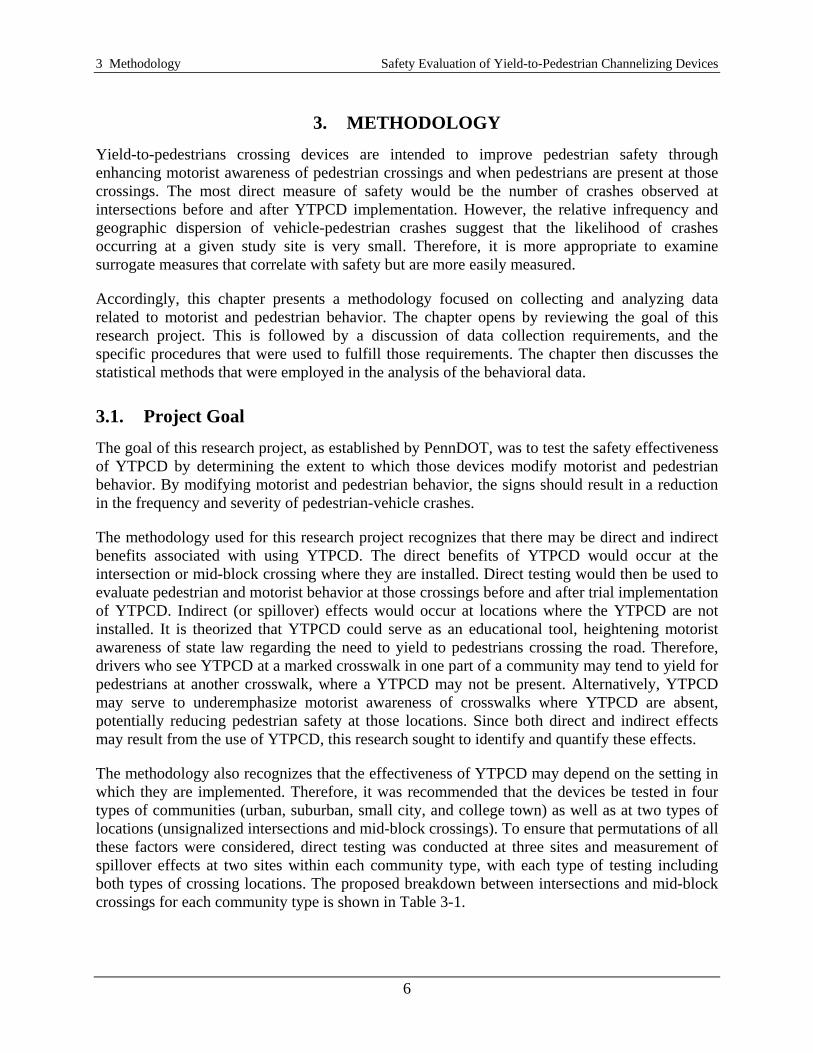
Similar devices have been used in other locations across the United States, with many of these having been evaluated, as shown in Table 2-1. This experience from other locations shows that while these devices have been successfully deployed in a wide variety of urban, rural and college town settings, there have been differences in the level of effectiveness across jurisdictions. These differences could result from varying levels of enforcement, driver expectations regarding seeing pedestrians in different areas, lighting, other obstructions in the driver’s viewing area, and other factors.
Table 2-1: Evaluation Results of Devices Similar to YTPCD in Other States
Measures of Effectiveness (MOEs)
Locations
Ped
estri
ans
For
Who
m M
otor
ists
Y
ield
ed
Mot
oris
ts Y
ield
ing
Ped
estri
an T
hat
Ran
, Abo
rted,
or
Hes
itate
d
Ped
estri
ans
Cro
ssin
g in
Cro
ssw
alk
Spe
ed C
ompl
ianc
e
Reference New York State and Portland, OR +12% -2% No
change 7
Cedar Rapids, IA +3 to 15% 8 Minnesota +20% 9 Madison, WI +5 to 15% 10
With PennDOT having made a significant commitment to these low-cost devices, it is important to know how effective they may be in Pennsylvania, and where they would be most effective. Chapter 3 presents the methodology that was designed to answer these questions.
3 Methodology Safety Evaluation of Yield-to-Pedestrian Channelizing Devices
6
3. METHODOLOGY
Yield-to-pedestrians crossing devices are intended to improve pedestrian safety through enhancing motorist awareness of pedestrian crossings and when pedestrians are present at those crossings. The most direct measure of safety would be the number of crashes observed at intersections before and after YTPCD implementation. However, the relative infrequency and geographic dispersion of vehicle-pedestrian crashes suggest that the likelihood of crashes occurring at a given study site is very small. Therefore, it is more appropriate to examine surrogate measures that correlate with safety but are more easily measured.
Accordingly, this chapter presents a methodology focused on collecting and analyzing data related to motorist and pedestrian behavior. The chapter opens by reviewing the goal of this research project. This is followed by a discussion of data collection requirements, and the specific procedures that were used to fulfill those requirements. The chapter then discusses the statistical methods that were employed in the analysis of the behavioral data.
3.1. Project Goal
The goal of this research project, as established by PennDOT, was to test the safety effectiveness of YTPCD by determining the extent to which those devices modify motorist and pedestrian behavior. By modifying motorist and pedestrian behavior, the signs should result in a reduction in the frequency and severity of pedestrian-vehicle crashes.
The methodology used for this research project recognizes that there may be direct and indirect benefits associated with using YTPCD. The direct benefits of YTPCD would occur at the intersection or mid-block crossing where they are installed. Direct testing would then be used to evaluate pedestrian and motorist behavior at those crossings before and after trial implementation of YTPCD. Indirect (or spillover) effects would occur at locations where the YTPCD are not installed. It is theorized that YTPCD could serve as an educational tool, heightening motorist awareness of state law regarding the need to yield to pedestrians crossing the road. Therefore, drivers who see YTPCD at a marked crosswalk in one part of a community may tend to yield for pedestrians at another crosswalk, where a YTPCD may not be present. Alternatively, YTPCD may serve to underemphasize motorist awareness of crosswalks where YTPCD are absent, potentially reducing pedestrian safety at those locations. Since both direct and indirect effects may result from the use of YTPCD, this research sought to identify and quantify these effects.
The methodology also recognizes that the effectiveness of YTPCD may depend on the setting in which they are implemented. Therefore, it was recommended that the devices be tested in four types of communities (urban, suburban, small city, and college town) as well as at two types of locations (unsignalized intersections and mid-block crossings). To ensure that permutations of all these factors were considered, direct testing was conducted at three sites and measurement of spillover effects at two sites within each community type, with each type of testing including both types of crossing locations. The proposed breakdown between intersections and mid-block crossings for each community type is shown in Table 3-1.

Safety Evaluation of Yield-to-Pedestrian Channelizing Devices 3 Methodology
7
3.2. Data Collection
The first aspect of this research project’s methodology was developing a framework for collecting data. This included site selection, scheduling of data collection, developing a process for recording motorist and pedestrian behavior, and training data collectors. Each of these is discussed in turn.
3.2.1. Site Selection
The technical panel selected District 6-0 (southeastern Pennsylvania) as the focus for this research project, as the district has received and fulfilled requests for the devices from numerous communities. District personnel reviewed the list of communities that had expressed interest in the signs but had not deployed any as of April 2006. Field visits were conducted to each of these communities to see whether there were a sufficient number of locations at both unsignalized intersections and mid-block crossings for this study where the devices could be deployed based on geometric and design characteristics. These characteristics included the presence of a marked crosswalk, a posted speed limit not exceeding 35 mph, a yellow painted centerline on the roadway, sufficient roadway width to safely place the sign, and an expectation of sufficient pedestrian traffic levels based on an assessment of adjacent land uses. As a result of this study, four communities were selected:
• Manayunk (NW Philadelphia) – Urban • Haverford Township – Suburban • Pottstown – Small City • West Chester – College Town
Once communities were selected, sites within each community were identified. Local officials in Haverford Township and West Chester had previously identified locations where they thought the devices would be suitable and beneficial. Staff from PennDOT and the research team field reviewed these sites and confirmed that they were appropriate. In Pottstown, PennDOT and research team personnel conducted a field visit, which identified several candidate sites. Subsequent communication with the local police suggested a couple of additional sites, which were also field reviewed. In Manayunk, a full set of sites was identified based on an initial field review. Based on a subsequent field visit, alternate intersections were identified where significantly higher pedestrian volumes could be expected.
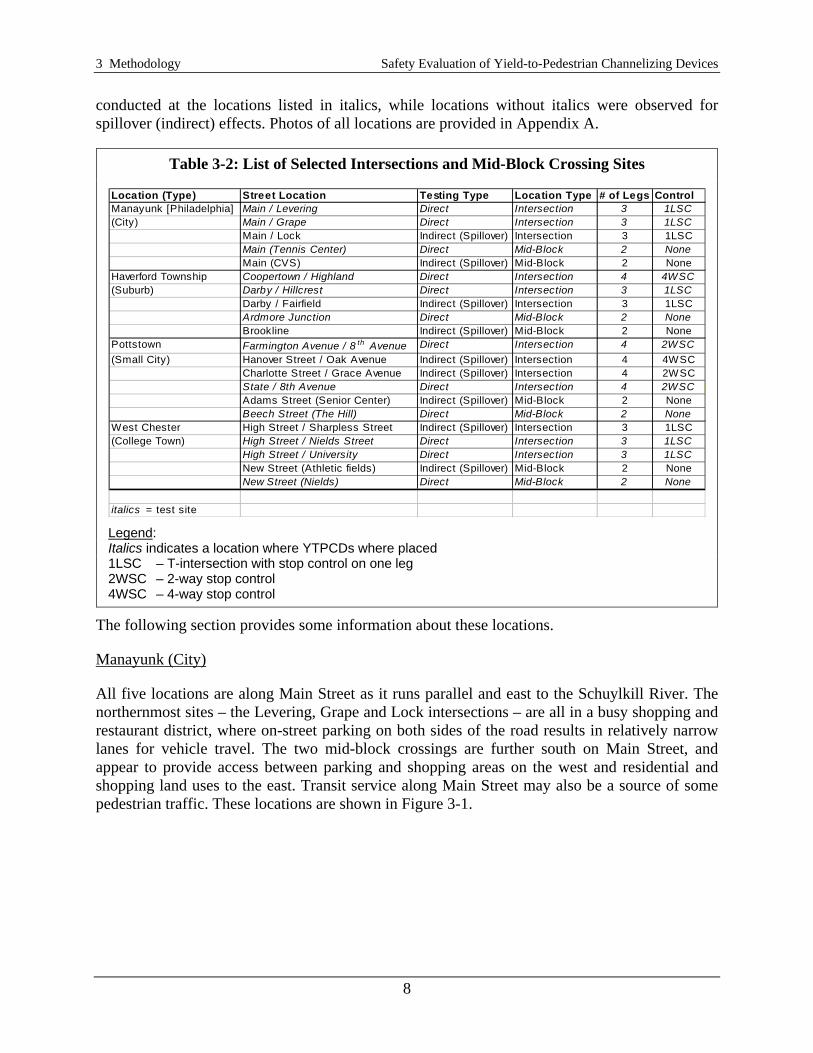
Table 3-2 lists the sites that were selected in each of the four communities. The traffic control of each location is also noted, as this may affect vehicle and pedestrian behavior. Direct testing was
Table 3-1: Number of Tested Locations in Ecah Community Type
Intersections Mid-BlockDirect Testing
With YTPCDSpillover Effect
Without YTPCD
2 1
1 1
3 Methodology Safety Evaluation of Yield-to-Pedestrian Channelizing Devices
8
conducted at the locations listed in italics, while locations without italics were observed for spillover (indirect) effects. Photos of all locations are provided in Appendix A.
The following section provides some information about these locations.
Manayunk (City)
All five locations are along Main Street as it runs parallel and east to the Schuylkill River. The northernmost sites – the Levering, Grape and Lock intersections – are all in a busy shopping and restaurant district, where on-street parking on both sides of the road results in relatively narrow lanes for vehicle travel. The two mid-block crossings are further south on Main Street, and appear to provide access between parking and shopping areas on the west and residential and shopping land uses to the east. Transit service along Main Street may also be a source of some pedestrian traffic. These locations are shown in Figure 3-1.
Table 3-2: List of Selected Intersections and Mid-Block Crossing Sites
Location (Type) Street Location Testing Type Location Type # of Legs ControlManayunk [Philadelphia] Main / Levering Direct Intersection 3 1LSC(City) Main / Grape Direct Intersection 3 1LSC
Main / Lock Indirect (Spillover) Intersection 3 1LSCMain (Tennis Center) Direct Mid-Block 2 NoneMain (CVS) Indirect (Spillover) Mid-Block 2 None
Haverford Township Coopertown / Highland Direct Intersection 4 4WSC(Suburb) Darby / Hillcrest Direct Intersection 3 1LSC
Darby / Fairfield Indirect (Spillover) Intersection 3 1LSCArdmore Junction Direct Mid-Block 2 NoneBrookline Indirect (Spillover) Mid-Block 2 None
Pottstown Farmington Avenue / 8 th Avenue Direct Intersection 4 2WSC(Small City) Hanover Street / Oak Avenue Indirect (Spillover) Intersection 4 4WSC
Charlotte Street / Grace Avenue Indirect (Spillover) Intersection 4 2WSCState / 8th Avenue Direct Intersection 4 2WSCAdams Street (Senior Center) Indirect (Spillover) Mid-Block 2 NoneBeech Street (The Hill) Direct Mid-Block 2 None
West Chester High Street / Sharpless Street Indirect (Spillover) Intersection 3 1LSC(College Town) High Street / Nields Street Direct Intersection 3 1LSC
High Street / University Direct Intersection 3 1LSCNew Street (Athletic fields) Indirect (Spillover) Mid-Block 2 NoneNew Street (Nields) Direct Mid-Block 2 None
italics = test site Legend: Italics indicates a location where YTPCDs where placed 1LSC – T-intersection with stop control on one leg 2WSC – 2-way stop control 4WSC – 4-way stop control

Safety Evaluation of Yield-to-Pedestrian Channelizing Devices 3 Methodology
9
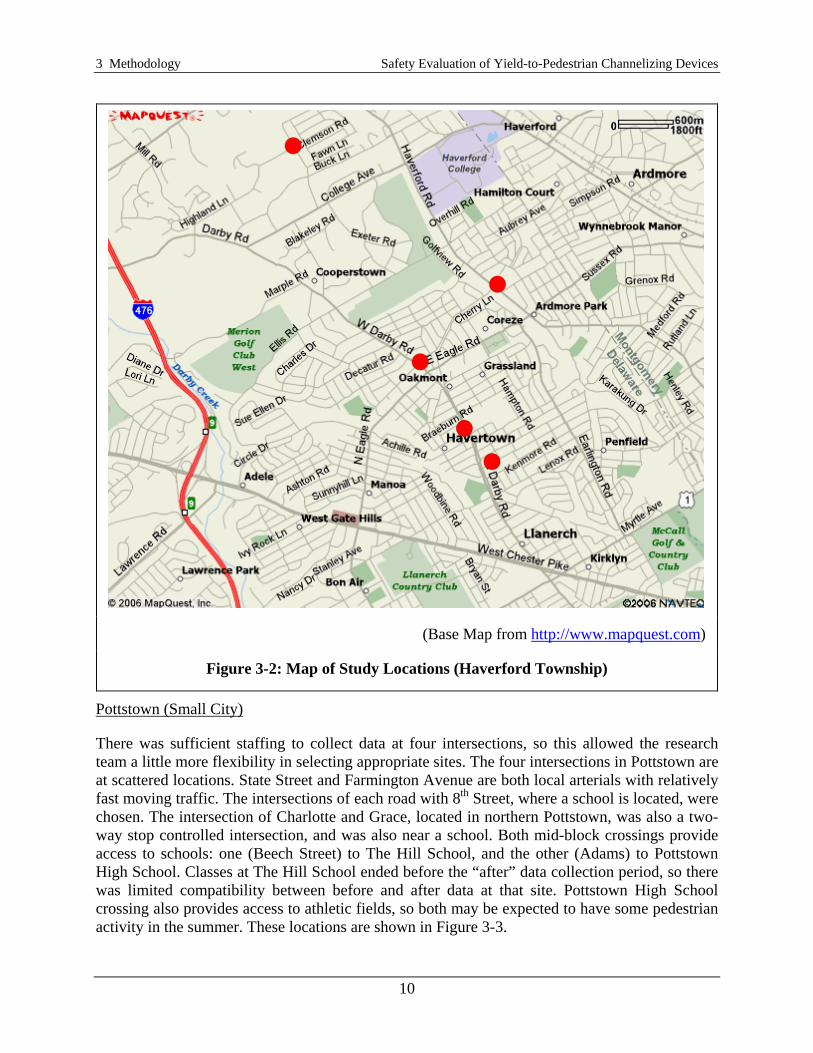
Haverford Township (Suburb)
The suburban locations have several differing characteristics. All three intersections are near schools. However, the Coopertown/Highland intersection is an all-way stop controlled intersection in an area with relatively low vehicle traffic, whereas the other two intersections – T-intersections on Darby Road – have higher traffic volumes, especially during rush hour. The intersection at Fairfield is particularly interesting because the crosswalk crosses a four-lane divided roadway; hence, pedestrians do not need to cross the entire street at once. The mid-block crosswalks are located near a SEPTA transit stop and a shopping district (Brookline). The Brookline location is interesting, because it is approximately 0.5 miles away from an existing YTPCD on the same street. These locations are shown in Figure 3-2.
(Base Map from http://www.mapquest.com)
Figure 3-1: Map of Study Locations (Philadelphia/Manayunk)
3 Methodology Safety Evaluation of Yield-to-Pedestrian Channelizing Devices
10
Pottstown (Small City)
There was sufficient staffing to collect data at four intersections, so this allowed the research team a little more flexibility in selecting appropriate sites. The four intersections in Pottstown are at scattered locations. State Street and Farmington Avenue are both local arterials with relatively fast moving traffic. The intersections of each road with 8th Street, where a school is located, were chosen. The intersection of Charlotte and Grace, located in northern Pottstown, was also a two-way stop controlled intersection, and was also near a school. Both mid-block crossings provide access to schools: one (Beech Street) to The Hill School, and the other (Adams) to Pottstown High School. Classes at The Hill School ended before the “after” data collection period, so there was limited compatibility between before and after data at that site. Pottstown High School crossing also provides access to athletic fields, so both may be expected to have some pedestrian activity in the summer. These locations are shown in Figure 3-3.
(Base Map from http://www.mapquest.com)
Figure 3-2: Map of Study Locations (Haverford Township)
Safety Evaluation of Yield-to-Pedestrian Channelizing Devices 3 Methodology
11
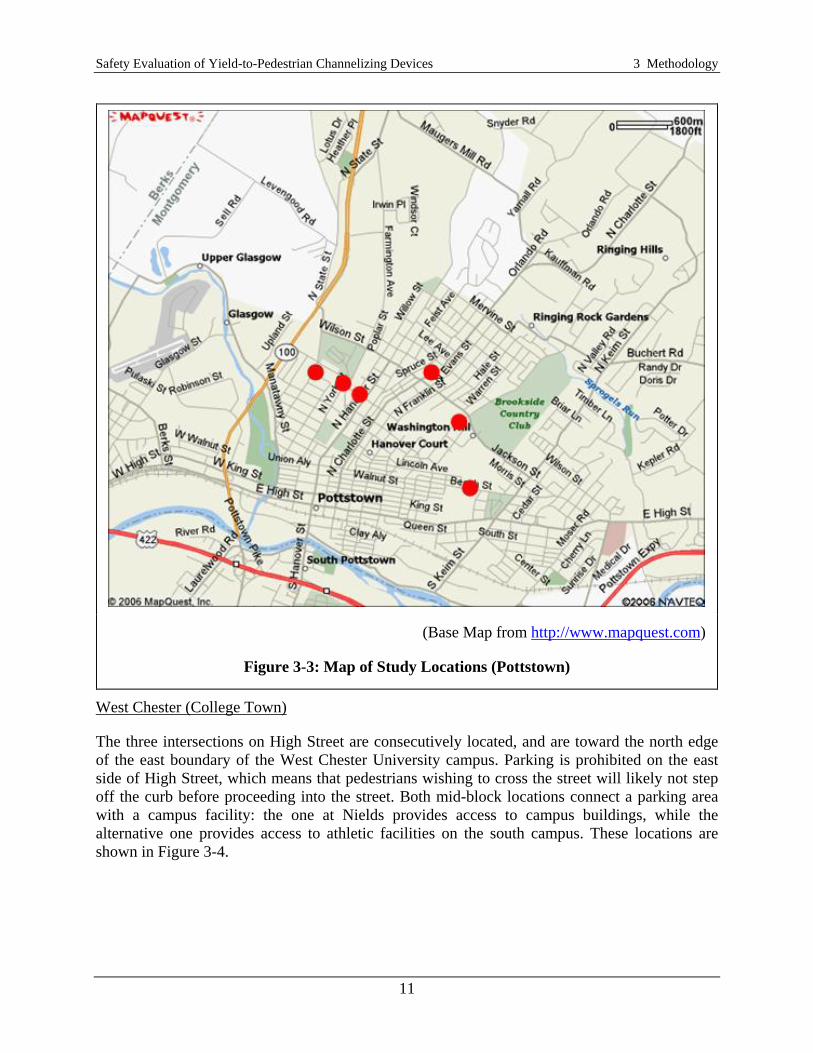
West Chester (College Town)
The three intersections on High Street are consecutively located, and are toward the north edge of the east boundary of the West Chester University campus. Parking is prohibited on the east side of High Street, which means that pedestrians wishing to cross the street will likely not step off the curb before proceeding into the street. Both mid-block locations connect a parking area with a campus facility: the one at Nields provides access to campus buildings, while the alternative one provides access to athletic facilities on the south campus. These locations are shown in Figure 3-4.
(Base Map from http://www.mapquest.com)
Figure 3-3: Map of Study Locations (Pottstown)

3 Methodology Safety Evaluation of Yield-to-Pedestrian Channelizing Devices
12
3.2.2. Data Collection Schedule
Times and dates for data collection were selected to maximize potential pedestrian traffic volumes, while working within staffing and schedule constraints. The “before” data collection period occurred May 4-12, 2006; the second phase of the data collection was completed June 12-15, 2006. The research team wanted to allow one month between data collection periods so that motorists could have some level of familiarity with the YTPCD. The signs were distributed and installed by PennDOT staff over the week of May 16-20, 2006. It was not desirable to delay “after” data collection any later into June, because schools would not be in session, and pedestrian crossings near schools were generally considered the greatest safety concern.
Motorist and pedestrian behavioral data were collected on weekdays during daylight time, often including part of the peak traffic period. In the absence of pedestrian volume data at any of the
(Base Map from http://www.mapquest.com)
Figure 3-4: Map of Study Locations (West Chester)

Safety Evaluation of Yield-to-Pedestrian Channelizing Devices 3 Methodology
13
study locations, researchers estimated that three to four hours of data collection would be required at each site in order to obtain a sufficient sample size. In general, data were collected at the same time of day for a given location in each period. Within staffing constraints, the research team sought to collect before and after data during the same time of day, in order to minimize any effects caused by differences in motorist and pedestrian characteristics at different times of the day. As can be seen in Table 3-3, the same time periods were generally used in both data collection periods.
Since no pedestrian crossings were observed at New Street (Athletic fields) during the “before” data collection period, data were not collected at this site during the “after” period. (Anecdotal observation suggests that there were no pedestrian crossings during the “after” period, either.)
Table 3-3: Data Collection Schedule
Hou
rs
3.54
3.54
3.543444444444444444
3.54
3.54
3.544
No pedestrians observed in "before" period 04444
3.54444444
BeforeAfter
After: June 14, 2006
After: June 15, 2006
West Chester
Before: May 11, 2006
After: June 13, 2006
Before: May 4, 2006
After: June 12, 2006
Manayunk [Phila.]
Before: May 10, 2006
7:00
AM
8:00
AM
9:00
AM
10:0
0 AM
11:0
0 AM
12:0
0 PM
1:00
PM
2:00
PM
3:00
PM
4:00
PM
5:00
PM
6:00
PM
9:00
PM
7:00
PM
8:00
PM
Farmington Avenue / 8th Avenue
Hanover Street / Oak Avenue
Charlotte Street / Grace Avenue
State Street / 8th Avenue
Adams Street (Senior Center)
Beech Street (The Hill)
Main / Levering
Main / Grape
Main / Lock
Main (Tennis Center)
Main (CVS)
High Street / Sharpless Street
High Street / Nields Street
High Street / University
New Street (Athletic fields)
New Street (Nields)
Pottstown
Brookline
Coopertown / Highland
Darby / Hillcrest
Darby / Fairfield
Ardmore Junction
Haverford Township
Before: May 12, 2006

3 Methodology Safety Evaluation of Yield-to-Pedestrian Channelizing Devices
14
3.2.3. Recording Behavioral Data
Because behavioral data were to be used to support this research, it was necessary to develop a data collection tool that could reliably record behavioral data for later analysis. Behavioral data were to be collected to quantify a group of measures of effectiveness which can be used, individually or in combination, to test hypotheses related to pedestrian safety. These measures include:
1. Crossings completed within the crosswalk with no approaching motorists 2. Crossings within 50 feet of the crosswalk with no approaching motorists 3. Percentage of pedestrians who yielded to motorists when crossing within 50 feet of the
crosswalk 4. Percentage of motorists who yielded to pedestrians when crossing within 50 feet of the
crosswalk 5. Crossings initiated while a motorist approached the crosswalk 6. Crossings in which the first approaching motorist yielded to pedestrians 7. Crossings in which other than the first approaching motorist yielded to pedestrians 8. Crossings in which no approaching motorists yielded to pedestrians 9. Approaching pedestrians who yielded to motorists 10. Approaching motorists who yielded to pedestrians 11. Total number of approaching motorists 12. Percentage of motorists yielding to pedestrians 13. Distribution of number of vehicles passing before yielding to pedestrian
To preserve maximum precision in the recorded data, the research team viewed pedestrian crossings as a series of events, as depicted in Figure 3-5. Data collectors were then to use data sheets developed by the team, as shown in Figure 3-6, to record this information. (A blank form is included as Appendix B.)

Safety Evaluation of Yield-to-Pedestrian Channelizing Devices 3 Methodology
15
No
Pedestrian StepsOff Curb
Is VehicleApproaching?
IsPedestrian Still
Off Curb?
No
Yes
Does VehicleYield?
DoesPedestrian
Yield?
Yes
No
No
PedestrianArrives
PedestrianCrosses
PedestrianFails to Cross
AB
C D
E F
G
Record infoabout
Pedestrian
Record“None”
No
RecordPedestrian
Yields;“Abort”
YesRecordMotoristYields
Yes
RecordPedestrian
Yields
No
RecordPedestrianDoes Not
Yield
DoesPedestrian
Yield?
Yes
Record PedYields;
IncreaseVehicles by
One
No
Record PedDoes Not
Yield;“Hesitate” or
“Run”
H
H
Is VehicleApproaching?
Yes
PedestrianCrosses
D
RecordMotorist
Does NotYield
No
No
C
Figure 3-5: Pedestrian Crossing Flow Chart
(1) (2) (3) (4) (5) (6) (7) (8) (9) (10)
Pedestrian Vehicle Yielding Special NotesNumber
1st Add
1 None Y N Y N H R A+1 None Y N Y N H R A
2 None Y N Y N H R A1 None Y N Y N H R A1 None Y N Y N H R A B1 None Y N Y N H R A1 OUT None Y N Y N H R A
VehicleYield?
Bad Crossing
Veh Type
Crossing Direction
Not in X-Walk Vehicle Direction
Ped Yield?
43
Figure 3-6: Sample Data Collection Form
3 Methodology Safety Evaluation of Yield-to-Pedestrian Channelizing Devices
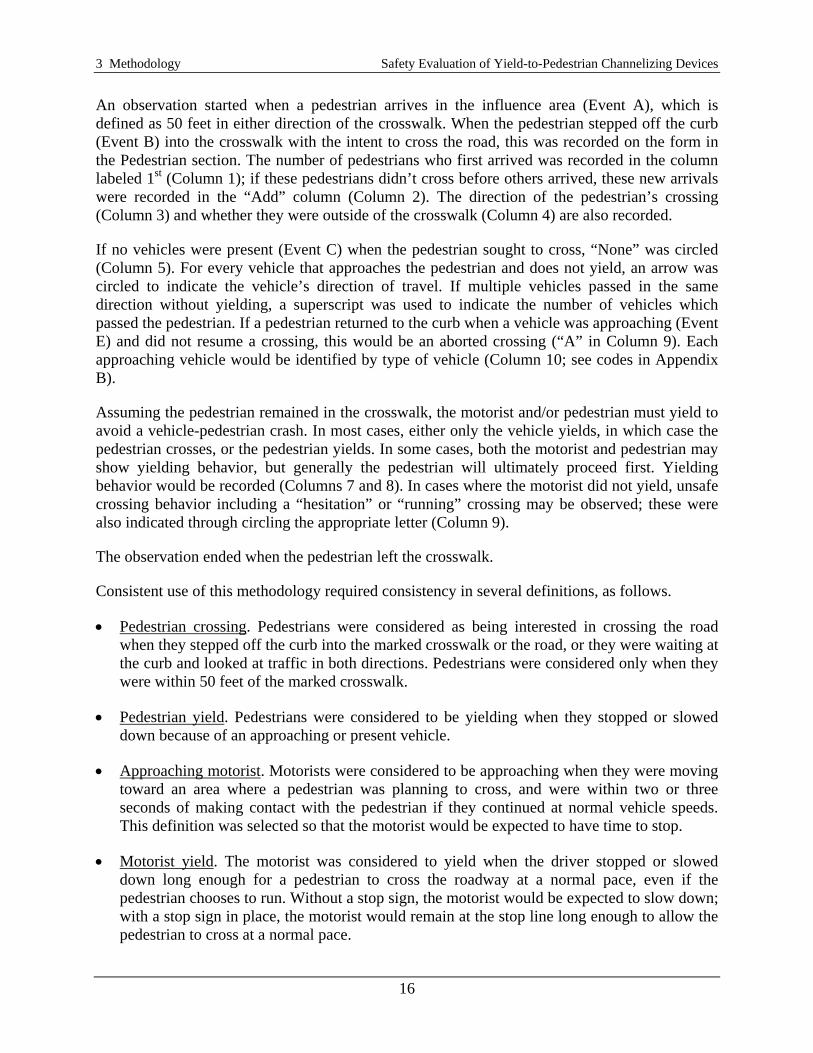
16
An observation started when a pedestrian arrives in the influence area (Event A), which is defined as 50 feet in either direction of the crosswalk. When the pedestrian stepped off the curb (Event B) into the crosswalk with the intent to cross the road, this was recorded on the form in the Pedestrian section. The number of pedestrians who first arrived was recorded in the column labeled 1st (Column 1); if these pedestrians didn’t cross before others arrived, these new arrivals were recorded in the “Add” column (Column 2). The direction of the pedestrian’s crossing (Column 3) and whether they were outside of the crosswalk (Column 4) are also recorded.
If no vehicles were present (Event C) when the pedestrian sought to cross, “None” was circled (Column 5). For every vehicle that approaches the pedestrian and does not yield, an arrow was circled to indicate the vehicle’s direction of travel. If multiple vehicles passed in the same direction without yielding, a superscript was used to indicate the number of vehicles which passed the pedestrian. If a pedestrian returned to the curb when a vehicle was approaching (Event E) and did not resume a crossing, this would be an aborted crossing (“A” in Column 9). Each approaching vehicle would be identified by type of vehicle (Column 10; see codes in Appendix B).
Assuming the pedestrian remained in the crosswalk, the motorist and/or pedestrian must yield to avoid a vehicle-pedestrian crash. In most cases, either only the vehicle yields, in which case the pedestrian crosses, or the pedestrian yields. In some cases, both the motorist and pedestrian may show yielding behavior, but generally the pedestrian will ultimately proceed first. Yielding behavior would be recorded (Columns 7 and 8). In cases where the motorist did not yield, unsafe crossing behavior including a “hesitation” or “running” crossing may be observed; these were also indicated through circling the appropriate letter (Column 9).
The observation ended when the pedestrian left the crosswalk.
Consistent use of this methodology required consistency in several definitions, as follows.
• Pedestrian crossing. Pedestrians were considered as being interested in crossing the road when they stepped off the curb into the marked crosswalk or the road, or they were waiting at the curb and looked at traffic in both directions. Pedestrians were considered only when they were within 50 feet of the marked crosswalk.
• Pedestrian yield. Pedestrians were considered to be yielding when they stopped or slowed down because of an approaching or present vehicle.
• Approaching motorist. Motorists were considered to be approaching when they were moving toward an area where a pedestrian was planning to cross, and were within two or three seconds of making contact with the pedestrian if they continued at normal vehicle speeds. This definition was selected so that the motorist would be expected to have time to stop.
• Motorist yield. The motorist was considered to yield when the driver stopped or slowed down long enough for a pedestrian to cross the roadway at a normal pace, even if the pedestrian chooses to run. Without a stop sign, the motorist would be expected to slow down; with a stop sign in place, the motorist would remain at the stop line long enough to allow the pedestrian to cross at a normal pace.

Safety Evaluation of Yield-to-Pedestrian Channelizing Devices 3 Methodology
17
3.2.4. Selection and Training of Data Collectors
The research team contracted with a temporary employment firm to provide data collectors to assist in this research. These temporary employees were supplemented with a student employee from Widener University. Because there may be some interpretation involved in completing the observation forms, it was important to have appropriate training to ensure consistency across observers (i.e. interrater reliability), and therefore assure the validity of the results.
Therefore, all data collectors completed a training session led by research team staff. This training session included a PowerPoint presentation that provided an overview of the project, discussed data collector responsibilities, and reviewed how to use the data collection form. The presentation used for this “after” training, similar to the one used for the “before” training, is provided in Appendix C1. Following this presentation, the data collectors reviewed video clips of pedestrian crossings from a mid-block location in Bozeman, Montana. The research team worked with the data collectors individually and collectively to ensure consistency in how observations were recorded.
3.2.5. Data Tabulation and Quality Control
To promote rapid analysis of the behavioral data, a spreadsheet was set up with extensive logic checks. The spreadsheet was created to record each pedestrian crossing as an event. There were coding challenges because many of the measures of effectiveness described earlier (page 14) involve assessing the overall behavior at a given crossing for each pedestrian and each motorist. Accurate tabulation of the data required being able to document separately the sequence of events for each individual pedestrian and for each individual motorist. Several checks were used to ensure that the tabulation was an accurate reflection of the data.
It was necessary to verify the quality of the data before any analysis was performed using the data. In entering the data into a spreadsheet, there were inconsistencies observed in the data which were corrected through algorithms and logic. First, observers generally recorded the interactions between vehicle and pedestrian traffic at all marked crossings at a given location. However, for many intersections, it would not make sense to install YTPCD on all approaches to a crosswalk (for example, at a two-way stop-controlled intersection). Therefore, data were filtered to include only the observations from the legs of the intersections that had the YTPCD sign installed. In addition, observers were asked to record the behavior of all vehicles at a location whenever a pedestrian was either crossing or waiting to cross. In some cases, they recorded the behavior of a vehicle that was not going to have a conflict with a pedestrian (i.e. they were traveling the same direction through an intersection). These observations were also filtered out.
There were some inconsistencies that could not be easily remedied. For example, some data collectors did not record all vehicles that passed by a waiting pedestrian, but only the first one. There were also differences across data collectors in interpreting vehicle and pedestrian yielding
1 The “after” presentation included in Appendix B reflects the newer data collection form, and is also a little longer to proactively address some issues that arose during the “before” data collection period.
3 Methodology Safety Evaluation of Yield-to-Pedestrian Channelizing Devices
18
behavior. Since very few locations had identical data collectors during the before and after periods, it is possible that variations in interpretation of yielding behavior could affect the data.
3.3. Analysis
The measures of effectiveness discussed in the last section provide data elements that may be used to assess the safety benefits of the YTPCD, but in themselves are often difficult to interpret. Moreover, concerns related to data quality control and sample size, also mentioned in the previous section, increase doubt as to the statistical validity of analyses of individual MOEs for individual sites.
Because of the impact of these factors, the research team adopted a conservative evaluation approach, focusing on a couple of testable hypotheses where the supporting data was believed to be consistent and reliable, in locations where sample sizes were larger. This section reviews the hypotheses that were employed, hypothesis testing methods, and the procedures that were used for evaluating YTPCD effects at both experimental and spillover sites.
3.3.1. Hypotheses
The most common measure of effectiveness for evaluating the safety benefit of a transportation system improvement is crash rate. Because of the relative infrequency of vehicle-pedestrian collisions at a given location over a short period of time – none were observed at any of the locations during either data collection period – this research project used surrogate safety measures as opposed to actual crash experience to measure the safety effect of the YTPCD.
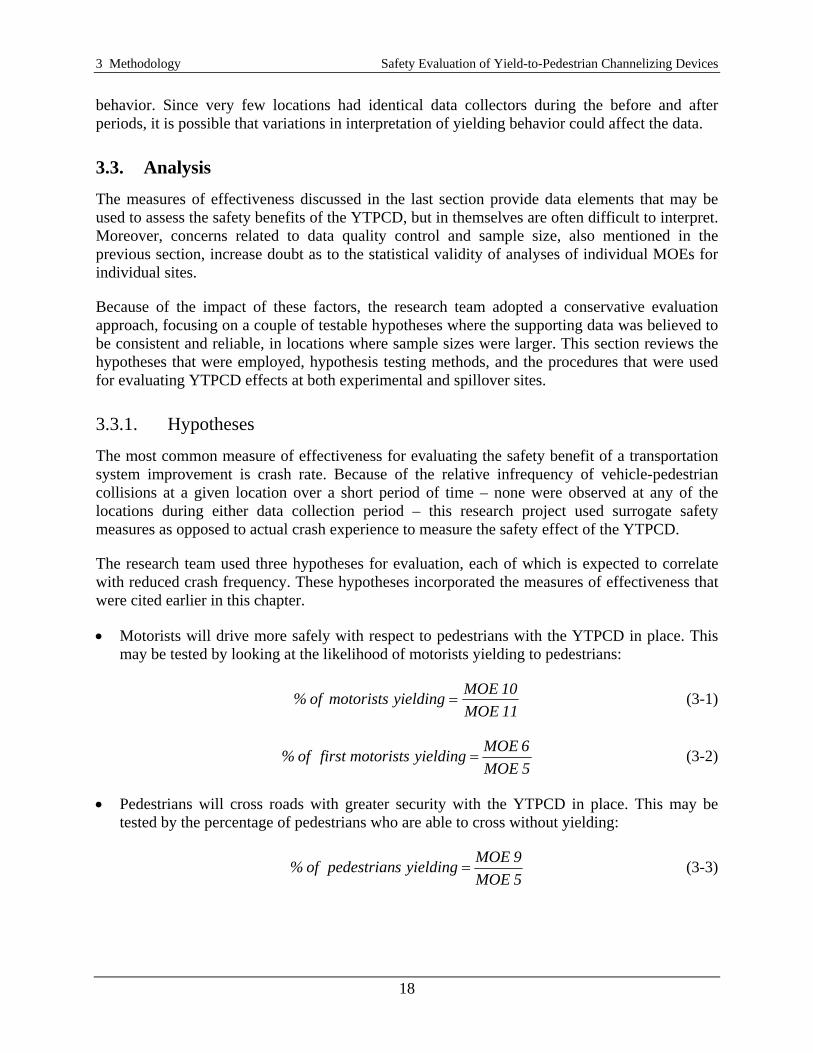
The research team used three hypotheses for evaluation, each of which is expected to correlate with reduced crash frequency. These hypotheses incorporated the measures of effectiveness that were cited earlier in this chapter.
• Motorists will drive more safely with respect to pedestrians with the YTPCD in place. This may be tested by looking at the likelihood of motorists yielding to pedestrians:
11 MOE10 MOE yielding motorists of % = (3-1)
5 MOE6 MOE yielding motorists first of % = (3-2)
• Pedestrians will cross roads with greater security with the YTPCD in place. This may be tested by the percentage of pedestrians who are able to cross without yielding:
5 MOE9 MOE yielding spedestrian of % = (3-3)

Safety Evaluation of Yield-to-Pedestrian Channelizing Devices 3 Methodology
19
• More pedestrians use marked crosswalks to cross the road, as opposed to crossing outside of the crosswalk. This may be tested by examining the percentage of pedestrians using crosswalks both when vehicles are present and when they are absent.
absent) (vehicles 2 MOEabsent) (vehicles 1 MOE absent) (vehicles crosswalk using spedestrian of % = (3-4)
present) (vehicles 2 MOEpresent) (vehicles 1 MOE present) (vehicles crosswalk using spedestrian of % = (3-5)
2 MOE1 MOE crosswalk using spedestrian of % = (3-6)
3.3.2. Hypothesis Testing and Statistical Significance
The hypotheses were evaluated using tests of statistical significance. Hypothesis testing cannot be used as a method of proof but as a test of probability. In other words, hypothesis testing cannot verify with certainty that the YTPCD have a positive safety effect, but it can be used to indicate a low likelihood that the changes in observed behavior are a result of chance.
For this project, all hypotheses involve the testing of two samples; therefore, the research team used a z-test in this analysis, a test which is used to compare percentages in two samples. The test statistic is calculated as follows:
⎟⎟⎠
⎞⎜⎜⎝
⎛+
−=
21
21
11ˆˆ
ˆˆ
nnqp
ppz (3-7)
where z = test statistic 1p̂ = percentage of motorists yielding to pedestrians before YTPCD 2p̂ = percentage of motorists yielding to pedestrians after YTPCD
p̂ = weighted average of percentages = 221
21
21
1 ˆˆ pnn
npnn
n+
++
q̂ = 1 – p̂ 1n = number of observations (before period) 2n = number of observations (after period)
The calculated z-test statistic is compared to critical values in the normal distribution. For determining the critical value, the research team assumed a 90 percent level of statistical significance.

3 Methodology Safety Evaluation of Yield-to-Pedestrian Channelizing Devices
20
3.3.3. Confidence Intervals
In addition to testing hypotheses, the research team used confidence intervals to quantify the estimated effects of the YTPCD on the various behavioral measures discussed earlier. The equation that was used for this is:
( ) ( ) ( )2
22
1
112/21
ˆ1ˆˆ1ˆˆˆ
npp
npp
Zpp−
+−
±− α (3-8)
For a 90 percent level of confidence (α = 0.10), 2/αZ = .520.
3.3.4. Experimental Locations
The research team focused first on examining whether the YTPCD’s effects agreed with the earlier stated hypotheses. To examine this question, the research team compared before and after data at the locations where YTPCD were employed. A one-tailed z-test was used for direct testing because the goal was to see whether there was an improvement according to any of the hypotheses, as opposed to simply a statistically significant change. The research team first examined these overall effects. Then, since there are numerous factors which could affect the observed motorist and pedestrian results at any location, these were examined next. These factors include community type (urban, suburban, small city, college town); location type (intersection or mid-block); intersection traffic control (all-way stop control, or partial stop control); and whether behavior was observed at day or night2.
3.3.5. Spillover Effects
After the effects of the devices at experimental locations were explored, the research team then analyzed any spillover effects of these devices on selected locations in the same communities without YTPCD sign deployment. The research team sought to examine whether there was a meaningful before-after relationship at these locations.
It is important to note that spillover effects could work for or against pedestrian safety. There is the possibility that the devices will heighten motorist awareness when approaching crosswalks in general, so that one would observe improved pedestrian safety even at locations without the signs. There is also the opposite possibility that the devices may tend to concentrate motorist attention on the locations where they are deployed, and motorists exercise less caution at other marked crosswalks. For this reason, a two-tailed z-test was used. Using a two-tailed test can determine whether there was a statistically significant difference before and after implementation of YTPCD. Additional analysis can then determine whether the spillover effect was positive or negative toward pedestrian safety.
2 Day and night observations were not collected at all locations, so these are provided in tables with minimal comment.

Safety Evaluation of Yield-to-Pedestrian Channelizing Devices 4 Summary of Observations
21
4. SUMMARY OF OBSERVATIONS
The observed field data were entered into a spreadsheet and summarized according to the measures of effectiveness and hypotheses presented in Chapter 3. These are provided in Appendix D, and are organized by hypothesis (motorist behavior, pedestrian security, and use of crosswalks).
4.1. General Observations
Prior to presenting the results of the observational analysis, a few general observations may be made. First, some of the study sites did not have as many pedestrian crossings or pedestrian-vehicle conflicts as anticipated. In some cases, this may be because the peak pedestrian traffic period did not fall within the four-hour observation period during the day of observation. The current peak usage hours are site-specific and pedestrian count information for the selected locations was not available. In other cases, the sites likely do not have a large volume of pedestrian traffic.
Regarding the likelihood of vehicles to yield to pedestrians, the research team noted that drivers were more likely to yield to larger groups of waiting pedestrians compared to one waiting pedestrian. If the first motorist did not yield for a pedestrian, it was very unlikely that any subsequent motorist would yield to the pedestrian. Vehicles were also less likely to yield during the evening than during the day.
It was observed that, in over 95 percent of pedestrian crossings where a vehicle was approaching, either the first arriving motorist yielded to the pedestrian, or no motorists yielded so the pedestrian had to wait until all cars had passed. This was consistent in both data collection periods.
A significant number of pedestrians crossed outside the crosswalk in order to be closer to the entrance door of their destination. This does not explain all crossings outside of the crosswalk, however. Some pedestrians were observed to wait to cross outside the crosswalk, even while several vehicles went by during which time they could have walked to the crosswalk. This was observed during both “before” and “after” data collection periods.
Some sites had crossing guards during a few hours of the day to help pedestrians cross the road. The research team used considerable discretion in determining the locations at which the crossing guards might have influenced motorist behavior. In some cases, a crossing guard would wait until there was a sufficient gap in the traffic stream and would then walk into the roadway. In these cases, the pedestrian would likely have safely crossed the road at the same time without the crossing guard. In other cases, the crossing guard would step out into traffic in a manner that a pedestrian would not normally do. In these cases, the observation was not included in the data set.
The data collection occurred during essentially ideal conditions. The weather conditions were sunny or overcast during the times of data collection. There was no rain or other adverse weather conditions during the data collection periods, with the exception of an evening data collection

4 Summary of Observations Safety Evaluation of Yield-to-Pedestrian Channelizing Devices
22
period in West Chester. Moreover, there was nothing atypical observed about the demographics of the pedestrians, or in the composition of vehicle traffic. One location – the Beech Street mid-block crossing in Pottstown – experienced significantly less traffic in the “after” period because classes at the adjacent private school had ended the preceding week.
As was mentioned earlier, the signs were intended to be in position for approximately one month before “after” data were collected. This would allow local motorists to have some acclimation to the signs, reducing bias on motorist behavior changes that may simply result from the novelty of the signs. However, this period of acclimation was not maintained at all sites. YTPCD signs at locations in Manayunk, Pottstown and West Chester communities were moved to the side of the streets or to different locations, and in some cases were absent altogether. Some of the signs which were in place had suffered obvious vehicle damage, as shown in Figure 4-1. It is not clear how this would affect the results of this study. However, it does bring attention to the need for communities to regularly monitor and, if necessary, replace signs.
4.2. Site-Specific Observations
The rest of this chapter offers some general observations from sites in the various communities.
4.2.1. Manayunk
The three intersections where behavior was observed were all three-way intersections and one-way-stop controlled. All three of these intersections had high pedestrian traffic volumes. The northernmost intersections – Levering and Grape – have on-street parking, which leaves the traveling lane width at less than 12 ft. The data collection team observed that larger commercial vehicles (e.g. delivery trucks) and transit vehicles rubbed against the signs and in some instances dragged them along the road. The YTPCD signs were also manually moved to the side of the road, and in one case the signs were moved to a different intersection.
The mid-block crossing on Main Street near the CVS pharmacy had very few pedestrian crossings and a significant number of the observed crossings occurred outside of the marked crosswalk. Two bus stops are situated within 10 feet of the mid-block crossing (i.e. one bus stop on each side of the street), which the research team hoped would result in higher pedestrian volumes. During the “after” data collection period, however, only two buses stopped at these bus stops.
Figure 4-1: Example of YTPCD Damaged by Vehicle
Safety Evaluation of Yield-to-Pedestrian Channelizing Devices 4 Summary of Observations
23
4.2.2. Haverford Township
None of the three intersections had especially large volumes of pedestrian traffic, and all three were affected by school-related traffic. Crossing guards were active at Coopertown/Highland and Darby/Hillcrest. The Darby/Fairfield location is unique in this study in that it is a four-lane road divided by a grass median; therefore, pedestrians are able to cross the road as if it were a pair of one-way roads. This location also had a third section of roadway where pedestrians had to cross in front of the vehicles, a pullout located in front of a middle school.
The Ardmore Junction mid-block crossing is the only one in this study where pedestrians had to cross a four-lane road without a median. Because of higher volumes of vehicle traffic and a posted speed limit of 35 mph, this was a difficult street to cross3. This location was also unusual because it is located approximately 100 feet from a traffic signal with a marked crosswalk. Despite the difficulties of crossing the street and the adjacent crosswalk which was protected by a signal, few if any pedestrians were observed moving from the subject crosswalk to the one at the signal. The Brookline mid-block crossing had a consistent volume of pedestrian traffic during day and evening periods. The street is wider than others so that there is more room for pedestrians to evade drivers if necessary.
4.2.3. Pottstown
With the exception of the Beech Street mid-block location during the “before” data collection period, pedestrian volumes were low at all locations. Crossing guards were observed at two intersection locations: Farmington/8th and State/8th. Moreover, pedestrian crossings often occurred when vehicles were not present, reducing the sample size of pedestrian-vehicle conflicts on which several hypotheses are based.
On the day data collection started, the research team observed that both signs from State/8th were absent, and both signs from Farmington/8th had been removed from the roadway. As borough police were aware of this research project and the locations of the devices, it is unclear who moved the signs. Consequently, the acclimation period for these locations was shorter than desired. Moreover, there was only one sign available for each location, as the remaining signs were not available.
One observer noted that a northbound vehicle at State/8th drove around the YTPCD on the wrong side of the road, even though the sign was correctly installed and it was a 12-foot lane. Fortunately, no southbound traffic was coming at the time.
3 A traffic incident was observed during the “after” data collection period. It was removed from the road within two minutes, and had no lasting impact on vehicle or pedestrian traffic.
4 Summary of Observations Safety Evaluation of Yield-to-Pedestrian Channelizing Devices
24
4.2.4. West Chester
The predominant generator of pedestrian traffic in West Chester was West Chester University. The “before” period occurred during finals week after the spring semester, while the “after” period occurred during summer classes.
There were sign relocation issues in West Chester as well. The signs at the New Street (Nields) mid-block crossing were intact, but only one sign was still installed at High/University, and no signs were present at High/Nields. Subsequent reconnaissance found one sign had been moved onto Price Street, just west of its intersection with High Street. A visit with the West Chester Public Works Department revealed that the signs had not been moved by city employees. For the “after” data collection period, only one sign was available each for High/University and High/Nields. Since it is not known how long the signs were moved or missing, there could be issues of a lack of familiarization at these locations as well.
Perhaps the most surprising observation was the lack of pedestrian crossings at the New Street (Athletic Fields) location. This location has a parking lot with spaces for approximately 50 vehicles, and has a campus shuttle stop. However, during both observation periods, the parking lot was barely used, and there were only a dozen pedestrians during each period, none of whom crossed the road.
Safety Evaluation of Yield-to-Pedestrian Channelizing Devices 5 Results
25
5. RESULTS
As was discussed in Chapter 3, three hypotheses were used to measure the safety effects of YTPCD. These hypotheses are explored first for direct effects – i.e. examining those locations where the devices were installed – and then for spillover effects – i.e. looking at effects elsewhere in the same region.
5.1. Direct Effects
It is hypothesized that, at a minimum, the YTPCD will result in improvements to pedestrian safety at the locations where they are deployed. This section examines whether the observational data confirm that pedestrian safety has improved by testing the three earlier stated hypotheses.
Initial analysis of sites where YTPCD were deployed showed unusual effects at mid-block crossings and in the city of Pottstown. Further investigation revealed that the Beech Street mid-block crossing was the source of these effects. There were a very large number of observations during the “before” period and much fewer observations in the “after” period, which was coincident with when classes were in session at the adjacent private school. This is an external factor that could affect motorist expectations and consequently their willingness to yield. Consequently, this site was removed from analysis.
5.1.1. Motorist Behavior
Two different hypotheses were used to measure the devices’ effect on motorist behavior. It was expected that the devices would result in a higher percentage of motorists yielding to pedestrians when they were present. In addition, it was expected that those motorists who arrived first at a location where a pedestrian was waiting to cross would be more likely to yield.
As noted earlier, the research team observed that, in more than 95 percent of cases, either the first motorist would yield to a pedestrian or no motorists would yield. Generally, one did not see a motorist in the middle of a queue of cars suddenly stop to let a pedestrian cross. This makes sense from both a pedestrian behavioral perspective (i.e. why would a pedestrian expect to cross in the middle of a queue of cars?) as well as a motorist behavioral perspective, where the driver is typically focused on maintaining a certain following distance behind the lead vehicle. The percentage of motorists yielding will therefore be more significantly influenced by patterns in traffic flow (i.e. a platoon of cars being released from a nearby signal) than the percentage of “first motorists” yielding. Therefore, while statistical results are presented on both of these measures of motorist behavior, the research team believes that the “first motorist” behavior may be a better indicator of pedestrian safety.
Figure 5-1 shows the percent of “first motorists” who yielded to pedestrians according to three classifications: location type, community type and intersection traffic control.

5 Results Safety Evaluation of Yield-to-Pedestrian Channelizing Devices
26
0%
10%
20%
30%
40%
50%
60%
70%
80%
90%
100%
Inters
ectio
ns
Mid-Bloc
k Cross
ings
Manayu
nk
Haverfo
rd
Pottsto
wn
West Che
ster
All-way
Stop C
ontrol
Partial
Stop C
ontrol
Perc
ent Before
After
Location Type Community TypeIntersection
Traffic Control
Figure 5-1: Percentage of “First Motorists” Yielding (Direct Testing, Excluding Beech Street)
The results of the Z-test analysis for both motorist behavior hypotheses are shown in Table 5-1. The percentages of motorists yielding to pedestrians, and the percentage of “first motorists” are shown for various classifications of locations where the devices were tested. The z-statistic was estimated using the formula provided earlier. The P-value represents the smallest level of significance at which the null hypothesis – i.e. assuming that there is no change in motorist behavior – would be rejected. Lower P-values mean that it is more likely that there is a difference between the before and after behavior. For example, a P-value of 0.05 means that there is only a 5 percent likelihood that the before and after behaviors are essentially the same, and any change is actually a result of random variation, whereas a P-value of 1.00 means that it is essentially certain that there is no difference between the before and after data. All statistics were developed by summing the relevant parameters across all locations falling into each category. Consequently, sites receive more weight based on the number of pedestrians or vehicles observed. As can be seen, there was a statistically significant increase in motorist yielding behavior regardless of location type, community type or intersection traffic control.
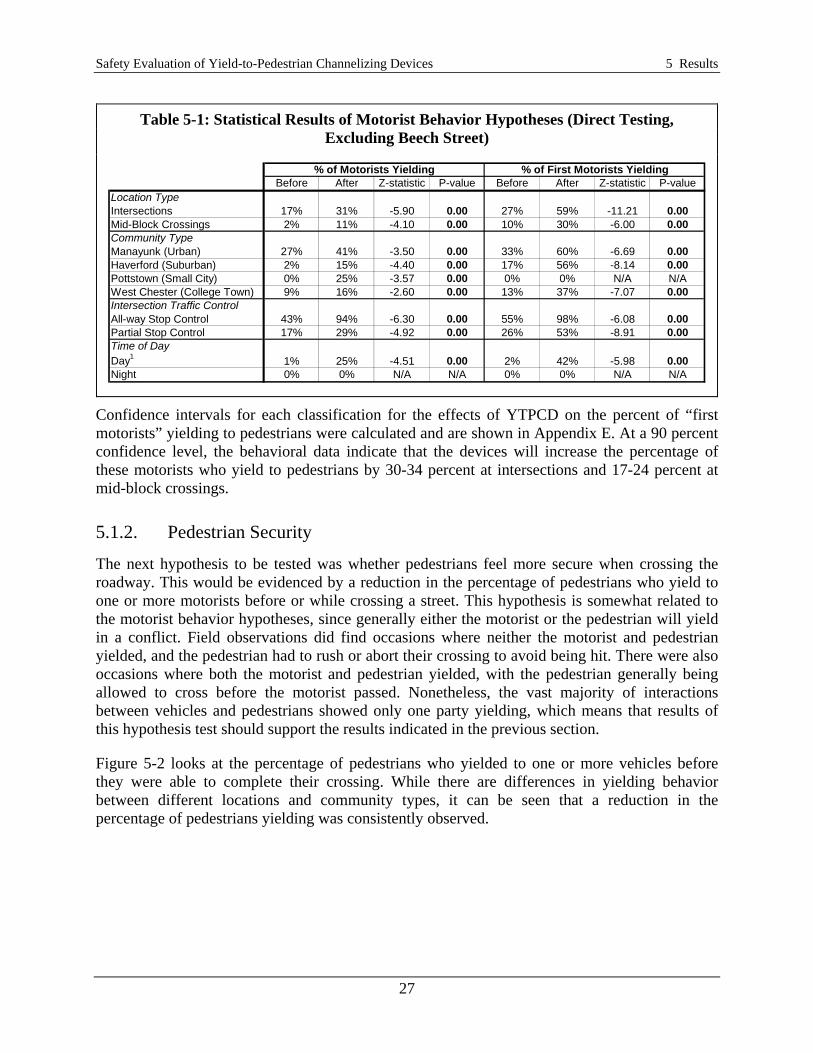
Safety Evaluation of Yield-to-Pedestrian Channelizing Devices 5 Results
27
Confidence intervals for each classification for the effects of YTPCD on the percent of “first motorists” yielding to pedestrians were calculated and are shown in Appendix E. At a 90 percent confidence level, the behavioral data indicate that the devices will increase the percentage of these motorists who yield to pedestrians by 30-34 percent at intersections and 17-24 percent at mid-block crossings.
5.1.2. Pedestrian Security
The next hypothesis to be tested was whether pedestrians feel more secure when crossing the roadway. This would be evidenced by a reduction in the percentage of pedestrians who yield to one or more motorists before or while crossing a street. This hypothesis is somewhat related to the motorist behavior hypotheses, since generally either the motorist or the pedestrian will yield in a conflict. Field observations did find occasions where neither the motorist and pedestrian yielded, and the pedestrian had to rush or abort their crossing to avoid being hit. There were also occasions where both the motorist and pedestrian yielded, with the pedestrian generally being allowed to cross before the motorist passed. Nonetheless, the vast majority of interactions between vehicles and pedestrians showed only one party yielding, which means that results of this hypothesis test should support the results indicated in the previous section.
Figure 5-2 looks at the percentage of pedestrians who yielded to one or more vehicles before they were able to complete their crossing. While there are differences in yielding behavior between different locations and community types, it can be seen that a reduction in the percentage of pedestrians yielding was consistently observed.
Table 5-1: Statistical Results of Motorist Behavior Hypotheses (Direct Testing, Excluding Beech Street)
% of Motorists Yielding % of First Motorists YieldingBefore After Z-statistic P-value Before After Z-statistic P-value
Location TypeIntersections 17% 31% -5.90 0.00 27% 59% -11.21 0.00Mid-Block Crossings 2% 11% -4.10 0.00 10% 30% -6.00 0.00Community TypeManayunk (Urban) 27% 41% -3.50 0.00 33% 60% -6.69 0.00Haverford (Suburban) 2% 15% -4.40 0.00 17% 56% -8.14 0.00Pottstown (Small City) 0% 25% -3.57 0.00 0% 0% N/A N/AWest Chester (College Town) 9% 16% -2.60 0.00 13% 37% -7.07 0.00Intersection Traffic ControlAll-way Stop Control 43% 94% -6.30 0.00 55% 98% -6.08 0.00Partial Stop Control 17% 29% -4.92 0.00 26% 53% -8.91 0.00Time of DayDay1 1% 25% -4.51 0.00 2% 42% -5.98 0.00Night 0% 0% N/A N/A 0% 0% N/A N/A

5 Results Safety Evaluation of Yield-to-Pedestrian Channelizing Devices
28
0%
10%
20%
30%
40%
50%
60%
70%
80%
90%
100%
Inters
ectio
ns
Mid-Bloc
k Cross
ings
Manayu
nk
Haverfo
rd
Pottsto
wn
West Che
ster
All-way
Stop C
ontrol
Partial
Stop C
ontrol
Perc
ent Before
After
Location Type Community TypeIntersection
Traffic Control
Figure 5-2: Percentage of Pedestrians Yielding (Direct Testing, Excluding Beech Street)
Table 5-2 shows statistical results using all locations where the devices were deployed. All classifications show a reduction in the percentage of pedestrians yielding to motorists; however, in some cases these reductions were not statistically significant, including Manayunk, Pottstown and intersections with all-way stop control.
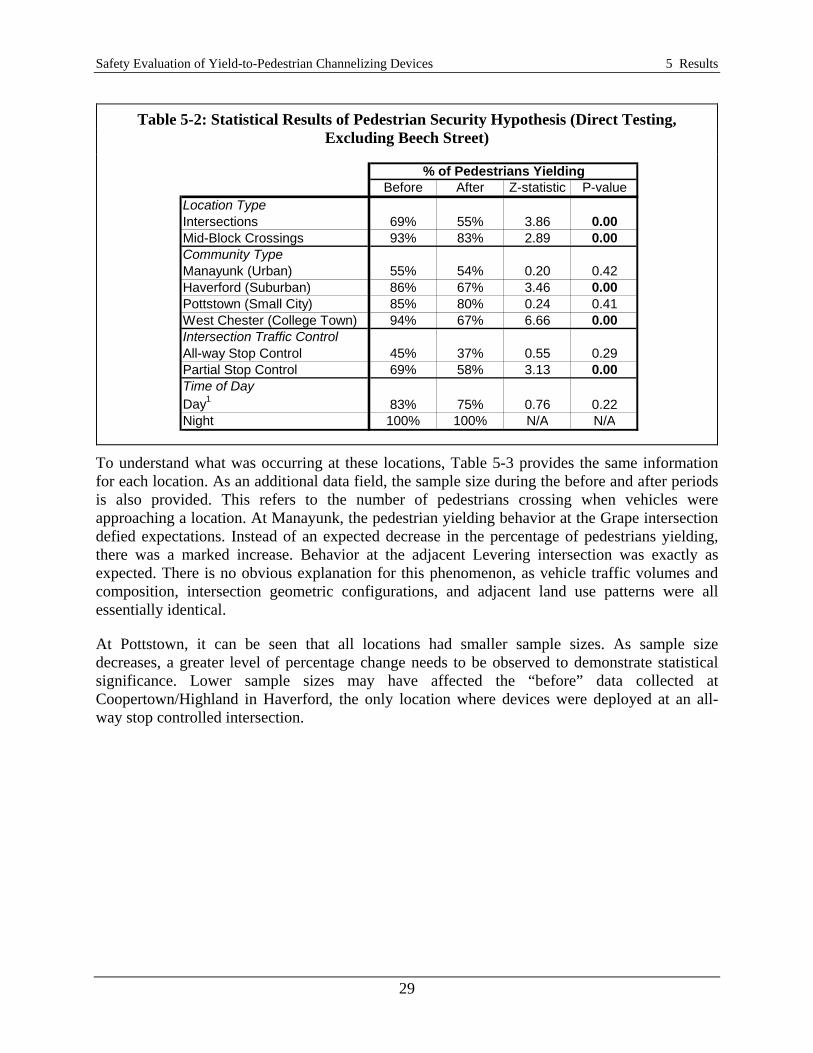
Safety Evaluation of Yield-to-Pedestrian Channelizing Devices 5 Results
29
To understand what was occurring at these locations, Table 5-3 provides the same information for each location. As an additional data field, the sample size during the before and after periods is also provided. This refers to the number of pedestrians crossing when vehicles were approaching a location. At Manayunk, the pedestrian yielding behavior at the Grape intersection defied expectations. Instead of an expected decrease in the percentage of pedestrians yielding, there was a marked increase. Behavior at the adjacent Levering intersection was exactly as expected. There is no obvious explanation for this phenomenon, as vehicle traffic volumes and composition, intersection geometric configurations, and adjacent land use patterns were all essentially identical.
At Pottstown, it can be seen that all locations had smaller sample sizes. As sample size decreases, a greater level of percentage change needs to be observed to demonstrate statistical significance. Lower sample sizes may have affected the “before” data collected at Coopertown/Highland in Haverford, the only location where devices were deployed at an all-way stop controlled intersection.
Table 5-2: Statistical Results of Pedestrian Security Hypothesis (Direct Testing, Excluding Beech Street)
% of Pedestrians YieldingBefore After Z-statistic P-value
Location TypeIntersections 69% 55% 3.86 0.00Mid-Block Crossings 93% 83% 2.89 0.00Community TypeManayunk (Urban) 55% 54% 0.20 0.42Haverford (Suburban) 86% 67% 3.46 0.00Pottstown (Small City) 85% 80% 0.24 0.41West Chester (College Town) 94% 67% 6.66 0.00Intersection Traffic ControlAll-way Stop Control 45% 37% 0.55 0.29Partial Stop Control 69% 58% 3.13 0.00Time of DayDay1 83% 75% 0.76 0.22Night 100% 100% N/A N/A

5 Results Safety Evaluation of Yield-to-Pedestrian Channelizing Devices
30
Confidence intervals for each classification for the effects of YTPCD on the percent of pedestrians yielding to motorists were calculated and are shown in Appendix E. At a 90 percent confidence level, the behavioral data indicate that the devices will decrease the percentage of pedestrians who must yield to motorists by 11-16 percent at intersections and 8-13 percent at mid-block crossings.
5.1.3. Use of Crosswalks
The third hypothesis stated that pedestrians would be more likely to use the crosswalks when the devices were installed. A literature review of behavioral studies showed that motorist behavior toward pedestrians improves and that pedestrian behavior does not become more reckless in marked crosswalks compared to unmarked crosswalks (11). Therefore, increased use of marked crosswalks should lead to improvements in pedestrian safety.
Pedestrian use of crosswalks was observed whether or not vehicles were present, so three different measures were developed to support this hypothesis:
• the percentage of pedestrians using the crosswalks with no vehicles present • the percentage of pedestrians using the crosswalks with vehicles approaching or present • the percentage of pedestrians using the crosswalks, whether or not vehicles were present
The consequences on pedestrian safety – positive or negative – are most relevant when vehicles are present. Therefore, greater emphasis is placed on the second of these measures – the percentage of pedestrians using the crosswalks with vehicles approaching or present – for
Table 5-3: Statistical Results of Pedestrian Security Hypothesis (Direct Testing, by Location)
% of Pedestrians YieldingBefore Sample After Sample Z-statistic P-value
Manayunk (Urban)Levering 63% 81 37% 106 3.55 0.00Grape 35% 99 69% 84 -4.54 1.00Tennis Center 89% 38 84% 19 0.57 0.28Haverford (Suburban)Coopertown / Highland 45% 11 37% 52 0.55 0.29Darby / Hillcrest 100% 10 57% 28 2.50 0.01Ardmore Junction 90% 80 94% 67 -0.89 0.81Pottstown (Small City)Farmington / 8th 80% 5 67% 3 0.42 0.34State / 8th 88% 8 100% 2 -0.53 0.70Beech 35% 214 N/A 0 N/A N/AWest Chester (College Town)High / University 96% 103 68% 72 5.06 0.00High / Nields 83% 46 75% 24 0.76 0.22New (Nields) 99% 73 61% 36 5.35 0.00High / Nields (Evening) 100% 3 N/A 4 N/A N/A
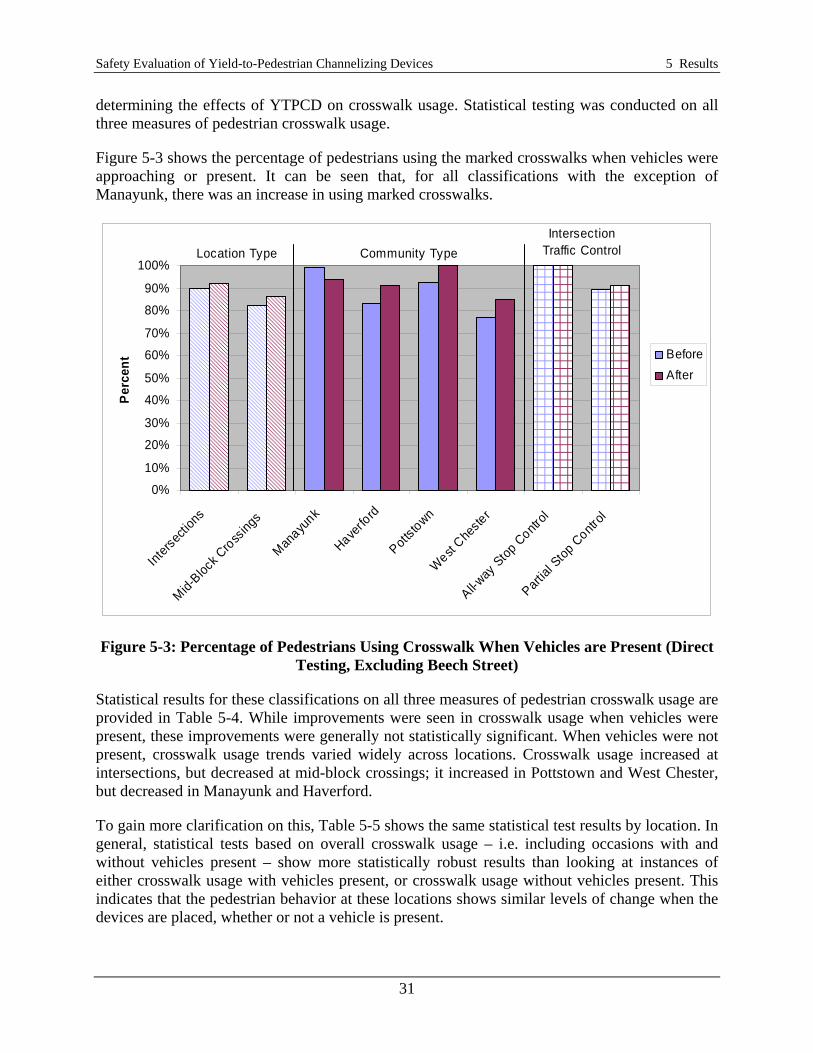
Safety Evaluation of Yield-to-Pedestrian Channelizing Devices 5 Results
31
determining the effects of YTPCD on crosswalk usage. Statistical testing was conducted on all three measures of pedestrian crosswalk usage.
Figure 5-3 shows the percentage of pedestrians using the marked crosswalks when vehicles were approaching or present. It can be seen that, for all classifications with the exception of Manayunk, there was an increase in using marked crosswalks.
0%
10%
20%
30%
40%
50%
60%
70%
80%
90%
100%
Inters
ectio
ns
Mid-Bloc
k Cross
ings
Manayu
nk
Haverfo
rd
Pottsto
wn
West Che
ster
All-way
Stop C
ontrol
Partial
Stop C
ontrol
Perc
ent Before
After
Location Type Community TypeIntersection
Traffic Control
Figure 5-3: Percentage of Pedestrians Using Crosswalk When Vehicles are Present (Direct Testing, Excluding Beech Street)
Statistical results for these classifications on all three measures of pedestrian crosswalk usage are provided in Table 5-4. While improvements were seen in crosswalk usage when vehicles were present, these improvements were generally not statistically significant. When vehicles were not present, crosswalk usage trends varied widely across locations. Crosswalk usage increased at intersections, but decreased at mid-block crossings; it increased in Pottstown and West Chester, but decreased in Manayunk and Haverford.
To gain more clarification on this, Table 5-5 shows the same statistical test results by location. In general, statistical tests based on overall crosswalk usage – i.e. including occasions with and without vehicles present – show more statistically robust results than looking at instances of either crosswalk usage with vehicles present, or crosswalk usage without vehicles present. This indicates that the pedestrian behavior at these locations shows similar levels of change when the devices are placed, whether or not a vehicle is present.

32
5 Results
Safety Evaluation of Yield-to-Pedestrians C
hannelizing Devices
Table 5-4: Statistical Results of Use of Crosswalks Hypothesis (Direct Testing, Excluding Beech Street)
% in Crosswalk with No Vehicles % in Crosswalk with Vehicles % in CrosswalkBefore After Z-statistic P-value Before After Z-statistic P-value Before After Z-statistic P-value
Location TypeIntersections 71% 81% -2.12 0.02 90% 92% -1.11 0.13 81% 89% -3.54 0.00Mid-Block Crossings 79% 58% 3.47 1.00 82% 86% -0.90 0.18 81% 73% 2.20 0.99Community TypeManayunk (Urban) 95% 74% 4.33 1.00 99% 94% 2.98 1.00 97% 89% 4.32 1.00Haverford (Suburban) 88% 76% 1.89 0.97 83% 91% -1.90 0.03 85% 87% -0.32 0.38Pottstown (Small City) 66% 89% -2.25 0.01 92% 100% -0.64 0.26 73% 90% -1.96 0.02West Chester (College Town) 50% 58% -1.28 0.10 77% 85% -1.78 0.04 65% 74% -2.32 0.01Intersection Traffic ControlAll-way Stop Control 88% 97% -1.31 0.09 100% 100% N/A N/A 91% 99% -2.02 0.02Partial Stop Control 70% 76% -1.32 0.09 90% 91% -0.60 0.27 81% 87% -2.64 0.00Time of DayDay1 38% 57% -1.25 0.11 76% 88% -1.13 0.13 57% 76% -2.07 0.02Night 100% 89% 0.69 0.76 100% 100% N/A N/A 100% 92% 0.75 0.77
1 - Day includes only those locations (Brookline and High / Nields) for which night data was also collected.
Table 5-5: Statistical Results of Use of Crosswalks Hypothesis (Direct Testing, by Location)
% in Crosswalk with No Vehicles % in Crosswalk with Vehicles % in CrosswalkBefore N After N Z P-value Before N After N Z P-value Before N After N Z P-value
Manayunk (Urban)Levering 91% 74 100% 21 -1.46 0.07 98% 81 100% 106 -1.63 0.05 94% 155 100% 127 -2.76 0.00Grape 98% 58 74% 27 3.56 1.00 100% 100 88% 84 3.55 1.00 99% 158 85% 111 4.74 1.00Tennis Center 100% 14 48% 21 3.27 1.00 100% 38 84% 19 2.52 0.99 100% 52 65% 40 4.63 1.00Haverford (Suburban)Coopertown / Highland 88% 24 97% 31 -1.31 0.09 100% 11 100% 52 N/A N/A 91% 35 99% 83 -2.02 0.02Darby / Hillcrest 57% 7 100% 3 -1.36 0.09 70% 10 93% 28 -1.84 0.03 65% 17 94% 31 -2.56 0.01Ardmore Junction 92% 53 56% 34 4.03 1.00 83% 80 84% 67 -0.17 0.43 86% 133 74% 101 2.37 0.99Pottstown (Small City)Farmington / 8th 58% 26 86% 29 -2.37 0.01 100% 5 100% 3 N/A N/A 65% 31 88% 32 -2.14 0.02State / 8th 100% 6 100% 6 N/A N/A 88% 8 100% 2 -0.53 0.30 93% 14 100% 8 -0.77 0.22Beech 87% 249 90% 10 -0.27 0.40 99% 214 N/A 0 N/A N/A 92% 463 90% 10 0.29 0.61West Chester (College Town)High / University 49% 69 48% 23 0.12 0.45 81% 103 81% 72 0.00 0.50 68% 172 73% 95 -0.78 0.78High / Nields 38% 47 57% 14 -1.25 0.11 76% 46 88% 24 -1.13 0.13 57% 93 76% 38 -2.07 0.02New (Nields) 60% 53 63% 49 -0.30 0.38 73% 73 92% 36 -2.29 0.01 67% 126 75% 85 -1.23 0.11High / Nields (Evening) 100% 4 89% 9 0.69 0.76 100% 3 100% 4 N/A N/A 100% 7 92% 13 0.75 0.77

Safety Evaluation of Yield-to-Pedestrian Channelizing Devices 5 Results
33
It appears that the location type – intersection or mid-block – is more influential on crosswalk usage than the community type. Seven of the eight intersections – all except Grape – showed increases in the percentage of pedestrians using the crosswalks, with most of these being statistically significant. This is consistent across community types. At mid-block locations, there was a mixture of behaviors observed. There was an increase in compliance at New Street (Nields) in West Chester, no real change at Beech Street in Pottstown, and decreases in compliance at Tennis Center in Manayunk and Ardmore Junction in Haverford.
Confidence intervals for each classification for the effects of YTPCD on the percent of pedestrians using crosswalks when vehicles are present were calculated and are shown in Appendix E. At a 90 percent confidence level, the behavioral data indicate that the devices will increase the percentage of pedestrians who use crosswalks by 1-4 percent at intersections and 1-7 percent at mid-block crossings. While these percentages appear small, these are based on relatively high baseline usage of crosswalks: over 90 percent at intersections and over 80 percent at mid-block crossings.
5.2. Spillover Effects
This section summarizes the results of statistical analysis regarding spillover effects of the YTPCD. As was noted before, spillover effects from YTPCD installed elsewhere in the same community could heighten awareness of and caution toward pedestrians, or it could reduce motorist attentiveness toward pedestrians at locations without the devices. Because of this, a two-tailed z-test was used.
It should be noted that fewer sites were examined for spillover effects than for direct effects. This means that caution needs to be used in generalizing conclusions based on this data.
5.2.1. Motorist Behavior
Figure 5-4 shows the percentage of “first motorists” yielding to pedestrians at marked crosswalks without YTPCD. The general trend of increasing yielding behavior shown under direct testing (shown in Figure 5-1) is observed, although there are some exceptions at mid-block crossing and all-way stop controlled intersections.

5 Results Safety Evaluation of Yield-to-Pedestrian Channelizing Devices
34
0%
10%
20%
30%
40%
50%
60%
70%
80%
90%
100%
Inters
ectio
ns
Mid-Bloc
k Cross
ings
Manayu
nk
Haverfo
rd
Pottsto
wn
West Che
ster
All-way
Stop C
ontrol
Partial
Stop C
ontrol
Perc
ent Before
After
Location Type Community TypeIntersection
Traffic Control
Figure 5-4: Percentage of “First Motorists” Yielding (Spillover Effects)
Summary statistics at the locations where devices were not installed but where motorist behavioral data were collected are provided in Table 5-6. As was stated earlier, a two-tailed z-test was used, so statistical significance could reflect either positive or negative spillover effects. In general, a greater effect was observed when examining the percentage of first motorists yielding compared to the percentage of motorists yielding. Overall, a statistically significant increase in “first motorist” yielding was reported at intersections without the devices, while statistically significant decreases were observed in both types of motorist yielding at mid-block crossings.

Safety Evaluation of Yield-to-Pedestrian Channelizing Devices 5 Results
35
However, this did not hold universally true for individual locations, as results provided in Table 5-7 show. It is interesting to note that the two of the three spillover intersections which showed improvement in motorist yielding behavior were on streets where other devices were installed. In Manayunk, Lock Street is a couple of blocks south of the pair of intersections (Levering and Grape) which had the devices. In West Chester, the High/Sharpless intersection is immediately north of the two intersections (High/University and High/Nields) which had the devices installed. However, this phenomenon was not observed at the CVS mid-block crossing in Manayunk, which is south of the other locations examined yet still on Main Street. This seems to suggest some positive spillover effects at intersections without the devices, if those intersections are located on the same street where some locations have the devices.
Table 5-6: Statistical Results of Motorist Behavior Hypotheses (Spillover Effects)
% of Motorists Yielding % of First Motorists YieldingBefore After Z-statistic P-value Before After Z-statistic P-value
Location TypeIntersections 12% 13% -0.16 0.87 20% 49% -6.89 0.00Mid-Block Crossings 36% 25% 2.61 0.01 51% 39% 2.68 0.01Community TypeManayunk (Urban) 10% 10% 0.12 0.91 11% 33% -4.51 0.00Haverford (Suburban) 40% 23% 3.95 0.00 50% 57% -1.61 0.11Pottstown (Small City) 58% 38% 2.30 0.02 60% 64% -0.43 0.66West Chester (College Town) 2% 23% -2.51 0.01 7% 67% -4.45 0.00Intersection Traffic ControlAll-way Stop Control 100% 75% 2.79 0.01 100% 80% 2.46 0.01Partial Stop Control 10% 12% -0.64 0.52 15% 48% -7.45 0.00Time of DayDay1 42% 29% 2.52 0.01 55% 45% 1.96 0.05Night 12% 20% -0.91 0.36 12% 27% -1.59 0.11
1 - Day includes only those locations (Brookline and High / Nields) for which night data was also collected.
Table 5-7: Statistical Results of Motorist Behavior Hypotheses (Spillover Effects by Location)
% of Motorists Yielding % of First Motorists Yielding
Before After Z-statistic P-value Before After Z-statistic P-valueManayunk (Urban)Lock 11% 10% 0.12 0.91 11% 37% -4.88 0.00CVS 7% 0% 1.26 0.21 15% 0% 1.96 0.05Haverford (Suburban)Darby / Fairfield 27% 15% 1.71 0.09 29% 71% -4.68 0.00Brookline 42% 29% 2.52 0.01 55% 45% 1.96 0.05Brookline (Evening) 18% 21% -0.23 0.82 14% 29% -1.34 0.18Pottstown (Small City)Hanover / Oak 100% 75% 2.79 0.01 100% 80% 2.46 0.01Charlotte / Grace 0% 0% N/A N/A 0% 0% N/A N/AAdams 33% 29% 0.43 0.67 33% 60% -2.22 0.03West Chester (College Town)High / Sharpless 2% 23% -2.51 0.01 7% 67% -4.45 0.00

5 Results Safety Evaluation of Yield-to-Pedestrian Channelizing Devices
36
As was done for direct testing, confidence intervals for each classification were developed for the effects of YTPCD on the percent of “first motorists” yielding at spillover locations; these are provided in Appendix E. At a 90 percent confidence level, the behavioral data indicate that the devices will increase the percentage of “first motorists” who yield to pedestrians by 26-32 percent at intersections, while decreasing the percentage by 8-17 percent at mid-block crossings.
5.2.2. Pedestrian Security
Figure 5-5 shows the percentage of pedestrians yielding to one or more motorists for the spillover locations. With the exception of the all-way stop controlled intersection (only one location with a very small sample size), the percentage of pedestrians yielding within each classification was reduced.
0%
10%
20%
30%
40%
50%
60%
70%
80%
90%
100%
Inters
ectio
ns
Mid-Bloc
k Cross
ings
Manayu
nk
Haverfo
rd
Pottsto
wn
West Che
ster
All-way
Stop C
ontrol
Partial
Stop C
ontrol
Perc
ent Before
After
Location Type Community TypeIntersection
Traffic Control
Figure 5-5: Percentage of Pedestrians Yielding (Spillover Effects)
The results of hypothesis testing regarding pedestrian security at spillover locations are provided in Table 5-8. Many of the reductions in the pedestrian yielding were statistically significant.
A more detailed analysis by location was conducted; the results of this are shown in Table 5-9. Small increases in pedestrian yielding frequency were observed at a couple of locations, but the overall trend is maintained.
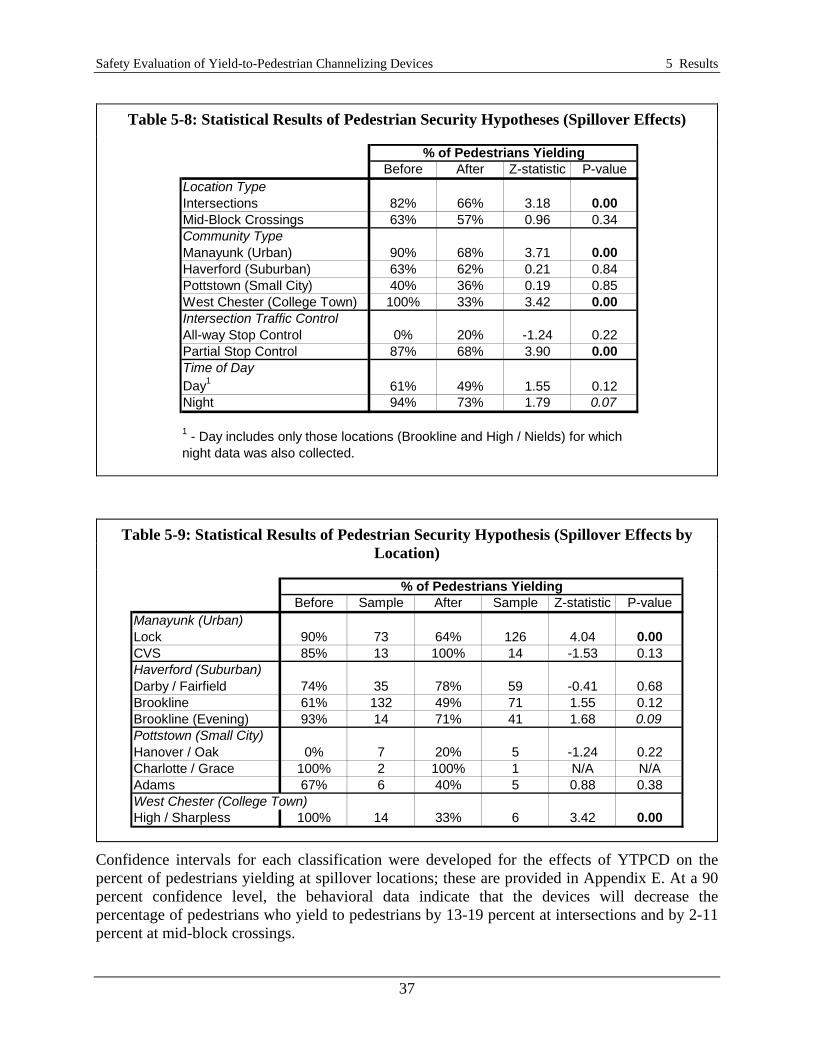
Safety Evaluation of Yield-to-Pedestrian Channelizing Devices 5 Results
37
Confidence intervals for each classification were developed for the effects of YTPCD on the percent of pedestrians yielding at spillover locations; these are provided in Appendix E. At a 90 percent confidence level, the behavioral data indicate that the devices will decrease the percentage of pedestrians who yield to pedestrians by 13-19 percent at intersections and by 2-11 percent at mid-block crossings.
Table 5-8: Statistical Results of Pedestrian Security Hypotheses (Spillover Effects)
% of Pedestrians YieldingBefore After Z-statistic P-value
Location TypeIntersections 82% 66% 3.18 0.00Mid-Block Crossings 63% 57% 0.96 0.34Community TypeManayunk (Urban) 90% 68% 3.71 0.00Haverford (Suburban) 63% 62% 0.21 0.84Pottstown (Small City) 40% 36% 0.19 0.85West Chester (College Town) 100% 33% 3.42 0.00Intersection Traffic ControlAll-way Stop Control 0% 20% -1.24 0.22Partial Stop Control 87% 68% 3.90 0.00Time of DayDay1 61% 49% 1.55 0.12Night 94% 73% 1.79 0.07
1 - Day includes only those locations (Brookline and High / Nields) for which night data was also collected.
Table 5-9: Statistical Results of Pedestrian Security Hypothesis (Spillover Effects by Location)
% of Pedestrians YieldingBefore Sample After Sample Z-statistic P-value
Manayunk (Urban)Lock 90% 73 64% 126 4.04 0.00CVS 85% 13 100% 14 -1.53 0.13Haverford (Suburban)Darby / Fairfield 74% 35 78% 59 -0.41 0.68Brookline 61% 132 49% 71 1.55 0.12Brookline (Evening) 93% 14 71% 41 1.68 0.09Pottstown (Small City)Hanover / Oak 0% 7 20% 5 -1.24 0.22Charlotte / Grace 100% 2 100% 1 N/A N/AAdams 67% 6 40% 5 0.88 0.38West Chester (College Town)High / Sharpless 100% 14 33% 6 3.42 0.00

5 Results Safety Evaluation of Yield-to-Pedestrian Channelizing Devices
38
5.2.3. Use of Crosswalks
Figure 5-6 shows the percentage of pedestrians using crosswalks at spillover locations when vehicles were approaching or present. This graph shows more ambiguous results than others. While there was an increase in crosswalk usage at intersections, little change was observed at mid-block locations. There was also variation across community types.
0%
10%
20%
30%
40%
50%
60%
70%
80%
90%
100%
Inters
ectio
ns
Mid-Bloc
k Cross
ings
Manayu
nk
Haverfo
rd
Pottsto
wn
West Che
ster
All-way
Stop C
ontrol
Partial
Stop C
ontrol
Perc
ent Before
After
Location Type Community TypeIntersection
Traffic Control
Figure 5-6: Percentage of Pedestrians Using Crosswalk When Vehicles are Present (Spillover Effects)
Table 5-10 and Table 5-11 show statistical results regarding spillover effects of YTPCD on locations without devices regarding the use of crosswalk hypotheses. There are a couple of interesting findings regarding this hypothesis. First, there is a statistically significant increase in the use of crosswalks at intersections, even without YTPCD. This was more marked at Lock Street and Darby/Fairfield, where higher sample sizes were observed. Second, increased use of crosswalks was observed on streets where YTPCD installed at other locations nearby (Lock Street and High/Sharpless). This may be a positive spillover effect of the devices if pedestrians see the signs elsewhere and change their behavior accordingly. This would be reasonable in West Chester, where a pedestrian may pass by all three crosswalk locations on High Street since they were at adjacent intersections. Third, there were reductions in crosswalk use at non-YTPCD locations in Pottstown. However, the findings when vehicles are present are constrained by a lack of sample size, so it is unclear whether there is any meaningful safety impact.

39
Safety Evaluation of Yield-to-Pedestrians C
hannelizing Devices
5 Results
Table 5-10: Statistical Results of Use of Crosswalks Hypotheses (Spillover Effects)
% in Crosswalk with No Vehicles % in Crosswalk with Vehicles % in CrosswalkBefore After Z-statistic P-value Before After Z-statistic P-value Before After Z-statistic P-value
Location TypeIntersections 76% 78% -0.38 0.71 78% 88% -2.51 0.01 77% 86% -2.50 0.01Mid-Block Crossings 47% 50% -0.50 0.61 48% 50% -0.25 0.80 48% 50% -0.53 0.59Community TypeManayunk (Urban) 60% 79% -1.97 0.05 83% 81% 0.25 0.80 74% 81% -1.56 0.12Haverford (Suburban) 51% 51% -0.06 0.95 47% 70% -3.92 0.00 49% 63% -3.09 0.00Pottstown (Small City) 80% 63% 1.98 0.05 100% 82% 1.72 0.09 85% 66% 2.51 0.01West Chester (College Town) 62% 67% -0.25 0.80 71% 83% -0.56 0.57 66% 73% -0.53 0.60Intersection Traffic ControlAll-way Stop Control 95% 88% 0.82 0.41 100% 100% N/A N/A 96% 90% 0.93 0.35Partial Stop Control 71% 73% -0.19 0.85 77% 88% -2.64 0.01 75% 85% -2.79 0.01Time of DayDay1 44% 53% -1.23 0.22 45% 56% -1.58 0.11 44% 55% -1.98 0.05Night 20% 25% -0.32 0.75 53% 42% N/A N/A 56% 45% 0.90 0.37
1 - Day includes only those locations (Brookline and High / Nields) for which night data was also collected.
Table 5-11 Statistical Results of Use of Crosswalks Hypotheses (Spillover Effects by Location)
% in Crosswalk with No Vehicles % in Crosswalk with Vehicles % in CrosswalkBefore N After N Z P-value Before N After N Z P-value Before N After N Z P-value
Manayunk (Urban)Lock 66% 47 90% 29 -2.32 0.02 86% 74 89% 126 -0.50 0.61 79% 121 89% 155 -2.39 0.02CVS 30% 10 44% 9 -0.65 0.51 62% 13 14% 14 2.54 0.01 48% 23 26% 23 1.53 0.13Haverford (Suburban)Darby / Fairfield 89% 19 33% 9 3.07 0.00 57% 35 86% 59 -3.19 0.00 69% 54 79% 68 -1.37 0.17Brookline 44% 111 53% 75 -1.23 0.22 45% 132 56% 71 -1.58 0.11 44% 243 55% 146 -1.98 0.05Brookline (Evening) 33% 6 35% 23 -0.07 0.95 43% 14 37% 41 0.42 0.68 40% 20 36% 64 0.33 0.74Pottstown (Small City)Hanover / Oak 95% 20 88% 25 0.82 0.41 100% 7 100% 5 N/A N/A 96% 27 90% 30 0.93 0.35Charlotte / Grace 100% 4 0% 1 2.24 0.03 100% 2 100% 1 N/A N/A 100% 6 50% 2 1.85 0.06Adams 67% 27 45% 31 1.64 0.10 100% 6 60% 5 1.71 0.09 73% 33 47% 36 2.16 0.03West Chester (College Town)High / Sharpless 62% 21 67% 9 -0.25 0.80 71% 14 83% 6 -0.56 0.57 66% 35 73% 15 -0.53 0.60

5 Results Safety Evaluation of Yield-to-Pedestrian Channelizing Devices
40
Confidence intervals for each classification were developed for the effects of YTPCD on the percent of pedestrians using crosswalks at spillover locations; these are provided in Appendix E. At a 90 percent confidence level, the behavioral data indicate that the devices increased crosswalk compliance by 7-13 percent at intersections, while the confidence interval for mid-block crossings was non-conclusive.

Safety Evaluation of Yield-to-Pedestrian Channelizing Devices 6 Summary and Recommendations
41
6. SUMMARY AND RECOMMENDATIONS
This report has presented a safety evaluation of PennDOT’s yield-to-pedestrian channelizing devices. This evaluation was conducted using observational data on motorist and pedestrian behavior, collected at a total of 21 sites, featuring a mixture of community types and location (intersection or mid-block) types. The study included a mix of sites with and without the devices to determine whether the signs’ effects were confined to the crosswalks where they were installed or whether there were positive or negative spillover effects.
This chapter summarizes the main findings of this research and provides recommendations for practice and future study.
6.1. Summary of Research Findings
The evaluation focused on three primary hypotheses for the effects of the YTPCD: motorist behavior, pedestrian security, and use of crosswalks.
6.1.1. Direct Effects
In terms of direct effects – i.e. examining behavior at crosswalks before and after YTPCD were deployed at those locations – the analysis showed generally positive effects of the YTPCD. The likelihood of the first motorist arriving at a crosswalk yielding to a waiting pedestrian increased 30-34 percent at intersections and 17-24 percent at mid-block crosswalks. The percentage of pedestrians who yielded to motorists decreased by 11-16 percent at intersections and 8-13 percent at mid-block crossings, suggesting increased pedestrian security when the devices are in place. There was a small but statistically significant increase in the percentage of pedestrians who used crosswalks, which should also correlate with pedestrian safety. The effects were generally more positive at intersections than at mid-block locations, and did not seem to exhibit any bias with respect to community type.
6.1.2. Spillover Effects
The research also examined spillover effects, to see whether YTPCD installed at one crosswalk appeared to influence motorist and pedestrian behavior at other crosswalks in the same community. In general, the spillover effects seemed to be positive primarily at intersections and on corridors or streets where the YTPCD were installed elsewhere. The effects of YTPCD at spillover intersections were comparable to those observed at intersections where YTPCD were deployed, while the effects at mid-block crossings were unclear.
6.1.3. Overall
Based on observations of motorist and pedestrian behavior, this research has concluded that the YTPCD have a positive effect on surrogate measures for pedestrian safety, including the motorists’ willingness to yield, pedestrian security, and pedestrian use of crosswalks. To the extent these surrogate measures correlate with vehicle-pedestrian crash rates, YTPCD should

6 Summary and Recommendations Safety Evaluation of Yield-to-Pedestrian Channelizing Devices
42
reduce the number of vehicle-pedestrian crashes. This research does not provide sufficient information to make a reliable estimate of the potential reduction in pedestrian crashes associated with various levels of YTPCD installation. However, the behavioral data indicate that communities should consider deployment of YTPCD at locations where local design conditions and pedestrian safety concerns warrant them.
The research found that the devices were most effective at intersections but also provided benefits at mid-block crossings. There were generally positive spillover effects at other locations in the community, so a community might be able to improve pedestrian safety by installing the devices at a few visible or highly-used crosswalks.
6.2. Recommendations
The research revealed a couple of considerations with respect to YTPCD placement at a given location. First, YTPCD do not last long on roads that have (or are perceived to have) narrow lane widths. In these cases, other safety improvements should be considered as alternatives or supplements to YTPCD. Second, in a related matter, the research project showed that the location and condition of YTPCD require monitoring. The disappearance of or damage to signs does not appear to be specifically related to traffic volumes, speed or community type. A community that seeks to use YTPCD to improve pedestrian safety should be prepared to include monitoring and replacement of the devices as part of their sign maintenance program4. Depending upon the location, the replacement frequency could be multiple times per year. This fact should be considered when comparing YTPCD to other safety measures.
The recommendation for continued use of YTPCD is tempered by a couple of caveats, which could be addressed through future research. First, this research looked at before and after data collected only a month apart. It is unclear whether, in a longer time frame, motorists might eventually ignore the YTPCD, especially at crosswalks with relatively infrequent pedestrian crossings. Collecting additional data at the same sites in 2007 where direct testing was conducted would be a good way of verifying whether the effects of YTPCD are lasting or temporary.
Second, it would be useful to have a long-term analysis of pedestrian crash statistics at locations with and without YTPCD to identify whether the signs, overall, have seemed to improve pedestrian safety across the Commonwealth. This analysis will be difficult because of inconsistent reporting on the extent of YTPCD usage (locations and dates of deployment) across Pennsylvania, in addition to regression-to-mean bias. With outreach to the law enforcement community, crash report forms for vehicle-pedestrian crashes may be able to be used to record whether YTPCD devices were present and in good condition at a location when a crash occurred. These data improvements would be necessary to support a valid analysis of the effects of YTPCD on the frequency of pedestrian-related crashes.
In summary, the YTPCD appear to have a positive impact on pedestrian safety, and merit consideration for future usage across the Commonwealth.
4 PennDOT currently provides replacements for the devices upon community request.

Safety Evaluation of Yield-to-Pedestrian Channelizing Devices References
43
REFERENCES
1. E-mail communication from Dave Bachman, Pennsylvania Department of Transportation, August 30, 2006.
2. National Highway Traffic Safety Administration, 2005 Annual Assessment of Motor Vehicle Crashes, Report No. DOT HS 810 639, National Center for Statistics & Analysis, National Highway Traffic Safety Administration, Washington [DC]: August 2006.
3. Pennsylvania Department of Transportation, 2004 Pennsylvania Crash Facts and Statistics, Bureau of Highway Safety and Traffic Engineering, Pennsylvania Department of Transportation, Harrisburg [PA].
4. Title 75, Section 3542(a), Pennsylvania Consolidated Statutes, as quoted at http://www.dot.state.pa.us/Pedestrian/web/laws.htm, Accessed on August 31, 2006.
5. E-mail communication from Dave Bachman, Pennsylvania Department of Transportation, August 28, 2006.
6. Kisic, J., “PENNDOT to Provide Pedestrian Channelizing Devices Free,” Moving Forward, Vol. 20, No. 1, Spring 2002, pp. 3, 6.
7. Huang, H., Zegeer, C., Nassi, R. and Fairfax, B., The Effects of Innovative Pedestrian Signs at Unsignalized Locations: A Tale of Three Treatments, Report No. FHWA-RD-00-098, Federal Highway Administration, Washington [DC]: August 2000.
8. Kannel, E.J., Souleyrette, R.R. and Tenges, R., In-Street Yield to Pedestrian Sign Application in Cedar Rapids, Iowa, Center for Transportation Research and Education, Iowa State University, Ames [IA]: May 2003.
9. Kamyab, A., Andrle, S. and Kroeger, D., Methods to Reduce Traffic Speed in High Pedestrian Areas, Report 2002-18, Prepared for the Minnesota Department of Transportation, St. Paul [MN]: March 2002.
10. Traffic Engineering Division, “Year 2 Field Evaluation of Experimental ‘In-Street’ Yield to Pedestrian Signs”, City of Madison Department of Transportation, Madison [WI]: 1999.
11. C.V. Zegeer, J.R. Stewart, H.H. Huang, P.A. Lagerwey, J. Feaganes, and B.J. Campbell, Safety Effects of Marked versus Unmarked Crosswalks at Uncontrolled Locations: Final Report and Recommended Guidelines, FHWA Report No. FHWA-HRT-04-100, Federal Highway Administration, McLean [VA], February 2005.

References Safety Evaluation of Yield-to-Pedestrian Channelizing Devices
44
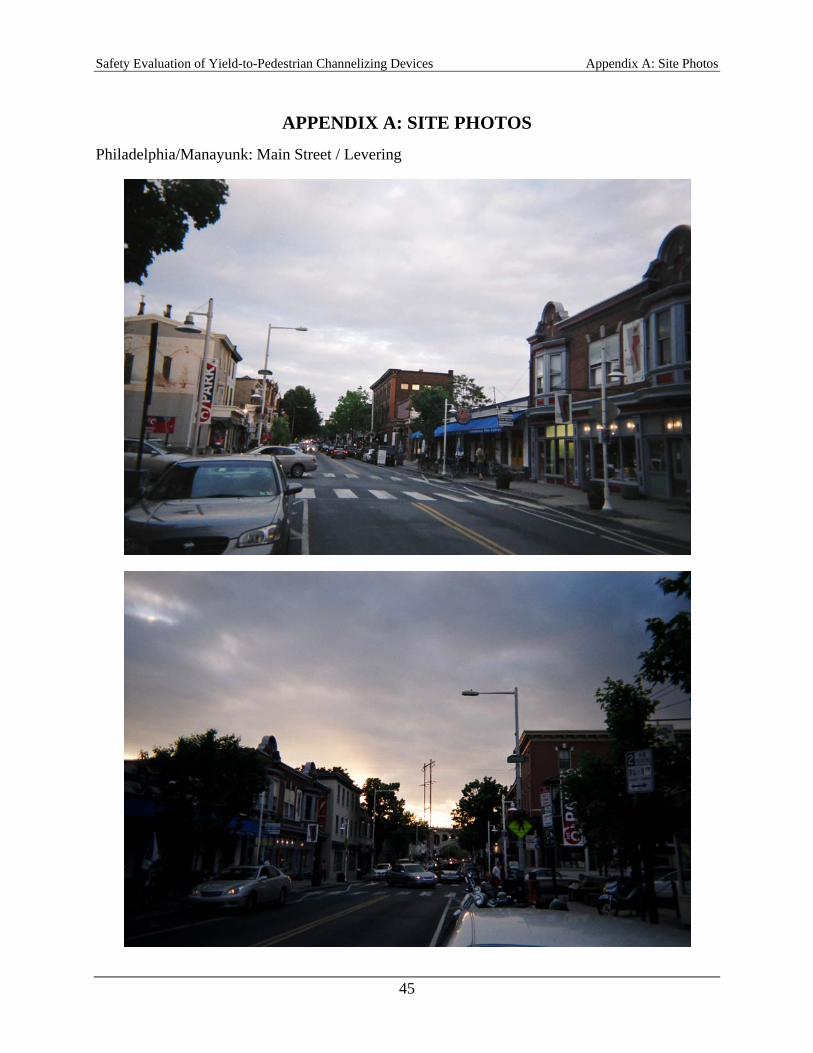
Safety Evaluation of Yield-to-Pedestrian Channelizing Devices Appendix A: Site Photos
45
APPENDIX A: SITE PHOTOS
Philadelphia/Manayunk: Main Street / Levering

Appendix A: Site Photos Safety Evaluation of Yield-to-Pedestrian Channelizing Devices
46
Philadelphia/Manayunk: Main Street / Grape
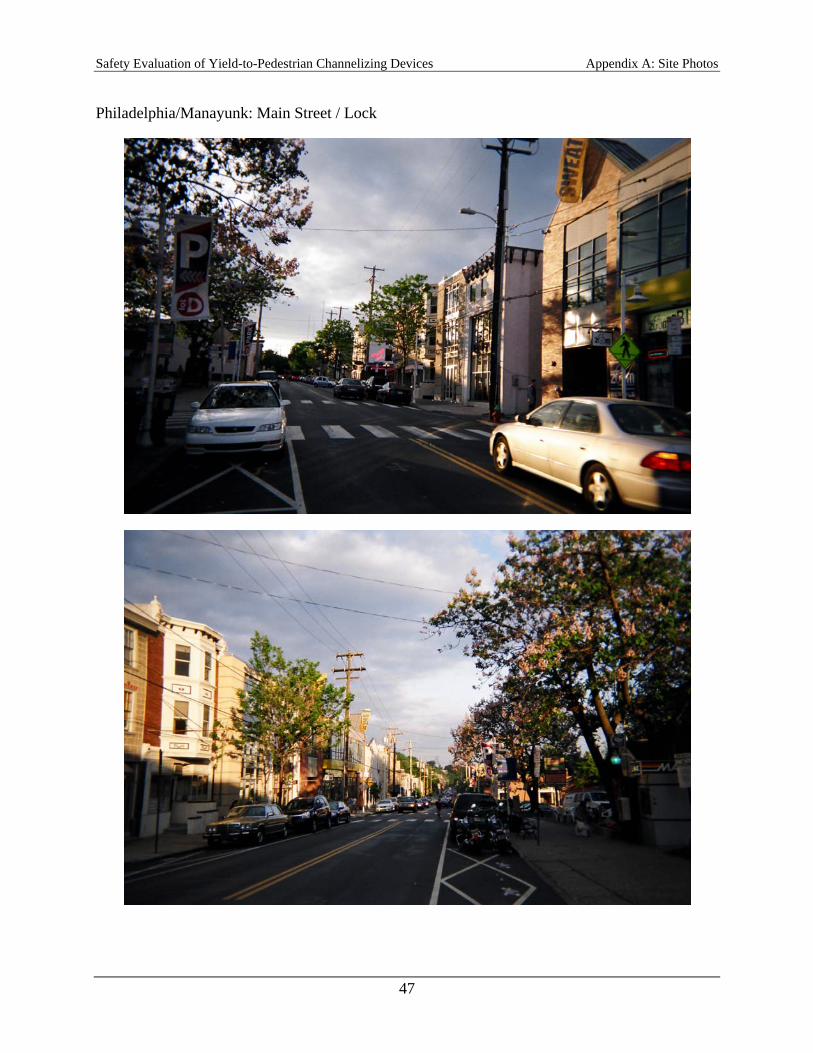
Safety Evaluation of Yield-to-Pedestrian Channelizing Devices Appendix A: Site Photos
47
Philadelphia/Manayunk: Main Street / Lock

Appendix A: Site Photos Safety Evaluation of Yield-to-Pedestrian Channelizing Devices
48
Philadelphia/Manayunk: Main Street (North)
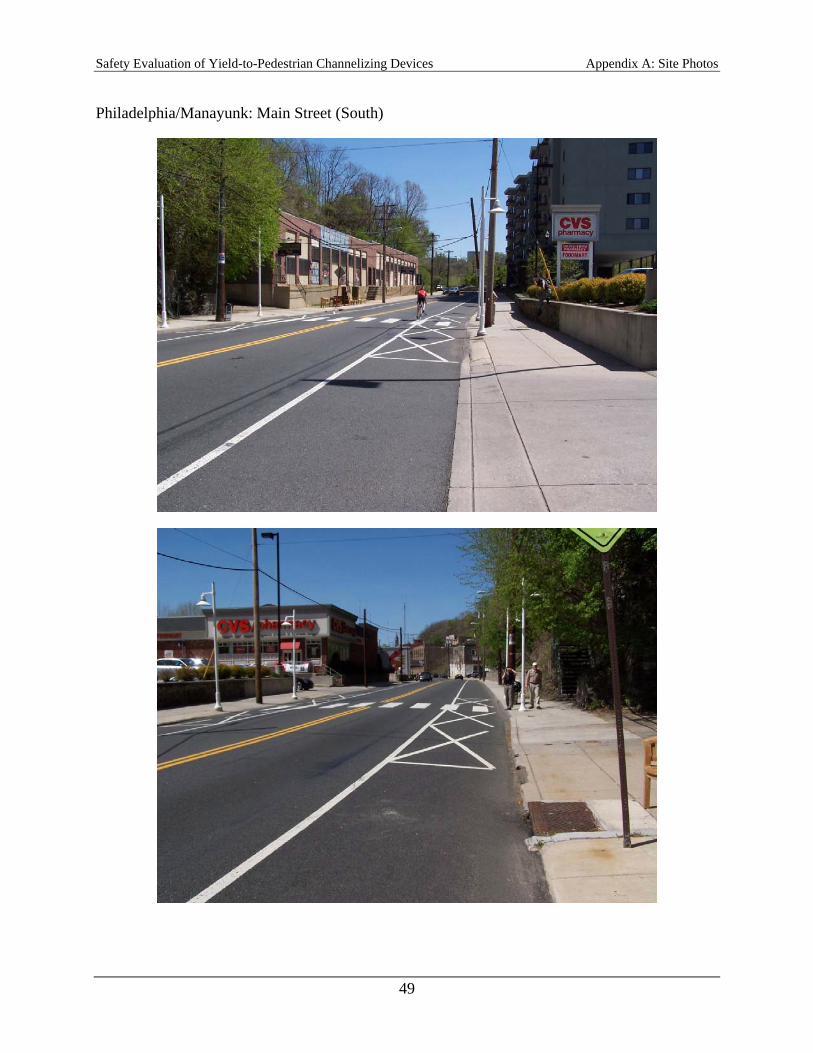
Safety Evaluation of Yield-to-Pedestrian Channelizing Devices Appendix A: Site Photos
49
Philadelphia/Manayunk: Main Street (South)
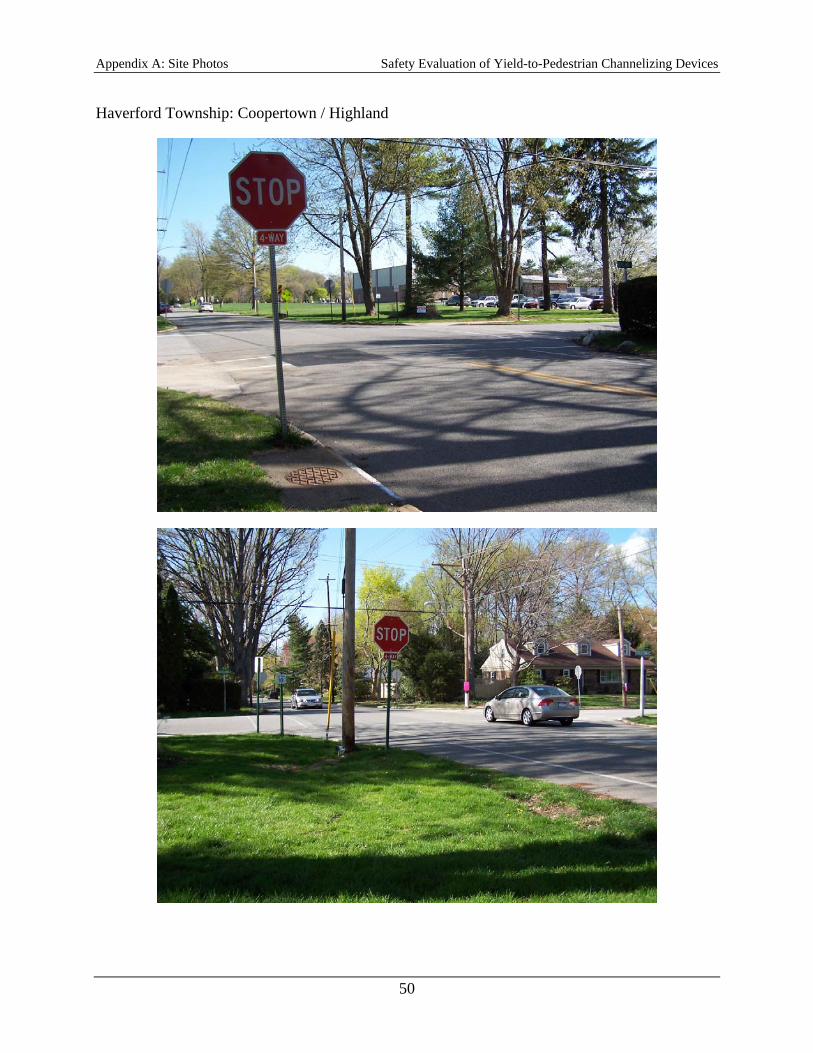
Appendix A: Site Photos Safety Evaluation of Yield-to-Pedestrian Channelizing Devices
50
Haverford Township: Coopertown / Highland

Safety Evaluation of Yield-to-Pedestrian Channelizing Devices Appendix A: Site Photos
51
Haverford Township: Darby / Hillcrest

Appendix A: Site Photos Safety Evaluation of Yield-to-Pedestrian Channelizing Devices
52
Haverford Township: Darby / Fairfield

Safety Evaluation of Yield-to-Pedestrian Channelizing Devices Appendix A: Site Photos
53
Haverford Township: Haverford Road / Hathaway

Appendix A: Site Photos Safety Evaluation of Yield-to-Pedestrian Channelizing Devices
54
Haverford Township: Brookline

Safety Evaluation of Yield-to-Pedestrian Channelizing Devices Appendix A: Site Photos
55
Pottstown: Farmington Avenue / 8th Avenue

Appendix A: Site Photos Safety Evaluation of Yield-to-Pedestrian Channelizing Devices
56
Pottstown: Hanover Street / Oak Avenue
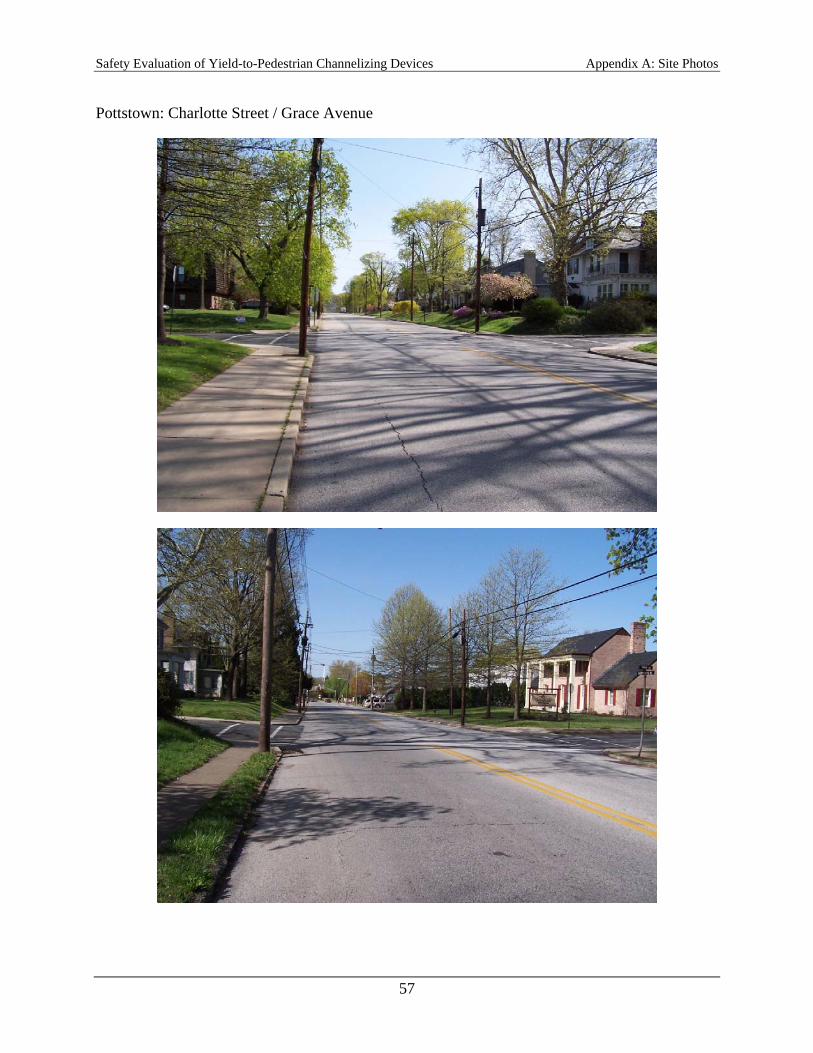
Safety Evaluation of Yield-to-Pedestrian Channelizing Devices Appendix A: Site Photos
57
Pottstown: Charlotte Street / Grace Avenue
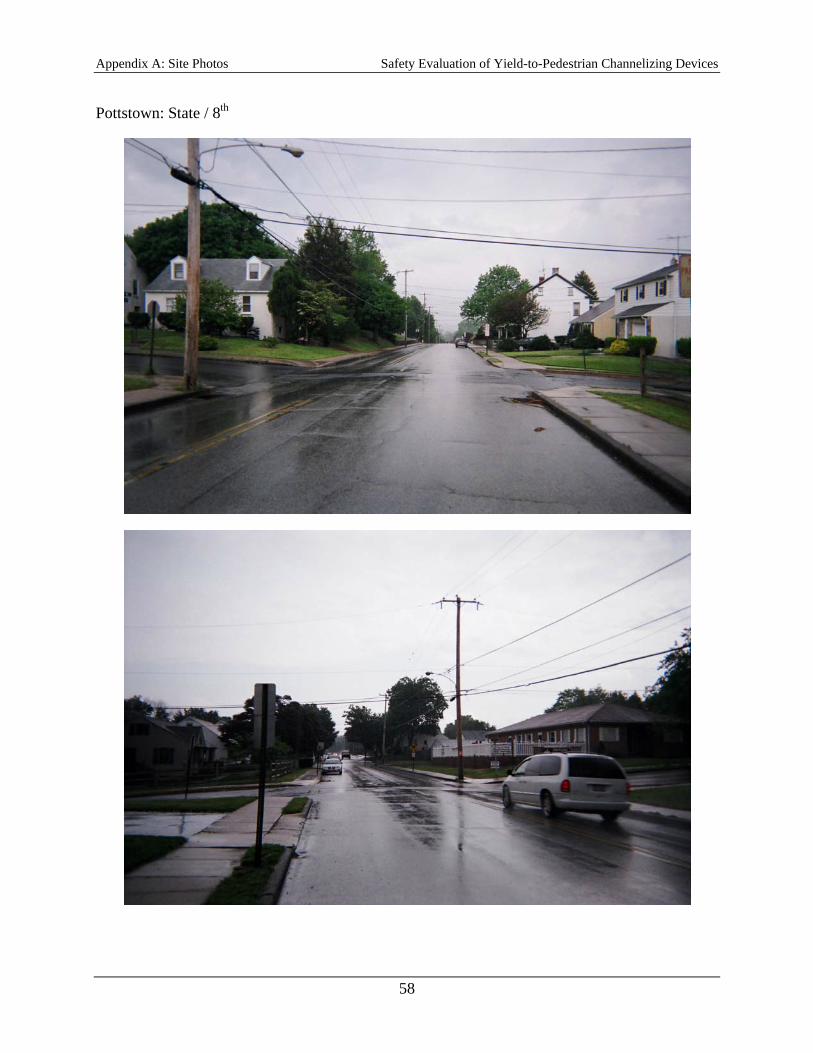
Appendix A: Site Photos Safety Evaluation of Yield-to-Pedestrian Channelizing Devices
58
Pottstown: State / 8th

Safety Evaluation of Yield-to-Pedestrian Channelizing Devices Appendix A: Site Photos
59
Pottstown: Adams Street (Senior Center)

Appendix A: Site Photos Safety Evaluation of Yield-to-Pedestrian Channelizing Devices
60
Pottstown: Beech Street (The Hill School)
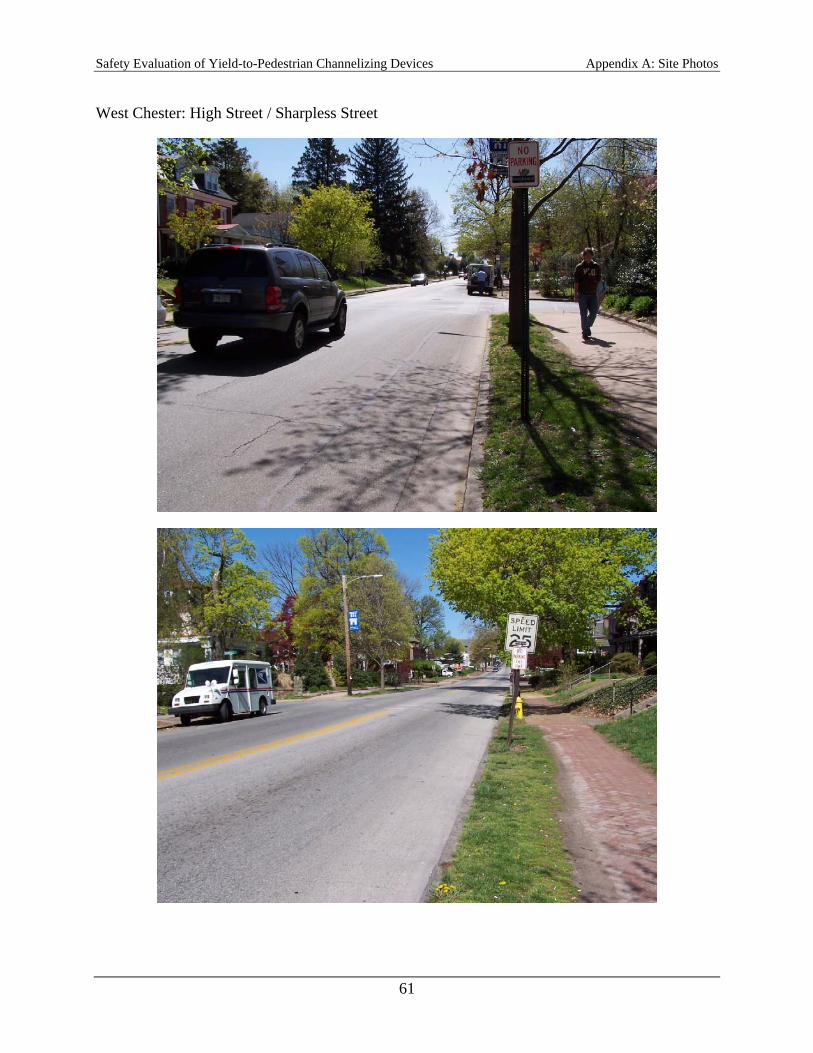
Safety Evaluation of Yield-to-Pedestrian Channelizing Devices Appendix A: Site Photos
61
West Chester: High Street / Sharpless Street
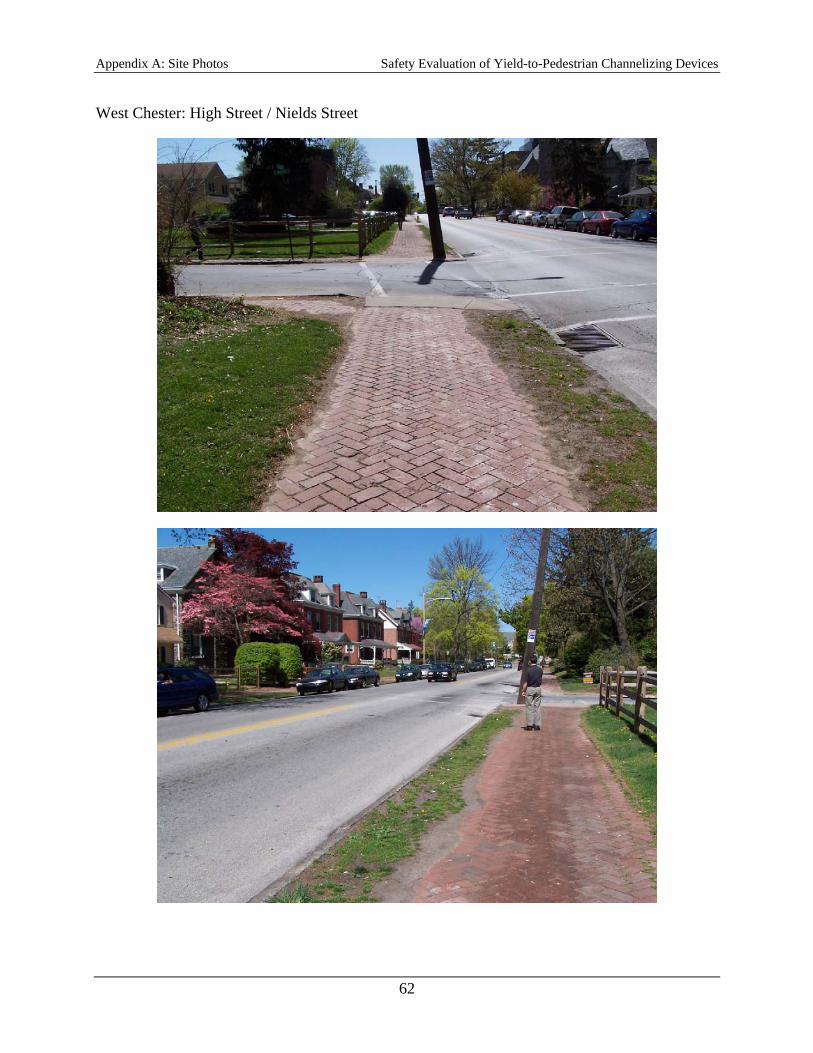
Appendix A: Site Photos Safety Evaluation of Yield-to-Pedestrian Channelizing Devices
62
West Chester: High Street / Nields Street

Safety Evaluation of Yield-to-Pedestrian Channelizing Devices Appendix A: Site Photos
63
West Chester: High Street / University

Appendix A: Site Photos Safety Evaluation of Yield-to-Pedestrian Channelizing Devices
64
West Chester: New Street (Athletic Fields)

Safety Evaluation of Yield-to-Pedestrian Channelizing Devices Appendix A: Site Photos
65
West Chester: New Street (Nields)

Appendix B: Data Collection Forms Safety Evaluation of Yield-to-Pedestrian Channelizing Devices
66
APPENDIX B: DATA COLLECTION FORMS
“Before” Form

Safety Evaluation of Yield-to-Pedestrian Channelizing Devices Appendix B: Data Collection Forms
67
“After” Form
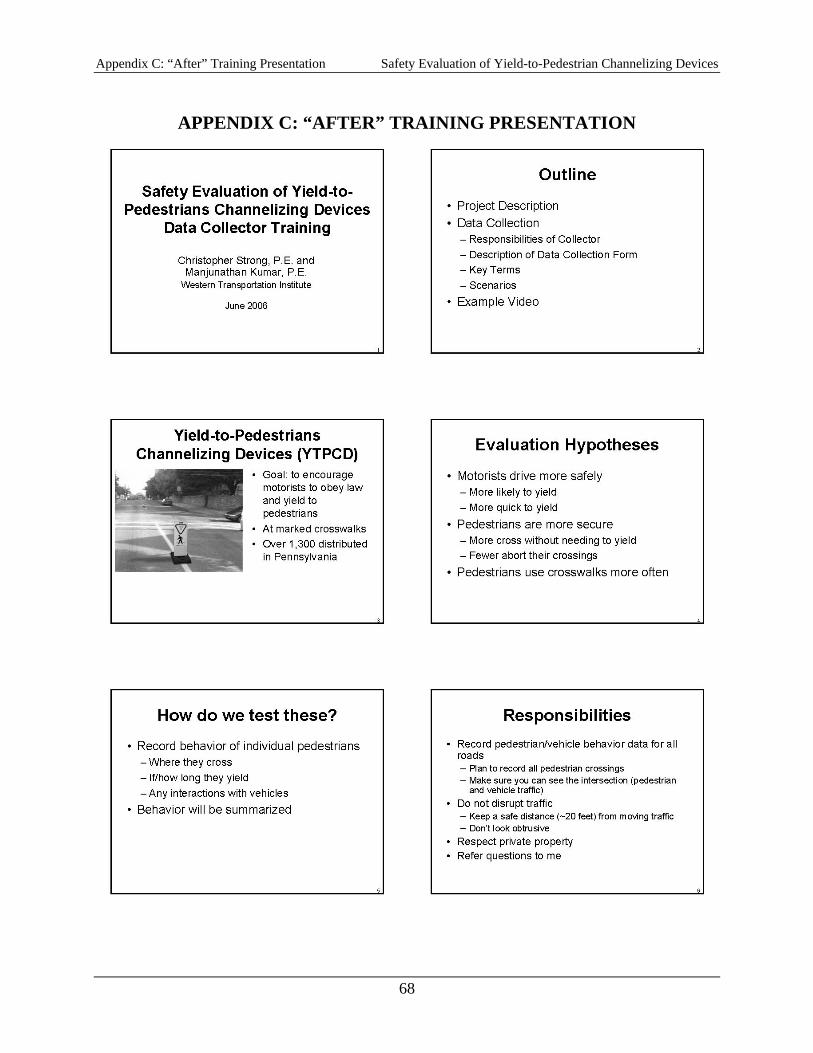
Appendix C: “After” Training Presentation Safety Evaluation of Yield-to-Pedestrian Channelizing Devices
68
APPENDIX C: “AFTER” TRAINING PRESENTATION

Safety Evaluation of Yield-to-Pedestrian Channelizing Devices Appendix C: “After” Training Presentation
69

Appendix C: “After” Training Presentation Safety Evaluation of Yield-to-Pedestrian Channelizing Devices
70

Safety Evaluation of Yield-to-Pedestrian Channelizing Devices Appendix C: “After” Training Presentation
71

Appendix D: Summary of Observational Data Safety Evaluation of Yield-to-Pedestrian Channelizing Devices
72
APPENDIX D: SUMMARY OF OBSERVATIONAL DATA % of Motorists Yielding
Community / Location Testing Period Num
ber o
f mot
oris
ts w
ho y
ield
ed to
pe
dest
rians
whe
n cr
ossi
ng w
ithin
50
feet
of
the
cros
swal
k
Num
ber o
f mot
oris
ts w
ho a
ppro
ache
d w
hile
a p
edes
trian
was
wai
ting
to c
ross
ing
Pct.
of m
otor
ists
who
yie
lded
to p
eds
whe
n cr
ossi
ng w
ithin
50
ft of
cro
ssw
alk
Cro
ssin
gs in
itiat
ed w
hile
a m
otor
ist
appr
oach
ed th
e cr
ossw
alk
Cro
ssin
gs in
whi
ch th
e fir
st a
ppro
achi
ng
mot
oris
t yie
lded
to p
eds
Pct.
of c
ross
ings
in w
hich
firs
t mot
oris
t yi
elde
d
Cro
ssin
gs in
whi
ch o
ther
than
the
first
ap
proa
chin
g m
otor
ist y
ield
ed to
ped
s
Cro
ssin
gs in
whi
ch n
o ap
proa
chin
g m
otor
ists
yie
lded
to p
eds
Pct.
of c
ross
ings
in w
hich
eith
er fi
rst
mot
oris
t yie
lded
or n
o m
otor
ist y
ield
ed
Before 28 84 33% 81 33 41% 2 46 98%After 63 92 68% 106 78 74% 0 28 100%Before 30 92 33% 100 35 35% 0 65 100%After 28 94 30% 84 43 51% 1 40 99%Before 12 110 11% 74 8 11% 5 61 93%After 20 191 10% 126 46 37% 0 80 100%Before 3 46 7% 38 5 13% 0 33 100%After 4 48 8% 19 4 21% 0 15 100%Before 2 30 7% 13 2 15% 0 11 100%After 0 17 0% 14 0 0% 0 14 100%Before 3 7 43% 11 6 55% 0 5 100%After 17 18 94% 52 51 98% 0 1 100%Before 2 51 4% 10 0 0% 2 8 80%After 17 42 40% 28 14 50% 8 6 71%Before 6 22 27% 35 10 29% 0 25 100%After 9 61 15% 59 42 71% 2 15 97%Before 24 1,235 2% 80 11 14% 10 59 88%After 36 410 9% 67 18 27% 7 42 90%Before 60 143 42% 132 73 55% 0 59 100%After 26 89 29% 71 32 45% 0 39 100%Before 2 11 18% 14 2 14% 0 12 100%After 8 39 21% 41 12 29% 1 28 98%Before 0 5 0% 5 0 0% 0 5 100%After 1 2 50% 3 0 0% 0 3 100%Before 5 5 100% 7 7 100% 0 0 100%After 3 4 75% 5 4 80% 0 1 100%Before 0 1 0% 2 0 0% 0 2 100%After 0 2 0% 1 0 0% 0 1 100%Before 0 17 0% 8 0 0% 3 5 63%After 0 2 0% 2 0 0% 0 2 100%Before 2 6 33% 6 2 33% 1 3 83%After 2 7 29% 5 3 60% 0 2 100%Before 30 117 26% 214 132 62% 8 74 96%After 0 0 N/A 0 0 N/A 0 0 N/ABefore 23 106 22% 103 24 23% 2 77 98%After 20 204 10% 72 24 33% 6 42 92%Before 2 158 1% 46 1 2% 1 44 98%After 13 52 25% 24 10 42% 5 9 79%Before 1 55 2% 14 1 7% 0 13 100%After 3 13 23% 6 4 67% 0 2 100%Before 5 75 7% 73 3 4% 3 67 96%After 14 41 34% 36 15 42% 0 21 100%Before 0 0 N/A 0 0 N/A 0 0 N/AAfter 0 0 N/A 0 0 N/A 0 0 N/ABefore 0 6 0% 3 0 0% 0 3 100%After 0 2 N/A 4 0 0% 0 4 100%
Spillover
High / Nields (Evening) Direct
Wes
t Che
ster
High / University Direct
High / Nields Direct
High / Sharpless Spillover
New (Nields) Direct
New (Athletic Fields)
Direct
Adams Spillover
Beech Direct
Brookline (Evening) Spillover
Potts
tow
n
Farmington/8th Direct
Hanover/Oak Spillover
Charlotte/Grace Spillover
State/8th
Ardmore Junction Direct
Brookline Spillover
Direct
CVS Spillover
Hav
erfo
rd T
owns
hip Coopertown / Highland Direct
Darby / Hillcrest Direct
Darby / Fairfield Spillover
Man
ayun
k
Levering Direct
Grape Direct
Lock Spillover
Tennis Center

Safety Evaluation of Yield-to-Pedestrian Channelizing Devices Appendix D: Summary of Observational Data
73
% of Motorists Yielding
Community / Location Testing Period Num
ber o
f mot
oris
ts w
ho y
ield
ed to
ped
estri
ans
whe
n cr
ossi
ng w
ithin
50
feet
of t
he c
ross
wal
k
Num
ber o
f mot
oris
ts w
ho a
ppro
ache
d w
hile
a
pede
stria
n w
as w
aitin
g to
cro
ssin
g
Pct
. of m
otor
ists
who
yie
lded
to p
eds
whe
n cr
ossi
ng
with
in 5
0 ft
of c
ross
wal
k
Cro
ssin
gs in
itiat
ed w
hile
a m
otor
ist a
ppro
ache
d th
e cr
ossw
alk
Cro
ssin
gs in
whi
ch th
e fir
st a
ppro
achi
ng m
otor
ist
yiel
ded
to p
eds
Pct
. of c
ross
ings
in w
hich
firs
t mot
oris
t yie
lded
Cro
ssin
gs in
whi
ch o
ther
than
the
first
app
roac
hing
m
otor
ist y
ield
ed to
ped
s
Cro
ssin
gs in
whi
ch n
o ap
proa
chin
g m
otor
ists
yie
lded
to
ped
s
Pct
. of c
ross
ings
in w
hich
eith
er fi
rst m
otor
ist y
ield
ed
or n
o m
otor
ist y
ield
ed
Before 88 520 17% 364 99 27% 10 255 97%After 159 506 31% 371 220 59% 20 131 95%Before 24 193 12% 132 26 20% 5 101 96%After 35 271 13% 197 96 49% 2 99 99%Before 3 7 43% 11 6 55% 0 5 100%After 17 18 94% 52 51 98% 0 1 100%Before 5 5 100% 7 7 100% 0 0 100%After 3 4 75% 5 4 80% 0 1 100%Before 85 513 17% 353 93 26% 10 250 97%After 142 488 29% 319 169 53% 20 130 94%Before 19 188 10% 125 19 15% 5 101 96%After 32 267 12% 192 92 48% 2 98 99%Before 62 1,473 4% 405 151 37% 21 233 95%After 54 499 11% 122 37 30% 7 78 94%Before 32 1,356 2% 191 19 10% 13 159 93%After 54 499 11% 122 37 30% 7 78 94%Before 64 179 36% 151 77 51% 1 73 99%After 28 113 25% 90 35 39% 0 55 100%Before 61 222 27% 219 73 33% 2 144 99%After 95 234 41% 209 125 60% 1 83 100%Before 14 140 10% 87 10 11% 5 72 94%After 20 208 10% 140 46 33% 0 94 100%Before 29 1,293 2% 101 17 17% 12 72 88%After 70 470 15% 147 83 56% 15 49 90%Before 66 165 40% 167 83 50% 0 84 100%After 35 150 23% 130 74 57% 2 54 98%Before 30 139 22% 227 132 58% 11 84 95%After 1 4 25% 5 0 0% 0 5 100%Before 0 22 0% 13 0 0% 3 10 77%After 1 4 25% 5 0 0% 0 5 100%Before 7 12 58% 15 9 60% 1 5 93%After 5 13 38% 11 7 64% 0 4 100%Before 30 339 9% 222 28 13% 6 188 97%After 47 297 16% 132 49 37% 11 72 92%Before 1 55 2% 14 1 7% 0 13 100%After 3 13 23% 6 4 67% 0 2 100%Before 150 1,993 8% 769 250 33% 31 488 96%After 213 1,005 21% 493 257 52% 27 209 95%Before 88 372 24% 283 103 36% 6 174 98%After 63 384 16% 287 131 46% 2 154 99%Before 2 158 1% 46 1 2% 1 44 98%After 13 52 25% 24 10 42% 5 9 79%Before 60 143 42% 132 73 55% 0 59 100%After 26 89 29% 71 32 45% 0 39 100%Before 0 6 0% 3 0 0% 0 3 100%After 0 2 0% 4 0 0% 0 4 100%Before 2 17 12% 17 2 12% 0 15 100%After 8 41 20% 45 12 27% 1 32 98%Evening Without Spillover
Daytime Without Spillover
Evening With Direct
Locations Without YTPCD Spillover
Daytime With Direct
West Chester Without Spillover
Locations With YTPCD Direct
Pottstown Without Spillover
West Chester With Direct
Pottstown With Direct
Pottstown With (no Beech) Direct
Haverford With Direct
Haverford Without Spillover
Manayunk With Direct
Manayunk Without Spillover
Mid-Blocks With YTPCD (no Beech) Direct
Mid-Blocks Without YTPCD Spillover
Partial Stop Control Without YTPCD Spillover
Mid-Blocks With YTPCD Direct
All-Way Stop Control Without YTPCD Spillover
Partial Stop Control With YTPCD Direct
Sum
mar
ies
Intersections With YTPCD Direct
Intersections Without YTPCD Spillover
All-Way Stop Control With YTPCD Direct

Appendix D: Summary of Observational Data Safety Evaluation of Yield-to-Pedestrian Channelizing Devices
74
% of Pedestrians Yielding
Community / Location Testing Period Num
ber o
f ped
estri
ans
who
yi
elde
d to
mot
oris
ts w
hen
cros
sing
with
in 5
0 fe
et o
f the
cr
ossw
alk
Num
ber o
f ped
estri
ans
cros
sing
whi
le a
mot
oris
t ap
proa
ched
Pct
. of p
eds
who
yie
lded
to
mot
oris
ts w
hen
cros
sing
w
ithin
50
ft of
cro
ssw
alk
Before 51 81 63%After 39 106 37%Before 35 99 35%After 58 84 69%Before 66 73 90%After 81 126 64%Before 34 38 89%After 16 19 84%Before 11 13 85%After 14 14 100%Before 5 11 45%After 19 52 37%Before 10 10 100%After 16 28 57%Before 26 35 74%After 46 59 78%Before 72 80 90%After 63 67 94%Before 80 132 61%After 35 71 49%Before 13 14 93%After 29 41 71%Before 4 5 80%After 2 3 67%Before 0 7 0%After 1 5 20%Before 2 2 100%After 1 1 100%Before 7 8 88%After 2 2 100%Before 4 6 67%After 2 5 40%Before 75 214 35%After 0 0 N/ABefore 99 103 96%After 49 72 68%Before 38 46 83%After 18 24 75%Before 14 14 100%After 2 6 33%Before 72 73 99%After 22 36 61%Before 0 0 N/AAfter 0 0 N/ABefore 3 3 100%After 4 4 N/A
Spillover
High / Nields (Evening) Direct
Wes
t Che
ster
High / University Direct
High / Nields Direct
High / Sharpless Spillover
New (Nields) Direct
New (Athletic Fields)
Direct
Adams Spillover
Beech Direct
Brookline (Evening) Spillover
Potts
tow
n
Farmington/8th Direct
Hanover/Oak Spillover
Charlotte/Grace Spillover
State/8th
Ardmore Junction Direct
Brookline Spillover
Direct
CVS Spillover
Hav
erfo
rd T
owns
hip Coopertown / Highland Direct
Darby / Hillcrest Direct
Darby / Fairfield Spillover
Man
ayun
k
Levering Direct
Grape Direct
Lock Spillover
Tennis Center

Safety Evaluation of Yield-to-Pedestrian Channelizing Devices Appendix D: Summary of Observational Data
75
% of Pedestrians Yielding
Community / Location Testing Period Num
ber o
f ped
estri
ans
who
yi
elde
d to
mot
oris
ts w
hen
cros
sing
with
in 5
0 fe
et o
f th
e cr
ossw
alk
Num
ber o
f ped
estri
ans
cros
sing
whi
le a
mot
oris
t ap
proa
ched
Pct
. of p
eds
who
yie
lded
to
mot
oris
ts w
hen
cros
sing
w
ithin
50
ft of
cro
ssw
alk
Before 249 363 69%After 203 371 55%Before 108 131 82%After 131 197 66%Before 5 11 45%After 19 52 37%Before 0 7 0%After 1 5 20%Before 244 352 69%After 184 319 58%Before 108 124 87%After 130 192 68%Before 253 405 62%After 101 122 83%Before 178 191 93%After 101 122 83%Before 95 151 63%After 51 90 57%Before 120 218 55%After 113 209 54%Before 77 86 90%After 95 140 68%Before 87 101 86%After 98 147 67%Before 106 167 63%After 81 130 62%Before 86 227 38%After 4 5 80%Before 11 13 85%After 4 5 80%Before 6 15 40%After 4 11 36%Before 209 222 94%After 89 132 67%Before 14 14 100%After 2 6 33%Before 502 768 65%After 304 493 62%Before 203 282 72%After 182 287 63%Before 38 46 83%After 18 24 75%Before 80 132 61%After 35 71 49%Before 3 3 100%After 4 4 100%Before 16 17 94%After 33 45 73%Evening Without Spillover
Daytime Without Spillover
Evening With Direct
Locations Without YTPCD Spillover
Daytime With Direct
West Chester Without Spillover
Locations With YTPCD Direct
Pottstown Without Spillover
West Chester With Direct
Pottstown With Direct
Pottstown With (no Beech) Direct
Haverford With Direct
Haverford Without Spillover
Manayunk With Direct
Manayunk Without Spillover
Mid-Blocks With YTPCD (no Beech) Direct
Mid-Blocks Without YTPCD Spillover
Partial Stop Control Without YTPCD Spillover
Mid-Blocks With YTPCD Direct
All-Way Stop Control Without YTPCD Spillover
Partial Stop Control With YTPCD Direct
Sum
mar
ies
Intersections With YTPCD Direct
Intersections Without YTPCD Spillover
All-Way Stop Control With YTPCD Direct
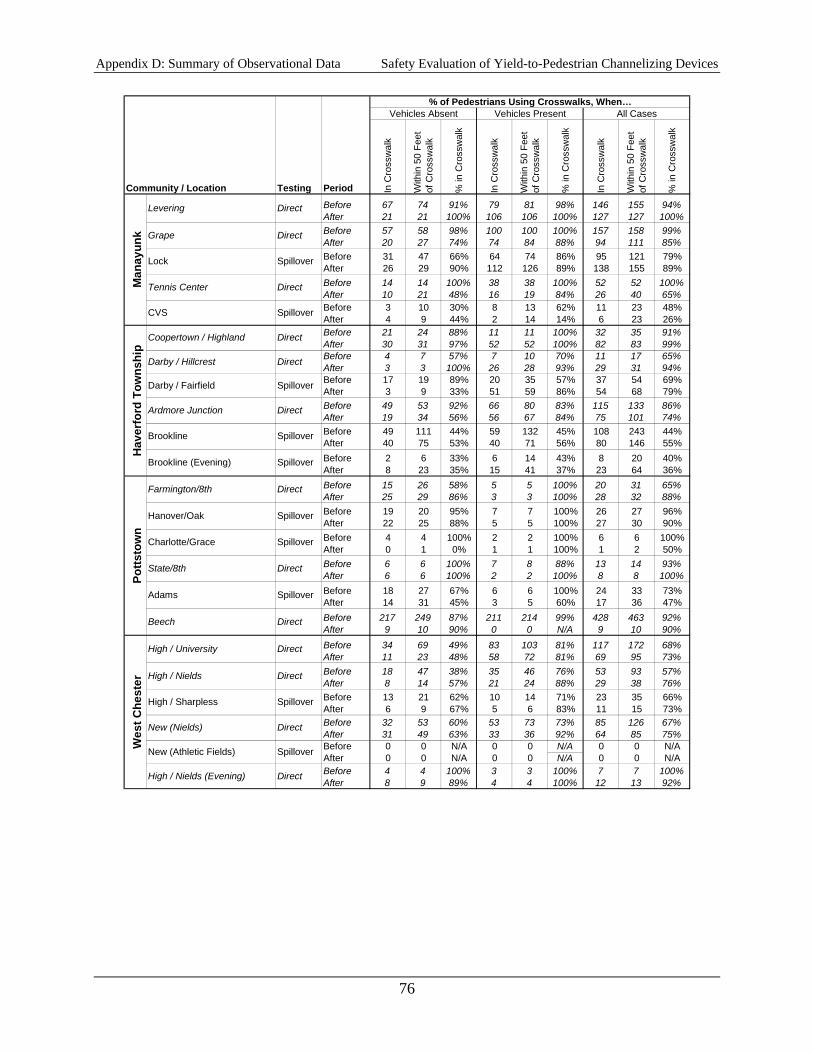
Appendix D: Summary of Observational Data Safety Evaluation of Yield-to-Pedestrian Channelizing Devices
76
% of Pedestrians Using Crosswalks, When…Vehicles Absent Vehicles Present All Cases
Community / Location Testing Period In C
ross
wal
k
With
in 5
0 Fe
et
of C
ross
wal
k
% in
Cro
ssw
alk
In C
ross
wal
k
With
in 5
0 Fe
et
of C
ross
wal
k
% in
Cro
ssw
alk
In C
ross
wal
k
With
in 5
0 Fe
et
of C
ross
wal
k
% in
Cro
ssw
alk
Before 67 74 91% 79 81 98% 146 155 94%After 21 21 100% 106 106 100% 127 127 100%Before 57 58 98% 100 100 100% 157 158 99%After 20 27 74% 74 84 88% 94 111 85%Before 31 47 66% 64 74 86% 95 121 79%After 26 29 90% 112 126 89% 138 155 89%Before 14 14 100% 38 38 100% 52 52 100%After 10 21 48% 16 19 84% 26 40 65%Before 3 10 30% 8 13 62% 11 23 48%After 4 9 44% 2 14 14% 6 23 26%Before 21 24 88% 11 11 100% 32 35 91%After 30 31 97% 52 52 100% 82 83 99%Before 4 7 57% 7 10 70% 11 17 65%After 3 3 100% 26 28 93% 29 31 94%Before 17 19 89% 20 35 57% 37 54 69%After 3 9 33% 51 59 86% 54 68 79%Before 49 53 92% 66 80 83% 115 133 86%After 19 34 56% 56 67 84% 75 101 74%Before 49 111 44% 59 132 45% 108 243 44%After 40 75 53% 40 71 56% 80 146 55%Before 2 6 33% 6 14 43% 8 20 40%After 8 23 35% 15 41 37% 23 64 36%Before 15 26 58% 5 5 100% 20 31 65%After 25 29 86% 3 3 100% 28 32 88%Before 19 20 95% 7 7 100% 26 27 96%After 22 25 88% 5 5 100% 27 30 90%Before 4 4 100% 2 2 100% 6 6 100%After 0 1 0% 1 1 100% 1 2 50%Before 6 6 100% 7 8 88% 13 14 93%After 6 6 100% 2 2 100% 8 8 100%Before 18 27 67% 6 6 100% 24 33 73%After 14 31 45% 3 5 60% 17 36 47%Before 217 249 87% 211 214 99% 428 463 92%After 9 10 90% 0 0 N/A 9 10 90%Before 34 69 49% 83 103 81% 117 172 68%After 11 23 48% 58 72 81% 69 95 73%Before 18 47 38% 35 46 76% 53 93 57%After 8 14 57% 21 24 88% 29 38 76%Before 13 21 62% 10 14 71% 23 35 66%After 6 9 67% 5 6 83% 11 15 73%Before 32 53 60% 53 73 73% 85 126 67%After 31 49 63% 33 36 92% 64 85 75%Before 0 0 N/A 0 0 N/A 0 0 N/AAfter 0 0 N/A 0 0 N/A 0 0 N/ABefore 4 4 100% 3 3 100% 7 7 100%After 8 9 89% 4 4 100% 12 13 92%
Spillover
High / Nields (Evening) Direct
Wes
t Che
ster
High / University Direct
High / Nields Direct
High / Sharpless Spillover
New (Nields) Direct
New (Athletic Fields)
Direct
Adams Spillover
Beech Direct
Brookline (Evening) Spillover
Potts
tow
n
Farmington/8th Direct
Hanover/Oak Spillover
Charlotte/Grace Spillover
State/8th
Ardmore Junction Direct
Brookline Spillover
Direct
CVS Spillover
Hav
erfo
rd T
owns
hip
Coopertown / Highland Direct
Darby / Hillcrest Direct
Darby / Fairfield Spillover
Man
ayun
k
Levering Direct
Grape Direct
Lock Spillover
Tennis Center
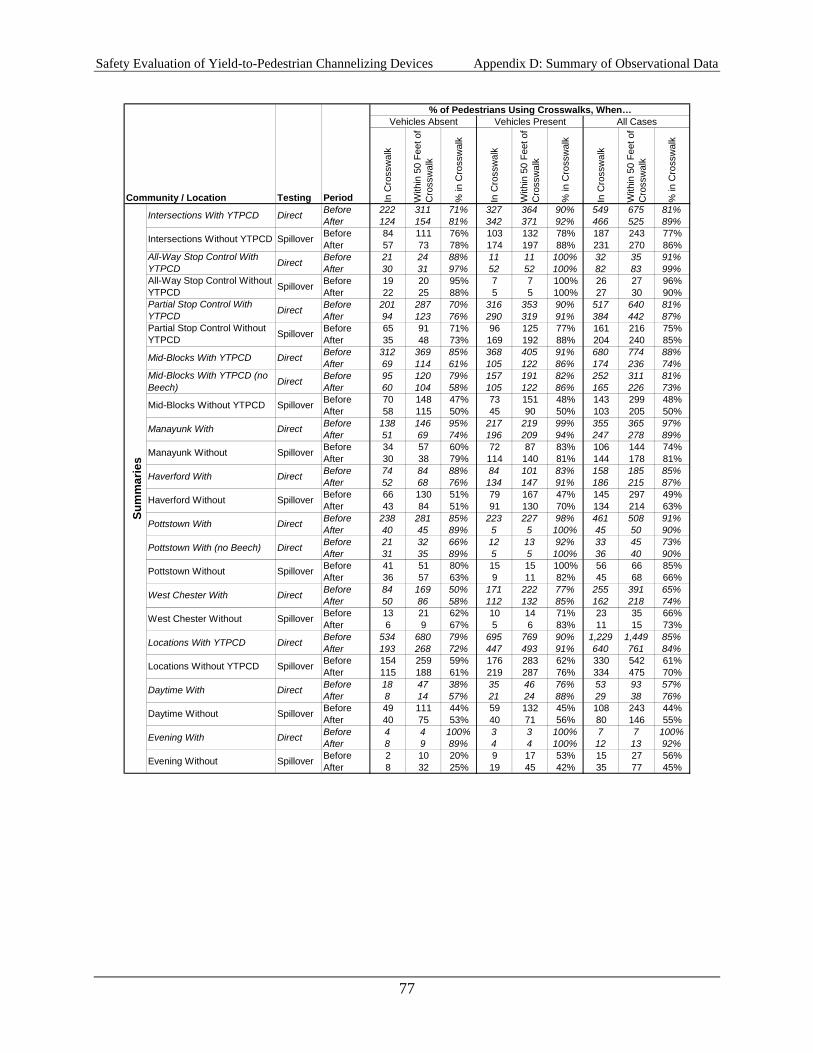
Safety Evaluation of Yield-to-Pedestrian Channelizing Devices Appendix D: Summary of Observational Data
77
% of Pedestrians Using Crosswalks, When…Vehicles Absent Vehicles Present All Cases
Community / Location Testing Period In C
ross
wal
k
With
in 5
0 Fe
et o
f C
ross
wal
k
% in
Cro
ssw
alk
In C
ross
wal
k
With
in 5
0 Fe
et o
f C
ross
wal
k
% in
Cro
ssw
alk
In C
ross
wal
k
With
in 5
0 Fe
et o
f C
ross
wal
k
% in
Cro
ssw
alk
Before 222 311 71% 327 364 90% 549 675 81%After 124 154 81% 342 371 92% 466 525 89%Before 84 111 76% 103 132 78% 187 243 77%After 57 73 78% 174 197 88% 231 270 86%Before 21 24 88% 11 11 100% 32 35 91%After 30 31 97% 52 52 100% 82 83 99%Before 19 20 95% 7 7 100% 26 27 96%After 22 25 88% 5 5 100% 27 30 90%Before 201 287 70% 316 353 90% 517 640 81%After 94 123 76% 290 319 91% 384 442 87%Before 65 91 71% 96 125 77% 161 216 75%After 35 48 73% 169 192 88% 204 240 85%Before 312 369 85% 368 405 91% 680 774 88%After 69 114 61% 105 122 86% 174 236 74%Before 95 120 79% 157 191 82% 252 311 81%After 60 104 58% 105 122 86% 165 226 73%Before 70 148 47% 73 151 48% 143 299 48%After 58 115 50% 45 90 50% 103 205 50%Before 138 146 95% 217 219 99% 355 365 97%After 51 69 74% 196 209 94% 247 278 89%Before 34 57 60% 72 87 83% 106 144 74%After 30 38 79% 114 140 81% 144 178 81%Before 74 84 88% 84 101 83% 158 185 85%After 52 68 76% 134 147 91% 186 215 87%Before 66 130 51% 79 167 47% 145 297 49%After 43 84 51% 91 130 70% 134 214 63%Before 238 281 85% 223 227 98% 461 508 91%After 40 45 89% 5 5 100% 45 50 90%Before 21 32 66% 12 13 92% 33 45 73%After 31 35 89% 5 5 100% 36 40 90%Before 41 51 80% 15 15 100% 56 66 85%After 36 57 63% 9 11 82% 45 68 66%Before 84 169 50% 171 222 77% 255 391 65%After 50 86 58% 112 132 85% 162 218 74%Before 13 21 62% 10 14 71% 23 35 66%After 6 9 67% 5 6 83% 11 15 73%Before 534 680 79% 695 769 90% 1,229 1,449 85%After 193 268 72% 447 493 91% 640 761 84%Before 154 259 59% 176 283 62% 330 542 61%After 115 188 61% 219 287 76% 334 475 70%Before 18 47 38% 35 46 76% 53 93 57%After 8 14 57% 21 24 88% 29 38 76%Before 49 111 44% 59 132 45% 108 243 44%After 40 75 53% 40 71 56% 80 146 55%Before 4 4 100% 3 3 100% 7 7 100%After 8 9 89% 4 4 100% 12 13 92%Before 2 10 20% 9 17 53% 15 27 56%After 8 32 25% 19 45 42% 35 77 45%Evening Without Spillover
Daytime Without Spillover
Evening With Direct
Locations Without YTPCD Spillover
Daytime With Direct
West Chester Without Spillover
Locations With YTPCD Direct
Pottstown Without Spillover
West Chester With Direct
Pottstown With Direct
Pottstown With (no Beech) Direct
Haverford With Direct
Haverford Without Spillover
Manayunk With Direct
Manayunk Without Spillover
Mid-Blocks With YTPCD (no Beech) Direct
Mid-Blocks Without YTPCD Spillover
Partial Stop Control Without YTPCD Spillover
Mid-Blocks With YTPCD Direct
All-Way Stop Control Without YTPCD Spillover
Partial Stop Control With YTPCD Direct
Sum
mar
ies
Intersections With YTPCD Direct
Intersections Without YTPCD Spillover
All-Way Stop Control With YTPCD Direct
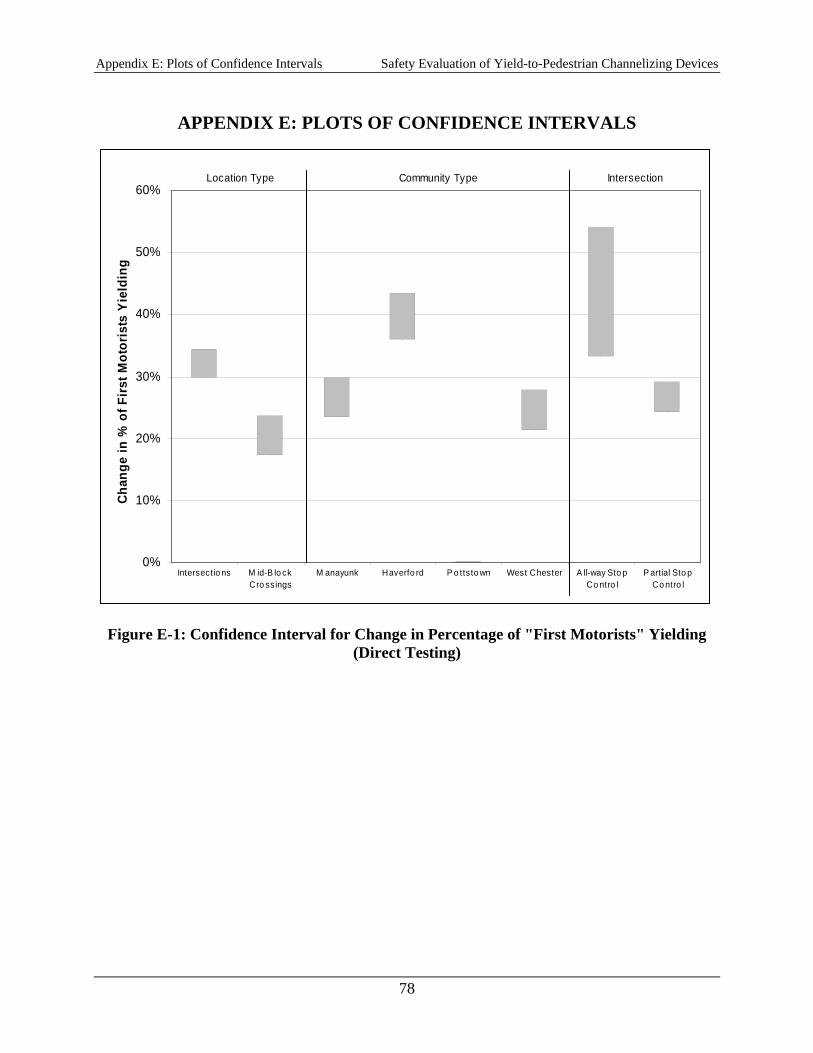
Appendix E: Plots of Confidence Intervals Safety Evaluation of Yield-to-Pedestrian Channelizing Devices
78
APPENDIX E: PLOTS OF CONFIDENCE INTERVALS
0%
10%
20%
30%
40%
50%
60%
Intersectio ns M id-B lo ckCro ssings
M anayunk Haverfo rd P o ttsto wn West Chester A ll-way Sto pCo ntro l
P artial Sto pCo ntro l
Cha
nge
in %
of F
irst M
otor
ists
Yie
ldin
g
Location Type Community Type Intersection
Figure E-1: Confidence Interval for Change in Percentage of "First Motorists" Yielding (Direct Testing)

Safety Evaluation of Yield-to-Pedestrian Channelizing Devices Appendix E: Plots of Confidence Intervals
79
-35%
-30%
-25%
-20%
-15%
-10%
-5%
0%
5%
10%
15%
Intersectio ns M id-B lo ckCro ssings
M anayunk Haverfo rd P o ttsto wn West Chester A ll-way Sto pCo ntro l
P artial Sto pCo ntro l
Cha
nge
in %
of P
edes
trian
s Yi
eldi
ngLocation Type Community Type Intersection
Figure E-2: Confidence Interval for Change in Percentage of Pedestrians Yielding (Direct Testing)
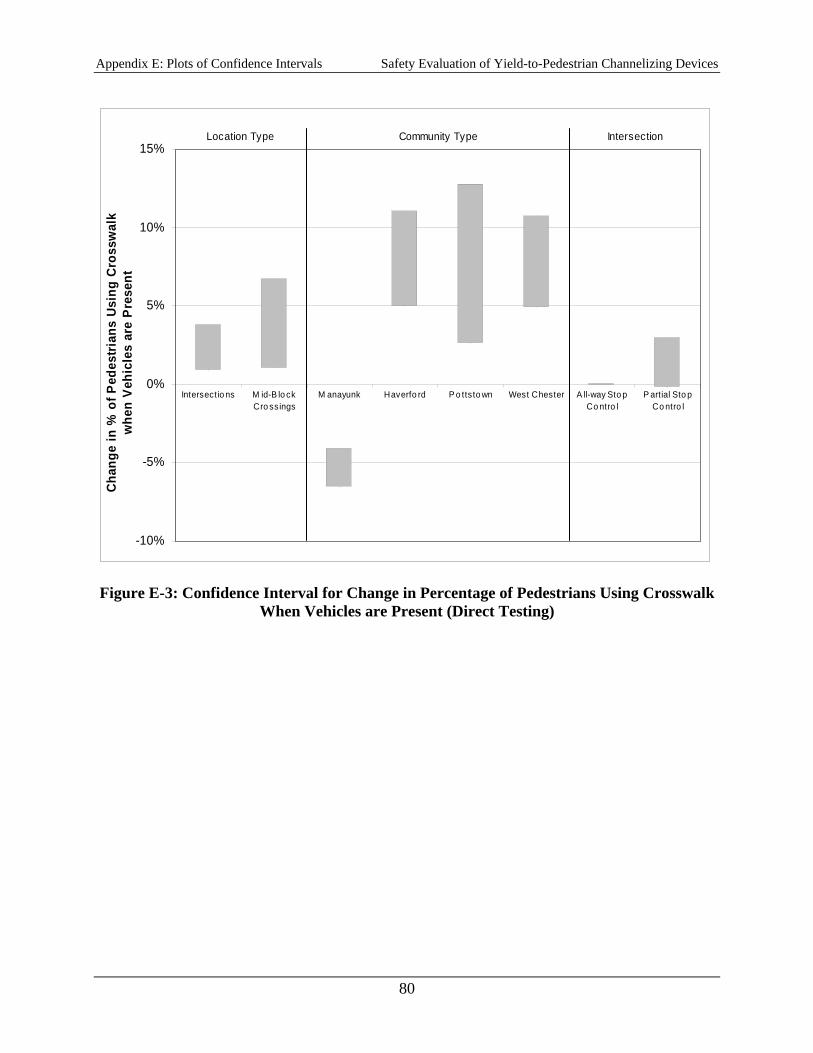
Appendix E: Plots of Confidence Intervals Safety Evaluation of Yield-to-Pedestrian Channelizing Devices
80
-10%
-5%
0%
5%
10%
15%
Intersectio ns M id-B lo ckCro ssings
M anayunk Haverfo rd P o ttsto wn West Chester A ll-way Sto pCo ntro l
P artial Sto pCo ntro l
Cha
nge
in %
of P
edes
tria
ns U
sing
Cro
ssw
alk
whe
n V
ehic
les
are
Pre
sent
Location Type Community Type Intersection
Figure E-3: Confidence Interval for Change in Percentage of Pedestrians Using Crosswalk When Vehicles are Present (Direct Testing)

Safety Evaluation of Yield-to-Pedestrian Channelizing Devices Appendix E: Plots of Confidence Intervals
81
-40%
-20%
0%
20%
40%
60%
80%
Intersectio ns M id-B lo ckCro ssings
M anayunk Haverfo rd P o ttsto wn West Chester A ll-way Sto pCo ntro l
P artial Sto pCo ntro l
Chan
ge in
% o
f Firs
t Mot
oris
ts Y
ield
ing
Location Type Community Type Intersection
Figure E-4: Confidence Interval for Change in Percentage of "First Motorists" Yielding (Spillover Effects)
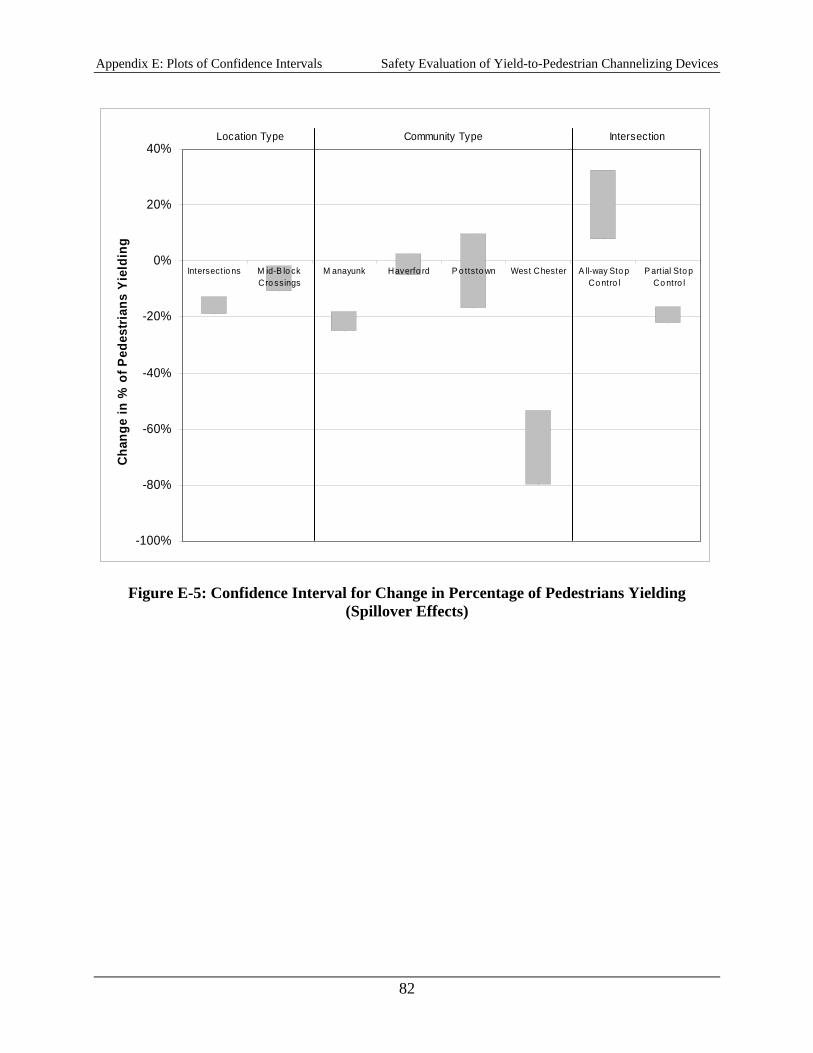
Appendix E: Plots of Confidence Intervals Safety Evaluation of Yield-to-Pedestrian Channelizing Devices
82
-100%
-80%
-60%
-40%
-20%
0%
20%
40%
Intersectio ns M id-B lo ckCro ssings
M anayunk Haverfo rd P o ttsto wn West Chester A ll-way Sto pCo ntro l
P artial Sto pCo ntro l
Cha
nge
in %
of P
edes
trian
s Yi
eldi
ngLocation Type Community Type Intersection
Figure E-5: Confidence Interval for Change in Percentage of Pedestrians Yielding (Spillover Effects)
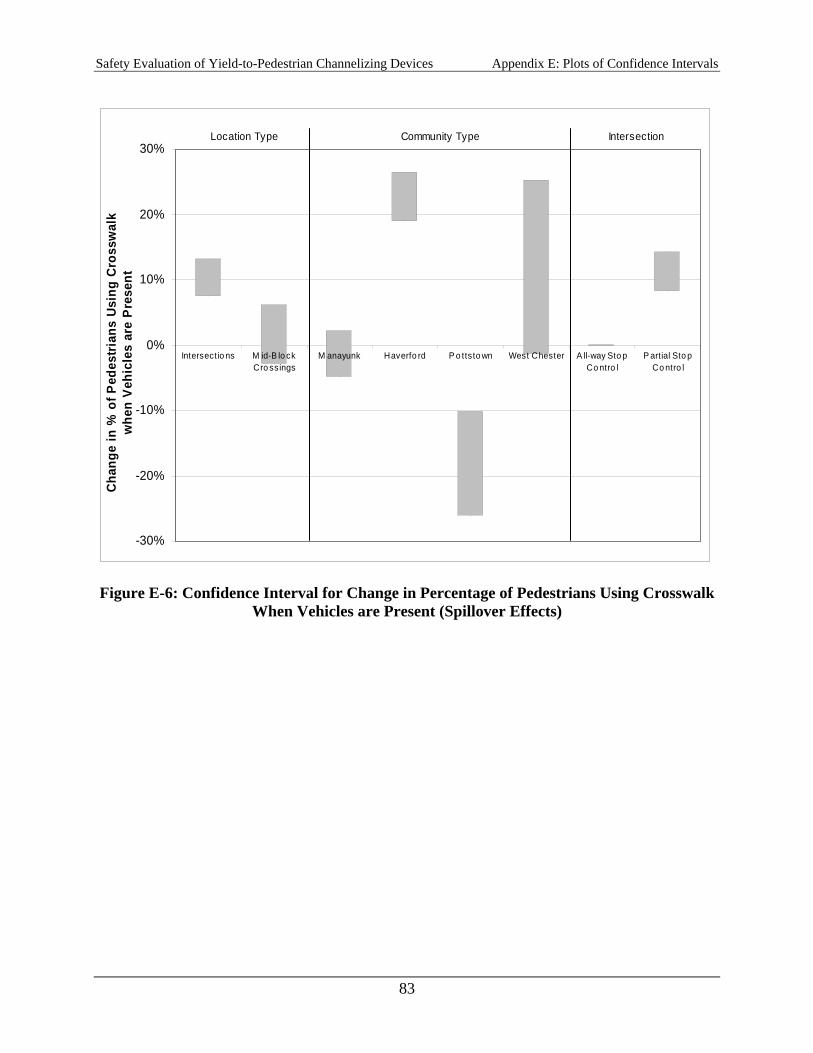
Safety Evaluation of Yield-to-Pedestrian Channelizing Devices Appendix E: Plots of Confidence Intervals
83
-30%
-20%
-10%
0%
10%
20%
30%
Intersectio ns M id-B lo ckCro ssings
M anayunk Haverfo rd P o ttsto wn West Chester A ll-way Sto pCo ntro l
P artial Sto pCo ntro l
Cha
nge
in %
of P
edes
tria
ns U
sing
Cro
ssw
alk
whe
n V
ehic
les
are
Pre
sent
Location Type Community Type Intersection
Figure E-6: Confidence Interval for Change in Percentage of Pedestrians Using Crosswalk When Vehicles are Present (Spillover Effects)
