safety in european gas transmission pipelines egig: european gas
TRANSCRIPT

23rd World Gas Conference, Amsterdam 2006
SAFETY IN EUROPEAN GAS TRANSMISSION PIPELINES EGIG: EUROPEAN GAS PIPELINE INCIDENT DATA GROUP
Main author
D. van den Brand, N.V. Nederlandse Gasunie, Groningen, The Netherlands
Co-author
K.H. Kutrowski,
N.V. Nederlandse Gasunie, Groningen, The Netherlands

ABSTRACT
The use of pipelines for the transport of large quantities of natural gas to industry and to commercial and domestic consumers represents a safe mode of transport in terms of impact on the environment and human health. As a general policy the natural gas industry strives to achieve one main objective: the construction, operation and maintenance of safe pipeline systems.
In 1982 six European gas transmission system operators took the initiative to gather data on the unintentional releases of gas in their transmission pipelines systems. This cooperation was formalised by the setting up of EGIG (European Gas pipeline Incident data Group). The objective of this initiative was to provide a broad basis for statistical use, thus providing a more realistic picture of the frequencies and probabilities of incidents than would have been possible with the independent data of each company considered separately. Nowadays, EGIG is a cooperation of twelve major gas transmission system operators in Europe and it is the owner of an extensive database of pipeline incident data collected since 1970.
Uniform definitions have been used consistently over the entire period. Consequently, on condition that the data is correctly used and interpreted, the EGIG database gives useful information about trends which have developed over the years. Indeed, the EGIG report demonstrates the safety performances of the existing transmission pipeline system in Europe and also provides a broad basis for statistical use.
This paper introduces the EGIG database and presents the most important data analyses and their results. The results of the analyses are commented on and give the most interesting information that can be extracted from the database. Linking of results of different analyses takes place when possible.

TABLE OF CONTENTS
Abstract Introduction 1. EGIG database 2. Analyses and results
2.1 Trends of the European gas transmission system 2.2 Failure frequencies analyses 2.3 Detection of incidents 2.4 Ignition probability
Conclusion References
INTRODUCTION The use of pipelines for the transport of large quantities of natural gas to industry and to commercial and domestic consumers represents a safe mode of transport in terms of impact on the environment and human health. The safety and the protection of the environment are constant objectives in the policies about construction, operation and maintenance of pipeline systems of the European natural gas industry. One way to monitor the safety of pipeline systems is to collect and analyze the data concerning the unintentional gas releases. In 1982 six European gas transmission system operators took the initiative to gather data on the unintentional releases of gas in their transmission pipelines systems. This cooperation was formalised by the setting up of EGIG (European Gas pipeline Incident data Group). The objective of this initiative was to provide a broad basis for statistical use, thus providing a more realistic picture of the frequencies and probabilities of incidents than would have been possible with the independent data of each company considered separately. Nowadays, EGIG is a cooperation of twelve major gas transmission system operators in Europe and it is the owner of an extensive database of pipeline incident data collected since 1970. In the period between 2001 and 2004 three new major gas transmission companies from Czech Republic, Portugal and Finland has become an EGIG member. The participating companies are nowadays the following:
- DONG (Denmark) - ENAGAS, S.A. (Spain) - Fluxys (Belgium) - Gasum (Finland) - N.V. Nederlandse Gasunie (The Netherlands) - Gaz de France Réseau Transport SA (France) - Ruhrgas AG (Germany) - SNAM Rete Gas (Italy) - SWISSGAS (Switzerland)
- National Grid∗ (UK) - Transgas (Czech Republic) - Transgas (Portugal)
Considering the number of participants, the extent of the pipeline systems and the exposure period involved, the EGIG database is a valuable and reliable source of information. In 2004 the total system exposure was equal to 2.77 million km.yr. This paper is based on the official sixth EGIG report [1] covering the period 1970-2004. It introduces the EGIG database and presents different analyses and their results. The results of the analyses are commented on and give the most interesting information that can be extracted from the database. Linking of results of different analyses takes place when possible. The EGIG report is annually updated and is available on the following internet site: www.EGIG.nl.
∗ was Transco, part of National Grid Transco, at time of data collection

1. EGIG DATABASE The objective of the EGIG database is to get and maintain a valuable and reliable source of information about incident data on natural gas transmission pipelines, which gives the opportunity to demonstrate the continuing high safety level of the European gas transmission pipelines system and to provide a broad basis for statistical use. The required criteria for an incident to be recorded in the EGIG database are the following:
- The incident must lead to an unintentional gas release, - The pipeline must fulfil the following conditions:
� To be made of steel � To be onshore � To have a design pressure higher than 15 bar � To be located outside the fences of the installations
Incidents on production lines or involving equipments or components (e.g. valve, compressor) are not recorded in the EGIG database. The EGIG database contains general information about the major European gas transmission pipelines system as well as specific information about the incidents. General information about the pipeline system is given per year on pipeline length categorised according to:
- Diameter - Pressure - Year of construction - Type of coating - Cover - Grade of material - Wall thickness
Specific information about incident comprises:
- The characteristics of the pipeline on which the incident happened, namely the general information listed here above.
- The leak size: � Pinhole/crack: the diameter of the hole is smaller than or equal to 2 cm � Hole: the diameter of the hole is larger than 2 cm and smaller than or equal to the
diameter of the pipe � Rupture: the diameter of the hole is larger than the pipeline diameter.
- The initial cause of the incident � External interference � Corrosion � Construction defect/material failure � Hot tap made by error � Ground movement

� Other and unknown
- The occurrence (or non-occurrence) of ignition - The consequences - Information on the way the incident has been detected (e.g. contractor, landowner, patrol) - A free text for extra information. Additional information is also given for the individual cause:
- External interference:
� The activity having caused the incident (e.g. digging, piling, ground works) � The equipment involved in the incident (e.g. anchor, bulldozer, excavator, plough) � The installed protective measures (e.g. casing, sleeves)
- Corrosion: � The location (external, internal or unknown) � The corrosion type (galvanic, pitting, stress corrosion cracking “SCC” or unknown)
- Construction defect/material failure: � The type of defect (construction or material) � The defect details (hard spot, lamination, material, field weld or unknown) � The pipeline type (straight, field bend, factory bend)
- Ground movement: � The type of ground movement (dike break, erosion, flood, landslide, mining, river or
unknown). - Other and unknown:
� The sub-causes out of category such as design error, lightning, maintenance.
2. ANALYSES AND RESULTS The objective of data or statistical analysis is to interpret the information contained in the data in order to draw conclusions from the sample or the population from which the sample is taken. The statistical analyses about the safety level of the gas transmission pipelines system are based on the calculation of indicators such as failure frequency, (mean or deviation) and ignition probability. The failure frequency is calculated by dividing the number of incidents by the exposure. The EGIG report presents two kinds of failure frequencies, the primary and the secondary. They refer to the notions of total and partial exposure respectively. These notions are defined below.
- Exposure is the length of a pipeline and its exposed duration and is expressed in kilometres-years [km.yr]. Example: company A has a constant length of transmission pipelines over 5 years of 1,000 km. Its exposure is then 5 times 1,000 km, so 5,000 km.yr.
- The total system exposure is the exposure as defined above, calculated for the complete
system.
- The partial system exposures are the exposures calculated per design parameter, e.g. per diameter class or per depth of cover class.
The failure frequencies are calculated by dividing the number of incidents by a system exposure.

In order to distinguish safety improvements of the last period a 5-years moving average has been introduced. The 5-years moving average means that the calculations have been performed over the 5 previous years in question. Two statistical terms are also used in this paper, confidence interval and ageing analysis:
- A confidence interval gives an estimated range of values which is likely to include an unknown population parameter, the estimated range being calculated from a given set of sample data. A confidence interval at 95% means that there is 95% probability that the real value (so not the estimated one) of the failure frequency lies in this interval.
- Ageing is the process of growing old and showing the effects of increasing age. For EGIG purposes an ageing analysis has been carried out in order to study the impact of the age of the pipelines on their failure frequencies. This analysis was made by comparing the failure frequencies of different pipeline age categories.
2.1 Trends of the European gas transmission system This paragraph gives information on the European gas transmission system from 1970 up to the present. 2.1.1 Total length The total length of the European gas transmission pipelines system in EGIG is constantly increasing. In 2004 the annual length was equal to 122,168 km against 110,236 km in 2001. The evolution of the total length of the system is shown in figure 1.
0
20.000
40.000
60.000
80.000
100.000
120.000
140.000
1970
1971
1972
1973
1974
1975
1976
1977
1978
1979
1980
1981
1982
1983
1984
1985
1986
1987
1988
1989
1990
1991
1992
1993
1994
1995
1996
1997
1998
1999
2000
2001
2002
2003
2004
Year [-]
Length [km]
Figure 1: Total length of the European gas transmission system in EGIG
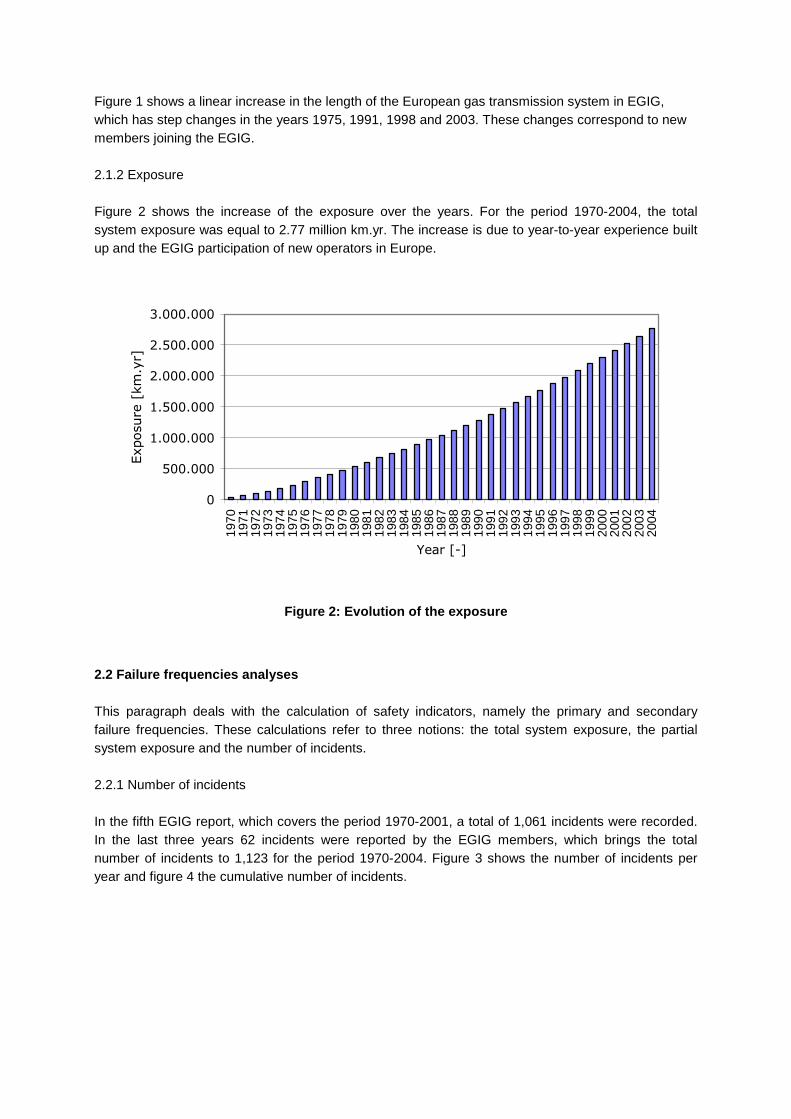
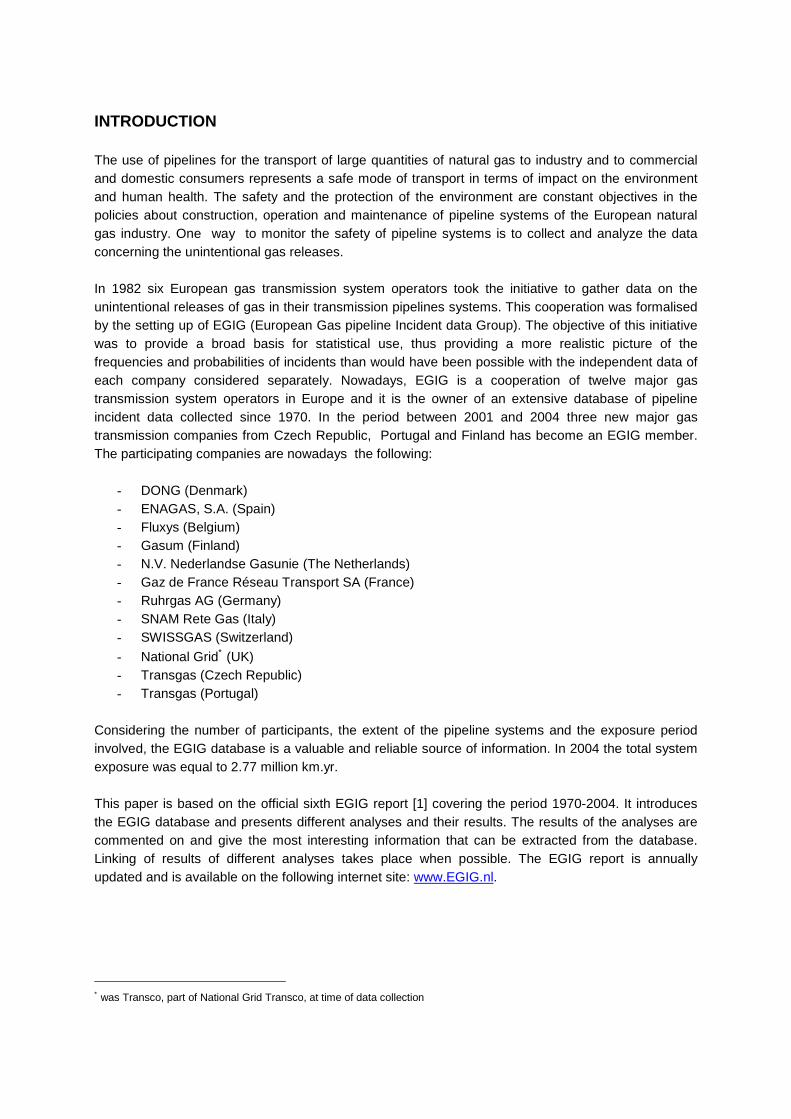
Figure 1 shows a linear increase in the length of the European gas transmission system in EGIG, which has step changes in the years 1975, 1991, 1998 and 2003. These changes correspond to new members joining the EGIG. 2.1.2 Exposure Figure 2 shows the increase of the exposure over the years. For the period 1970-2004, the total system exposure was equal to 2.77 million km.yr. The increase is due to year-to-year experience built up and the EGIG participation of new operators in Europe.
0
500.000
1.000.000
1.500.000
2.000.000
2.500.000
3.000.000
1970
1971
1972
1973
1974
1975
1976
1977
1978
1979
1980
1981
1982
1983
1984
1985
1986
1987
1988
1989
1990
1991
1992
1993
1994
1995
1996
1997
1998
1999
2000
2001
2002
2003
2004
Year [-]
Exposure [km.yr]
Figure 2: Evolution of the exposure
2.2 Failure frequencies analyses This paragraph deals with the calculation of safety indicators, namely the primary and secondary failure frequencies. These calculations refer to three notions: the total system exposure, the partial system exposure and the number of incidents. 2.2.1 Number of incidents In the fifth EGIG report, which covers the period 1970-2001, a total of 1,061 incidents were recorded. In the last three years 62 incidents were reported by the EGIG members, which brings the total number of incidents to 1,123 for the period 1970-2004. Figure 3 shows the number of incidents per year and figure 4 the cumulative number of incidents.

0
10
20
30
40
50
60
1970
1971
1972
1973
1974
1975
1976
1977
1978
1979
1980
1981
1982
1983
1984
1985
1986
1987
1988
1989
1990
1991
1992
1993
1994
1995
1996
1997
1998
1999
2000
2001
2002
2003
2004
Year [-]
Number of incidents [-]
Figure 3: Annual number of incidents
0
200
400
600
800
1.000
1.200
1970
1971
1972
1973
1974
1975
1976
1977
1978
1979
1980
1981
1982
1983
1984
1985
1986
1987
1988
1989
1990
1991
1992
1993
1994
1995
1996
1997
1998
1999
2000
2001
2002
2003
2004
Year [-]
Number of incidents [-]
Figure 4: Cumulative number of incidents
2.2.2 Primary failure frequencies The primary failure frequency is the result of the number of incidents within a period divided by the corresponding total system exposure. Depending on the period studied, the number of incidents varies and so does the total system exposure.
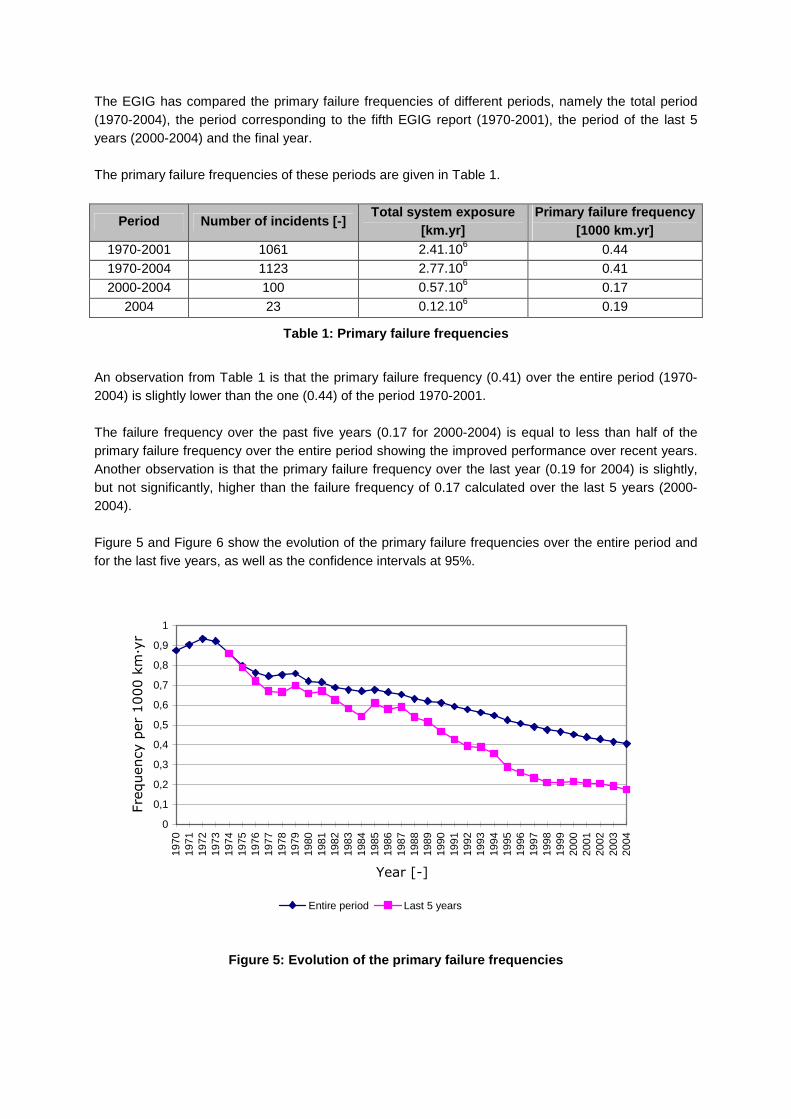
The EGIG has compared the primary failure frequencies of different periods, namely the total period (1970-2004), the period corresponding to the fifth EGIG report (1970-2001), the period of the last 5 years (2000-2004) and the final year. The primary failure frequencies of these periods are given in Table 1.
Period Number of incidents [-] Total system exposure
[km.yr] Primary failure frequency
[1000 km.yr] 1970-2001 1061 2.41.106 0.44 1970-2004 1123 2.77.106 0.41 2000-2004 100 0.57.106 0.17
2004 23 0.12.106 0.19
Table 1: Primary failure frequencies
An observation from Table 1 is that the primary failure frequency (0.41) over the entire period (1970-2004) is slightly lower than the one (0.44) of the period 1970-2001. The failure frequency over the past five years (0.17 for 2000-2004) is equal to less than half of the primary failure frequency over the entire period showing the improved performance over recent years. Another observation is that the primary failure frequency over the last year (0.19 for 2004) is slightly, but not significantly, higher than the failure frequency of 0.17 calculated over the last 5 years (2000-2004). Figure 5 and Figure 6 show the evolution of the primary failure frequencies over the entire period and for the last five years, as well as the confidence intervals at 95%.
0
0,1
0,2
0,3
0,4
0,5
0,6
0,7
0,8
0,9
1
1970
1971
1972
1973
1974
1975
1976
1977
1978
1979
1980
1981
1982
1983
1984
1985
1986
1987
1988
1989
1990
1991
1992
1993
1994
1995
1996
1997
1998
1999
2000
2001
2002
2003
2004
Year [-]
Frequency per 1000 km�yr
Entire period Last 5 years
Figure 5: Evolution of the primary failure frequencies

Figure 5 illustrates the steady drop of the primary failure frequencies and the failure frequencies of the 5 years moving average. The primary failure frequency over the entire period declined from 0.87 per 1,000 km.yr in 1970 to 0.41 per 1,000 km.yr in 2004. The moving average primary failure frequency over five years decreased by a factor 5 (0.86 to 0.17 per 1,000 km.yr).
0
0,2
0,4
0,6
0,8
1
1,2
1,4
1970
1971
1972
1973
1974
1975
1976
1977
1978
1979
1980
1981
1982
1983
1984
1985
1986
1987
1988
1989
1990
1991
1992
1993
1994
1995
1996
1997
1998
1999
2000
2001
2002
2003
2004
Year [-]
Frequency per 1,000.km�yr
Entire period Last 5 years
Figure 6: Primary failure frequencies and confidence intervals at 95%
Figure 6 shows the confidence intervals for the primary failure frequency. Remark A confidence interval is made to take uncertainty into account. We see that the greater the exposure, the smaller the interval, which, logically, means that the uncertainty decreases if the quantity of information increases. To calculate a confidence interval the population is assumed to have a known distribution. Most used and common distributions are Gauss’ law (normal distribution), Poisson’s law, the binomial distribution or the exponential one. The number of incidents, being a whole number (discrete,) is small in comparison to the exposure. The assumption is made that the number of incidents follows Poisson’s law, also called law of rare events. In 2004 the primary failure frequency over the entire period was equal to 0.41 per 1,000 km.yr with a 95% confidence interval of ± 0.02. The primary failure frequency over the last five years was, in 2004, equal to 0.17 per 1,000 km.yr with a 95% confidence interval of ± 0.03. Other interesting information is the distribution of the incidents per cause. Six different causes have been identified and are given below in association with the percentage of incidents they represent: External interference : 50% Construction defect / Material failure : 17% Corrosion : 15% Ground movement : 7% Hot-tap : 5% Other and unknown : 7%

0
10
20
30
40
50
60
External
Interference
Construction
defect./
Material
failure
Corrosion
Ground
movement
Hot-tap
made by
error
Other and
Unknown
Percentage %
Figure 7: Distribution of incidents per cause
Figure 8 and Figure 9 give respectively the primary failure frequencies for the entire period (up to the year) and for the last five years moving average per cause.
0
0,1
0,2
0,3
0,4
0,5
0,6
1970
1971
1972
1973
1974
1975
1976
1977
1978
1979
1980
1981
1982
1983
1984
1985
1986
1987
1988
1989
1990
1991
1992
1993
1994
1995
1996
1997
1998
1999
2000
2001
2002
2003
2004
Year [-]
Frequency per 1,000.km�yr
Construction/material Corrosion External interferenceGround movement Hot-tap by error Other/unknown
Figure 8: Primary failure frequencies per cause (up to the year)

0
0,1
0,2
0,3
0,4
0,5
0,6
1970
1971
1972
1973
1974
1975
1976
1977
1978
1979
1980
1981
1982
1983
1984
1985
1986
1987
1988
1989
1990
1991
1992
1993
1994
1995
1996
1997
1998
1999
2000
2001
2002
2003
2004
Year [-]
Frequency per1,000.km�yr
Construction/material Corrosion External interference
Ground movement Hot-tap by error Other/unknown
Figure 9: Primary failure frequencies per cause (5-years moving average)
Figure 8 and Figure 9 also illustrate the reducing failure frequency over the years. This has been due to technological developments, such as: welding, inspection, condition monitoring using in-line inspection and improved procedures for damage prevention and detection. As far as the cause of external interference is concerned, its associated primary failure frequency over the period 1970-2004 decreased to 0.20 per 1,000 km.yr while the 5-years moving average has levelled off at around 0.10 per 1,000 km.yr since 2000. However external interference remains the main cause of incidents. A further improvement in the prevention of external interference could be obtained through a more stringent enforcement of land use planning and the application of one-call systems for the digging activities of external parties. The EGIG was interested in the relation between the age of the pipelines and their failure frequencies. In other words, the EGIG wanted to know if old pipelines fail more often than younger ones. The influence of the age of the pipelines on their failure frequencies has been studied in the ageing analysis presented in Figure 10.

0
0,1
0,20,3
0,4
0,50,6
0,70,8
0,9
1
0 5 10 15 20 25 30 35 40 45 50 55Age at time of failure [year]F
requency per 1,000.km�year
Constr year < 54 Constr year 55-64 Constr year 65-74Constr year 75-83 Constr year 84-93
Figure 10: Ageing analysis (corrosion and construction defects)
Explanation Figure 10 Taking for instance a pipeline constructed in 1970 (Construction year 65-74), the failure frequency after 5 years (1975) will equal 0.15 whereas it will equal 0.08 after 30 years (2000). The first conclusion of Figure 10 is that early constructed pipelines have indeed a higher failure frequency than recently constructed pipelines. The second very important conclusion is that all failure frequencies irrespective of the age category are slightly decreasing in time. The EGIG has been interested in the relation between the causes and the damage size. Figure 11 illustrates the link between the causes and the type of incident in terms of size of leak.
0
0,05
0,1
0,15
0,2
0,25
External
Interference
Construction
defect./
Material failure
Corrosion Ground
movement
Hot-tap made
by error
Other and
Unknown
Cause
Frequency per 1,000.km.yr
Pinhole-crack Hole Rupture
Figure 11: Relation cause-size of leak
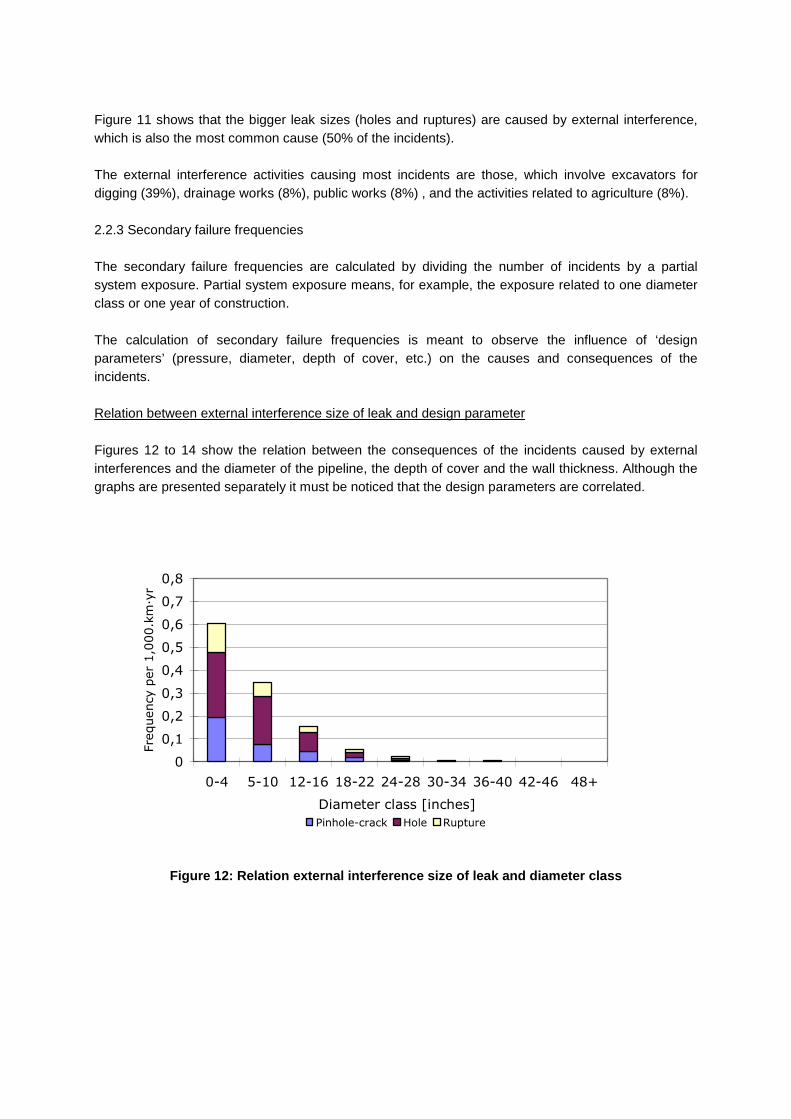
Figure 11 shows that the bigger leak sizes (holes and ruptures) are caused by external interference, which is also the most common cause (50% of the incidents). The external interference activities causing most incidents are those, which involve excavators for digging (39%), drainage works (8%), public works (8%) , and the activities related to agriculture (8%). 2.2.3 Secondary failure frequencies The secondary failure frequencies are calculated by dividing the number of incidents by a partial system exposure. Partial system exposure means, for example, the exposure related to one diameter class or one year of construction. The calculation of secondary failure frequencies is meant to observe the influence of ‘design parameters’ (pressure, diameter, depth of cover, etc.) on the causes and consequences of the incidents. Relation between external interference size of leak and design parameter Figures 12 to 14 show the relation between the consequences of the incidents caused by external interferences and the diameter of the pipeline, the depth of cover and the wall thickness. Although the graphs are presented separately it must be noticed that the design parameters are correlated.
0
0,1
0,2
0,3
0,4
0,5
0,6
0,7
0,8
0-4 5-10 12-16 18-22 24-28 30-34 36-40 42-46 48+
Diameter class [inches]
Frequency per 1,000.km�yr
Pinhole-crack Hole Rupture
Figure 12: Relation external interference size of leak and diameter class

0
0,02
0,04
0,06
0,08
0,1
0,12
0,14
0,16
0,18
0,2
80-100 100+
Cover class [cm]
Frequency per 1,000.km.yr
Pinhole-crack Hole Rupture
Figure 13: Relation external interference size of leak and depth of cover class
0
0,1
0,2
0,3
0,4
0,5
0,6
0,7
0,8
0-5 5-10 10-15Wall thickness class [mm]
Frequency per 1,000.km.yr
Pinhole-crack Hole Rupture
Figure 14: Relation external interference size of leak and wall thickness class
From these figures some general conclusions can be drawn. The first conclusion is that small diameter pipelines are more vulnerable to external interferences than bigger diameter pipelines. This can be explained by the fact that small diameter pipelines can be more easily hooked up during ground works than bigger pipelines, the second reason is that their resistance is often lower due to thinner wall thickness.

Relation between corrosion size of leak and design parameter Figures 15 to 17 show the relation between the leak sizes of the incidents caused by corrosion and the year of construction of the pipeline, the type of coating and the wall thickness.
0
0,05
0,1
0,15
0,2
0,25
0,3
<1954 1954-
1963
1964-
1973
1974-
1983
1984-
1993
1994-
2003
Year of construction
Frequency per 1,000.km.yr
Pinhole-crack Hole Rupture
Figure 15: Relation corrosion size of leak and year of construction
0
0,02
0,04
0,06
0,08
0,1
0,12
Unknown Coaltar Bitumen Polyeth Epoxy Other
Type of coating
Frequency per 1,000.km.yr
Pinhole-crack Hole Rupture
Figure 16: Relation corrosion size of leak and type of coating

0
0,02
0,04
0,06
0,08
0,1
0,12
0,14
0-5 5-10 10-15
Wall thickness class [mm]
Frequency per 1,000.km.yr
Pinhole-crack Hole Rupture
Figure 17: Relation corrosion size of leak and wall thickness class
Corrosion has been identified as the third cause of incident (15%). Study of figures 15 to 17 shows that corrosion often results in smaller leak sizes (pinholes and cracks), whereas very few holes were observed and only one rupture occurred on a pipeline, which was constructed before 1954. Figures 15 illustrates the link between the year of construction of the pipelines and the failure frequencies whereas figure 16 shows the relation between the type of coating and the failure frequencies. From these figures it can be concluded that the older the pipeline, which generally used bitumen and coal tar, the higher the failure frequencies are. Corrosion is a phenomenon of deterioration of the pipelines. Corrosion takes place independently of the wall thickness, but the thinner the corroded pipeline wall, the sooner the pipeline fails, as figure 17 illustrates. The failure point of a thinner pipeline is reached more quickly. Corrosion on thicker pipelines takes longer before causing an incident and therefore has more chance to be detected. Different protective measures are undertaken by pipeline owners to overcome the problem of corrosion. These measures are for example cathodic protection and pipeline coating. In line inspections and pigging operations also allow detecting corrosion at early stage. Three types of corrosion have been addressed by the EGIG: external corrosion, internal corrosion and corrosion with an unknown cause. Up to 2004 they represented respectively 79%, 16% and 5% of all incidents due to corrosion. 71% of the cases of external corrosion was due to pitting. Galvanic corrosion and unknown causes represented both 13% of the external corrosion incidents whereas stress corrosion cracking was responsible for only 2%.

Relation between construction defect size of leak and design parameter
0
0,05
0,1
0,15
0,2
0,25
<1954 1954-1963 1964-1973 1974-1983 >1984
Year of construction
Frequency per 1,000.km�yr
Pinhole-crack Hole Rupture
Figure 18: Relation construction defect/material size of leak and year of construction
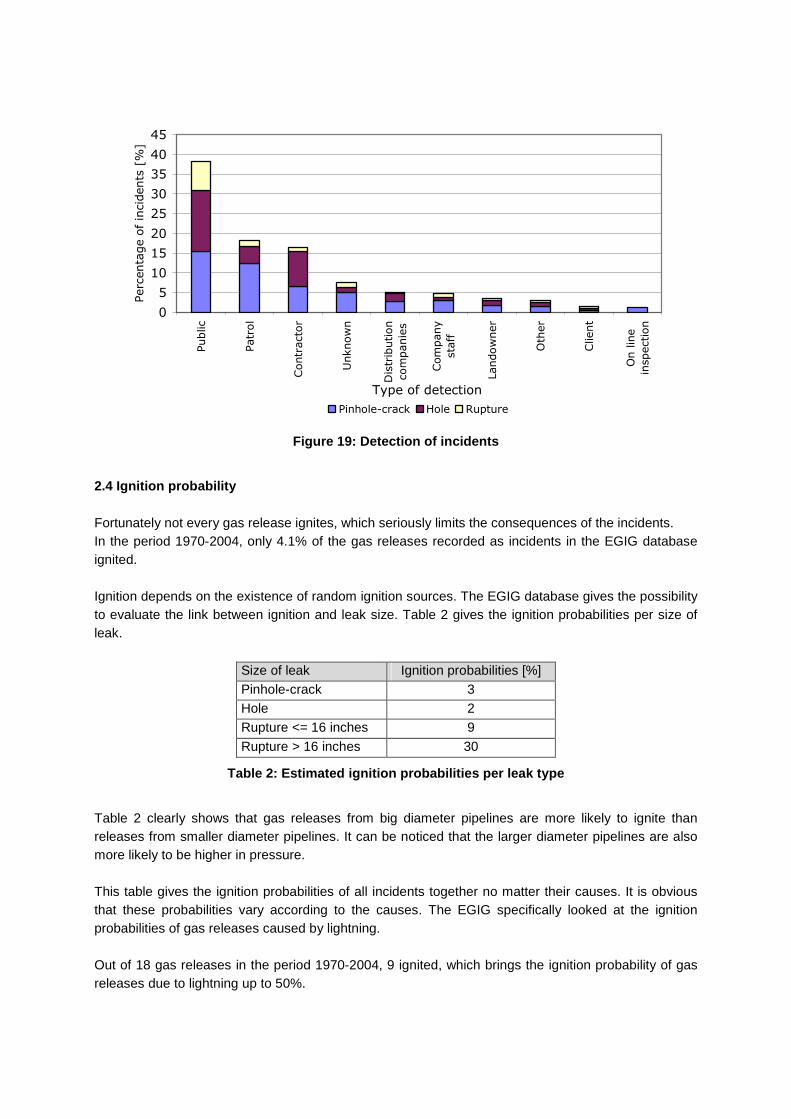
Figure 18 shows that the older the pipelines, the higher the failure frequencies (due to construction defect/material). It seems that the new pipelines are less vulnerable to construction defect/material, which is synonymous to technical improvements. This phenomenon has already been observed in the ageing analysis. 2.3 Detection of incidents Figure 19 shows the distribution of the type of detection. With almost 40% of all incidents detected, the public is the most common detector. Up to 2004 almost 20% of the incidents were detected by the patrols, which demonstrates their usefulness and effectiveness.
0
5
10
15
20
25
30
35
40
45
Public
Patrol
Contractor
Unknown
Distribution
companies
Company
staff
Landowner
Other
Client
On line
inspection
Type of detection
Percentage of incidents [%]
Pinhole-crack Hole Rupture
Figure 19: Detection of incidents
2.4 Ignition probability Fortunately not every gas release ignites, which seriously limits the consequences of the incidents. In the period 1970-2004, only 4.1% of the gas releases recorded as incidents in the EGIG database ignited. Ignition depends on the existence of random ignition sources. The EGIG database gives the possibility to evaluate the link between ignition and leak size. Table 2 gives the ignition probabilities per size of leak.
Size of leak Ignition probabilities [%] Pinhole-crack 3 Hole 2 Rupture <= 16 inches 9
Rupture > 16 inches 30
Table 2: Estimated ignition probabilities per leak type
Table 2 clearly shows that gas releases from big diameter pipelines are more likely to ignite than releases from smaller diameter pipelines. It can be noticed that the larger diameter pipelines are also more likely to be higher in pressure. This table gives the ignition probabilities of all incidents together no matter their causes. It is obvious that these probabilities vary according to the causes. The EGIG specifically looked at the ignition probabilities of gas releases caused by lightning. Out of 18 gas releases in the period 1970-2004, 9 ignited, which brings the ignition probability of gas releases due to lightning up to 50%.

CONCLUSION EGIG has maintained and expanded the European gas pipeline incident database. Transmission companies of twelve European countries now collect incident data on more than 122,000 km of pipelines every year. The total exposure, which expresses the length of a pipeline and its period of operation, is 2.77 million km.yr.
The statistics of incidents collected in the database give reliable failure frequencies. The overall incident frequency over the period 1970 to 2004 is equal to 0.41 incidents per year per 1,000 km.
The 5 year moving average overall failure frequency, which represents the average incident frequency over the past 5 years, equals 0.17 per year per 1,000 km. This frequency is almost 5 times lower than the one reported in the first years of the data base (1970-1974). The failure frequencies have been reducing consistently over the years, although they recently tend to stabilize. The major cause of incidents remains external interference (50% of all incidents), followed by construction defects/material failures (17%) and corrosion (15%). Over the past five years, 51% of all incidents were due to external interference. The relatively high contribution of external interference emphasises its importance to pipeline operators and authorities. External interference incidents are characterised by potentially severe consequences (holes and ruptures), and the incident in Ghislenghien on 30 July 2004 reminds us of this fact.
REFERENCES [1] 6th EGIG report 1970-2004, December 2005.