safety measurement system (sms) methodology · of the system measurement and analysis division of...
TRANSCRIPT

SAFETY MEASUREMENT SYSTEM (SMS) METHODOLOGY
Version 2.1
December 2010
Prepared for: Prepared by: Federal Motor Carrier Safety Administration John A. Volpe National Transportation 1200 New Jersey Avenue, SE Systems Center Washington, DC 20590 55 Broadway Cambridge, MA 02142

December 2010 i
Preface
This report documents the Safety Measurement System (SMS) methodology developed to support the Compliance, Safety, Accountability (CSA) Initiative for the Federal Motor Carrier Safety Administration (FMCSA). The SMS is one of the major tools for measuring the safety of individual motor carriers and commercial motor vehicle (CMV) drivers. Such measures help identify and monitor safety problems as part of the CSA safety improvement process.
Many of the concepts used to construct the SMS originated from the SafeStat measurement system. SafeStat was developed at the U.S. Department of Transportation‘s John A. Volpe National Transportation Systems Center (the Volpe Center) in Cambridge, MA, under a project plan agreement with the Federal Highway Administration‘s (FHWA) Office of Motor Carriers, FMCSA‘s predecessor. It was designed and tested under the Federal/State Performance and Registration Information Systems Management (PRISM) program in the mid 1990s. Since then, SafeStat has been implemented nationally to prioritize motor carriers for on-site compliance reviews (CRs). SafeStat output has been made available to the public via the Internet on the Analysis & Information (A&I) Website at http://www.ai.fmcsa.dot.gov.
The SMS design builds on the lessons learned from developing and implementing SafeStat for CR prioritization. However, the SMS also incorporates new CSA requirements for identifying specific types of unsafe behaviors that the entities exhibit. A more specialized set of interventions will now address these unsafe behaviors and the system will also expand the use of on-road safety violation data. In January 2008, FMCSA started an Operational Model Test (Op-Model Test) of the CSA Initiative, which includes using the SMS to identify and monitor unsafe carrier and CMV driver behavior in nine states. Version 2.0 of the Methodology incorporates feedback from the Op-Model Test and was implemented as part of the CSA Data Preview in August 2010, which provided SMS results to carriers nationally. Future SMS development will be part of a continuous improvement process based on results and feedback. The Volpe Center Technical Project Manager for developing the SMS is David Madsen of the System Measurement and Analysis Division of the Center for Safety Management Systems. Eran Segev, also of the System Measurement and Analysis Division, headed the analysis leading to the SMS design and methodology. The following Volpe Center staff provided further technical support: Lee Biernbaum, Kevin Gay, Gustaf Lawson, Richard (Kha) Nguyen, Amy Olanyk, Jonathan Pearlman, and Scott Smith.

December 2010 ii
Table of Contents List of Figures ................................................................................................................... iii List of Tables..................................................................................................................... iv
Glossary ............................................................................................................................. v
1. Introduction ............................................................................................................... 1-1
2. Design of the SMS .................................................................................................... 2-1
2.1 Description of BASICs and Crash Indicator ....................................................... 2-1
2.2 Data Sources ........................................................................................................ 2-2
2.3 Carrier BASICs Rankings in SMS ...................................................................... 2-3
2.4 SMS Design Features .......................................................................................... 2-4
2.4.1 Violation Severity.......................................................................................... 2-4
2.4.2 Crash Severity ............................................................................................... 2-4
2.4.3 Time Weights ................................................................................................ 2-4
2.4.4 Normalization ................................................................................................ 2-4
2.4.5 Segmentation ................................................................................................. 2-5
2.4.6 Safety Event Groups ...................................................................................... 2-5
2.4.7 Data Sufficiency ............................................................................................ 2-5
2.4.8 Percentile Rank.............................................................................................. 2-5
2.5 Differences Between SafeStat and the SMS........................................................ 2-6
3. CSMS Methodology .................................................................................................. 3-1
3.1 Unsafe Driving BASIC Assessment .................................................................... 3-1
3.1.1 Calculation of BASIC Measure ..................................................................... 3-1
3.1.2 Calculation of BASIC Percentile Rank ......................................................... 3-3
3.2 Fatigued Driving (Hours-of-Service (HOS)) BASIC Assessment ...................... 3-5
3.2.1 Calculation of BASIC Measure ..................................................................... 3-5
3.2.2 Calculation of BASIC Percentile Rank ......................................................... 3-6
3.3 Driver Fitness BASIC Assessment ...................................................................... 3-7
3.3.1 Calculation of BASIC Measure ..................................................................... 3-7
3.3.2 Calculation of BASIC Percentile Rank ......................................................... 3-8
3.4 Controlled Substances/Alcohol BASIC .............................................................. 3-9
3.4.1 Calculation of BASIC Measure ................................................................... 3-10
3.4.2 Calculation of BASIC Percentile Rank ....................................................... 3-11
3.5 Vehicle Maintenance BASIC Assessment ........................................................ 3-11
3.5.1 Calculation of BASIC Measure ................................................................... 3-12 3.5.2 Calculation of BASIC Percentile Rank ....................................................... 3-13
3.6 Cargo-Related BASIC Assessment ................................................................... 3-13
3.6.1 Calculation of BASIC Measure ................................................................... 3-14
3.6.2 Calculation of BASIC Percentile Rank ....................................................... 3-15

December 2010 iii
3.7 Crash Indicator Assessment .............................................................................. 3-16
3.7.1 Calculation of Crash Indicator Measure ...................................................... 3-16 3.7.2 Calculation of Crash Indicator Percentile Rank .......................................... 3-18
4. DSMS Methodology ................................................................................................. 4-1
4.1 Unsafe Driving BASIC and Controlled Substances/Alcohol BASIC Assessment .....................................................................................................................................4-1
4.1.1 Calculation of BASIC Measure ..................................................................... 4-2
4.1.2 Calculation of BASIC Percentile Rank ......................................................... 4-3
4.2 Fatigued Driving (HOS) BASIC and Driver Fitness BASIC Assessment .......... 4-3
4.2.1 Calculation of BASIC Measure ..................................................................... 4-3 4.2.2 Calculation of BASIC Percentile Rank ......................................................... 4-5
4.3 Vehicle Maintenance BASIC and Cargo-Related BASIC Assessment ............... 4-5 4.3.1 Calculation of BASIC Measure ..................................................................... 4-6
4.3.2 Calculation of BASIC Percentile Rank ......................................................... 4-7
4.4 Crash Indicator Assessment ................................................................................ 4-7
4.4.1 Calculation of Crash Indicator Measure ........................................................ 4-8
4.4.2 Calculation of Crash Indicator Percentile Rank ............................................ 4-9
5. Sample SMS Measurement Examples ...................................................................... 5-1
5.1 Sample SMS Output ............................................................................................ 5-1
5.2 SMS Measurement Examples ............................................................................. 5-2 5.2.1 Fatigued Driving (HOS) BASIC Example .................................................... 5-2
5.2.2 Vehicle Maintenance BASIC Example ....................................................... 5-11
5.2.3 Crash Indicator Example ............................................................................. 5-22
6. SMS Report – Summary/Next Steps ......................................................................... 6-1
List of Figures
Figure 2-1. BASICs Ranking Process ............................................................................ 2-3
Figure 5-1. CSMS Screenshot ......................................................................................... 5-2
Figure 5-2. Example: Fatigued Driving (HOS) Inspection/Violation List ..................... 5-3
Figure 5-3. Example: Fatigued Driving (HOS) Detailed Inspection Report .................. 5-4
Figure 5-4. Example: Fatigued Driving (HOS) Inspection/Violation/Measure Report .. 5-5
Figure 5-5. Example: Fatigued Driving (HOS) Inspection #1 ....................................... 5-6
Figure 5-6. Example: Fatigued Driving (HOS) Inspection #2 ....................................... 5-7
Figure 5-7. Example: Fatigued Driving (HOS) Measure Calculation ............................ 5-8
Figure 5-8. Example: Fatigued Driving (HOS) On-Road Performance Summary ......... 5-9
Figure 5-9. Example: Fatigued Driving (HOS) Measure and Percentile Calculation .. 5-11

December 2010 iv
Figure 5-10. Example: Vehicle Maintenance Relevant Inspection List ....................... 5-12
Figure 5-11. Example: Vehicle Maintenance Detailed Inspection Report ................... 5-13
Figure 5-12. Example: Vehicle Maintenance Inspection/Violation/Measure Report ... 5-15
Figure 5-13. Example: Vehicle Maintenance Inspection # 1 ....................................... 5-16
Figure 5-14. Example: Vehicle Maintenance Inspection # 3 ....................................... 5-17
Figure 5-15. Example: Vehicle Maintenance Inspection #7 ........................................ 5-18
Figure 5-16. Example: Vehicle Maintenance Inspection #5 ........................................ 5-19
Figure 5-17. Example: Vehicle Maintenance On-Road Performance Summary .......... 5-20
Figure 5-18. Example: Vehicle Maintenance Measure and Percentile Calculation ..... 5-22
Figure 5-19. Example: Crash Indicator Applicable Crash List .................................... 5-23
Figure 5-20. Example: Crash Indicator PU Type ......................................................... 5-24
Figure 5-21. Example: Crash Indicator Average Power Unit Calculation ................... 5-25
Figure 5-22. Example: Crash Indicator VMT data ....................................................... 5-25
Figure 5-23. Example: Crash Indicator Crash/Measure Report ................................... 5-26
Figure 5-24. Example: Crash Indicator Crash #1 ......................................................... 5-27
Figure 5-25. Example: Crash Indicator Measure Calculation ...................................... 5-28
Figure 5-26. Example: Crash Indicator Crash Activity ................................................ 5-29
List of Tables
Table 3-1. VMT per PU for Combo Segment ................................................................ 3-3
Table 3-2. VMT per Average PU for Straight Segment ................................................. 3-3
Table 3-3. Safety Event Groups for Unsafe Driving BASIC: Combo Segment ............ 3-4
Table 4-1. Safety Event Groups Categories for Fatigued Driving (HOS) and Driver Fitness BASICs ............................................................................................. 4-5
Table 4-2. Safety Event Groups for Vehicle Maintenance and Cargo-Related BASICs 4-7
Table 4-3. Crash Severity Weights for Crash Indicator ................................................. 4-8
Table 5-1. Safety Event Group Categories for Fatigued Driving (HOS) ..................... 5-10
Table 5-2. Safety Event Group Categories for Vehicle Maintenance .......................... 5-21
Table 5-3. VMT per PU for Combo Segment .............................................................. 5-25
Table 5-4. Crash Severity Weights for Crash Indicator ............................................... 5-27
Table 5-5. Safety Event Group Categories for Crash Indicator.................................... 5-29
December 2010 v
Glossary
BASIC Behavior Analysis and Safety Improvement Category CDL Commercial Driver‘s License
CMV Commercial Motor Vehicle CR Compliance Review CRWG Compliance Review Work Group
CSA Compliance, Safety, Accountability CSMS Carrier Safety Measurement System DIR Driver Information Resource
DSMS Driver Safety Measurement System FMCSA Federal Motor Carrier Safety Administration
FMCSR Federal Motor Carrier Safety Regulations HAZMAT Hazardous Materials HMR Hazardous Materials Regulations
HOS Hours-of-Service LTCCS Large Truck Crash Causation Study MCMIS Motor Carrier Management Information System
MCSAP Motor Carrier Safety Assistance Program NGA National Governors Association NTSB National Transportation Safety Board
OOS Out-of-Service PU Power Unit
PRISM Performance and Registration Information Systems Management
SafeStat Motor Carrier Safety Status Measurement System SEA Safety Evaluation Area SFD Safety Fitness Determination
SME Subject Matter Expert SMS Safety Measurement System USDOT U.S. Department of Transportation
VSAS Violation Severity Assessment Study VMT Vehicle Miles Travelled

December 2010 1-1
1. Introduction
The Federal Motor Carrier Safety Administration (FMCSA) is developing a new Operational Model through its Comprehensive Safety Analysis 2010 (CSA) Initiative. The goal of CSA is to develop and implement more effective and efficient ways for FMCSA, its State Partners, and the trucking industry to reduce commercial motor vehicle (CMV) crashes, fatalities, and injuries. CSA will help FMCSA and its State Partners impact the safety behavior of more carriers and drivers, use continually improving data to better identify high-risk carriers and drivers, and apply a wider range of interventions to reduce high-risk behavior.1
As part of this effort, FMCSA has identified the attributes of a model for safety oversight that it considers ideal: flexibility, efficiency, effectiveness, innovation, and equity. The CSA Operational Model, shown below, features continuous monitoring and tracking of entities‘ safety performance. Entities may be either carriers or drivers. All entities found with problematic safety behavior will be subject to the Intervention Process.
Figure 1-1. CSA Operational Model
1 FMCSA CSA2010 Website, http://csa2010.fmcsa.dot.gov

December 2010 1-2
The Safety Measurement System Within the CSA Operational Model, the Safety Measurement System (SMS) quantifies the on-road safety performance of individual entities to:
Identify entities for interventions. The SMS will be a key component in determining the inclusion of entities with significant safety problems into the CSA Intervention Process.
Determine the specific safety problems an entity exhibits. The SMS allows enforcement officers to identify the specific safety problems that the system highlights and to surgically address them through a tailored set of interventions.
Monitor safety problems throughout the Intervention Process. The SMS will continuously monitor on-road performance to assess whether an entity‘s safety performance has improved enough for it to exit the Intervention Process, or if further intervention is warranted.
Support FMCSA‘s proposed Safety Fitness Determination (SFD) process. The SMS results can be an important factor in determining the safety fitness of carriers. The SMS will identify the carriers demonstrating the worst safety performance so they can be considered for an ―Unfit‖ safety determination. Details on the proposed process will be available for public comment as part of the upcoming Notice of Proposed Rulemaking.
In addition to supporting the CSA Operational Model, the SMS results can provide other stakeholders with valuable safety information. The SMS results will be easily accessible via the Internet to encourage improvements in motor carrier safety. Findings from the SMS will allow the evaluated carriers an assessment of their weaknesses in various safety areas. Thus, the SMS will empower carriers and other firms (e.g., shippers, insurers) involved with the motor carrier industry to make safety-based business decisions.

December 2010 2-1
2. Design of the SMS
The SMS is a tool for assessing available roadside performance data. These data are used to rank an entity‘s relative performance in any of six Behavior Analysis and Safety Improvement Categories (BASICs) as well as crash involvement (Crash Indicator). Law enforcement will use rankings within these BASICs and the Crash Indicator to select entities for appropriate interventions.
2.1 Description of BASICs and Crash Indicator The CSA team developed the BASICs under the premise that CMV crashes can be traced to the behavior of motor carriers and/or drivers. The behavior categories are derived based on information from a number of sources: Large Truck Crash Causation Study (LTCCS);2 CSA Driver History Study; the existing FMCSA regulatory structure; and analysis conducted under FMCSA‘s Compliance Review Workgroup (CRWG), the predecessor to CSA. The BASICs are defined as follows:
Unsafe Driving BASIC—Operation of CMVs in a dangerous or careless manner. Example violations: speeding, reckless driving, improper lane change, and inattention.
Fatigued Driving (Hours-of-Service) BASIC—Operation of CMVs by drivers who are ill, fatigued, or in non-compliance with the Hours-of-Service (HOS) regulations. This BASIC includes violations of regulations surrounding the complete and accurate recording of logbooks as they relate to HOS requirements and the management of CMV driver fatigue. Instances related to the Fatigued Driving (HOS) BASIC are distinguished from incidents where unconsciousness or an inability to react is brought about by the use of alcohol, drugs, or other controlled substances. Example violations: HOS, logbook, and operating a CMV while ill or fatigued.
Driver Fitness BASIC—Operation of CMVs by drivers who are unfit to operate a CMV due to lack of training, experience, or medical qualifications. Example violations: failing to have a valid and appropriate commercial driver's license (CDL) and being medically unqualified to operate a CMV.
Controlled Substances/Alcohol BASIC—Operation of CMVs by drivers who are impaired due to alcohol, illegal drugs, and misuse of prescription or over-the-counter medications. Example violations: use or possession of controlled substances or alcohol.
Vehicle Maintenance BASIC—Failure to properly maintain a CMV. Example violations: brakes, lights, and other mechanical defects, and failure to make required repairs.
2 Daniel Blower and Kenneth L. Campbell, Large Truck Crash Causation Study Analysis Brief, February 2005. Available at http://www.ai.fmcsa.dot.gov/ltccs/.
December 2010 2-2
Cargo-Related BASIC—Failure to properly prevent shifting loads, spilled or dropped cargo, and unsafe handling of hazardous materials (hazmat) on a CMV. Example violations: improper load securement, cargo retention, and hazmat handling.
Additionally, the SMS evaluates an entity‘s crash history. The crash history used by the Crash Indicator is not specifically a behavior; rather, it is the consequence of behavior and may indicate a problem that warrants attention. The Crash Indicator is defined as follows:
Crash Indicator—Histories or patterns of high crash involvement, including frequency and severity. It is based on information from state-reported crash reports.
The SMS will initially focus on the two types of entities most likely to impact the BASICs and Crash Indicator: motor carriers and CMV drivers. Therefore, two measurement systems were designed for CSA:
Carrier Safety Measurement System (CSMS)
Driver Safety Measurement Systems (DSMS)
2.2 Data Sources Both CSMS and DSMS assess an individual entity‘s performance by BASIC and Crash Indicators calculated from information collected during on-road safety inspections and state-reported CMV crash records. These data are recorded in the Motor Carrier Management Information System (MCMIS). In addition, motor carrier Census data, also recorded in MCMIS, are used for the identification and normalization of safety event data. Below are more detailed descriptions of each data source:
Roadside Inspections are examinations a Motor Carrier Safety Assistance Program (MCSAP) inspector conducts on individual CMVs and drivers to determine if they are in compliance with the Federal Motor Carrier Safety Regulations (FMCSRs) and/or Hazardous Materials Regulations (HMRs).
Violations are recorded during inspections and are entered into the MCMIS database. A subset of these violations results in driver or vehicle Out-of-Service (OOS) orders. These OOS violations must be corrected before the affected driver or vehicle is allowed to return to service. The SMS assessments are based on the safety violations listed in Appendix A. These assessments, however, do not include those violations that are: (1) a result of a crash3 or (2) assigned to another entity such as a shipper or Intermodal Equipment Provider.
Note: Some roadside inspections are performed following a traffic enforcement stop for a moving violation. Violations reported during such stops do not always
3 Only pre-existing violations from post-crash inspections are used in the SMS. Violations recorded in MCMIS as being attributed to the crash are not used.

December 2010 2-3
result in the issuance of a citation to the driver, but are used in the SMS whether or not a citation is issued.
State-Reported Commercial Vehicle Crash Data are taken from MCMIS and provide information on crashes as reported by state and local police officials. The reporting of these crashes follows National Governors Association (NGA) standards.
Motor Carrier Census Data are first collected when a carrier obtains a U.S. Department of Transportation (USDOT) number. The Census data are primarily collected from: (1) Form MCS-150, filled out by the carrier, and (2) Form MCS-151, filled out by law enforcement as part of an investigation. Carriers are required to update their MCS-150 information biennially. Carriers domiciled in states participating in Performance and Registration Information Systems Management (PRISM) Program update their Census data as part of the CMV registration process. The CSMS uses Census data for identification and normalization of safety-related data. Examples of Census data include USDOT number, carrier name, number and type of Power Units (PUs), annualized vehicle miles travelled (VMT), physical location, current status, and types of cargo hauled.
2.3 Carrier BASICs Rankings in SMS Four principal steps are used to assess a carrier‘s performance in each BASIC and the Crash Indicator. First, relevant inspection, violation, and crash data obtained from MCMIS are attributed to a carrier to create a safety event history for the carrier. Each carrier‘s violations are classified into a BASIC and are then time weighted, severity weighted, and normalized to form a quantifiable measure for a carrier in each BASIC. Based on a comparison of each carrier‘s BASIC measure to other carriers with a similar number of safety events, a rank and percentile are assigned. These steps are illustrated in Figure 2-1. The SMS applies similar steps to crash data to calculate carrier Crash Indicator percentiles.
Safety Events
by Entity
BASIC Data
Rank/
Percentile
BASIC
Measures
Figure 2-1. BASICs Ranking Process
December 2010 2-4
2.4 SMS Design Features The conversion of a carrier‘s safety data into a BASIC measure and rank/percentile involves the application of several SMS design features as discussed below.
2.4.1 Violation Severity
All roadside inspection violations that pertain to a BASIC are assigned a severity weight that reflects its association with crash occurrence and crash consequences. The severity weights help differentiate the levels of crash risk associated with the various violations attributed to each BASIC. The violation severity weights in the tables in Appendix A have been converted to a scale from 1 to 10 for each BASIC, where 1 represents the lowest crash risk and 10 represents the highest crash risk relative to the other violations in the BASIC. Since these severity weights are BASIC-specific, two weights that appear identical but are in different BASICs do not represent the same crash risk. For example, a ‗5‘ in one BASIC is not equivalent to a ‗5‘ in another BASIC. Instead, the ‗5‘ represents the midpoint between a crash risk of 1 and 10 within a BASIC. A violation‘s severity weight is only reflective of crash risk when compared to other violations within the same BASIC. Severity weights from one BASIC should not be added, subtracted, equated or otherwise combined with the severity weight of a violation from any other BASIC. Within certain BASICs, additional severity weight is applied to violations that resulted in driver or vehicle OOS orders This additional severity weight for OOS conditions, as with the severity weight assigned to each violation, is based on analysis that quantified the extent of these associations between violation and crash risk, as well as input from enforcement subject matter experts (SMEs). Appendix A describes the severity weights‘ derivation and provides the specific weights assigned to each roadside inspection violation used in the SMS.
2.4.2 Crash Severity
Crashes are assigned severity weights according to their impact. Greater weight is attributed to crashes involving injuries, fatalities, and/or crashes involving the release of hazmat than to crashes only resulting in a vehicle being towed away at the scene of the crash.
2.4.3 Time Weights
All safety events are assigned a time weight. The time weight of an event decreases with time. This decline results in more recent events having a greater impact on a carrier‘s BASIC and Crash Indicator measures than older events. When safety events become older than two years, they are no longer used to assess a carrier‘s safety in the SMS.
2.4.4 Normalization
BASIC and Crash Indicator measures are normalized to reflect differences in exposure among carriers. The normalization approach varies depending on what is being measured.

December 2010 2-5
The SMS normalizes for the number of driver inspections with driver-related BASICs, whereas vehicle inspections are used for normalization within vehicle-related BASICs. Therefore, the number of driver inspections normalizes the Fatigued Driving (HOS), Driver Fitness, and Controlled Substances/Alcohol measures, while the number of vehicle inspections normalizes the Vehicle Maintenance and Cargo-Related measures.
While violations of the above BASICs are discovered during an inspection, a distinction is made for behaviors that usually prompt an inspection. For this reason, the SMS normalizes the Unsafe Driving BASIC measure by carrier size (i.e., a hybrid PU and VMT measure), instead of by number of inspections. Similarly, the Crash Indicator is also normalized by carrier size.
2.4.5 Segmentation
The Unsafe Driving BASIC and Crash Indicator account for carrier differences by segmenting the carrier population into two groups based on the types of vehicles operated. This segmentation ensures that carriers with fundamentally different types of vehicles/operations are not compared to each other. The two segments are: (1) ―Combo‖
or combination trucks/motor coach buses constituting 70% or more of the total power units and (2) ―Straight‖ or straight trucks/other vehicles constituting more than 30% of the total power units.
2.4.6 Safety Event Groups
To further account for the differences among carriers, the SMS places carriers in safety event groups based on the number of safety events (e.g., inspections, crashes) in which the carriers have been involved. This tiered approach accounts for the inherent greater variability in rates based on small samples or limited levels of exposure and the stronger level of confidence in measures based on higher exposure. The safety event grouping also allows the SMS to handle the widely diverse motor carrier population, while ensuring that similarly situated carriers are treated with the same standards.
2.4.7 Data Sufficiency
The SMS employs data sufficiency standards to ensure that there are enough inspections or crashes to produce meaningful measures of safety for carriers. In instances where the safety performance of a carrier can potentially lead to CSA interventions or a detrimental SFD, additional data sufficiency tests are employed. These tests ensure that a carrier has a ―critical mass‖ of poor performance data or a pattern of violations before adverse action is taken.
2.4.8 Percentile Rank
The SMS uses the measures to assign a percentile ranking to each BASIC and Crash Indicator. Each measure is a quantifiable determination of safety behavior. Percentile ranking allows the safety behavior of a carrier to be compared with the safety behavior of carriers with similar numbers of safety events. Within each safety event group, a percentile is computed on a 0-100 scale for each carrier that receives a non-zero measure, with 100 indicating the worst performance. Carriers with percentiles above a certain set threshold and meeting minimum data sufficiency requirements in a BASIC or Crash Indicator will deemed as ―deficient‖ in

December 2010 2-6
that BASIC or Crash Indicator. The current thresholds can be found on the CSA website. These carriers will be identified for the CSA Intervention Process.
2.5 Differences Between SafeStat and the SMS The SMS offers several improvements over FMCSA‘s existing carrier measurement system, SafeStat. Some of the key differences are listed below. The SMS is organized by specific behaviors (BASICs) whereas SafeStat is organized into four general Safety Evaluation Areas (SEAs). SafeStat assesses carriers in four Safety Evaluation Areas (SEAs)—Accident, Driver, Vehicle, and Safety Management—whereas the SMS measures each carrier in six behavioral categories (i.e., the BASICs) and the Crash Indicator. The specific behavioral metrics in the SMS provide a more detailed level of measurement that can be used to describe, evaluate, and address carrier safety. For example, SafeStat indicates that a carrier has general driver issues according to its Driver SEA value, while the SMS provides information on the specific driver behavior (i.e., Controlled Substances/Alcohol, Fatigued Driving (HOS), Unsafe Driving, and Driver Fitness) that needs modification and/or attention. The more specific organization of the SMS‘s BASICs often allows the discovery of serious safety problems that go undetected under SafeStat‘s more generalized SEA structure. This is particularly important for BASICs related to driver behavior given that recent research (e.g., the LTCCS) has highlighted driver behavior as increasingly relevant to crash occurrence.
The SMS identifies specific safety problems so that CSA interventions can address them in a surgical manner; the SafeStat score is based on grouping safety problems together to identify carriers for a one-size-fits-all CR. Through the measurement of a carrier‘s safety performance by behavior and the targeting of an intervention to the carrier‘s specific behavior, the CSA Operational Model provides an integrated approach to measuring and improving CMV safety. The alignment of both the SMS and intervention selection through BASICs and the Crash Indicator allows FMCSA to identify both the carrier for intervention as well as the specific safety problem that should be surgically addressed. This approach will lead to more efficient and effective use of enforcement resources directed towards improving motor carrier safety. The SMS uses all safety-based inspection violations while SafeStat uses only OOS violations and selected moving violations from inspections. The inclusion of all safety-based inspection violations in the SMS fully leverages the results of the roadside inspection program (3.5 million inspections annually) and provides a more comprehensive evaluation of a carrier‘s on-road safety performance.
The SMS utilizes risk-based violation weightings while SafeStat does not. Although the SMS utilizes all safety-based inspection violations in the SMS, it is recognized that not all violations pose the same crash risk. Therefore, violations in the SMS are weighted according to the relationship that the violation may cause, contribute

December 2010 2-7
to, or exacerbate the outcome of CMV crash. Violations shown to have a larger impact on crash risk will have a stronger detrimental impact on a carrier‘s BASIC measure. The risk-based weighting of violations will provide a risk-based assessment of a carrier‘s performance in each BASIC. The SMS will feed the Safety Fitness Determination (SFD) of a carrier while SafeStat has no impact on a carrier’s safety rating. Currently SafeStat prioritizes carriers for CRs. Based strictly on the results of the CR, FMCSA provides a SFD in the form of a safety rating to a carrier. Under CSA, FMCSA could consider the results of the SMS along with the results of interventions in generating a carrier‘s SFD. With this approach, all violations can be considered when determining safety fitness, not just the more severe ones from CRs as is now done with SFD. Carrier SMS results could impact the SFD in two ways. First, poor CSMS results can prompt further examination through the CSA Intervention Process. Major violations found during the Intervention Process could adversely impact a carrier‘s SFD. Secondly, the SFD could be calculated solely on the basis of on-road performance by comparing a carrier‘s absolute BASIC measures, not relative percentiles, to a pre-set BASIC measurement standard. Adverse SFD could occur when a carrier‘s measures do not meet or exceed the standard. This proposed SFD procedure places strong emphasis on carrier on-road performance in determining overall carrier safety fitness. This approach would address one of the National Transportation Safety Board‘s (NTSB) long-standing recommendations that a carrier‘s poor on-road performance alone should have a detrimental impact on its SFD.
The SMS assesses individual drivers and carriers while SafeStat assesses only carriers. Currently, most of the focus of FMCSA safety programs and enforcement has been on motor carriers. In the future, the DSMS will allow FMCSA to identify unsafe drivers for interventions based on their inspection and crash history across all employers (former and current). Given the often transient nature of driver employment, the DSMS will be a valuable tool for FMCSA to address driver-specific problems that cannot be easily handled at the motor carrier level. These efforts will encourage safe and compliant behavior among CMV drivers by making them more accountable for their on-road performance.
December 2010 3-1
3. CSMS Methodology
The following sections describe the CSMS methodology used to calculate the measurement and percentile of each BASIC and the Crash Indicator for individual motor carriers.
3.1 Unsafe Driving BASIC Assessment This section describes the calculation of carrier measures and percentile ranks in the Unsafe Driving BASIC. This BASIC is defined as:
Operating CMVs in a dangerous or careless manner. Example violations: speeding, reckless driving, improper lane change, and inattention. See Appendix A for a complete list of roadside inspection violations used in the CSMS.
The CSMS assesses the Unsafe Driving BASIC using relevant violations of FMCSRs recorded during roadside inspections and reported in MCMIS. Individual carriers‘ BASIC measures also incorporate carrier size in terms of PUs and annual VMT. These measures are used to generate percentile ranks that reflect each carrier‘s driver safety posture relative to carriers in the same segment with similar numbers of inspections with violations.
3.1.1 Calculation of BASIC Measure
The BASIC measures for the Unsafe Driving BASIC are calculated as the sum of severity and time weighted applicable violations divided by carrier average PUs multiplied by a Utilization Factor, as follows:
FactornUtilizatioxPUsAverage
violationsapplicableweightedseverityandtimeofTotalMeasureBASIC
Equation 3-1
In this equation, the terms are defined as follows:
An Applicable Violation is defined as any violation recorded in any level roadside inspection that matches the FMCSR and HMR cites listed for Unsafe Driving (Table 1, Appendix A) and during the past 24 months. In cases of multiple counts of the same violation, the CSMS only uses each violation cite once per inspection. Note: Some roadside inspections are performed following a traffic enforcement stop for a moving violation. Violations reported during such stops do not always result in the issuance of a citation/ticket to the driver, but are used in the CSMS whether or not a citation/ticket is issued. A Severity Weight from 1 (less severe) to 10 (most severe) is assigned to each applicable violation. See the Unsafe Driving Table (Table 1, Appendix A) for the severity weights corresponding to each violation. The severity weighting of each

December 2010 3-2
violation cite accounts for the level of crash risk relative to the other violation cites used in the BASIC measurement. The sum of all violation severity weights for any one inspection in any one BASIC is capped at a maximum of 30. This cap of 30 is applied before the severity weights are multiplied by the time weight. Note: The severity weights of violations outside of the BASIC being calculated do not count towards the violation cap. A Time Weight of 1, 2, or 3 is assigned to each applicable violation based on how long ago it was recorded. Violations recorded in the past 6 months receive a time weight of 3. Violations recorded between 6 and 12 months ago receive a time weight of 2. All violations recorded earlier (older than 12 months but within the past 24 months) receive a time weight of 1. This time weighting places more emphasis on recent violations relative to older violations. A Time and Severity Weighted Violation is a violation‘s severity weight multiplied by its time weight. Average Power Units (PUs) are used in part to account for each carrier‘s level of exposure when calculating the BASIC measure. The number of owned, term-leased, and trip-leased PUs (trucks, tractors, hazardous material tank trucks, motor coaches, and school buses) contained in the Census data are used to calculate the PU totals. The average PUs for each carrier is calculated using (i) the carrier‘s current number of PUs, (ii) the number of PUs the carrier had 6 months ago, and (iii) the number of PUs the carrier had 18 months ago. The average PU calculation is shown below:
3186 Months
PUMonths
PUCurrent
PUAveragePU
Equation 3-2
The Utilization Factor is a multiplier that adjusts the average PU values based on the utilization in terms of VMT per average PU where VMT data in the past 24 months are available. The primary sources of VMT information in the Census are: (1) Form MCS-150, filled out by the carrier, and (2) Form MCS-151, filled out by law enforcement as part of an investigation. Carriers are required to update their MCS-150 information biennially. In cases where the VMT data has been obtained multiple times over the past 24 months for the same carrier, the most current positive VMT figure is used. The Utilization Factor is calculated by the following three steps:
(i) Carrier Segment There are two segments into which each motor carrier can be categorized:
"Combo‖ – combination trucks/motor coach buses constituting 70% or more of the total PU
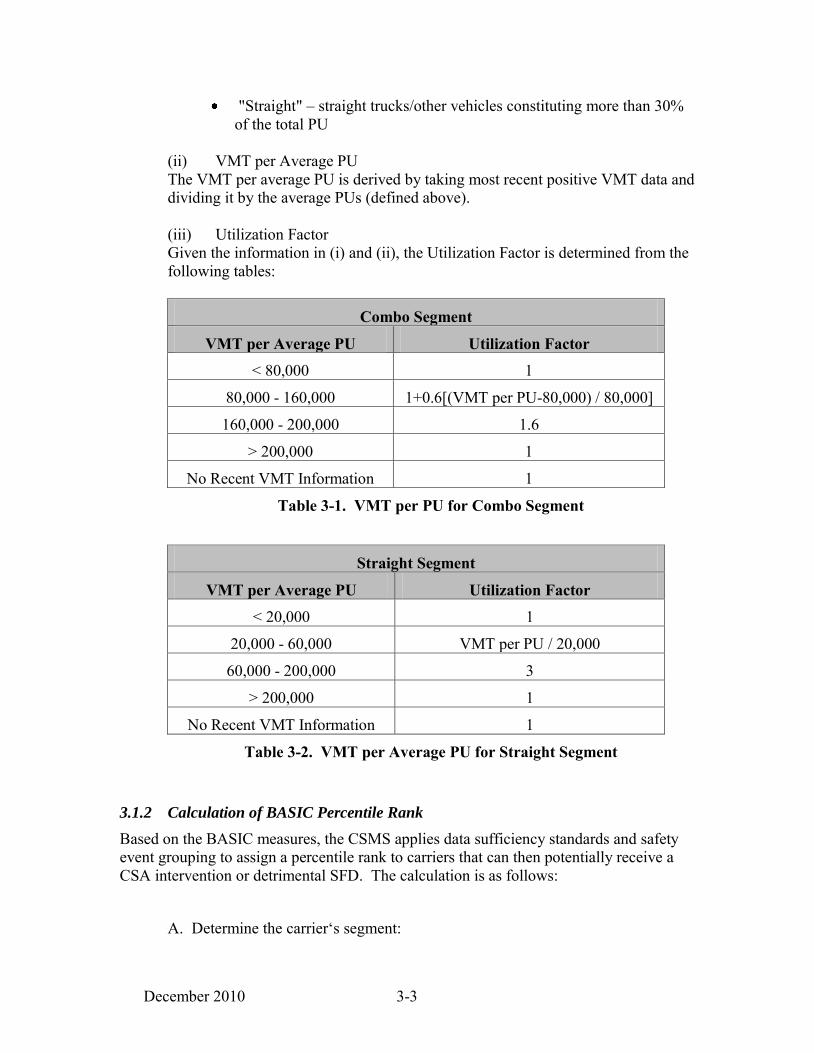
December 2010 3-3
"Straight" – straight trucks/other vehicles constituting more than 30% of the total PU
(ii) VMT per Average PU The VMT per average PU is derived by taking most recent positive VMT data and dividing it by the average PUs (defined above). (iii) Utilization Factor Given the information in (i) and (ii), the Utilization Factor is determined from the following tables:
Combo Segment
VMT per Average PU Utilization Factor
< 80,000 1
80,000 - 160,000 1+0.6[(VMT per PU-80,000) / 80,000]
160,000 - 200,000 1.6
> 200,000 1
No Recent VMT Information 1
Table 3-1. VMT per PU for Combo Segment
Straight Segment
VMT per Average PU Utilization Factor
< 20,000 1
20,000 - 60,000 VMT per PU / 20,000
60,000 - 200,000 3
> 200,000 1
No Recent VMT Information 1
Table 3-2. VMT per Average PU for Straight Segment
3.1.2 Calculation of BASIC Percentile Rank
Based on the BASIC measures, the CSMS applies data sufficiency standards and safety event grouping to assign a percentile rank to carriers that can then potentially receive a CSA intervention or detrimental SFD. The calculation is as follows:
A. Determine the carrier‘s segment:

December 2010 3-4
"Combo" – combination trucks/motor coach buses constituting 70% or more of the total PU
"Straight" – straight trucks/other vehicles constituting more than 30% of the total PU
B. Determine the number of inspections with at least one BASIC violation and remove carriers with less than three such inspections. For the remaining carriers, place each carrier into one of ten groups based on the carrier segment and the number of inspections with an Unsafe Driving violation:
Unsafe Driving BASIC: Combo Segment
Safety Event Group
Number of Inspections with Unsafe Driving Violations
Combo 1 3-8
Combo 2 9-21
Combo 3 22-57
Combo 4 58-149
Combo 5 150+
Table 3-3. Safety Event Groups for Unsafe Driving BASIC: Combo Segment
Unsafe Driving BASIC: Straight Segment
Safety Event Group
Number of Inspections with Unsafe Driving Violations
Straight 1 3-4
Straight 2 5-8
Straight 3 9-18
Straight 4 19-49
Straight 5 50+
Table 3-4. Safety Event Groups for Unsafe Driving BASIC: Straight Segment
C. Within each group, rank all the carriers‘ BASIC measures in ascending order. Transform the ranked values into percentiles from 0 (representing the lowest
December 2010 3-5
BASIC measure) to 100 (representing the highest BASIC measure). Eliminate carriers whose violations in the BASIC are all older than twelve months. Carriers that remain retain the previously calculated percentile.
3.2 Fatigued Driving (Hours-of-Service (HOS) BASIC Assessment This section describes the calculation of carrier measures and percentile ranks in the Fatigued Driving (HOS) BASIC. This BASIC is defined as:
Operation of CMVs by drivers who are ill, fatigued, or in noncompliance with the HOS regulations. This BASIC includes violations of regulations surrounding the complete and accurate recording of logbooks as they relate to HOS requirements and the management of CMV driver fatigue. Instances related to the Fatigued Driving (HOS) BASIC are distinguished from incidents where unconsciousness or an inability to react is brought about by the use of alcohol, drugs, or other controlled substances. Example violations include: HOS, logbook, and operating a CMV while ill or fatigued. See Appendix A for a complete list of roadside inspection violations used in the CSMS.
The CSMS assesses the Fatigued Driving (HOS) BASIC using relevant violations recorded during roadside inspections to calculate a measure for motor carriers. These measures are used to generate percentile ranks that reflect each carrier‘s safety posture relative to carriers with similar numbers of relevant inspections.
3.2.1 Calculation of BASIC Measure
The equation used for calculating Fatigued Driving (HOS) BASIC measures is as follows:
sinspectionrelevantofweighttimeTotal
violationsapplicableweightedseverityandtimeofTotalMeasureBASIC
Equation 3-3
In this equation, the terms are defined as follows: An Applicable Violation is any violation recorded in any level roadside inspection that matches the FMCSRs listed for Fatigued Driving (HOS) (Table 2, Appendix A) during the past 24 months. The CSMS only uses each violation cite once per inspection in cases of multiple counts of the same violation. A Relevant Inspection is any Driver Inspection (Level 1, 2, 3, or 6), including those that do not result in a violation in the BASIC, or any other inspection resulting in an applicable BASIC violation. A Severity Weight is assigned to each applicable violation, with a value dependent on two parts: (i) the level of crash risk relative to the other violations comprising the BASIC measurement, and (ii) whether or not the violation resulted in an OOS condition.

December 2010 3-6
(i) The level of crash risk is assigned to each applicable violation ranging from 1 (less severe) to 10 (most severe); see the Fatigued Driving (HOS) table (Table 2, Appendix A) for the violations‘ corresponding severity weights.
(ii) An OOS weight of 2 is then added to the severity weight of OOS violations. In cases of multiple counts of the same violation, the OOS weight of 2 applies if any of the counts of the violation are OOS.
The sum of all violation severity weights for any one inspection in any one BASIC is capped at a maximum of 30. This cap of 30 is applied before the severity weights are multiplied by the time weight. Note: The severity weights of violations outside of the BASIC being calculated do not count towards the violation cap. A Time Weight of 1, 2, or 3 is assigned to each applicable violation and each relevant inspection based on its age. Violations/inspections recorded in the past 6 months receive a time weight of 3. Violations/inspections recorded between 6 and 12 months ago receive a time weight of 2. All violations/inspections recorded earlier (older than 12 months but within the past 24 months) receive a time weight of 1. This time weighting places more emphasis on results of recent inspections relative to older inspections. Note: The time weight is applied to all relevant inspections, including those that do not result in a violation in the BASIC. A Time and Severity Weighted Violation is a violation‘s severity weight multiplied by its time weight.
3.2.2 Calculation of BASIC Percentile Rank
Based on the BASIC measures, the CSMS applies data sufficiency standards and safety event grouping to assign a percentile rank to carriers that can then potentially receive a CSA intervention or detrimental SFD. The calculation is as follows:
A. Determine the number of relevant inspections and the number of inspections
with at least one BASIC violation. For the Fatigued Driving (HOS) BASIC, remove carriers with (1) less than three relevant driver inspections or (2) no inspections resulting in at least one BASIC violation. For the remaining carriers, place each carrier into one of five groups based on the number of relevant inspections:
Safety Event Group Number of Relevant Inspections
1 3-10
2 11-20

December 2010 3-7
3 21-100
4 101-500
5 501+
Table 3-5. Safety Event Groups for the Fatigued Driving (HOS) BASIC
B. Within each group, rank all the carriers‘ BASIC measures in ascending order. Transform the ranked values into percentiles from 0 (representing the lowest BASIC measure) to 100 (representing the highest BASIC measure). Eliminate carriers that meet both of the following criteria: (1) no violation was recorded in the BASIC during the previous twelve months, and (2) no violation in the BASIC was recorded during the latest relevant inspection. For the remaining carriers with three or more relevant inspections resulting in a Fatigued Driving (HOS) BASIC violation, assign the percentile values to each carrier‘s BASIC.
3.3 Driver Fitness BASIC Assessment This section describes the calculation of carrier measures and percentile ranks in the Driver Fitness BASIC. This BASIC is defined as:
Operation of CMVs by drivers who are unfit to operate a CMV due to lack of training, experience, or medical qualifications. Example violations: failing to have a valid and appropriate CDL and being medically unqualified to operate a CMV. See Appendix A for a complete list of roadside inspection violations used in the CSMS.
The CSMS assesses the Driver Fitness BASIC using relevant violations recorded during roadside inspections to calculate a measure for individual motor carriers. These measures are used to generate percentile ranks that reflect each carrier‘s driver safety posture relative to carriers with similar numbers of relevant inspections.
3.3.1 Calculation of BASIC Measure
The equation used for calculating the BASIC measure for Driver Fitness is as follows:
BASICMeasureTotalof time and severity weightedapplicableviolations
Total time weight of relevantinspections
Equation 3-4
In this equation, the terms are defined as follows: An Applicable Violation is any violation recorded in any level roadside inspection that matches the FMCSRs and HMRs listed for Driver Fitness (Table 3, Appendix

December 2010 3-8
A) during the past 24 months. The CSMS only uses each violation cite once per inspection in cases of multiple counts of the same violation. A Relevant Inspection is any Driver Inspection (Level 1, 2, 3, or 6), including those that do not result in a violation in the BASIC, or any other inspection resulting in applicable BASIC violation. A Severity Weight is assigned to each applicable violation, with a value dependent on two parts: (i) the level of crash risk relative to the other violations comprising the BASIC measurement, and (ii) whether or not the violation resulted in an OOS condition.
(i) The level of crash risk is assigned to each applicable violation ranging from 1 (less severe) to 10 (most severe); see the Driver Fitness table (Table 3, Appendix A) for the violations‘ corresponding severity weights.
(ii) An OOS weight of 2 is then added to the severity weight of OOS violations. In cases of multiple counts of the same violation, the OOS weight of 2 applies if any of the counts of the violation are OOS.
The sum of all violation severity weights for any one inspection in any one BASIC is capped at a maximum of 30. This cap of 30 is applied before the severity weights are multiplied by the time weight. Note: The severity weights of violations outside of the BASIC being calculated do not count towards the violation cap. A Time Weight of 1, 2, or 3 is assigned to each applicable violation and each relevant inspection based on its age. Violations/inspections recorded in the past 6 months receive a time weight of 3. Violations/inspections recorded between 6 and 12 months ago receive a time weight of 2. All violations/inspections recorded earlier (older than 12 months but within the past 24 months) receive a time weight of 1. This time weighting places more emphasis on results of recent inspections relative to older inspections. Note: The time weight is applied to all relevant inspections, including those that do not result in a violation in the BASIC. A Time and Severity Weighted Violation is a violation‘s severity weight multiplied by its time weight.
3.3.2 Calculation of BASIC Percentile Rank
Based on the BASIC measures, the CSMS applies data sufficiency standards and safety event grouping to assign a percentile rank to carriers that can then potentially receive a CSA intervention or detrimental SFD. The calculation is as follows:

December 2010 3-9
A. Determine the number of relevant inspections and the number of inspections with at least one BASIC violation. For the Driver Fitness BASIC, remove carriers with (1) less than five relevant driver inspections or (2) no inspections resulting in at least one BASIC violation. For the remaining carriers, place each carrier into one of five groups based on the number of relevant inspections:
Safety Event Group Number of Relevant Inspections
1 5-10
2 11-20
3 21-100
4 101-500
5 501+
Table 3-6. Safety Event Groups for the Driver Fitness BASIC
B. Within each group, rank all the carriers‘ BASIC measures in ascending order. Transform the ranked values into percentiles from 0 (representing the lowest BASIC measure) to 100 (representing the highest BASIC measure). Eliminate carriers that meet both of the following criteria: (1) no violation was recorded in the BASIC during the previous twelve months, and (2) no violation in the BASIC was recorded during the latest relevant inspection. For the remaining carriers with five or more relevant inspections resulting in a Driver Fitness BASIC violation, assign the percentile values to each carrier‘s BASIC.
3.4 Controlled Substances/Alcohol BASIC This section describes the calculation of carrier measures and percentile ranks in the Controlled Substances/Alcohol BASIC. The definition of this BASIC is as follows:
Operation of CMVs by drivers cited in roadside inspections for impairment due to alcohol, illegal drugs, and misuse of prescription or over-the-counter medications. Example violations: use or possession of controlled substances or alcohol. See Appendix A for a complete list of roadside inspection violations used in the CSMS.
The CSMS assesses the Controlled Substances/Alcohol BASIC using relevant violations of FMCSRs recorded during roadside inspections and reported in MCMIS. Individual carriers‘ BASIC measures also incorporate quantity of relevant roadside inspections. These measures are used to generate percentile ranks that reflect each carrier‘s driver safety posture relative to carriers with similar numbers of inspections with violations.

December 2010 3-10
3.4.1 Calculation of BASIC Measure
The BASIC measures for the Controlled Substances/Alcohol BASIC are calculated as the sum of severity and time weighted applicable violations divided by time weighted relevant inspections, as follows:
sinspectionrelevantofweighttimeTotal
violationsapplicableweightedseverityandtimeofTotalMeasureBASIC
Equation 3-5
In this equation, the terms are defined as follows: An Applicable Violation is defined as any violation recorded in any level roadside inspection that matches the FMCSR cites listed for Controlled Substances/Alcohol (Table 4, Appendix A) and during the past 24 months. In cases of multiple counts of the same violation, the CSMS only uses each violation cite once per inspection.
Note: Some roadside inspections are performed following a traffic enforcement stop for a moving violation. Violations reported during such stops do not always result in the issuance of a citation/ticket to the driver, but are used in the CSMS whether or not a citation/ticket is issued. A Relevant Inspection is any Driver Inspection (Level 1, 2, 3, or 6), including those that do not result in a violation in the BASIC, or any other inspection resulting in an applicable BASIC violation. A Severity Weight from 1 (less severe) to 10 (most severe) is assigned to each applicable violation. See the Controlled Substances/Alcohol Table (Table 4, Appendix A) for the severity weights corresponding to each violation. The severity weighting of each violation cite accounts for the level of crash risk relative to the other violation cites used in the BASIC measurement. The sum of all violation severity weights for any one inspection in any one BASIC is capped at a maximum of 30. This cap of 30 is applied before the severity weights are multiplied by the time weight. Note: The severity weights of violations outside of the BASIC being calculated do not count towards the violation cap. A Time Weight of 1, 2, or 3 is assigned to each applicable violation and each relevant inspection based on its age. Violations/inspections recorded in the past 6 months receive a time weight of 3. Violations/inspections recorded between 6 and 12 months ago receive a time weight of 2. All violations/inspections recorded earlier (older than 12 months but within the past 24 months) receive a time weight of 1. This time weighting places more emphasis on results of recent inspections relative to older inspections.

December 2010 3-11
Note: The time weight is applied to all relevant inspections, including those that do not result in a violation in the BASIC. A Time and Severity Weighted Violation is a violation‘s severity weight multiplied by its time weight.
3.4.2 Calculation of BASIC Percentile Rank
Based on the BASIC measures, the CSMS applies data sufficiency standards and safety event grouping to assign a percentile rank to carriers that can then potentially receive a CSA intervention. The calculation is as follows:
A. Remove carriers with no violations in this BASIC. For the remaining carriers, place each carrier into one of four groups based on the number of carrier inspections with applicable violations:
Safety Event Group Number of Inspections with
Controlled Substance/Alcohol Violations
1 1
2 2
3 3
4 4+
Table 3-7. Safety Event Groups for Controlled Substances/Alcohol BASIC
B. Within each group, rank all the carriers‘ BASIC measures in ascending order. Transform the ranked values into percentiles from 0 (representing the lowest BASIC measure) to 100 (representing the highest BASIC measure). Eliminate carriers whose violations in the BASIC are all older than twelve months. Carriers that remain retain the previously calculated percentile.
3.5 Vehicle Maintenance BASIC Assessment This section describes the calculation of carrier measures and percentile ranks in the Vehicle Maintenance BASIC. This BASIC is defined as:
Failure to properly maintain a CMV. Example violations: brakes, lights, and other mechanical defects, and failure to make required repairs. See Appendix A for a complete list of roadside inspection violations used in the CSMS.
The CSMS assesses the Vehicle Maintenance BASIC using relevant violations recorded during roadside inspections to calculate a measure of each BASIC for individual motor carriers. These measures are used to generate percentile ranks that reflect each carrier‘s safety posture relative to carriers with similar numbers of relevant inspections.

December 2010 3-12
3.5.1 Calculation of BASIC Measure
The equation used for calculating Vehicle Maintenance BASIC measures is as follows:
sinspectionrelevantofweighttimeTotal
violationsapplicableweightedseverityandtimeofTotalMeasureBASIC
Equation 3-6
In this equation, the terms are defined as follows: An Applicable Violation is defined as any violation recorded in any level roadside inspection that matches the FMCSR cites listed for Vehicle Maintenance (Table 5, Appendix A) during the past 24 months. In cases of multiple counts of the same violation, the CSMS only uses each violation cite once per inspection. A Relevant Inspection is any Vehicle Inspection (Level 1, 2, 5, or 6), including those that do not result in a violation in the BASIC, or any other inspection resulting in applicable BASIC violation. A Severity Weight is assigned to each applicable violation with a value dependent on two parts: (i) the level of crash risk relative to the other violation cites used in the BASIC measurement, and (ii) whether or not the violation resulted in an OOS condition. (i) The level of crash risk is assigned to each applicable violation ranging
from 1 (less severe) to 10 (most severe); see the Vehicle Maintenance table (Table 5, Appendix A) for the corresponding severity weights of each violation cite.
(ii) An OOS weight of 2 is then added to the severity weight of OOS violations. In cases of multiple counts of the same violation, the OOS weight of 2 applies if any of the counts of the violation are OOS.
The sum of all violation severity weights for any one inspection in any one BASIC is capped at a maximum of 30. This cap of 30 is applied before the severity weights are multiplied by the time weight. Note: The severity weights of violations outside of the BASIC being calculated do not count towards the violation cap. A Time Weight of 1, 2, or 3 is assigned to each applicable violation and each relevant inspection based on its age. Violations/inspections recorded in the past 6 months receive a time weight of 3. Violations/inspections recorded between 6 and 12 months ago receive a time weight of 2. All violations/inspections recorded earlier (older than 12 months but within the past 24 months) receive a time weight of 1. This time weighting places more emphasis on results of recent inspections relative to older inspections.
December 2010 3-13
Note: The time weight is applied to all relevant inspections, including those that do not result in a violation in the BASIC.
A Time and Severity Weighted Violation is a violation‘s severity weight multiplied by its time weight.
3.5.2 Calculation of BASIC Percentile Rank
Based on the BASIC measures, the CSMS applies data sufficiency standards and safety event grouping to assign a percentile rank to carriers that can then potentially receive a CSA intervention or detrimental SFD. The calculation is as follows:
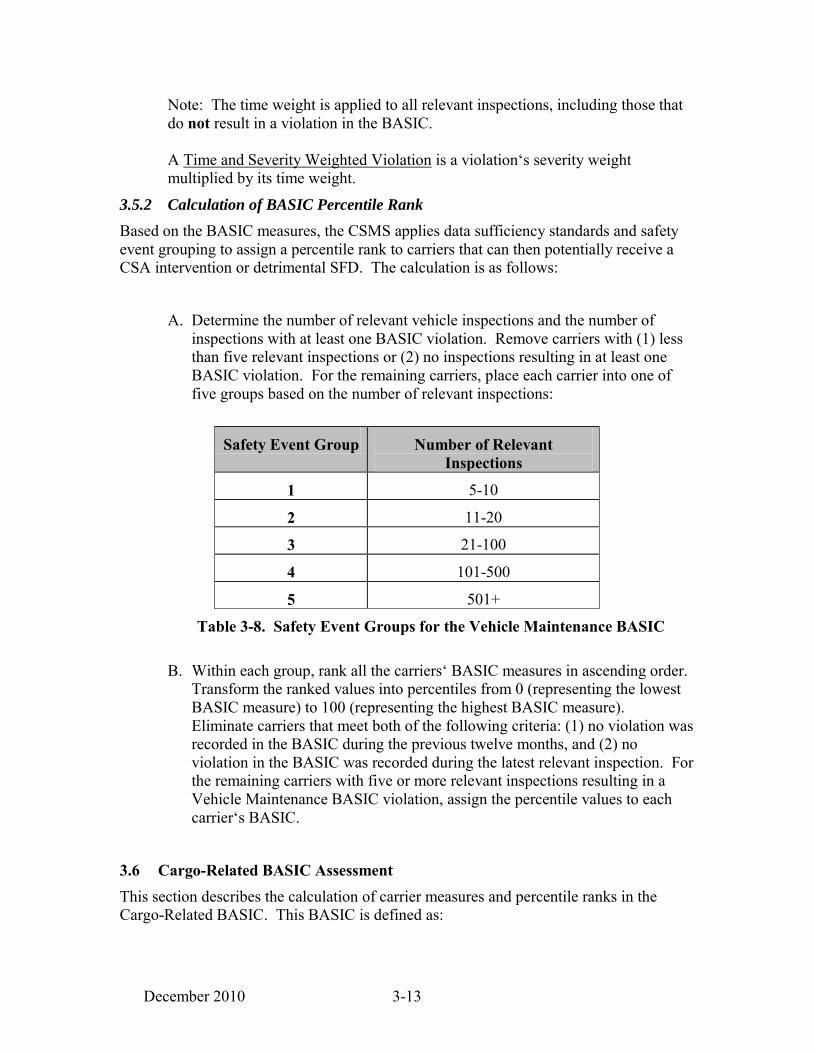
A. Determine the number of relevant vehicle inspections and the number of
inspections with at least one BASIC violation. Remove carriers with (1) less than five relevant inspections or (2) no inspections resulting in at least one BASIC violation. For the remaining carriers, place each carrier into one of five groups based on the number of relevant inspections:
Safety Event Group Number of Relevant Inspections
1 5-10
2 11-20
3 21-100
4 101-500
5 501+
Table 3-8. Safety Event Groups for the Vehicle Maintenance BASIC
B. Within each group, rank all the carriers‘ BASIC measures in ascending order. Transform the ranked values into percentiles from 0 (representing the lowest BASIC measure) to 100 (representing the highest BASIC measure). Eliminate carriers that meet both of the following criteria: (1) no violation was recorded in the BASIC during the previous twelve months, and (2) no violation in the BASIC was recorded during the latest relevant inspection. For the remaining carriers with five or more relevant inspections resulting in a Vehicle Maintenance BASIC violation, assign the percentile values to each carrier‘s BASIC.
3.6 Cargo-Related BASIC Assessment This section describes the calculation of carrier measures and percentile ranks in the Cargo-Related BASIC. This BASIC is defined as:

December 2010 3-14
Failure to properly prevent shifting loads, spilled or dropped cargo, and unsafe handling of hazmat on a CMV. Example violations: improper load securement, cargo retention, and hazmat handling. See Appendix A for a complete list of roadside inspection violations used in the CSMS.
The CSMS assesses the Cargo-Related BASIC using relevant violations recorded during roadside inspections to calculate a measure of each BASIC for individual motor carriers. These measures are used to generate percentile ranks that reflect each carrier‘s safety posture relative to carriers with similar numbers of relevant inspections.
3.6.1 Calculation of BASIC Measure
The equation used for calculating Cargo-Related BASIC measures is as follows:
sinspectionrelevantofweighttimeTotal
violationsapplicableweightedseverityandtimeofTotalMeasureBASIC
Equation 3-7
In this equation, the terms are defined as follows: An Applicable Violation is defined as any violation recorded in any level roadside inspection that matches the FMCSR and HMR cites listed in the Cargo-Related BASIC (Table 6, Appendix A) during the past 24 months. In cases of multiple counts of the same violation, the CSMS only uses each violation cite once per inspection. A Relevant Inspection is any Vehicle Inspection (Level 1, 2, 5, or 6), including those that do not result in a violation in the BASIC, or any other inspection resulting in applicable BASIC violation. A Severity Weight is assigned to each applicable violation with a value dependent on two parts: (i) the level of crash risk relative to the other violation cites used in the BASIC measurement, and (ii) whether or not the violation resulted in an OOS condition. (i) The level of crash risk is assigned to each applicable violation ranging
from 1 (less severe) to 10 (most severe); see the Cargo-Related table (Table 6, Appendix A) for the corresponding severity weights of each violation cite.
(ii) An OOS weight of 2 is then added to the severity weight of OOS violations. In cases of multiple counts of the same violation, the OOS weight of 2 applies if any of the counts of the violation are OOS.
The sum of all violation severity weights for any one inspection in any one BASIC is capped at a maximum of 30. This cap of 30 is applied before the severity weights are multiplied by the time weight. Note: The severity weights of violations outside of the BASIC being calculated do not count towards the violation cap.

December 2010 3-15
A Time Weight of 1, 2, or 3 is assigned to each applicable violation and each relevant inspection based on its age. Violations/inspections recorded in the past 6 months receive a time weight of 3. Violations/inspections recorded between 6 and 12 months ago receive a time weight of 2. All violations/inspections recorded earlier (older than 12 months but within the past 24 months) receive a time weight of 1. This time weighting places more emphasis on results of recent inspections relative to older inspections. Note: The time weight is applied to all relevant inspections, including those that do not result in a violation in the BASIC.
A Time and Severity Weighted Violation is a violation‘s severity weight multiplied by its time weight.
3.6.2 Calculation of BASIC Percentile Rank
Based on the BASIC measures, the CSMS applies data sufficiency standards and safety event grouping to assign a percentile rank to carriers that can then potentially receive a CSA intervention or detrimental SFD. The calculation is as follows:
A. Determine the number of relevant vehicle inspections and the number of inspections with at least one BASIC violation. Remove carriers with (1) less than five relevant inspections or (2) no inspections resulting in at least one BASIC violation. For the remaining carriers, place each carrier into one of five groups based on the number of relevant inspections:
Safety Event Group Number of Relevant Inspections
1 5-10
2 11-20
3 21-100
4 101-500
5 501+
Table 3-9. Safety Event Groups for the Cargo-Related BASIC
B. Within each group, rank all the carriers‘ BASIC measures in ascending order. Transform the ranked values into percentiles from 0 (representing the lowest BASIC measure) to 100 (representing the highest BASIC measure). Eliminate carriers that meet both of the following criteria: (1) no violation was recorded in the BASIC during the previous twelve months, and (2) no

December 2010 3-16
violation in the BASIC was recorded during the latest relevant inspection. For the remaining carriers with five or more relevant inspections resulting in a Cargo-Related BASIC violation, assign the percentile values to each carrier‘s BASIC.
3.7 Crash Indicator Assessment This section describes the calculation of carrier measures and percentile ranks for the Crash Indicator. The Crash Indicator is defined as:
Histories or patterns of high crash involvement, including frequency and severity, based on information from state-reported crash reports.
The crash history used by the Crash Indicator is not specifically a behavior; rather, it is the consequence of behavior and may indicate a problem that warrants attention. The CSMS assesses the Crash Indicator using relevant state-reported crash data reported in MCMIS. Individual carriers‘ Crash Indicator measures also incorporate carrier size in terms of PUs and annual VMT. These measures are used to generate percentile ranks that reflect each carrier‘s safety posture relative to carriers in the same segment with similar numbers of crashes.
3.7.1 Calculation of Crash Indicator Measure
The Crash Indicator measure is calculated as the sum of severity and time weighted crashes divided by carrier average PUs multiplied by a Utilization Factor, as follows:
FactornUtilizatioxPUsAverage
crashesapplicableweightedseverityandtimeofTotalMeasureIndicatorCrash
Equation 3-8
In this equation, the terms are defined as follows: An Applicable Crash is a state-reported crash that meets the reportable crash standard during the past 24 months. A reportable crash is one that results in at least one fatality; one injury where the injured person is taken to a medical facility for immediate medical attention; or, one vehicle having been towed from the scene as a result of disabling damage caused by the crash (i.e., tow-away). A Crash Severity Weight places more weight on crashes with more severe consequences. For example, a crash involving an injury or fatality is weighted more heavily than a crash where only a tow-away occurred. A hazmat release also increases the weighting of a crash, as shown in Table 3-9.
Crash Type Crash Severity Weight
Involves tow-away but no injury or fatality
1

December 2010 3-17
Involves injury or fatality 2
Involves a hazmat release Crash Severity Weight (from above) + 1
Table 3-10. Crash Severity Weights for Crash Indicator
A Time Weight of 1, 2, or 3 is assigned to each applicable crash based on the time elapsed since the crash occurred. Crashes that occurred within 6 months of the measurement date receive a time weight of 3. Crashes that occurred between 6 and 12 months prior to the measurement date receive a time weight of 2. All crashes that happened later (older than 12 months but within the past 24 months of the measurement date) receive a time weight of 1. This time weighting places more emphasis on recent crashes relative to older crashes. A Time and Severity Weighted Crash is a crash‘s severity weight multiplied by its time weight. Average Power Units (PUs) are used in part to account for each carrier‘s level of exposure when calculating the BASIC measure. The number of owned, term-leased, and trip-leased PUs (trucks, tractors, hazardous material tank trucks, motor coaches, and school buses) contained in the Census data are used to calculate the PU totals. The average PUs for each carrier is calculated using (i) the carrier‘s current number of PUs, (ii) the number of PUs the carrier had 6 months ago, and (iii) the number of PUs the carrier had 18 months ago. The average PU calculation is shown below:
3186 Months
PUMonths
PUCurrent
PUAveragePU
Equation 3-9
The Utilization Factor is a multiplier that adjusts the average PU values based on the utilization in terms of VMT per average PU where VMT data in the past 24 months are available. The primary sources of VMT information in the Census are: (1) Form MCS-150, filled out by the carrier, and (2) Form MCS-151, filled out by law enforcement as part of an investigation. Carriers are required to update their MCS-150 information biennially. In cases where the VMT data has been obtained multiple times over the past 24 months for the same carrier, the most current positive VMT figure is used. The Utilization Factor is calculated by the following three steps:
(i) Carrier Segment There are two segments into which each motor carrier is categorized:
―Combo‖ – combination trucks/motor coach buses constituting 70% or more of the total PU

December 2010 3-18
―Straight‖ – straight trucks/other vehicles constituting more than 30% of the total PU
(ii) VMT per Average PU The VMT per average PU is derived by taking the most recent positive VMT data and dividing it by the average PUs (defined above). (iii) Utilization Factor Given the information in (i) and (ii), the Utilization Factor is determined from the following tables:
Combo Segment
VMT per Average PU Utilization Factor
< 80,000 1
80,000 - 160,000 1+0.6[(VMT per PU-80,000) / 80,000]
160,000 - 200,000 1.6
> 200,000 1
No Recent VMT Information 1
Table 3-11. VMT per PU for Combo Segment
Straight Segment
VMT per Average PU Utilization Factor
< 20,000 1
20,000 - 60,000 VMT per PU / 20,000
60,000 - 200,000 3
> 200,000 1
No Recent VMT Information 1
Table 3-12. VMT per Average PU for Straight Segment
3.7.2 Calculation of Crash Indicator Percentile Rank
Based on the Crash Indicator measures, the CSMS applies data sufficiency standards and Safety Event Grouping to assign a percentile rank to carriers that can potentially receive a CSA intervention. The calculation is as follows:
A. Determine the carrier‘s segment: ―Combo‖ – combination trucks/motor coach buses constituting
70% or more of the total PU.

December 2010 3-19
―Straight‖ – straight trucks/other vehicles constituting more than 30% of the total PU.
B. For carriers with two or more applicable crashes, place each carrier into one of ten groups based on the carrier segment and number of crashes:
Crash Indicator: Combo Segment
Safety Event Group Number of Crashes
Combo 1 2-3
Combo 2 4-6
Combo 3 7-16
Combo 4 17-45
Combo 5 46+
Table 3-13. Safety Event Groups for Crash Indicator: Combo Segment
Crash Indicator: Straight Segment
Safety Event Group Number of Crashes
Straight 1 2
Straight 2 3-4
Straight 3 5-8
Straight 4 9-26
Straight 5 27+
Table 3-14. Safety Event Groups for Crash Indicator: Straight Segment
C. Within each group, rank all the carriers‘ Crash Indicator measures in ascending order. Transform the ranked values into percentiles from 0 (representing the lowest indicator measure) to 100 (representing the highest indicator measure). Remove carriers that did not have a crash recorded in the previous twelve months. Carriers that remain retain the previously calculated percentile.

December 2010 4-1
4. DSMS Methodology
The DSMS is the other major component of the SMS, along with the CSMS. Law enforcement officials use the DSMS results to examine the safety performance of individual CMV drivers when conducting CSA investigations. Currently, the DSMS results are being used strictly as an investigative tool for law enforcement and are not available to carriers, drivers, or the public. However, the raw safety information from roadside inspections and crashes that feeds the DSMS is compiled by the same system that provides CMV driver-based data to FMCSA‘s Driver Pre-Employment Screening Program (PSP). This new program allows motor carriers to access driver inspection and crash records electronically as a part of the hiring process.4 This section describes the algorithms used in the DSMS methodology and the computational logic used to calculate the driver measures and percentiles for each BASIC and the Crash Indicator for individual CMV drivers. BASICs that are evaluated similarly are described together.
Unsafe Driving BASIC and Controlled Substances/Alcohol BASIC
Fatigued Driving (HOS) BASIC and Driver Fitness BASIC
Vehicle Maintenance BASIC and Cargo-Related BASIC
Crash Indicator
4.1 Unsafe Driving BASIC and Controlled Substances/Alcohol BASIC Assessment This section describes the measurement of the Unsafe Driving BASIC and the Controlled Substances/Alcohol BASIC. The definition of each BASIC is as follows:
Unsafe Driving BASIC—Operation of CMVs in a dangerous or careless manner. Example violations: speeding, reckless driving, improper lane change, and inattention.
Controlled Substances/Alcohol BASIC—Operation of CMVs by drivers who are impaired due to alcohol, illegal drugs, and misuse of prescription or over-the-counter medications. Example violations: use or possession of controlled substances or alcohol.
The DSMS assesses both the Unsafe Driving BASIC and Controlled Substances/Alcohol BASIC by using applicable violations recorded during roadside inspections to calculate a measure in each BASIC for individual drivers. These measures are used to generate percentile ranks that reflect drivers‘ safety postures relative to drivers with applicable violations.
4 More information about the PSP program can be found on FMCSA‘s PSP website at http://www.psp.fmcsa.dot.gov/.

December 2010 4-2
4.1.1 Calculation of BASIC Measure
The BASIC measures for the Unsafe Driving and Controlled Substances/Alcohol BASICs are calculated as the sum of severity and time weighted applicable violations as follows: BASICMeasure Total of time and severity weighted applicableviolations
Equation 4-1
In this equation, the terms are defined as follows:
An Applicable Violation is defined as any violation recorded in any level roadside inspection that matches the FMCSR and HMR cites listed for Unsafe Driving (Table 1, Appendix A) and Controlled Substances/Alcohol (Table 4, Appendix A) during the past 36 months, and for which the CMV driver can be held responsible (see ‗Violation in the DSMS (Y/N)‘ column). In cases of multiple counts of the same violation, the DSMS only uses each violation cite once per inspection. A Severity Weight from 1 (less severe) to 10 (most severe) is assigned to each applicable violation. See the Unsafe Driving Table (Table 1, Appendix A) and the Controlled Substance and Alcohol Table (Table 4, Appendix A) for the corresponding severity weights of each violation cite. The severity weighting of each violation cite accounts for the level of crash risk relative to the other violation cites used in the BASIC measurement. The sum of all violation severity weights for any one inspection in any one BASIC is capped at a maximum of 30. This cap of 30 is applied before the severity weights are multiplied by the time weight. Note: The severity weights of violations outside of the BASIC being calculated do not count towards the violation cap. A Time Weight of 1, 2, or 3 is assigned to each applicable violation based on how long ago a violation on the inspection was recorded. Violations recorded in the past 12 months receive a time weight of 3. Violations recorded between 12 and 24 months ago receive a time weight of 2. All violations recorded earlier (older than 24 months but within the past 36 months) receive a time weight of 1. This time weighting places more emphasis on recent violations relative to older violations. A Time and Severity Weighted Violation is a violation‘s severity weight multiplied by its time weight.

December 2010 4-3
4.1.2 Calculation of BASIC Percentile Rank
Based on the BASIC measures, the DSMS applies data sufficiency standards to assign a percentile rank to drivers who can then potentially be subjected to a CSA intervention. The calculation is as follows:
A. Determine the total number of inspections with at least one BASIC violation. Remove drivers with no BASIC violations.
B. Rank all the drivers‘ BASIC measures in ascending order. Transform the
ranked values into percentiles from 0 (representing the lowest BASIC measure) to 100 (representing the highest BASIC measure). Then, assign the percentile values for that BASIC to each driver.
4.2 Fatigued Driving (HOS) BASIC and Driver Fitness BASIC Assessment This section describes the measurement of the Fatigued Driving (HOS) BASIC and the Driver Fitness BASIC. The definition of each BASIC is as follows:
Fatigued Driving (HOS) BASIC—Operation of CMVs by drivers who are ill, fatigued, or in noncompliance with the Hours-of-Service (HOS) regulations. This BASIC includes violations of regulations surrounding the complete and accurate recording of logbooks as they relate to HOS requirements and the management of CMV driver fatigue. Instances related to the Fatigued Driving (HOS) BASIC are distinguished from incidents where unconsciousness or an inability to react is brought about by the use of alcohol, drugs, or other controlled substances. Example violations include: HOS, logbook, and operating a CMV while ill or fatigued.
Driver Fitness BASIC—Operation of CMVs by drivers who are unfit to operate a CMV due to lack of training, experience, or medical qualifications. Example violations: failure to have a valid and appropriate CDL and being medically unqualified to operate a CMV.
The DSMS assesses both the Fatigued Driving (HOS) BASIC and Driver Fitness BASIC using applicable violations recorded during roadside inspections to calculate a measure in each BASIC for individual drivers. These measures are used to generate percentile ranks that reflect drivers‘ relative safety posture.
4.2.1 Calculation of BASIC Measure
The equation used for calculating the BASIC measure for Fatigued Driving (HOS) and Driver Fitness is as follows:
sinspectionrelevantofweighttimeTotal
violationsapplicableweightedseverityandtimeofTotalMeasureBASIC

December 2010 4-4
Equation 4-2
In this equation, the terms are defined as follows: An Applicable Violation is defined as any violation recorded in any level roadside inspection that matches the FMCSR and HMR cites listed for Fatigued Driving (HOS) (Table 2, Appendix A) and Driver Fitness (Table 3, Appendix A) during the past 36 months, and for which the CMV driver can be held responsible (see ‗Violation in the DSMS (Y/N)‘ column). In cases of multiple counts of the same violation, the DSMS only uses each violation cite once per inspection. A Relevant Inspection is any Driver Inspection (Level 1, 2, 3, or 6), including those that do not result in a violation in the BASIC, or any other inspection resulting in applicable BASIC violation. A Severity Weight is assigned to each applicable violation, with a value dependent on two parts: (i) the level of crash risk relative to the other violation cites used in the BASIC measurement, and (ii) whether or not the violation resulted in an OOS condition.
(i) The level of crash risk is assigned to each applicable violation ranging from 1 (less severe) to 10 (most severe); see the Fatigued Driving (HOS) Table (Table 2, Appendix A) and the Driver Fitness Table (Table 3, Appendix A) for the corresponding severity weights of each violation cite.
(ii) An OOS weight of 2 is then added to the severity weight of OOS violations. In cases of multiple counts of the same violation, if any of the counts of the violation are OOS then the OOS weight of 2 applies.
The sum of all violation severity weights for any one inspection in any one BASIC is capped at a maximum of 30. This cap of 30 is applied before the severity weights are multiplied by the time weight. Note: The severity weights of violations outside of the BASIC being calculated do not count towards the violation cap. A Time Weight of 1, 2, or 3 is assigned to each applicable violation and each relevant inspection based on its age. Violations/inspections recorded in the past 12 months receive a time weight of 3. Violations/inspections recorded between 12 and 24 months ago receive a time weight of 2. All violations/inspections recorded earlier (older than 24 months but within the past 36 months) receive a time weight of 1. This time weighting places more emphasis on results of recent inspections relative to older inspections. Note: The time weight is applied to all relevant inspections, including those that do not result in a violation in the BASIC. A Time and Severity Weighted Violation is a violation‘s severity weight multiplied by its time weight.
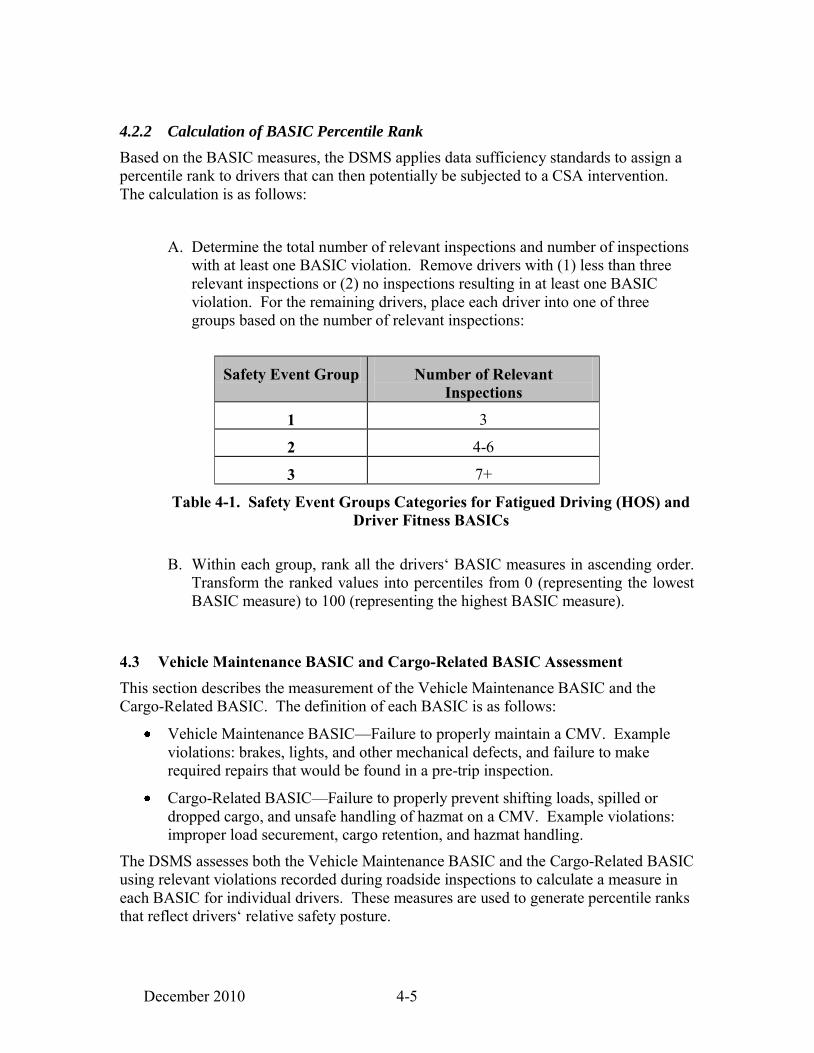
December 2010 4-5
4.2.2 Calculation of BASIC Percentile Rank
Based on the BASIC measures, the DSMS applies data sufficiency standards to assign a percentile rank to drivers that can then potentially be subjected to a CSA intervention. The calculation is as follows:
A. Determine the total number of relevant inspections and number of inspections
with at least one BASIC violation. Remove drivers with (1) less than three relevant inspections or (2) no inspections resulting in at least one BASIC violation. For the remaining drivers, place each driver into one of three groups based on the number of relevant inspections:
Safety Event Group Number of Relevant Inspections
1 3
2 4-6
3 7+
Table 4-1. Safety Event Groups Categories for Fatigued Driving (HOS) and Driver Fitness BASICs
B. Within each group, rank all the drivers‘ BASIC measures in ascending order.
Transform the ranked values into percentiles from 0 (representing the lowest BASIC measure) to 100 (representing the highest BASIC measure).
4.3 Vehicle Maintenance BASIC and Cargo-Related BASIC Assessment This section describes the measurement of the Vehicle Maintenance BASIC and the Cargo-Related BASIC. The definition of each BASIC is as follows:
Vehicle Maintenance BASIC—Failure to properly maintain a CMV. Example violations: brakes, lights, and other mechanical defects, and failure to make required repairs that would be found in a pre-trip inspection.
Cargo-Related BASIC—Failure to properly prevent shifting loads, spilled or dropped cargo, and unsafe handling of hazmat on a CMV. Example violations: improper load securement, cargo retention, and hazmat handling.
The DSMS assesses both the Vehicle Maintenance BASIC and the Cargo-Related BASIC using relevant violations recorded during roadside inspections to calculate a measure in each BASIC for individual drivers. These measures are used to generate percentile ranks that reflect drivers‘ relative safety posture.

December 2010 4-6
4.3.1 Calculation of BASIC Measure
The equation used for calculating the Vehicle Maintenance and Cargo-Related BASIC measures is as follows:
sinspectionrelevantofweighttimeTotal
violationsapplicableweightedseverityandtimeofTotalMeasureBASIC
Equation 4-3
In this equation, the terms are defined as follows: An Applicable Violation is any violation recorded in any level roadside inspection that matches the FMCSR and HMR cites listed for Vehicle Maintenance (Table 5, Appendix A) and Cargo-Related (Table 6, Appendix A) BASICs during the past 36 months, and for which the CMV driver can be held responsible (‗see ‗Violation in the DSMS (Y/N)‘ column). In cases of multiple counts of the same violation, the DSMS only uses each violation cite once per inspection. A Relevant Inspection is any Vehicle Inspection (Level 1, 2, 5, or 6), including those that do not result in a violation in the BASIC, or any other inspection resulting in applicable BASIC violation. A Severity Weight is assigned to each applicable violation with a value dependent on two parts: (i) the level of crash risk relative to the other violation cites used in the BASIC measurement, and (ii) whether or not the violation resulted in an OOS condition. (i) The level of crash risk is assigned to each applicable violation ranging
from 1 (less severe) to 10 (most severe); see the Vehicle Maintenance Table (Table 5, Appendix A) and the Cargo-Related (Table 6, Appendix A) BASICs for the corresponding severity weights of each violation cite.
(ii) An OOS weight of 2 is then added to the severity weight of OOS violations. In cases of multiple counts of the same violation, if any of the counts of the violation are OOS then the OOS weight of 2 applies.
The sum of all violation severity weights for any one inspection in any one BASIC is capped at a maximum of 30. This cap of 30 is applied before the severity weights are multiplied by the time weight. Note: The severity weights of violations outside of the BASIC being calculated do not count towards the violation cap. A Time Weight of 1, 2, or 3 is assigned to each applicable violation and each relevant inspection based on its age. Violations/inspections recorded in the past 12 months receive a time weight of 3. Violations/inspections recorded between 12 and 24 months ago receive a time weight of 2. All violations/inspections recorded earlier (older than 24 months but within the past 36 months) receive a

December 2010 4-7
time weight of 1. This time weighting places more emphasis on results of recent inspections relative to older inspections. Note: The time weight is applied to all relevant inspections, including those that do not result in a violation in the BASIC. A Time and Severity Weighted Violation is a violation‘s severity weight multiplied by its time weight.
4.3.2 Calculation of BASIC Percentile Rank
Based on the BASIC measures, the DSMS applies data sufficiency standards to assign a percentile rank to drivers that can then potentially be subjected to a CSA intervention. The calculation is as follows:
A. Determine the total number of relevant vehicle inspections and the number of
inspections with at least one BASIC violation. Remove drivers with (1) less than three relevant inspections or (2) no inspections resulting in at least one BASIC violation. For the remaining drivers, place each driver into one of three groups based on the number of relevant inspections:
Safety Event Group Number of Relevant Inspections
1 3
2 4-6
3 7+
Table 4-2. Safety Event Groups for Vehicle Maintenance and Cargo-Related BASICs
B. Within each group, rank all the drivers‘ BASIC measures in ascending order.
Transform the ranked values into percentiles from 0 (representing the lowest BASIC measure) to 100 (representing the highest BASIC measure).
4.4 Crash Indicator Assessment This section describes the measurement of the Crash Indicator. The definition of the Crash Indicator is as follows:
Crash Indicator—Histories or patterns of high crash involvement, including frequency and severity, based on information from state-reported crash reports.
The crash history used by the Crash Indicator is not specifically a behavior; rather, it is the consequence of behavior and may indicate a problem that warrants attention.

December 2010 4-8
The DSMS assesses the Crash Indicator using relevant state-reported crash data to calculate a measure of the indicator for individual drivers. This measure is used to generate percentile ranks that reflect drivers‘ relative crash posture.
4.4.1 Calculation of Crash Indicator Measure
The equation used for calculating the Crash Indicator measure is as follows:
crashesapplicableweightedseverityandtimeofTotalMeasureIndicatorCrash
Equation 4-4
In this equation, the terms are defined as follows: An Applicable Crash is based on crash reports provided by the states for each crash that meets the reportable crash standard during the past 36 months. A reportable crash is one that results in at least one fatality; one injury where the injured person is taken to a medical facility for immediate medical attention; or, one vehicle having been towed from the scene as a result of disabling damage caused by the crash (i.e., tow-away). Crash Severity Weight places more weight on crashes with more severe consequences. For example, a crash involving an injury or fatality is weighted more heavily than a crash where only a tow-away occurred. A hazmat release also increases the weighting of a crash, as shown in Table 4-3.
Crash Type Crash Severity Weight
Involves tow-away but no injury or fatality
1
Involves injury or fatality
2
Involves a hazmat release
Crash Severity Weight (from above) + 1
Table 4-3. Crash Severity Weights for Crash Indicator
A Time Weight of 1, 2, or 3 is assigned to each applicable crash based on the time elapsed since it occurred. Crashes that occurred in the past 12 months receive a time weight of 3. Crashes that occurred between 12 and 24 months ago receive a time weight of 2. All crashes that happened later (older than 24 months but within the past 36 months) receive a time weight of 1. This time weighting places more emphasis on recent crashes relative to older crashes.
December 2010 4-9
A Time and Severity Weighted Crash is a crash‘s severity weight multiplied by its time weight.
4.4.2 Calculation of Crash Indicator Percentile Rank
Based on the Crash Indicator measures, the DSMS applies data sufficiency standards and assigns a percentile rank to drivers who then can potentially receive a CSA intervention. The calculation is as follows:
A. Identify drivers with at least one applicable crash. B. Rank all the drivers‘ Crash Indicator measures in ascending order. Transform
the ranked values into percentiles from 0 (representing the lowest indicator measure) to 100 (representing the highest indicator measure). Then, assign the percentile values to each driver.

December 2010 5-1
5. Sample SMS Measurement Examples
A web-based interface was developed to display the SMS results. The website provides a query capability allowing a user to search an entity of interest or identify the worst-performing entities in each BASIC and Crash Indicator. Also available is a drill-down capability that displays all the BASIC and Crash Indicator results of an individual entity and the safety events used in determining the BASIC percentile.
5.1 Sample SMS Output Figure 5-1 is a screenshot of the SMS carrier overview page for an actual carrier with the identifying fields obscured. This summary page provides carrier identification information (e.g., name, USDOT number), current safety information (e.g., investigation, inspection, and crash activity), and SMS performance information (e.g., BASIC on-road percentile, investigation status, and performance status). The BASIC percentiles above the CSA Intervention Thresholds are outlined in orange. Note that the carrier in Figure 5-1 is at 99.8% in the Unsafe Driving BASIC, 95.7% in the Fatigued Driving (HOS) BASIC, and 99.3% in the Driver Fitness BASIC. These BASIC percentiles mean that this carrier has demonstrated worse safety performance than 99.8%, 95.7%, and 99.3%, respectively, of the other carriers evaluated in these BASICs (and will be prioritized for an intervention by FMCSA accordingly as indicated by the alert status).
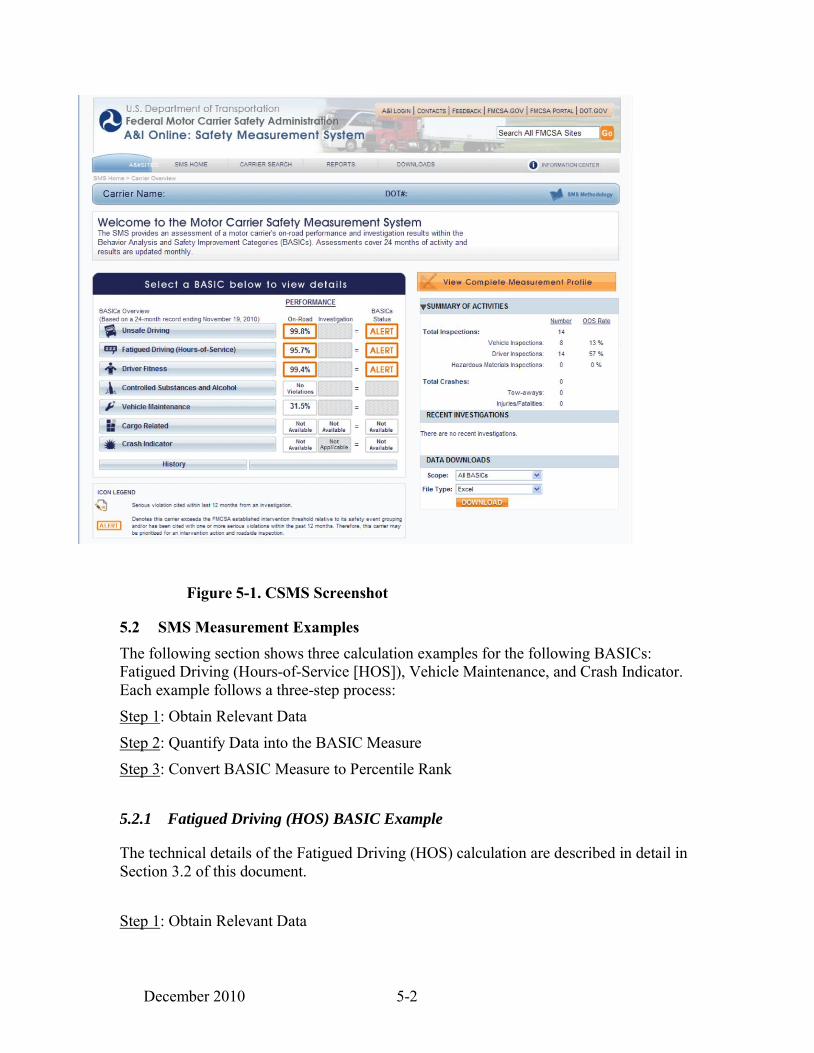
December 2010 5-2
Figure 5-1. CSMS Screenshot
5.2 SMS Measurement Examples The following section shows three calculation examples for the following BASICs: Fatigued Driving (Hours-of-Service [HOS]), Vehicle Maintenance, and Crash Indicator. Each example follows a three-step process: Step 1: Obtain Relevant Data
Step 2: Quantify Data into the BASIC Measure Step 3: Convert BASIC Measure to Percentile Rank
5.2.1 Fatigued Driving (HOS) BASIC Example
The technical details of the Fatigued Driving (HOS) calculation are described in detail in Section 3.2 of this document.
Step 1: Obtain Relevant Data

December 2010 5-3
Twenty-four months of inspection and violation data are required to calculate the BASIC measure and percentile. The following screenshot displays 24 months of inspection data for the Fatigued Driving (HOS) BASIC:
Figure 5-2. Example: Fatigued Driving (HOS) Inspection/Violation List
The figure above displays the following: 1. The five relevant inspections (numbered 1 through 5) for the Fatigued Driving (HOS)
BASIC. Relevant inspections are all Driver Inspections (Level I, II, III, and VI), including those that do not result in a violation in the BASIC plus any other inspection that does result in a Fatigued Driving (HOS) BASIC violation. Of the five relevant inspections, two do not result in a BASIC violation (inspection numbers 2 and 3) and three do result in violations in the BASIC (inspection numbers 1, 4, and 5).
2. The applicable Fatigued Driving (HOS) violations cited during relevant inspections as indicated in inspections 1, 4, and 5. Example violations include HOS, logbook, and operating a CMV while ill or fatigued. A complete list of applicable violations in the Fatigued Driving (HOS) BASIC is found in Appendix A, Table 2.
Factors to consider when compiling the list of relevant inspections and applicable violations are as follows:
Factor to consider: Some inspections are conducted after a CMV has been involved in a crash. Such inspections are noted as post-crash inspections. In
Rel
evan
t Ins
pect
ions
Applicable Violations
Applicable Violations
Applicable Violations

December 2010 5-4
post-crash inspections, only violations found in the pre-crash phase are included in the measure calculation (See the Vehicle Maintenance example).
Factor to consider: In cases of multiple counts of the same violation, the CSMS only uses the cited violation once. If any of these violations are out-of-service (OOS), the OOS violation will be used in CSMS. In Figure 5-3 there are two 395.3(b) violations shown in the detailed inspection report: one is an OOS violation and the other is not. The CSMS only uses the OOS violation in the calculation.
Figure 5-3. Example: Fatigued Driving (HOS) Detailed Inspection Report
Step 2: Quantify Data into the BASIC Measure
Figure 5-4 displays the additional information required for the calculation in the "Measure" section:

December 2010 5-5
Figure 5-4. Example: Fatigued Driving (HOS)Inspection/Violation/ Measure Report
The following are the major components needed to calculate the BASIC measure. Each component (A-F) is labeled on Figure 5-4. A. Severity Weight of a violation is the Violation Weight + OOS Weight, where:
Violation Weight – applicable violations have a corresponding violation weight that can be found in Appendix A of this document. The violation weight ranges from 1 (less severe) to 10 (most severe)

December 2010 5-6
and is assigned based on the violation‘s relationship to crash risk. The violation weights cannot be compared across BASICs.
Out-of-Service (OOS) Weight – a violation resulting in an OOS condition is given a weight of 2, otherwise the weight is 0.
B. Time Weight of 1, 2, or 3 is assigned to each violation and inspection based on its age. The most recent violations and inspections are given higher weights. The weights are as follows:
Less than 6 months = time weight of 3
6 months – less than 1 year = time weight of 2
1 year – less than 2 years = time weight of 1
2 years and older = not used in measurement system
C. Time and Severity Weight (AxB) – severity weight multiplied by the time weight D. Total Inspection Time Weight of all relevant inspections (sum of column B) E. Total Time and Severity Weight of all relevant inspections (sum of column C)
F. Fatigued Driving (HOS) BASIC Measure – the BASIC measure is calculated by dividing the sum of the time/severity weight for all applicable violations (E) by the sum of the inspection time weight for all relevant inspections (D).
Example of Relevant Inspection with Applicable Violations - Inspection #1:
Figure 5-5. Example: Fatigued Driving (HOS) Inspection #1
A. Severity Weight –Violation Weight + OOS Weight for each applicable violation. The
severity weight for each applicable violation is then summed to the inspection level.
395.3(a)(1) severity weight = 7 (violation weight) + 2 (OOS weight) = 9
395.3(b)(1) severity weight = 7 (violation weight) + 2 (OOS weight) = 9
Total Severity Weight for Inspection (sum of the severity weight for each applicable violation) – a + b from above = 9 + 9 = 18
Factor to consider: The total severity weight for an inspection is the sum of the applicable violation severity weight, but cannot exceed 30. If the total severity weight for an inspection within a BASIC is greater than 30, then the
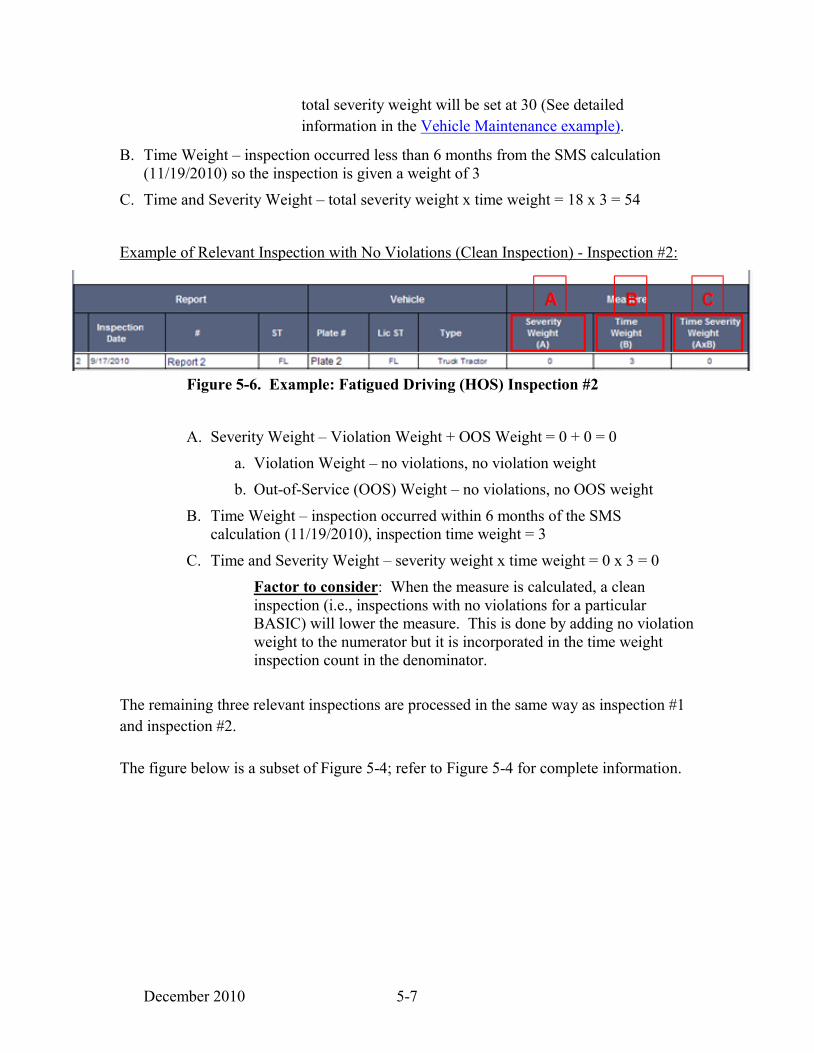
December 2010 5-7
total severity weight will be set at 30 (See detailed information in the Vehicle Maintenance example).
B. Time Weight – inspection occurred less than 6 months from the SMS calculation (11/19/2010) so the inspection is given a weight of 3
C. Time and Severity Weight – total severity weight x time weight = 18 x 3 = 54
Example of Relevant Inspection with No Violations (Clean Inspection) - Inspection #2:
Figure 5-6. Example: Fatigued Driving (HOS) Inspection #2
A. Severity Weight – Violation Weight + OOS Weight = 0 + 0 = 0 a. Violation Weight – no violations, no violation weight b. Out-of-Service (OOS) Weight – no violations, no OOS weight
B. Time Weight – inspection occurred within 6 months of the SMS calculation (11/19/2010), inspection time weight = 3
C. Time and Severity Weight – severity weight x time weight = 0 x 3 = 0 Factor to consider: When the measure is calculated, a clean inspection (i.e., inspections with no violations for a particular BASIC) will lower the measure. This is done by adding no violation weight to the numerator but it is incorporated in the time weight inspection count in the denominator.
The remaining three relevant inspections are processed in the same way as inspection #1 and inspection #2. The figure below is a subset of Figure 5-4; refer to Figure 5-4 for complete information.

December 2010 5-8
Figure 5-7. Example: Fatigued Driving (HOS) Measure Calculation
D. Sum of the inspection time weight for all relevant inspections = 3 + 3 + 1 +1 + 1 = 9
E. Sum of the time/severity weight for all relevant inspections = 54 + 0 + 0 + 5 + 7 = 66 F. Fatigued Driving (HOS) BASIC Measure – the BASIC measure is calculated by
dividing the sum of the time/severity weight for all applicable violations (E) by the sum of the inspection time weight for all relevant inspections (D).
33.7966
E
D
sinspectionallforweighttimeTotal
violationsapplicableweightedseverityandtimeofTotalMeasureBASIC
Step 3: Convert BASIC Measure to Percentile Rank
The percentile rank is a relative comparison among all active U.S. domiciled interstate and intrastate HM motor carriers; therefore, this step cannot be calculated without all 700,000 plus motor carriers‘ Fatigued Driving (HOS) BASIC measures. However, with applicable data, the SMS calculates the percentile rank as follows.

December 2010 5-9
The percentile rank is calculated by ranking the carriers‘ BASIC measures. There are four components to consider when calculating the percentile rank. Data Sufficiency (A) and Safety Event Group (B) are applied prior to calculating the percentile rank and Critical Mass (C) and Recent Activity (D) are applied afterwards.
The following shows information required to determine the percentile:
Figure 5-8. Example: Fatigued Driving (HOS) On-Road Performance Summary
A. Data Sufficiency The CSMS applies data sufficiency standards to assign a percentile rank; if the data sufficiency standards are not met, the carrier will not be assigned a percentile rank. For the Fatigued Driving (HOS) BASIC, both of the following conditions are required:
1. At least three relevant inspections. The example carrier has five relevant inspections, shown by the letter A in
the Figure above; data sufficiency is met. 2. At least one inspection resulting in a BASIC violation.
The example carrier has three inspections with a Fatigued Driving (HOS) violation, shown by the letter C in the Figure above; data sufficiency is met.
B. Safety Event Group The CSMS uses safety event groups to assign percentiles. Each carrier meeting the conditions in A is placed into a safety event group based on the number of relevant
C A
B

December 2010 5-10
inspections. The example carrier above has five relevant inspections so they are placed in safety event group 1, 3-10 relevant inspections.
Safety Event Group Number of Relevant Inspections
1 3-10
2 11-20
3 21-100
4 101-500
5 501+
Table 5-1. Safety Event Group Categories for Fatigued Driving (HOS)
Calculate percentile rank by ranking all the carriers‘ BASIC measures in ascending order within the same safety event group. In this case, the example carrier would have its BASIC measure ranked against all carriers with 3-10 relevant inspections. Transform the ranked values into percentiles from 0 (representing the lowest BASIC measure) to 100 (representing the highest BASIC measure). The example carrier‘s percentile rank is 96.7 as shown by Figure 5-7. C. Critical Mass Remove carriers‘ percentiles that do not have at least three inspections with a Fatigued Driving (HOS) violation. As shown by letter C in Figure 5-8, the carrier has three inspections with a violation, so it meets the critical mass condition. D. Recent Activity
Remove carriers‘ percentiles that do not have any recent activity. Recent activity in this BASIC is defined as follows:
a. No violation recorded in the BASIC during the previous 12 months The example carrier‘s most recent violation was recorded on 9/29/2010, which is less than 12 months from the snapshot date 11/19/2010 as shown in Figure 5-12.
AND
b. No violation recorded in the BASIC during the latest relevant inspection The example carrier‘s most recent relevant inspection on 9/29/2010 had applicable Fatigued Driving (HOS) violations as

December 2010 5-11
shown in Figure 5-12. Example: Vehicle Maintenance
Inspection/Violation/ Measure Report Therefore, the carrier‘s percentile remains at 96.7.
Figure 5-9. Example: Fatigued Driving (HOS) Measure and Percentile Calculation
5.2.2 Vehicle Maintenance BASIC Example
The technical details of the Vehicle Maintenance calculation are described in detail in section 3.5 of this document.
Step 1: Obtain Relevant Data
Twenty-four months of inspection and violation data are required to calculate the BASIC measure and percentile. The following screenshot displays 24 months of inspection data for the Vehicle Maintenance BASIC:

December 2010 5-12
Figure 5-10. Example: Vehicle Maintenance Relevant Inspection List
Applicable Violations
Applicable Violations
ApplicableViolations
Rel
evan
t Ins
pect
ions
Applicable Violations
Applicable Violations
Applicable Violations
Applicable Violations

December 2010 5-13
The figure above displays the following: 1. The 10 relevant inspections (numbered 1 – 10) for the Vehicle Maintenance
BASIC. Relevant inspections are all Vehicle Inspections (Level I, II, V, and VI), including those that do not result in a violation in the BASIC, plus any other inspection that does result in a Vehicle Maintenance BASIC violation. Of the 10 relevant inspections, three do not result in a BASIC violation (inspection numbers 1, 2, and 7) and seven do result in a BASIC violation.
2. The applicable Vehicle Maintenance violations cited during relevant inspections as indicated in inspections 3, 4, 5, 6, 8, 9, and 10. Example violations include brakes, lights, other mechanical defects, and failure to make required repairs. A complete list of applicable violations in the Vehicle Maintenance BASIC can be found in Appendix A, Table 5.
Factors to consider when compiling the list of relevant inspections and applicable violations are as follows:
Factor to consider: In cases of multiple counts of the same violation on a single inspection, the CSMS only uses the cited violation once. If any of these violations are OOS, the OOS violation will be used in CSMS (See the Fatigued Driving (HOS) example).
Factor to consider: Some inspections are conducted after a CMV has been involved in a crash. Such inspections are noted as post-crash inspections. In post-crash inspections, only violations found in the pre-crash phase are included in the calculation. In Figure 5-11 below, violations 393.60(c) and 393.9TS are listed in the Detailed Inspection Report as post-crash violations (denoted by an asterisk) and are not listed in the CSMS Relevant Inspection Report.

December 2010 5-14
Figure 5-11. Example: Vehicle Maintenance Detailed Inspection Report
Step 2: Quantify Data into the BASIC Measure Figure 5-12. displays the additional information required for the calculation in the "Measure" section:

December 2010 5-15
Figure 5-12. Example: Vehicle Maintenance Inspection/Violation/ Measure Report

December 2010 5-16
The following are the major components needed to calculate the BASIC measure. Each component (A-F) is labeled on Figure 5-12. Example: Vehicle Maintenance
Inspection/Violation/ Measure Report with red letters.
A. Severity Weight of a violation is the Violation Weight + OOS Weight where:
Violation Weight – applicable violations have a corresponding violation weight that can be found in Appendix A of this document. The violation weight ranges from 1 (less severe) to 10 (most severe) and is assigned based on the violation‘s relationship to crash risk. The violation weights cannot be compared across BASICs.
Out-of-Service (OOS) Weight – a violation resulting in an OOS condition is given a weight of 2, otherwise the weight is 0.
B. Time Weight of 1, 2, or 3 is assigned to each violation and inspection based on its age. The most recent violations and inspections are given higher weights. The weights are as follows:
Less than 6 months = time weight of 3
6 months – less than 1 year = time weight of 2
1 year – less than 2 years = time weight of 1
2 years and older = not used in measurement system
C. Time and Severity Weight – severity weight multiplied by the time weight D. Total Inspection Time Weight of all relevant inspections (sum of column D)
E. Total Time and Severity Weight of all relevant inspections (sum of column E) F. Vehicle Maintenance BASIC Measure – the BASIC measure is calculated by dividing
the sum of the time/severity weight for all applicable violations (G) by the sum of the inspection time weight for all relevant inspections (F).
Example of Relevant Inspection with No Violations (Clean Inspection) - Inspection #1:
Figure 5-13. Example: Vehicle Maintenance Inspection # 1
A. Severity Weight Violation Weight + OOS Weight = 0 + 0 = 0
Violation Weight – no violations, no violation weight
Out-of-Service (OOS) Weight – no violations, no OOS weight

December 2010 5-17
B. Time Weight – inspection occurred within 6 months of the SMS calculation (11/19/2010), inspection time weight = 3
C. Time and Severity Weight – severity weight x time weight = 0 x 3 = 0
Factor to consider: When the measure is calculated, a clean inspection (i.e., inspections with no violations for a particular BASIC) will lower the measure. This is done by adding no violation weight to the numerator but it is incorporated in the time weight inspection count in the denominator.
Example of Relevant Inspection with Applicable Violations - Inspection #3
Figure 5-14. Example: Vehicle Maintenance Inspection # 3
A. Severity Weight – Violation Weight + OOS Weight for each applicable violation. The severity weight for each violation is then summed to the inspection level.
a. 393.11 severity weight = 3 (violation weight) + 0 (OOS weight) = 3
b. 393.45(b)(2) severity weight = 4 (violation weight) + 0 (OOS weight) = 4
c. 393.47(e) severity weight = 4 (violation weight) + 0 (OOS weight) = 4
d. Total Severity Weight for Inspection (sum of the severity weight for each applicable violation –a + b + c from above = 3 + 4 + 4 = 11)
Factor to consider: The total severity weight for an inspection is set to the sum of the applicable violation severity weight, but cannot exceed 30. If the total severity weight for an inspection within a BASIC is greater than 30, then the total severity weight will be set at 30 (See example in Vehicle Maintenance).
B. Time Weight of inspection – inspection occurred within 6 months of the SMS calculation (11/19/2010) so the inspection is given a weight of 3

December 2010 5-18
C. Time and Severity Weight – severity weight x time weight = 11 x 3 = 33
Example of Relevant Inspection with Applicable Violations and a Violation "Cap" - Inspection #7:
Figure 5-15. Example: Vehicle Maintenance Inspection #7
A. Severity Weight – Violation Weight + OOS Weight for each applicable violation. The severity weight for each violation is then summed to the inspection level.
393.11 severity weight = 3 (violation weight) + 0 (OOS weight) = 3
393.9TS severity weight = 6 (violation weight) + 0 (OOS weight) = 6
393.9T severity weight = 6 (violation weight) + 0 (OOS weight) = 6
393.60(d) severity weight = 1 (violation weight) + 0 (OOS weight) = 1
393.55(d)(1) severity weight = 4 (violation weight) + 0 (OOS weight) = 4
393.25(f) severity weight = 6 (violation weight) + 0 (OOS weight) = 6
393.19 severity weight = 6 (violation weight) + 0 (OOS weight) = 6
Total Severity Weight for Inspection (sum of the severity weight for each applicable violation) – from above = 3 + 6 + 6 + 1 + 4 + 6 + 6 = 32. This is greater than 30, so the severity weight is set at 30.
Factor to consider: The total severity weight for an inspection is set to the sum of the applicable violation severity weight, but cannot exceed 30. If the total severity weight for an inspection within a BASIC is greater than 30, then the total severity weight will be set at 30.
B. Time Weight of inspection – inspection occurred more than 1 year after the SMS calculation (11/19/2010), so the inspection is given a weight of 1
C. Time and Severity Weight – severity weight x time weight = 30 x 1 = 30

December 2010 5-19
The remaining five relevant inspections are processed in the same way as inspection #1, inspection #3, and inspection #7.
The figure below is a subset of Figure 5-12; refer to Figure 5-12 for complete information.
Figure 5-16. Example: Vehicle Maintenance Inspection #5
D. Sum of the inspection time weight for all relevant inspections = 3 + 3 + 3 + 2 + 2 + 2 + 1 + 1 + 1 + 1 = 19
E. Sum of the time/severity weight for all relevant inspections = 0 + 0 + 33 + 0 + 8 + 54 + 30 + 6 + 6 + 21 = 158
F. Vehicle Maintenance BASIC Measure – the BASIC measure is calculated by dividing the sum of the time/severity weight for all applicable violations (E) by the sum of the inspection time weight for all relevant inspections (D).
31.819158
E
D
sinspectionallforweighttimeTotal
violationsapplicableweightedseverityandtimeofTotalMeasureBASIC
Step 3: Convert BASIC Measure to Percentile Rank

December 2010 5-20
The percentile rank is a relative comparison among all active U.S. domiciled interstate and intrastate HM motor carriers; therefore, this step cannot be calculated without all 700,000 plus motor carriers‘ Vehicle Maintenance BASIC measures. However, with applicable data, the SMS calculates the percentile rank as follows.
The percentile rank is calculated by ranking the carriers‘ BASIC measures. There are four components to consider when calculating the percentile rank. Data Sufficiency (A) and Safety Event Group (B) are applied prior to calculating the percentile rank and Critical Mass (C) and Recent Activity (D) are applied afterwards.
The following shows information required to determine the percentile:
Figure 5-17. Example: Vehicle Maintenance On-Road Performance Summary
A. Data Sufficiency The CSMS applies data sufficiency standards to assign a percentile rank; if the data sufficiency standards are not met, the carrier will not be assigned a percentile rank. For the Vehicle Maintenance BASIC, carriers are not assigned a percentile if they meet the following two conditions. Both of the following conditions are required:
2. At least five relevant inspections. The example carrier has 10 relevant inspections, shown by the
letter A in the Figure above; data sufficiency is met. 3. At least one inspection resulting in a BASIC violation.
C A
B

December 2010 5-24
1. Carrier Segment There are two segments that each motor carrier falls into:
"Combo" – combination trucks/motor coach buses constituting 70% or more of the total PU
"Straight"– straight trucks/other vehicles constituting more than 30% of the total PU
The following figure displays the carrier‘s PU types:
Owned Term Leased Trip Leased
Straight Trucks Straight 5
Truck Tractors Combo 125
HazMat Cargo Tank Trucks Straight
Motor Coach Combo
School Bus (1-8 passengers) * Not used
School Bus (9-15 passengers) Straight
School Bus (16+ passengers) Straight
Mini-Bus (16+ passengers) Straight
Limousine (1-8 passengers) * Not used
Limousine (9-15 passengers) Straight
Limousine (16+ passengers) Straight
Van (1-8 passengers) * Not used
Van (9-15 passengers) Straight
Vehicle TypePower Units
Segment Type
* Indicates power units not used by the Carrier Safety Measurement System when calculating total
power units
Figure 5-20. Example: Crash Indicator PU Type To determine the carrier‘s segment, take the number of PUs in the Combo segment and divide by the total number of PUs.
%70%96100130125100
5125125
PUTotal
PUCombo
The carrier has more than 70% combination trucks or motor coaches. Therefore, the carrier is classified in the ―Combo‖ segment.
2. Average Power Units (PUs)

December 2010 5-22
The example carrier‘s most recent violation was recorded on 6/10/2010, which is less than 12 months from the snapshot date 11/19/2010 as shown in Figure 5-12.
AND
b. No violation recorded in the BASIC during the latest relevant inspection The example carrier‘s most recent relevant inspection on 10/7/2010 had no applicable Vehicle Maintenance violations as shown in Figure 5-12.
Therefore, the carrier‘s percentile remains at 71.0.
Figure 5-18. Example: Vehicle Maintenance Measure and Percentile Calculation
5.2.3 Crash Indicator Example

December 2010 5-23
The technical details of the Crash Indicator calculation are described in detail in section 3.7 of this document.
Step 1: Obtain Relevant Data The Crash Indicator requires two forms of relevant data: A) twenty-four months of crash data are required to calculate the BASIC measure and percentile and B) relevant exposure information in the form of Power Units (PUs) and Vehicle Miles Traveled (VMT).
A. Twenty-Four Months of Crash Data
Figure 5-19. Example: Crash Indicator Applicable Crash List
The figure above displays:
The 11 applicable crashes that are State-reported crashes that meet the report crash standard. A reportable crash is one that results in at least one fatality; one injury where the injured person is taken to a medical facility for immediate medical attention; or, one vehicle having been towed from the scene as a result of disabling damage caused by the crash (i.e., tow-away).
B. Determine Carrier Exposure
To calculate the carrier measure for the Crash Indicator, there are three carrier exposure factors that are required: Carrier Segment (1), Average Pus (2), Utilization Factor (3).
App
licab
le C
rash
es

December 2010 5-24
1. Carrier Segment There are two segments that each motor carrier falls into:
"Combo" – combination trucks/motor coach buses constituting 70% or more of the total PU
"Straight"– straight trucks/other vehicles constituting more than 30% of the total PU
The following figure displays the carrier‘s PU types:
Owned Term Leased Trip Leased
Straight Trucks Straight 5
Truck Tractors Combo 125
HazMat Cargo Tank Trucks Straight
Motor Coach Combo
School Bus (1-8 passengers) * Not used
School Bus (9-15 passengers) Straight
School Bus (16+ passengers) Straight
Mini-Bus (16+ passengers) Straight
Limousine (1-8 passengers) * Not used
Limousine (9-15 passengers) Straight
Limousine (16+ passengers) Straight
Van (1-8 passengers) * Not used
Van (9-15 passengers) Straight
Vehicle TypePower Units
Segment Type
* Indicates power units not used by the Carrier Safety Measurement System when calculating total
power units
Figure 5-20. Example: Crash Indicator PU Type To determine the carrier‘s segment, take the number of PUs in the Combo segment and divide by the total number of PUs.
%70%96100130125100
5125125
PUTotal
PUCombo
The carrier has more than 70% combination trucks or motor coaches. Therefore, the carrier is classified in the "Combo" segment.
2. Average Power Units (PUs)

December 2010 5-25
The average PUs for each carrier are calculated by using (i) the carrier‘s current number of PUs, (ii) the number of PUs the carrier had 6 months ago, and (iii) the number of PUs the carrier had 18 months ago. The following figure shows the average PU calculation.
1303
130130130PUAverage
Figure 5-21. Example: Crash Indicator Average Power Unit Calculation
3. Utilization Factor Given that this carrier is in the ―Combo‖ Segment, the carrier‘s Utilization Factor is determined based on the following table.
Combo Segment
VMT per Average PU Utilization Factor
< 80,000 1
80,000 - 160,000 1+0.6[(VMT per PU-80,000) / 80,000]
160,000 - 200,000 1.6
> 200,000 1
No Recent VMT Information 1
Table 5-3. VMT per PU for Combo Segment
To apply this table, the VMT per average PU needs to be calculated. In #2 above, we showed that the average PU for this carrier is 130. The following figure shows that the VMT is 13,514,000.
Figure 5-22. Example: Crash Indicator VMT data
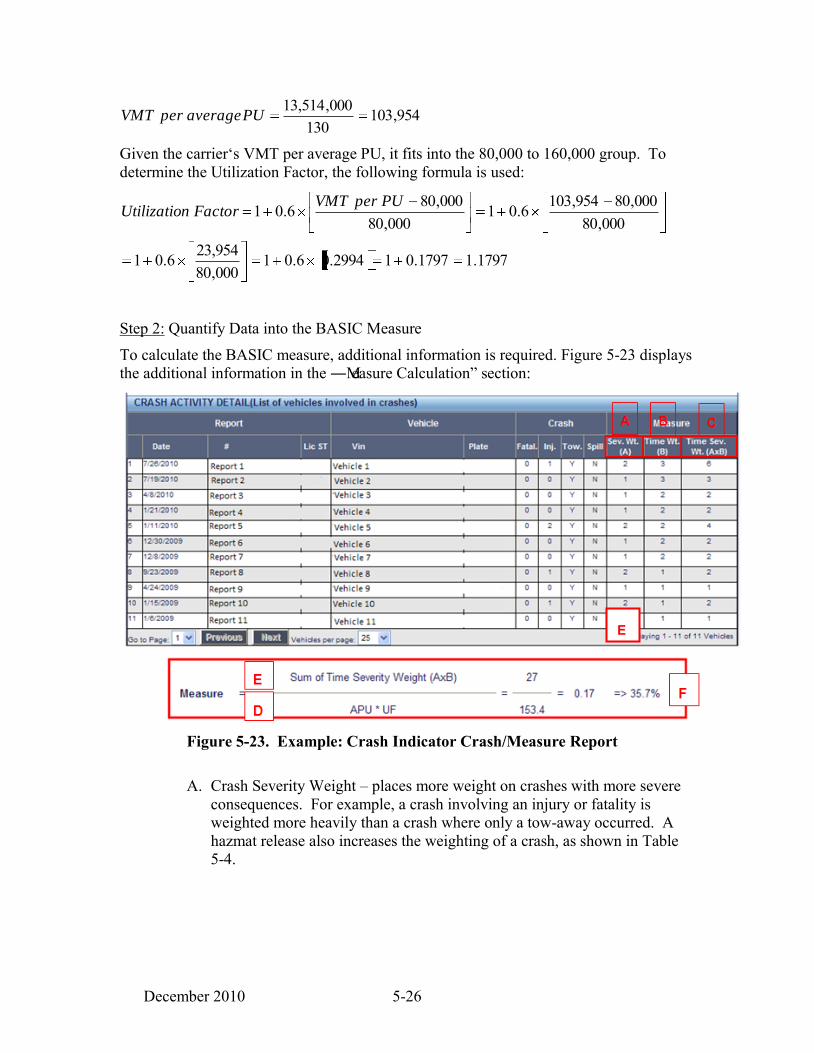
December 2010 5-26
954,103130
000,514,13PUaverageperVMT
Given the carrier‘s VMT per average PU, it fits into the 80,000 to 160,000 group. To determine the Utilization Factor, the following formula is used:
1797.11797.012994.06.01000,80954,236.01
000,80000,80954,1036.01
000,80000,806.01 PUperVMT
FactornUtilizatio
Step 2: Quantify Data into the BASIC Measure
To calculate the BASIC measure, additional information is required. Figure 5-23 displays the additional information in the ―Measure Calculation‖ section:
Figure 5-23. Example: Crash Indicator Crash/Measure Report
A. Crash Severity Weight – places more weight on crashes with more severe
consequences. For example, a crash involving an injury or fatality is weighted more heavily than a crash where only a tow-away occurred. A hazmat release also increases the weighting of a crash, as shown in Table 5-4.
E

December 2010 5-27
Crash Type Crash Severity Weight
Involves tow-away but no injury or fatality
1
Involves injury or fatality 2
Involves a hazmat release Crash Severity Weight (from above) + 1
Table 5-4. Crash Severity Weights for Crash Indicator
B. Time Weight of 1, 2, or 3 is assigned to each violation and inspection based on its age. The most recent violations and inspections are given higher weights. The weights are as follows:
a. Less than 6 months = time weight of 3 b. 6 months – less than 1 year = time weight of 2 c. 1 year – less than 2 years = time weight of 1
d. 2 years and older = not used in measurement system C. Time and Severity Weight – severity weight multiplied by the time weight D. Total Time and Severity Weight for all applicable crashes (sum of column
C) E. Crash Indicator Measure – the BASIC measure is calculated by dividing
the sum of the time/severity weight for all applicable crashes (D) by the Average PUs * Utilization Factor.
Example of Applicable Crash – Crash #1
Figure 5-24. Example: Crash Indicator Crash #1 A. Crash Severity Weight – shown in Table 5-4 above, the crash involves an
injury, but no hazmat release. Crash Severity Weight = 2
B. Time Weight of Crash – crash occurred within 6 months of the SMS calculation (11/19/2010), so the crash is given a weight of 3

December 2010 5-28
C. Time and Severity Weight – crash severity weight x time weight = 2 x 3 = 6
The remaining 10 applicable crashes are processed in the same way as crash #1.
The figure below is a subset of Figure 5-23; refer to Figure 5-23 for complete information.
Figure 5-25. Example: Crash Indicator Measure Calculation
D. Total Time and Severity Weight for all applicable crashes = 6 + 3 + 2 + 2 + 4 + 2 + 2 + 2 + 1 + 2 + 1 = 27
E. Crash Indicator Measure – the BASIC measure is calculated by dividing the sum of the time/severity weight for all applicable crashes (D) by the Average PUs * Utilization Factor. The Average PU and Utilization Factor values are provided in Step 1 of this example.
17.015327
1797.1*130*D
FactornUtilizatioPUsAverage
crashesapplicableweightedseverityandtimeofTotalMeasureBASIC
Step 3: Convert BASIC Measure to Percentile Rank
The percentile rank is a relative comparison among all active U.S. domiciled interstate and intrastate HM motor carriers; therefore, this step cannot be calculated without all 700,000 plus motor carriers‘ Crash Indicator BASIC measures. However, with applicable data, the SMS calculates the percentile rank as follows.
The percentile rank is calculated by ranking the carriers‘ BASIC measures. There are four components to consider when calculating the percentile rank. Data Sufficiency (A) and Safety Event Group (B) are applied prior to calculating the percentile rank and Critical Mass (C) and Recent Activity (D) are applied afterwards.
The following shows information required to determine the percentile:

December 2010 5-29
Figure 5-26. Example: Crash Indicator Crash Activity
A. Data Sufficiency The CSMS applies data sufficiency standards to assign a percentile rank; if the data sufficiency standards are not met, the carrier will not be assigned a percentile rank. For the Crash Indicator, the following condition is required:
1. At least two applicable crashes. The example carrier has 11 applicable crashes, shown by the letter A in
the Figure above; data sufficiency is met. B. Safety Event Group The CSMS uses safety event categories to assign percentiles. Each carrier meeting the conditions in A is placed into a safety event group based on the carrier segment and number of crashes. The example carrier above is in the Combo Segment (shown in step 1) and has 10 applicable crashes, so it is placed in safety event group 3, 7-16 crashes.
Safety Event Group
Combo Segment: Number of Crashes
1 2-3
2 4-6
3 7-16
4 17-45
5 46+
Table 5-5. Safety Event Group Categories for Crash Indicator
A
B
December 2010 5-30
Calculate percentile rank by ranking all the carriers‘ BASIC measures in ascending order within each safety event group. In this case, the example carrier would have its BASIC measure ranked against all carriers with 7-16 crashes. Transform the ranked values into percentiles from 0 (representing the lowest BASIC measure) to 100 (representing the highest BASIC measure). The example carrier‘s percentile rank is 35.7 as shown by Figure 5-26. C. Critical Mass In the Crash Indicator, the Critical Mass is the same as the Data Sufficiency: two applicable crashes. The example carrier has 11 applicable crashes; critical mass condition is met. D. Recent Activity
Remove carriers‘ percentiles that do not have any recent activity. Recent activity in the Crash Indicator is defined as:
1. No crash recorded during the previous 12 months The example carrier‘s most recent crash was on 7/26/2010, which is less than 12 months from the snapshot date 11/19/2010 as shown in Figure 5-23.
Therefore, the percentile remains at 35.7.

December 2010 6-1
6. SMS Report – Summary/Next Steps
The SMS methodology is part of a continuous improvement process in support of CSA and the implementation of the new FMCSA Operational Model. Several major enhancements (see Appendix B) were made to the SMS as part of lessons learned from the CSA Op-Model Test and public listening session feedback. Future improvements to the SMS will be also based on feedback from stakeholders such as enforcement personnel, industry, and the public, as well as on additional findings as FMCSA implements the CSA Operational Model nationally. In addition, as new data sources become available, these may be incorporated into the SMS methodology. Finally, the SMS will be enhanced periodically as future research reveals new and useful knowledge about crash causation and about the relationship between crash risk and regulatory compliance.
December 2010 A-1
Appendix A Violation Severity by BASIC
Overview
The tables in this Appendix contain all violations used in the SMS along with the corresponding Federal Motor Carrier Safety Regulation (FMCSR) or Hazardous Material Regulation (HMR) section. Each table represents a unique Behavior Analysis and Safety Improvement Category (BASIC). Each violation is assigned a severity weight that reflects its relevance to crash risk. Crash risk is defined as the risk of crashes occurring and the consequences of the crash after it occurs. Within each BASIC, the violations are grouped based on their attributes, so that similar violations can be assigned the same severity weights. Severity weights, discussed in more detail below, only reflect relative crash risk within a BASIC, and are not comparable across the BASICs.
Interpretation of the Severity Weights
The violation severity weights in the tables that follow have been converted into a scale from 1 to 10, where 1 represents the lowest crash risk and 10 represents the highest crash risk relative to the other violations in the BASIC. Because the weights reflect the relative importance of each violation only within each particular BASIC, they cannot be compared meaningfully across the various BASICs. Therefore, a ‗5‘ in one BASIC is not equivalent to a ‗5‘ in another BASIC, but the ‗5‘ does represent the approximate midpoint between a crash risk of 1 and 10 within the same BASIC. The ―Violation Group‖ column in each table identifies the group to which each violation has been assigned. Each violation within a violation group is assigned the same severity weight.
Derivation of the Severity Weights
In order to determine the severity weights crash involvement and crash consequence the following five-step process was invoked:
1. BASIC Mapping—All roadside safety-related violations were mapped to an appropriate BASIC so that the severity weight analysis could be conducted on each individual BASIC.
2. Violation Grouping—All violations in each BASIC were placed into groups of similar violations based on the judgment of enforcement subject matter experts. These groups, listed in the ―Violation Group‖ column in each table, make it possible to incorporate otherwise rarely cited violations into the robust statistical analysis used to derive the severity weights. The violation grouping also ensured that similar types of violations received the same severity weight.

December 2010 A-2
3. Crash Occurrence Analysis—Statistical analysis was performed to quantify the extent of the relationship between crash involvement on the one hand and violation rates in each violation group, within each BASIC, on the other hand. A driver approach was used in this analysis. This approach was taken due to strong demonstrable relationships between driver crashes and violations documented in prior Volpe Center research. The earlier research was conducted in support of FMCSA‘s Compliance Review Work Group (CRWG), the CSA Initiative‘s predecessor. Based on the conclusions from the earlier research, the Volpe Center developed a Driver Information Resource (DIR) for FMCSA. The DIR uses individual crash and inspection reports from all states to construct multi-year driver safety histories for individual commercial drivers. Multivariate negative binomial regression models were used to quantify the strength of relationships between driver violation rates in individual violation groups and crash involvement.
4. Crash Consequences Analysis—While the statistical modeling described in step 3 provides a empirical basis for associating violations and crash occurrence it does not address the violations relationship to crash consequence. To factor in the risk associated with crash consequence enforcement subject matter experts (SMEs) representing State and Federal Field Staff provided input for modifying preliminary severity weight defined in step 3. This approach helped balance the violation risk associated with crash involvement (occurrence) and crash consequence.
5. CSMS Effectiveness Test—Various severity weighting schemes developed in Steps 1 through 4 were applied to the Carrier Safety Measurement System (CSMS) to provide an empirical evaluation of the weighting schemes. This empirical evaluation, or ―CSMS Effectiveness Test,‖ was modeled after the SafeStat Effectiveness Test.5 The CSMS Effectiveness Test was accomplished through the following steps: (1) performing a simulated CSMS run that calculates carrier percentile ranks for each BASIC using historical data; (2) examining each carrier‘s crash involvement over the immediate 18 months after the simulated CSMS timeframe, and (3) observing the relationship between the percentile ranks in each BASIC and the subsequent post-CSMS carrier crash rates. The CSMS Effectiveness Test provides an environment to evaluate various severity weighting schemes in terms of their impact in identifying high-risk carriers. It also provides a means of testing other weight schemes, such as the Out-of-Service (OOS) weight, to help optimize CSMS‘s effectiveness.
Severity Weight Tables 1 through 6 list all of the violations in the CSMS, with the first two columns of each table identifying each violation by regulatory part and its associated definition. The third column in each table identifies the violation group to which each violation is assigned, followed by the violation groups‘ severity weights in the fourth
5 SafeStat Motor Carrier Safety Status Measurement System Methodology: Version 8.6 (January 2004). Prepared for FMCSA by John A. Volpe National Transportation Systems Center. Chapter 7: SafeStat Evaluation.

December 2010 A-3
column. The final column in these tables specifies whether or not each violation is also included in the DSMS; violations included in the DSMS are the subset of CSMS BASIC violations for which the commercial motor vehicle (CMV) driver could also be a responsible party.

December 2010 A-4
Table 1. CSMS Unsafe Driving BASIC Violations6
Section
Violation Description Shown on Driver/Vehicle Examination Report Given to CMV Driver after Roadside Inspection
Violation Group Description
Violation Severity Weight
Violation in the DSMS (Y/N)
177.800(d) Unnecessary delay in HM transportation to destination HM Related 1 Y
390.17DT Operating a CMV while texting Texting 10 Y
390.20 Failing to properly secure parked vehicle Other Driver Violations 1 Y
392.2C Failure to obey traffic control device Dangerous Driving 5 Y
392.2DH Headlamps - Failing to dim when required
Misc Violations 3 Y
392.2FC Following too close Dangerous Driving 5 Y
392.2LC Improper lane change Dangerous Driving 5 Y
392.2LV Lane Restriction violation Misc Violations 3 Y
392.2P Improper passing Dangerous Driving 5 Y
392.2PK Unlawfully parking and/or leaving vehicle in the roadway
Other Driver Violations 1 Y
392.2R Reckless driving Reckless Driving 10 Y
392.2RR Railroad Grade Crossing violation Dangerous Driving 5 Y
392.2S Speeding Speeding Related 5 Y
392.2-SLLS1
State/Local Laws - Speeding 1-5 miles per hour over the speed limit Speeding 1 1 Y
392.2-SLLS2
State/Local Laws - Speeding 6-10 miles per hour over the speed limit Speeding 2 4 Y
392.2-SLLS3
State/Local Laws - Speeding 11-14 miles per hour over the speed limit Speeding 3 7 Y
392.2-SLLS4
State/Local Laws - Speeding 15 or more miles per hour over the speed limit Speeding 4 10 Y
6 Violation severity weights reflect the relative importance of each violation within each BASIC. These weights cannot be compared or added meaningfully across the BASICs.

December 2010 A-5
Table 1. CSMS Unsafe Driving BASIC Violations6
Section
Violation Description Shown on Driver/Vehicle Examination Report Given to CMV Driver after Roadside Inspection
Violation Group Description
Violation Severity Weight
Violation in the DSMS (Y/N)
392.2-SLLSWZ
State/Local Laws - Speeding work/construction zone Speeding 4 10 Y
392.2-SLLT State/Local Laws - Operating a CMV while texting Texting 10 Y
392.2T Improper turns Dangerous Driving 5 Y
392.2Y Failure to yield right of way Dangerous Driving 5 Y
392.6 Scheduling run to necessitate speeding Speeding Related 5 N
392.10(a)(1) Failing to stop at railroad crossing—bus Dangerous Driving 5 Y
392.10(a)(2) Failing to stop at railroad crossing—chlorine
Dangerous Driving 5 Y
392.10(a)(3) Failing to stop at railroad crossing—placard
Dangerous Driving 5 Y
392.10(a)(4) Failing to stop at railroad crossing—HM cargo
Dangerous Driving 5 Y
392.14 Failed to use caution for hazardous condition
Dangerous Driving 5 Y
392.16 Failing to use seat belt while operating CMV Seat Belt 7 Y
392.22(a) Failing to use hazard warning flashers Other Driver Violations 1 Y
392.60(a) Unauthorized passenger on board CMV Other Driver Violations 1 Y
392.62 Unsafe bus operations Other Driver Violations 1 Y
392.62(a) Bus—Standees forward of the standee line
Other Driver Violations 1 Y
392.71(a) Using or equipping a CMV with radar detector
Speeding Related 5 Y
397.3 State/local laws ordinances regulations HM Related 1 Y
397.13 Smoking within 25 feet of HM vehicle HM Related 1 Y
398.4 Driving of vehicle—migrant workers Other Driver Violations 1 Y

December 2010 A-6
Table 2. CSMS Fatigued Driving (HOS) BASIC Violations7
Section
Violation Description Shown on Driver/Vehicle Examination Report Given to CMV Driver after Roadside Inspection
Violation Group Description
Violation Severity Weight8
Violation in the DSMS (Y/N)
392.2H State/Local Hours-of-Service (HOS) Hours 7 Y
392.3 Operating a CMV while ill/fatigued
Jumping OOS/Driving Fatigued 10 Y
395.1(h)(1) 15, 20, 70/80 HOS violations (Alaska-Property) Hours 7 Y
395.1(h)(2) 15, 20, 70/80 HOS violations (Alaska-Passenger) Hours 7 Y
395.1(h)(3) Adverse driving conditions violations (Alaska) Hours 7 Y
395.1(o) 16 hour rule violation (Property) Hours 7 Y
395.3(a)(1) Requiring or permitting driver to drive more than 11 hours Hours 7 Y
395.3A1R 11-hour rule violation (Property) Hours 7 Y
395.3(a)(2) Requiring or permitting driver to drive after 14 hours on duty Hours 7 Y
395.3A2R 14-hour rule violation (Property) Hours 7 Y
395.3(b) 60/70-hour rule violation Hours 7 Y
395.3BR 60/70-hour rule violation (Property) Hours 7 Y
395.3(c) 34-hour restart violation (Property) Hours 7 Y
395.5(a)(1) 10-hour rule violation (Passenger) Hours 7 Y
395.5(a)(2) 15-hour rule violation (Passenger) Hours 7 Y
395.5(b) 60/70-hour rule violation (Passenger) Hours 7 Y
395.8 Log violation (general/form and manner)
Other Log/Form & Manner 2 Y
7 Violation severity weights reflect the relative importance of each violation within each BASIC. These weights cannot be compared or added meaningfully across the BASICs.
8 In cases where a violation results in an out-of-service order as defined in 49 CFR 390.5, an
additional weight of 2 is added to arrive at a total severity weight for the violation.

December 2010 A-7
Table 2. CSMS Fatigued Driving (HOS) BASIC Violations7
Section
Violation Description Shown on Driver/Vehicle Examination Report Given to CMV Driver after Roadside Inspection
Violation Group Description
Violation Severity Weight8
Violation in the DSMS (Y/N)
395.8(a) No drivers record of duty status Incomplete/Wrong Log 5 Y
395.8(e) False report of drivers record of duty status False Log 7 Y
395.8(f)(1) Drivers record of duty status not current
Incomplete/Wrong Log 5 Y
395.8(k)(2) Driver failing to retain previous 7 days’ logs
Incomplete/Wrong Log 5 Y
395.13(d) Driving after being declared out-of-service
Jumping OOS/Driving Fatigued 10 Y
395.15(b) Onboard recording device information requirements not met
EOBR Related 1 Y
395.15(c) Onboard recording device improper form and manner
EOBR Related 1 Y
395.15(f)
Onboard recording device failure and driver failure to reconstruct duty status
EOBR Related 1 Y
395.15(g) Onboard recording device information not available
EOBR Related 1 Y
395.15(i)(5) Onboard recording device does not display required information
EOBR Related 1 N
398.6 Violation of hours of service regulations—migrant workers Hours 7 Y

December 2010 A-8
Table 3. CSMS Driver Fitness BASIC Violations 9
Section
Violation Description Shown on Driver/Vehicle Examination Report Given to CMV Driver after Roadside Inspection
Violation Group Description
Violation Severity Weight10
Violation in the DSMS (Y/N)
177.816 Driver training requirements General Driver Qualification 4 N
383.21 Operating a CMV with more than one driver's license
License-related 8 Y
383.21(a)
Operating a CMV with more
than one driver's license† License-related 8 Y
383.23(a)(2) Operating a CMV without a CDL License-related 8 Y
383.23(c) Operating on learner's permit without CDL holder
License-related 8 Y
383.23(c)(1) Operating on learner's permit without CDL holder
License-related 8 Y
383.23(c)(2) Operating on learner's permit without valid driver’s license
License-related 8 Y
383.51(a) Driving a CMV (CDL) while disqualified
License-related 8 Y
383.91(a) Operating a CMV with improper CDL group
License-related 8 Y
383.93(b)(1) No double/triple trailer endorsement on CDL
License-related 8 Y
383.93(b)(2) No passenger vehicle endorsement on CDL
License-related 8 Y
383.93(b)(3) No tank vehicle endorsement on CDL
License-related 8 Y
383.93(b)(4) No hazardous materials endorsement on CDL
License-related 8 Y
9 Violation severity weights reflect the relative importance of each violation within each BASIC. These weights cannot be compared or added meaningfully across the BASICs.
10 In cases where a violation results in an out-of-service order as defined in 49 CFR 390.5, an
additional weight of 2 is added to arrive at a total severity weight for the violation.
† Citations marked with † are being phased out based on regulatory changes, and are intended
for removal from the SMS at a later time.

December 2010 A-9
Table 3. CSMS Driver Fitness BASIC Violations 9
Section
Violation Description Shown on Driver/Vehicle Examination Report Given to CMV Driver after Roadside Inspection
Violation Group Description
Violation Severity Weight10
Violation in the DSMS (Y/N)
383.93(b)(5) No school bus endorsement on CDL
License-related 8 Y
383.93B5LCDL
License (CDL) - Operating a school bus without a school bus endorsement as described in 383.93(b)(5)
License-related 8 Y
383.95(a) Violating airbrake restriction License-related 8 Y
386.72(b) Failing to comply with Imminent Hazard OOS Order
Fitness/ Jumping OOS 10 Y
391.11 Unqualified driver License-related 8 Y
391.11(b)(1) Interstate driver under 21 years of age
General Driver Qualification 4 Y
391.11(b)(2) Non-English speaking driver General Driver Qualification 4 Y
391.11B2S
Driver must be able to understand highway traffic signs and signals in the English language
General Driver Qualification 4 Y
391.11(b)(4) Driver lacking physical qualification(s) Physical 2 Y
391.11(b)(5) Driver lacking valid license for type vehicle being operated
License-related 8 Y
391.11(b)(7) Driver disqualified from operating CMV
License-related 8 Y
391.15(a) Driving a CMV while disqualified License-related 8 Y
391.41(a) Driver not in possession of medical certificate
Medical Certificate 1 Y
391.43(h) Improper medical examiners certificate form
Medical Certificate 1 Y
391.45(b) Expired medical examiner's certificate
Medical Certificate 1 Y
391.49(j) No valid medical waiver in driver's possession
Medical Certificate 1 Y

December 2010 A-10
Table 3. CSMS Driver Fitness BASIC Violations 9
Section
Violation Description Shown on Driver/Vehicle Examination Report Given to CMV Driver after Roadside Inspection
Violation Group Description
Violation Severity Weight10
Violation in the DSMS (Y/N)
398.3(b) Driver not physically qualified Physical 2 Y
398.3(b)(8) No doctor's certificate in possession
Medical Certificate 1 Y

December 2010 A-11
Table 4. CSMS Controlled Substances/Alcohol BASIC Violations11
Section Violation Description
Violation Group Description
Violation Severity Weight
Violation in the DSMS (Y/N)
392.5(c)(2) Violating OOS order pursuant to 392.5(a)/(b)
Alcohol Jumping OOS 10 Y
392.4(a) Driver uses or is in possession of drugs Drugs 10 Y
392.5(a) Possession/use/under influence alcohol-4hrs prior to duty Alcohol 5 Y
11 Violation severity weights reflect the relative importance of each violation within each BASIC. These weights cannot be compared or added meaningfully across the BASICs.

December 2010 A-12
Table 5. CSMS Vehicle Maintenance BASIC Violations 12
Section
Violation Description Shown on Driver/Vehicle Examination Report Given to CMV Driver after Roadside Inspection
Violation Group Description
Violation Severity Weight13
Violation in the DSMS (Y/N)
365.511 Fail to display current CVSA Decal: Permanent Authority
Inspection Reports 4 N
374.313(a) Failure to maintain a reasonable temperature
Cab, Body, Frame 2 Y
374.313(b) Bus — Failure to maintain restroom Cab, Body, Frame 2 Y
374.313(c) Bus — Not maintained in clean working order
Cab, Body, Frame 2 Y
385.103(c) Fail to display current CVSA decal— Provisional Authority
Inspection Reports 4 N
392.2WC Wheel (Mud) Flaps missing or defective
Windshield /Glass /Markings 1 Y
392.7 No pre-trip inspection Inspection Reports 4 Y
392.7(a) Driver failing to conduct pre-trip inspection
Inspection Reports 4 Y
392.7(b) Driver failing to conduct a pre-trip inspection of Intermodal Equipment
Inspection Reports 4 Y
392.8 Failing to inspect/use emergency equipment
Emergency Equipment 2 Y
392.22(b) Failing/improper placement of warning devices
Cab, Body, Frame 2 Y
392.33 Operating CMV with lamps/reflectors obscured Lighting 6 Y
393.9(a) Inoperative required lamps
Clearance Identification Lamps/Other 2 Y
12 Violation severity weights reflect the relative importance of each violation within each BASIC. These weights cannot be compared or added meaningfully across the BASICs.
13 In cases where a violation results in an out-of-service order as defined in 49 CFR 390.5, an
additional weight of 2 is added to arrive at a total severity weight for the violation.
† Citations marked with † are being phased out based on regulatory changes and are intended
for removal from the SMS at a later time.

December 2010 A-13
Table 5. CSMS Vehicle Maintenance BASIC Violations 12
Section
Violation Description Shown on Driver/Vehicle Examination Report Given to CMV Driver after Roadside Inspection
Violation Group Description
Violation Severity Weight13
Violation in the DSMS (Y/N)
393.9H Inoperative head lamps Lighting 6 Y
393.9T Inoperative tail lamp Lighting 6 Y
393.9TS Inoperative turn signal Lighting 6 Y
393.11 No/defective lighting devices/reflective devices/projected
Reflective Sheeting 3 Y
393.11LR
Lower retroreflective sheeting/reflex reflectors manufactured on or after 12/1/1993
Reflective Sheeting 3 Y
393.11N
No retroreflective sheeting/reflex reflectors manufactured on or after 12/1/1993
Reflective Sheeting 3 Y
393.11RT
Retroreflective not affixed as required Trailer manufactured on or after 12/1/1993
Reflective Sheeting 3 Y
393.11S
Side retroreflective sheeting/reflex reflectors manufactured on or after 12/1/1993
Reflective Sheeting 3 Y
393.11TL
Truck Tractor manufactured on or after 7/1/1997 with no retro reflective sheeting or reflex reflectors on mud flaps
Reflective Sheeting 3 Y
393.11TT
Truck Tractor no retroreflective sheeting/reflex reflectors manufactured on or after 7/1/1997
Reflective Sheeting 3 Y
393.11TU
Truck Tractor upper body corners retroreflective sheeting/reflex manufactured on or after 7/1/1997
Reflective Sheeting 3 Y
393.11UR
Upper reflex reflectors retroreflective sheeting/reflex reflectors manufactured on or after 12/1/1993
Reflective Sheeting 3 Y
393.13(a)
Retroreflective tape not affixed; Trailer manufactured before 12//1/1993
Reflective Sheeting 3 Y
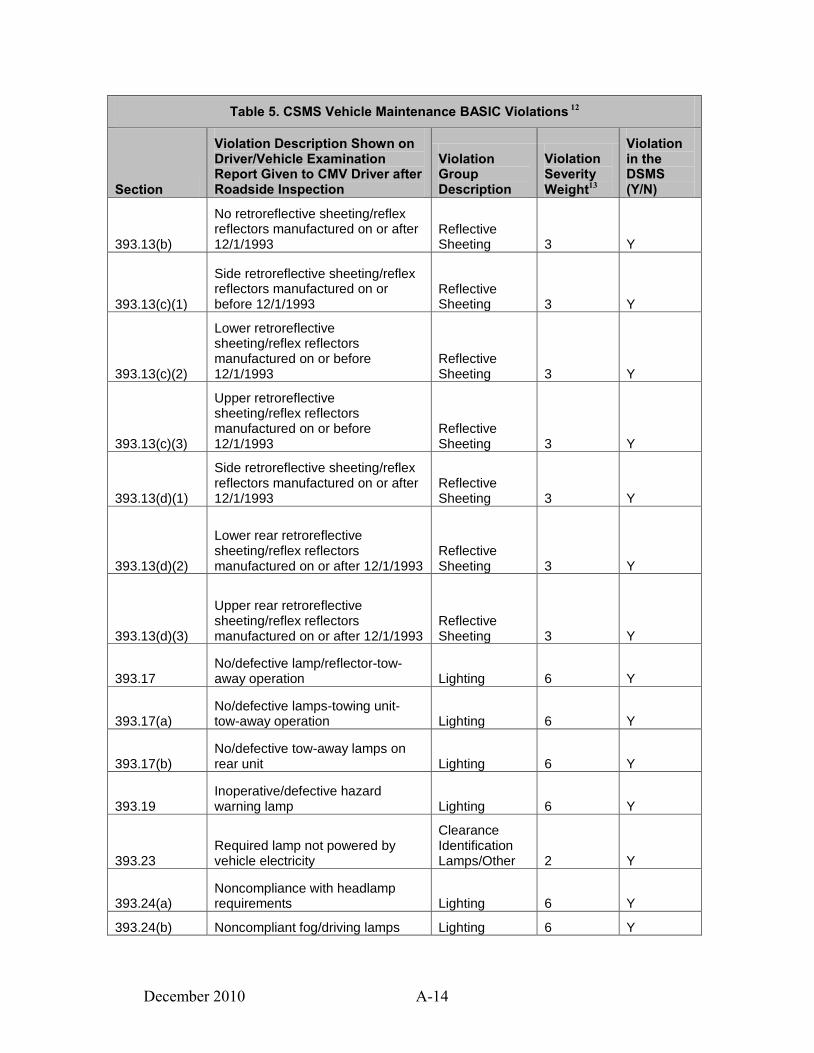
December 2010 A-14
Table 5. CSMS Vehicle Maintenance BASIC Violations 12
Section
Violation Description Shown on Driver/Vehicle Examination Report Given to CMV Driver after Roadside Inspection
Violation Group Description
Violation Severity Weight13
Violation in the DSMS (Y/N)
393.13(b)
No retroreflective sheeting/reflex reflectors manufactured on or after 12/1/1993
Reflective Sheeting 3 Y
393.13(c)(1)
Side retroreflective sheeting/reflex reflectors manufactured on or before 12/1/1993
Reflective Sheeting 3 Y
393.13(c)(2)
Lower retroreflective sheeting/reflex reflectors manufactured on or before 12/1/1993
Reflective Sheeting 3 Y
393.13(c)(3)
Upper retroreflective sheeting/reflex reflectors manufactured on or before 12/1/1993
Reflective Sheeting 3 Y
393.13(d)(1)
Side retroreflective sheeting/reflex reflectors manufactured on or after 12/1/1993
Reflective Sheeting 3 Y
393.13(d)(2)
Lower rear retroreflective sheeting/reflex reflectors manufactured on or after 12/1/1993
Reflective Sheeting 3 Y
393.13(d)(3)
Upper rear retroreflective sheeting/reflex reflectors manufactured on or after 12/1/1993
Reflective Sheeting 3 Y
393.17 No/defective lamp/reflector-tow-away operation Lighting 6 Y
393.17(a) No/defective lamps-towing unit-tow-away operation Lighting 6 Y
393.17(b) No/defective tow-away lamps on rear unit Lighting 6 Y
393.19 Inoperative/defective hazard warning lamp Lighting 6 Y
393.23 Required lamp not powered by vehicle electricity
Clearance Identification Lamps/Other 2 Y
393.24(a) Noncompliance with headlamp requirements Lighting 6 Y
393.24(b) Noncompliant fog/driving lamps Lighting 6 Y

December 2010 A-15
Table 5. CSMS Vehicle Maintenance BASIC Violations 12
Section
Violation Description Shown on Driver/Vehicle Examination Report Given to CMV Driver after Roadside Inspection
Violation Group Description
Violation Severity Weight13
Violation in the DSMS (Y/N)
393.24BR Noncompliant fog or driving lamps Lighting 6 Y
393.24(c) Improper headlamp mounting Lighting 6 N
393.24(d) Improper head / auxiliary / fog lamp aiming Lighting 6 N
393.25(a) Improper lamp mounting Lighting 6 N
393.25(b) Lamps are not visible as required Lighting 6 Y
393.25(e) Lamp not steady burning Lighting 6 Y
393.25(f) Stop lamp violations Lighting 6 Y
393.26 Requirements for reflectors Reflective Sheeting 3 Y
393.28 Improper or no wiring protection as required
Other Vehicle Defect 3 Y
393.30 Improper battery installation Other Vehicle Defect 3 Y
393.40 Inadequate brake system on a CMV
Brakes, All Others 4 Y
393.41 No or defective parking brake system on CMV
Brakes, All Others 4 Y
393.42 No brakes as required Brakes, All Others 4 Y
393.43 No/improper breakaway or emergency braking
Brakes, All Others 4 Y
393.43(a) No/improper tractor protection valve
Brakes, All Others 4 Y
393.43(d) No or defective automatic trailer brake
Brakes, All Others 4 Y
393.44 No/defective bus front brake line protection
Brakes, All Others 4 Y
393.45 Brake tubing and hose adequacy Brakes, All Others 4 N
393.45(a)(4) Failing to secure brake hose/tubing against mechanical damage
Brakes, All Others 4 N
393.45(b)(2) Failing to secure brake hose/tubing against mechanical damage
Brakes, All Others 4 Y

December 2010 A-16
Table 5. CSMS Vehicle Maintenance BASIC Violations 12
Section
Violation Description Shown on Driver/Vehicle Examination Report Given to CMV Driver after Roadside Inspection
Violation Group Description
Violation Severity Weight13
Violation in the DSMS (Y/N)
393.45(b)(3) Failing to secure brake hose/tubing against high temperatures
Brakes, All Others 4 N
393.45(d) Brake connections with leaks/constrictions
Brakes, All Others 4 N
393.47 Inadequate/contaminated brake linings
Brakes, All Others 4 Y
393.47(a) Inadequate brakes for safe stopping
Brakes, All Others 4 Y
393.47(b) Mismatched brake chambers on same axle
Brakes, All Others 4 Y
393.47(c) Mismatched slack adjuster effective length
Brakes, All Others 4 Y
393.47(d) Insufficient brake linings Brakes, All Others 4 Y
393.47(e) Clamp/Roto-Chamber type brake(s) out of adjustment
Brakes Out of Adjustment 4 Y
393.47(f) Wedge type brake(s) out of adjustment
Brakes Out of Adjustment 4 Y
393.47(g) Insufficient drum/rotor thickness Brakes, All Others 4 Y
393.48(a) Inoperative/defective brakes Brakes, All Others 4 Y
393.48(b)(1) Defective brake limiting device Brakes, All Others 4 Y
393.50 Inadequate reservoir for air/vacuum brakes
Brakes, All Others 4 N
393.50(a) Failing to have sufficient air/vacuum reserve
Brakes, All Others 4 N
393.50(b) Failing to equip vehicle—prevent reservoir air/vacuum leak
Brakes, All Others 4 N
393.50(c) No means to ensure operable check valve
Brakes, All Others 4 N
393.50(d) No or defective air reservoir drain valve
Brakes, All Others 4 Y
393.51 No or defective brake warning device
Brakes, All Others 4 Y

December 2010 A-17
Table 5. CSMS Vehicle Maintenance BASIC Violations 12
Section
Violation Description Shown on Driver/Vehicle Examination Report Given to CMV Driver after Roadside Inspection
Violation Group Description
Violation Severity Weight13
Violation in the DSMS (Y/N)
393.52(a)(1) Insufficient braking force as percent of GVW or GCW
Brakes, All Others 4 Y
393.53(a)
Automatic brake adjuster CMV manufactured on or after 10/20/1993—hydraulic brake
Brakes, All Others 4 Y
393.53(b)
Automatic brake adjuster CMV manufactured on or after 10/20/1994—air brake
Brakes, All Others 4 Y
393.53(c)
Brake adjustment indicator CMV manufactured on or after 10/20/1994—external automatic adjustment
Brakes, All Others 4 Y
393.55(a)
ABS—all CMVs manufactured on or after 3/1/1999 with hydraulic brakes
Brakes, All Others 4 N
393.55(b) ABS—malfunction indicators for hydraulic brake system
Brakes, All Others 4 N
393.55(c)(1) ABS—all tractors manufactured on or after 3/1/1997 air brake system
Brakes, All Others 4 N
393.55(c)(2)
ABS—all other CMVs manufactured on or after 3/1/1998 air brake system
Brakes, All Others 4 N
393.55(d)(1)
ABS—malfunctioning circuit/signal manufactured on or after 3/1/1997, single-unit CMV manufactured on or after 3/1/1998
Brakes, All Others 4 N
393.55(d)(2)
ABS—malfunctioning indicator to cab of towing CMV manufactured on or after 3/1/2001
Brakes, All Others 4 N
393.55(d)(3)
ABS—malfunctioning indicator connection from towed CMV manufactured on or after 3/1/2001
Brakes, All Others 4 N
393.55(e)
ABS—malfunctioning lamps towed CMV manufactured on or after 3/1/1998, manufactured before 3/1/2009
Brakes, All Others 4 Y
393.60(b) Windshields required
Windshield/ Glass/ Markings 1 Y

December 2010 A-18
Table 5. CSMS Vehicle Maintenance BASIC Violations 12
Section
Violation Description Shown on Driver/Vehicle Examination Report Given to CMV Driver after Roadside Inspection
Violation Group Description
Violation Severity Weight13
Violation in the DSMS (Y/N)
393.60(c) Damaged or discolored windshield
Windshield/ Glass/ Markings 1 Y
393.60(d) Glazing permits less than 70 percent of light
Windshield/ Glass/ Markings 1 Y
393.60EWS Windshield – Obstructed
Windshield/ Glass/ Markings 1 Y
393.61 Inadequate or missing truck side windows
Windshield/ Glass/ Markings 1 Y
393.61(a) Inadequate or missing truck side windows
Windshield/ Glass/ Markings 1 Y
393.61(b)(2)
Emergency exit window handle
broken †
Windshield/ Glass/ Markings 1 Y
393.62(a)
No or defective bus emergency exits, manufactured on or after 9/1/1994
Windshield/ Glass/ Markings 1 Y
393.62(b)
No or defective bus emergency exits, manufactured on or after 9/1/1973 but before 9/1/1994
Windshield/ Glass/ Markings 1 Y
393.62(c)
No or defective bus emergency exit windows, manufactured before 9/1/1973
Windshield/ Glass/ Markings 1 Y
393.62(d) No / defective Safety glass/push-out window
Windshield/ Glass/ Markings 1 Y
393.62(e) No or inadequate bus emergency exit marking
Windshield/ Glass/ Markings 1 Y
393.65 Fuel system requirements Fuel Systems 1 N
393.65(b) Improper location of fuel system Fuel Systems 1 Y
393.65(c) Improper securement of fuel tank Fuel Systems 1 Y
393.65(f) Improper fuel line protection Fuel Systems 1 Y
393.67 Fuel tank requirement violations Fuel Systems 1 N

December 2010 A-19
Table 5. CSMS Vehicle Maintenance BASIC Violations 12
Section
Violation Description Shown on Driver/Vehicle Examination Report Given to CMV Driver after Roadside Inspection
Violation Group Description
Violation Severity Weight13
Violation in the DSMS (Y/N)
393.67(c)(7) Fuel tank fill pipe cap missing Fuel Systems 1 Y
393.67(c)(8) Improper fuel tank safety vent Fuel Systems 1 N
393.68
Compressed Natural Gas (CNG) Fuel Container does not conform to regulations
Other Vehicle Defect 3 Y
393.70 Fifth wheel Coupling Devices 3 N
393.70(a) Defective coupling device—improper tracking
Coupling Devices 3 N
393.70(b) Defective/improper fifth wheel assemblies
Coupling Devices 3 Y
393.70(b)(2) Defective fifth wheel locking mechanism
Coupling Devices 3 Y
393.70(c) Defective coupling devices for full trailer
Coupling Devices 3 Y
393.70(d) No/improper safety chains/cables for full trailer
Coupling Devices 3 Y
393.70(d)(8) Improper safety chain attachment Coupling Devices 3 Y
393.71 Improper coupling driveaway/tow-away operation
Coupling Devices 3 Y
393.71(g) Prohibited towing connection / device
Coupling Devices 3 Y
393.71(h) Towbar requirement violations Coupling Devices 3 Y
393.71(h)(10) No/improper safety chains/cables for towbar
Coupling Devices 3 Y
393.75 Tires/tubes (general) Tires 8 Y
393.75(a) Flat tire or fabric exposed Tires 8 Y
393.75(a)(1) Tire—ply or belt material exposed Tires 8 Y
393.75(a)(2) Tire—tread and/or sidewall separation Tires 8 Y
393.75(a)(3) Tire—flat and/or audible air leak Tires 8 Y
393.75(a)(4) Tire—cut exposing ply and/or belt material Tires 8 Y

December 2010 A-20
Table 5. CSMS Vehicle Maintenance BASIC Violations 12
Section
Violation Description Shown on Driver/Vehicle Examination Report Given to CMV Driver after Roadside Inspection
Violation Group Description
Violation Severity Weight13
Violation in the DSMS (Y/N)
393.75(b) Tire—front tread depth less than 4/32 of inch Tires 8 Y
393.75(c) Tire—other tread depth less than 2/32 of inch Tires 8 Y
393.75(d) Tire—bus regrooved/recap on front wheel Tires 8 Y
393.75(e) Tire—regrooved on front of truck/truck-tractor Tire vs. Load 3 Y
393.75(f) Tire—load weight rating/under inflated Tire vs. Load 3 Y
393.75(f)(1)
Weight carried exceeds tire load
limit † Tire vs. Load 3 Y
393.75(f)(2) Tire under-inflated † Tire vs. Load 3 Y
393.75(h) Tire under-inflated Tire vs. Load 3 Y
393.76 Sleeper berth requirement violations
Other Vehicle Defect 3 Y
393.77 Defective and/or prohibited heaters Other Vehicle Defect 3 Y
393.77(b)(5) Protection of operating controls from tampering
Other Vehicle Defect 3 Y
393.77(b)(11) Bus heater fuel tank location Other Vehicle Defect 3 Y
393.78 Windshield wipers inoperative/defective
Windshield/ Glass/ Markings 1 Y
393.79 Defroster / Defogger inoperative
Windshield/ Glass/ Markings 1 Y
393.80 Failing to equip vehicle with two rear vision mirrors
Other Vehicle Defect 3 Y
393.81 Horn inoperative Other Vehicle Defect 3 Y
393.82 Speedometer inoperative / inadequate
Other Vehicle Defect 3 Y
393.83(a) Exhaust system location Exhaust Discharge 1 Y

December 2010 A-21
Table 5. CSMS Vehicle Maintenance BASIC Violations 12
Section
Violation Description Shown on Driver/Vehicle Examination Report Given to CMV Driver after Roadside Inspection
Violation Group Description
Violation Severity Weight13
Violation in the DSMS (Y/N)
393.83(b) Exhaust discharge fuel tank/filler tube
Exhaust Discharge 1 Y
393.83(c) Improper exhaust—bus (gasoline) Exhaust Discharge 1 Y
393.83(d) Improper exhaust—bus (diesel) Exhaust Discharge 1 Y
393.83(e) Improper exhaust discharge (not rear of cab)
Exhaust Discharge 1 Y
393.83(f) Improper exhaust system repair (patch/wrap)
Exhaust Discharge 1 Y
393.83(g) Exhaust leak under truck cab and/or sleeper
Exhaust Discharge 1 Y
393.83(h) Exhaust system not securely fastened
Exhaust Discharge 1 Y
393.84 Inadequate floor condition Cab, Body, Frame 2 Y
393.86 No or improper rearend protection Cab, Body, Frame 2 Y
393.86(a)(1)
Rear impact guards—all trailers/semitrailers manufactured on or after 1/26/98
Cab, Body, Frame 2 N
393.86(a)(2)
Impact guard width—all trailers/semitrailers manufactured on or after 1/26/98
Cab, Body, Frame 2 N
393.86(a)(3)
Impact guard height—all trailers/semitrailers manufactured on or after 1/26/98
Cab, Body, Frame 2 N
393.86(a)(4)
Impact guard rear—all trailers/semitrailers manufactured on or after 1/26/98
Cab, Body, Frame 2 N
393.86(a)(5)
Cross-sectional vertical height— all trailers/semitrailers manufactured on or after 1/26/98
Cab, Body, Frame 2 N
393.86(b)(1)
Rear Impact Guards—motor vehicle manufactured on or after 12/31/52, see exceptions
Cab, Body, Frame 2 Y
393.88 Improperly located television receiver
Cab, Body, Frame 2 Y
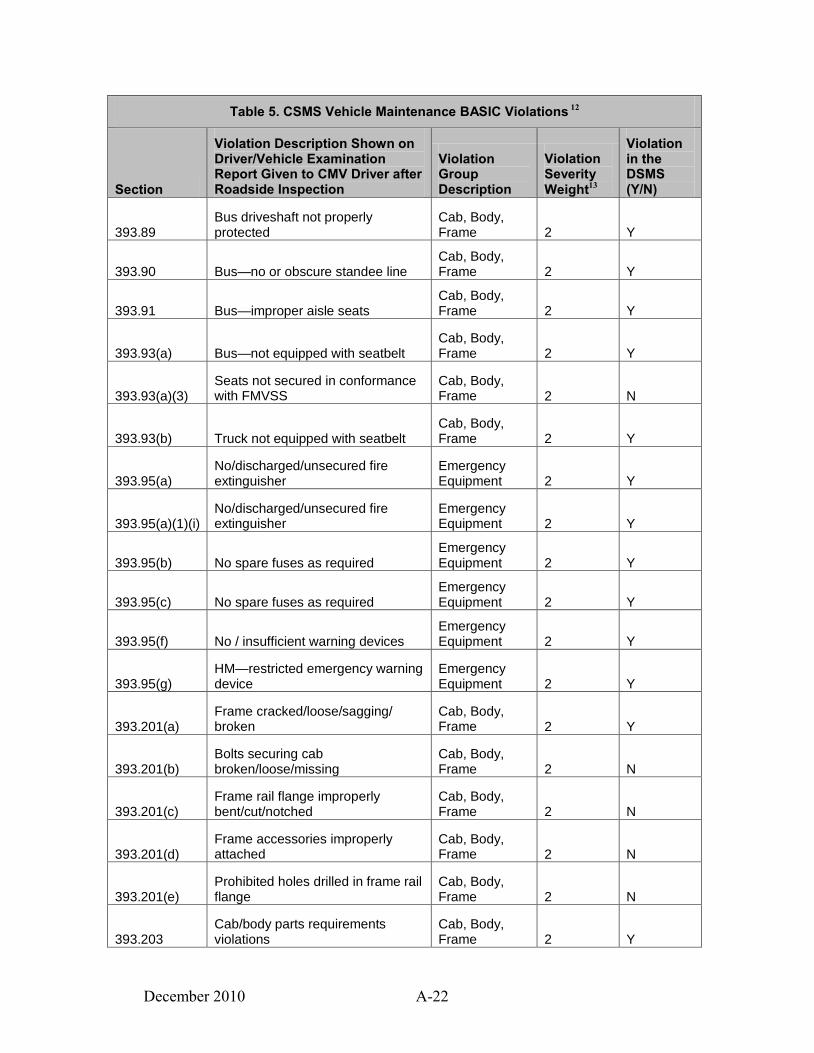
December 2010 A-22
Table 5. CSMS Vehicle Maintenance BASIC Violations 12
Section
Violation Description Shown on Driver/Vehicle Examination Report Given to CMV Driver after Roadside Inspection
Violation Group Description
Violation Severity Weight13
Violation in the DSMS (Y/N)
393.89 Bus driveshaft not properly protected
Cab, Body, Frame 2 Y
393.90 Bus—no or obscure standee line Cab, Body, Frame 2 Y
393.91 Bus—improper aisle seats Cab, Body, Frame 2 Y
393.93(a) Bus—not equipped with seatbelt Cab, Body, Frame 2 Y
393.93(a)(3) Seats not secured in conformance with FMVSS
Cab, Body, Frame 2 N
393.93(b) Truck not equipped with seatbelt Cab, Body, Frame 2 Y
393.95(a) No/discharged/unsecured fire extinguisher
Emergency Equipment 2 Y
393.95(a)(1)(i) No/discharged/unsecured fire extinguisher
Emergency Equipment 2 Y
393.95(b) No spare fuses as required Emergency Equipment 2 Y
393.95(c) No spare fuses as required Emergency Equipment 2 Y
393.95(f) No / insufficient warning devices Emergency Equipment 2 Y
393.95(g) HM—restricted emergency warning device
Emergency Equipment 2 Y
393.201(a) Frame cracked/loose/sagging/ broken
Cab, Body, Frame 2 Y
393.201(b) Bolts securing cab broken/loose/missing
Cab, Body, Frame 2 N
393.201(c) Frame rail flange improperly bent/cut/notched
Cab, Body, Frame 2 N
393.201(d) Frame accessories improperly attached
Cab, Body, Frame 2 N
393.201(e) Prohibited holes drilled in frame rail flange
Cab, Body, Frame 2 N
393.203 Cab/body parts requirements violations
Cab, Body, Frame 2 Y

December 2010 A-23
Table 5. CSMS Vehicle Maintenance BASIC Violations 12
Section
Violation Description Shown on Driver/Vehicle Examination Report Given to CMV Driver after Roadside Inspection
Violation Group Description
Violation Severity Weight13
Violation in the DSMS (Y/N)
393.203(a) Cab door missing/broken Cab, Body, Frame 2 Y
393.203(b) Cab/body improperly secured to frame
Cab, Body, Frame 2 Y
393.203(c) Hood not securely fastened Cab, Body, Frame 2 Y
393.203(d) Cab seats not securely mounted Cab, Body, Frame 2 Y
393.203(e) Cab front bumper missing/ unsecured/protrude
Cab, Body, Frame 2 Y
393.205(a) Wheel/rim cracked or broken Wheels, Studs, Clamps, Etc. 2 Y
393.205(b) Stud/bolt holes elongated on wheels
Wheels, Studs, Clamps, Etc. 2 Y
393.205(c) Wheel fasteners loose and/or missing
Wheels, Studs, Clamps, Etc. 2 Y
393.207(a) Axle positioning parts defective/missing Suspension 7 Y
393.207(b) Adjustable axle locking pin missing/disengaged Suspension 7 Y
393.207(c) Leaf spring assembly defective/missing Suspension 7 Y
393.207(d) Coil spring cracked and/or broken Suspension 7 Y
393.207(e) Torsion bar cracked and/or broken Suspension 7 Y
393.207(f) Air suspension pressure loss Suspension 7 Y
393.207(g) No/defective air suspension exhaust control Suspension 7 N
393.209(a) Steering wheel not secured/broken Steering Mechanism 6 Y
393.209(b) Excessive steering wheel lash Steering Mechanism 6 Y
393.209(c) Loose steering column Steering Mechanism 6 Y
393.209(d) Steering system components worn/welded/missing
Steering Mechanism 6 Y

December 2010 A-24
Table 5. CSMS Vehicle Maintenance BASIC Violations 12
Section
Violation Description Shown on Driver/Vehicle Examination Report Given to CMV Driver after Roadside Inspection
Violation Group Description
Violation Severity Weight13
Violation in the DSMS (Y/N)
393.209(e) Power steering violations Steering Mechanism 6 Y
396.1 Must have knowledge of and comply with regulations
Inspection Reports 4 Y
396.3(a)(1) Inspection/repair and maintenance parts and accessories
Wheels, Studs, Clamps, Etc. 2 Y
396.3A1B Brakes (general) Brakes, All Others 4 Y
396.3A1BA Brake out of adjustment Brakes Out of Adjustment 4 N
396.3A1BC Brake-air compressor violation Brakes, All Others 4 N
396.3A1BD Brake-defective brake drum Brakes, All Others 4 N
396.3A1BL Brake-reserve system pressure loss
Brakes, All Others 4 N
396.3A1T Tires (general) Tires 8 Y
396.5 Excessive oil leaks† Other Vehicle Defect 3 N
396.5(a) Failing to ensure that vehicle is properly lubricated
Other Vehicle Defect 3 N
396.5(b) Oil and/or grease leak Other Vehicle Defect 3 N
396.7 Unsafe operations forbidden Other Vehicle Defect 3 Y
396.9(c)(2) Operating an OOS vehicle Vehicle Jumping OOS 10 Y
396.9(d)(2) Failure to correct defects noted on inspection report
Inspection Reports 4 N
396.11 No or inadequate driver vehicle inspection report
Inspection Reports 4 Y
396.13(c)
No reviewing driver's signature on Driver Vehicle Inspection Report (DVIR)
Inspection Reports 4 Y
396.17(c) Operating a CMV without periodic inspection
Inspection Reports 4 N

December 2010 A-25
Table 5. CSMS Vehicle Maintenance BASIC Violations 12
Section
Violation Description Shown on Driver/Vehicle Examination Report Given to CMV Driver after Roadside Inspection
Violation Group Description
Violation Severity Weight13
Violation in the DSMS (Y/N)
398.5 Parts/access—migrant workers Other Vehicle Defect 3 Y
398.7 Inspect/maintain motor vehicle—migrant workers
Inspection Reports 4 N
399.207 Vehicle access requirements violations
Cab, Body, Frame 2 N
399.211 Inadequate maintenance of driver access
Cab, Body, Frame 2 N

December 2010 A-26
Table 6. CSMS Cargo-Related BASIC Violations 14
Section
Violation Description Shown on Driver/Vehicle Examination Report Given to CMV Driver after Roadside Inspection
Violation Group Description
Violation Severity Weight15
Violation in the DSMS (Y/N)
171.2(a) Failure to comply with HM regulations HM Other 2 Y
171.2(b)
Failure to comply with the requirements for HM transportation (including labeling and handling) HM Other 2 Y
171.2(c) Representing a package./container for HM not meeting specs Markings - HM 5 N
171.2(d) Accepting HM without registering with PHMSA
Documentation - HM 3 Y
171.2(f) Transporting HM not in accordance with this part
Fraudulent Behavior – HM 5 Y
171.2(g) Cargo tank does not comply with HM Regulations
Fraudulent Behavior – HM 5 N
171.2(k) Representing vehicle with HM, none present Fraudulent Behavior – HM 5 Y
172.301(a) No ID number on side/ends of non-bulk package — large quantity of single HM Markings - HM 5 N
172.301(a)(1) No proper shipping name and/or ID# marking on non-bulk Markings - HM 5 N
172.301(b) No technical name on non-bulk Documentation - HM 3 N
172.301(c) No special permit number on non-bulk package
Documentation - HM 3 N
172.301(d) No consignee/consignor on non-bulk Documentation - HM 3 N
172.302(a) No ID number (portable and cargo tank) Markings - HM 5 Y
172.302(b) Bulk package marking incorrect size Markings - HM 5 N
172.302(c) No special permit number on bulk package Documentation - HM 3 N
172.303(a) Prohibited HM marking on package Markings - HM 5 N
14 Violation severity weights reflect the relative importance of each violation within each BASIC. These weights cannot be compared or added meaningfully across the BASICs.
15 In cases where a violation results in an out-of-service order as defined in 49 CFR 390.5, an
additional weight of 2 is added to arrive at a total severity weight for the violation.
† Citations marked with † are being phased out based on regulatory changes, and are intended
for removal from the SMS at a later time

December 2010 A-27
Table 6. CSMS Cargo-Related BASIC Violations 14
Section
Violation Description Shown on Driver/Vehicle Examination Report Given to CMV Driver after Roadside Inspection
Violation Group Description
Violation Severity Weight15
Violation in the DSMS (Y/N)
172.304(a)(1) Package marking not durable, English, or print Markings - HM 5 N
172.304(a)(2) Marking not on sharply contrasting color Markings - HM 5 N
172.304(a)(3) Marking obscured by label or attachments Markings - HM 5 N
172.304(a)(4) Marking not away from other marking Markings - HM 5 N
172.310(a) No gross weight on radioactive materials package greater than 50 KG Markings - HM 5 N
172.310(b) Radioactive materials package not marked "Type A or B" Markings - HM 5 N
172.312(a) No package orientation arrows Cargo Protection – HM 4 N
172.312(a)(2) No package orientation arrows Cargo Protection – HM 4 N
172.312(b) Prohibited use of orientation arrows Cargo Protection – HM 4 N
172.313(a) No "inhalation hazard" on package Markings - HM 5 N
172.313(b) No "poison" on non-bulk plastic package Markings - HM 5 N
172.316(a) ―Other regulated material‖ non-bulk package not marked Markings - HM 5 N
172.320(a) Class 1 package not marked with ex-number Markings - HM 5 N
172.322(b) No marine pollutant marking on bulk packaging Markings - HM 5 N
172.324 Non-bulk hazardous substance not marked Markings - HM 5 N
172.325(a) Elevated temperature not marked "Hot" Markings - HM 5 N
172.325(b) Improperly marked molten aluminum/sulphur Markings - HM 5 N
172.326(b) No portable tank owner or lessee marking Markings - HM 5 N
172.326(c)(1) No ID number marking on vehicle carrying portable tank Markings - HM 5 N
172.326(c)(2) Shipper failed to provide ID number to carrier Markings - HM 5 N
172.328(a) Shipper failed to provide or affix ID number for cargo tank Markings - HM 5 N

December 2010 A-28
Table 6. CSMS Cargo-Related BASIC Violations 14
Section
Violation Description Shown on Driver/Vehicle Examination Report Given to CMV Driver after Roadside Inspection
Violation Group Description
Violation Severity Weight15
Violation in the DSMS (Y/N)
172.328(b) Cargo tank not marked for class 2 Markings - HM 5 N
172.328(c)
No quenched and tempered steel (QT)/other than quenched and tempered steel (NQT) marked on cargo tank (MC 330/331) Markings - HM 5 N
172.328(d) Fail to mark manual remote shutoff device Markings - HM 5 N
172.330(a)(2) Tank car tank (non cylinder) not marked as required Markings - HM 5 N
172.330(b) Motor vehicle with tank not marked Markings - HM 5 N
172.332 Required ID markings displayed Markings - HM 5 N
172.334 Prohibited ID number marking Markings - HM 5 N
172.334(a) ID # displayed on Class 7/Class 1/Dangerous or Subsidiary placard Markings - HM 5 N
172.336(b) ID numbers not properly displayed Markings - HM 5 N
172.336(c)(1) Failing to display ID numbers on compartment cargo tank in sequence Markings - HM 5 N
172.338 Carrier failed to replace missing ID number Markings - HM 5 N
172.400(a) Package/containment not labeled as required Markings - HM 5 Y
172.401 Prohibited labeling Markings - HM 5 N
172.402(a) No label for subsidiary hazard Markings - HM 5 N
172.402(b) Display of class number on label Markings - HM 5 N
172.402(d) Subsidiary labeling for radioactive materials Markings - HM 5 N
172.402(e) Subsidiary labeling for class 1(explosive) materials Markings - HM 5 N
172.403(a) Radioactive material label requirement Markings - HM 5 N
172.403(f) Radioactive material package—2 labels on opposite sides Markings - HM 5 N
172.403(g) Failed to label radioactive material properly Markings - HM 5 N

December 2010 A-29
Table 6. CSMS Cargo-Related BASIC Violations 14
Section
Violation Description Shown on Driver/Vehicle Examination Report Given to CMV Driver after Roadside Inspection
Violation Group Description
Violation Severity Weight15
Violation in the DSMS (Y/N)
172.403(g)(2) Class 7 label – no activity/activity not in SI units Markings - HM 5 N
172.404(a) Mixed package not properly labeled Markings - HM 5 N
172.404(b) Failed to properly label consolidated package Markings - HM 5 N
172.406(a)(1) Label placement not as required Markings - HM 5 N
172.406(c) Multiple label placement not as required Markings - HM 5 N
172.406(d) Label not on contrasting background or no border Markings - HM 5 N
172.406(e) Failed to display duplicate label as required Markings - HM 5 N
172.406(f) Label obscured by marking or attachment Markings - HM 5 N
172.504(a) Vehicle not placarded as required Markings - HM 5 Y
172.506(a)(1) Placards not affixed to vehicle Markings - HM 5 Y
172.516(a) Placard not visible from direction it faces Markings - HM 5 Y
172.516(c)(1) Placard not securely affixed or attached Markings - HM 5 Y
172.516(c)(2) Placard not clear of appurtenance Markings - HM 5 Y
172.516(c)(4) Placard improper location Markings - HM 5 Y
172.516(c)(5) Placard not reading horizontally Markings - HM 5 Y
172.516(c)(6) Placard damaged, deteriorated, or obscured Markings - HM 5 Y
172.516(c)(7) Placard not on contrasting background or border Markings - HM 5 Y
172.600(c) Emergency Response (ER) information not available
Documentation – HM 3 Y
172.602(a) Emergency response information missing Documentation – HM 3 Y
172.602(b) Form and manner of emergency response information
Documentation – HM 3 Y
172.602(c)(1) Maintenance/accessibility of emergency response information
Documentation – HM 3 Y
173.24(b)(1) Release of HM from package
Load Securement – HM 10 Y

December 2010 A-30
Table 6. CSMS Cargo-Related BASIC Violations 14
Section
Violation Description Shown on Driver/Vehicle Examination Report Given to CMV Driver after Roadside Inspection
Violation Group Description
Violation Severity Weight15
Violation in the DSMS (Y/N)
173.25(c)
Failure to label and package poison properly, when transported with edible material Markings - HM 5 Y
173.29(a) Empty package improper transportation Cargo Protection – HM 4 N
173.30 Loading/ unloading transport vehicles Cargo Protection – HM 4 Y
173.33(a) Cargo tank general requirements Cargo Protection – HM 4 Y
173.33(b) HM in cargo tank which had dangerous reaction with cargo tank
Cargo Protection – HM 4 Y
173.33(c)(2)
Cargo tank not marked with design or maximum allowable working pressure (MAWP)
Cargo Protection – HM 4 N
173.35(a) Intermediate bulk container requirements Package Integrity – HM 8 Y
173.35(f)(2) Intermediate bulk container (IBC) not secured to or within vehicle
Load Securement – HM 10 Y
173.54 Forbidden explosives, offering or transporting Fire Hazard - HM 6 N
173.315(j)(3) Residential gas tank not secure in transport Fire Hazard - HM 6 Y
173.315(j)(4) Liquefied Petroleum Gas (LPG) storage tank overfilled for transport Fire Hazard - HM 6 N
173.421(a) Transporting limited quantity—radioactive material exceeds 0.5 millirem/hour
Cargo Protection – HM 4 N
173.427(a)(iv) No instructions for exclusive use packaging—low specific activity
Cargo Protection – HM 4 Y
173.427(a)(vi)
Exclusive use low specific activity (LSA) radioactive material not marked "Radioactive-LSA" Markings - HM 5 Y
173.427(a)(6)(iv) No instructions for exclusive use packaging—low specific activity
Cargo Protection – HM 4 Y
173.427(a)(6)(vi)
Exclusive use low specific activity (LSA) radioactive material not marked "Radioactive-LSA" Markings - HM 5 Y
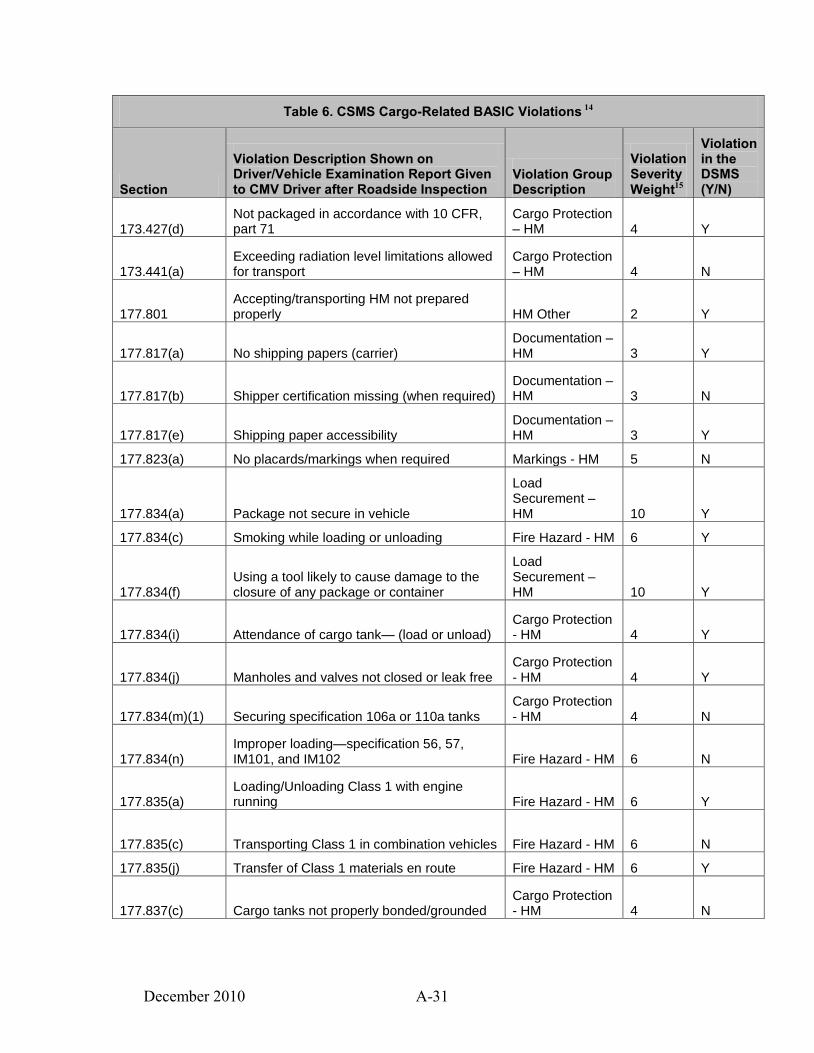
December 2010 A-31
Table 6. CSMS Cargo-Related BASIC Violations 14
Section
Violation Description Shown on Driver/Vehicle Examination Report Given to CMV Driver after Roadside Inspection
Violation Group Description
Violation Severity Weight15
Violation in the DSMS (Y/N)
173.427(d) Not packaged in accordance with 10 CFR, part 71
Cargo Protection – HM 4 Y
173.441(a) Exceeding radiation level limitations allowed for transport
Cargo Protection – HM 4 N
177.801 Accepting/transporting HM not prepared properly HM Other 2 Y
177.817(a) No shipping papers (carrier) Documentation – HM 3 Y
177.817(b) Shipper certification missing (when required) Documentation – HM 3 N
177.817(e) Shipping paper accessibility Documentation – HM 3 Y
177.823(a) No placards/markings when required Markings - HM 5 N
177.834(a) Package not secure in vehicle
Load Securement – HM 10 Y
177.834(c) Smoking while loading or unloading Fire Hazard - HM 6 Y
177.834(f) Using a tool likely to cause damage to the closure of any package or container
Load Securement – HM 10 Y
177.834(i) Attendance of cargo tank— (load or unload) Cargo Protection - HM 4 Y
177.834(j) Manholes and valves not closed or leak free Cargo Protection - HM 4 Y
177.834(m)(1) Securing specification 106a or 110a tanks Cargo Protection - HM 4 N
177.834(n) Improper loading—specification 56, 57, IM101, and IM102 Fire Hazard - HM 6 N
177.835(a) Loading/Unloading Class 1 with engine running Fire Hazard - HM 6 Y
177.835(c) Transporting Class 1 in combination vehicles Fire Hazard - HM 6 N
177.835(j) Transfer of Class 1 materials en route Fire Hazard - HM 6 Y
177.837(c) Cargo tanks not properly bonded/grounded Cargo Protection - HM 4 N

December 2010 A-32
Table 6. CSMS Cargo-Related BASIC Violations 14
Section
Violation Description Shown on Driver/Vehicle Examination Report Given to CMV Driver after Roadside Inspection
Violation Group Description
Violation Severity Weight15
Violation in the DSMS (Y/N)
177.837(d) Improper unloading of combustible liquids Cargo Protection - HM 4 N
177.838 Improper transport of class 4, 5, or division 4.2 Fire Hazard - HM 6 Y
177.840 Improper transport of class 2 Fire Hazard - HM 6 Y
177.840(g) Discharge valve not closed in transit class 2 Cargo Protection - HM 4 Y
177.840(o) Fail to test off-truck remote shutoff device Cargo Protection - HM 4 Y
177.840(s) Fail to possess remote shutoff when unloading
Cargo Protection - HM 4 Y
177.841(e) Poison label loaded with foodstuffs HM Other 2 Y
177.842(a) Total transport index exceeds 50—non-exclusive use HM Other 2 N
177.842(b) Distance from package to person—radioactive material HM Other 2 N
177.842(d) Blocking and bracing of radioactive material packages HM Other 2 Y
177.848(d) Prohibited load/transport/storage combination Fire Hazard - HM 6 N
177.848(f) Class 1 load separation or segregation HM Other 2 N
178.245-4 DOT51 integrity and securement Package Integrity - HM 8 N
178.245-5 DOT51 valve protection Package Integrity - HM 8 N
178.245-6(a) DOT51 name plate Markings - HM Package Integrity - HM 8 N
178.245-6(b) Tank outlets not marked Package Integrity - HM 8 N
178.251-4 DOT 56/57 integrity and securement Package Integrity - HM 8 N
178.251-7(b) DOT 56/57 spec Markings - HM Package Integrity - HM 8 N
178.255-4 DOT 60 manhole Package Integrity - HM 8 N
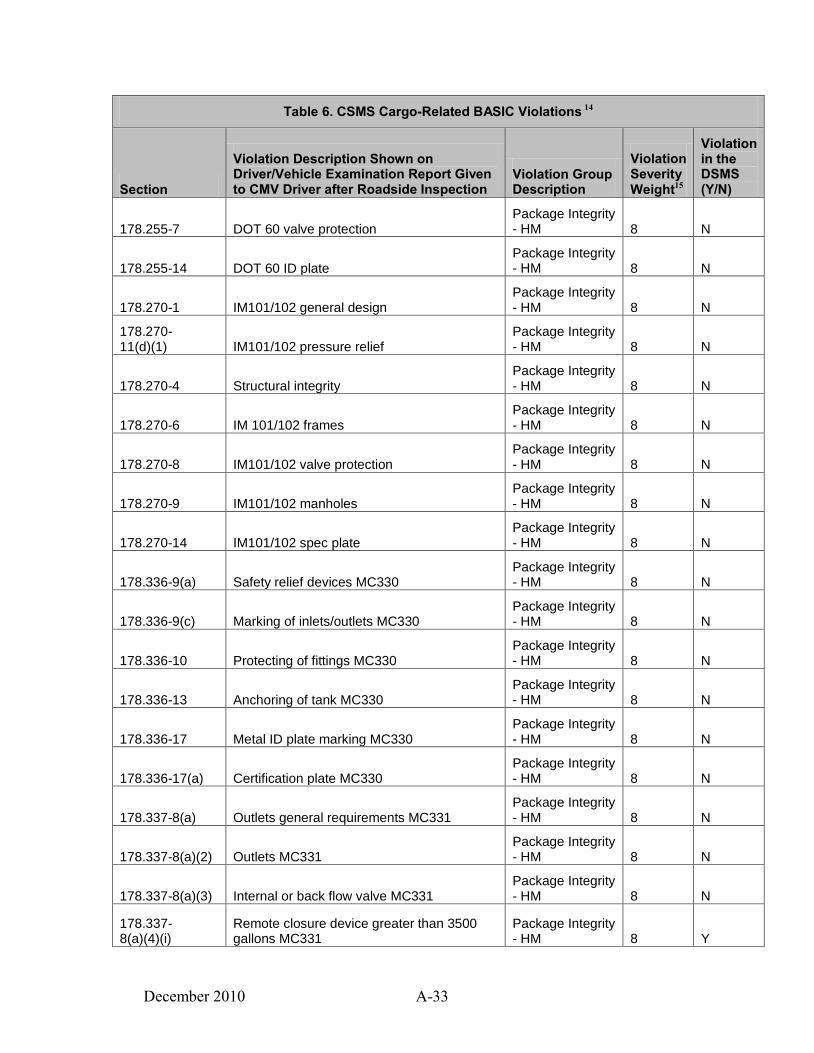
December 2010 A-33
Table 6. CSMS Cargo-Related BASIC Violations 14
Section
Violation Description Shown on Driver/Vehicle Examination Report Given to CMV Driver after Roadside Inspection
Violation Group Description
Violation Severity Weight15
Violation in the DSMS (Y/N)
178.255-7 DOT 60 valve protection Package Integrity - HM 8 N
178.255-14 DOT 60 ID plate Package Integrity - HM 8 N
178.270-1 IM101/102 general design Package Integrity - HM 8 N
178.270-11(d)(1) IM101/102 pressure relief
Package Integrity - HM 8 N
178.270-4 Structural integrity Package Integrity - HM 8 N
178.270-6 IM 101/102 frames Package Integrity - HM 8 N
178.270-8 IM101/102 valve protection Package Integrity - HM 8 N
178.270-9 IM101/102 manholes Package Integrity - HM 8 N
178.270-14 IM101/102 spec plate Package Integrity - HM 8 N
178.336-9(a) Safety relief devices MC330 Package Integrity - HM 8 N
178.336-9(c) Marking of inlets/outlets MC330 Package Integrity - HM 8 N
178.336-10 Protecting of fittings MC330 Package Integrity - HM 8 N
178.336-13 Anchoring of tank MC330 Package Integrity - HM 8 N
178.336-17 Metal ID plate marking MC330 Package Integrity - HM 8 N
178.336-17(a) Certification plate MC330 Package Integrity - HM 8 N
178.337-8(a) Outlets general requirements MC331 Package Integrity - HM 8 N
178.337-8(a)(2) Outlets MC331 Package Integrity - HM 8 N
178.337-8(a)(3) Internal or back flow valve MC331 Package Integrity - HM 8 N
178.337-8(a)(4)(i)
Remote closure device greater than 3500 gallons MC331
Package Integrity - HM 8 Y

December 2010 A-34
Table 6. CSMS Cargo-Related BASIC Violations 14
Section
Violation Description Shown on Driver/Vehicle Examination Report Given to CMV Driver after Roadside Inspection
Violation Group Description
Violation Severity Weight15
Violation in the DSMS (Y/N)
178.337-8(a)(4)(ii)
Remote closure device less than 3500 gallons MC331
Package Integrity - HM 8 Y
178.337-9(c) Marking inlets/outlets MC331 Package Integrity - HM 8 N
178.337-10(a) Protection of fittings MC331 Package Integrity - HM 8 N
178.337-10(d) Rear end protection MC331 Package Integrity - HM 8 N
178.337-11(b) Shut off valves MC331 Package Integrity - HM 8 Y
178.337-13 MC331 supports and anchoring Package Integrity - HM 8 N
178.337-17(a) Metal ID plate missing MC331 Package Integrity - HM 8 N
178.338-6 Manhole MC338 Package Integrity - HM 8 N
178.338-8 Pressure relief devices MC338 Package Integrity - HM 8 N
178.338-10(a) Protection of fittings MC338 Package Integrity - HM 8 N
178.338-10(c) Rear end protection MC338 Package Integrity - HM 8 N
178.338-11(b) Manual shutoff valve MC338 Package Integrity - HM 8 Y
178.338-12 Shear section MC338 Package Integrity - HM 8 N
178.338-13 Supports and anchoring MC338 Package Integrity - HM 8 N
178.338-18(a) Name plate/Specification plate missing MC338
Package Integrity - HM 8 N
178.338-18(b) Specification plate missing MC338 Package Integrity - HM 8 N
178.340-6 MC306/307/312 supports and anchoring Package Integrity - HM 8 N
178.340-7(a) MC306/307/312 ring stiffeners Package Integrity - HM 8 N
178.340-7(c) MC306/307/312 double bulkhead drain Package Integrity - HM 8 N

December 2010 A-35
Table 6. CSMS Cargo-Related BASIC Violations 14
Section
Violation Description Shown on Driver/Vehicle Examination Report Given to CMV Driver after Roadside Inspection
Violation Group Description
Violation Severity Weight15
Violation in the DSMS (Y/N)
178.340-7(d)(2) MC306/307/312 ring stiffener drain hole Package Integrity - HM 8 N
178.340-8(a) MC306/307/312 appurtenances attachment Package Integrity - HM 8 N
178.340-8(b) MC306/307/312 rearend protection Package Integrity - HM 8 N
178.340-8(c) MC306/307/312 overturn protection Package Integrity - HM 8 N
178.340-8(d) MC306/307/312 piping protection Package Integrity - HM 8 N
178.340-8(d)(1) MC306/307/312 piping protection Package Integrity - HM 8 N
178.340-8(d)(2) MC306/307/312 minimum road clearance Package Integrity - HM 8 N
178.340-10(b) MC306/307/312 metal certification plate missing
Package Integrity - HM 8 N
178.341-3(a) MC306 no manhole closure Package Integrity - HM 8 N
178.341-4 MC306 venting Package Integrity - HM 8 N
178.341-4(d)(1) MC306 inadequate emergency venting Package Integrity - HM 8 N
178.341-4(d)(2) MC306 pressure activated vents Package Integrity - HM 8 N
178.341-4(d)(3) MC306 no fusible venting Package Integrity - HM 8 N
178.341-5(a) MC306 internal valves Package Integrity - HM 8 N
178.341-5(a)(1) MC306 heat actuated safety Package Integrity - HM 8 N
178.341-5(a)(2) MC306 remote control shutoff Package Integrity - HM 8 Y
178.342-3 MC307 manhole closure Package Integrity - HM 8 Y
178.342-4 MC307 venting Package Integrity - HM 8 N
178.342-4(b) Inadequate venting capacity Package Integrity - HM 8 N

December 2010 A-36
Table 6. CSMS Cargo-Related BASIC Violations 14
Section
Violation Description Shown on Driver/Vehicle Examination Report Given to CMV Driver after Roadside Inspection
Violation Group Description
Violation Severity Weight15
Violation in the DSMS (Y/N)
178.342-5(a) MC307 internal valve Package Integrity - HM 8 N
178.342-5(a)(1) MC307 heat actuated safety Package Integrity - HM 8 N
178.342-5(a)(2) MC307 remote control shutoff Package Integrity - HM 8 Y
178.343-3 Manhole closure MC312 Package Integrity - HM 8 N
178.343-4 Venting MC312 (show calculations) Package Integrity - HM 8 N
178.343-5(a) MC312 top outlet and valve Package Integrity - HM 8 N
178.343-5(b)(1) MC312 bottom valve/piping protection Package Integrity - HM 8 N
178.345-1(i)(2) DOT 406, 407, 412 Obstructed double bulkhead drain/vent
Package Integrity - HM 8 N
178.345-5(d) DOT406/407/412 manhole securement Package Integrity - HM 8 N
178.345-5(e) DOT406/407/412 manhole marking Package Integrity - HM 8 N
178.345-6 DOT406/407/412 supports and anchoring Package Integrity - HM 8 N
178.345-7(d)(4) DOT406/407/412 ring stiffener drain Package Integrity - HM 8 N
178.345-8(a) DOT406/407/412 accident protection Package Integrity - HM 8 N
178.345-8(a)(5) DOT406/407/412 minimum road clearance Package Integrity - HM 8 N
178.345-8(b) DOT406/407/412 bottom damage protection Package Integrity - HM 8 N
178.345-8(c) DOT406/407/412 rollover damage protection Package Integrity - HM 8 N
178.345-8(d) DOT406/407/412 rear end protection Package Integrity - HM 8 N
178.345-10 DOT406/407/412 pressure relief Package Integrity - HM 8 N
178.345-11(b) DOT406/407/412 tank valves Package Integrity - HM 8 N
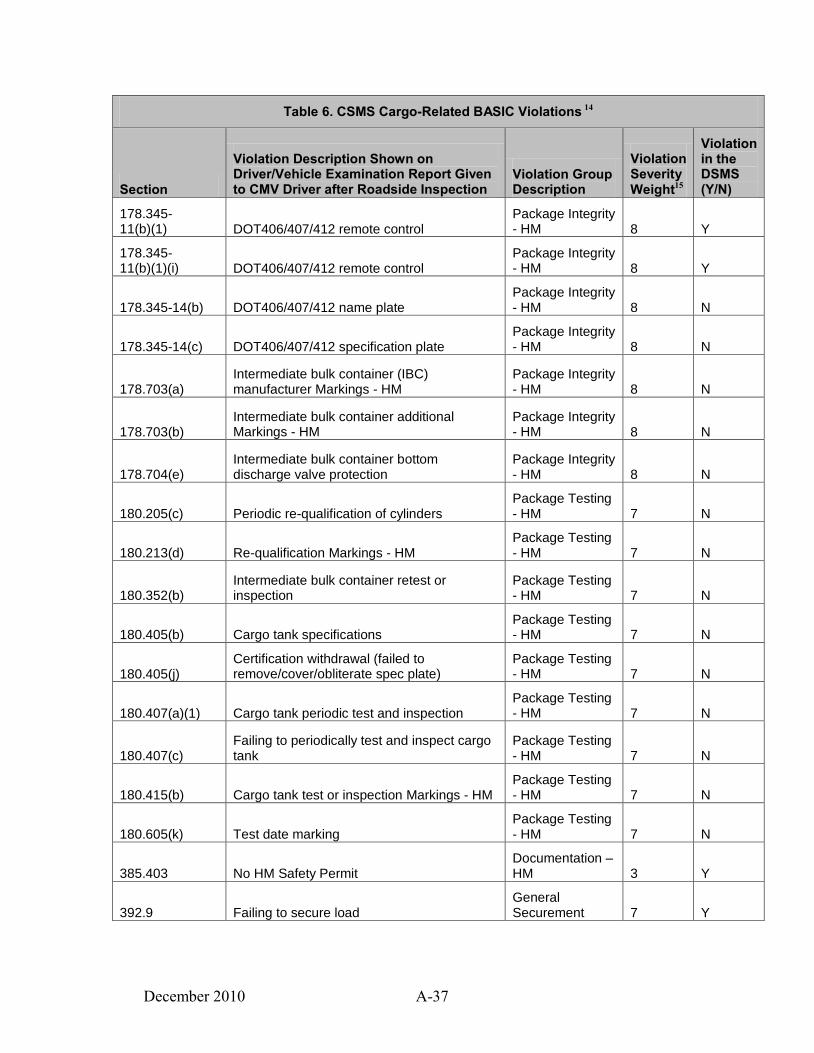
December 2010 A-37
Table 6. CSMS Cargo-Related BASIC Violations 14
Section
Violation Description Shown on Driver/Vehicle Examination Report Given to CMV Driver after Roadside Inspection
Violation Group Description
Violation Severity Weight15
Violation in the DSMS (Y/N)
178.345-11(b)(1) DOT406/407/412 remote control
Package Integrity - HM 8 Y
178.345-11(b)(1)(i) DOT406/407/412 remote control
Package Integrity - HM 8 Y
178.345-14(b) DOT406/407/412 name plate Package Integrity - HM 8 N
178.345-14(c) DOT406/407/412 specification plate Package Integrity - HM 8 N
178.703(a) Intermediate bulk container (IBC) manufacturer Markings - HM
Package Integrity - HM 8 N
178.703(b) Intermediate bulk container additional Markings - HM
Package Integrity - HM 8 N
178.704(e) Intermediate bulk container bottom discharge valve protection
Package Integrity - HM 8 N
180.205(c) Periodic re-qualification of cylinders Package Testing - HM 7 N
180.213(d) Re-qualification Markings - HM Package Testing - HM 7 N
180.352(b) Intermediate bulk container retest or inspection
Package Testing - HM 7 N
180.405(b) Cargo tank specifications Package Testing - HM 7 N
180.405(j) Certification withdrawal (failed to remove/cover/obliterate spec plate)
Package Testing - HM 7 N
180.407(a)(1) Cargo tank periodic test and inspection Package Testing - HM 7 N
180.407(c) Failing to periodically test and inspect cargo tank
Package Testing - HM 7 N
180.415(b) Cargo tank test or inspection Markings - HM Package Testing - HM 7 N
180.605(k) Test date marking Package Testing - HM 7 N
385.403 No HM Safety Permit Documentation – HM 3 Y
392.9 Failing to secure load General Securement 7 Y

December 2010 A-38
Table 6. CSMS Cargo-Related BASIC Violations 14
Section
Violation Description Shown on Driver/Vehicle Examination Report Given to CMV Driver after Roadside Inspection
Violation Group Description
Violation Severity Weight15
Violation in the DSMS (Y/N)
392.9(a) Failing to secure load General Securement 7 Y
392.9(a)(1) Failing to secure cargo/§§ 393.100-393.136 General Securement 7 Y
392.9(a)(2) Failing to secure vehicle equipment General Securement 7 Y
392.9(a)(3) Driver's view/movement is obstructed General Securement 7 Y
392.62(c)(1) Bus — baggage/freight restricts driver operation
General Securement 7 Y
392.62(c)(2) Bus — Exit(s) obstructed by baggage/freight General Securement 7 Y
392.62(c)(3) Passengers not protected from falling baggage
General Securement 7 Y
392.63 Pushing/towing a loaded bus Passenger 10 Y
393.87 Warning flag required on projecting load Warning Flags 4 Y
393.87(a) Warning flag required on projecting load Warning Flags 4 Y
393.87(b) Improper warning flag placement Warning Flags 4 Y
393.100 Failure to prevent cargo shifting General Securement 7 Y
393.100(a) Failure to prevent cargo shifting General Securement 7 Y
393.100(b) Leaking/spilling/blowing/falling cargo Improper Securement 10 Y
393.100(c) Failure to prevent cargo shifting General Securement 7 Y
393.102(a) Improper securement system (tiedown assemblies) Tiedown 8 Y
393.102(a)(1) Insufficient means to prevent forward movement
Failure to Prevent Movement 8 Y
393.102(a)(1)(i) Insufficient means to prevent forward movement
Failure to Prevent Movement 8 Y
393.102(a)(1)(ii) Insufficient means to prevent rearward movement
Failure to Prevent Movement 8 Y

December 2010 A-39
Table 6. CSMS Cargo-Related BASIC Violations 14
Section
Violation Description Shown on Driver/Vehicle Examination Report Given to CMV Driver after Roadside Inspection
Violation Group Description
Violation Severity Weight15
Violation in the DSMS (Y/N)
393.102(a)(1)(iii) Insufficient means to prevent lateral movement
Failure to Prevent Movement 8 Y
393.102(a)(2) Tiedown assembly with inadequate working load limit Tiedown 8 Y
393.102(a)(3) Insufficient means to prevent lateral movement
Failure to Prevent Movement 8 Y
393.102(b) Insufficient means to prevent vertical movement
Failure to Prevent Movement 8 Y
393.102(c) No equivalent means of securement Improper Securement 10 Y
393.104(a) Inadequate/damaged securement device/system Equipment 7 Y
393.104(b) Damaged securement system/tiedowns Equipment 7 Y
393.104(c) Damaged vehicle structures/anchor points Equipment 7 Y
393.104(d) Damaged Dunnage/bars/blocking-bracing Equipment 7 Y
393.104(f)(1) Knotted tiedown Tiedown 8 Y
393.104(f)(2) Use of tiedown with improper repair. Tiedown 8 Y
393.104(f)(3) Loose/unfastened tiedown. Tiedown 8 Y
393.104(f)(4) No edge protection for tiedowns Tiedown 8 Y
393.104F4R No edge protection for tiedowns Tiedown 8 Y
393.104(f)(5) No edge protection for tiedowns Tiedown 8 Y
393.106(a) No/improper front end structure/headerboard Equipment 7 Y
393.106(b) Cargo not immobilized or secured
Failure to Prevent Movement 8 Y
393.106(c)(1) No means to prevent cargo from rolling
Failure to Prevent Movement 8 Y
393.106(c)(2) Cargo without direct contact/prevention from shifting
Failure to Prevent Movement 8 Y
393.106(d) Insufficient aggregate working load limit Tiedown 8 Y
393.110 Failing to meet minimum tiedown requirements (
General Securement 7 Y

December 2010 A-40
Table 6. CSMS Cargo-Related BASIC Violations 14
Section
Violation Description Shown on Driver/Vehicle Examination Report Given to CMV Driver after Roadside Inspection
Violation Group Description
Violation Severity Weight15
Violation in the DSMS (Y/N)
393.110(b) Insufficient tiedowns; without headerboard/blocking Tiedown 8 Y
393.110(c) Insufficient tiedowns; with headerboard/blocking Tiedown 8 Y
393.110(d) Large/odd-shaped cargo not adequately secured
Failure to Prevent Movement 8 Y
393.112 Tiedown not adjustable by driver Equipment 7 Y
393.114 No/improper front end structure General Securement 7 Y
393.114(b)(1) Insufficient height for front-end structure Equipment 7 Y
393.114(b)(2) Insufficient width for front-end structure Equipment 7 Y
393.114(d) Front-end structure with large opening(s) Equipment 7 Y
393.116 No/improper securement of logs General Securement 7 Y
393.116(d)(1) Short; over 1/3 length past structure Improper Securement 10 Y
393.116(d)(2) Short, insufficient/no tiedowns Improper Securement 10 Y
393.116(d)(3) Short, tiedowns improperly positioned Improper Securement 10 Y
393.116(d)(4) Short, no center stakes/high log not secured Improper Securement 10 Y
393.116(e) Short, length; improper securement Improper Securement 10 Y
393.118 No/improper lumber/building materials. securement
General Securement 7 Y
393.118(b) Improper placement of bundles Improper Securement 10 Y
393.118(d) Insufficient protection against lateral movement
Failure to Prevent Movement 8 Y
393.118(d)(3) Insufficient/improper arrangement of tiedowns Tiedown 8 Y
393.120 No/improper securement of metal coils General Securement 7 Y

December 2010 A-41
Table 6. CSMS Cargo-Related BASIC Violations 14
Section
Violation Description Shown on Driver/Vehicle Examination Report Given to CMV Driver after Roadside Inspection
Violation Group Description
Violation Severity Weight15
Violation in the DSMS (Y/N)
393.120(b)(1) Coil/vertical improper securement Improper Securement 10 Y
393.120(b)(2) Coils, rows, eyes vertical; improper secure. Improper Securement 10 Y
393.120(c)(1) Coil/eye crosswise improper securement Improper Securement 10 Y
393.120(c)(2) X-pattern on coil(s) with eyes crosswise Improper Securement 10 Y
393.120(d)(1) Coil with eye lengthwise—improper securement
Improper Securement 10 Y
393.120(d)(4) Coils, rows, eyes length—improper securement.
Improper Securement 10 Y
393.120(e) No protection against shifting/tipping
Failure to Prevent Movement 8 Y
393.122 No/improper securement of paper rolls General Securement 7 Y
393.122(b) Rolls vertical—improper securement Improper Securement 10 Y
393.122(c) Rolls vertical /split—improper securement Improper Securement 10 Y
393.122(d) Rolls vertical /stacked—improper securement
Improper Securement 10 Y
393.122(e) Rolls crosswise—improper securement Improper Securement 10 Y
393.122(f) Rolls crosswise/stacked load—improperly secured
Improper Securement 10 Y
393.122(g) Rolls length—improper securement Improper Securement 10 Y
393.122(h) Rolls lengthwise/stacked—improper securement
Improper Securement 10 Y
393.122(i) Improper securement—rolls on flatbed/curb-side
Improper Securement 10 Y
393.124 No/improper securement of concrete pipe General Securement 7 Y
393.124(b) Insufficient working load limit—concrete pipes Tiedown 8 Y

December 2010 A-42
Table 6. CSMS Cargo-Related BASIC Violations 14
Section
Violation Description Shown on Driver/Vehicle Examination Report Given to CMV Driver after Roadside Inspection
Violation Group Description
Violation Severity Weight15
Violation in the DSMS (Y/N)
393.124(c) Improper blocking of concrete pipe Improper Securement 10 Y
393.124(d) Improper arrangement of concrete pipe Improper Securement 10 Y
393.124(e) Improper securement, up to 45 in. diameter Improper Securement 10 Y
393.124(f) Improper securement, greater than 45 inch diameter
Improper Securement 10 Y
393.126 Fail to ensure intermodal container secured General Securement 7 Y
393.126(b) Damaged/missing tiedown/securement device -Equipment 7 Y
393.126(c)(1) Lower corners not on vehicle/structure -Equipment 7 Y
393.126(c)(2) All corners of chassis not secured Improper Securement 10 Y
393.126(c)(3) Front and rear not secured independently Improper Securement 10 Y
393.126(d)(1) Empty container not properly positioned Improper Securement 10 Y
393.126(d)(2) Empty container, more than 5 foot overhang Improper Securement 10 Y
393.126(d)(4) Empty container—not properly secured Improper Securement 10 Y
393.128 No/improper securement of vehicles General Securement 7 Y
393.128(b)(1) Vehicle not secured—front and rear Improper Securement 10 Y
393.128(b)(2) Tiedown(s) not affixed to mounting points. Improper Securement 10 Y
393.128(b)(3) Tiedown(s) not over/around wheels. Improper Securement 10 Y
393.130 No/improper heavy vehicle/machine securement
General Securement 7 Y
393.130(b) Item not properly prepared for transport Improper Securement 10 Y
393.130(c) Improper restraint/securement of item Improper Securement 10 Y

December 2010 A-43
Table 6. CSMS Cargo-Related BASIC Violations 14
Section
Violation Description Shown on Driver/Vehicle Examination Report Given to CMV Driver after Roadside Inspection
Violation Group Description
Violation Severity Weight15
Violation in the DSMS (Y/N)
393.132 No/improper securement of crushed vehicles General Securement 7 Y
393.132(b) Prohibited use of synthetic webbing. Equipment 7 Y
393.132(c) Insufficient tiedowns per stack cars Tiedown 8 Y
393.132(c)(5) Insufficient means to retain loose parts Improper Securement 10 Y
393.134 No/improper securement of roll/hook container
General Securement 7 Y
393.134(b)(1) No blocking against forward movement
Failure to Prevent Movement Y
393.134(b)(2) Container not secured to front of vehicle Improper Securement 10 Y
393.134(b)(3) Rear of container not properly secured Improper Securement 10 Y
393.136 No/improper securement of large boulders General Securement 7 Y
393.136(b) Improper placement/positioning for boulder Improper Securement 10 Y
393.136(c)(1) Boulder not secured with chain Improper Securement 10 Y
393.136(d) Improper securement—cubic boulder Improper Securement 10 Y
393.136(e) Improper securement—non-cubic boulder with base
Improper Securement 10 Y
393.136(f) Improper securement—non-cubic boulder without base
Improper Securement 10 Y
397.1(a) Driver/carrier must obey part 397 HM Other 2 Y
397.1(b) Failing to require employees to know/obey part 397 HM Other 2 Y
397.2 Must comply with rules in parts 390-397—transporting HM HM Other 2 Y
397.7(a) Improperly parked explosives vehicle Fire Hazard - HM 6 Y
397.7(b) Improperly parked HM vehicle Fire Hazard - HM 6 Y
397.11(a) HM vehicle operated near open fire Fire Hazard - HM 6 Y
397.11(b) HM vehicle parked within 300 feet of fire Fire Hazard - HM 6 Y

December 2010 A-44
Table 6. CSMS Cargo-Related BASIC Violations 14
Section
Violation Description Shown on Driver/Vehicle Examination Report Given to CMV Driver after Roadside Inspection
Violation Group Description
Violation Severity Weight15
Violation in the DSMS (Y/N)
397.15 HM vehicle fueling violation Fire Hazard - HM 6 Y
397.17 No tire examination on HM vehicle HM Other 2 Y
397.19
No instructions/documents when transporting Division 1.1/1.2/1.3 (explosive) materials
Documentation - HM 3 Y
397.19(c) Required documents not in possession—explosive materials
Documentation - HM 3 Y
397.67 HM vehicle routing violation (non-radioactive materials) HM Route 1 Y
397.101(b) Radioactive materials vehicle not on preferred route HM Route 1 Y
397.101(d) No or incomplete route plan—radioactive materials HM Route 1 Y
397.101(e)(2) Driver not in possession of training certificate HM Route 1 Y
397.101(e)(3) Driver not in possession of written route plan HM Route 1 Y

December 2010 B-1
Appendix B
SMS Methodology Changes from Version 1.2 to 2.0
The Federal Motor Carrier Safety Administration (FMCSA) and its stakeholders share a commitment to safety, which has been underscored by strong participation in FMCSA‘s listening sessions on CSA resulting in constructive input from organizations, enforcement personnel, industry, and motor carrier safety experts. During the Operational Model Test (Op-Model Test) period, FMCSA solicited feedback and suggestions from stakeholders including FMCSA staff, State Partners, industry, and safety advocates and, as a result, the Agency has identified four opportunities to enhance the new program. The enhancements include:
1. Modifications to the measure of exposure for the Unsafe Driving Behavior Analysis and Safety Improvement Category (BASIC) and Crash Indicator
2. Refinements to the measurement approach for the Controlled Substances/Alcohol BASIC
3. Updates to the severity weights of roadside violations based on subject matter expert review; and
4. A more strategic approach to addressing motor carriers with a history of vehicle size and weight violations.
Below is detailed information regarding the feedback, analysis, and implementation approach for each of these four enhancements.
1. Modifications to the measure of exposure for the Unsafe Driving BASIC and
Crash Indicator a. Feedback Received: The sole use of number of Power Units (PUs) owned
by a motor carrier underestimates the on-road exposure for carriers that more extensively utilize their PUs. The use of Vehicle Miles Traveled (VMT) should be considered as a means of assessing the Unsafe Driving BASIC and Crash Indicator that currently rely on PUs.
b. Analysis Conducted: Analysis conducted by FMCSA shows that while measuring exposure solely by PUs may overly identify high-utilization carriers (i.e., carriers with above-average VMT per PU) as deficient, the sole use of VMT overly identifies low-utilization carriers as deficient. In addition, complete and accurate data on all carriers‘ VMT is not currently available.
c. Solution: FMCSA has revised its approach to measure carriers‘ exposure on the road within the Unsafe Driving BASIC and the Crash Indicator. This new approach uses a combination of PUs and, when available and

December 2010 B-2
reliable, VMT data from FMCSA‘s Motor Carrier Census. Further, the Agency is currently exploring options to enhance the completeness and accuracy of VMT data including confirming the validity of VMT information from other sources.
d. Implementation Approach:
i. Segmentation –The carrier population is segmented into two groups for the Unsafe Driving BASIC and Crash Indicator based on the types of vehicles operated so that companies operating fundamentally different types of vehicles are no longer compared to each other:
1. Segment 1 –―Combo‖: Combination trucks/motor coach buses constituting 70% or more of the total PUs in a carrier‘s fleet.
2. Segment 2 –―Straight‖: Straight trucks/other vehicles constituting more than 30% of the total PUs in a carrier‘s fleet.
ii. Utilization Factor – Carriers with above-average truck utilization will receive an adjustment to their PUs called the Utilization Factor (UF), which will provide a safety-based adjustment to the Unsafe Driving BASIC and Crash Indicator percentiles. Only carriers with annualized VMT data reported in the past 24 months on the Motor Carrier Census (obtained via the VMT field on the MCS-150 Form or from a FMCSA investigation) will be eligible to receive an adjustment. Carriers without current VMT will not benefit from the utilization factor in their safety assessment calculations.
iii. Safety Event Grouping – The Unsafe Driving BASIC and Crash Indicator will change from using PUs as the basis for safety event grouping (formerly referred to as peer grouping) to using the number of inspections with an Unsafe Driving-related violation for the Unsafe Driving BASIC and the number of crashes for the Crash Indicator. The safety event grouping allows the SMS to handle the diverse motor carrier population while ensuring similarly situated carriers are treated with the same standard.
2. Refinements to the measurement approach for the Controlled Substances/Alcohol BASIC
a. Feedback Received: Op-Model Test results and law enforcement experts indicated that violations within this BASIC are more likely to be found during an inspection rather than be the cause for an inspection and

December 2010 B-3
therefore, measuring exposure in this BASIC by number of PUs does not accurately reflect carrier exposure.
b. Analysis Conducted: Analysis confirmed that these types of violations are more likely to result from an inspection than to be the cause of the inspection.
c. Solution: The Controlled Substance/Alcohol BASIC measure of exposure will now be based on the number of relevant inspections instead of the number of PUs as in the prior version of the SMS. This BASIC will change from using PUs as the basis for safety event grouping to using number of inspections with a Controlled Substance/Alcohol-related violation.
d. Implementation Approach: This measure is now calculated by the following formula:
sinspectionrelevantofweighttimeTotal
violationsapplicableweightedseverityandtimeofTotalMeasureBASIC
Note: Further information on time and severity weights is available in this SMS Methodology document.
3. Updates to the severity weights of roadside violations based on subject matter expert review
a. Feedback Received: Law enforcement personnel recommended that the violation used in the measurement system be updated to reflect the current set of roadside inspection safety violations. Enforcement personnel, along with the motor carrier industry, also suggested that the severity weights assigned to some violations be reassessed.
b. Analysis Conducted: Subject matter experts from FMCSA‘s field staff, including enforcement personnel and CSA development team members, examined severity weighting and submitted recommendations for changes to the Agency.
c. Solution: This version of SMS includes updated violations and severity weightings.
d. Implementation Approach: Appendix A in the SMS Methodology contains a complete listing of violations and severity weights.
4. A more strategic approach to addressing motor carriers with a history of size and weight violations
December 2010 B-4
a. Feedback Received: Results from the Op-Model Test have demonstrated the difficulties of enforcing vehicle size and weight violations through CSA interventions conducted by FMCSA and State Safety Investigators.
b. Analysis Conducted: Alternative methods to address this safety issue are currently under development. These methods include a more refined collection of detailed size and weight violation data and alerts in systems used by roadside inspectors to identify carriers with patterns of prior size and weight violations.
c. Solution: Size and weight violations have been removed from the Cargo-Related BASIC. However, it is important to note that roadside inspectors will continue to cite these violations at the roadside and Safety Investigators will continue to address these violations, including potential enforcement actions if appropriate, through investigations.
SMS Methodology Changes from Version 2.0 to 2.1
FMCSA has continued to solicit feedback and suggestions from stakeholders and has identified two opportunities to enhance the SMS Methodology. The enhancements include:
1. Recalibration of the Cargo-Related BASIC severity weights of roadside violations based on subject matter expert review; and
2. A new chapter that provides SMS example calculations. Below is detailed information regarding the feedback, analysis, and implementation approach for each of these enhancements.
1. Recalibration of the Cargo-Related BASIC severity weights of roadside violations based on subject matter expert review
a. Feedback Received: The motor carrier industry as well as law enforcement personnel suggested that the severity weight of all the ―Load Securement‖
violations in the Cargo-Related BASIC that were set to the maximum of 10 were too high.
b. Analysis Conducted: Subject matter experts from FMCSA‘s field staff and State Partners, including enforcement personnel and CSA development team members, examined severity weighting and submitted recommendations for changes to the Agency.
c. Solution: This version of SMS includes updated violations and severity weightings in the Cargo-Related BASIC.

December 2010 B-5
d. Implementation Approach: Table 6 in Appendix A of the SMS Methodology contains a complete listing of violations and severity weights in the Cargo-Related BASIC.
2. A new chapter that provides SMS example calculations a. Feedback Received: The motor carrier industry as well as law enforcement
personnel suggested that the inclusion of example measurement calculations would help them understand how the SMS results were derived.
b. Analysis Conducted: Analysis confirmed that example calculations will aid users in learning the details behind the SMS.
c. Solution: This version of SMS includes a chapter detailing example measurement calculations.
d. Implementation Approach: Section 5 of the SMS Methodology contains the example calculations.