sagd water disposal options, associated impacts, … perdicakis, january 27, 2011. sagd water...
TRANSCRIPT
Basil Perdicakis, January 27, 2011
SAGD Water Disposal Options, Associated Impacts, and Strategies to Improve Environmental Footprint
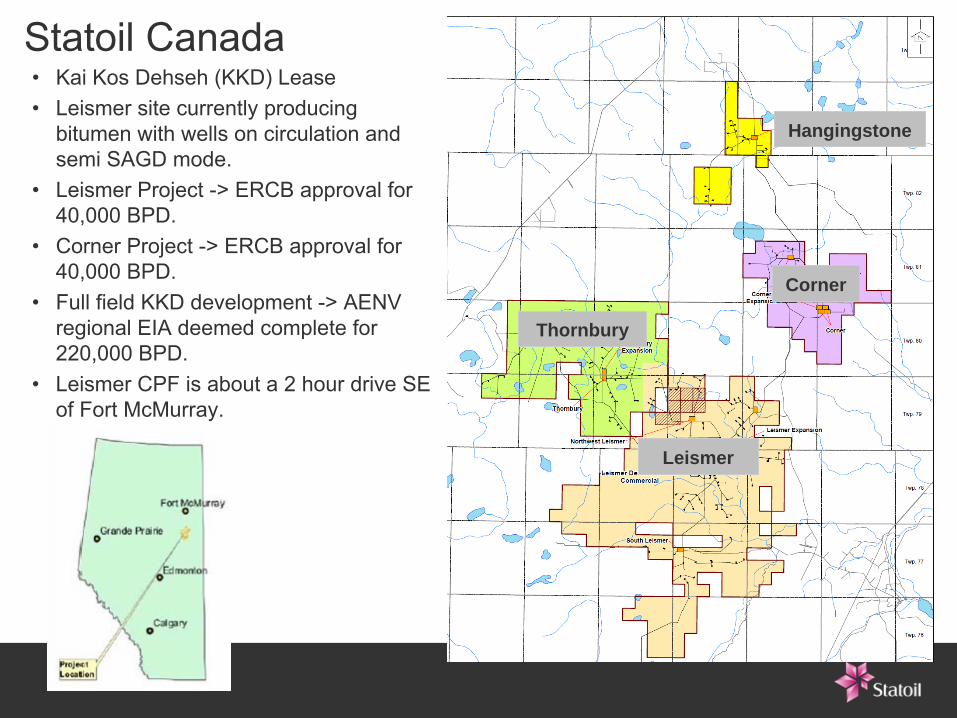
Statoil Canada•
Kai Kos Dehseh (KKD) Lease•
Leismer site currently producing bitumen with wells on circulation and semi SAGD mode.
•
Leismer Project -> ERCB approval for 40,000 BPD.
•
Corner Project -> ERCB approval for 40,000 BPD.
•
Full field KKD development -> AENV regional EIA deemed complete for 220,000 BPD.
•
Leismer CPF is about a 2 hour drive SE of Fort McMurray.
Corner
Leismer
Hangingstone
Thornbury
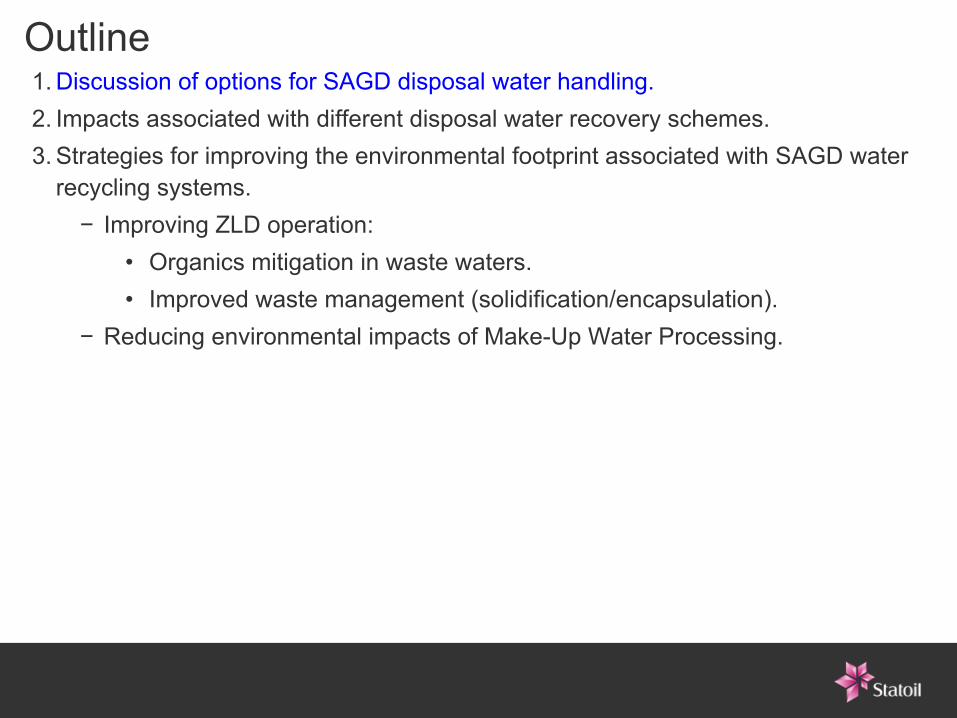
Outline1.
Discussion of options for SAGD disposal water handling.2.
Impacts associated with different disposal water recovery schemes.3.
Strategies for improving the environmental footprint associated with SAGD water recycling systems.−
Improving ZLD operation:•
Organics mitigation in waste waters.•
Improved waste management (solidification/encapsulation).−
Reducing environmental impacts of Make-Up Water Processing.
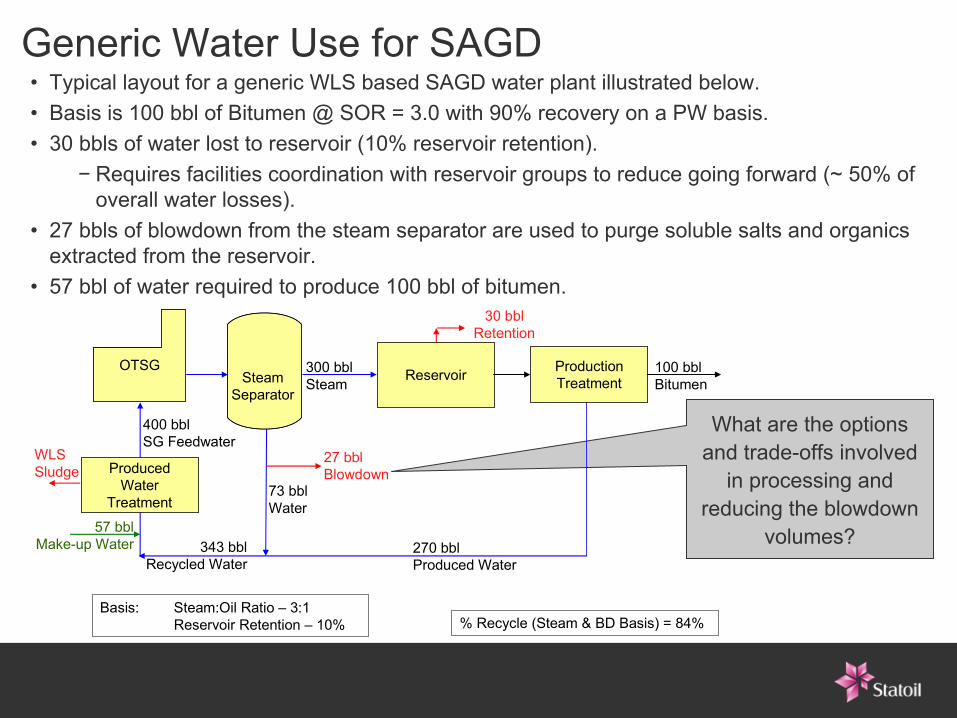
Generic Water Use for SAGD•
Typical layout for a generic WLS based SAGD water plant illustrated below. •
Basis is 100 bbl of Bitumen @ SOR = 3.0 with 90% recovery on a PW basis.•
30 bbls of water lost to reservoir (10% reservoir retention). −
Requires facilities coordination with reservoir groups to reduce
going forward (~ 50% of overall water losses).
•
27 bbls of blowdown from the steam separator are used to purge soluble salts and organics extracted from the reservoir.
•
57 bbl of water required to produce 100 bbl of bitumen.
What are the options and trade-offs involved
in processing and reducing the blowdown
volumes?57 bblMake-up Water
Basis: Steam:Oil Ratio – 3:1Reservoir Retention – 10%
OTSGOTSG 300 bblSteamSteam
SeparatorSteam
SeparatorReservoir Production
Treatment
ProducedWater
Treatment
270 bblProduced Water
343 bblRecycled Water
400 bblSG Feedwater
73 bblWater
100 bblBitumen
30 bbl Retention
27 bbl Blowdown
% Recycle (Steam & BD Basis) = 84%
WLSSludge
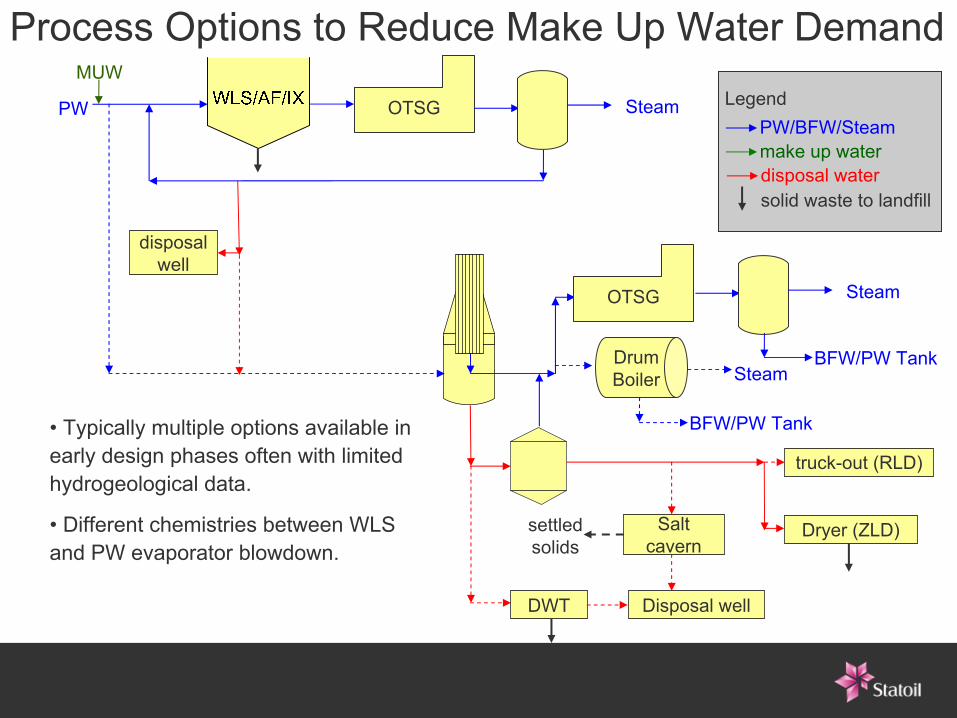
Process Options to Reduce Make Up Water Demand
PW
OTSG Steam
BFW/PW TankDrum Boiler Steam
BFW/PW Tank
Dryer (ZLD)
truck-out (RLD)
DWT Disposal well
Salt cavern
MUW
OTSG Steam
disposal
well
settled solids
solid waste to landfill
PW/BFW/Steammake up waterdisposal water
Legend
•
Typically multiple options available in early design phases often with limited hydrogeological data.
•
Different chemistries between WLS and PW evaporator blowdown.
SAGD Disposal Water and Waste HandlingDisposal Wells•
Typically Class 1b (ERCB Directive 51) for SAGD PW liquid wastes. •
Disposal Pipelines > 50 km likely to be cost prohibitive.•
Balance between costs of matching chemistry of disposal water with formation water to minimize plugging and lifecycle costs of drilling for new disposal wells.
Landfills•
Currently used for long term disposal of dewatered WLS sludge and ZLD solids. •
Land area to dispose of 1 m3
of waste is about 0.16 m2.•
325,000 m3 landfill cell can take ~ 1 year to construct at a cost of ~ 1 million CAD.−
~ 50 year life for a 20,000 BPD SAGD Plant using WLS.•
Class II landfills typically used for disposal of non-hazardous waste. −
Cost impact for disposal in third party class I landfill due to waste contamination is significant.
•
~ 0.5 m3
of leachate per m2
of uncapped landfill area per year.•
Risks: liner failure, trucking accidents and impacts, public perception, long-term liability.
SAGD Disposal Water and Waste HandlingDisposal Water Treatment (DWT) •
Typically neutralization with HCl or H2
SO4
followed by solid-liquid separation (centrifuge, filter press).
•
Have had reliability issues in SAGD application.•
Similar technologies could also be used to replace dryer operations in a ZLD operation to recover additional water as opposed to vapourizing water.
Drying•
Many types of industrial dryers (gas fired rotary, drum, spray, vacuum).•
Challenging application in SAGD due to unique nature of feed slurry.
Trucking •
High OPEX, low CAPEX. Typically short term solution for start-up or smaller facilities.
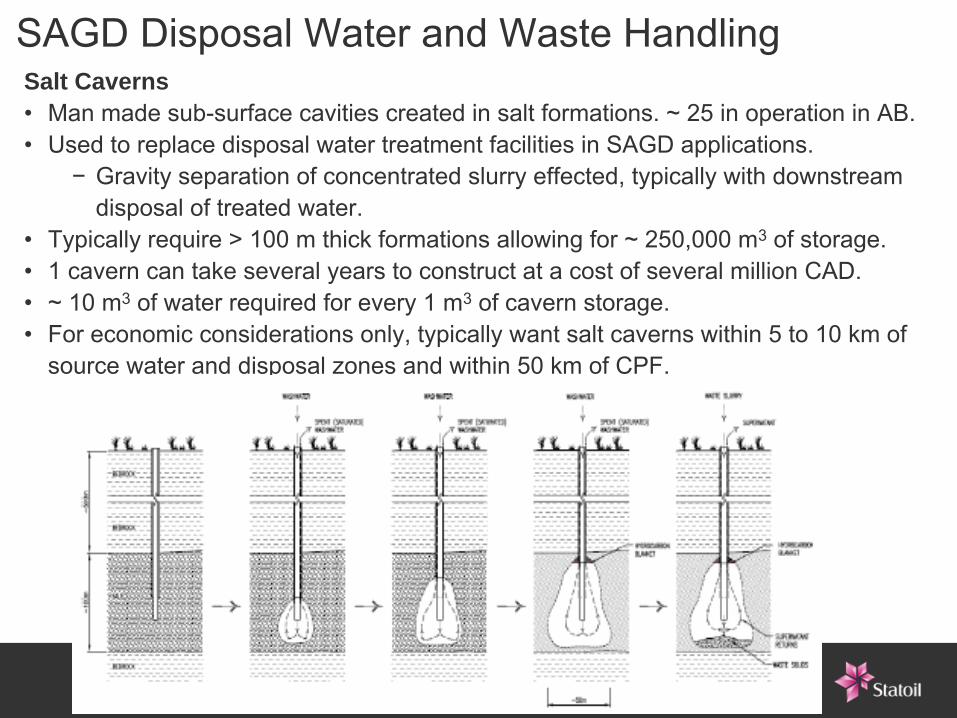
SAGD Disposal Water and Waste HandlingSalt Caverns•
Man made sub-surface cavities created in salt formations. ~ 25 in operation in AB. •
Used to replace disposal water treatment facilities in SAGD applications. −
Gravity separation of concentrated slurry effected, typically with downstream disposal of treated water.
•
Typically require > 100 m thick formations allowing for ~ 250,000 m3
of storage.•
1 cavern can take several years to construct at a cost of several million CAD.•
~ 10 m3
of water required for every 1 m3
of cavern storage. •
For economic considerations only, typically want salt caverns within 5 to 10 km of source water and disposal zones and within 50 km of CPF.
Outline1.
Discussion of options for SAGD disposal water handling.2.
Impacts associated with different disposal water recovery schemes.3.
Strategies for improving the environmental footprint associated with SAGD water recycling systems.
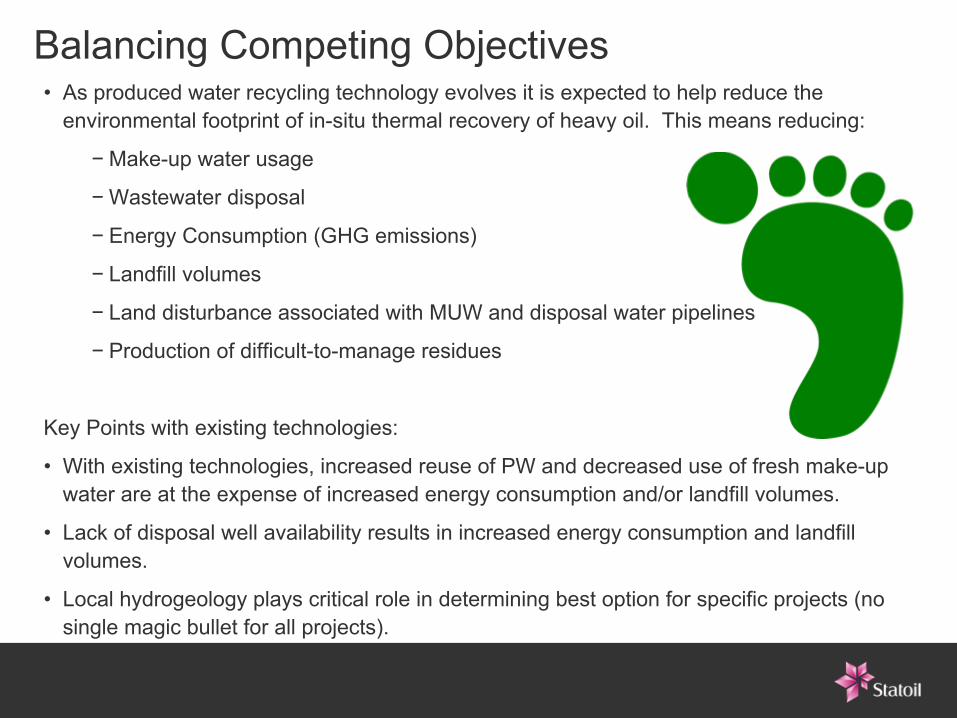
Balancing Competing Objectives•
As produced water recycling technology evolves it is expected to
help reduce the environmental footprint of in-situ thermal recovery of heavy oil. This means reducing:
−
Make-up water usage
−
Wastewater disposal
−
Energy Consumption (GHG emissions)
−
Landfill volumes
−
Land disturbance associated with MUW and disposal water pipelines
−
Production of difficult-to-manage residues
Key Points with existing technologies:
•
With existing technologies, increased reuse of PW and decreased use of fresh make-up water are at the expense of increased energy consumption and/or landfill volumes.
•
Lack of disposal well availability results in increased energy consumption and landfill volumes.
•
Local hydrogeology plays critical role in determining best option for specific projects (no single magic bullet for all projects).
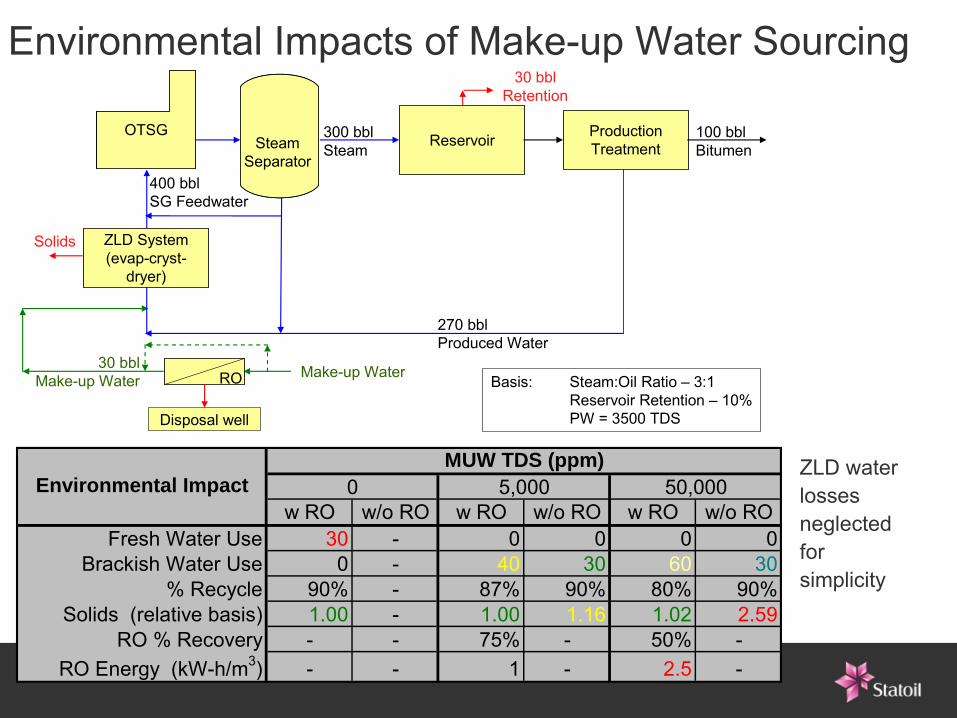
Environmental Impacts of Make-up Water Sourcing
30 bblMake-up Water Basis: Steam:Oil Ratio – 3:1
Reservoir Retention – 10%PW = 3500 TDS
OTSGOTSG 300 bblSteamSteam
SeparatorSteam
SeparatorReservoir Production
Treatment
ZLD System(evap-cryst-
dryer)
270 bblProduced Water
400 bblSG Feedwater
100 bblBitumen
30 bbl Retention
Solids
Make-up Water
Disposal well
RO
w RO w/o RO w RO w/o RO w RO w/o RO30 - 0 0 0 0
0 - 40 30 60 3090% - 87% 90% 80% 90%1.00 - 1.00 1.16 1.02 2.59- - 75% - 50% -- - 1 - 2.5 -RO Energy (kW-h/m3)
Brackish Water Use% Recycle
Solids (relative basis)RO % Recovery
Environmental Impact
Fresh Water Use
50,0005,0000MUW TDS (ppm) ZLD water
losses neglected for simplicity
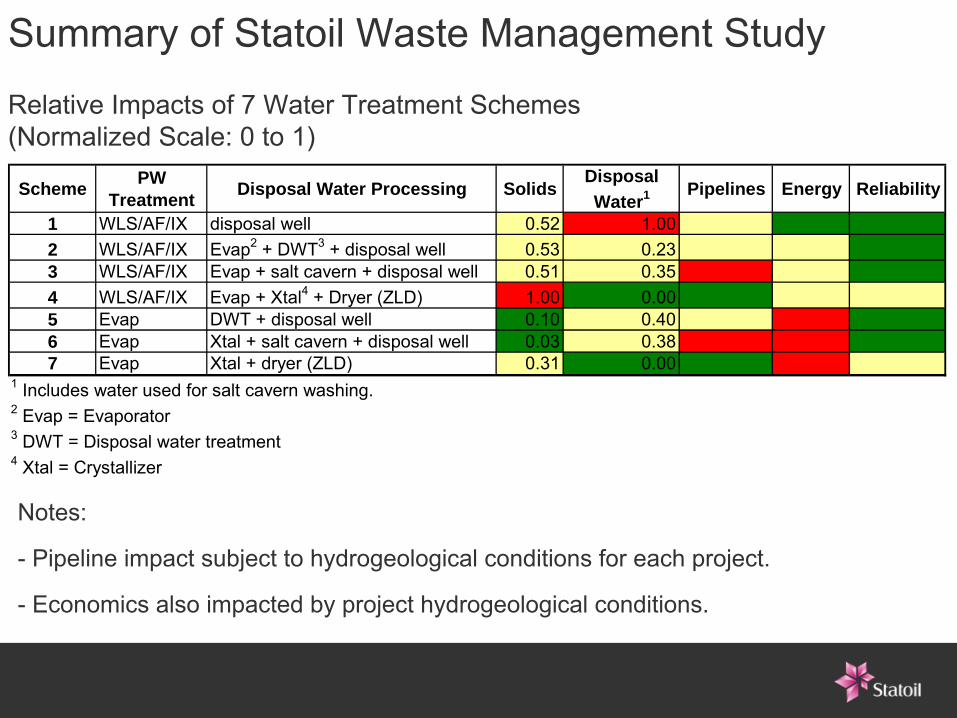
Summary of Statoil Waste Management Study
Notes:
- Pipeline impact subject to hydrogeological conditions for each project.
- Economics also impacted by project hydrogeological conditions.
Scheme PW Treatment Disposal Water Processing Solids
Disposal Water1 Pipelines Energy Reliability
1 WLS/AF/IX disposal well 0.52 1.002 WLS/AF/IX Evap2 + DWT3 + disposal well 0.53 0.233 WLS/AF/IX Evap + salt cavern + disposal well 0.51 0.354 WLS/AF/IX Evap + Xtal4 + Dryer (ZLD) 1.00 0.005 Evap DWT + disposal well 0.10 0.406 Evap Xtal + salt cavern + disposal well 0.03 0.387 Evap Xtal + dryer (ZLD) 0.31 0.00
1 Includes water used for salt cavern washing.2 Evap = Evaporator3 DWT = Disposal water treatment4 Xtal = Crystallizer
Relative Impacts of 7 Water Treatment Schemes
(Normalized Scale: 0 to 1)
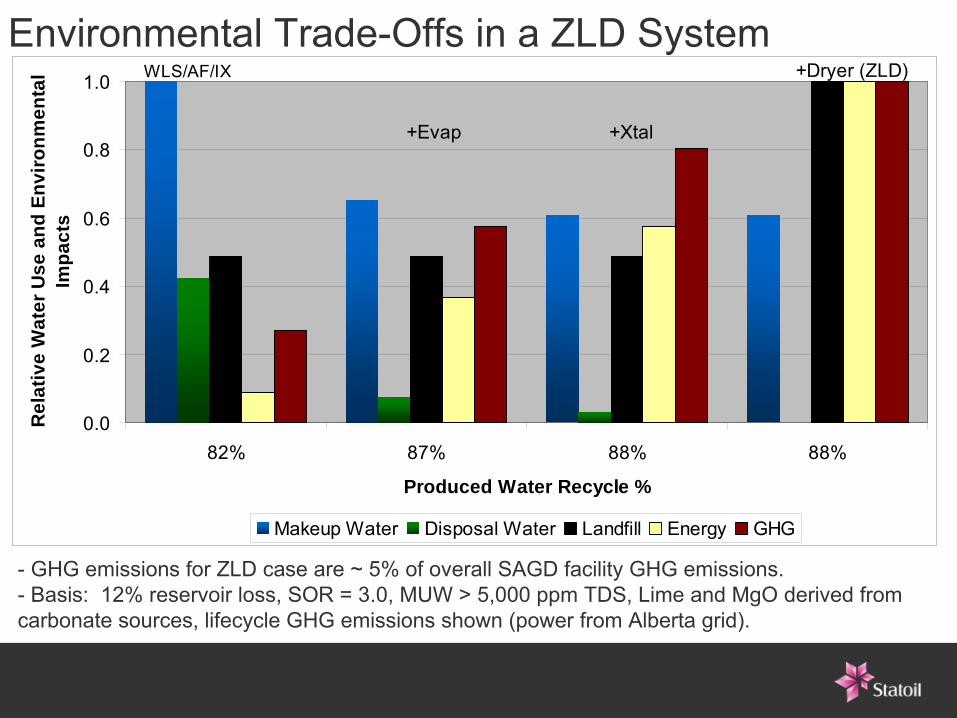
Environmental Trade-Offs in a ZLD System
-
GHG emissions for ZLD case are ~ 5% of overall SAGD facility GHG emissions.-
Basis: 12% reservoir loss, SOR = 3.0, MUW > 5,000 ppm TDS, Lime and MgO derived from carbonate sources, lifecycle GHG emissions shown (power from Alberta grid).
0.0
0.2
0.4
0.6
0.8
1.0
82% 87% 88% 88%
Produced Water Recycle %
Rel
ativ
e W
ater
Use
and
Env
ironm
enta
l Im
pact
s
Makeup Water Disposal Water Landfill Energy GHG
WLS/AF/IX
+Evap +Xtal
+Dryer (ZLD)
Outline1.
Discussion of options for SAGD disposal water handling.2.
Impacts associated with different disposal water recovery schemes.3. Strategies for improving the environmental footprint associated with SAGD
water recycling systems.−
Improving ZLD operation.•
Organics mitigation in waste waters•
Improved waste management (solidification/encapsulation)−
Reducing environmental impacts of Make-Up Water Processing.
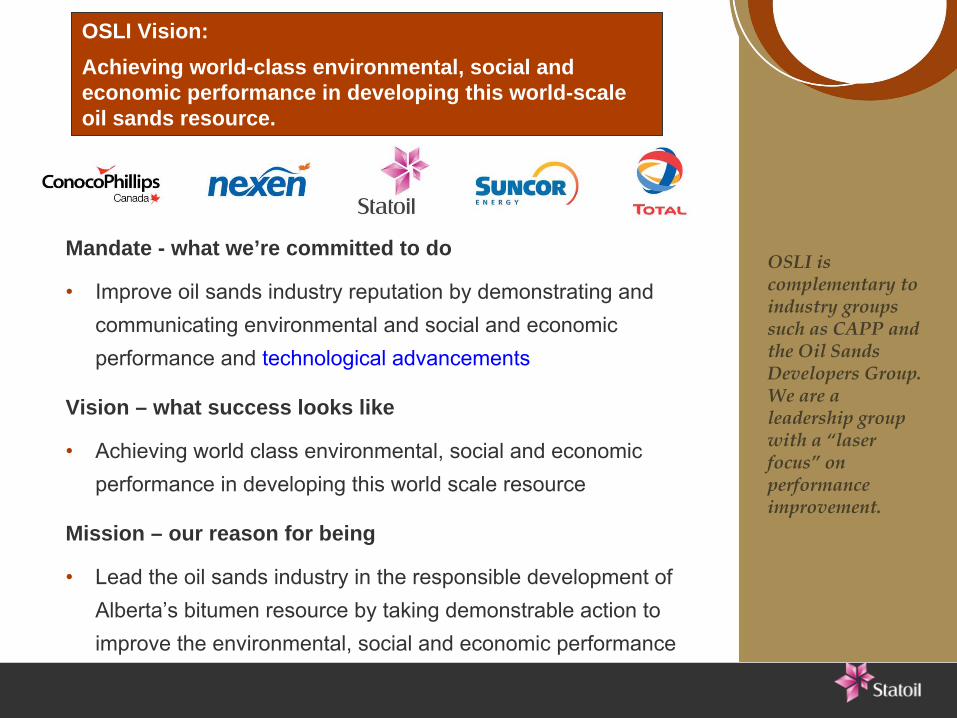
Mandate - what we’re committed to do
•
Improve oil sands industry reputation by demonstrating and communicating environmental and social and economic performance and technological advancements
Vision – what success looks like
•
Achieving world class environmental, social and economic performance in developing this world scale resource
Mission – our reason for being
•
Lead the oil sands industry in the responsible development of Alberta’s bitumen resource by taking demonstrable action to improve the environmental, social and economic performance
OSLI Vision:Achieving world-class environmental, social and economic performance in developing this world-scale oil sands resource.
OSLI is complementary to industry groups such as CAPP and the Oil Sands Developers Group. We are a leadership group with a “laser focus”
on performance improvement.
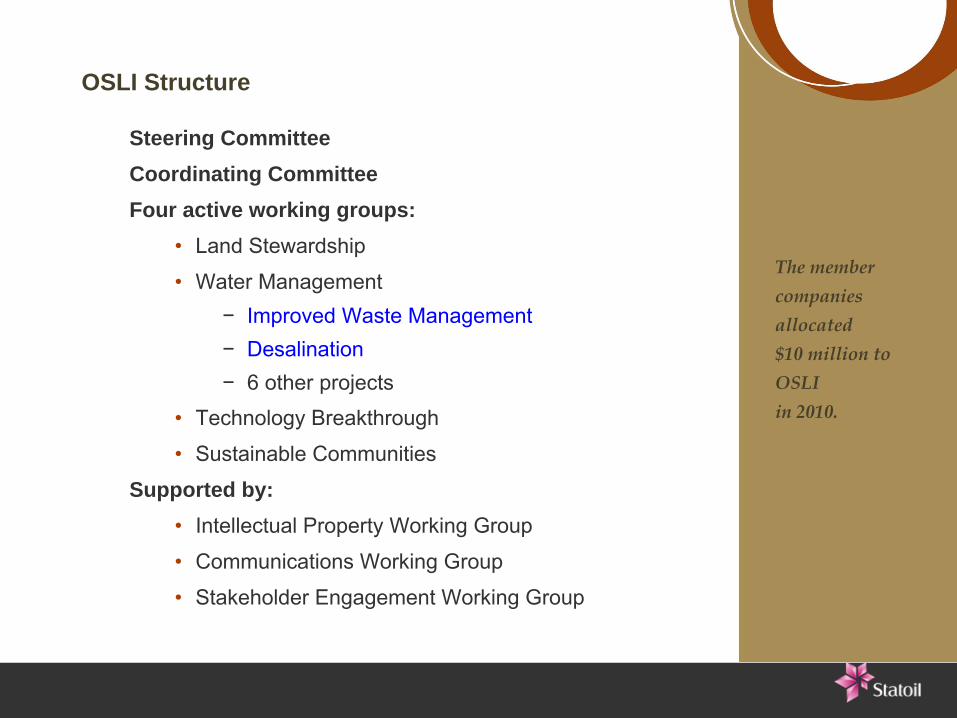
OSLI Structure
Steering CommitteeCoordinating CommitteeFour active working groups:
•
Land Stewardship
•
Water Management−
Improved Waste Management−
Desalination−
6 other projects•
Technology Breakthrough
•
Sustainable Communities
Supported by:•
Intellectual Property Working Group
•
Communications Working Group
•
Stakeholder Engagement Working Group
The member companies allocated$10 million to OSLIin 2010.
16
Improved Waste Management•
Trend is towards higher produced water recycle rates to conserve
water and comply with ERCB directives.
•
This implies waste stream changes (more concentrated brine and/or dry salt).
•
Lessons learned in industry with regards to first generation ZLD
technology:
−
high energy consumption/GHG production
−
mechanical issues with solids handling
−
Viscosity issues arising from high levels of dissolved organics
−
Perpetual care of a highly soluble residue in a landfill
•
Goal: To improve reliability of ZLD operations while also reducing waste liability
•
Approach: Seek and evaluate alternative methods of managing evaporator/ crystallizer wastes to mitigate adverse impacts of ZLD technology
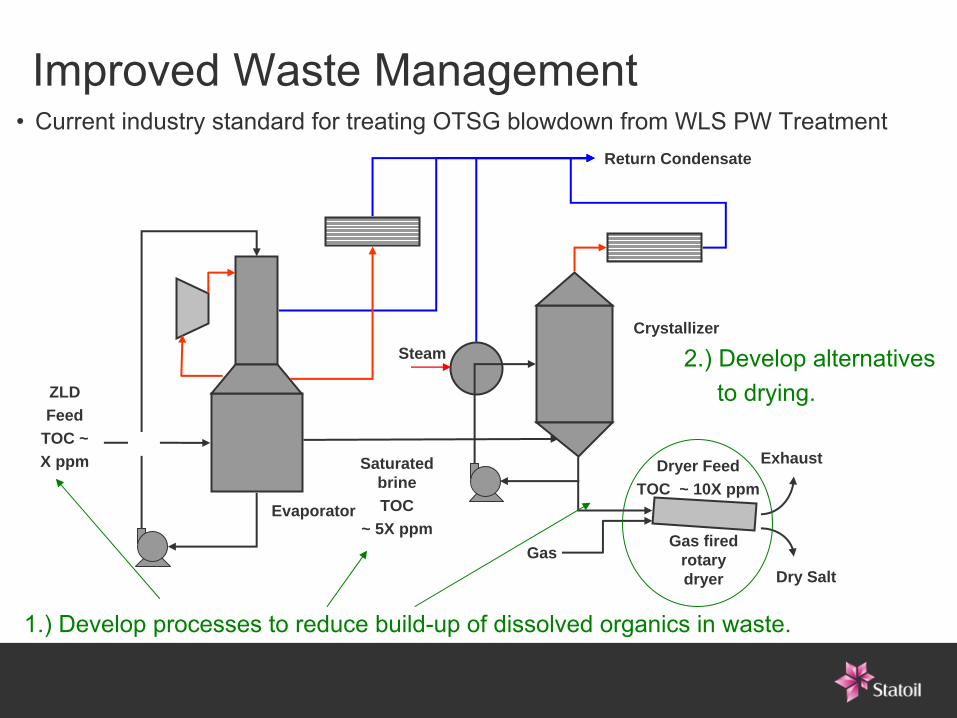
Improved Waste Management
Return Condensate
Dry Salt
Crystallizer
Saturated brineTOC
~ 5X ppmEvaporator
ZLD Feed
TOC ~ X ppm
Steam
Exhaust
Gas fired rotary dryer
Gas
•
Current industry standard for treating OTSG blowdown from WLS PW
Treatment
Dryer FeedTOC ~ 10X ppm
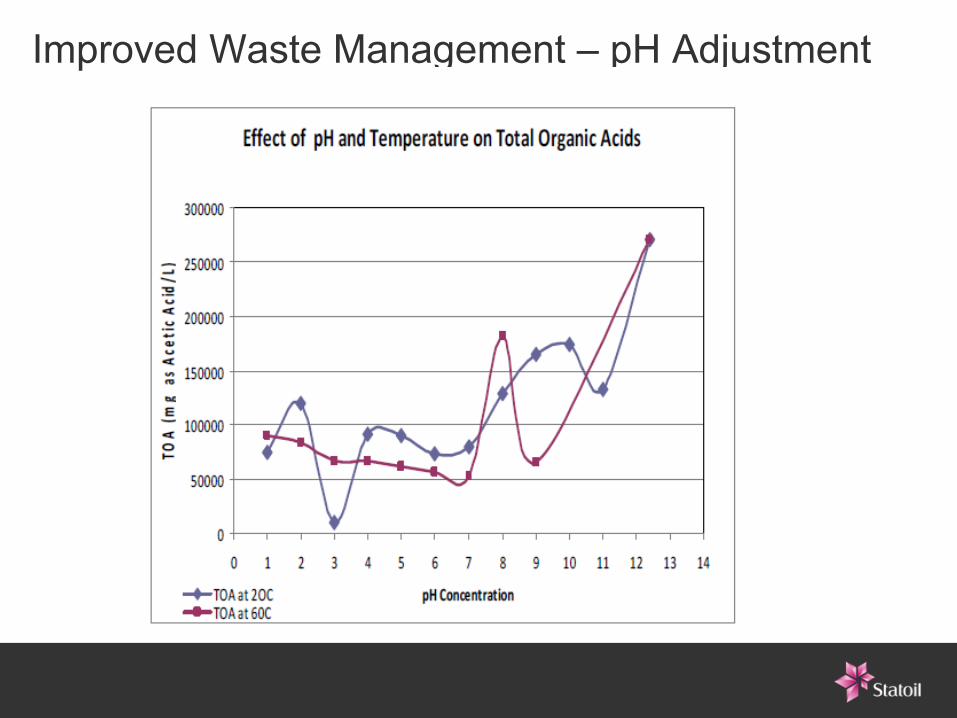
1.) Develop processes to reduce build-up of dissolved organics in waste.
2.) Develop alternatives to drying.
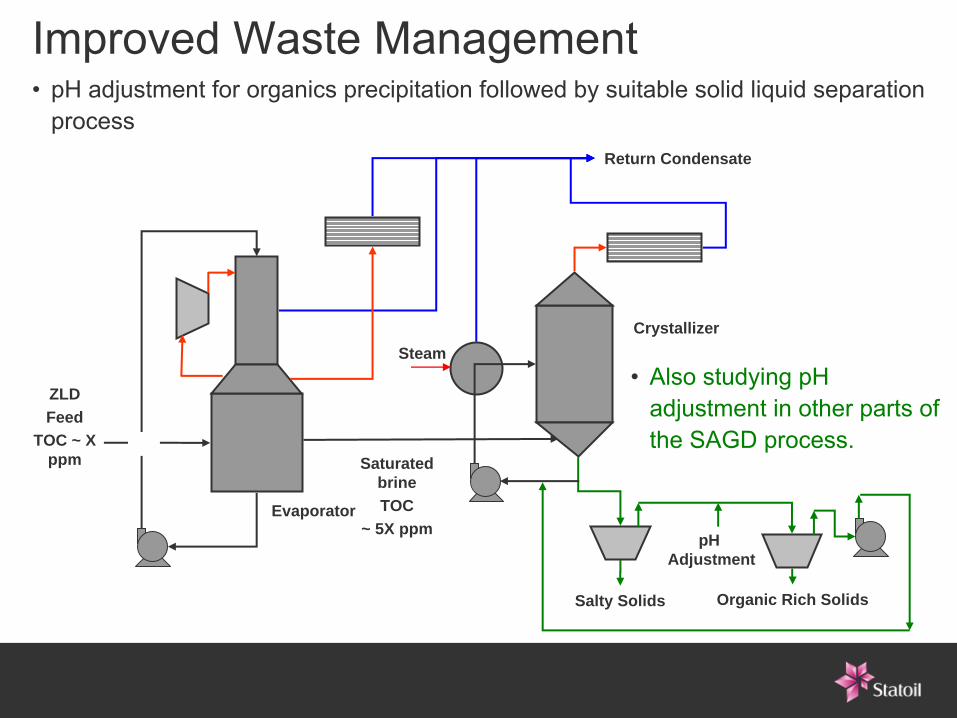
Improved Waste Management
Return Condensate
Crystallizer
Saturated brineTOC
~ 5X ppmEvaporator
ZLD Feed
TOC ~ X ppm
Steam•
Also studying pH adjustment in other parts of the SAGD process.
Salty Solids Organic Rich Solids
pH Adjustment
•
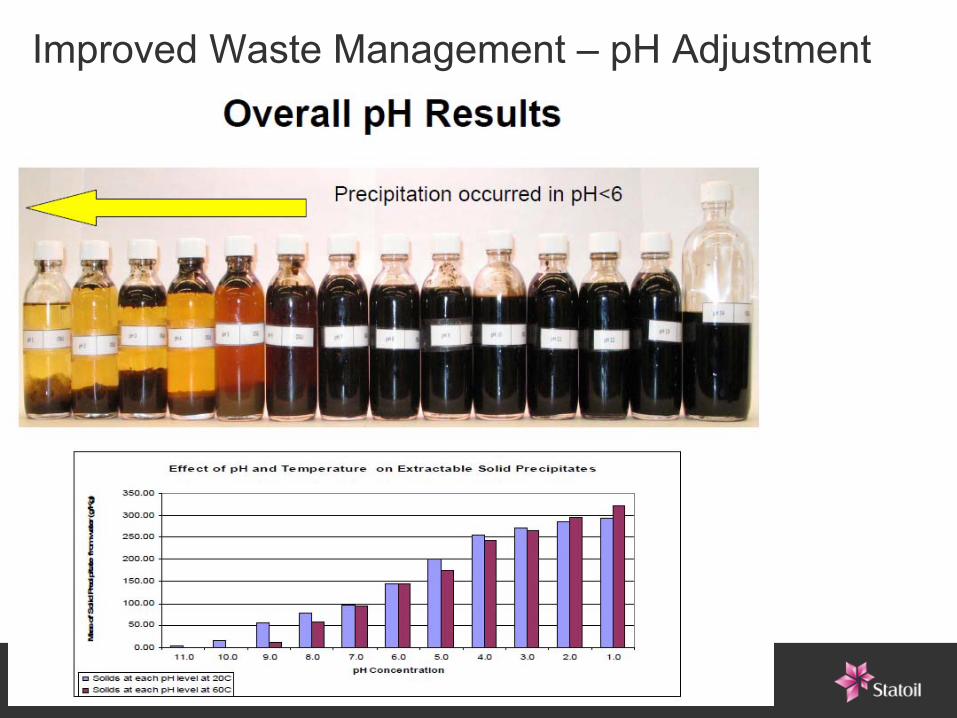
pH adjustment for organics precipitation followed by suitable solid liquid separation process
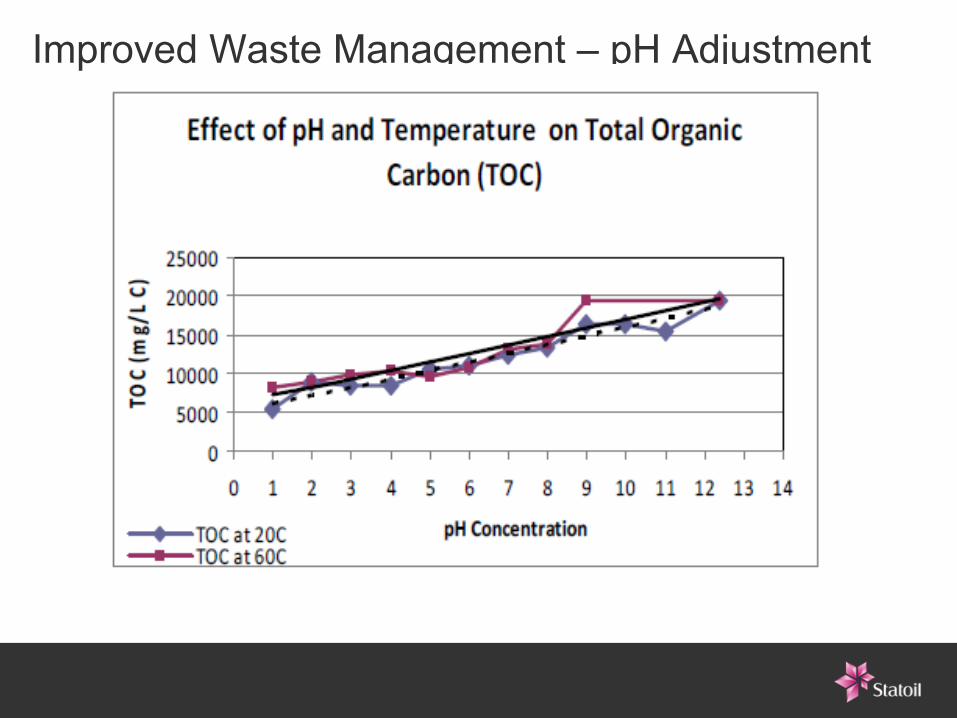
Improved Waste Management –
pH Adjustment
Improved Waste Management –
pH Adjustment
Improved Waste Management –
pH Adjustment

Improved Waste Management
Return Condensate
Crystallizer
Saturated brineTOC
~ 5X ppmEvaporator
ZLD Feed
TOC ~ X ppm
Steam•
Also studying solidification options in other parts of the SAGD process.
Solid Waste
•
Alternatives to Drying –
solidification/encapsulation of waste
Solidification agents
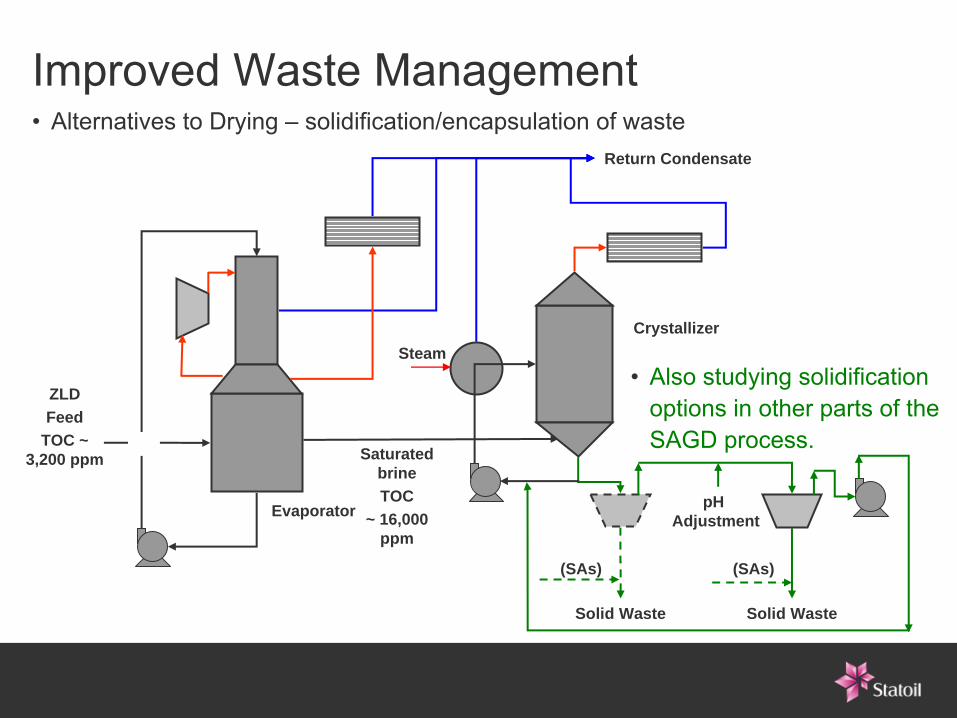
Improved Waste Management
Return Condensate
Crystallizer
Saturated brineTOC
~ 16,000 ppm
Evaporator
ZLD Feed
TOC ~ 3,200 ppm
Steam•
Also studying solidification options in other parts of the SAGD process.
Solid Waste Solid Waste
pH Adjustment
•
Alternatives to Drying –
solidification/encapsulation of waste
(SAs) (SAs)
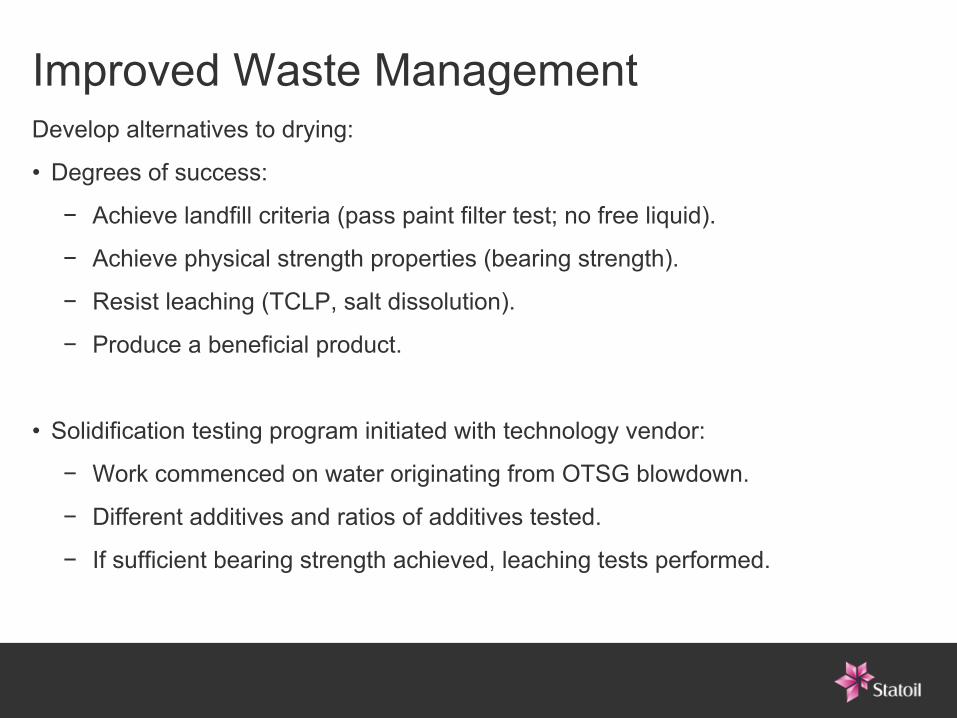
Improved Waste Management Develop alternatives to drying:
•
Degrees of success:
−
Achieve landfill criteria (pass paint filter test; no free liquid).
−
Achieve physical strength properties (bearing strength).
−
Resist leaching (TCLP, salt dissolution).
−
Produce a beneficial product.
•
Solidification testing program initiated with technology vendor:
−
Work commenced on water originating from OTSG blowdown.
−
Different additives and ratios of additives tested.
−
If sufficient bearing strength achieved, leaching tests performed.
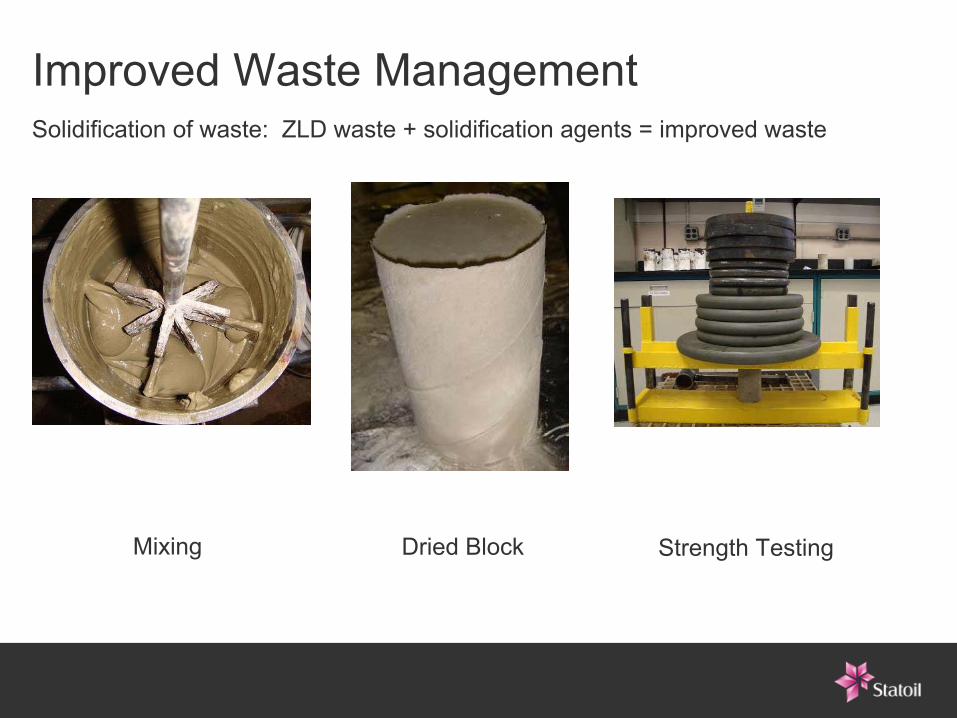
Improved Waste Management Solidification of waste: ZLD waste + solidification agents = improved waste
Mixing Strength TestingDried Block
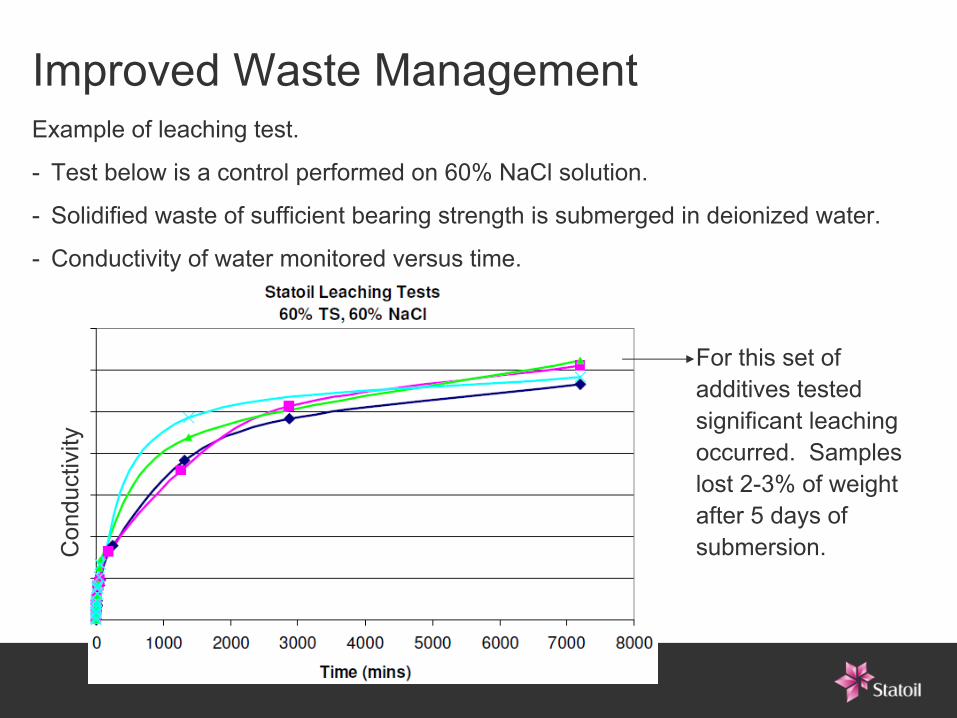
Improved Waste Management Example of leaching test.
-
Test below is a control performed on 60% NaCl solution.
-
Solidified waste of sufficient bearing strength is submerged in deionized water.
-
Conductivity of water monitored versus time.
Con
duct
ivity
For this set of additives tested significant leaching occurred. Samples lost 2-3% of weight after 5 days of submersion.
Improved Waste Management –
Next StepsDissolved organics removal:
•
Develop better understanding of high concentrations of simple organic acids in comparison to naphthenic acids in feed.
•
Test different technologies for effecting liquid solids separation.
•
Determine possible destinations for waste streams.
•
Test blowdown from PW evaporators.
Solidification/encapsulation:
•
Optimize solidification parameters and test new solidification agents.
•
Develop better understanding of the role of organics.
•
Further reduce long term leachability of final end product.
•
Process development. Refine processing schemes with and without
pH adjustment.
•
Determine overall economic and environmental benefits.
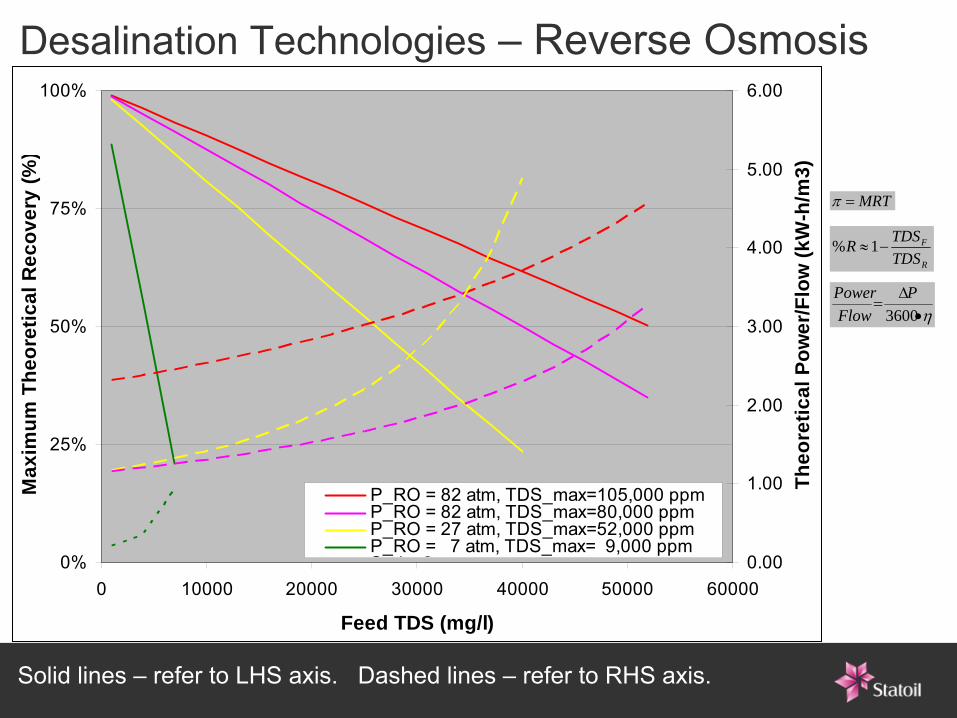
Desalination Technologies
–
Reverse Osmosis
MRT
3600
PFlowPower
R
F
TDSTDSR 1%
0%
25%
50%
75%
100%
0 10000 20000 30000 40000 50000 60000
Feed TDS (mg/l)
Max
imum
The
oret
ical
Rec
over
y (%
)
0.00
1.00
2.00
3.00
4.00
5.00
6.00
Theo
retic
al P
ower
/Flo
w (k
W-h
/m3)
P_RO = 82 atm, TDS_max=105,000 ppmP_RO = 82 atm, TDS_max=80,000 ppmP_RO = 27 atm, TDS_max=52,000 ppmP_RO = 7 atm, TDS_max= 9,000 ppmS i 2
Solid lines –
refer to LHS axis. Dashed lines –
refer to RHS axis.
New Desalination Technologies•
Use exclusively or in combination with RO to reduce environmental impacts of make-up water sourcing.−
Reduced energy consumption.•
Note: Make-up water sourcing for high salinity water at 25% recycle begins to approach HP BFW pump energy requirements.
•
Some new technologies claim up to 80% reduction in energy compared to RO.
•
Use of low grade waste heat from SAGD facility.−
Increased water recovery as opposed to standalone RO, or use in place of MVC to treat RO reject.
•
Potential for reduced capital costs.
•
OSLI Desalination Project−
Consultant has completed Emerging Desalination Technologies Report.−
2-3 new technologies currently being evaluated in greater detail.

QUESTIONS ?