saginaw bay watershed and area of concern - canr.msu.edu · provinces to restore the chemical,...
TRANSCRIPT

Saginaw Bay waterShed and area of ConCernMarch 2012

saginaw bay watershed and area of concern
plan
ning
& z
onin
g ce
nter
1
The Saginaw Bay Watershed consists of the entire land and water area that drains into Saginaw Bay. Encompassing over 8,700 square miles, it
is the largest and one of the most diverse watersheds in Michigan. Its rich resources support agriculture, manufac-turing, tourism, outdoor recreation, and a vast variety of wildlife. It contains America’s largest contiguous freshwa-ter coastal wetland system. This wetland complex extends along the shores of Saginaw Bay and provides habitat for large populations of waterfowl, birds, and over 90 fish species. The Saginaw Bay Watershed also contains more than 175 inland lakes and about 7,000 miles of rivers and streams, and drains approximately 15 percent of the state.
The Saginaw Bay Watershed is home to about 1.4 million people in 22 counties. Land use is diverse, ranging from relatively undisturbed natural areas to intensive agricul-tural and heavily industrialized urban settings. Most of the industrial activity is in, or adjacent to, the four major urban centers: Bay City, Flint, Midland, and Saginaw.
The region began to see steady development and changes in land use beginning around the mid-1860s. It is no coin-cidence that the region’s largest communities grew along waterways in the Saginaw Bay Watershed. Many of these communities formed where rivers converge. Before rail-roads and roadways, waterways were the major thorough-fares, frequently providing the fastest and most efficient mode of transportation by boat.
Midland grew along the Tittabawassee River near the area where the Chippewa and Pine Rivers meet. These rivers and their tributaries connect the northern and western areas of the watershed. On the southeastern side of the watershed, the city of Flint grew along the Flint River, which joins the Shiawassee River just upriver of Saginaw.
The city of Saginaw grew near the juncture of the Cass, Shiawassee, and Tittabawassee Rivers, where they form the Saginaw River and flow to the Saginaw Bay. Bay City grew along the Saginaw River in the area just before it joins Lake Huron and Saginaw Bay. The Saginaw River is one of the deepest rivers in Michigan. This allows a wide range of Great Lakes vessels to engage in regional and global commerce.
The growth of agriculture, cities, manufacturing, and industrialization around these waterways provided jobs, homes, and resources for society but also had a dras-tic and lasting impact on natural resources within the Watershed and the Saginaw Bay. Just as the waterways connected these communities, they also transported and
concentrated pollutants from throughout the Watershed in the Saginaw River and Bay.
History of ContaminationThe Saginaw Bay Watershed has experienced a variety of environmental impacts since the area began to be settled around 1820. Extensive lumbering occurred between 1850 and 1890; urbanization from 1860 to 1900; and rapid growth, including agriculture and industrialization, from 1900 to modern times. As early as the 1930s fish kills were reported almost annually on the Saginaw and Cass Rivers due to discharges from beet processing facilities. By 1965, levels of dissolved oxygen had fallen so low in the Saginaw River that it was uninhabitable for nearly all fish species. A Bay City Times report from the mid-1960s indicated that a single industrial spill along the Tittabawassee at Midland killed an estimated 14,000 fish. In the 1970s, contaminant testing methods had improved and showed that chemicals such as DDT and PCBs were accumulating in fish at high enough levels that they were not safe to eat.
While some environmental laws had already passed, significant legislation emerged beginning in the 1960s and 1970s which developed the institutional framework for environmental protection and restoration of natural resources. Over time new laws and programs have devel-oped to address complex and changing conditions in order to better protect and enhance the environment.
Institutional Framework for Resource Management, Protection, and RestorationIn the Great Lakes Basin the benefits of, and responsi-bilities for, Great Lakes resources are shared among eight American states and two Canadian provinces. Even with-out considering the Canadian involvement, the manage-ment and protection of the riparian shorelands, wetlands, bottom lands, fisheries, wildlife, and water resources of the Great Lakes and their tributaries depend upon a complex nested jurisdictional system involving numerous federal agencies, the eight states, and literally thousands of local governments.
The eight states exercise primary ownership and respon-sibility for the integrity of natural resources and therefore manage their respective portions of Great Lakes submerged bottom lands, as well as fisheries and wildlife. Federal agencies exercise direct or indirect control of matters that involve interstate commerce, navigation, hydropower generation, and compliance with federal statutes, particu-larly those related to treaty obligations. Local governments

exercise natural resource management and environmental protec-tion responsibilities delegated by the individual states and are responsible for many of the land use decisions that affect riparian lands on tributaries and shoreline areas of the Great Lakes. On the Canadian side of the Great Lakes, a similar sharing of respon-sibility for management and protection of Great Lakes resources exists between the two provinces, several Canadian federal agen-cies, and a large number of local governmental units.
The joint management of resources by two countries can add a layer of complexity in dealing with unique state and provin-cial laws, and differing federal laws. Historically, formal agree-ments between Canada and the United States on the shared Great Lakes natural resources related primarily to the use of the Great Lakes connecting waterways where navigation, lake level control, and hydropower generation were of critical importance to both nations. Informal agreements between states and prov-inces and even between local communities of the two countries were a common means of addressing mutual concerns related to the allocation and protection of locally important Great Lakes natural resources. However, beginning in the mid-1950s there was a growing recognition that more formal agreements and joint commitment of resources would be needed to address Great Lakes natural resource management issues on a binational basis.
The principal treaties, organizations, and programs involved in Great Lakes management and restoration efforts include:
� 1909: Boundary Waters Treaty—established the Inter-national Joint Commission (IJC) to mediate and resolve transboundary issues related to Great Lakes Resources.
� 1954: Convention on Great Lakes Fisheries—estab-lished the Great Lakes Fishery Commission to control invasive sea lampreys, coordinate fishery research, and facilitate cooperative fisheries management among the state, provincial, tribal, and federal management agen-cies, including development in 1981 of A Joint Strategic Plan for Management of Great Lakes Fisheries.
� 1972: Great Lakes Water Quality Agreement of 1972—administered through the International Joint Commis-sion in cooperation with U.S. and Canadian federal gov-ernments, eight Great Lakes states, and two Canadian provinces to restore the chemical, physical, and biologi-cal integrity of the Great Lakes.
� 1978: Revised Great Lakes Water Quality Agreement of 1978, as amended by Protocol in 1987—facilitated devel-opment of Remedial Action Plans (RAPs) and Lakewide Management Plans (LaMPs) to restore beneficial use im-pairments in Areas of Concern (AOCs).
� 1992: First biennial State of the Lakes Ecosystem Con-ference (SOLEC)—administered through the U.S.
1900s1909 Boundary Waters Treaty—Established the International Joint
Commission
1920s through 1960s1929 Michigan Water Resource Commission Act1948 Federal Water Pollution Control Act1955 National Air Pollution Control Act1963 Clean Air Act (amended in 1965, 1966, 1967, 1969, 1970, 1977, 1990)1965 Solid Waste Disposal Act1969 National Environmental Protection Act
1970s1970 Clean Air Act extended1970 Environmental Protection Agency established1970 Michigan Environmental Protection Act1970 Michigan Shoreland Protection and Management Act1970 Michigan Natural Rivers Act1971 PCB Source Control Program instituted by the state of Michigan1971 Michigan Phosphate Control Law1972 Michigan Inland Lakes and Streams Act1972 Michigan Soil Erosion and Sedimentation Act1972 Michigan Wilderness and Natural Areas Act1972 DDT use banned in the United States1972 Federal Water Pollution Control Act Amendments
(Clean Water Act)1972 Federal Insecticide, Fungicide, and Rodenticide Act1972 Great Lakes Water Quality Agreement between the US & Canada1972 Coastal Zone Management Act1973 Michigan’s Act 245—Promulgation of Water Quality
Standards Part 4 1973 Endangered Species Act1974 Safe Drinking Water Act1974 Michigan Farmland and Open Space Preservation Act1974 Michigan Endangered Species Act1976 Resource Conservation and Recovery Act (RCRA)1976 Toxic Substances Control Act1976 Michigan Sand Dune Protection and Management Act1976 Michigan Pesticide Control Act1976 Michigan Land Trust Fund Act1977 Michigan Ban on Phosphate Detergents1977 Clean Water Act Amended Federal Water Pollution Control
Act of 19721978 Great Lakes Water Quality Agreement revised 1978 Michigan Solid Waste Management Act1979 Michigan Wetlands Protection Act1979 PCB Manufacturing banned by EPA1979 Michigan Hazardous Waste Management Act
1980s1980 Fish and Wildlife Conservation Act1980 Comprehensive Environmental Response, Compensation, and
Liability Act (CERCLA)1981 A Joint Strategic Plan of Management of Great Lakes Fisheries1982 Michigan Environmental Response Act1983 Michigan Nongame Wildlife Fund Act1985 Phosphorus reduction strategy developed by Michigan for the
Saginaw Bay1985 Great Lakes Charter1985 Michigan Great Lakes Protection Act1986 Safe Drinking Water Act Amendments1986 Superfund Amendments and Reauthorization Act (SARA)1986 Clean Michigan Fund Act1987 Water Quality Act Amended FWPCA of 19721987 Great Lakes Water Quality Agreement between US & Canada
revised—Develops the Area of Concern Framework—Saginaw River and Bay identified as an Area of Concern
1987 Michigan Waste Reduction Act1987 Michigan Hazardous Waste Act Reduction Amendments1988 Michigan Environmental Protection Bond Authorization Act1988 Michigan Recreation Bond Authorization Act1988 Michigan Clean Water Assistance Act1989 Michigan Wildlife Conservation Act1989 Michigan Sand Dune Conservation Act
1990s1990 Clean Air Act Amendments1994 Michigan Natural Resources and Environmental Protection Act,
1994 PA 451 (MNREPA)1996 Safe Drinking Water Act amended 1998 Clean Michigan Initiative
2000s2001 Annex to the Great Lakes Compact2002 Great Lakes Legacy Act2005 Great Lakes–Saint Lawrence River Basin Water Resource
Agreement 2008 Great Lakes–Saint Lawrence River Basin Water Resource Compact
signed into federal law
2010s2010 Great Lakes Restoration Initiative 2012 Michigan Ban on Phosphorus-containing lawn fertilizer takes effect
Sele
cted
Sta
te a
nd F
eder
al E
nvir
onm
enta
l Law
s an
d P
rog
ram
s R
elat
ing
to
Env
iro
nmen
tal Q
ualit
y
saginaw bay watershed and area of concern
plan
ning
& z
onin
g ce
nter
3
Environmental Protection Agency and Envi-ronment Canada in cooperation with state and provincial governments to provide independent scientific reporting on the state of aquatic com-munities in the Great Lakes ecosystem.
� 2010: The Great Lakes Restoration Initiative (GLRI)—initiated by the U.S. federal government through an Action Plan that was developed col-laboratively with stakeholders throughout the Great Lakes Basin to achieve restoration goals. Be-tween 2010 and 2012 the GLRI authorized over $1 billion for restoration efforts in the Great Lakes.
The 1987 amendments to the Great Lakes Water Quality Agreement identified regions of significant environmental degradation throughout the Great Lakes, known as Areas of Concern, or AOCs. The AOC program is non-regulatory and creates a framework to assess and improve the envi-ronmental quality of these designated areas by identifying beneficial uses of Great Lakes resources. Specific impair-ments were identified as beneficial use impairments, or BUIs. When the AOC program was first developed, 43 AOCs were identified throughout the United States and Canada. As of 2011, one Canadian and one American AOC reached established restoration targets and were subsequently delisted.
The Saginaw River and Bay is one of the remaining AOCs and one of 14 in Michigan. When first identified, the Saginaw River and Bay AOC was described as having 12 of 14 possible BUIs. Since the region was originally designated as an AOC in 1987, environmental conditions have improved through planning, targeted restorative actions, and stakeholder involvement such that two of the beneficial use impairments have been removed. There are currently ten BUIs remaining for this Area of Concern. The AOC program is one of many policy and programmatic mechanisms used to address environmental concerns. The program has clearly defined goals and priori-ties and does not attempt to address every environmental issue.
Beneficial Use Impairments in the Saginaw River and Bay Area of Concern The 12 beneficial use impairments that were originally identified in the Saginaw River and Bay AOC were the result of a few main sources of pollution and environmen-tal degradation; these included elevated bacteria levels, excessive nutrients, habitat loss, and toxic chemicals.
Excessive pollution and environmental degradation result in the impairment of Great Lakes resources and the ways that society and individuals use these resources to their benefit. The BUI designations help answer questions such as: Why is elevated bacteria a problem? How do toxic chemicals manifest themselves in the environment? What does excessive nutrient loading do to our waterways and ecosystem? What happens when wildlife lose places to live and reproduce?
These important questions help us understand the effects of excessive pollution and environmental degradation on beneficial uses of Great Lakes resources.
Table 1 shows each of the beneficial use impair-ments identified for the Saginaw River and Bay Area of Concern and major contributing factors that led to their impaired designation.
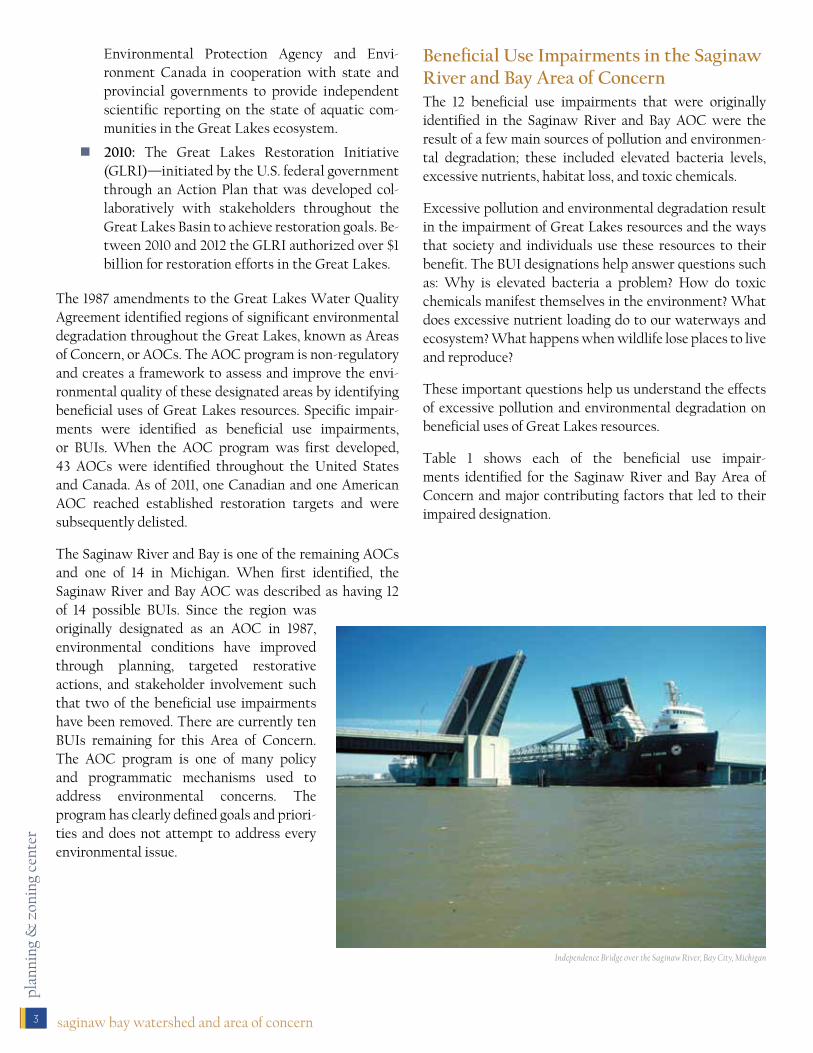
Independence Bridge over the Saginaw River, Bay City, Michigan

saginaw bay watershed and area of concern
land
pol
icy
inst
itut
e
43
Beneficial Use Impairment (BUI)
Problems Leading to BUI Designation
BacteriaExcessive Nutrients Habitat Loss
Hazardous Chemicals
Restrictions on fish or wildlife consumption XTainting of fish or wildlife flavor (BUI removed) XDegradation of fish and wildlife populations X XLoss of fish and wildlife habitat X XBird or animal deformities or reproductive problems XDegradation of benthos X XRestrictions on dredging activities XEutrophication XRestriction on drinking water—taste odor problems (BUI removed)
X
Beach closings XDegradation of aesthetics XDegradation to phytoplankton and zooplankton X
� BUI removed since first listed.
Source: Public Sector Consultants.
While many of the beneficial uses of Saginaw Bay Watershed resources became impaired because of a few causes that can be generalized into these categories, a number of other factors influence the quality of the environment and affect the ways that resources can be used. Many reports have been issued by federal and state agencies, local govern-ments, and non-governmental organizations that provide region-specific details about natural resource concerns in the Saginaw Bay Watershed and AOC. One key report is the 1988 Remedial Action Plan (RAP) for the Saginaw River and Saginaw Bay Area of Concern.1 The report was jointly prepared by a number of groups including the Michigan Department of Natural Resources, the East Central Michigan Planning & Development Regional Commission, the National Wildlife Federation, the Saginaw Basin Natural Resource Committee, and a technical work group. This first RAP goes into specific detail about the causes of the use impairments and is updated periodically by the Michigan Department of Environmental Quality.
In 2000, stakeholders from across the Watershed came together to develop specific and measurable restoration targets for each of the beneficial use impairments in the foundational Measures of Success: Addressing Environmental Impairments in the Saginaw River and Saginaw Bay report that was prepared by Public Sector Consultants. Measures of Success was a key planning tool to advance restoration
1 Michigan Department of Natural Resources, Remedial Action Plan for Saginaw River and Saginaw Bay Area of Concern, September 1988, Lansing, Mich.
and delisting of the BUIs. In 2006 and 2008, the Michigan Department of Environmental Quality developed and released the statewide Guidance for Delisting Michigan’s Great Lakes Areas of Concern. The revised restoration targets in this document were accepted by the Partnership for the Saginaw Bay Watershed, which is the local Public Advisory Council that oversees efforts to reach restoration targets and remove the region’s Area of Concern designation. In addition to these reports, the Partnership for the Saginaw Bay Watershed, in coordination with Public Sector Consultants, the Michigan Department of Environmental Quality, the U.S. Environmental Protection Agency, and local groups, has developed tracking reports and identi-fied specific action steps for addressing the remaining beneficial use impairments. This information informed the development of the 2012 Saginaw River and Bay Stage 2 RAP, which serves as a primary tool for documenting and communicating progress to the public and agencies. This document also provides updates on recent restoration actions and assessments specifically related to the benefi-cial use impairments listed for this AOC.
Hazardous ChemicalsAs the nation industrialized, communities within the Saginaw Bay Watershed experienced a boom in manufac-turing facilities including automobile factories, chemical plants, forges, and others that provided jobs and goods to society. Although it was not necessarily known at the
Table 1: Beneficial Use Impairments and Their Major Contributing Factors

saginaw bay watershed and area of concern
plan
ning
& z
onin
g ce
nter
5
time, many of these facilities used prac-tices and substances now recognized to be of concern to human health and envi-ronmental quality.
Before current laws were passed, manu-facturing facilities discharged untreat-ed waste directly into rivers. Others sent their untreated waste through the sewer system to treatment plants. Some of these discharges contained hazard-ous chemicals such as those in the DDT chemical family, PCBs, and heavy metals such as cadmium, chromium, mercury, and copper.
Hazardous chemicals and heavy metals such as these can persist in the envi-ronment long after the source has been removed and can manifest them-selves through bioaccumulation, which magnifies their concentration as the compounds move up the food chain.
These conditions led to the degradation of fish and wildlife populations, restrictions on fish and wildlife consumption, tainting of fish and wildlife flavor, bird or animal defor-mities or reproductive problems, degradation of benthos, restrictions on dredging, and degradation of fish and wild-life habitat, all of which are beneficial use impairments identified in the Saginaw River and Bay AOC.
Many of the hazardous chemicals used in the early to mid-twentieth century and discovered to cause significant damage to the environment have been banned from use and manufacturing. Others have been controlled through state and federal laws passed since the 1970s that regulate their storage, handling, transport, and disposal.
Habitat LossAs communities in the Saginaw Bay Watershed grew and the landscape was altered, a substantial amount of natu-ral habitat was lost. Wetlands were drained for mosquito control and to create more agricultural land. Key spawn-ing areas for fish were blocked by dams and low-head barriers. Runoff from agricultural operations and urban areas increased sediment levels in waterways. All of these changes decreased available habitat for wildlife and were a factor in wildlife population declines.
Dams and River BarriersThroughout the Saginaw Bay Watershed, an estimated 315 dams and other man-made barriers that impede fish passage to spawning areas were identified as one of the major factors
contributing to the decline of various fish species such as salmon, steelhead, walleye, and lake sturgeon. Despite the negative impact that dams have had on the environment, many still play an important role in power generation, flood control, and water-based recreation. Fish passage structures such as rock ramps have become recognized as an option to allow Great Lakes fish species increased access to critical spawning areas, either by removing dams or allowing fish to bypass dams.
The Chesaning Dam, located along the Shiawassee River, was originally built in the 1860s to generate electricity for a local mill. The dam outlived its original purpose and, with time, was no longer used as a source of electricity. The dam deteriorated, reaching a point where the potential for a failure become so great that the community responded by removing the dam and putting in place a rock ramp that has helped reconnect 37 miles of river habitat. Similarly, the Frankenmuth Dam, located along the Cass River, was built in the 1850s for a local mill. This barrier has prevent-ed fish passage to approximately 73 miles of river habitat. Through local efforts and support from state and federal partners, a restoration project is expected to be imple-mented that will install a rock ramp to restore connectiv-ity to areas upriver of the Frankenmuth Dam. While dams and other river barriers were identified as contributing to the loss of fish and wildlife habitat and degradation of fish and wildlife populations BUIs, current AOC restoration targets are based on other factors, including the amount of preserved coastal wetlands.
Nesting gull, Saginaw Bay.
Gulls nesting on dredge confined disposal facility Saginaw Bay.

saginaw bay watershed and area of concern
land
pol
icy
inst
itut
e
6
Wetlands Prior to European settlement of the Watershed, the Saginaw Bay contained one of the most extensive wetland complexes in the Great Lakes. The Saginaw Bay Watershed was estimated to be covered with roughly 700,000 acres of wetlands, with nearly 37,000 acres of emergent vegetation around Saginaw Bay.
The 1988 RAP and subsequent planning efforts to advance restoration goals identified wetland preserva-tion and restoration as a goal for the region because of the importance of wetlands for fish and wildlife habi-tat and nonpoint pollution control. In 2001, Ducks Unlimited conducted analysis with local stake-holders (published in the 2008 Habitat Restoration Plan report by Public Sector Consultants) which esti-mated that 20–30 percent of Saginaw Bay coastal wetlands were preserved. Since that time addition-al wetlands have been acquired and protected through conservation easements by the state and local groups active in the Watershed. A 2010 update of the Habitat Restoration Plan assessment suggests that the amount of preserved wetlands in the region has increased to more than 55 percent of Saginaw Bay coastal wetlands.
In addition to efforts to preserve existing wetlands, a number of groups throughout the region have restored lands that had been altered from wetlands to another use such as agriculture. A comparison of land cover data available through the National Oceanic and Atmospheric Administration (NOAA) from 1996 to 2006 showed an increase of almost 7,500 acres of total wetlands in the Watershed.2
Excessive Nutrients and BacteriaExcessive nutrients and bacteria frequently enter the ecosystem from the same sources and are commonly addressed together. Excessive nutrient loading affects many aspects of the environment. Most aquatic ecosystems,
2 Land Policy Institute at MSU using data from National Oceanic and Atmospheric Administration Coastal Services Center. Land Cover Analysis webpage. Data source available online at: http://www.csc.noaa.gov/crs/lca/greatlakes.htm.
including the Saginaw Bay and its tributaries, are phos-phorus-limited, meaning that the amount of phosphorus determines the basic productivity of the Bay. Higher levels of phosphorus lead to dense growth of algae and other plant material, which eventually dies. The decomposition of organic debris has a high dissolved oxygen demand, which decreases dissolved oxygen levels available to fish and benthic organisms (those living at the bottom of rivers
and lakes). When dissolved oxygen levels fall too low, benthic organisms and other aquatic populations can be reduced. This process is called eutrophication.
The increased nutrient inputs also enhance the growth of blue-green algae that has been known to have foul odors and result in water with an unpleas-ant taste. Increased growth can lead to more algal mats that wash up on Saginaw Bay beaches; these are aesthetically unpleasant and can harbor bacteria.
In the Saginaw River and Bay Area of Concern, excessive nutrient loading was a contributing factor in the identifi-cation of many BUIs including the degradation of benthos, eutrophication, restrictions on drinking water-taste and odor problems, degradation to aesthetics, and degradation to phytoplankton and zooplankton BUIs.
Elevated bacteria levels can occur as a result of untreated discharges of human and animal waste into waterways, which poses a risk to human health and can result in beach closings along the Saginaw Bay and its tributaries.
The means by which excessive nutrients and bacteria enter the Watershed can be categorized by “point sourc-es” and “nonpoint sources.” Point sources originate from single locations that are relatively easy to identify, such as a wastewater treatment facility. Nonpoint sources origi-nate from less easily identified sources, such as agricul-tural fields, golf courses, or subdivisions, that can contrib-ute nutrients, sediment, and contaminants through storm water runoff after a heavy rain or snow melt.
Upper photo: Silver water lapping at beach, Tawas Point State Park.Lower photo: Purple loosestrife, Saginaw Bay.

saginaw bay watershed and area of concern
plan
ning
& z
onin
g ce
nter
7
Point Sources of Nutrients and Bacteria in the Saginaw Bay WatershedThe discharge of untreated wastewater (sewage) into waterways throughout the Watershed represented one of the most significant environmental threats to the Saginaw Bay Watershed and Area of Concern. As development occurred, many communities began to discharge their waste to the rivers. Untreated sewage is a known source of excessive nutrients including phosphorus and can harbor harmful pathogens such as E. coli that can represent a threat to human health.
Measures of Success noted that as early as 1887, there were 14 miles of main sewer lines and 10 miles of connecting lateral sewer lines in Bay City. Efforts to treat raw sewage being transported to the river from nearby urban areas were under way by the 1940s, although it was not until 1954 that the last large city on the river, Bay City, constructed a waste-water treatment plant. It is reported that as late as 1965, several smaller communities were still dumping untreated human waste into the river.
Since that time significant investments have been made to upgrade sewer systems to prevent untreated sewage and other pollutants from entering the rivers that flow into Saginaw Bay. The 1972 Federal Water Pollution Control Act established a construction grants program to assist in upgrading wastewater treatment systems. Between 1972 and 1988, this program helped fund wastewater treatment system upgrades throughout the Saginaw Bay Watershed. Total projects implemented in the Watershed during this period amounted to more than $500 million.3
Another program that helps communities address these concerns is Michigan’s Water Pollution Control Revolving Fund (commonly called the state revolving fund, or SRF), which provides low-interest loans to upgrade and expand infrastructure like wastewater treatment plants, retention basins, and sewer systems that are needed to minimize discharges of sewage into waterways. Since the program
3 Michigan Department of Natural Resources, Remedial Action Plan for Saginaw River and Saginaw Bay Area of Concern, September 1988, Lan-sing, Mich.
was implemented, more than 40 loans totaling over $330 million have been invested in communities within the Saginaw Bay Watershed (see Figure 1).4 The majority of these investments have been directed to the counties with the largest cities and the highest populations. These investments are reducing waste flowing into these water-ways and hence the Saginaw Bay.
These two programs represent more than $830 million of investments in the Watershed since 1972 and are thought to be responsible for significant declines in phosphorus loading and bacteria levels in waterways.
According to the Saginaw Bay Coastal Initiative Phosphorus Committee Report, a study conducted for the 1991 Michigan Phosphorus Reduction Strategy Update estimated that point sourc-es such as municipal waste-water treatment systems accounted for approxi-mately 50 percent of the phosphorus load in the Saginaw Bay and also found that investments to improve wastewater treatment facil-
ities had decreased phosphorus contributions from munic-ipalities by 80 to 90 percent.5
Nonpoint Sources of Nutrients and Bacteria in the Saginaw Bay WatershedNonpoint sources frequently represent the accumulation of many small contributors that together can have a signifi-cant impact on the quality of the environment, particularly in sensitive areas like waterfront property.
A number of nonpoint sources including agricultural runoff and failing septic systems have been known to contribute bacteria and nutrients to the Saginaw River and Bay. Agricultural operations can add nutrients to the environment in a number of ways. Confined animal feed-ing operations (CAFOs) generate large amounts of animal waste. If not properly managed, disposal of this waste represents a concern due to its high phosphorus levels
4 PSC conducted a review of loans issued through the SRF to deter-mine investments in the Saginaw Bay Watershed using information available on the Internet at: http://www.michigan.gov/documents/deq/deq-ess-mfs-SRF-SRFfunded_249279_7.pdf.5 Saginaw Bay Coastal Initiative, Phosphorus Committee Report, June 2009. Available online at: http://www.michigan.gov/documents/deq/sagbayphosrep_283289_7.pdf.
Lake Huron beach, Port Austin

saginaw bay watershed and area of concern
land
pol
icy
inst
itut
e
8
and bacteria. Commercial fertilizers can also be a threat to environmental quality if they are over-applied, applied too close to a watercourse, or applied just before a heavy rain. Septic systems can also have a negative impact on environ-mental quality. Collectively, large numbers of failing septic systems can contribute a relatively large quantity of bacte-ria and phosphorus to the waterways.
Together, point and nonpoint sources contribute a substantial amount of phosphorus into Saginaw Bay. During the 1970s and 1980s it is estimated that the Saginaw River contributed almost two tons of phosphorus into the Bay every day.6 The International Joint Commission, in coordination with the State of Michigan, set a target load of 440 tons of phosphorus per year, which is comparable to approximately 15 micrograms of total phosphorus per liter. Through environmental programs, investment in infra-structure, educational efforts, and improved land manage-ment practices, phosphorus levels in the Bay have declined substantially since the 1960s (see Figure 2).
6 Saginaw Bay Coastal Initiative, Phosphorus Committee Report, June 2009. Available online at: http://www.michigan.gov/documents/deq/sagbayphosrep_283289_7.pdf.
Great Lakes Restoration Initiative The Great Lakes Restoration Initiative (GLRI), a federal initiative established in 2010, is one of the most significant investments in environmental restoration of the Great Lakes. The initiative grew out of collaborative efforts among the Great Lakes states and federal agencies. In 2004, President George W. Bush created the Great Lakes Interagency Task Force to promote regional collaboration of restoration and protection efforts. In 2005, the Great Lakes Regional Collaboration Strategy was established and set forth recommendations to restore the health of the Great Lakes.
In 2009, President Barack Obama included $475 million in the FY 2010 budget for the Great Lakes Restoration Initiative to address the most pressing environmen-tal concerns in the Great Lakes. In February 2010, the GLRI Action Plan was released. This plan laid out the specific steps to advance restoration goals in the Great Lakes between FY 2010 and FY 2014 and identified five focus areas.
Figure 1: State Revolving Loans to Saginaw Bay Watershed Communities from 1991 to 2011
$0
$30,000,000
$60,000,000
$90,000,000
$120,000,000
$150,000,000
SaginawCounty
Other Saginaw Bay
Watershed Counties
Midland County
GeneseeCounty
BayCounty
$126
,145,
00
0
$45,
380,
00
0
$15,130,000$51,6
75,0
00
$92,
545,
00
0
Source: PSC using data from the MDEQ State Revolving Fund, 2012.

saginaw bay watershed and area of concern
plan
ning
& z
onin
g ce
nter
9
Great Lakes Restoration Initiative Focus Areas
1) Toxic Substances and Areas of Concern (AOCs)
2) Invasive Species
3) Nearshore Health and Nonpoint Source Pollution
4) Habitat and Wildlife Protection and Restoration
5) Accountability, Education, Monitoring, Evaluation, Communication, and Partnerships
The federal government has continued its commitment to restore the environmental quality of the Great Lakes by continuing to fund the GLRI at $300 million in FY 2011 and FY 2012. While these figures are less than the original plan called for, the funding totals more than $1 billion over three years and has led to significant restoration progress throughout the Great Lakes Basin.
To improve the transparency of funding allocations and to provide information about funded projects, the GLRI set up the Great Lakes Accountability System (GLAS), which is available online at http://greatlakesrestoration.us/proj-ects.html. Many projects throughout the Saginaw Bay
Watershed have received funding support from the GLRI and are included in the GLAS. For example:
� The Shiawassee Flats Wildlife and Fish Habitat Restoration project, coordinated by Ducks Un-limited and the U.S. Fish & Wildlife Service, will restore water level management of approximately 3,700 acres of floodplain habitat. The project re-ceived $589,119 GLRI dollars from FY 2010 fund-ing to assist in project completion.
� The Rifle River Watershed Nonpoint Implemen-tation Project received $382,000 of GLRI dollars from FY 2010 funding to address sediment and nutrient loading in the Rifle River Watershed, which is a sub-watershed within the Saginaw Bay Watershed. The project is coordinated by Huron Pines, the U.S. Fish & Wildlife Service, U.S.D.A. Natural Resource Conservation Service, the Michigan Department of Environmental Qual-ity, and the Saginaw Bay Resource Conservation District.
� The Pigeon River Corridor Sediment Reduction Project, coordinated by the Pigeon River Inter-agency Drainage Board, received $800,000 GLRI dollars from FY 2010 funding. The project will de-sign and implement best management practices to address soil erosion and streambank stabilization along the Pigeon River.
Figure 2: Phosphorus Levels in the Saginaw Bay, 1968–2008
*Represents the target concentration level.Source: Craig Stow at National Oceanic and Atmospheric Administration, Great Lakes Environmental Research Lab.

saginaw bay watershed and area of concern
land
pol
icy
inst
itut
e
10
Summary The growth of communities in the Saginaw Bay Watershed placed an increasing strain on the region’s natural resources and the environment. Significant degradation of resources occurred from excessive nutrient loading, elevated bacteria levels, habitat loss, and hazardous chemi-cals entering the environment; this was reflected in declin-ing wildlife populations, water quality concerns, beach closings, and the buildup of hazardous chemicals in the food-web and environment.
By the 1970s, environmental quality had declined to such an extent that there was a call to action. In the following decades some of the most significant state, national, and international programs and laws were enacted to protect and restore environmental quality.
The continued efforts of local, state, and federal organi-zations to plan and implement restoration projects have substantially improved environmental conditions in the Saginaw River and Bay Area of Concern such that restora-tion targets for two of the beneficial use impairments iden-tified for the Area of Concern have been reached and the impaired status removed.
While environmental conditions have improved in the Saginaw Bay Watershed, there are ten remaining benefi-cial use impairments for the AOC that require continued efforts in order to plan, implement, and monitor prog-ress. The investment of the federal government through the Great Lakes Restoration Initiative has continued to support local efforts to restore the Saginaw Bay.
Resources UsedGreat Lakes Restoration Initiative. 2010. Available online at:
http://greatlakesrestoration.us/index.html.
International Joint Commission. February 2012. Available online at: http://www.ijc.org/.
Land Policy Institute at MSU, using data from National Oceanic and Atmospheric Administration Coastal Services Center. Land Cover Analysis webpage. Data source available online at: http://www.csc.noaa.gov/crs/lca/greatlakes.htm.
Michigan Department of Environmental Quality. January 2006. Guidance for Delisting Michigan’s Great Lakes Areas of Concern. Report MI/DEQ/WB-06/001. Lansing, Mich. Available online at: http://www.michigan.gov/documents/deq/wb-aoc-delistguide_247421_7.pdf.
Michigan Department of Environmental Quality. 2012. State Revolving Fund. Available online at: http://www.michigan.gov/deq/0,1607,7-135-3307_3515_4143---,00.html.
Michigan Department of Natural Resources. September 1988. Remedial Action Plan for Saginaw River and Saginaw Bay Area of Concern. Lansing, Mich. Available online at: http://www.epa.gov/greatlakes/aoc/sagrivr/1988_Saginaw_RAP.pdf.
Public Sector Consultants Inc. 2000. Measures of Success: Addressing Environmental Impairments in the Saginaw River and Saginaw Bay. Lansing, Mich. Available online at: http://www.pscinc.com/Portals/0/Publications/Saginaw_Bay/2000_Measures_Success/report.pdf.
Public Sector Consultants Inc. December 2005. Enhancing Fish Passage over Low-head Barrier Dams in the Saginaw River Watershed. Lansing, Mich. Available online at: http://www.pscinc.com/LinkClick.aspx?fileticket=AA9mGDFNw08%3d&tabid=65.
Public Sector Consultants Inc. June 2008. Saginaw River/Bay Area of Concern Habitat Restoration Plan. Lansing, Mich. Available online at: http://www.pscinc.com/LinkClick.aspx?fileticket=QhZtbdgiJwg%3D&tabid=65.
Public Sector Consultants Inc. October 2010. Saginaw River/Bay Area of Concern Habitat Restoration Plan Update and Target Review. Lansing, Mich.
Saginaw Bay Coastal Initiative. June 2009. Phosphorus Committee Report. Available online at: http://www.michigan.gov/documents/deq/sagbayphosrep_283289_7.pdf.
United States Environmental Protection Agency. February 2011. Saginaw River and Bay Area of Concern. Available online at: http://www.epa.gov/greatlakes/aoc/sagrivr.html.
United States Fish & Wildlife Service. November 2011. Great Lakes Restoration Initiative. Available online at: http://www.fws.gov/glri/.
Photo credits: United States Environmental Protection Agency Great Lakes National Program Office. Available online at: http://www.epa.gov/glnpo/image/.
Stream fishing in Michigan.

Prepared by Public Sector Consultants Inc.600 W. Saint Joseph Street, Suite 10, Lansing, MI517.494-4954www.pscinc.com
AcknowledgementsThis pamphlet was prepared by Public Sector Consultants (PSC) Inc. under contract to the Planning & Zoning Center (PZC) at Michigan State University (MSU), for initial distribution at the Saginaw Bay Watershed Conference on March 16, 2012, at Saginaw Valley State University. MSU received financial support for this pamphlet by a grant from the Great Lakes Restoration Initiative (GLRI), a grant program of the U.S. Environmental Protection Agency, and also received assistance from PZC staff funded from MSU Extension, Greening Michigan Institute. The Planning & Zoning Center is a part of the MSU Land Policy Institute and both are affiliated with the MSU School of Planning, Design and Construction. Project partners with PZC on this GLRI grant include the Michigan Department of Environmental Quality, the East Michigan Council of Governments, and the Saginaw Basin Land Conservancy. Co-sponsors of the March 16th conference include these project partners plus The Partnership for the Saginaw Bay Watershed and the Saginaw Bay Coastal Initiative.
PZC wishes to thank all of these entities for their long-standing commitment and support for improving water quality throughout the Saginaw Basin. PZC would also like to thank the nearly 100 jurisdictions in the Pigeon, Pinnebog, Cass, and Rifle River sub-watersheds that are working to update local master plans and zoning ordinanc-es to make them more supportive of water quality protec-tion and low-impact development; as well as the dozens of other stakeholders in the region who work daily to protect and improve water quality in the Basin.
For a directory of these groups visit: www.landpolicy.msu.edu/SaginawBayProject/Directory. For more infor-mation on this project, visit: www.landpolicy.msu.edu/SaginawBayProject. Contact PZC at MSU at: 310 Manly Miles, 1405 S. Harrison Road, East Lansing, MI, 48823; (517) 432-2222; (517) 432-3222 FAX; or [email protected].