sailing tourism in scotland - scottish tourism alliancescottishtourismalliance.co.uk/uploads/ts2020...
TRANSCRIPT
Report for The Crown Estate, Highlands and Islands Enterprise and Scottish Canals December 2016
EKOS Limited, St. George’s Studios, 93-97 St. George’s Road, Glasgow, G3 6JA
Reg 145099
Telephone: 0141 353 1994
Web: www.ekos-consultants.co.uk
Sailing Tourism in Scotland

Direct enquiries regarding this report should be submitted to:
James Adam, Associate Director, EKOS
Email: [email protected]
Tel: 0141 353 1994
As part of our green office policy all EKOS reports are printed double sided on 100%
sustainable paper
Contents
Executive Summary a
1. Introduction 1
2. Current Market Overview 3
3. Current Economic Impact 10
4. Resident and Visitors Craft Survey 20
5. The Future – Pontoons and Moorings 31
6. Future Economic Impact 68
7. Conclusions 82
Appendix 1: Consultees and Databases i
Appendix 2: Glossary ii
Appendix 3: Bibliography iii
Sailing Tourism in Scotland
a
Executive Summary
Introduction
This report provides an update on the economic analysis and growth projections of
the Sailing Tourism sector in Scotland and identifies strategic development areas
around Scotland’s coastline.
Objectives
The objectives of the study were to: provide an overview of the sector; establish the
current berthing capacity and economic contribution; identify gaps, market
opportunities and growth potential; ensure it does not exceed saturation; and provide
an assessment of the potential future economic impact.
Method
The study method comprised a combination of: a review of previous
studies/documents; audit of existing provision; stakeholder consultations; consumer
survey; operators’ survey; assessment of gaps/market opportunities; assessment of
the current and potential future economic impact. The market opportunities that
have been identified will help to strengthen the visitor sailing product across
Scotland. This takes account of key visitor sailing routes, sail to visitor destinations
and strategic sail through locations providing essential connections. The strategic
importance of resident sailing hubs is recognised as they help drive visitor trips out
to the sail to destinations boosting the economic benefit of sailing tourism.
Key Findings
Current Market
The total current supply is approximately 15,700 berths up from 12,600 in 2009, an
increase of 24%. Of these 13,500 are resident berths (up 23%) and 2,200 visitor
berths (up 32%). Occupancy of resident berths is 95% which is the same level as in
2009, thus demand has kept pace with supply. The proportion of non-Scottish
residents has increased from 13.5% in 2009 to 21.5% in 2016.
Sailing Tourism in Scotland
b
Visitor boats nights are just under 176,000, an increase of 5%. The proportion
accounted for by non-Scottish residents is 45% (very similar to 2009 – 44%).
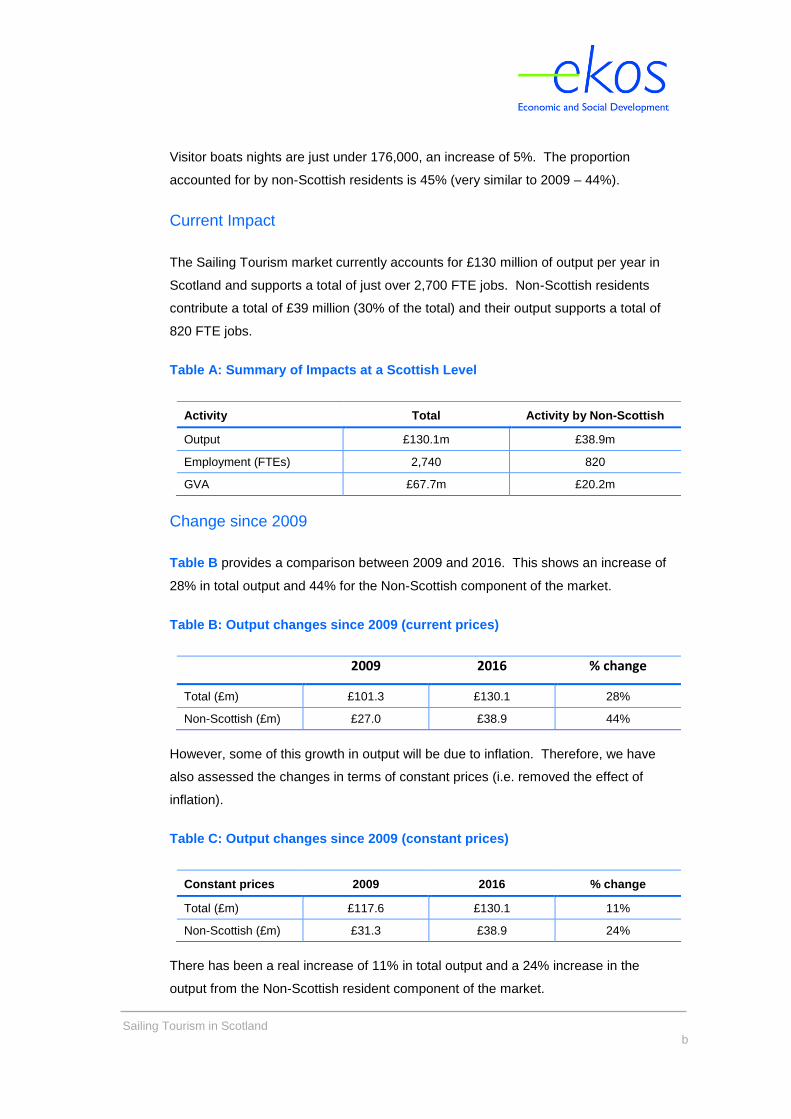
Current Impact
The Sailing Tourism market currently accounts for £130 million of output per year in
Scotland and supports a total of just over 2,700 FTE jobs. Non-Scottish residents
contribute a total of £39 million (30% of the total) and their output supports a total of
820 FTE jobs.
Table A: Summary of Impacts at a Scottish Level
Activity Total Activity by Non-Scottish
Output £130.1m £38.9m
Employment (FTEs) 2,740 820
GVA £67.7m £20.2m
Change since 2009
Table B provides a comparison between 2009 and 2016. This shows an increase of
28% in total output and 44% for the Non-Scottish component of the market.
Table B: Output changes since 2009 (current prices)
2009 2016 % change
Total (£m) £101.3 £130.1 28%
Non-Scottish (£m) £27.0 £38.9 44%
However, some of this growth in output will be due to inflation. Therefore, we have
also assessed the changes in terms of constant prices (i.e. removed the effect of
inflation).
Table C: Output changes since 2009 (constant prices)
Constant prices 2009 2016 % change
Total (£m) £117.6 £130.1 11%
Non-Scottish (£m) £31.3 £38.9 24%
There has been a real increase of 11% in total output and a 24% increase in the
output from the Non-Scottish resident component of the market.
Sailing Tourism in Scotland
c
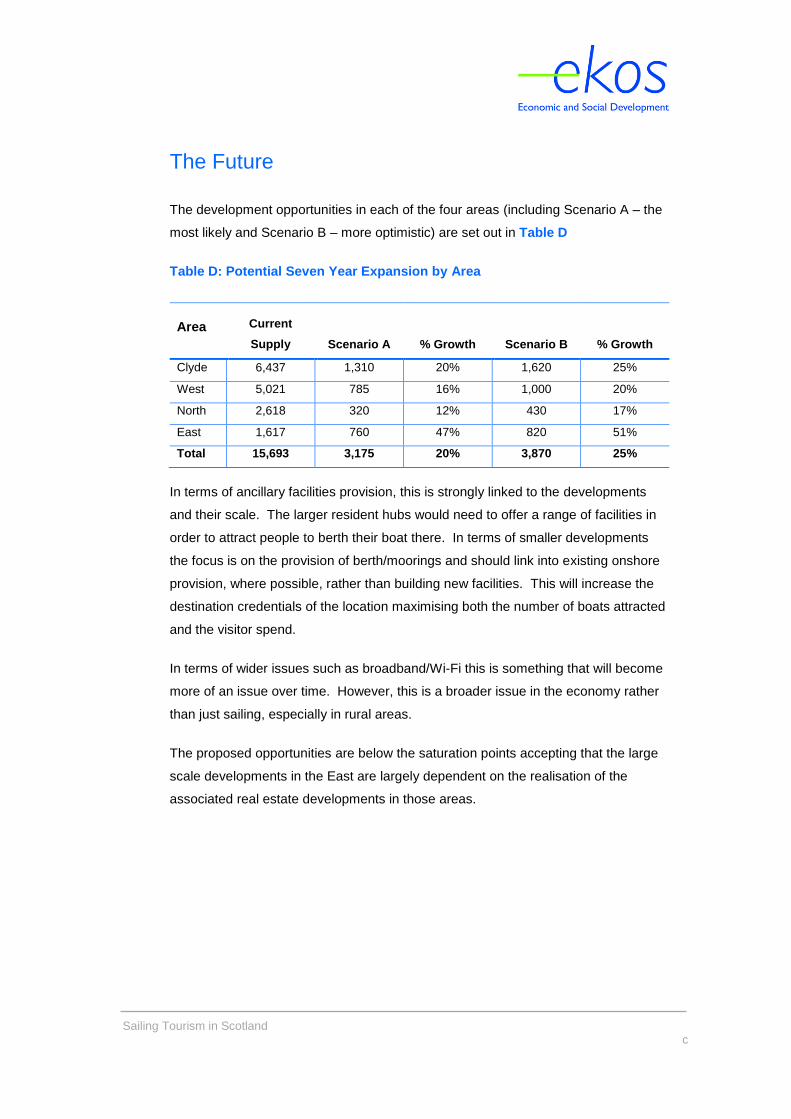
The Future
The development opportunities in each of the four areas (including Scenario A – the
most likely and Scenario B – more optimistic) are set out in Table D
Table D: Potential Seven Year Expansion by Area
Area Current
Supply Scenario A % Growth Scenario B % Growth
Clyde 6,437 1,310 20% 1,620 25%
West 5,021 785 16% 1,000 20%
North 2,618 320 12% 430 17%
East 1,617 760 47% 820 51%
Total 15,693 3,175 20% 3,870 25%
In terms of ancillary facilities provision, this is strongly linked to the developments
and their scale. The larger resident hubs would need to offer a range of facilities in
order to attract people to berth their boat there. In terms of smaller developments
the focus is on the provision of berth/moorings and should link into existing onshore
provision, where possible, rather than building new facilities. This will increase the
destination credentials of the location maximising both the number of boats attracted
and the visitor spend.
In terms of wider issues such as broadband/Wi-Fi this is something that will become
more of an issue over time. However, this is a broader issue in the economy rather
than just sailing, especially in rural areas.
The proposed opportunities are below the saturation points accepting that the large
scale developments in the East are largely dependent on the realisation of the
associated real estate developments in those areas.
Sailing Tourism in Scotland
d
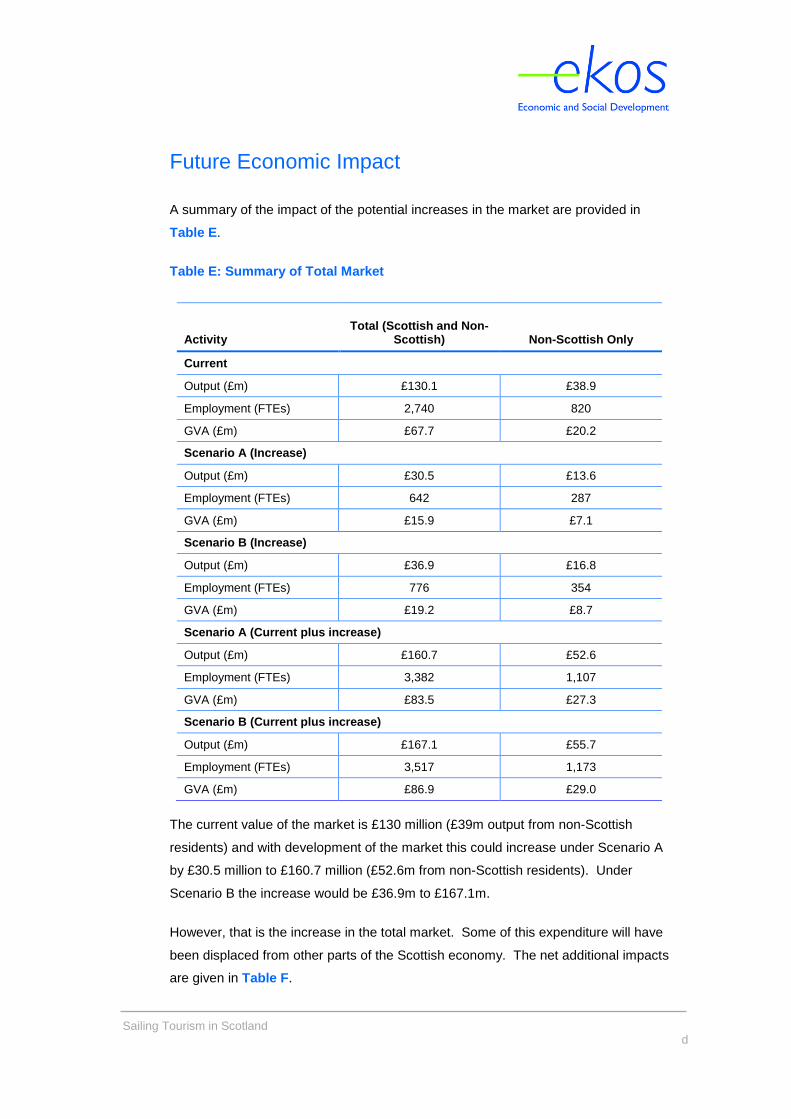
Future Economic Impact
A summary of the impact of the potential increases in the market are provided in
Table E.
Table E: Summary of Total Market
Activity Total (Scottish and Non-
Scottish) Non-Scottish Only
Current
Output (£m) £130.1 £38.9
Employment (FTEs) 2,740 820
GVA (£m) £67.7 £20.2
Scenario A (Increase)
Output (£m) £30.5 £13.6
Employment (FTEs) 642 287
GVA (£m) £15.9 £7.1
Scenario B (Increase)
Output (£m) £36.9 £16.8
Employment (FTEs) 776 354
GVA (£m) £19.2 £8.7
Scenario A (Current plus increase)
Output (£m) £160.7 £52.6
Employment (FTEs) 3,382 1,107
GVA (£m) £83.5 £27.3
Scenario B (Current plus increase)
Output (£m) £167.1 £55.7
Employment (FTEs) 3,517 1,173
GVA (£m) £86.9 £29.0
The current value of the market is £130 million (£39m output from non-Scottish
residents) and with development of the market this could increase under Scenario A
by £30.5 million to £160.7 million (£52.6m from non-Scottish residents). Under
Scenario B the increase would be £36.9m to £167.1m.
However, that is the increase in the total market. Some of this expenditure will have
been displaced from other parts of the Scottish economy. The net additional impacts
are given in Table F.

Sailing Tourism in Scotland
e
Table F: Summary of Net Additional Increase
Activity Total (Scottish and Non-
Scottish) Non-Scottish Only
Current
Output (£m) £130.1 £38.9
Employment (FTEs) 2,740 820
GVA (£m) £67.7 £20.2
Scenario A (Net Additional Increase)
Output (£m) £18.7 £13.6
Employment (FTEs) £393.6 £287.3
GVA (£m) £9.7 £7.1
Scenario B (Net Additional Increase)
Output (£m) £22.8 £16.8
Employment (FTEs) £480.4 £353.5
GVA (£m) £11.9 £8.7
Scenario A (Current plus net additional increase)
Output (£m) £148.9 £52.6
Employment (FTEs) £3,134.1 £1,107.1
GVA (£m) £77.4 £27.3
Scenario B (Current plus net additional increase)
Output (£m) £153.0 £55.7
Employment (FTEs) £3,220.9 £1,173.4
GVA (£m) £79.6 £29.0
Therefore, allowing for displacement gives a potential net additional increase in
output of £18.7 million under Scenario A (£13.6m for Non-Scottish Residents) and
£22.8m under Scenario B (£16.8m for Non-Scottish Residents)
Sailing Tourism in Scotland
1
1. Introduction
1.1 Background
Scotland’s Marine Tourism Strategy - Awakening the Giant – outlines the potential
and opportunities to grow Scotland’s reputation as a world class marine tourism
destination by focusing on three key themes – Providing Authentic Experiences,
Improving the Customer Journey and Building our Capabilities. The strategy sets a
target to develop and lead the growth of sailing tourism in Scotland from £101m to
£145m by 2020, and to increase the overall economic value of the marine tourism
sector from £360m to £450m by 2020.
The Crown Estate, in partnership with Scottish Canals and Highlands & Islands
Enterprise, commissioned a research project in order to update the economic
analysis and growth projections of the Sailing Tourism sector in Scotland and identify
strategic development areas around Scotland’s coastline. This new research project
was to build on Scottish Enterprise’s Sailing Tourism in Scotland report published in
February 2010 (referred to hereafter as the ‘2010 report’).
1.2 Objectives
The overall objective of this study was to update the current economic contribution
the sailing tourism1 sector makes to the Scottish economy and analyse the potential
within the sector to grow GVA (gross value added2) impact. There are also a
number of more detailed objectives, including:
Providing an overview of current sailing infrastructure in place, supported by
information on sailing numbers and an understanding of sailing market
trends and forecasts;
1 For the purposes of this study Sailing Tourism is considered to be the activity surrounding leisure
power and sail craft that are normally berthed in the marine environment. 2 GVA is the difference between output and intermediate consumption for any given sector/industry.
That is the difference between the value of goods and services produced and the cost of raw materials and other inputs which are used up in production.
Sailing Tourism in Scotland
2
Calculating the current total berthing capacity within Scotland, both
permanent and visitor (fixed berth and swing mooring);
Quantifying the contribution made by the existing sailing infrastructure to
overall GVA in Scotland;
Identifying any sailing tourism projects in Scotland that are in the
development pipeline;
Providing an update on the growth potential for the sector in Scotland, using
the 2010 report as a baseline;
Identifying any geographical and service gaps in the market which are
hindering the development of sailing tourism;
Quantifying the likely economic growth, in terms of GVA and employment,
that would be associated with the developments needed to unlock the
potential (including direct, indirect and induced impacts); and
Using sailing zones identified in the 2010 report, forecast the berthing
capacity at which market saturation could occur.
1.3 Report Structure
The remainder of the report is structured as follows:
Chapter 2: Current Market Overview;
Chapter 3: Current Economic Impact;
Chapter 4: Resident & Visitors Craft Survey;
Chapter 5: The Future;
Chapter 6: Future Economic Impact; and
Chapter 7: Conclusions.
Sailing Tourism in Scotland
3
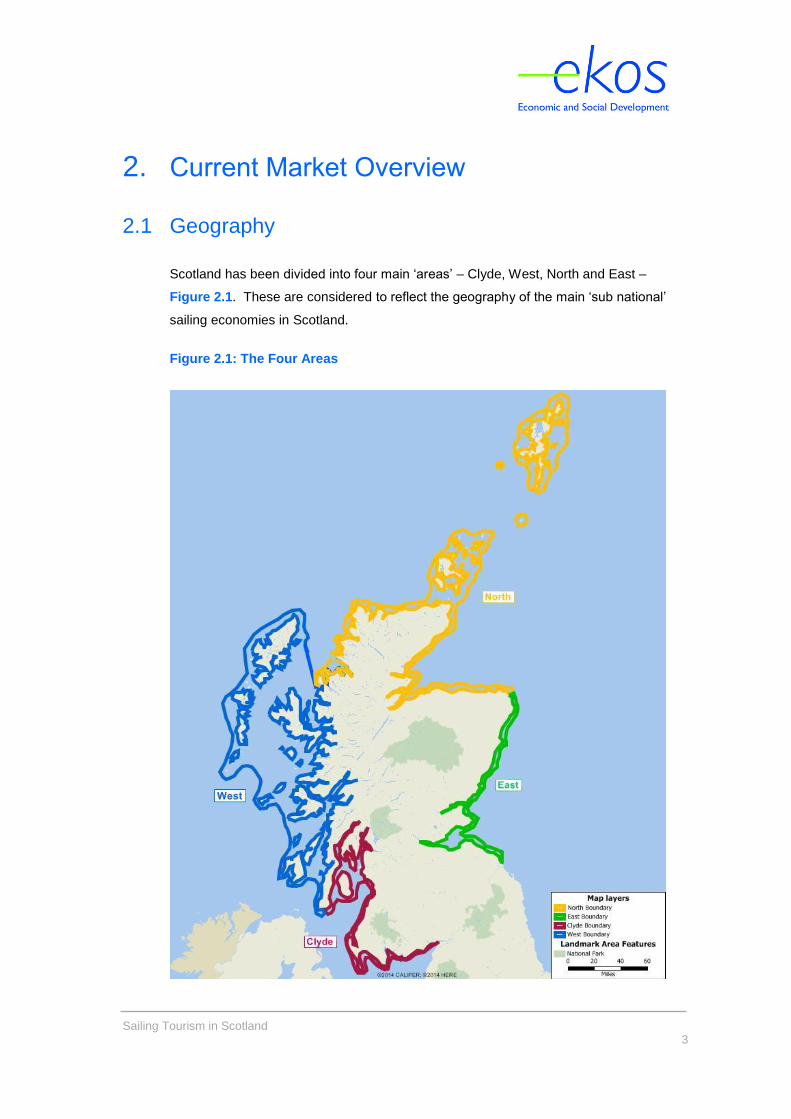
2. Current Market Overview
2.1 Geography
Scotland has been divided into four main ‘areas’ – Clyde, West, North and East –
Figure 2.1. These are considered to reflect the geography of the main ‘sub national’
sailing economies in Scotland.
Figure 2.1: The Four Areas
Sailing Tourism in Scotland
4
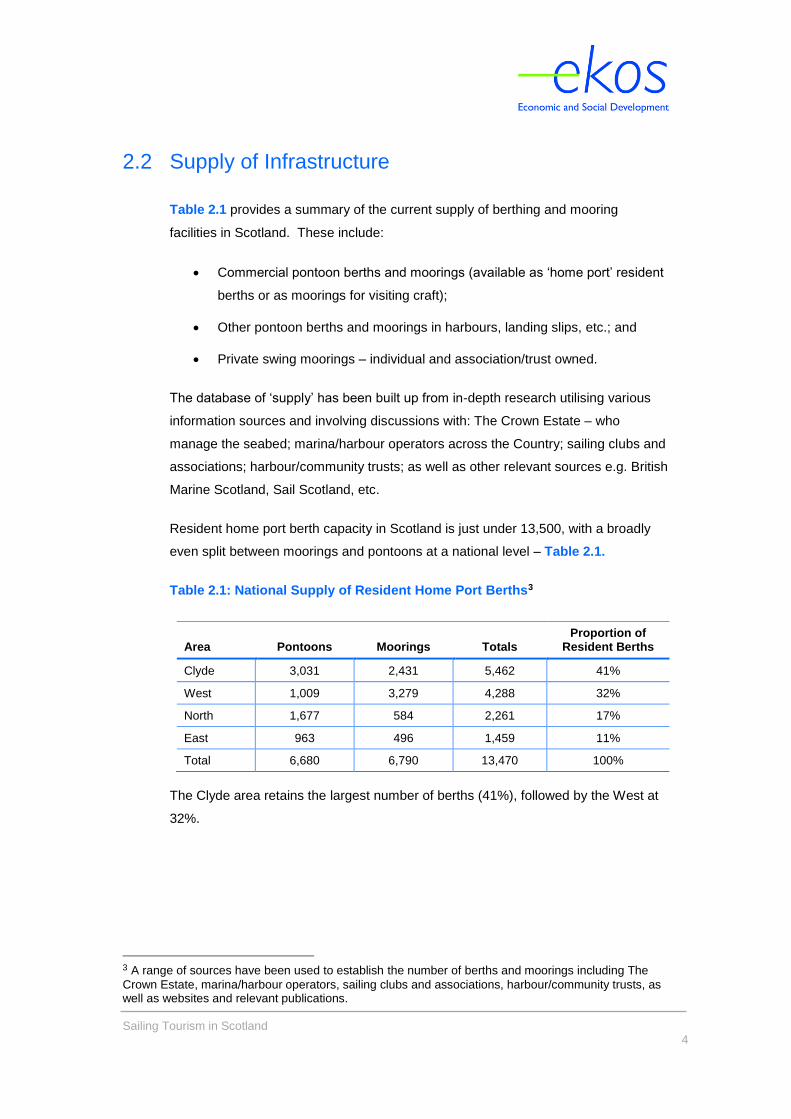
2.2 Supply of Infrastructure
Table 2.1 provides a summary of the current supply of berthing and mooring
facilities in Scotland. These include:
Commercial pontoon berths and moorings (available as ‘home port’ resident
berths or as moorings for visiting craft);
Other pontoon berths and moorings in harbours, landing slips, etc.; and
Private swing moorings – individual and association/trust owned.
The database of ‘supply’ has been built up from in-depth research utilising various
information sources and involving discussions with: The Crown Estate – who
manage the seabed; marina/harbour operators across the Country; sailing clubs and
associations; harbour/community trusts; as well as other relevant sources e.g. British
Marine Scotland, Sail Scotland, etc.
Resident home port berth capacity in Scotland is just under 13,500, with a broadly
even split between moorings and pontoons at a national level – Table 2.1.
Table 2.1: National Supply of Resident Home Port Berths3
Area Pontoons Moorings Totals Proportion of
Resident Berths
Clyde 3,031 2,431 5,462 41%
West 1,009 3,279 4,288 32%
North 1,677 584 2,261 17%
East 963 496 1,459 11%
Total 6,680 6,790 13,470 100%
The Clyde area retains the largest number of berths (41%), followed by the West at
32%.
3 A range of sources have been used to establish the number of berths and moorings including The
Crown Estate, marina/harbour operators, sailing clubs and associations, harbour/community trusts, as well as websites and relevant publications.
Sailing Tourism in Scotland
5
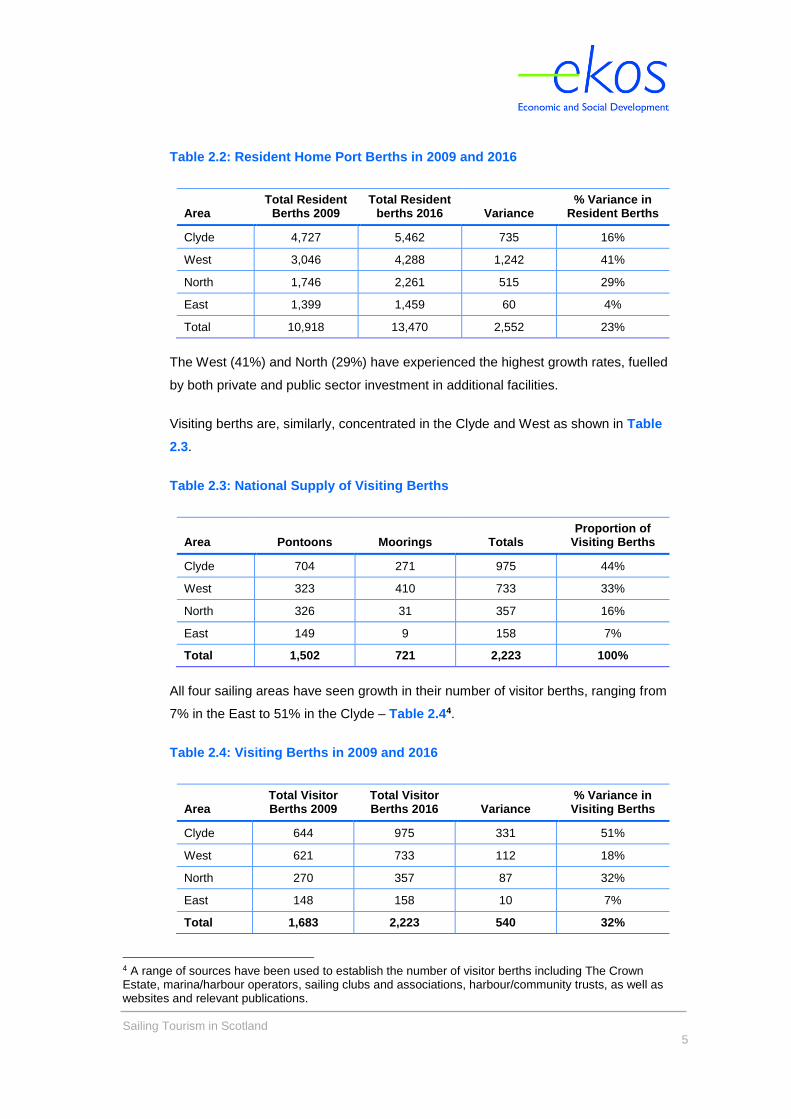
Table 2.2: Resident Home Port Berths in 2009 and 2016
Area Total Resident
Berths 2009 Total Resident
berths 2016 Variance % Variance in
Resident Berths
Clyde 4,727 5,462 735 16%
West 3,046 4,288 1,242 41%
North 1,746 2,261 515 29%
East 1,399 1,459 60 4%
Total 10,918 13,470 2,552 23%
The West (41%) and North (29%) have experienced the highest growth rates, fuelled
by both private and public sector investment in additional facilities.
Visiting berths are, similarly, concentrated in the Clyde and West as shown in Table
2.3.
Table 2.3: National Supply of Visiting Berths
Area Pontoons Moorings Totals Proportion of
Visiting Berths
Clyde 704 271 975 44%
West 323 410 733 33%
North 326 31 357 16%
East 149 9 158 7%
Total 1,502 721 2,223 100%
All four sailing areas have seen growth in their number of visitor berths, ranging from
7% in the East to 51% in the Clyde – Table 2.44.
Table 2.4: Visiting Berths in 2009 and 2016
Area Total Visitor Berths 2009
Total Visitor Berths 2016 Variance
% Variance in Visiting Berths
Clyde 644 975 331 51%
West 621 733 112 18%
North 270 357 87 32%
East 148 158 10 7%
Total 1,683 2,223 540 32%
4 A range of sources have been used to establish the number of visitor berths including The Crown Estate, marina/harbour operators, sailing clubs and associations, harbour/community trusts, as well as websites and relevant publications.
Sailing Tourism in Scotland
6
Combining resident and visitor5 berths gives a total of 15,700. Nearly three quarters
of this capacity (73%) is located in the West and Clyde regions – Table 2.5.
Table 2.5: National Supply of All Berthing Facilities
Area Pontoons Moorings Total Proportion of Total
Available Berths
Clyde 3,735 2,702 6,437 41%
West 1,332 3,689 5,021 32%
North 2,003 615 2,618 17%
East 1,112 505 1,617 10%
Total 8,182 7,511 15,693 100%
The total number of berths in Scotland increased by 25% from 2009 to 2016 - Table
2.6. Growth was seen in all four regions, although this ranged from an increase of
5% in the East to 37% in the West.
Table 2.6: All Berths in 2009 and 2016
Area
Total Resident & Visitor
Berths 2009
Total Resident & Visitor
Berths 2016 Variance
% Variance in Resident &
Visitor Berths
Clyde 5,371 6,437 1,066 20%
West 3,667 5,021 1,354 37%
North 2,016 2,618 602 30%
East 1,547 1,617 70 5%
Total 12,601 15,693 3,092 25%
2.3 Current Demand for Berths
There are currently around 12,800 boats with a home resident berth in Scotland,
growth of 23% from the 2009 figure of 10,400. Research indicates that demand has
kept pace with this increased capacity, with average occupancy remaining at 95% at
a national level – Table 2.7.
5 Some locations may at times make use of their resident berths (when not occupied) for visitors.
Sailing Tourism in Scotland
7
Table 2.7: Demand for Home Port Resident Berths
Area Pontoons Occupied
Moorings Occupied
Total Occupied Supply
Average Occupancy
Change from 2009
(% pts)
Clyde 2,893 2,320 5,213 5,462 95% +1%
West 924 3,002 3,926 4,288 92% -3%
North 1,677 572 2,249 2,261 99% +2%
East 920 474 1,393 1,459 96% -4%
Total 6,413 6,368 12,781 13,470 95% 0%
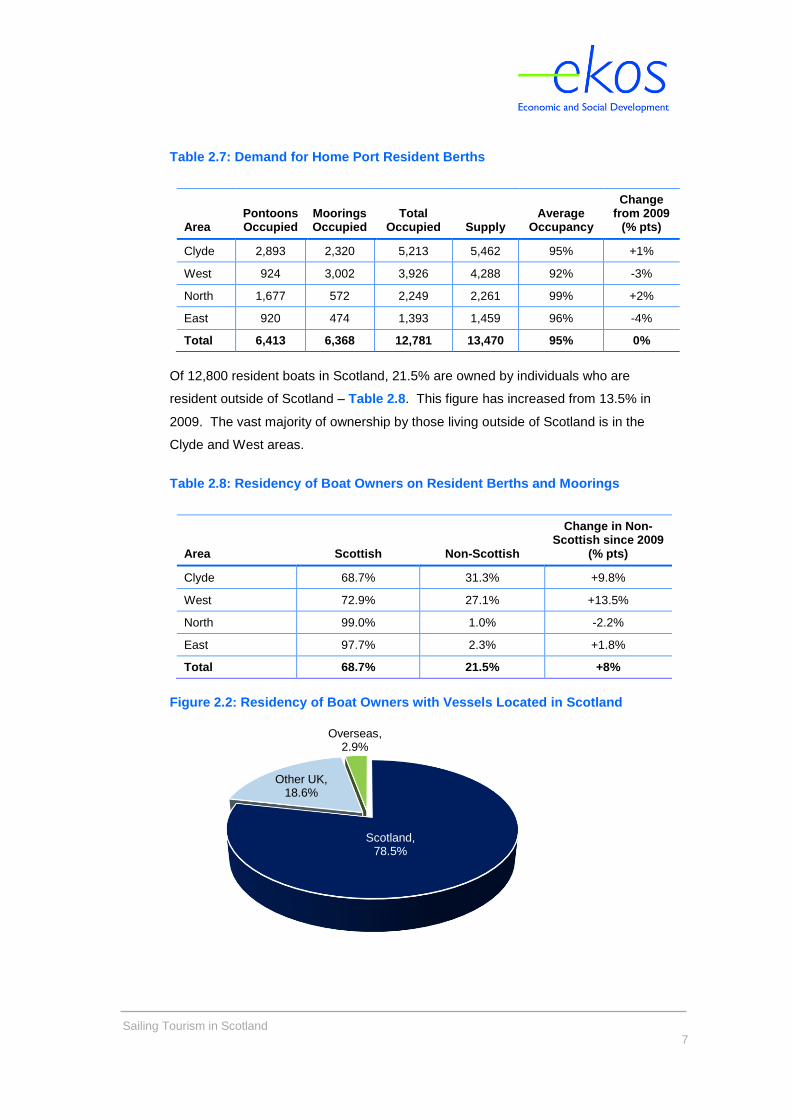
Of 12,800 resident boats in Scotland, 21.5% are owned by individuals who are
resident outside of Scotland – Table 2.8. This figure has increased from 13.5% in
2009. The vast majority of ownership by those living outside of Scotland is in the
Clyde and West areas.
Table 2.8: Residency of Boat Owners on Resident Berths and Moorings
Area Scottish Non-Scottish
Change in Non-Scottish since 2009
(% pts)
Clyde 68.7% 31.3% +9.8%
West 72.9% 27.1% +13.5%
North 99.0% 1.0% -2.2%
East 97.7% 2.3% +1.8%
Total 68.7% 21.5% +8%
Figure 2.2: Residency of Boat Owners with Vessels Located in Scotland
Scotland, 78.5%
Other UK, 18.6%
Overseas, 2.9%
Sailing Tourism in Scotland
8
The residency of overseas visitors included France, Netherlands, Norway,
Switzerland, Eire, Sweden, Italy, Belgium, Germany and the USA.
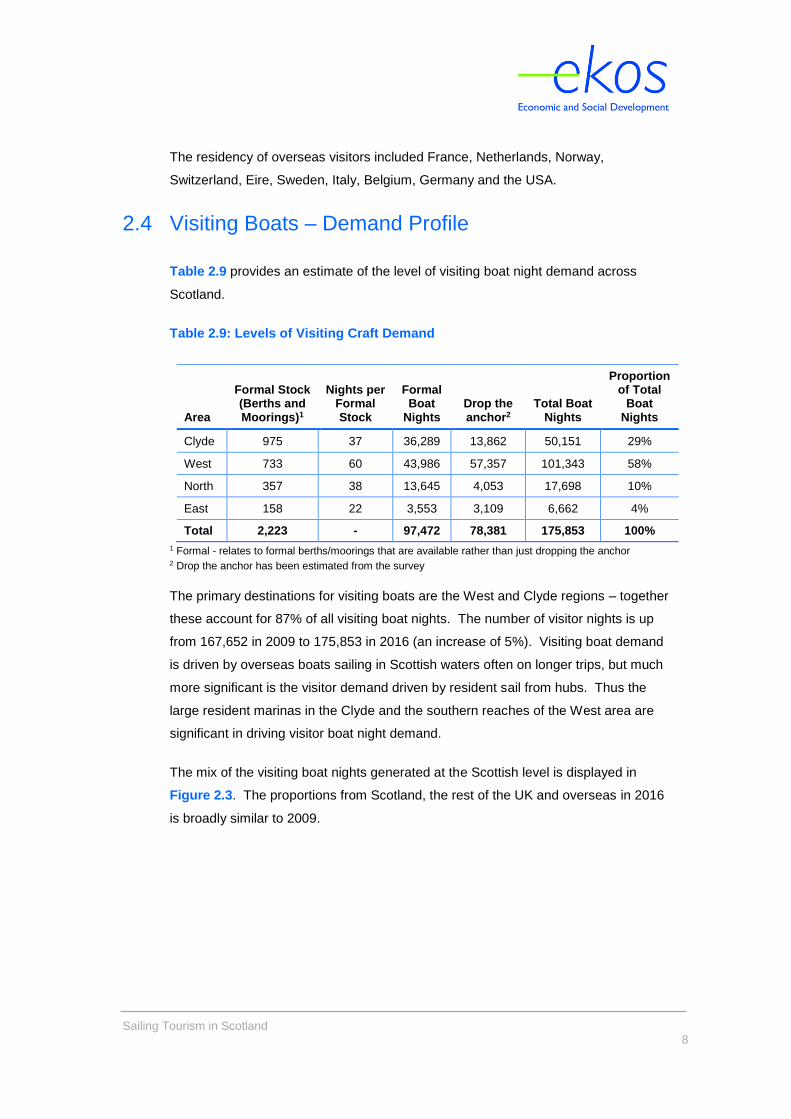
2.4 Visiting Boats – Demand Profile
Table 2.9 provides an estimate of the level of visiting boat night demand across
Scotland.
Table 2.9: Levels of Visiting Craft Demand
Area
Formal Stock (Berths and Moorings)1
Nights per Formal Stock
Formal Boat
Nights Drop the anchor2
Total Boat Nights
Proportion of Total
Boat Nights
Clyde 975 37 36,289 13,862 50,151 29%
West 733 60 43,986 57,357 101,343 58%
North 357 38 13,645 4,053 17,698 10%
East 158 22 3,553 3,109 6,662 4%
Total 2,223 - 97,472 78,381 175,853 100%
1 Formal - relates to formal berths/moorings that are available rather than just dropping the anchor 2 Drop the anchor has been estimated from the survey
The primary destinations for visiting boats are the West and Clyde regions – together
these account for 87% of all visiting boat nights. The number of visitor nights is up
from 167,652 in 2009 to 175,853 in 2016 (an increase of 5%). Visiting boat demand
is driven by overseas boats sailing in Scottish waters often on longer trips, but much
more significant is the visitor demand driven by resident sail from hubs. Thus the
large resident marinas in the Clyde and the southern reaches of the West area are
significant in driving visitor boat night demand.
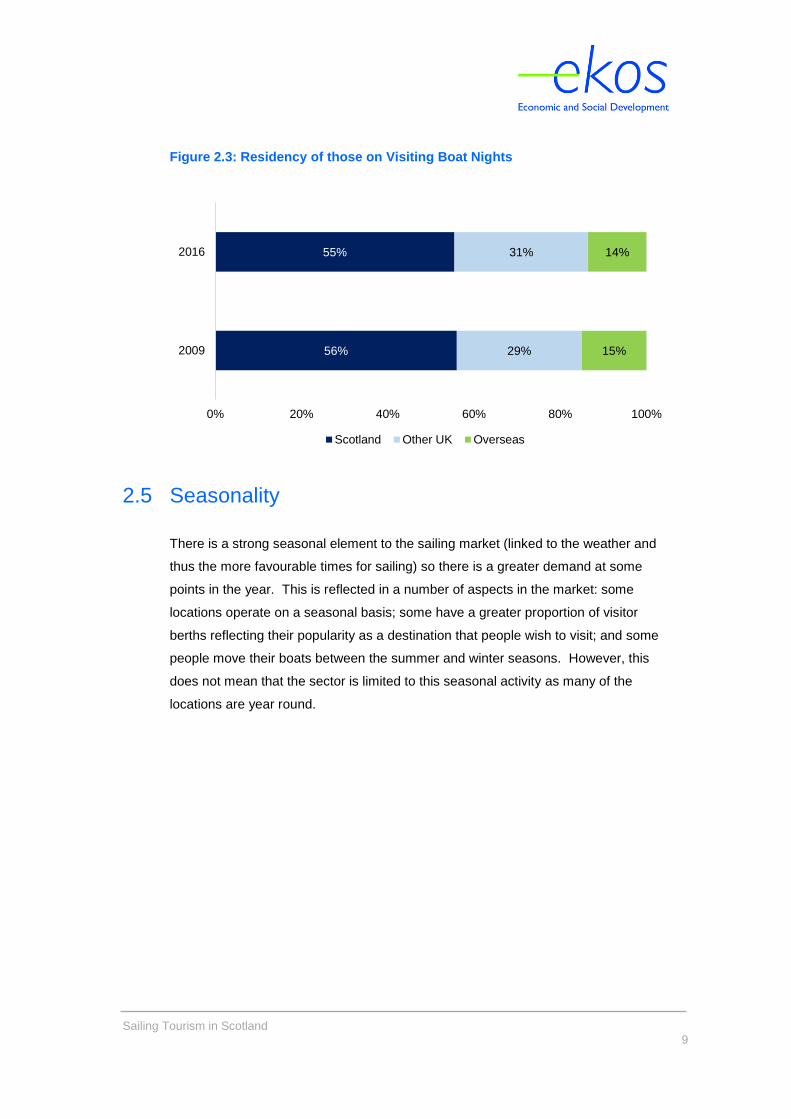
The mix of the visiting boat nights generated at the Scottish level is displayed in
Figure 2.3. The proportions from Scotland, the rest of the UK and overseas in 2016
is broadly similar to 2009.
Sailing Tourism in Scotland
9
Figure 2.3: Residency of those on Visiting Boat Nights
2.5 Seasonality
There is a strong seasonal element to the sailing market (linked to the weather and
thus the more favourable times for sailing) so there is a greater demand at some
points in the year. This is reflected in a number of aspects in the market: some
locations operate on a seasonal basis; some have a greater proportion of visitor
berths reflecting their popularity as a destination that people wish to visit; and some
people move their boats between the summer and winter seasons. However, this
does not mean that the sector is limited to this seasonal activity as many of the
locations are year round.
56%
55%
29%
31%
15%
14%
0% 20% 40% 60% 80% 100%
2009
2016
Scotland Other UK Overseas
Sailing Tourism in Scotland
10
3. Current Economic Impact
3.1 Introduction
This section sets out the current level of economic impact resulting from sailing
tourism market in Scotland. (The scope of the sector includes activities related to
the leisure power and sail craft on moorings and berths in marine-related
environments. The economic impact makes no attempt to quantify the economic
activity surrounding sailing events and other sectors of the marine leisure economy).
The impacts identified below are those generated through both resident and visitor
berths and moorings.
The economic analysis provides an assessment of the total value of activity in the
sector generated by Scottish and Non-Scottish residents.
3.2 Expenditure Generated by Resident Berths and
Moorings
Table 3.1: Resident Berths and Moorings
Area Available Occupied
Clyde 5,462 5,213
West 4,288 3,926
North 2,261 2,249
East 1,459 1,393
Scotland 13,470 12,781
For the purposes of the economic impact assessment we are interested in the
number of resident berths and moorings that are occupied, as they have associated
expenditure.
Sailing Tourism in Scotland
11
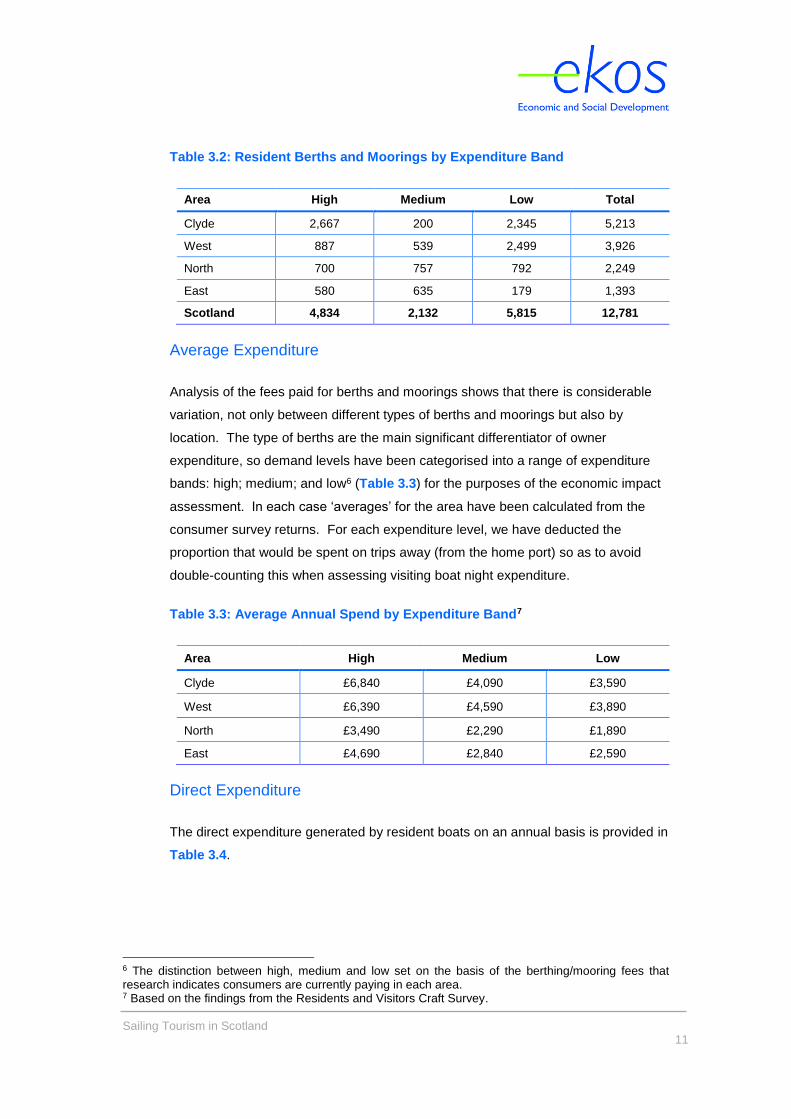
Table 3.2: Resident Berths and Moorings by Expenditure Band
Area High Medium Low Total
Clyde 2,667 200 2,345 5,213
West 887 539 2,499 3,926
North 700 757 792 2,249
East 580 635 179 1,393
Scotland 4,834 2,132 5,815 12,781
Average Expenditure
Analysis of the fees paid for berths and moorings shows that there is considerable
variation, not only between different types of berths and moorings but also by
location. The type of berths are the main significant differentiator of owner
expenditure, so demand levels have been categorised into a range of expenditure
bands: high; medium; and low6 (Table 3.3) for the purposes of the economic impact
assessment. In each case ‘averages’ for the area have been calculated from the
consumer survey returns. For each expenditure level, we have deducted the
proportion that would be spent on trips away (from the home port) so as to avoid
double-counting this when assessing visiting boat night expenditure.
Table 3.3: Average Annual Spend by Expenditure Band7
Area High Medium Low
Clyde £6,840 £4,090 £3,590
West £6,390 £4,590 £3,890
North £3,490 £2,290 £1,890
East £4,690 £2,840 £2,590
Direct Expenditure
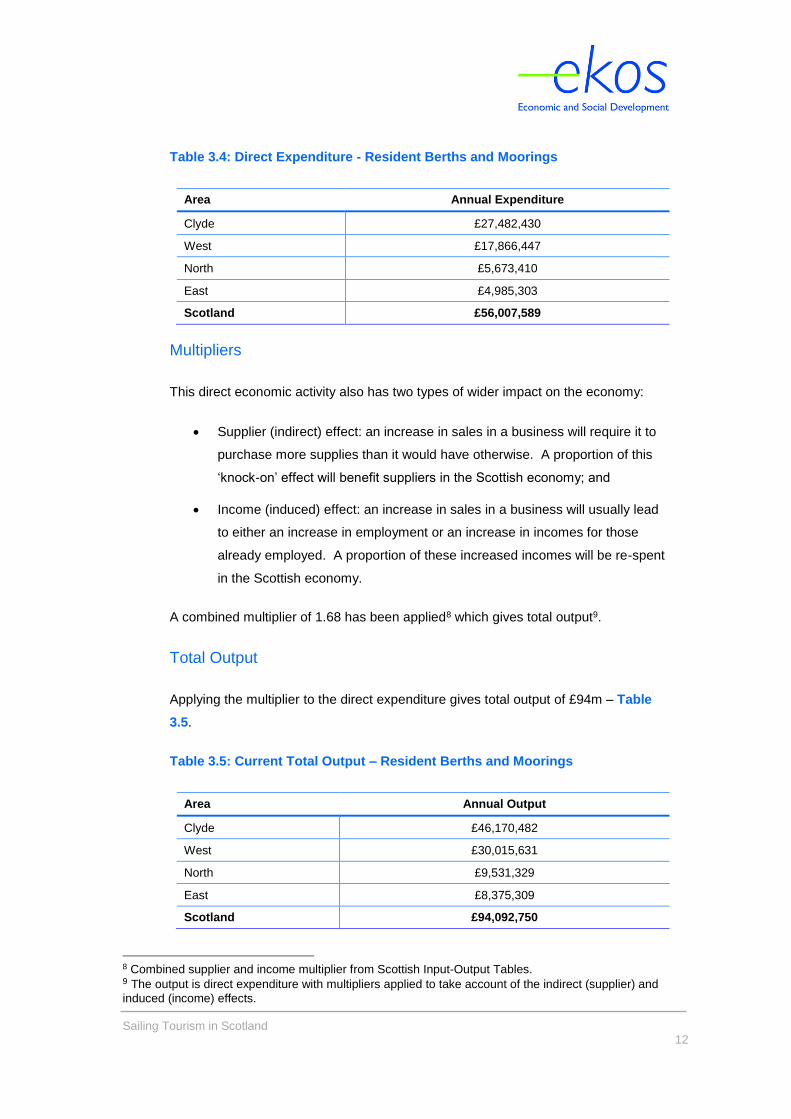
The direct expenditure generated by resident boats on an annual basis is provided in
Table 3.4.
6 The distinction between high, medium and low set on the basis of the berthing/mooring fees that research indicates consumers are currently paying in each area. 7 Based on the findings from the Residents and Visitors Craft Survey.
Sailing Tourism in Scotland
12
Table 3.4: Direct Expenditure - Resident Berths and Moorings
Area Annual Expenditure
Clyde £27,482,430
West £17,866,447
North £5,673,410
East £4,985,303
Scotland £56,007,589
Multipliers
This direct economic activity also has two types of wider impact on the economy:
Supplier (indirect) effect: an increase in sales in a business will require it to
purchase more supplies than it would have otherwise. A proportion of this
‘knock-on’ effect will benefit suppliers in the Scottish economy; and
Income (induced) effect: an increase in sales in a business will usually lead
to either an increase in employment or an increase in incomes for those
already employed. A proportion of these increased incomes will be re-spent
in the Scottish economy.
A combined multiplier of 1.68 has been applied8 which gives total output9.
Total Output
Applying the multiplier to the direct expenditure gives total output of £94m – Table
3.5.
Table 3.5: Current Total Output – Resident Berths and Moorings
Area Annual Output
Clyde £46,170,482
West £30,015,631
North £9,531,329
East £8,375,309
Scotland £94,092,750
8 Combined supplier and income multiplier from Scottish Input-Output Tables. 9 The output is direct expenditure with multipliers applied to take account of the indirect (supplier) and
induced (income) effects.
Sailing Tourism in Scotland
13
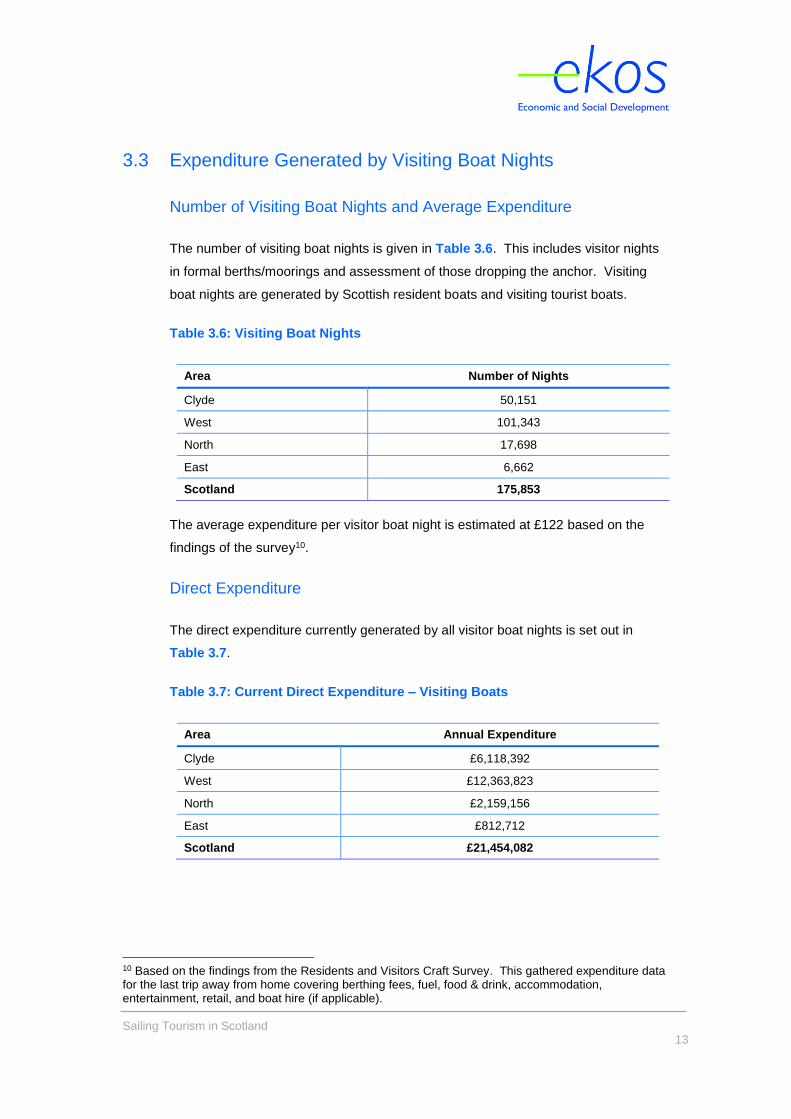
3.3 Expenditure Generated by Visiting Boat Nights
Number of Visiting Boat Nights and Average Expenditure
The number of visiting boat nights is given in Table 3.6. This includes visitor nights
in formal berths/moorings and assessment of those dropping the anchor. Visiting
boat nights are generated by Scottish resident boats and visiting tourist boats.
Table 3.6: Visiting Boat Nights
Area Number of Nights
Clyde 50,151
West 101,343
North 17,698
East 6,662
Scotland 175,853
The average expenditure per visitor boat night is estimated at £122 based on the
findings of the survey10.
Direct Expenditure
The direct expenditure currently generated by all visitor boat nights is set out in
Table 3.7.
Table 3.7: Current Direct Expenditure – Visiting Boats
Area Annual Expenditure
Clyde £6,118,392
West £12,363,823
North £2,159,156
East £812,712
Scotland £21,454,082
10 Based on the findings from the Residents and Visitors Craft Survey. This gathered expenditure data for the last trip away from home covering berthing fees, fuel, food & drink, accommodation, entertainment, retail, and boat hire (if applicable).
Sailing Tourism in Scotland
14
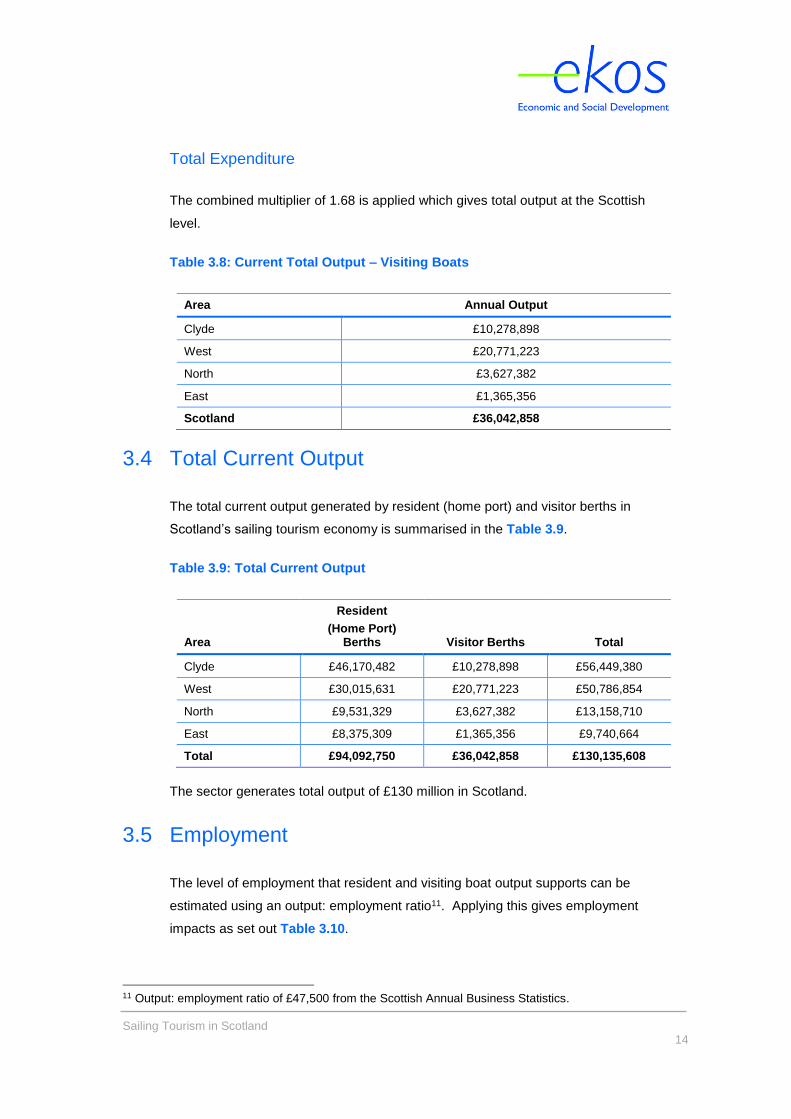
Total Expenditure
The combined multiplier of 1.68 is applied which gives total output at the Scottish
level.
Table 3.8: Current Total Output – Visiting Boats
Area Annual Output
Clyde £10,278,898
West £20,771,223
North £3,627,382
East £1,365,356
Scotland £36,042,858
3.4 Total Current Output
The total current output generated by resident (home port) and visitor berths in
Scotland’s sailing tourism economy is summarised in the Table 3.9.
Table 3.9: Total Current Output
Area
Resident
(Home Port) Berths Visitor Berths Total
Clyde £46,170,482 £10,278,898 £56,449,380
West £30,015,631 £20,771,223 £50,786,854
North £9,531,329 £3,627,382 £13,158,710
East £8,375,309 £1,365,356 £9,740,664
Total £94,092,750 £36,042,858 £130,135,608
The sector generates total output of £130 million in Scotland.
3.5 Employment
The level of employment that resident and visiting boat output supports can be
estimated using an output: employment ratio11. Applying this gives employment
impacts as set out Table 3.10.
11 Output: employment ratio of £47,500 from the Scottish Annual Business Statistics.
Sailing Tourism in Scotland
15
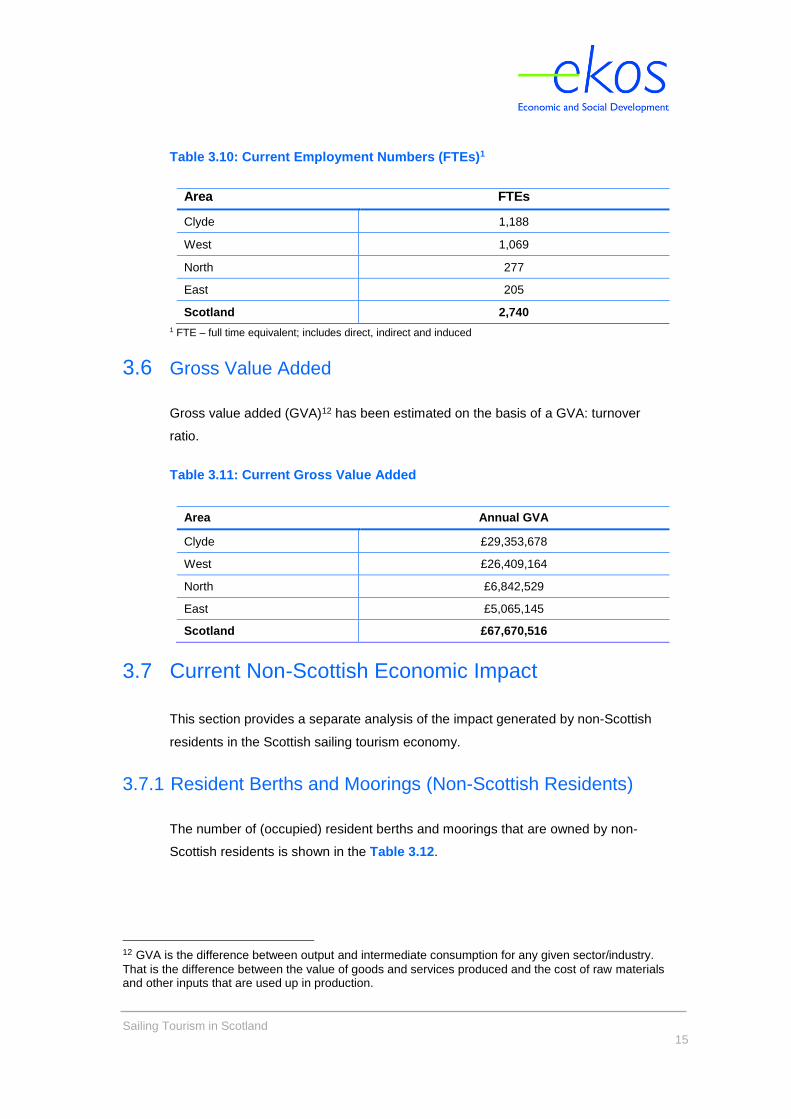
Table 3.10: Current Employment Numbers (FTEs)1
Area FTEs
Clyde 1,188
West 1,069
North 277
East 205
Scotland 2,740
1 FTE – full time equivalent; includes direct, indirect and induced
3.6 Gross Value Added
Gross value added (GVA)12 has been estimated on the basis of a GVA: turnover
ratio.
Table 3.11: Current Gross Value Added
Area Annual GVA
Clyde £29,353,678
West £26,409,164
North £6,842,529
East £5,065,145
Scotland £67,670,516
3.7 Current Non-Scottish Economic Impact
This section provides a separate analysis of the impact generated by non-Scottish
residents in the Scottish sailing tourism economy.
3.7.1 Resident Berths and Moorings (Non-Scottish Residents)
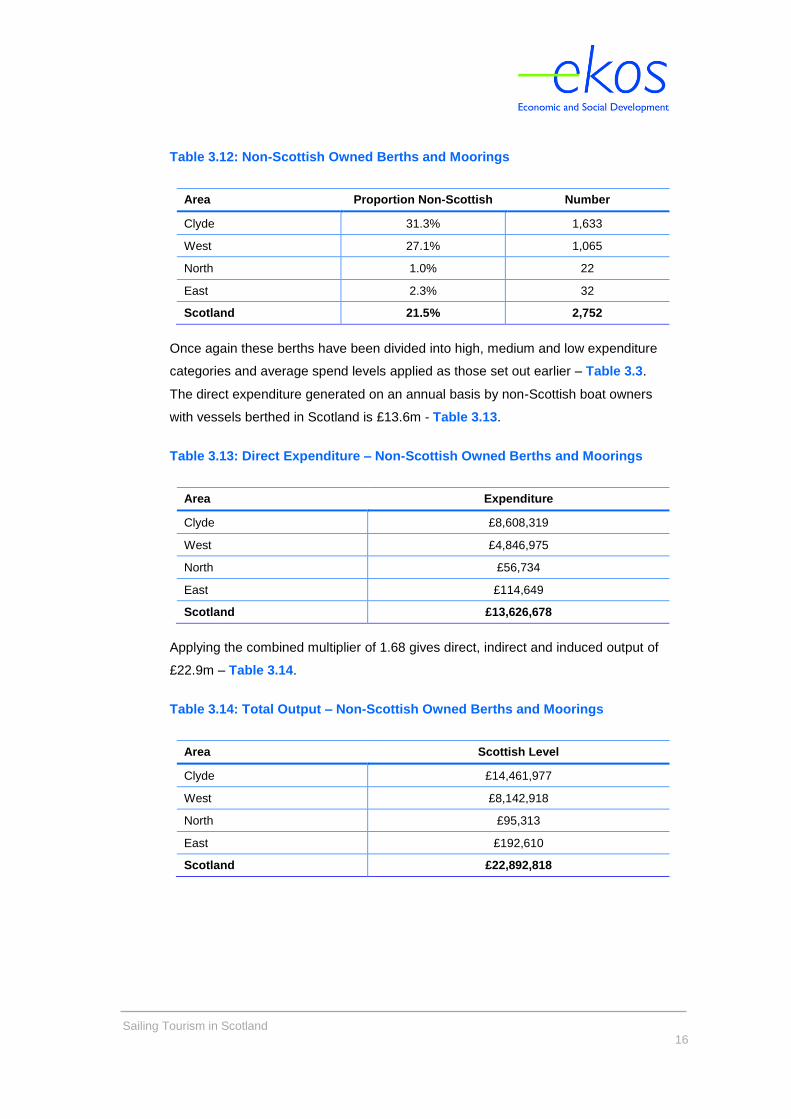
The number of (occupied) resident berths and moorings that are owned by non-
Scottish residents is shown in the Table 3.12.
12 GVA is the difference between output and intermediate consumption for any given sector/industry.
That is the difference between the value of goods and services produced and the cost of raw materials and other inputs that are used up in production.
Sailing Tourism in Scotland
16
Table 3.12: Non-Scottish Owned Berths and Moorings
Area Proportion Non-Scottish Number
Clyde 31.3% 1,633
West 27.1% 1,065
North 1.0% 22
East 2.3% 32
Scotland 21.5% 2,752
Once again these berths have been divided into high, medium and low expenditure
categories and average spend levels applied as those set out earlier – Table 3.3.
The direct expenditure generated on an annual basis by non-Scottish boat owners
with vessels berthed in Scotland is £13.6m - Table 3.13.
Table 3.13: Direct Expenditure – Non-Scottish Owned Berths and Moorings
Area Expenditure
Clyde £8,608,319
West £4,846,975
North £56,734
East £114,649
Scotland £13,626,678
Applying the combined multiplier of 1.68 gives direct, indirect and induced output of
£22.9m – Table 3.14.
Table 3.14: Total Output – Non-Scottish Owned Berths and Moorings
Area Scottish Level
Clyde £14,461,977
West £8,142,918
North £95,313
East £192,610
Scotland £22,892,818
Sailing Tourism in Scotland
17
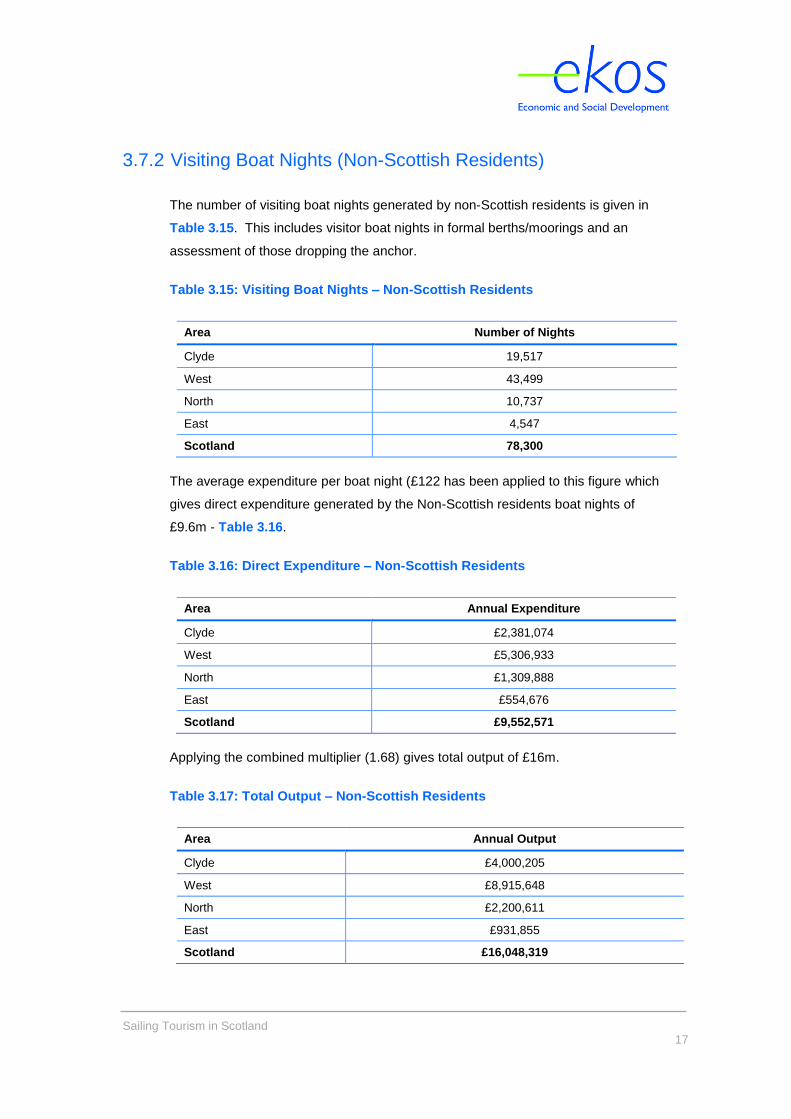
3.7.2 Visiting Boat Nights (Non-Scottish Residents)
The number of visiting boat nights generated by non-Scottish residents is given in
Table 3.15. This includes visitor boat nights in formal berths/moorings and an
assessment of those dropping the anchor.
Table 3.15: Visiting Boat Nights – Non-Scottish Residents
Area Number of Nights
Clyde 19,517
West 43,499
North 10,737
East 4,547
Scotland 78,300
The average expenditure per boat night (£122 has been applied to this figure which
gives direct expenditure generated by the Non-Scottish residents boat nights of
£9.6m - Table 3.16.
Table 3.16: Direct Expenditure – Non-Scottish Residents
Area Annual Expenditure
Clyde £2,381,074
West £5,306,933
North £1,309,888
East £554,676
Scotland £9,552,571
Applying the combined multiplier (1.68) gives total output of £16m.
Table 3.17: Total Output – Non-Scottish Residents
Area Annual Output
Clyde £4,000,205
West £8,915,648
North £2,200,611
East £931,855
Scotland £16,048,319

Sailing Tourism in Scotland
18
3.7.3 Current Total Non-Scottish Resident Output
The total current Non-Scottish Resident output generated by activities associated
with resident berths and visitor berthing activities is £38.9m - Table 3.18.
Table 3.18: Total Output – Non-Scottish Residents
Area Resident Visitor Total
Clyde £14,461,977 £4,000,205 £18,462,181
West £8,142,918 £8,915,648 £17,058,566
North £95,313 £2,200,611 £2,295,925
East £192,610 £931,855 £1,124,466
Total £22,892,818 £16,048,319 £38,941,137
3.7.4 Employment and Gross Value Added
Applying the output: employment and GVA factors set out earlier gives employment
of 820 FTEs and gross value added of £20.2m, as set out in the Tables 3.19 and
3.20.
Table 3.19: Employment Generated by Non-Scottish Residents
Area FTEs
Clyde 389
West 359
North 48
East 24
Scotland 820
Table 3.20: GVA Generated by Non-Scottish Residents
Area Annual GVA
Clyde £9,600,334
West £8,870,454
North £1,193,881
East £584,722
Scotland £20,249,391
Sailing Tourism in Scotland
19
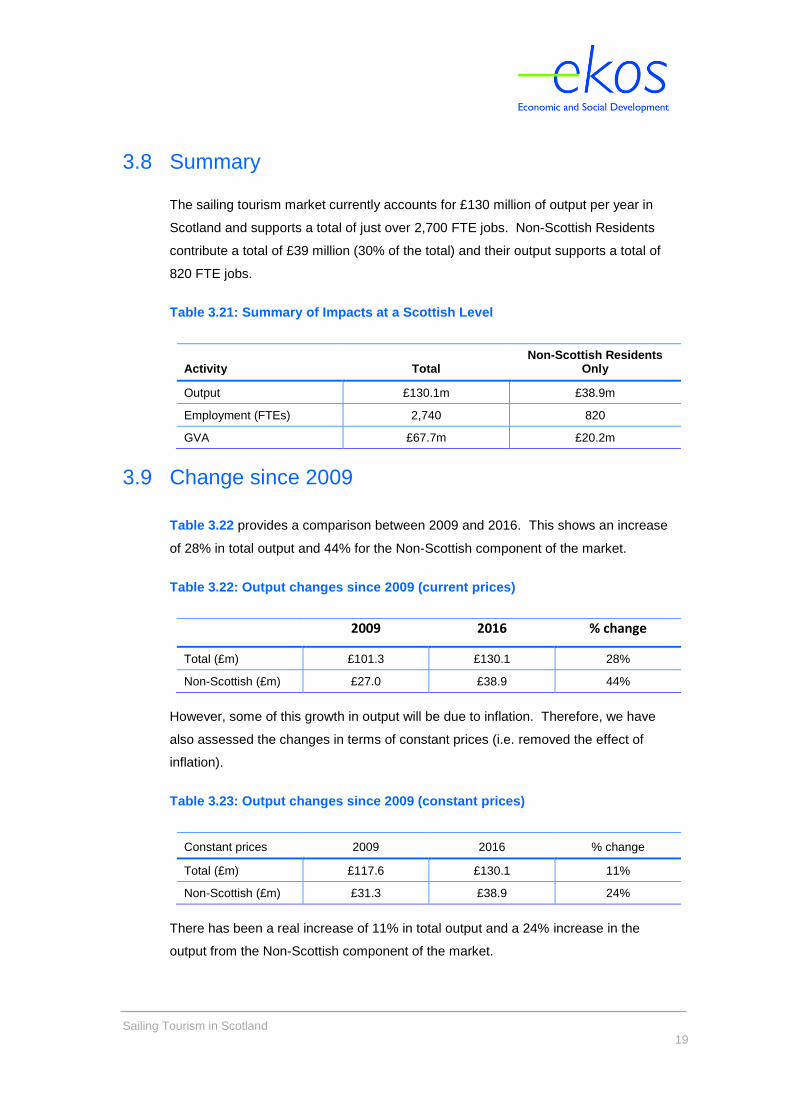
3.8 Summary
The sailing tourism market currently accounts for £130 million of output per year in
Scotland and supports a total of just over 2,700 FTE jobs. Non-Scottish Residents
contribute a total of £39 million (30% of the total) and their output supports a total of
820 FTE jobs.
Table 3.21: Summary of Impacts at a Scottish Level
Activity Total Non-Scottish Residents
Only
Output £130.1m £38.9m
Employment (FTEs) 2,740 820
GVA £67.7m £20.2m
3.9 Change since 2009
Table 3.22 provides a comparison between 2009 and 2016. This shows an increase
of 28% in total output and 44% for the Non-Scottish component of the market.
Table 3.22: Output changes since 2009 (current prices)
2009 2016 % change
Total (£m) £101.3 £130.1 28%
Non-Scottish (£m) £27.0 £38.9 44%
However, some of this growth in output will be due to inflation. Therefore, we have
also assessed the changes in terms of constant prices (i.e. removed the effect of
inflation).
Table 3.23: Output changes since 2009 (constant prices)
Constant prices 2009 2016 % change
Total (£m) £117.6 £130.1 11%
Non-Scottish (£m) £31.3 £38.9 24%
There has been a real increase of 11% in total output and a 24% increase in the
output from the Non-Scottish component of the market.
Sailing Tourism in Scotland
20
4. Resident and Visitors Craft Survey
4.1.1 Background
A survey was undertaken with resident (home port) and visiting boaters. Paper
surveys were distributed to a number of marinas and harbours across Scotland, with
a free postal return envelope enclosed. A survey link was also provided online. The
survey remained open over the course of summer 2016, during which time a total of
242 survey responses13 were received from resident and visiting boaters.
The vast majority of respondents (91%) collected a paper survey at a port of call or
home marina, while 9% were received online.
4.1.2 Respondent Profile
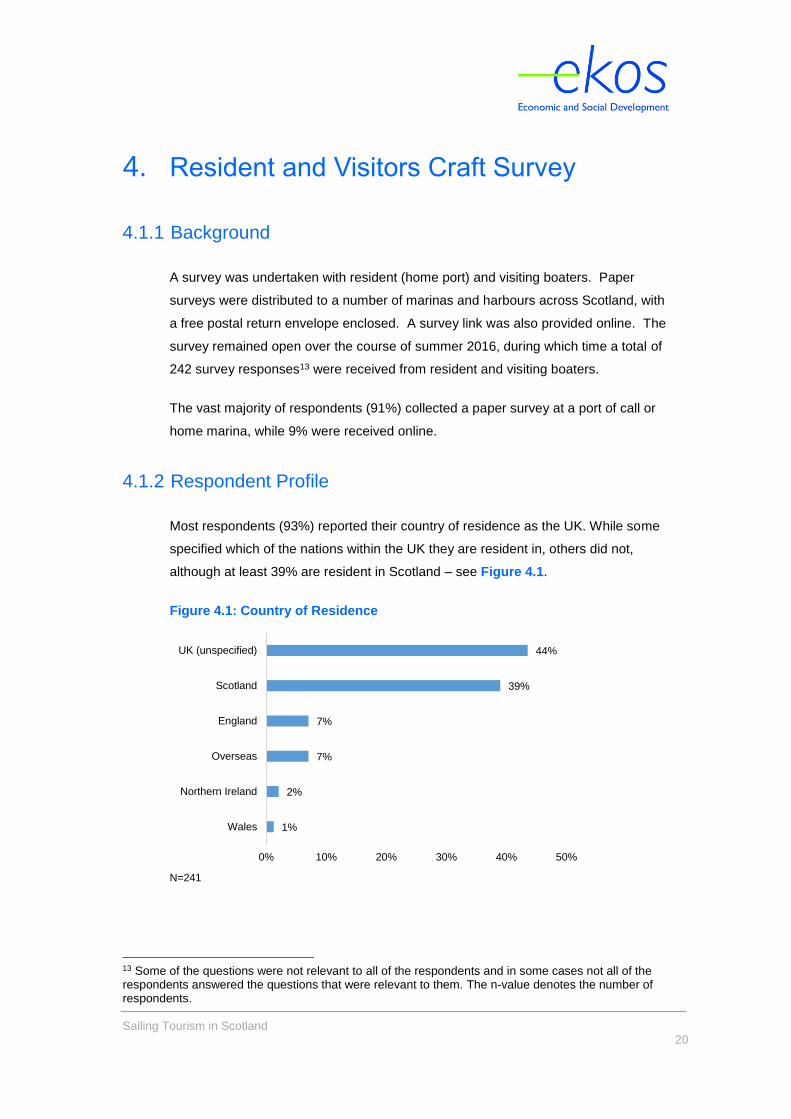
Most respondents (93%) reported their country of residence as the UK. While some
specified which of the nations within the UK they are resident in, others did not,
although at least 39% are resident in Scotland – see Figure 4.1.
Figure 4.1: Country of Residence
N=241
13 Some of the questions were not relevant to all of the respondents and in some cases not all of the respondents answered the questions that were relevant to them. The n-value denotes the number of respondents.
1%
2%
7%
7%
39%
44%
0% 10% 20% 30% 40% 50%
Wales
Northern Ireland
Overseas
England
Scotland
UK (unspecified)
Sailing Tourism in Scotland
21
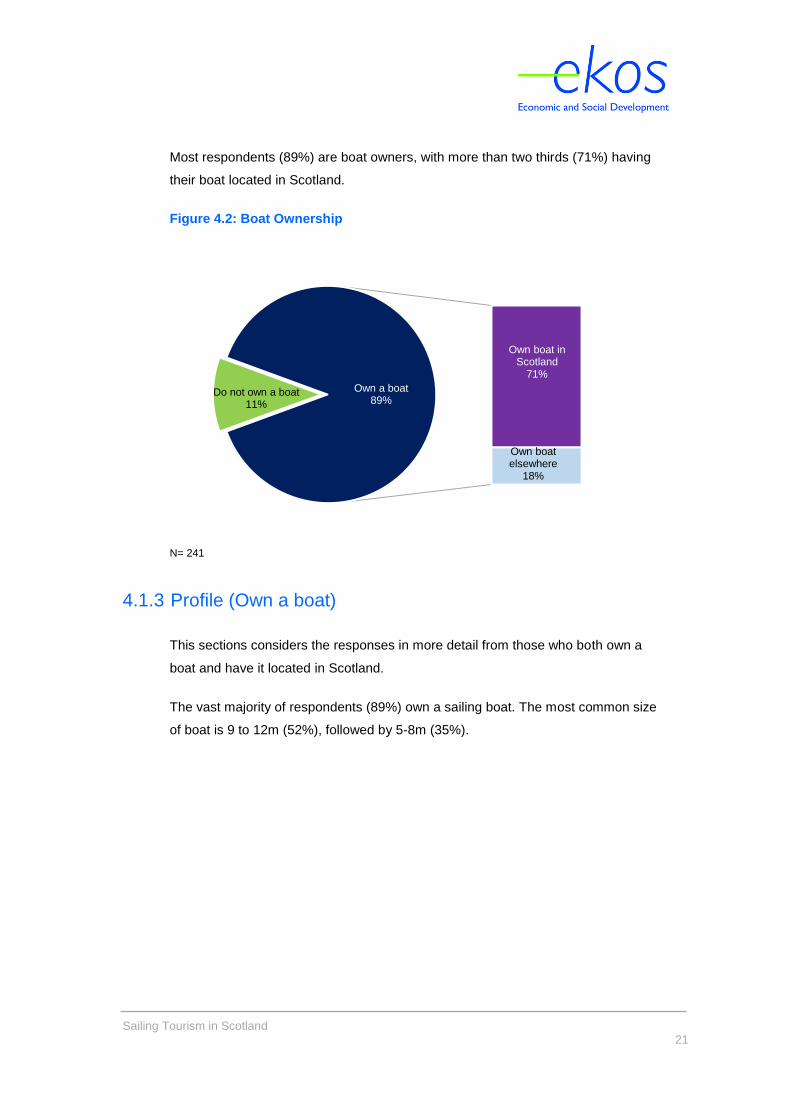
Most respondents (89%) are boat owners, with more than two thirds (71%) having
their boat located in Scotland.
Figure 4.2: Boat Ownership
N= 241
4.1.3 Profile (Own a boat)
This sections considers the responses in more detail from those who both own a
boat and have it located in Scotland.
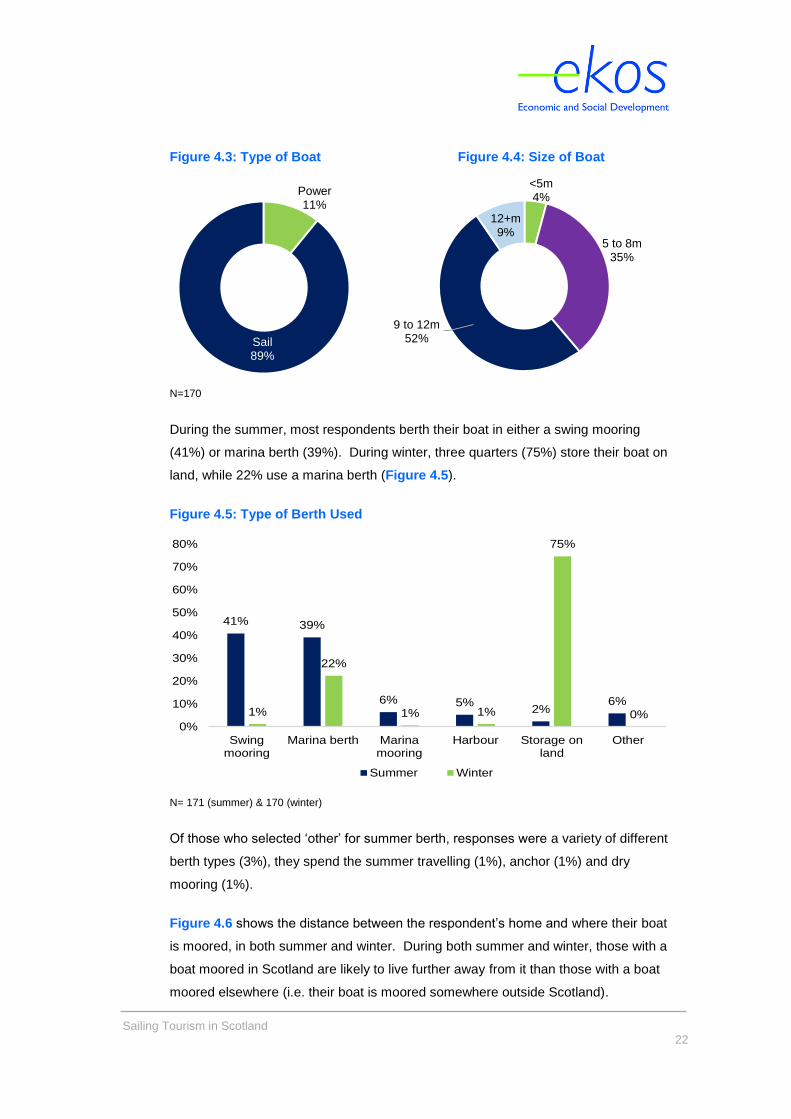
The vast majority of respondents (89%) own a sailing boat. The most common size
of boat is 9 to 12m (52%), followed by 5-8m (35%).
Do not own a boat11%
Own boat in Scotland
71%
Own boat elsewhere
18%
Own a boat89%
Sailing Tourism in Scotland
22
Figure 4.3: Type of Boat Figure 4.4: Size of Boat
N=170
During the summer, most respondents berth their boat in either a swing mooring
(41%) or marina berth (39%). During winter, three quarters (75%) store their boat on
land, while 22% use a marina berth (Figure 4.5).
Figure 4.5: Type of Berth Used
N= 171 (summer) & 170 (winter)
Of those who selected ‘other’ for summer berth, responses were a variety of different
berth types (3%), they spend the summer travelling (1%), anchor (1%) and dry
mooring (1%).
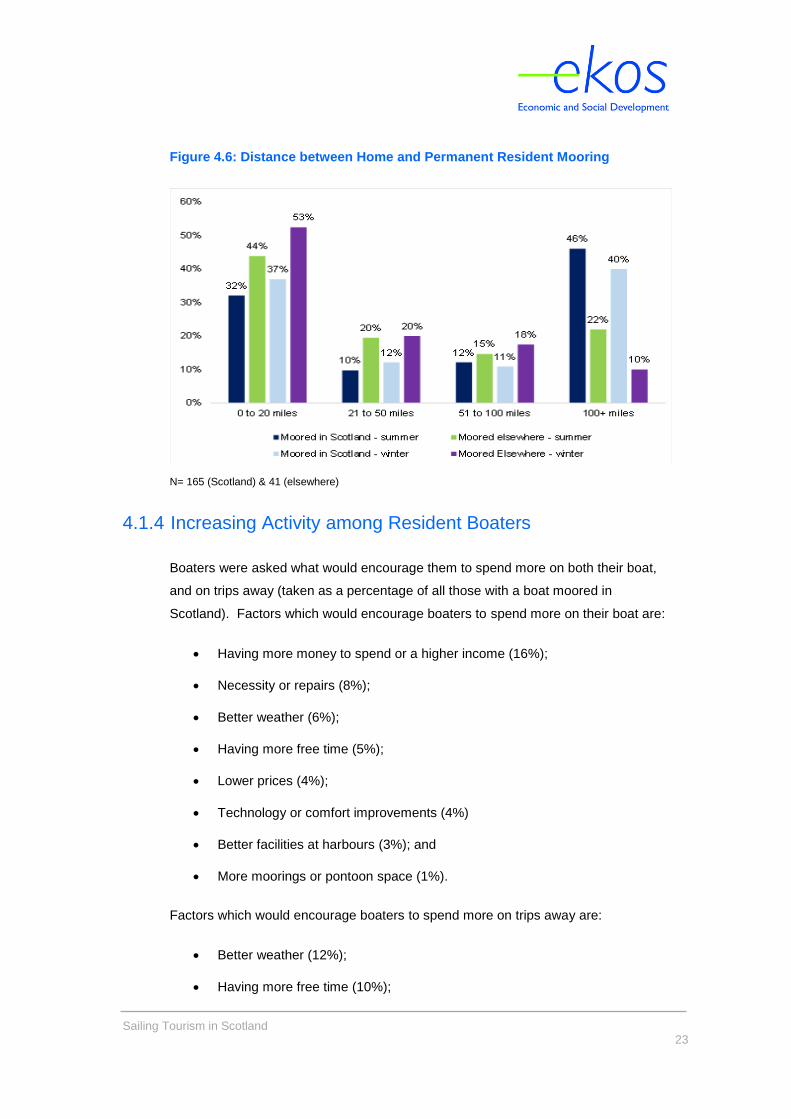
Figure 4.6 shows the distance between the respondent’s home and where their boat
is moored, in both summer and winter. During both summer and winter, those with a
boat moored in Scotland are likely to live further away from it than those with a boat
moored elsewhere (i.e. their boat is moored somewhere outside Scotland).
41% 39%
6% 5%2%
6%1%
22%
1% 1%
75%
0%0%
10%
20%
30%
40%
50%
60%
70%
80%
Swingmooring
Marina berth Marinamooring
Harbour Storage onland
Other
Summer Winter
Power11%
Sail89%
<5m4%
5 to 8m35%
9 to 12m52%
12+m9%
Sailing Tourism in Scotland
23
Figure 4.6: Distance between Home and Permanent Resident Mooring
N= 165 (Scotland) & 41 (elsewhere)
4.1.4 Increasing Activity among Resident Boaters
Boaters were asked what would encourage them to spend more on both their boat,
and on trips away (taken as a percentage of all those with a boat moored in
Scotland). Factors which would encourage boaters to spend more on their boat are:
Having more money to spend or a higher income (16%);
Necessity or repairs (8%);
Better weather (6%);
Having more free time (5%);
Lower prices (4%);
Technology or comfort improvements (4%)
Better facilities at harbours (3%); and
More moorings or pontoon space (1%).
Factors which would encourage boaters to spend more on trips away are:
Better weather (12%);
Having more free time (10%);
Sailing Tourism in Scotland
24
Having more money to spend or a higher income (8%);
Better facilities at harbours (7%);
More moorings or pontoon space (5%);
Lower prices (4%); and
More crew availability (1%).
Some of the main factors relate to personal circumstances (more money and free
time) or the weather which those involved in the sector have no control over.
However, some of the others factors could be influenced by those in the sector e.g.
better facilities, mooring and pontoon space.
If boaters wish to relocate their resident berth/mooring to a different location but
have not, the key factors preventing them from doing so are the:
Distance (11%);
Cost (11%);
Lack of facilities at their desired location (8%); and
Availability of space (6%).
Again certain factors such as distance would be difficult to influence but others could
such as facilities and availability of space.
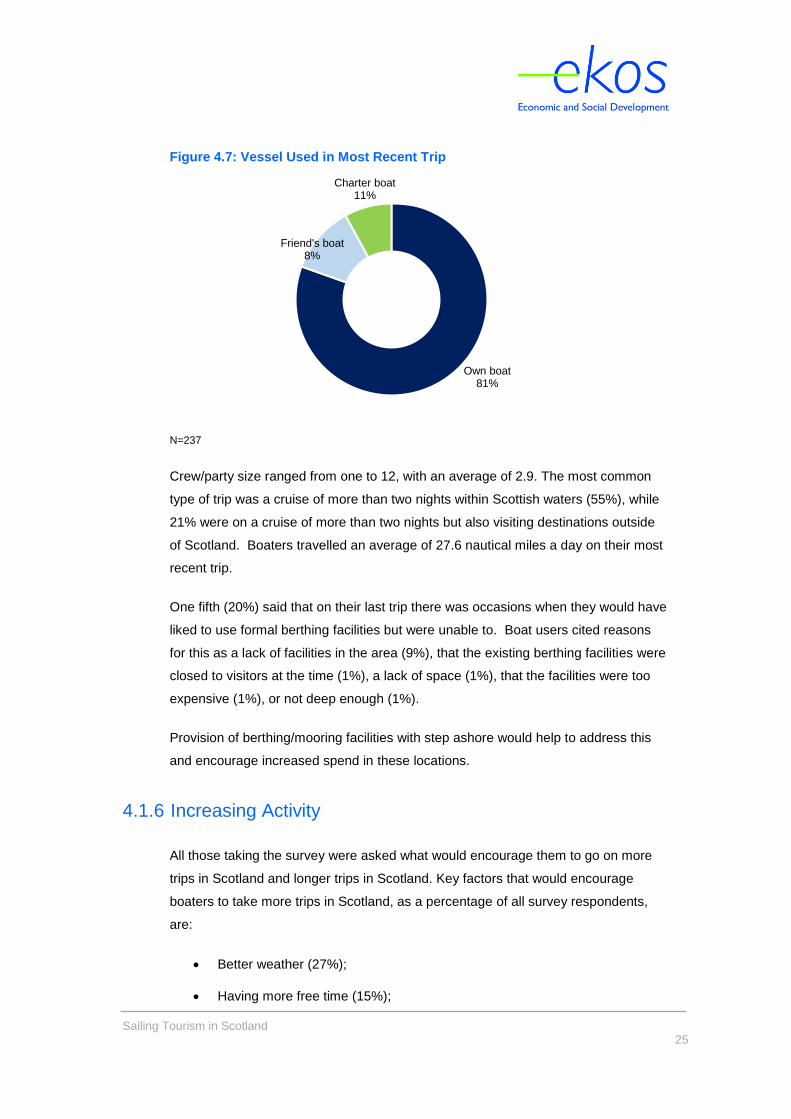
4.1.5 Details of Most Recent Trip
The survey asked boaters for specific details about their most recent sailing or
motorised boat trip in Scotland or, if on their first trip in Scotland, the details of their
current cruise. As Figure 4.7 shows, four fifths (81%) used their own boat for their
trip.
Sailing Tourism in Scotland
25
Figure 4.7: Vessel Used in Most Recent Trip
N=237
Crew/party size ranged from one to 12, with an average of 2.9. The most common
type of trip was a cruise of more than two nights within Scottish waters (55%), while
21% were on a cruise of more than two nights but also visiting destinations outside
of Scotland. Boaters travelled an average of 27.6 nautical miles a day on their most
recent trip.
One fifth (20%) said that on their last trip there was occasions when they would have
liked to use formal berthing facilities but were unable to. Boat users cited reasons
for this as a lack of facilities in the area (9%), that the existing berthing facilities were
closed to visitors at the time (1%), a lack of space (1%), that the facilities were too
expensive (1%), or not deep enough (1%).
Provision of berthing/mooring facilities with step ashore would help to address this
and encourage increased spend in these locations.
4.1.6 Increasing Activity
All those taking the survey were asked what would encourage them to go on more
trips in Scotland and longer trips in Scotland. Key factors that would encourage
boaters to take more trips in Scotland, as a percentage of all survey respondents,
are:
Better weather (27%);
Having more free time (15%);
Own boat81%
Charter boat11%
Friend's boat8%

Sailing Tourism in Scotland
26
Better boating facilities (6%);
More pontoon spaces (3%);
More harbours/marinas (2%); and
Having a higher income or more spending money (2%).
Key factors that would encourage boaters to go on longer trips in Scotland are:
Better weather (17%);
Having more free time (14%);
Better boating facilities (5%);
More pontoon spaces (3%);
Lower prices (3%); and
More harbours/marinas (2%).
Again, whilst the main factors are outwith the influence of the sector others are not
such as facilities/pontoon spaces.
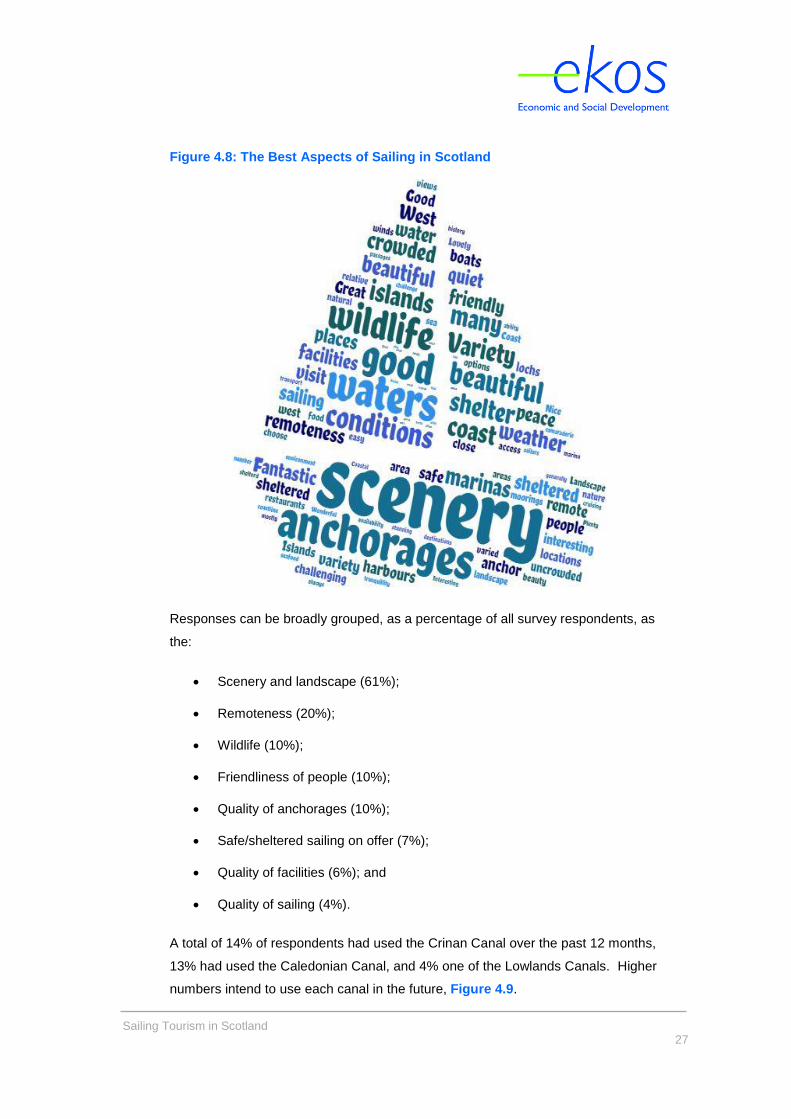
Boaters provided a wide range of reasons when asked to comment on what the best
aspects of sailing and boating are in Scotland. Their responses are summarised in
the world cloud, Figure 4.8.
Sailing Tourism in Scotland
27
Figure 4.8: The Best Aspects of Sailing in Scotland
Responses can be broadly grouped, as a percentage of all survey respondents, as
the:
Scenery and landscape (61%);
Remoteness (20%);
Wildlife (10%);
Friendliness of people (10%);
Quality of anchorages (10%);
Safe/sheltered sailing on offer (7%);
Quality of facilities (6%); and
Quality of sailing (4%).
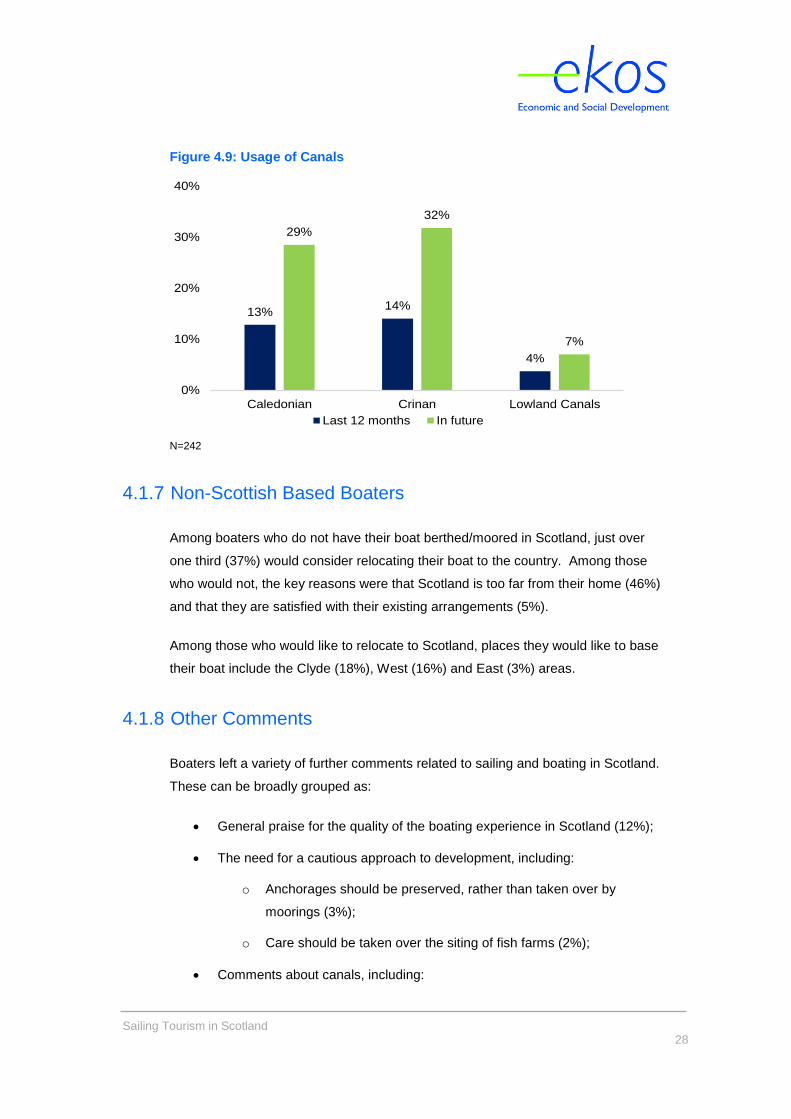
A total of 14% of respondents had used the Crinan Canal over the past 12 months,
13% had used the Caledonian Canal, and 4% one of the Lowlands Canals. Higher
numbers intend to use each canal in the future, Figure 4.9.
Sailing Tourism in Scotland
28
Figure 4.9: Usage of Canals
N=242
4.1.7 Non-Scottish Based Boaters
Among boaters who do not have their boat berthed/moored in Scotland, just over
one third (37%) would consider relocating their boat to the country. Among those
who would not, the key reasons were that Scotland is too far from their home (46%)
and that they are satisfied with their existing arrangements (5%).
Among those who would like to relocate to Scotland, places they would like to base
their boat include the Clyde (18%), West (16%) and East (3%) areas.
4.1.8 Other Comments
Boaters left a variety of further comments related to sailing and boating in Scotland.
These can be broadly grouped as:
General praise for the quality of the boating experience in Scotland (12%);
The need for a cautious approach to development, including:
o Anchorages should be preserved, rather than taken over by
moorings (3%);
o Care should be taken over the siting of fish farms (2%);
Comments about canals, including:
13%14%
4%
29%
32%
7%
0%
10%
20%
30%
40%
Caledonian Crinan Lowland Canals
Last 12 months In future
Sailing Tourism in Scotland
29
o Transit fees are too expensive (2%);
o Facilities/service needs improved (2%);
o Praise for the canal experience and staff (1%);
Comments about boating facilities:
o Encouraging new pontoons/moorings (2%);
o Encouraging other new/improved supporting facilities (2%); and
Other, non-maritime elements of the tourism/hospitality industry in Scotland
need to improve (2%).
4.2 Charter Survey
We undertook a survey of 14 charter companies. The key findings from these
discussions are set out below.
The Offer
The high season tends to run from mid-May to August and the shoulder and low
season from early April to mid-May and the end of August to the end of October.
The hire can either be with a skipper or without (bareboat charter). Occupancy
levels averaged at high season – 88%, shoulder season – 68% and low season –
36%. The main market is solely for leisure cruising but some companies do provide
other activities such as diving and fishing. Some also offer onshore visits e.g.
distilleries to differentiate themselves from the competition.
Customer Profile
The average length of charter is six days with an average of seven people (including
crew). The breakdown of origin is broadly 35% Scottish, 45% English and 20%
other UK and overseas. There are good levels of repeat business at between 40-
50%.
Sailing Tourism in Scotland
30
Popular Destinations
The destinations that are most popular are along the West coast with the Clyde and
Mull proving very popular followed by those prepared to travel further afield including
the Outer Hebrides and Orkney. On the East coast the Moray Firth and Firth of
Forth are the main destinations.
Facilities
Identification of areas where development of facilities would be appealing to the
charter companies included Inverness/Loch Ness and the Moray Firth, and onshore
facilities in the Oban area. Moorings in Kilchattan Bay on Bute and Tighnabruaich
were mentioned as being of interest, and development of a marina north of Mallaig.
Castlebay on Barra was also mentioned as an area that would be of interest if
development was to take place there. On the East coast the general consensus was
that more regular dredging of the harbours and more moorings would make the area
more appealing to them.
Future Growth
None of the companies are currently planning to add craft to their fleet rather where
growth was planned this was in terms of increasing the number of destinations on
offer and looking to increase the uptake in the shoulder months.
Sailing Tourism in Scotland
31
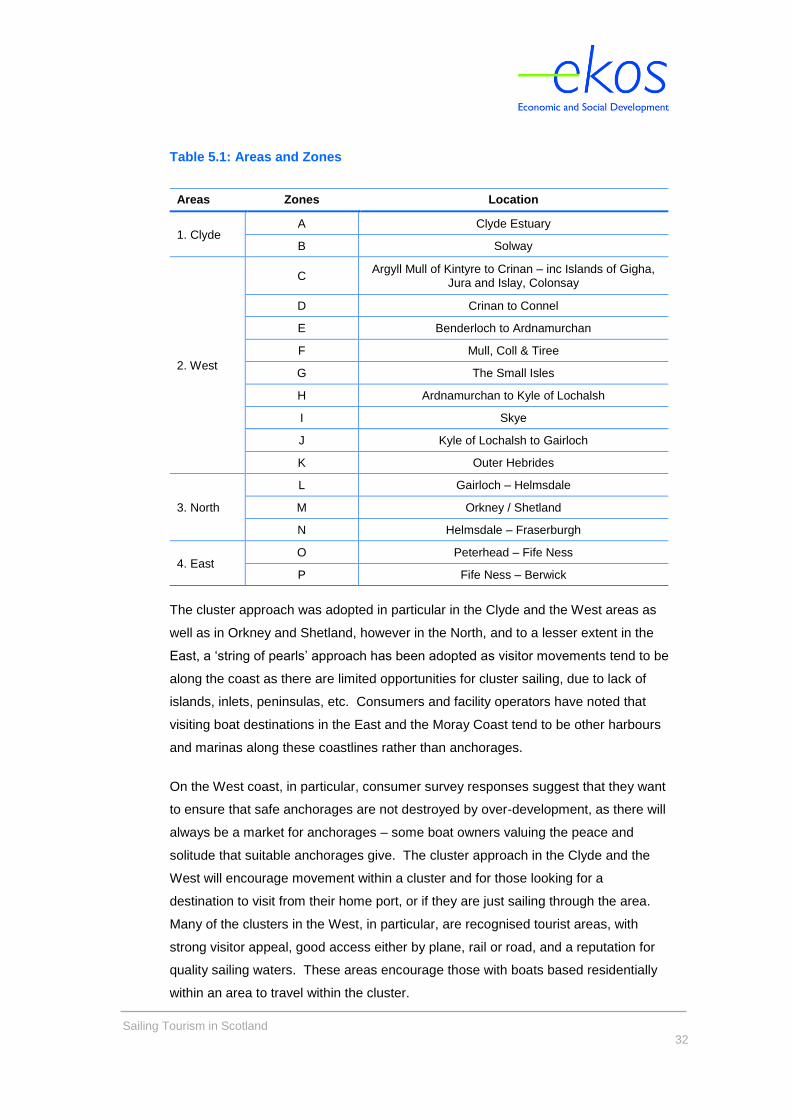
5. The Future – Pontoons and Moorings
5.1 Introduction
This Chapter sets out the potential strategic sailing opportunities across Scotland
and has largely been based on the cluster approach first highlighted in the 2010
report, but adapted as appropriate. Each future sailing location has been
categorised as a sail from, sail to or sail through destination, based on the key focus
of its sailing function:
Sail from: those sailing facilities that have a focus of resident
berths/moorings;
Sail to: sailing destinations for visiting yachts; and
Sail through: strategic staging posts for yachts to stop at, whilst travelling
both to and from sailing destinations.
It is important to note that strategic resident hubs are largely sail from facilities and
help to drive demand for sail to and sail through locations, particularly to island
locations where fragile rural economies are boosted by spend from visiting yachts
and their crew.
5.2 Approach
In the 2010 report a geographic segmentation was agreed. Scotland was divided
into four areas, Clyde, West, North and East with further subdivision into 10
individual ‘Activity Zones’ to help guide the research process. However for this
report, to help better identify the future opportunities, we have broken down the
Zones further to reflect both the geographical nature of the coastline and the habits
of sailing visitors. As a result we have broken down the West into nine zones rather
than the three as in the original 2010 report. The other seven zones in Clyde, East
and North remain as previously – Table 5.1.
Sailing Tourism in Scotland
32
Table 5.1: Areas and Zones
Areas Zones Location
1. Clyde A Clyde Estuary
B Solway
2. West
C Argyll Mull of Kintyre to Crinan – inc Islands of Gigha,
Jura and Islay, Colonsay
D Crinan to Connel
E Benderloch to Ardnamurchan
F Mull, Coll & Tiree
G The Small Isles
H Ardnamurchan to Kyle of Lochalsh
I Skye
J Kyle of Lochalsh to Gairloch
K Outer Hebrides
3. North
L Gairloch – Helmsdale
M Orkney / Shetland
N Helmsdale – Fraserburgh
4. East O Peterhead – Fife Ness
P Fife Ness – Berwick
The cluster approach was adopted in particular in the Clyde and the West areas as
well as in Orkney and Shetland, however in the North, and to a lesser extent in the
East, a ‘string of pearls’ approach has been adopted as visitor movements tend to be
along the coast as there are limited opportunities for cluster sailing, due to lack of
islands, inlets, peninsulas, etc. Consumers and facility operators have noted that
visiting boat destinations in the East and the Moray Coast tend to be other harbours
and marinas along these coastlines rather than anchorages.
On the West coast, in particular, consumer survey responses suggest that they want
to ensure that safe anchorages are not destroyed by over-development, as there will
always be a market for anchorages – some boat owners valuing the peace and
solitude that suitable anchorages give. The cluster approach in the Clyde and the
West will encourage movement within a cluster and for those looking for a
destination to visit from their home port, or if they are just sailing through the area.
Many of the clusters in the West, in particular, are recognised tourist areas, with
strong visitor appeal, good access either by plane, rail or road, and a reputation for
quality sailing waters. These areas encourage those with boats based residentially
within an area to travel within the cluster.
Sailing Tourism in Scotland
33
There is a strategic importance in the future development of key resident hubs
further north in Scotland to help drive future demand to sail to destinations.
The consumer survey identified an average sailing distance of approximately 25 to
30 nautical miles covered in a day by a sailing vessel. This is an important strategic
consideration in the positioning of strategic clusters, homeports and visiting
destinations. Our approach to identifying opportunities was then to establish a
balance of the three forms of location within each cluster or a facility on the string of
pearls.
Having established strategic facilities, it was then a case of identifying linkages to
encourage movement between them, thus maximising each area’s destination
credentials and boosting potential visitor spend ashore.
5.3 Project Developments
We consulted a range of sources to identify proposed opportunities including council
planning departments, planning web portals, HIE, Coastal Communities projects,
etc. However, our approach is not to assess each of these individual developments
but rather to identify a range of strategic geographical opportunities whilst taking
cognisance of proposed and aspirational developments.
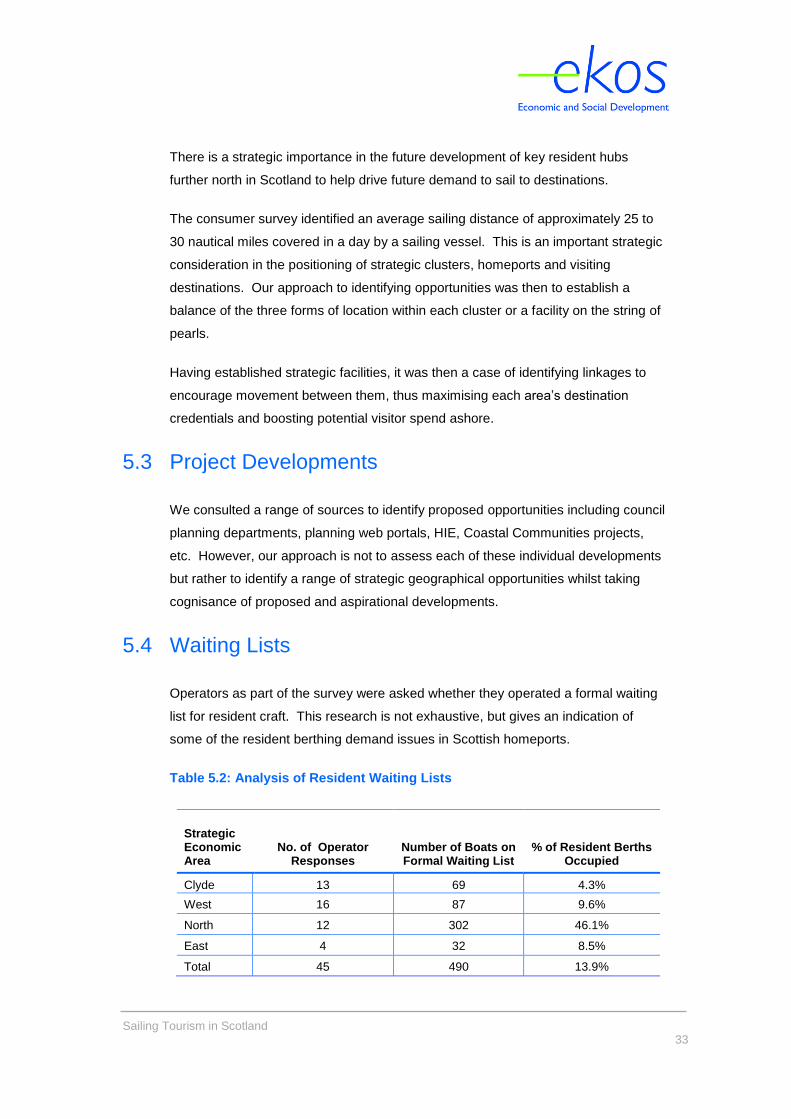
5.4 Waiting Lists
Operators as part of the survey were asked whether they operated a formal waiting
list for resident craft. This research is not exhaustive, but gives an indication of
some of the resident berthing demand issues in Scottish homeports.
Table 5.2: Analysis of Resident Waiting Lists
Strategic Economic Area
No. of Operator Responses
Number of Boats on Formal Waiting List
% of Resident Berths Occupied
Clyde 13 69 4.3%
West 16 87 9.6%
North 12 302 46.1%
East 4 32 8.5%
Total 45 490 13.9%
Sailing Tourism in Scotland
34
In the Clyde area, the Solway zone has waiting lists at Stranraer, Kirkcudbright, and
Portpatrick. However a larger development is required at Stranraer and significant
dredging at Kirkcudbright is unlikely and perhaps impractical.
In the West area from the operator responses, resident boat waiting lists are in
operation at Oban, Ardfern, Plockton, Crinan, Dallens Bay and Gairloch.
The North area along the Moray Coast has the greatest apparent number of boats
on waiting lists of marine facilities. There is evidence that additional facilities are
needed in this area and they would be filled. However, what is not clear from this
analysis is the number of boat owners registered on more than one facility waiting
list. The sail to facilities in this area are mainly the harbours along the Moray coast
which are used by resident boats sailing between them.
The waiting lists identified in the East area are at Peterhead and Stonehaven.
If a facility could be developed at Aberdeen, it is likely to be in high demand from
both residents and visitors, albeit there is a significant amount of commercial oil and
ferry traffic and a marina may be limited in scale or costly to develop. There is a
strategic gap in visitor provision at Aberdeen.
5.5 Physical Gaps in the Supply of Berths and Moorings
and Other Facilities
The consumer survey element of this study identified that boat owners on average
travel 25 to 30 nautical miles on a day’s sail. The Cool Route survey identified this
as around 25 nautical miles.
Our consumer survey noted that safe, well protected berthings or anchorages and
good shore access to Scottish island locations, in particular, were seen to be of
paramount importance in choosing a destination to berth at. Boat owners are
primarily motivated to use a destination because of its safe berthing rather than the
provision of shore-side facilities e.g. toilets, showers, and fuel or refreshment
facilities.
Sailing Tourism in Scotland
35
There is no doubt that those destinations close to sail from hubs that are viewed as
visitor destinations and provide a good range of ancillary facilities are visited more
often and the visitor expenditure is very welcome, in what can be rather fragile rural
communities. What is apparent from the consumer survey is that ancillary facilities
in some locations would just be nice to have, but do not have to be provided at each,
and every 25 nautical mile stopping point.
On a longer cruiser, however, it is important that these facilities are available within
the wider area. Visiting sailors, in the main, seem to be well-versed where these
ancillary facilities are located and publications such as Welcome Anchorages
provide valuable information. As a result there were very few visitor demands other
than safe berthing identified in the consumer survey. However, when sailors were
asked about their home port facility their wants/wish lists were far broader.
We have produced a map of the supply of berthing facilities. This is produced using
a radius around each facility of 12.5 miles which would be the facility’s area of
influence for a typical sailor’s day’s travel.
As a result of this assumption, the overlap of facilities was visualised. If adjoining
facilities were 25 miles apart and each had an influence radius of 12.5 miles a boat
would be never more than 12.5 miles from a facility. This analysis was rather
inconclusive but did reveal that there are potentially only two strategic supply gaps:
one at the southern and western side of Mull; and along the North East coast
between Peterhead and Fife Ness, ideally at Aberdeen. However given the
commercial activities of the oil sector at Aberdeen this is not likely to be practical.
The remainder of the coastline is well covered with berthing facilities from a visual
perspective.
5.6 The Scoring Matrix Criteria
We used the information gleaned from the operator and visitor surveys, as well as
from the planning enquiries, overlaid with the strategic approach of developing
sailing clusters (sail from, sail to and sail through) and string of pearls approach
along the North and East coasts, to identify and rank the strategic significance of
potential development locations. The assessment was based on our independent
assessment of the future market opportunities. It was necessary to develop a
scoring matrix to assess the potential strategic locations.
Sailing Tourism in Scotland
36
Potential market opportunities were scored for the Zones and each location was
scored on a scale of 1 to 5 across 5 criteria (5 being the highest).
Each of the strategic market opportunities was scored against the following five
criteria (in terms of future potential):
Resident market demand: this is the potential demand for sailing facilities
that will be generated by the resident boats i.e. those that would have their
boat reside/based there rather than themselves necessarily being resident
there;
Visitor market demand: this refers to the potential market demand that a
location will generate among the visiting sailing market if the proposed
development were to go ahead. This would include visiting boats from
outwith the area, and resident boats away from their home base on day and
overnight trips;
Strategically important: fills or enhances a locational or product gap (sail
times, etc.). This reflects the planned development’s ability to plug a sailing
gap / complete the sailing route either within the cluster or as a connecting
destination between clusters. This category is scored on its strategic
importance;
Links to local economy: this is the opportunity and ease to spend when
sailors step ashore. A planned development which is close to a local
community (shops, bars, etc.) will score higher as they will be better placed
to service the sailing market; and
Catalytic effect: this refers to the potential for the proposed development to
create opportunities for further business development both on site and within
the local community. This can be achieved through the attraction of new
business to the location, or by specifically complementing and optimising
existing offerings.
The total score that a location achieves determines its strategic position/importance
as a sailing market opportunity within Scotland. It should be noted that this is an
assessment of the future market opportunity only and gives a future framework for
potential development. Assessment of individual projects was outwith the scope of
this study.
Sailing Tourism in Scotland
37
Considerations for individual developments will include: the project promoter, the
physical feasibility, the development cost, the environmental impact, the ability to
achieve planning permission, and fundability of the development. All of these issues
would have to be considered before any individual project can come to fruition.
5.7 The Scoring Matrix
Tables 5.3 to 5.22 present the summary scores for each of the potential
opportunities in the 16 Zones for development as either clusters or strings of pearls.
The consultants have also given a priority to each of the strategic market
opportunities, green (high) priority and amber (medium) priority. However, individual
projects would each have to be tested on their own merits to meet the strategic
goals, on viability and cost effectiveness, etc.
In addition the consultants have prepared two potential market growth scenarios,
Scenario A - the most likely and Scenario B - more optimistic. These growth
scenarios have been based on a detailed build-up of strategic sail from hubs, sail
through and sail to facilities in each of the zones.
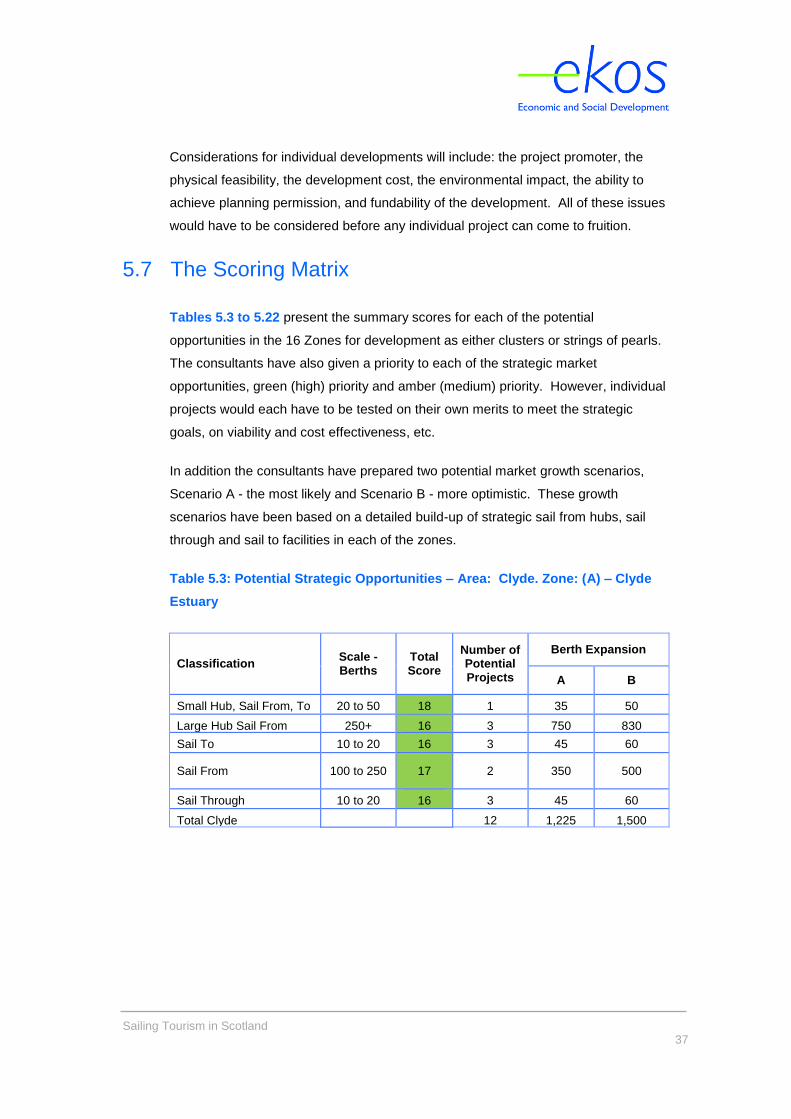
Table 5.3: Potential Strategic Opportunities – Area: Clyde. Zone: (A) – Clyde
Estuary
Classification Scale - Berths
Total Score
Number of Potential Projects
Berth Expansion
A B
Small Hub, Sail From, To 20 to 50 18 1 35 50
Large Hub Sail From 250+ 16 3 750 830
Sail To 10 to 20 16 3 45 60
Sail From 100 to 250 17 2 350 500
Sail Through 10 to 20 16 3 45 60
Total Clyde 12 1,225 1,500
Sailing Tourism in Scotland
38
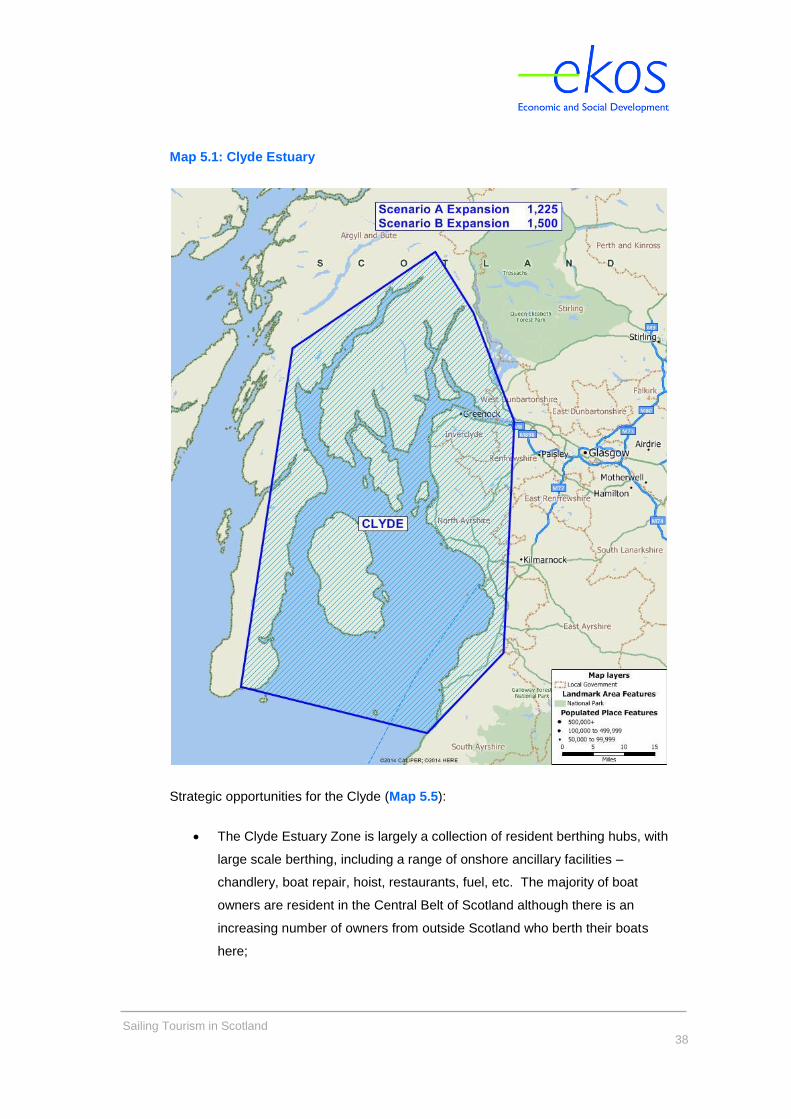
Map 5.1: Clyde Estuary
Strategic opportunities for the Clyde (Map 5.5):
The Clyde Estuary Zone is largely a collection of resident berthing hubs, with
large scale berthing, including a range of onshore ancillary facilities –
chandlery, boat repair, hoist, restaurants, fuel, etc. The majority of boat
owners are resident in the Central Belt of Scotland although there is an
increasing number of owners from outside Scotland who berth their boats
here;
Sailing Tourism in Scotland
39
It is anticipated that there is still potential growth in boat ownership and the
propensity for non-Scottish residents to berth here will increase as prices
continue to rise in southern England. The lower cost due to a weak pound
encourages people to berth in the UK rather than overseas. There is still
therefore an opportunity to increase the number of resident sail from hubs in
the Clyde;
Lamlash had the most mentions in our consumer survey as a location for
visitor moorings and pontoons, followed by Tarbert Loch Fyne, Brodick and
Millport for visitor pontoons. Lochranza was also mentioned. Strategically
the Clyde Estuary Zone would benefit from more sail to and sail through
destinations, places for the increasing number of resident boat owners to
visit, such as Arran, Kyles of Bute, Loch Fyne, etc. In recent years this has
been witnessed with the development and success of the facilities at
Portavadie;
Arran is strategically important as a sail to destination and facilities should
be upgraded and extended where practical, and mooring association
facilities should, if possible, be upgraded with cost effective, small pontoon
developments, ensuring good landing facilities and access to the shore.
This would also enable a small resident sail from facility to be formalised and
strengthen the sail to destinations on the island. It is important that the
yacht facilities are properly linked to the wider destination to maximise
benefit;
The Crinan Canal is an important link for west coast sailing and the safe
strategic sail through point at Ardrishaig should be built upon;
Resident demand for the Clyde Estuary in the future will continue to grow so
there are opportunities to extend existing facilities where possible, and
extend the offer northwards towards Greenock and Glasgow and also in the
southern reaches. There are possibilities in the future for larger scale
projects to come to fruition if space can be made available and cost effective
solutions can be ensured, particularly along the Ayrshire Coast;
There are opportunities on the Clyde’s Argyll Coast for the siting of a larger
resident marina, as many parts of the coastline are easily accessible to the
Central Belt via ferry; and
Sailing Tourism in Scotland
40
Campbeltown is strategically important for visitors as a gateway to non-
Scottish visitors from the south and west, particularly Ireland. If practical,
the berthing facilities here should be extended.
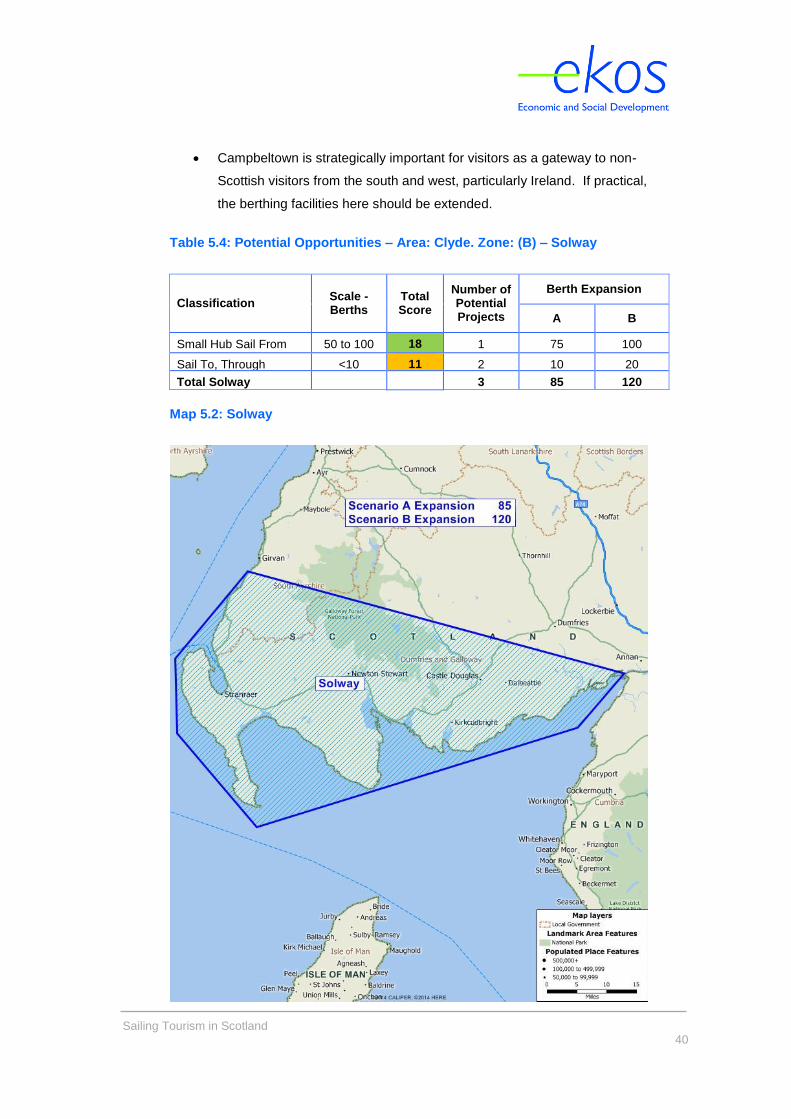
Table 5.4: Potential Opportunities – Area: Clyde. Zone: (B) – Solway
Classification Scale - Berths
Total Score
Number of Potential Projects
Berth Expansion
A B
Small Hub Sail From 50 to 100 18 1 75 100
Sail To, Through <10 11 2 10 20
Total Solway 3 85 120
Map 5.2: Solway
Sailing Tourism in Scotland
41
Strategic opportunities for the Solway (Map 5.2):
Stranraer is strategically important both as a resident hub and as a sail
through – a gateway for yachts entering Scottish waters from the south and
links to Ireland, so a cost effective solution to extending the berthing
provision should be encouraged. There is an aspiration to extend Stranraer
Marina and this makes strategic sense both as a resident hub and as a
gateway facility assuming it is part of a larger development to regenerate the
waterfront and the now disused ferry terminal.
The Solway Firth is a difficult proposition for future development or
expansion of visitor facilities with small silted harbours and river estuaries
that are very tidal. Dredging is unlikely to be cost effective and there are
perhaps small scale berthing additions that could be made along the Solway
coast at existing locations; and
The consumer survey mentioned that more visitor moorings would be
beneficial along the Mull of Galloway Coast and at Portpatrick, in particular.
These would be strategically important facilities as sail to and through
destinations for English and Irish boats and give additional links to the Isle of
Man to the south. This may be difficult to achieve, given the coastal
conditions and limited size of harbour places for safe berthing, etc.
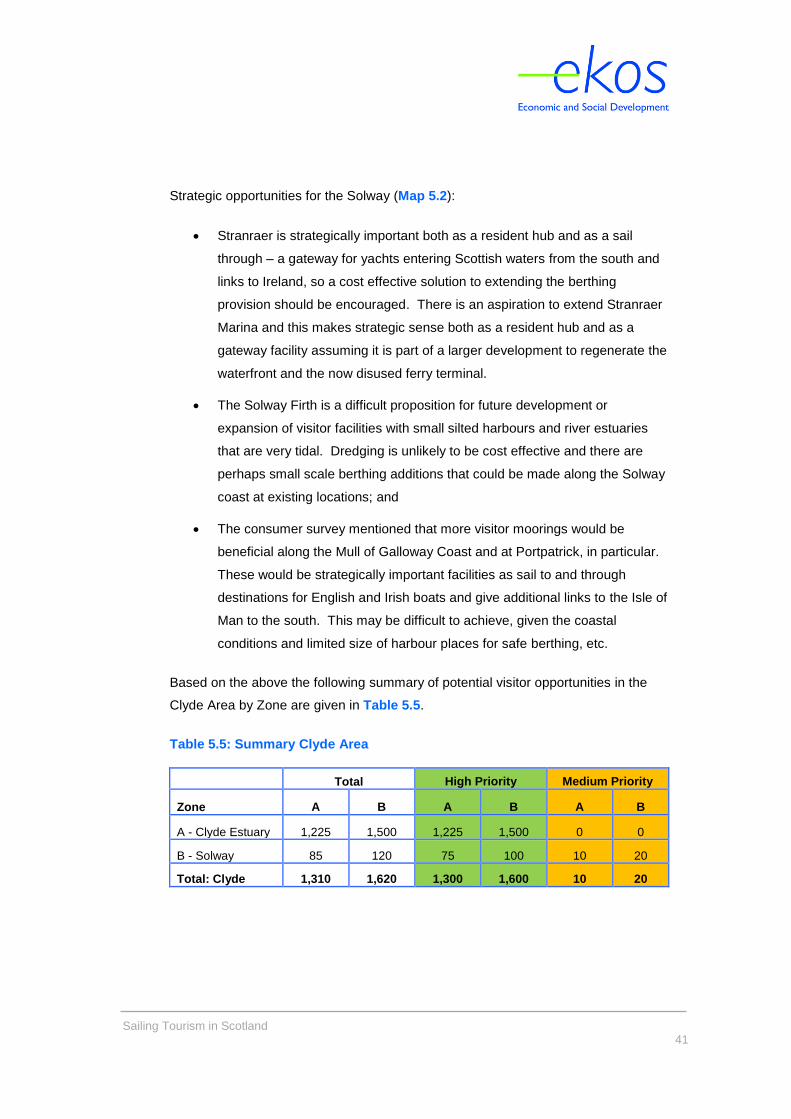
Based on the above the following summary of potential visitor opportunities in the
Clyde Area by Zone are given in Table 5.5.
Table 5.5: Summary Clyde Area
Total High Priority Medium Priority
Zone A B A B A B
A - Clyde Estuary 1,225 1,500 1,225 1,500 0 0
B - Solway 85 120 75 100 10 20
Total: Clyde 1,310 1,620 1,300 1,600 10 20
Sailing Tourism in Scotland
42
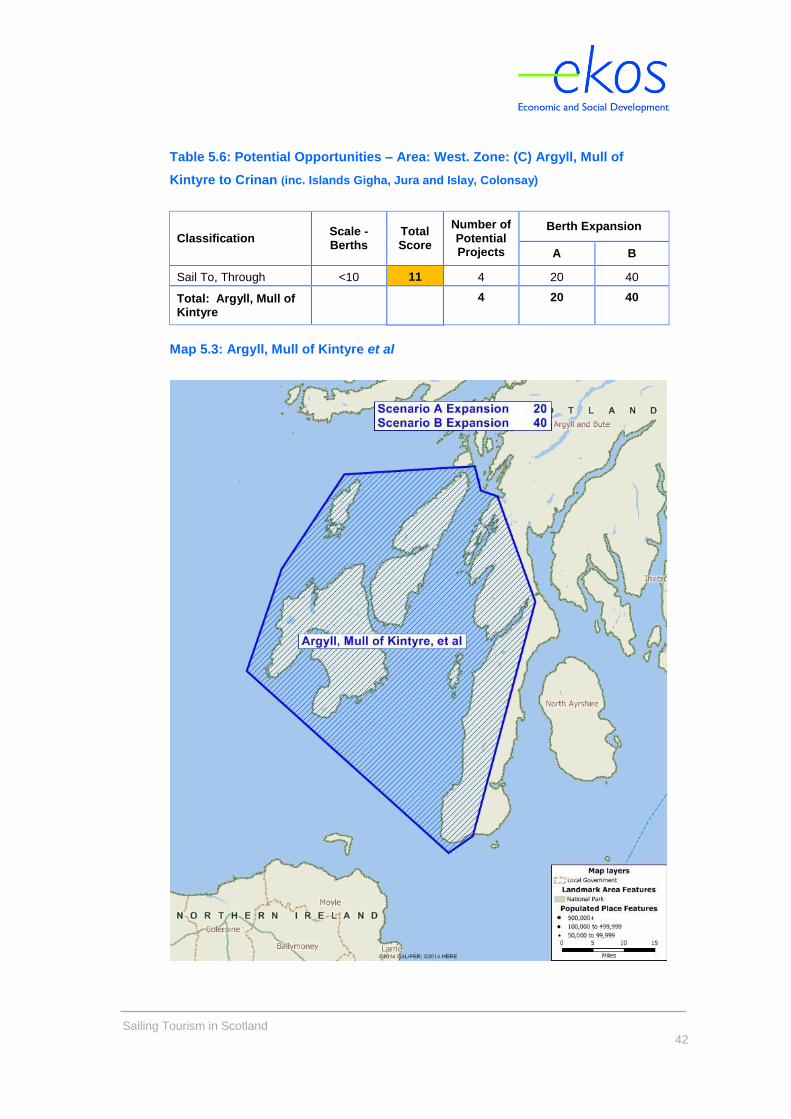
Table 5.6: Potential Opportunities – Area: West. Zone: (C) Argyll, Mull of
Kintyre to Crinan (inc. Islands Gigha, Jura and Islay, Colonsay)
Classification Scale - Berths
Total Score
Number of Potential Projects
Berth Expansion
A B
Sail To, Through <10 11 4 20 40
Total: Argyll, Mull of Kintyre
4 20 40
Map 5.3: Argyll, Mull of Kintyre et al
Sailing Tourism in Scotland
43
Strategic opportunities for the Zone Argyll, Mull of Kintyre to Crinan (inc Islands of
Gigha, Jura and Islay, Colonsay) (Map 5.3):
Yachts sail into this area from the south (Ireland or around the Mull of
Kintyre from the Clyde). Returning transiting yachts also approach from the
north, and the islands are visited from boats in the key resident hubs such
as Ardfern, Croabh Haven and Oban;
Crinan and the Crinan Canal are strategically important for resident boats in
the Clyde reaching the sailing waters of the West Coast. Berth expansion
should be encouraged to maximise these assets, both as holding points and
for improved visitor usage on entering, leaving and along the Canal; and
The islands of Argyll are important sail to and through destinations and they
help to create the sailing cluster, so additional facilities should be
encouraged, linked to the main key settlements extending the existing
facilities, where practical.
Sailing Tourism in Scotland
44
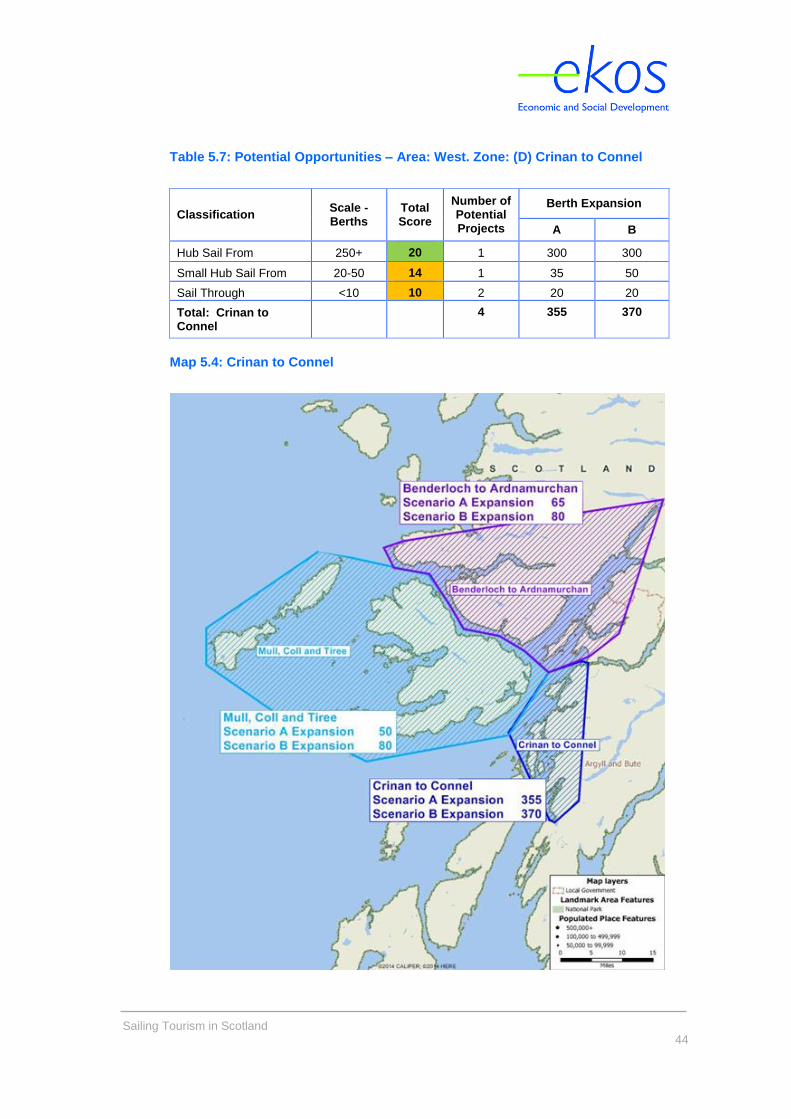
Table 5.7: Potential Opportunities – Area: West. Zone: (D) Crinan to Connel
Classification Scale - Berths
Total Score
Number of Potential Projects
Berth Expansion
A B
Hub Sail From 250+ 20 1
300 300
Small Hub Sail From 20-50 14 1 35 50
Sail Through <10 10 2 20 20
Total: Crinan to Connel
4 355 370
Map 5.4: Crinan to Connel
Sailing Tourism in Scotland
45
Strategic opportunities for Crinan to Connel (Map 5.4):
Oban and the surrounding area to the northeast are strategically very
important, both as sail from and sail to destinations. There is an opportunity
for this area to accommodate more resident boats and could even attract
some demand out of the Clyde. Thus increasing the level of expenditure
within that area;
This area is unusual in that it is in the process of losing some of the existing
facilities, in the form of the Marine Research Centre and doubts as to the
future of the marina on Kerrera;
Oban is a staging post and with Tobermory a gateway to the more northerly
sailing ground north of Ardnamurchan. There is an opportunity for a large
resident hub in the Oban area. This would also help to increase and
strengthen the surrounding sail to destinations, particularly those further to
the north. However, it may not be practical to develop a resident hub of this
scale on one site near Oban. It may be more practical to develop a number
of smaller resident hubs or a combination of new facilities and expansion of
existing. If this is the preferred development route the focus should still be
on Oban but existing facilities in the wider area could still be
expanded/developed as resident hubs to satisfy the future demand;
Oban’s connection to the rail network is important and is used as a base to
facilitate crew changes; and
South of Oban there are opportunities to expand some of the visitor and
resident facilities at existing operations such as Ardfern, again helping to
boost links to sail to visitor locations.
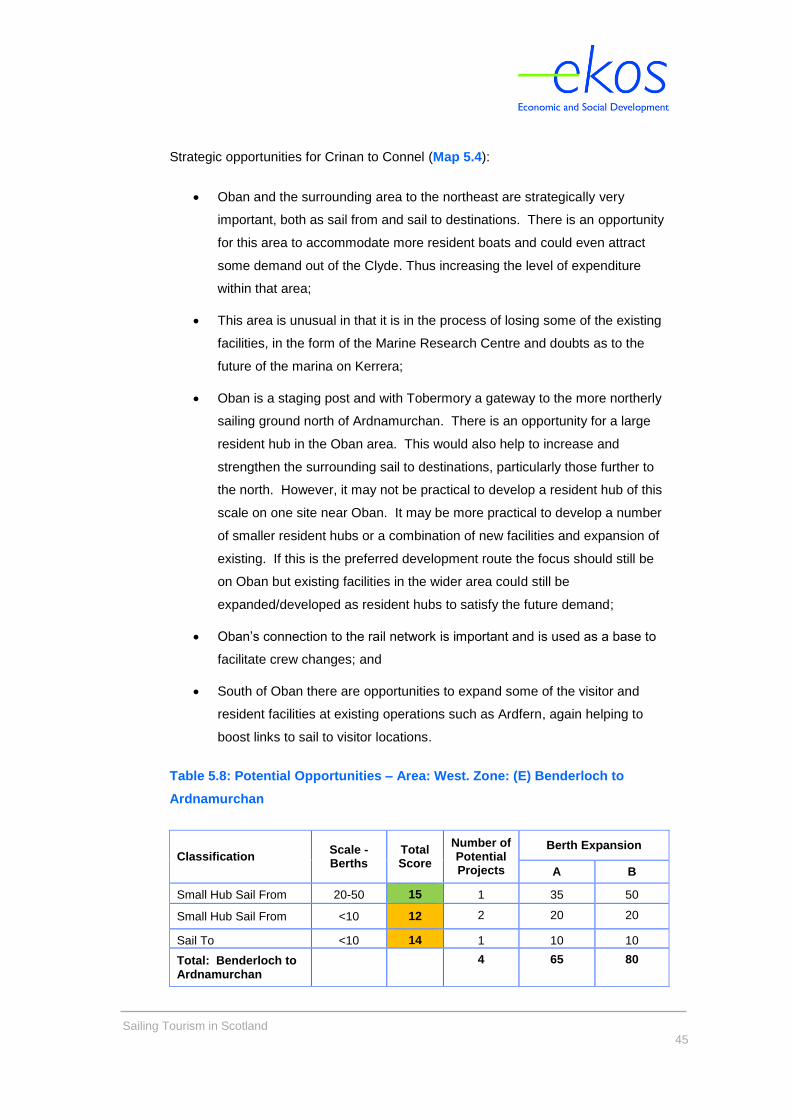
Table 5.8: Potential Opportunities – Area: West. Zone: (E) Benderloch to
Ardnamurchan
Classification Scale - Berths
Total Score
Number of Potential Projects
Berth Expansion
A B
Small Hub Sail From 20-50 15 1 35 50
Small Hub Sail From <10 12 2 20 20
Sail To <10 14 1 10 10
Total: Benderloch to Ardnamurchan
4 65 80
Sailing Tourism in Scotland
46
Strategic opportunities for Benderloch to Ardnamurchan (Map 5.4):
Although perhaps of smaller scale, facilities in Loch Linnhe are important
when linked to transiting through the Caledonian Canal and as a result there
are visitor opportunities at Fort William, with good access to its town centre
and links to the West Highland Line;
A visitor holding facility at the entrance to the Caledonian Canal would be
beneficial; and
There are some small-scale opportunities to extend the number of resident
berths and sail through locations in the wider Loch Linnhe area.
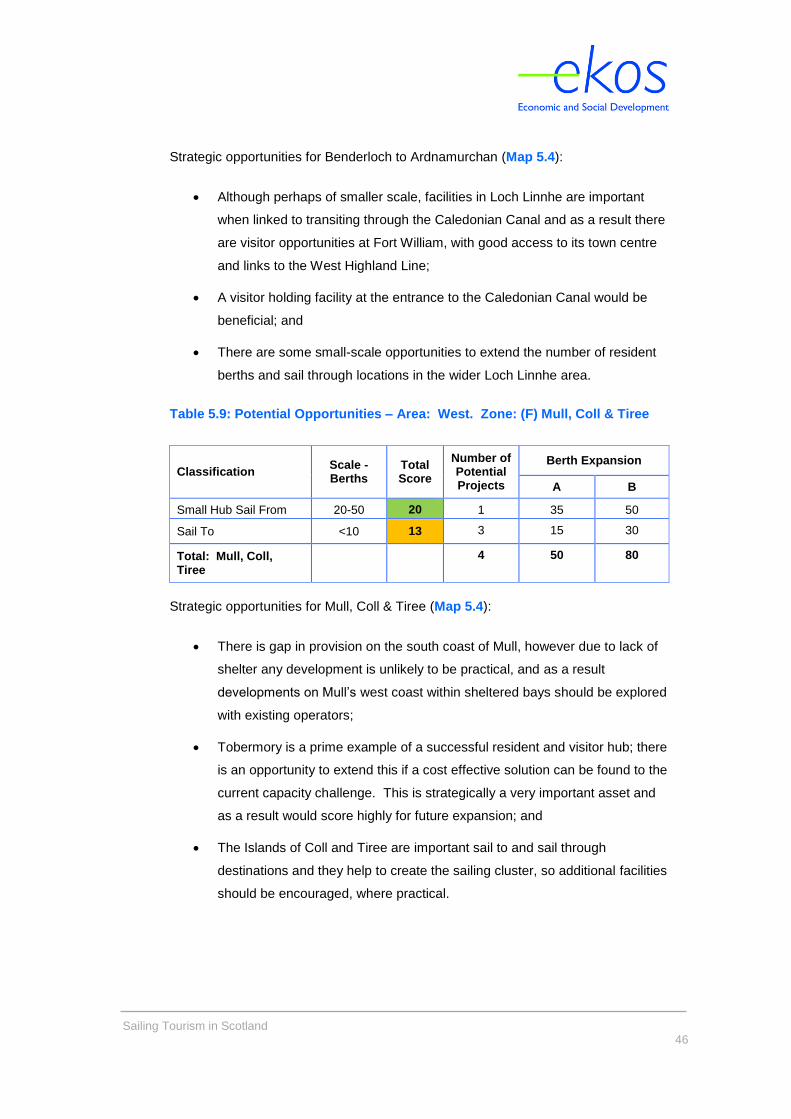
Table 5.9: Potential Opportunities – Area: West. Zone: (F) Mull, Coll & Tiree
Classification Scale - Berths
Total Score
Number of Potential Projects
Berth Expansion
A B
Small Hub Sail From 20-50 20 1 35 50
Sail To <10 13 3 15 30
Total: Mull, Coll, Tiree
4 50 80
Strategic opportunities for Mull, Coll & Tiree (Map 5.4):
There is gap in provision on the south coast of Mull, however due to lack of
shelter any development is unlikely to be practical, and as a result
developments on Mull’s west coast within sheltered bays should be explored
with existing operators;
Tobermory is a prime example of a successful resident and visitor hub; there
is an opportunity to extend this if a cost effective solution can be found to the
current capacity challenge. This is strategically a very important asset and
as a result would score highly for future expansion; and
The Islands of Coll and Tiree are important sail to and sail through
destinations and they help to create the sailing cluster, so additional facilities
should be encouraged, where practical.
Sailing Tourism in Scotland
47
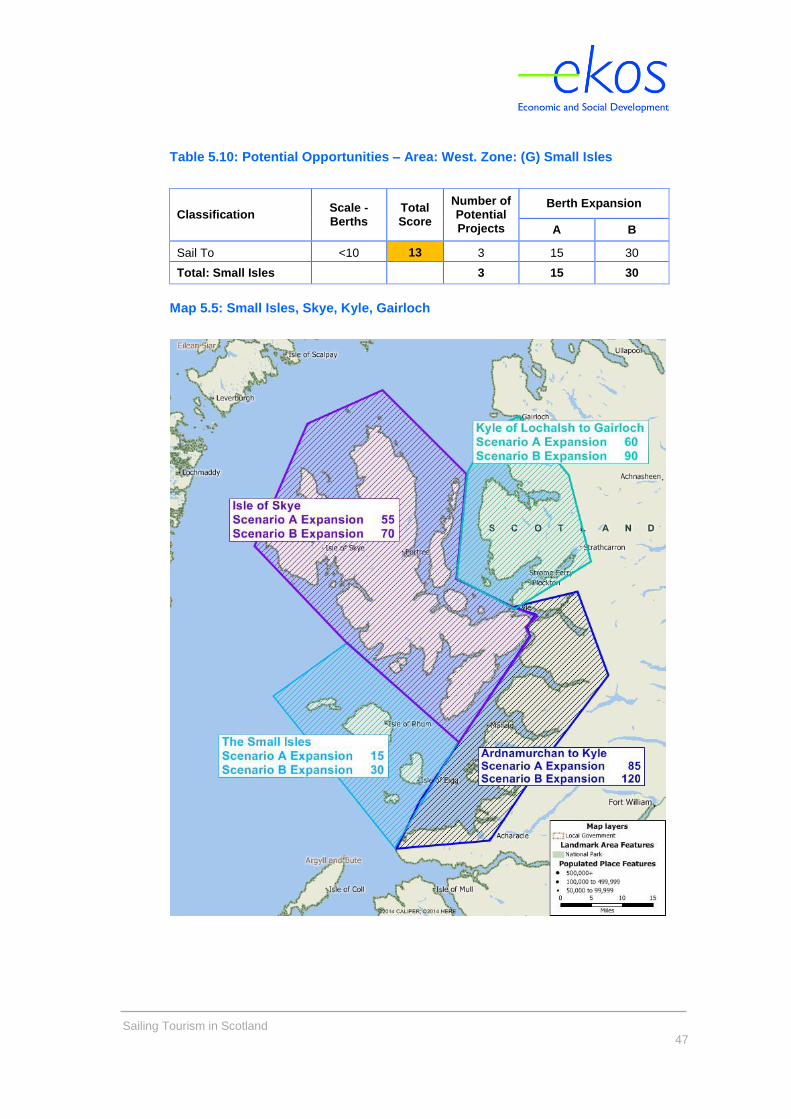
Table 5.10: Potential Opportunities – Area: West. Zone: (G) Small Isles
Classification Scale - Berths
Total Score
Number of Potential Projects
Berth Expansion
A B
Sail To <10 13 3 15 30
Total: Small Isles 3 15 30
Map 5.5: Small Isles, Skye, Kyle, Gairloch
Sailing Tourism in Scotland
48
Strategic opportunities for the Small Isles (Map 5.5):
The Small Isles are important sail to and sail through destinations for both
overnight and day sailors (out of Mallaig and Arisaig in particular) and they
help to strengthen the sailing cluster link with southern Skye. Developments
were originally proposed as part of the Sail West Project but have not yet
come to fruition. Additional small-scale facilities should be encouraged
where practical; and
These facilities may not necessarily be directly linked to shore-based
infrastructure, but shelter, safety and good access ashore are key.
Development of the Small Isles is important as it strengthens the facilities at
Mallaig and Arisaig and provides a bridge to the Hebrides.
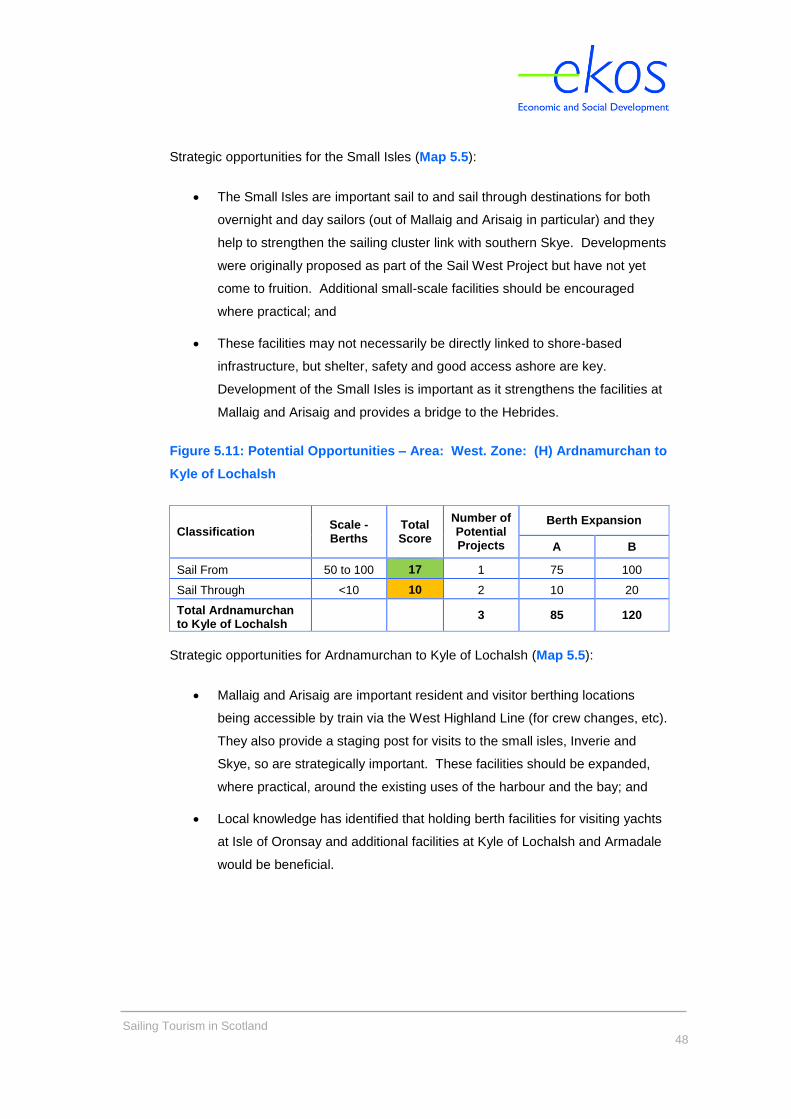
Figure 5.11: Potential Opportunities – Area: West. Zone: (H) Ardnamurchan to
Kyle of Lochalsh
Classification Scale - Berths
Total Score
Number of Potential Projects
Berth Expansion
A B
Sail From 50 to 100 17 1 75 100
Sail Through <10 10 2 10 20
Total Ardnamurchan to Kyle of Lochalsh
3 85 120
Strategic opportunities for Ardnamurchan to Kyle of Lochalsh (Map 5.5):
Mallaig and Arisaig are important resident and visitor berthing locations
being accessible by train via the West Highland Line (for crew changes, etc).
They also provide a staging post for visits to the small isles, Inverie and
Skye, so are strategically important. These facilities should be expanded,
where practical, around the existing uses of the harbour and the bay; and
Local knowledge has identified that holding berth facilities for visiting yachts
at Isle of Oronsay and additional facilities at Kyle of Lochalsh and Armadale
would be beneficial.
Sailing Tourism in Scotland
49
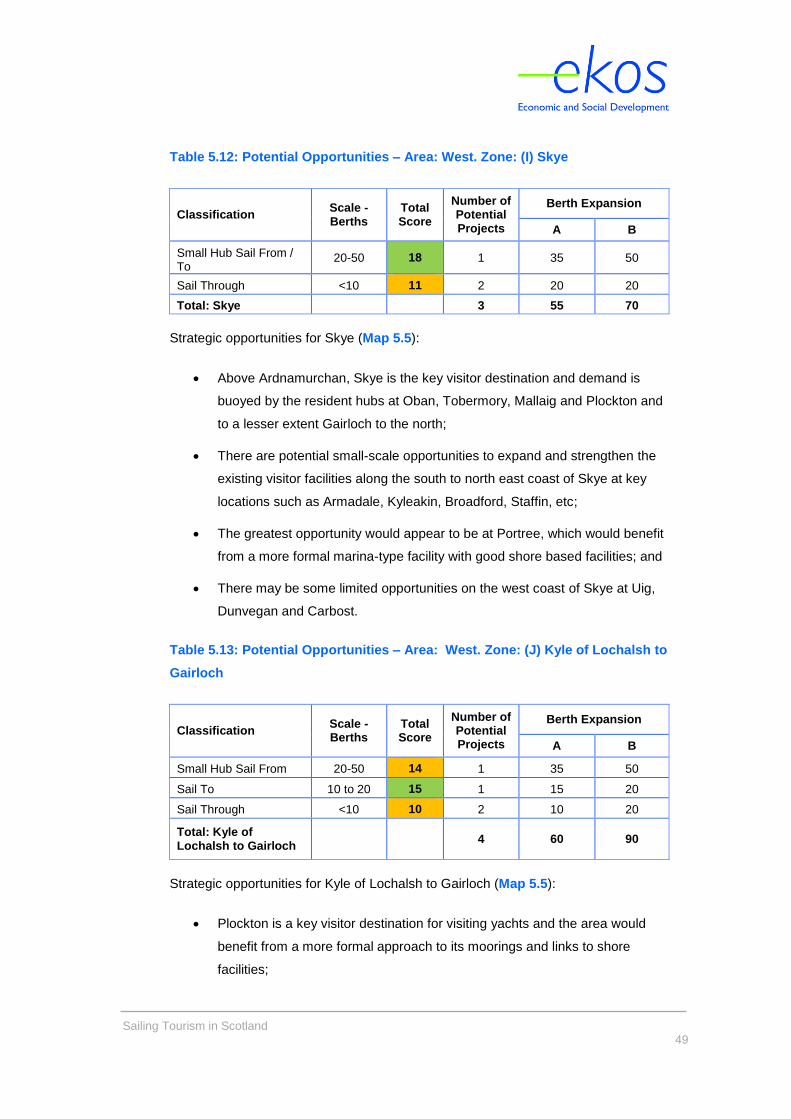
Table 5.12: Potential Opportunities – Area: West. Zone: (I) Skye
Classification Scale - Berths
Total Score
Number of Potential Projects
Berth Expansion
A B
Small Hub Sail From / To
20-50 18 1 35 50
Sail Through <10 11 2 20 20
Total: Skye 3 55 70
Strategic opportunities for Skye (Map 5.5):
Above Ardnamurchan, Skye is the key visitor destination and demand is
buoyed by the resident hubs at Oban, Tobermory, Mallaig and Plockton and
to a lesser extent Gairloch to the north;
There are potential small-scale opportunities to expand and strengthen the
existing visitor facilities along the south to north east coast of Skye at key
locations such as Armadale, Kyleakin, Broadford, Staffin, etc;
The greatest opportunity would appear to be at Portree, which would benefit
from a more formal marina-type facility with good shore based facilities; and
There may be some limited opportunities on the west coast of Skye at Uig,
Dunvegan and Carbost.
Table 5.13: Potential Opportunities – Area: West. Zone: (J) Kyle of Lochalsh to
Gairloch
Classification Scale - Berths
Total Score
Number of Potential Projects
Berth Expansion
A B
Small Hub Sail From 20-50 14 1 35 50
Sail To 10 to 20 15 1 15 20
Sail Through <10 10 2 10 20
Total: Kyle of Lochalsh to Gairloch
4 60 90
Strategic opportunities for Kyle of Lochalsh to Gairloch (Map 5.5):
Plockton is a key visitor destination for visiting yachts and the area would
benefit from a more formal approach to its moorings and links to shore
facilities;
Sailing Tourism in Scotland
50
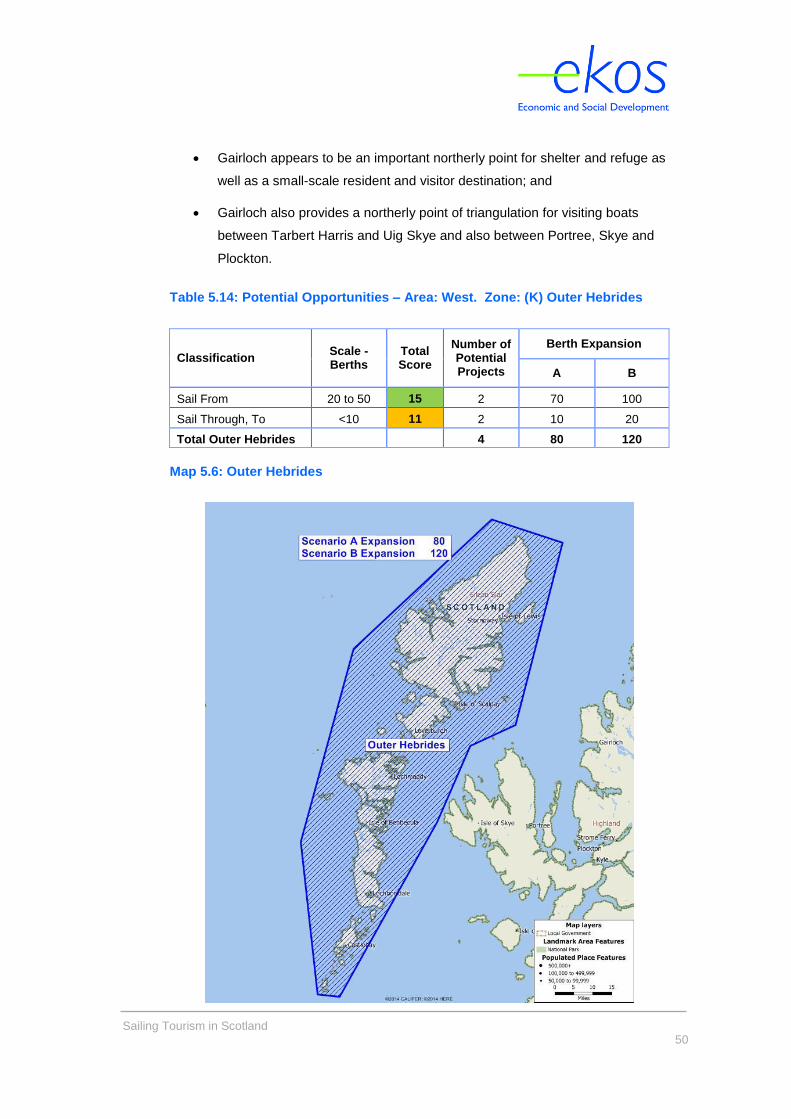
Gairloch appears to be an important northerly point for shelter and refuge as
well as a small-scale resident and visitor destination; and
Gairloch also provides a northerly point of triangulation for visiting boats
between Tarbert Harris and Uig Skye and also between Portree, Skye and
Plockton.
Table 5.14: Potential Opportunities – Area: West. Zone: (K) Outer Hebrides
Classification Scale - Berths
Total Score
Number of Potential Projects
Berth Expansion
A B
Sail From 20 to 50 15 2 70 100
Sail Through, To <10 11 2 10 20
Total Outer Hebrides 4 80 120
Map 5.6: Outer Hebrides
Sailing Tourism in Scotland
51
Strategic opportunities for Outer Hebrides (Map 5.6):
The Outer Hebrides has a number of key resident hubs the largest being
Stornoway and a string of pearls that attracts visitors down the more
sheltered east coast of the islands. The west coast of the archipelago is
more troublesome and there is unlikely to be significant visitor demand for
facilities due to limited shelter and the sea conditions. If they can be directly
linked to the east coast facilities, within 25 nautical miles, there may be
some market opportunity, albeit perhaps limited. Isolated facilities on the
island’s west coast are unlikely to bring additional benefit and in addition
visitor spends will be low if facilities cannot be linked to local amenities;
The Outer Hebrides is strategically a key sailing visitor destination, with a
mix of sail to and sail through locations, the chain being accessed in the
south via Oban, Tobermory or Tiree, and in the mid-point from Mallaig, Skye
and the Small Isles and in the North from Lochinver;
There is a market opportunity for a resident hub and sail to destination
around the Tarbet area of the coastline in Harris, to fuel demand for the
wider string of pearls. A sail to destination would help to complete the future
triangulation and links between Uig, Plockton and Gairloch; and
The strategy for the future is to continue to fill gaps in the Hebrides visitor
and resident berth supply using the string of pearls approach.
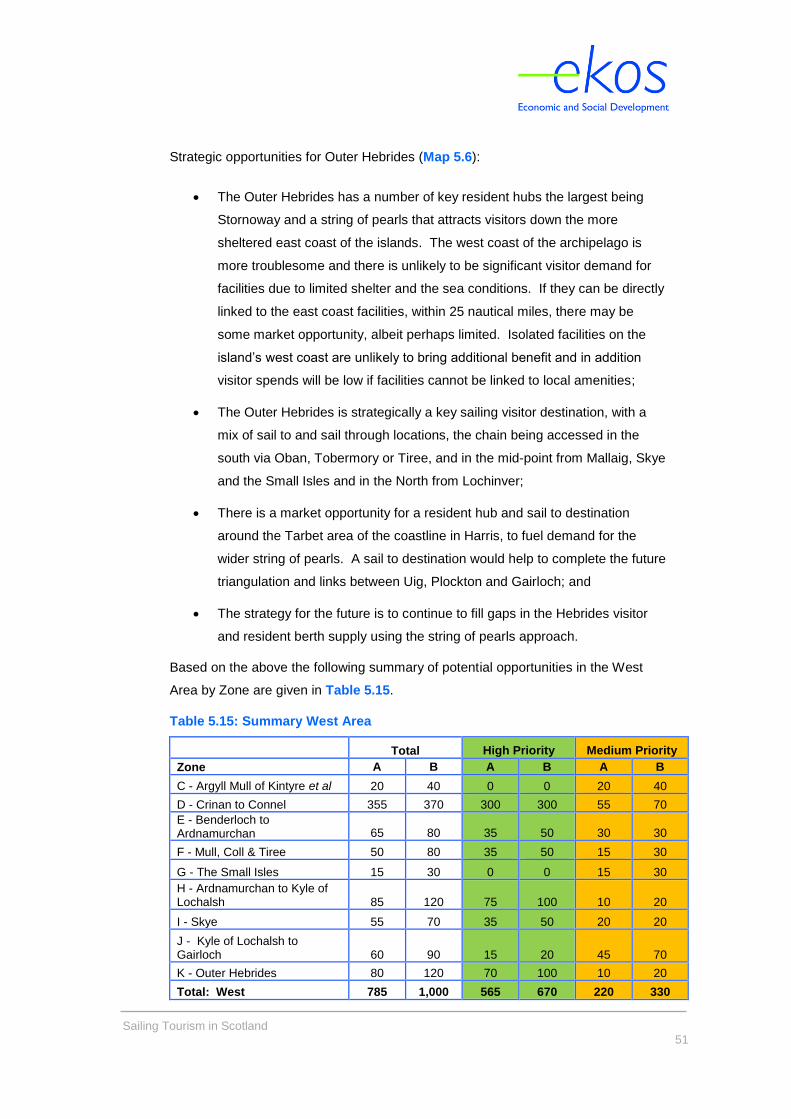
Based on the above the following summary of potential opportunities in the West
Area by Zone are given in Table 5.15.
Table 5.15: Summary West Area
Total High Priority Medium Priority
Zone A B A B A B
C - Argyll Mull of Kintyre et al 20 40 0 0 20 40
D - Crinan to Connel 355 370 300 300 55 70
E - Benderloch to Ardnamurchan 65 80 35 50 30 30
F - Mull, Coll & Tiree 50 80 35 50 15 30
G - The Small Isles 15 30 0 0 15 30
H - Ardnamurchan to Kyle of Lochalsh 85 120 75 100 10 20
I - Skye 55 70 35 50 20 20
J - Kyle of Lochalsh to Gairloch 60 90 15 20 45 70
K - Outer Hebrides 80 120 70 100 10 20
Total: West 785 1,000 565 670 220 330
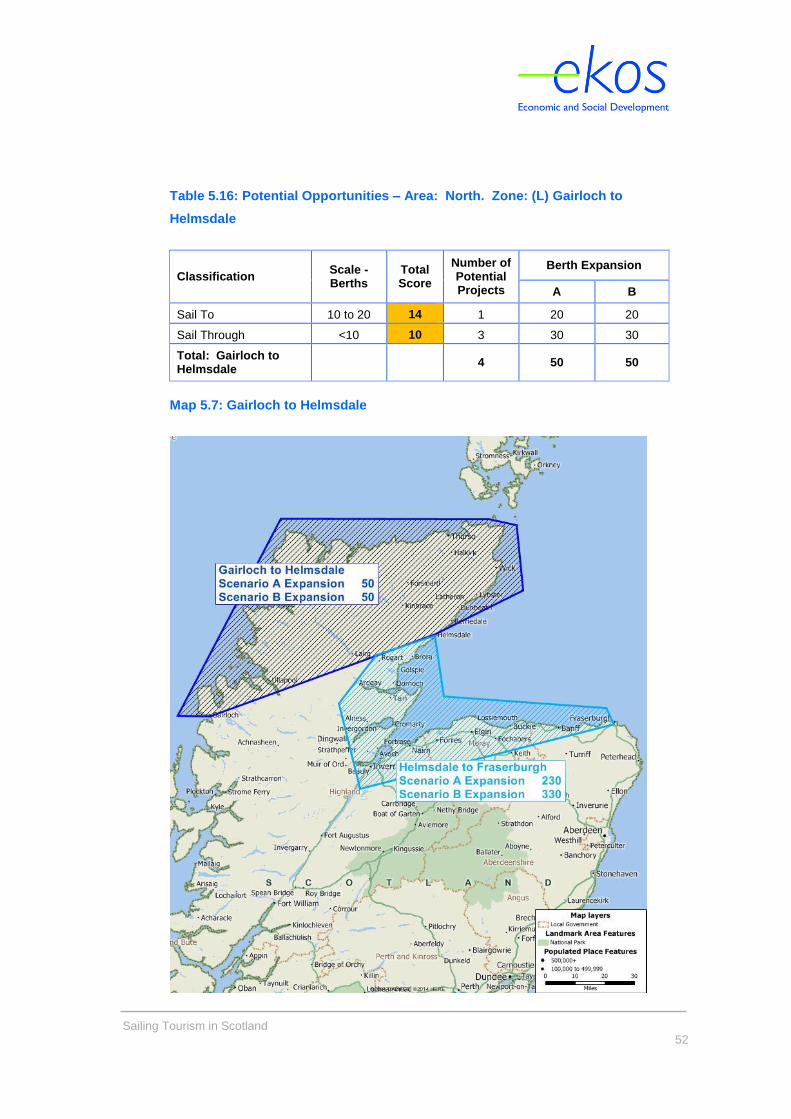
Sailing Tourism in Scotland
52
Table 5.16: Potential Opportunities – Area: North. Zone: (L) Gairloch to
Helmsdale
Classification Scale - Berths
Total Score
Number of Potential Projects
Berth Expansion
A B
Sail To 10 to 20 14 1 20 20
Sail Through <10 10 3 30 30
Total: Gairloch to Helmsdale
4 50 50
Map 5.7: Gairloch to Helmsdale
Sailing Tourism in Scotland
53
Strategic Opportunities for Gairloch to Helmsdale (Map 5.7):
In this area Ullapool has the most resident boats on moorings, but there are
issues over expansion due to the presence of the ferry terminal. The
consumer survey reveals that adding visitor pontoons and giving better
access to the shore could improve facilities and be a strategic addition to
supply of visitor berthing in this northern area. The resident hub facility
would also benefit from better berthing and a more formal approach. This
may not lead to net additional boats, but replacement of small vessels with
larger vessels could occur over time;
This northern area is exposed to more severe sailing conditions and often
yachtsmen are looking for shelter and bolt holes. Loch Eribol is an example
of this (before rounding Cape Wrath), but sea bed conditions make
anchoring difficult and visitors require better access to the shore;
Highland Council are currently reviewing their harbours and as a result
improvements may be made to Kinlochbervie and Lochinver.
Encouragement should be given to small-scale improvements to visitor
facilities where appropriate; and
These northern projects are about visitor yacht servicing, small scale
developments, improvements to existing facilities, and providing essential
shelter and bolt holes in more formal facilities where places to anchor are
difficult.
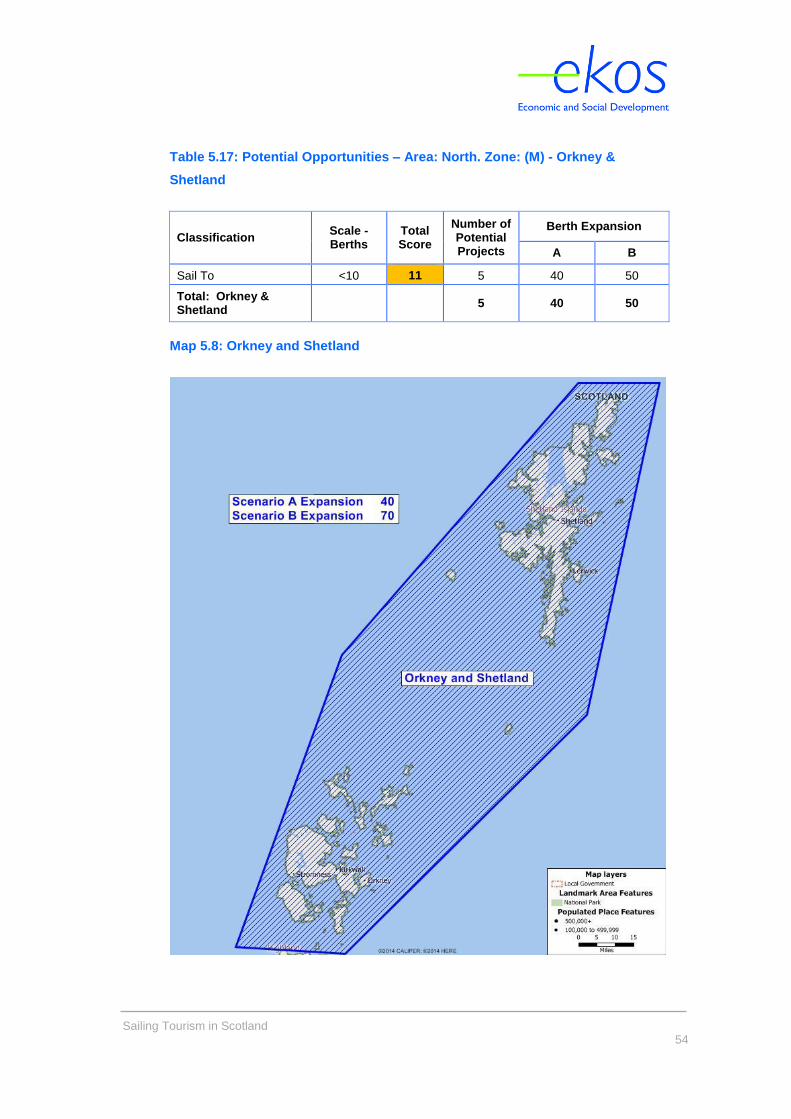
Sailing Tourism in Scotland
54
Table 5.17: Potential Opportunities – Area: North. Zone: (M) - Orkney &
Shetland
Classification Scale - Berths
Total Score
Number of Potential Projects
Berth Expansion
A B
Sail To <10 11 5 40 50
Total: Orkney & Shetland
5 40 50
Map 5.8: Orkney and Shetland
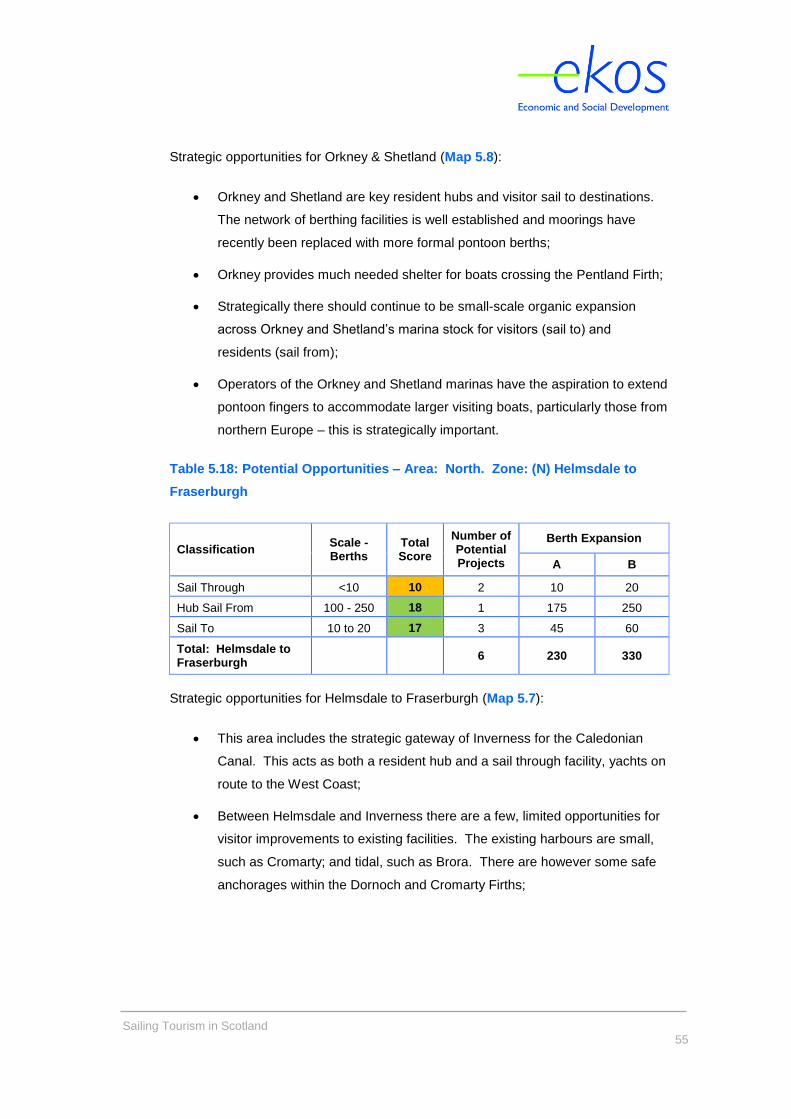
Sailing Tourism in Scotland
55
Strategic opportunities for Orkney & Shetland (Map 5.8):
Orkney and Shetland are key resident hubs and visitor sail to destinations.
The network of berthing facilities is well established and moorings have
recently been replaced with more formal pontoon berths;
Orkney provides much needed shelter for boats crossing the Pentland Firth;
Strategically there should continue to be small-scale organic expansion
across Orkney and Shetland’s marina stock for visitors (sail to) and
residents (sail from);
Operators of the Orkney and Shetland marinas have the aspiration to extend
pontoon fingers to accommodate larger visiting boats, particularly those from
northern Europe – this is strategically important.
Table 5.18: Potential Opportunities – Area: North. Zone: (N) Helmsdale to
Fraserburgh
Classification Scale - Berths
Total Score
Number of Potential Projects
Berth Expansion
A B
Sail Through <10 10 2 10 20
Hub Sail From 100 - 250 18 1 175 250
Sail To 10 to 20 17 3 45 60
Total: Helmsdale to Fraserburgh
6 230 330
Strategic opportunities for Helmsdale to Fraserburgh (Map 5.7):
This area includes the strategic gateway of Inverness for the Caledonian
Canal. This acts as both a resident hub and a sail through facility, yachts on
route to the West Coast;
Between Helmsdale and Inverness there are a few, limited opportunities for
visitor improvements to existing facilities. The existing harbours are small,
such as Cromarty; and tidal, such as Brora. There are however some safe
anchorages within the Dornoch and Cromarty Firths;
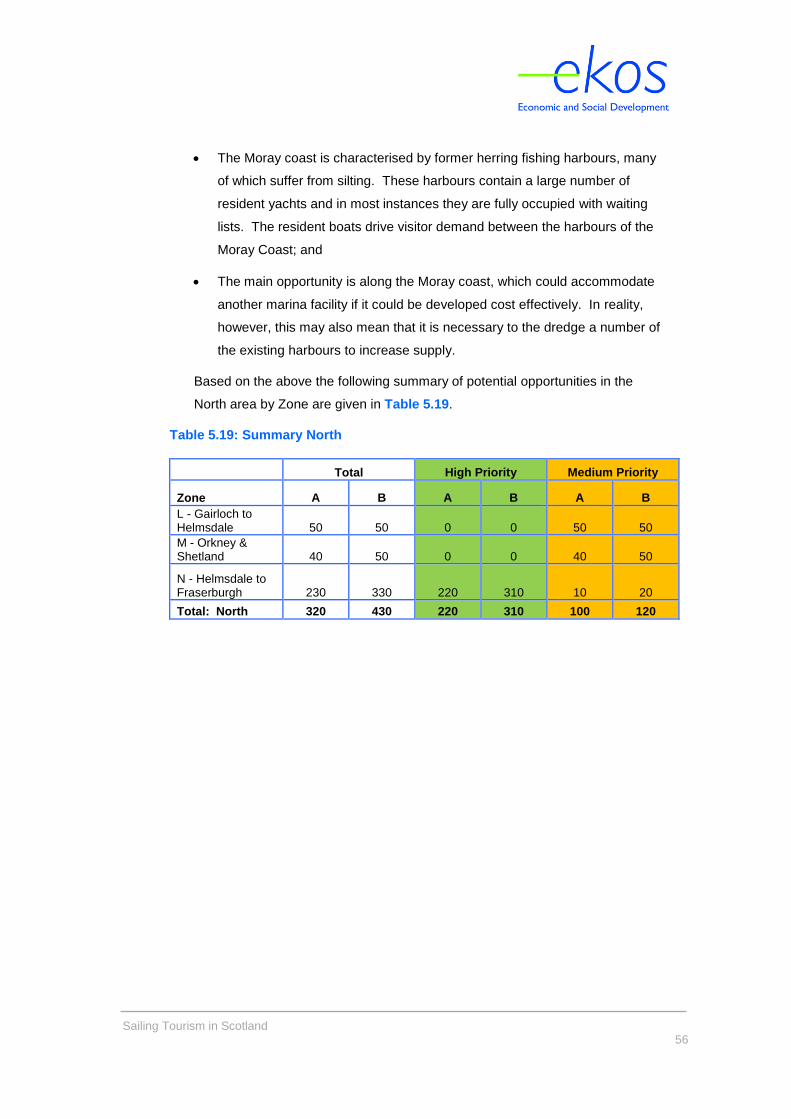
Sailing Tourism in Scotland
56
The Moray coast is characterised by former herring fishing harbours, many
of which suffer from silting. These harbours contain a large number of
resident yachts and in most instances they are fully occupied with waiting
lists. The resident boats drive visitor demand between the harbours of the
Moray Coast; and
The main opportunity is along the Moray coast, which could accommodate
another marina facility if it could be developed cost effectively. In reality,
however, this may also mean that it is necessary to the dredge a number of
the existing harbours to increase supply.
Based on the above the following summary of potential opportunities in the
North area by Zone are given in Table 5.19.
Table 5.19: Summary North
Total High Priority Medium Priority
Zone A B A B A B
L - Gairloch to Helmsdale 50 50 0 0 50 50
M - Orkney & Shetland 40 50 0 0 40 50
N - Helmsdale to Fraserburgh 230 330 220 310 10 20
Total: North 320 430 220 310 100 120
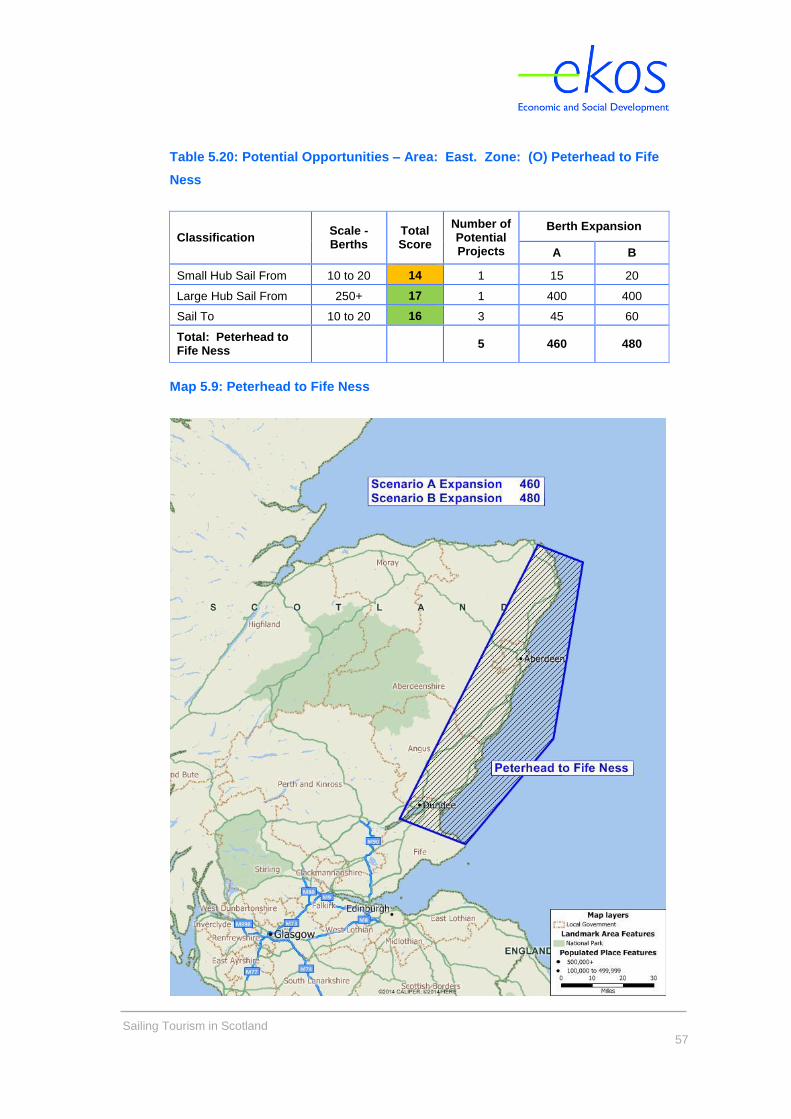
Sailing Tourism in Scotland
57
Table 5.20: Potential Opportunities – Area: East. Zone: (O) Peterhead to Fife
Ness
Classification Scale - Berths
Total Score
Number of Potential Projects
Berth Expansion
A B
Small Hub Sail From 10 to 20 14 1 15 20
Large Hub Sail From 250+ 17 1 400 400
Sail To 10 to 20 16 3 45 60
Total: Peterhead to Fife Ness
5 460 480
Map 5.9: Peterhead to Fife Ness
Sailing Tourism in Scotland
58
Strategic opportunities for Peterhead to Fife Ness (Map 5.9):
On this stretch of coastline Peterhead is strategically important as a resident
hub sail from and a sail through facility. It is a strategic gateway to the
Moray Firth and foreign boats crossing the North Sea. It is also seen as a
staging post for yachts sailing north/south from Wick and Orkney;
This zone includes the opportunities around the large marina project at
Dundee Waterfront. This project is largely supply-led on the back of
residential and waterfront regeneration. Depending on the speed of wider
development this may not be fully realised within the time period envisaged
in this report. This will largely be a resident hub which will then help to fuel
demand for visitor facilities to the north at Arbroath and Montrose and to the
south at St Andrews and along the East Neuk of Fife;
In the north of the zone, a marina at Aberdeen would fill the demand and
location gap but it cannot be accommodated within the working commercial
harbour, given the oil and ferry traffic; and
A possible expansion of Peterhead and a number of small scale visitor
additions at some of the following – Arbroath, Montrose, St Andrews, and
Tayport would be strategic.
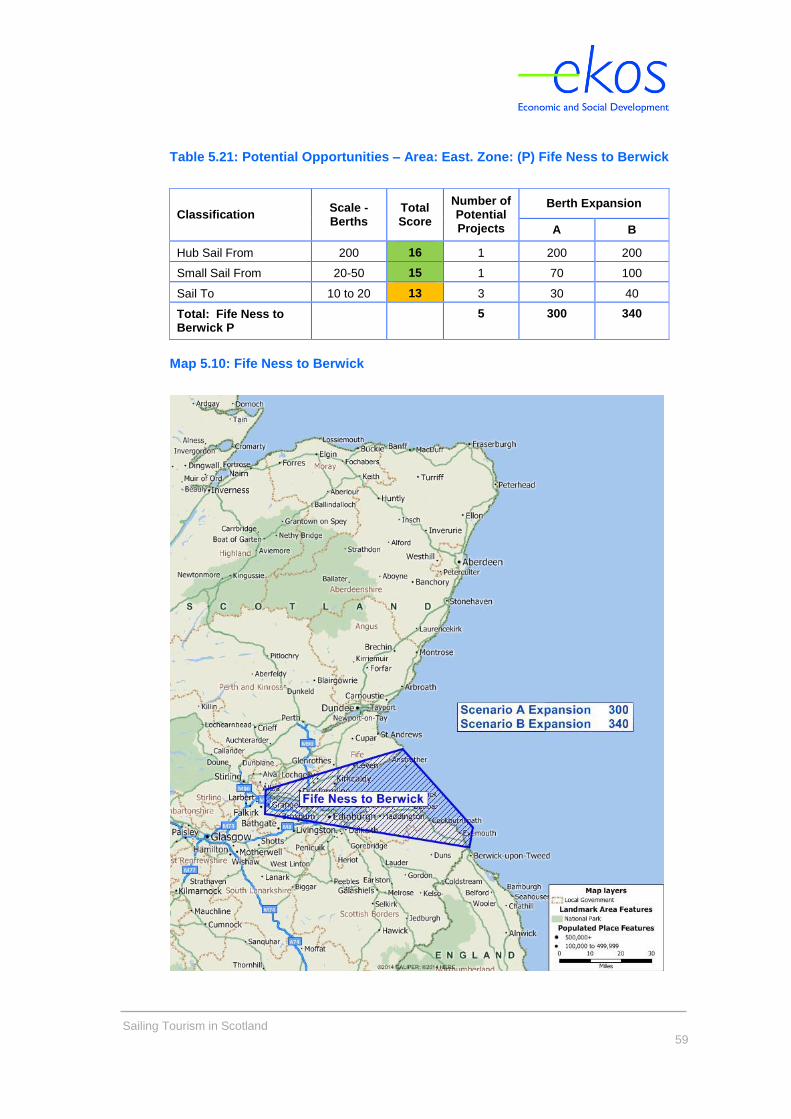
Sailing Tourism in Scotland
59
Table 5.21: Potential Opportunities – Area: East. Zone: (P) Fife Ness to Berwick
Classification Scale - Berths
Total Score
Number of Potential Projects
Berth Expansion
A B
Hub Sail From 200 16 1 200 200
Small Sail From 20-50 15 1 70 100
Sail To 10 to 20 13 3 30 40
Total: Fife Ness to Berwick P
5 300 340
Map 5.10: Fife Ness to Berwick
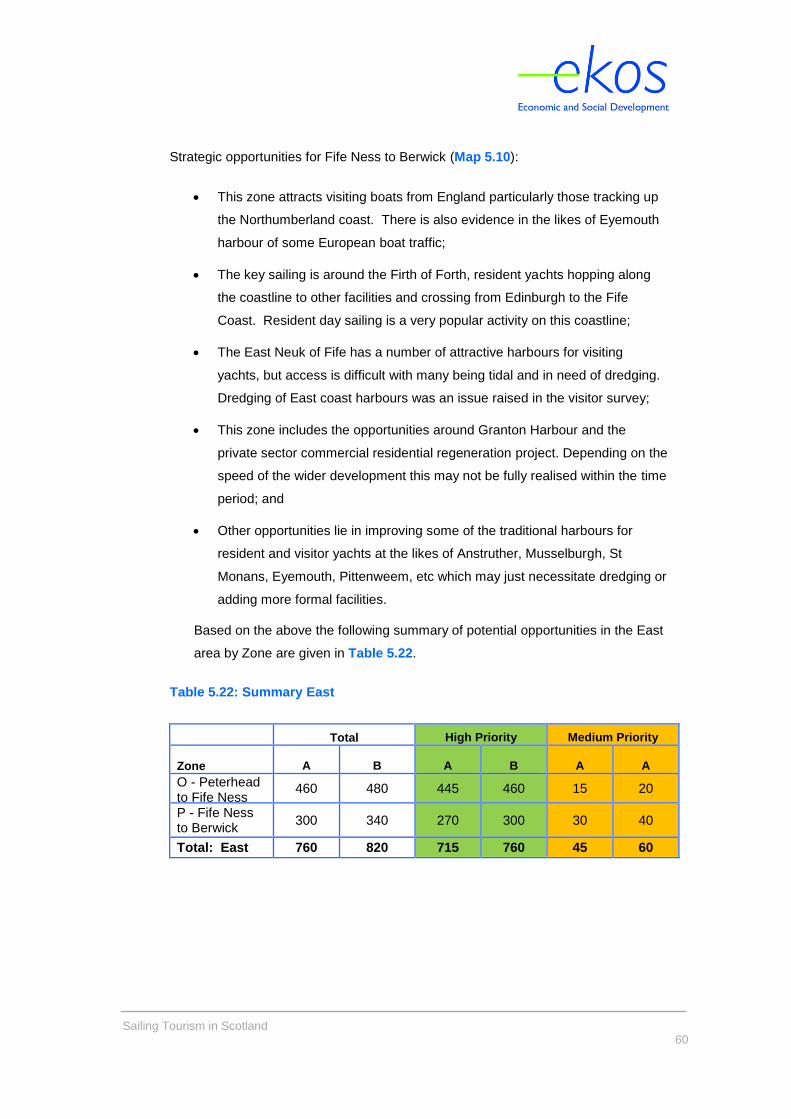
Sailing Tourism in Scotland
60
Strategic opportunities for Fife Ness to Berwick (Map 5.10):
This zone attracts visiting boats from England particularly those tracking up
the Northumberland coast. There is also evidence in the likes of Eyemouth
harbour of some European boat traffic;
The key sailing is around the Firth of Forth, resident yachts hopping along
the coastline to other facilities and crossing from Edinburgh to the Fife
Coast. Resident day sailing is a very popular activity on this coastline;
The East Neuk of Fife has a number of attractive harbours for visiting
yachts, but access is difficult with many being tidal and in need of dredging.
Dredging of East coast harbours was an issue raised in the visitor survey;
This zone includes the opportunities around Granton Harbour and the
private sector commercial residential regeneration project. Depending on the
speed of the wider development this may not be fully realised within the time
period; and
Other opportunities lie in improving some of the traditional harbours for
resident and visitor yachts at the likes of Anstruther, Musselburgh, St
Monans, Eyemouth, Pittenweem, etc which may just necessitate dredging or
adding more formal facilities.
Based on the above the following summary of potential opportunities in the East
area by Zone are given in Table 5.22.
Table 5.22: Summary East
Total High Priority Medium Priority
Zone A B A B A A
O - Peterhead to Fife Ness
460 480 445 460 15 20
P - Fife Ness to Berwick
300 340 270 300 30 40
Total: East 760 820 715 760 45 60
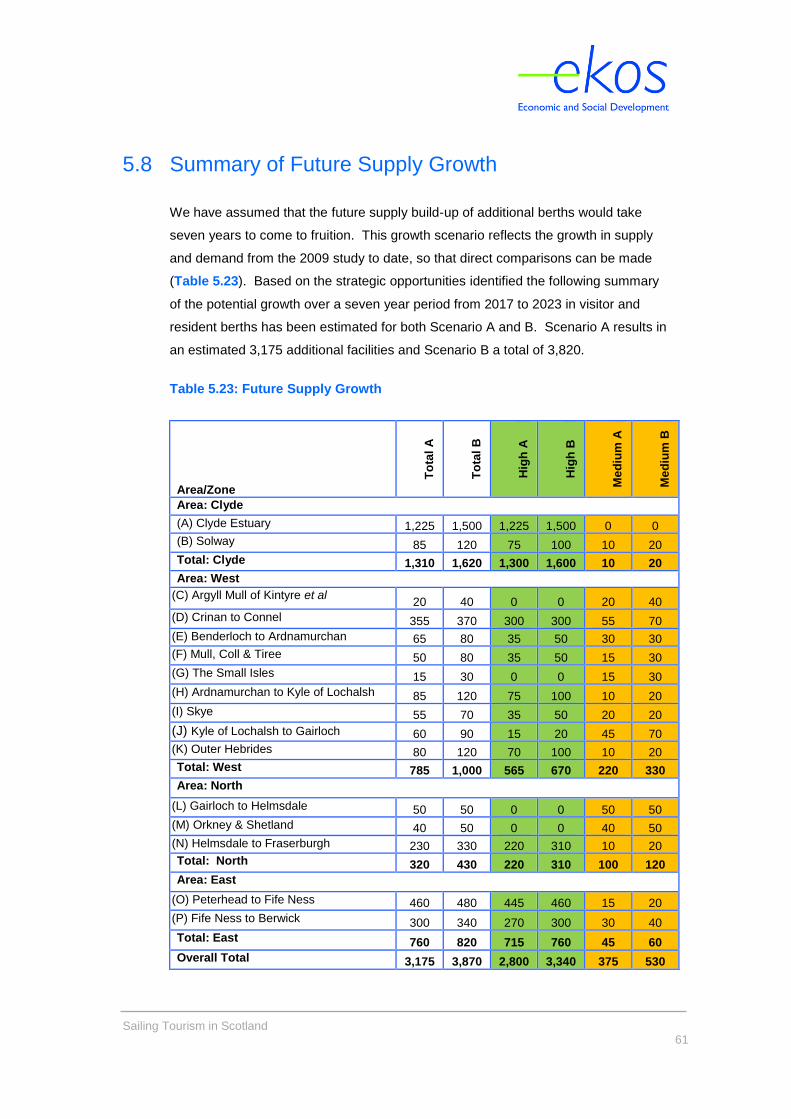
Sailing Tourism in Scotland
61
5.8 Summary of Future Supply Growth
We have assumed that the future supply build-up of additional berths would take
seven years to come to fruition. This growth scenario reflects the growth in supply
and demand from the 2009 study to date, so that direct comparisons can be made
(Table 5.23). Based on the strategic opportunities identified the following summary
of the potential growth over a seven year period from 2017 to 2023 in visitor and
resident berths has been estimated for both Scenario A and B. Scenario A results in
an estimated 3,175 additional facilities and Scenario B a total of 3,820.
Table 5.23: Future Supply Growth
Area/Zone
To
tal
A
To
tal
B
Hig
h A
Hig
h B
Me
diu
m A
Me
diu
m B
Area: Clyde
(A) Clyde Estuary 1,225 1,500 1,225 1,500 0 0
(B) Solway 85 120 75 100 10 20
Total: Clyde 1,310 1,620 1,300 1,600 10 20
Area: West
(C) Argyll Mull of Kintyre et al 20 40 0 0 20 40
(D) Crinan to Connel 355 370 300 300 55 70
(E) Benderloch to Ardnamurchan 65 80 35 50 30 30
(F) Mull, Coll & Tiree 50 80 35 50 15 30
(G) The Small Isles 15 30 0 0 15 30
(H) Ardnamurchan to Kyle of Lochalsh 85 120 75 100 10 20
(I) Skye 55 70 35 50 20 20
(J) Kyle of Lochalsh to Gairloch 60 90 15 20 45 70
(K) Outer Hebrides 80 120 70 100 10 20
Total: West 785 1,000 565 670 220 330
Area: North
(L) Gairloch to Helmsdale 50 50 0 0 50 50
(M) Orkney & Shetland 40 50 0 0 40 50
(N) Helmsdale to Fraserburgh 230 330 220 310 10 20
Total: North 320 430 220 310 100 120
Area: East
(O) Peterhead to Fife Ness 460 480 445 460 15 20
(P) Fife Ness to Berwick 300 340 270 300 30 40
Total: East 760 820 715 760 45 60
Overall Total 3,175 3,870 2,800 3,340 375 530
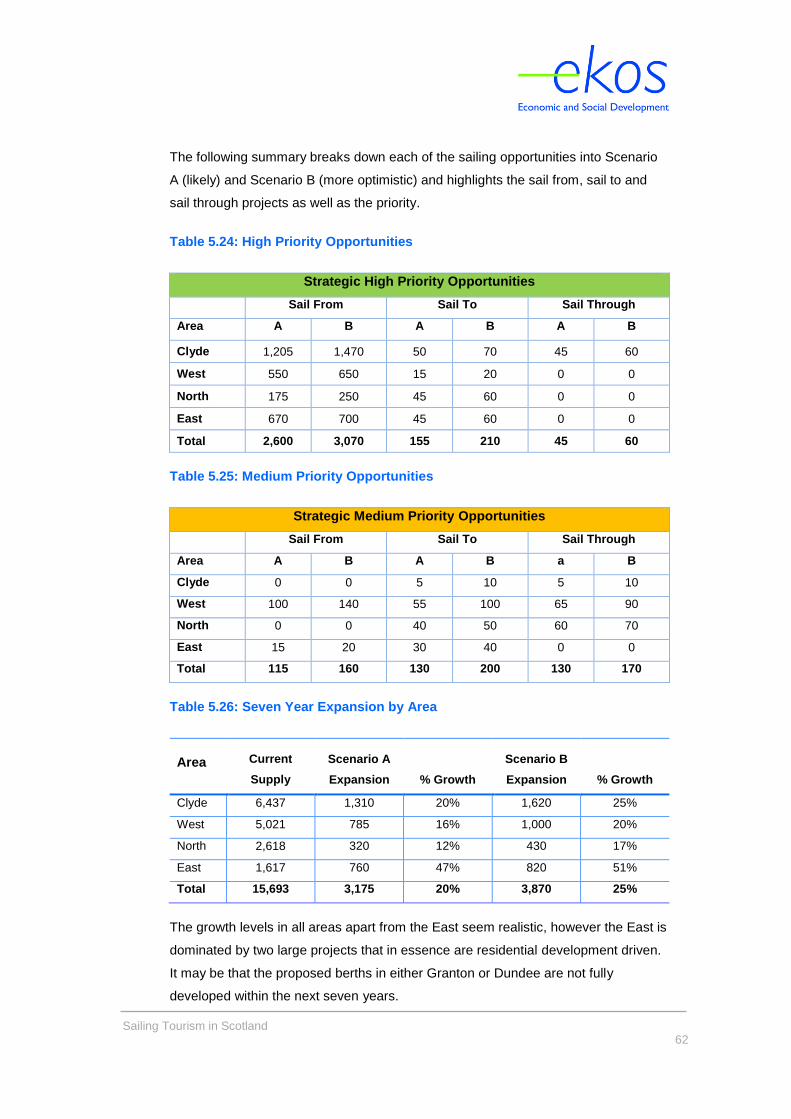
Sailing Tourism in Scotland
62
The following summary breaks down each of the sailing opportunities into Scenario
A (likely) and Scenario B (more optimistic) and highlights the sail from, sail to and
sail through projects as well as the priority.
Table 5.24: High Priority Opportunities
Strategic High Priority Opportunities
Sail From Sail To Sail Through
Area A B A B A B
Clyde 1,205 1,470 50 70 45 60
West 550 650 15 20 0 0
North 175 250 45 60 0 0
East 670 700 45 60 0 0
Total 2,600 3,070 155 210 45 60
Table 5.25: Medium Priority Opportunities
Strategic Medium Priority Opportunities
Sail From Sail To Sail Through
Area A B A B a B
Clyde 0 0 5 10 5 10
West 100 140 55 100 65 90
North 0 0 40 50 60 70
East 15 20 30 40 0 0
Total 115 160 130 200 130 170
Table 5.26: Seven Year Expansion by Area
Area Current
Supply
Scenario A
Expansion % Growth
Scenario B
Expansion % Growth
Clyde 6,437 1,310 20% 1,620 25%
West 5,021 785 16% 1,000 20%
North 2,618 320 12% 430 17%
East 1,617 760 47% 820 51%
Total 15,693 3,175 20% 3,870 25%
The growth levels in all areas apart from the East seem realistic, however the East is
dominated by two large projects that in essence are residential development driven.
It may be that the proposed berths in either Granton or Dundee are not fully
developed within the next seven years.
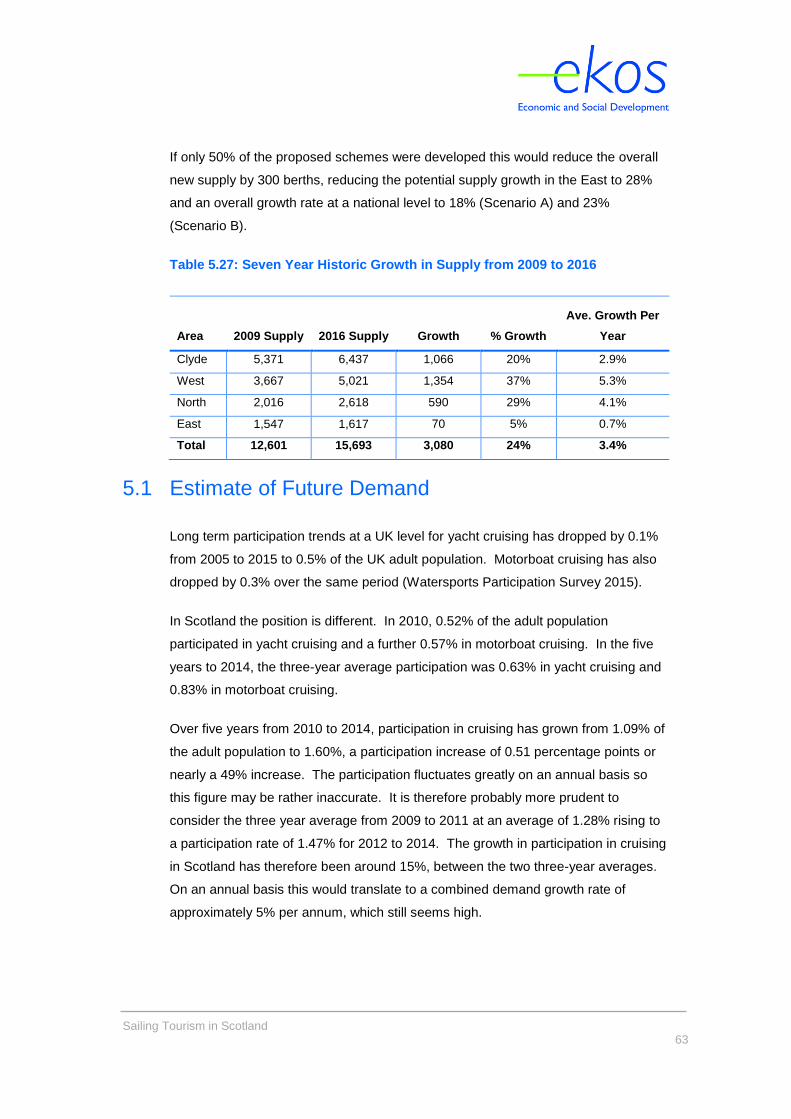
Sailing Tourism in Scotland
63
If only 50% of the proposed schemes were developed this would reduce the overall
new supply by 300 berths, reducing the potential supply growth in the East to 28%
and an overall growth rate at a national level to 18% (Scenario A) and 23%
(Scenario B).
Table 5.27: Seven Year Historic Growth in Supply from 2009 to 2016
Area 2009 Supply 2016 Supply Growth % Growth
Ave. Growth Per
Year
Clyde 5,371 6,437 1,066 20% 2.9%
West 3,667 5,021 1,354 37% 5.3%
North 2,016 2,618 590 29% 4.1%
East 1,547 1,617 70 5% 0.7%
Total 12,601 15,693 3,080 24% 3.4%
5.1 Estimate of Future Demand
Long term participation trends at a UK level for yacht cruising has dropped by 0.1%
from 2005 to 2015 to 0.5% of the UK adult population. Motorboat cruising has also
dropped by 0.3% over the same period (Watersports Participation Survey 2015).
In Scotland the position is different. In 2010, 0.52% of the adult population
participated in yacht cruising and a further 0.57% in motorboat cruising. In the five
years to 2014, the three-year average participation was 0.63% in yacht cruising and
0.83% in motorboat cruising.
Over five years from 2010 to 2014, participation in cruising has grown from 1.09% of
the adult population to 1.60%, a participation increase of 0.51 percentage points or
nearly a 49% increase. The participation fluctuates greatly on an annual basis so
this figure may be rather inaccurate. It is therefore probably more prudent to
consider the three year average from 2009 to 2011 at an average of 1.28% rising to
a participation rate of 1.47% for 2012 to 2014. The growth in participation in cruising
in Scotland has therefore been around 15%, between the two three-year averages.
On an annual basis this would translate to a combined demand growth rate of
approximately 5% per annum, which still seems high.
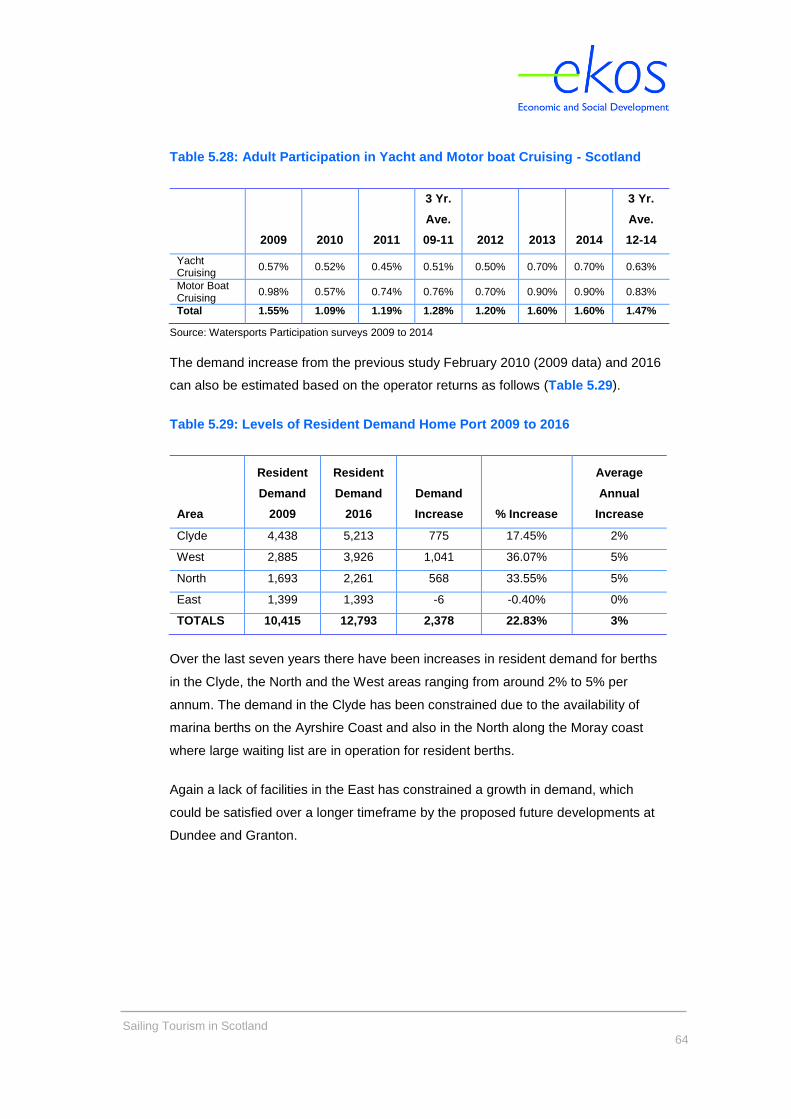
Sailing Tourism in Scotland
64
Table 5.28: Adult Participation in Yacht and Motor boat Cruising - Scotland
2009 2010 2011
3 Yr.
Ave.
09-11 2012 2013 2014
3 Yr.
Ave.
12-14
Yacht Cruising
0.57% 0.52% 0.45% 0.51% 0.50% 0.70% 0.70% 0.63%
Motor Boat Cruising
0.98% 0.57% 0.74% 0.76% 0.70% 0.90% 0.90% 0.83%
Total 1.55% 1.09% 1.19% 1.28% 1.20% 1.60% 1.60% 1.47%
Source: Watersports Participation surveys 2009 to 2014
The demand increase from the previous study February 2010 (2009 data) and 2016
can also be estimated based on the operator returns as follows (Table 5.29).
Table 5.29: Levels of Resident Demand Home Port 2009 to 2016
Area
Resident
Demand
2009
Resident
Demand
2016
Demand
Increase % Increase
Average
Annual
Increase
Clyde 4,438 5,213 775 17.45% 2%
West 2,885 3,926 1,041 36.07% 5%
North 1,693 2,261 568 33.55% 5%
East 1,399 1,393 -6 -0.40% 0%
TOTALS 10,415 12,793 2,378 22.83% 3%
Over the last seven years there have been increases in resident demand for berths
in the Clyde, the North and the West areas ranging from around 2% to 5% per
annum. The demand in the Clyde has been constrained due to the availability of
marina berths on the Ayrshire Coast and also in the North along the Moray coast
where large waiting list are in operation for resident berths.
Again a lack of facilities in the East has constrained a growth in demand, which
could be satisfied over a longer timeframe by the proposed future developments at
Dundee and Granton.
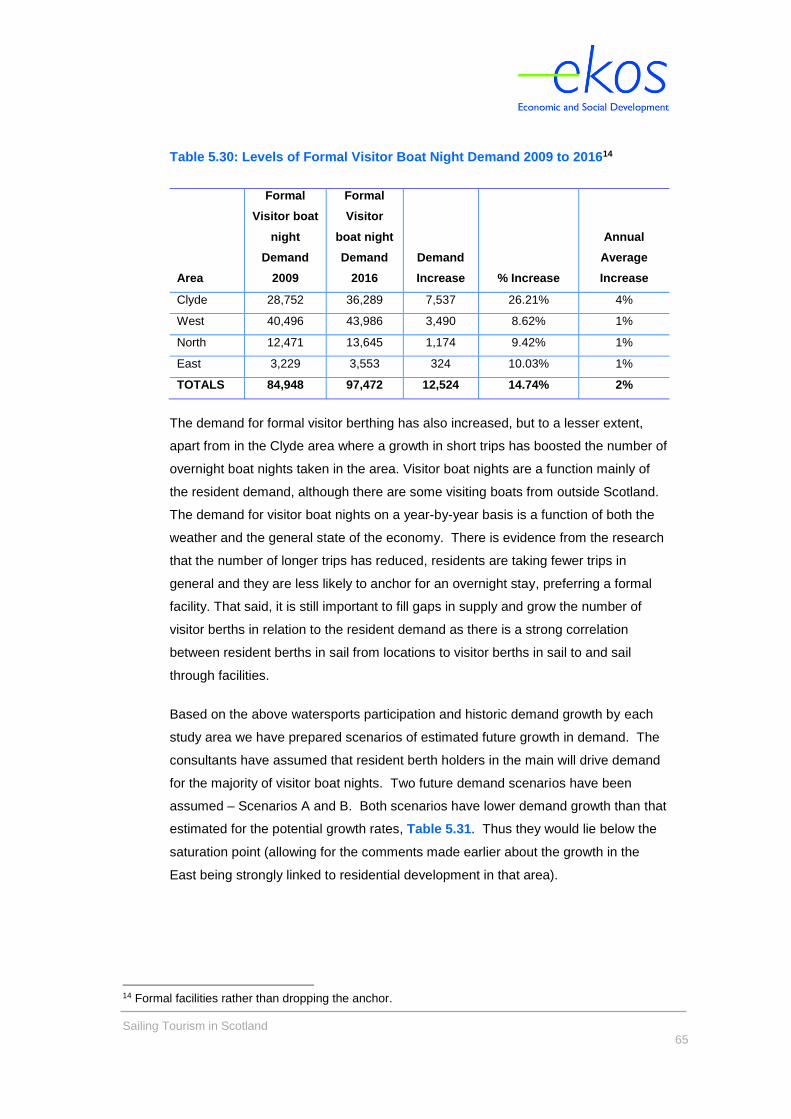
Sailing Tourism in Scotland
65
Table 5.30: Levels of Formal Visitor Boat Night Demand 2009 to 201614
Area
Formal
Visitor boat
night
Demand
2009
Formal
Visitor
boat night
Demand
2016
Demand
Increase % Increase
Annual
Average
Increase
Clyde 28,752 36,289 7,537 26.21% 4%
West 40,496 43,986 3,490 8.62% 1%
North 12,471 13,645 1,174 9.42% 1%
East 3,229 3,553 324 10.03% 1%
TOTALS 84,948 97,472 12,524 14.74% 2%
The demand for formal visitor berthing has also increased, but to a lesser extent,
apart from in the Clyde area where a growth in short trips has boosted the number of
overnight boat nights taken in the area. Visitor boat nights are a function mainly of
the resident demand, although there are some visiting boats from outside Scotland.
The demand for visitor boat nights on a year-by-year basis is a function of both the
weather and the general state of the economy. There is evidence from the research
that the number of longer trips has reduced, residents are taking fewer trips in
general and they are less likely to anchor for an overnight stay, preferring a formal
facility. That said, it is still important to fill gaps in supply and grow the number of
visitor berths in relation to the resident demand as there is a strong correlation
between resident berths in sail from locations to visitor berths in sail to and sail
through facilities.
Based on the above watersports participation and historic demand growth by each
study area we have prepared scenarios of estimated future growth in demand. The
consultants have assumed that resident berth holders in the main will drive demand
for the majority of visitor boat nights. Two future demand scenarios have been
assumed – Scenarios A and B. Both scenarios have lower demand growth than that
estimated for the potential growth rates, Table 5.31. Thus they would lie below the
saturation point (allowing for the comments made earlier about the growth in the
East being strongly linked to residential development in that area).
14 Formal facilities rather than dropping the anchor.
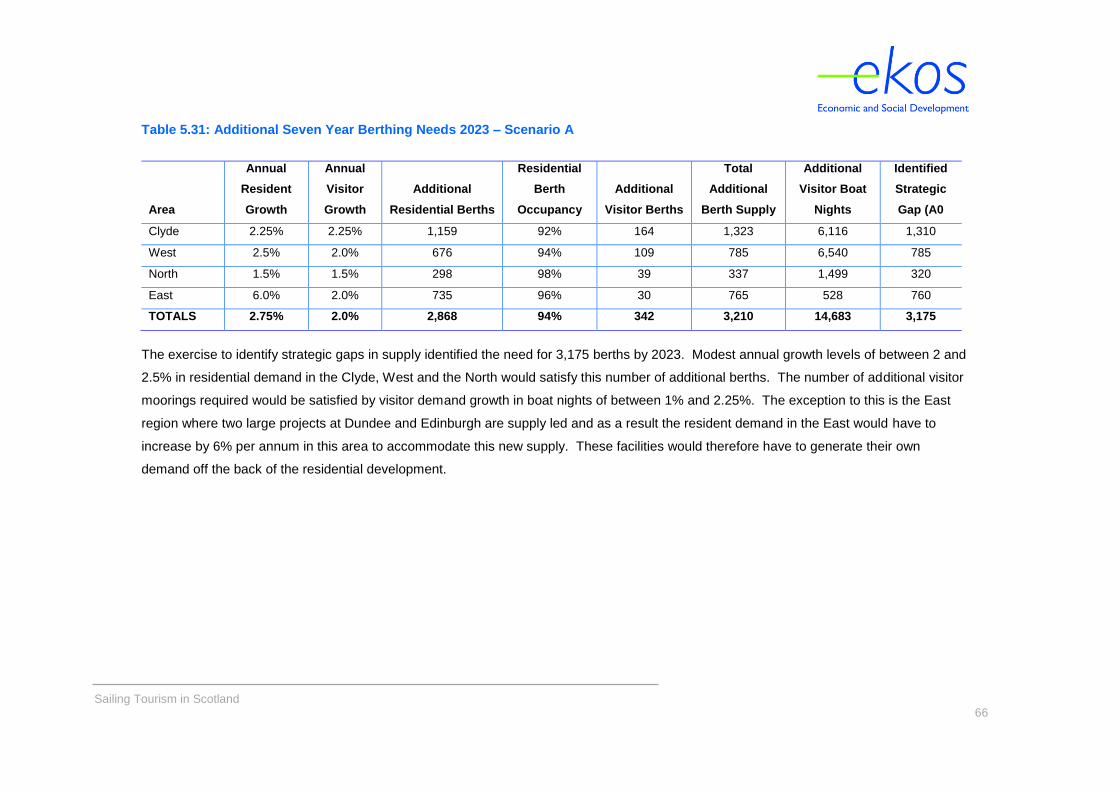
Sailing Tourism in Scotland
66
Table 5.31: Additional Seven Year Berthing Needs 2023 – Scenario A
Area
Annual
Resident
Growth
Annual
Visitor
Growth
Additional
Residential Berths
Residential
Berth
Occupancy
Additional
Visitor Berths
Total
Additional
Berth Supply
Additional
Visitor Boat
Nights
Identified
Strategic
Gap (A0
Clyde 2.25% 2.25% 1,159 92% 164 1,323 6,116 1,310
West 2.5% 2.0% 676 94% 109 785 6,540 785
North 1.5% 1.5% 298 98% 39 337 1,499 320
East 6.0% 2.0% 735 96% 30 765 528 760
TOTALS 2.75% 2.0% 2,868 94% 342 3,210 14,683 3,175
The exercise to identify strategic gaps in supply identified the need for 3,175 berths by 2023. Modest annual growth levels of between 2 and
2.5% in residential demand in the Clyde, West and the North would satisfy this number of additional berths. The number of additional visitor
moorings required would be satisfied by visitor demand growth in boat nights of between 1% and 2.25%. The exception to this is the East
region where two large projects at Dundee and Edinburgh are supply led and as a result the resident demand in the East would have to
increase by 6% per annum in this area to accommodate this new supply. These facilities would therefore have to generate their own
demand off the back of the residential development.
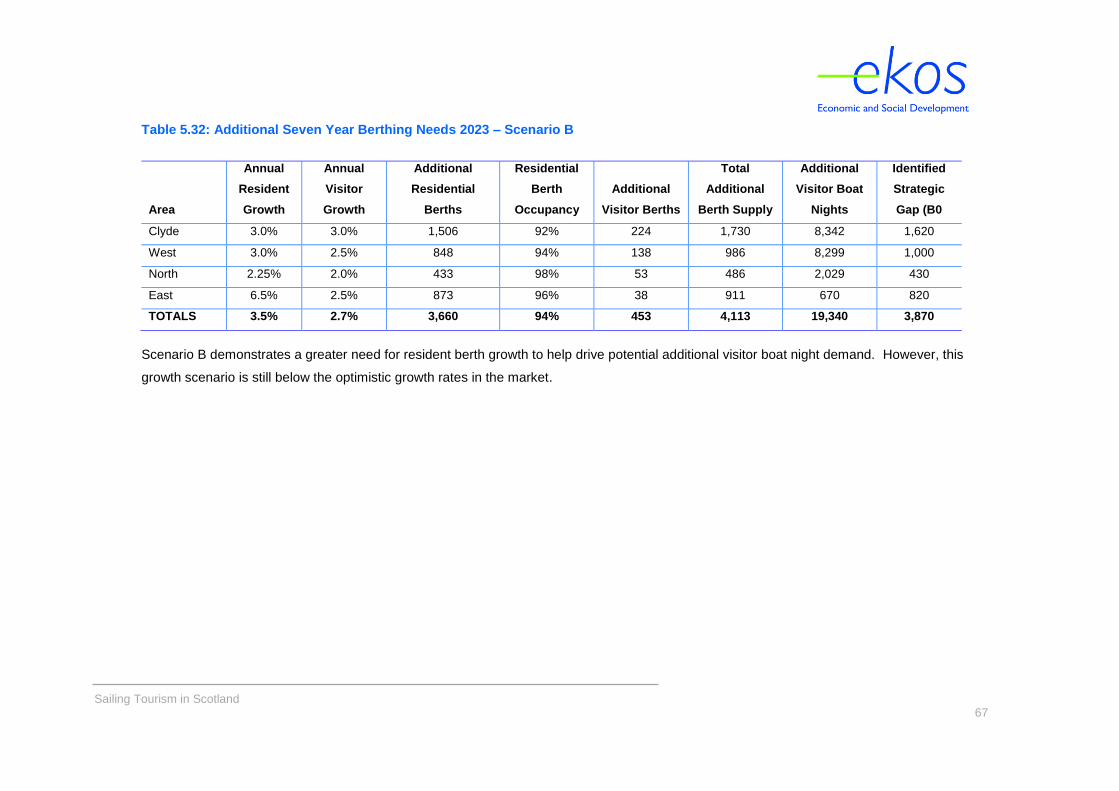
Sailing Tourism in Scotland
67
Table 5.32: Additional Seven Year Berthing Needs 2023 – Scenario B
Area
Annual
Resident
Growth
Annual
Visitor
Growth
Additional
Residential
Berths
Residential
Berth
Occupancy
Additional
Visitor Berths
Total
Additional
Berth Supply
Additional
Visitor Boat
Nights
Identified
Strategic
Gap (B0
Clyde 3.0% 3.0% 1,506 92% 224 1,730 8,342 1,620
West 3.0% 2.5% 848 94% 138 986 8,299 1,000
North 2.25% 2.0% 433 98% 53 486 2,029 430
East 6.5% 2.5% 873 96% 38 911 670 820
TOTALS 3.5% 2.7% 3,660 94% 453 4,113 19,340 3,870
Scenario B demonstrates a greater need for resident berth growth to help drive potential additional visitor boat night demand. However, this
growth scenario is still below the optimistic growth rates in the market.
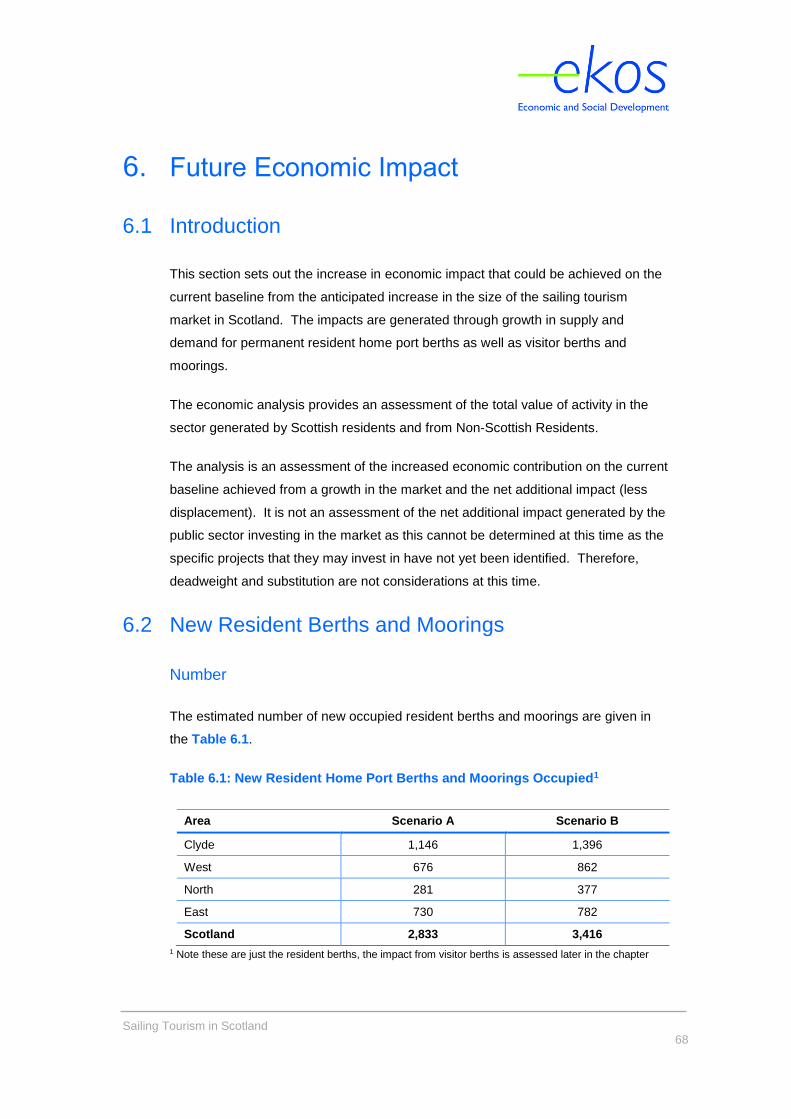
Sailing Tourism in Scotland
68
6. Future Economic Impact
6.1 Introduction
This section sets out the increase in economic impact that could be achieved on the
current baseline from the anticipated increase in the size of the sailing tourism
market in Scotland. The impacts are generated through growth in supply and
demand for permanent resident home port berths as well as visitor berths and
moorings.
The economic analysis provides an assessment of the total value of activity in the
sector generated by Scottish residents and from Non-Scottish Residents.
The analysis is an assessment of the increased economic contribution on the current
baseline achieved from a growth in the market and the net additional impact (less
displacement). It is not an assessment of the net additional impact generated by the
public sector investing in the market as this cannot be determined at this time as the
specific projects that they may invest in have not yet been identified. Therefore,
deadweight and substitution are not considerations at this time.
6.2 New Resident Berths and Moorings
Number
The estimated number of new occupied resident berths and moorings are given in
the Table 6.1.
Table 6.1: New Resident Home Port Berths and Moorings Occupied1
Area Scenario A Scenario B
Clyde 1,146 1,396
West 676 862
North 281 377
East 730 782
Scotland 2,833 3,416
1 Note these are just the resident berths, the impact from visitor berths is assessed later in the chapter
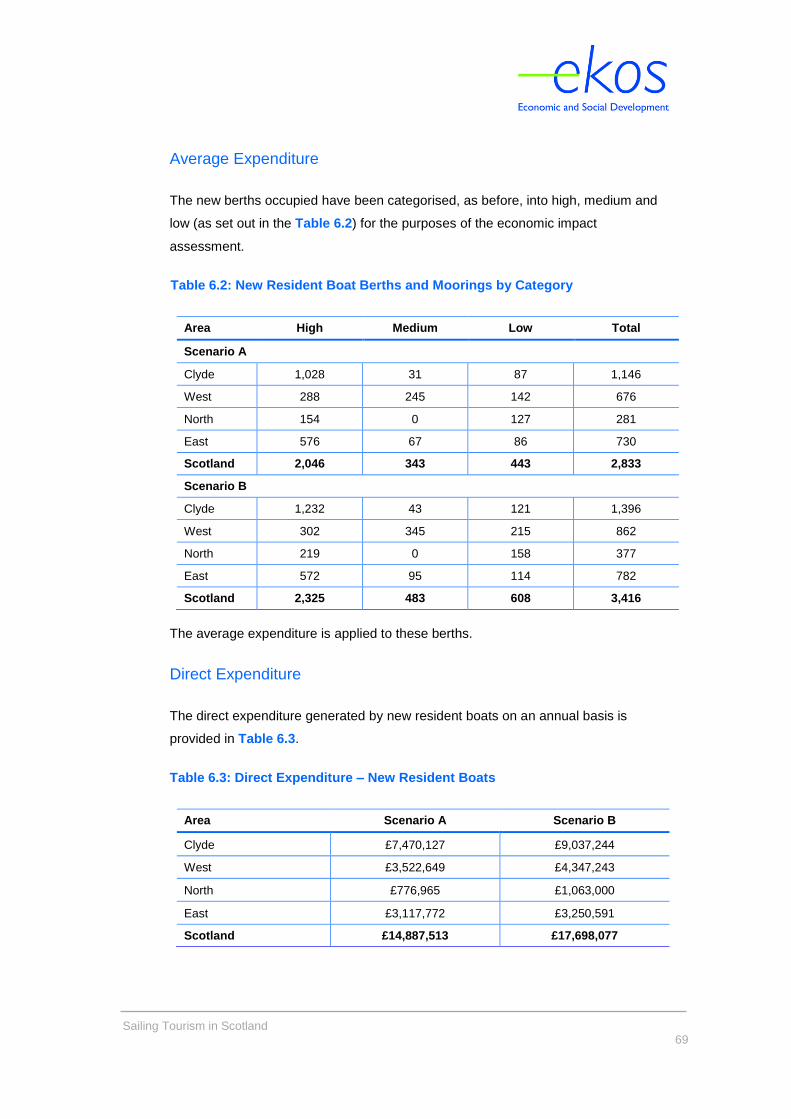
Sailing Tourism in Scotland
69
Average Expenditure
The new berths occupied have been categorised, as before, into high, medium and
low (as set out in the Table 6.2) for the purposes of the economic impact
assessment.
Table 6.2: New Resident Boat Berths and Moorings by Category
Area High Medium Low Total
Scenario A
Clyde 1,028 31 87 1,146
West 288 245 142 676
North 154 0 127 281
East 576 67 86 730
Scotland 2,046 343 443 2,833
Scenario B
Clyde 1,232 43 121 1,396
West 302 345 215 862
North 219 0 158 377
East 572 95 114 782
Scotland 2,325 483 608 3,416
The average expenditure is applied to these berths.
Direct Expenditure
The direct expenditure generated by new resident boats on an annual basis is
provided in Table 6.3.
Table 6.3: Direct Expenditure – New Resident Boats
Area Scenario A Scenario B
Clyde £7,470,127 £9,037,244
West £3,522,649 £4,347,243
North £776,965 £1,063,000
East £3,117,772 £3,250,591
Scotland £14,887,513 £17,698,077
Sailing Tourism in Scotland
70
Displacement
Displacement is an assessment of the extent to which expenditure is simply moved
from one part of the economy (in this case the Scottish economy) to another. We
have estimated displacement levels in order to provide an analysis showing the
overall size of the future market and the net additional market (with displacement
applied).
There will be no displacement for the non-Scottish boat owners. They are new and
will have been attracted to Scotland as a result of the developments that will have
taken place in the market. For the Scottish boat owner there will be displacement as
a proportion of their expenditure would already have been taking place in the
Scottish economy. High displacement ranges from 70-90% and normally Scottish
residents’ expenditure would tend to be at the high end of this. However, within the
sailing market there are some reasons that would suggest that this would be lower,
including:
Some Scottish residents may be encouraged to move their boat from other
locations back to Scotland; and
As the expenditure amounts to a lot over the year, it is reasonable to
assume that some of the expenditure that would now be spent on a boat
would have been used for short breaks/holidays outwith Scotland.
For these reasons we have assumed that the level of displacement would be at the
lower end of the high displacement – 70%.
Multipliers
This direct economic activity also has two types of wider impact on the economy.
We have applied the combined multiplier of 1.68.
Total Expenditure
We have provided two figures: the total value of the market (by only applying the
multipliers) and net additional impact (by applying displacement and multipliers).
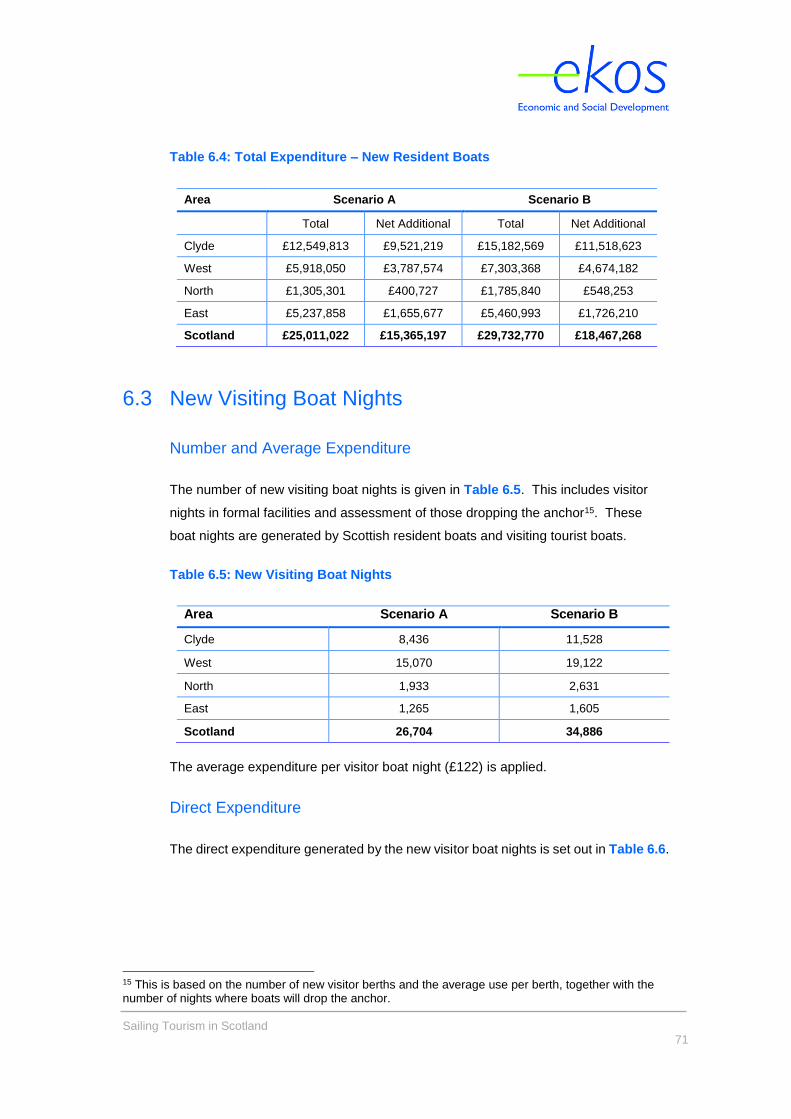
Sailing Tourism in Scotland
71
Table 6.4: Total Expenditure – New Resident Boats
Area Scenario A Scenario B
Total Net Additional Total Net Additional
Clyde £12,549,813 £9,521,219 £15,182,569 £11,518,623
West £5,918,050 £3,787,574 £7,303,368 £4,674,182
North £1,305,301 £400,727 £1,785,840 £548,253
East £5,237,858 £1,655,677 £5,460,993 £1,726,210
Scotland £25,011,022 £15,365,197 £29,732,770 £18,467,268
6.3 New Visiting Boat Nights
Number and Average Expenditure
The number of new visiting boat nights is given in Table 6.5. This includes visitor
nights in formal facilities and assessment of those dropping the anchor15. These
boat nights are generated by Scottish resident boats and visiting tourist boats.
Table 6.5: New Visiting Boat Nights
Area Scenario A Scenario B
Clyde 8,436 11,528
West 15,070 19,122
North 1,933 2,631
East 1,265 1,605
Scotland 26,704 34,886
The average expenditure per visitor boat night (£122) is applied.
Direct Expenditure
The direct expenditure generated by the new visitor boat nights is set out in Table 6.6.
15 This is based on the number of new visitor berths and the average use per berth, together with the number of nights where boats will drop the anchor.
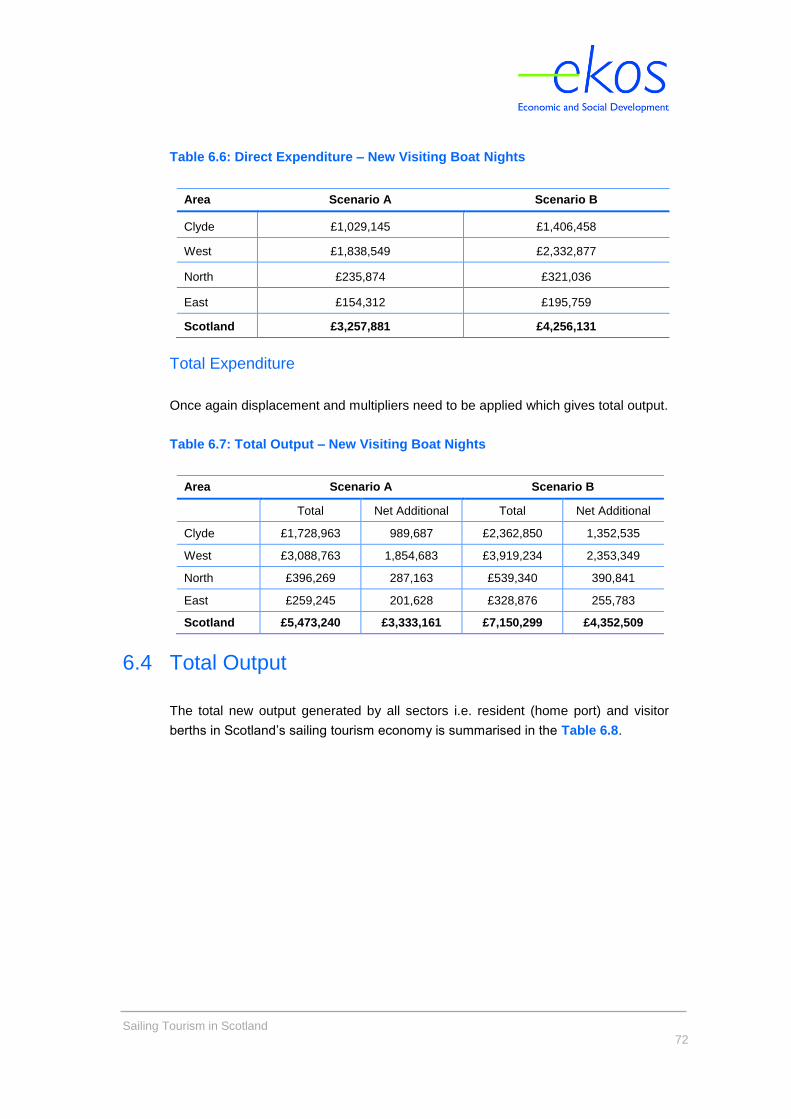
Sailing Tourism in Scotland
72
Table 6.6: Direct Expenditure – New Visiting Boat Nights
Area Scenario A Scenario B
Clyde £1,029,145 £1,406,458
West £1,838,549 £2,332,877
North £235,874 £321,036
East £154,312 £195,759
Scotland £3,257,881 £4,256,131
Total Expenditure
Once again displacement and multipliers need to be applied which gives total output.
Table 6.7: Total Output – New Visiting Boat Nights
Area Scenario A Scenario B
Total Net Additional Total Net Additional
Clyde £1,728,963 989,687 £2,362,850 1,352,535
West £3,088,763 1,854,683 £3,919,234 2,353,349
North £396,269 287,163 £539,340 390,841
East £259,245 201,628 £328,876 255,783
Scotland £5,473,240 £3,333,161 £7,150,299 £4,352,509
6.4 Total Output
The total new output generated by all sectors i.e. resident (home port) and visitor
berths in Scotland’s sailing tourism economy is summarised in the Table 6.8.

Sailing Tourism in Scotland
73
Figure 6.8: Total New Output – Resident and Visiting Boats
Area
Resident
(Home Port) Berths Visitor Berths Total
Total
Scenario A
Clyde £12,549,813 £1,728,963 £14,278,776
West £5,918,050 £3,088,763 £9,006,813
North £1,305,301 £396,269 £1,701,570
East £5,237,858 £259,245 £5,497,102
Total £25,011,022 £5,473,240 £30,484,261
Scenario B
Clyde £15,182,569 £2,362,850 £17,545,419
West £7,303,368 £3,919,234 £11,222,602
North £1,785,840 £539,340 £2,325,179
East £5,460,993 £328,876 £5,789,869
Total £29,732,770 £7,150,299 £36,883,069
Net Additional
Scenario A
Clyde £9,521,219 £989,687 £10,510,906
West £3,787,574 £1,854,683 £5,642,257
North £400,727 £287,163 £687,890
East £1,655,677 £201,628 £1,857,305
Total £15,365,197 £3,333,161 £18,698,359
Scenario B
Clyde £11,518,623 £1,352,535 £12,871,158
West £4,674,182 £2,353,349 £7,027,531
North £548,253 £390,841 £939,094
East £1,726,210 £255,783 £1,981,993
Total £18,467,268 £4,352,509 £22,819,777
6.5 Employment
The level of employment that this expenditure supports can be estimated using an
output: employment ratio. Applying this gives employment impacts as set out in
Table 6.9.
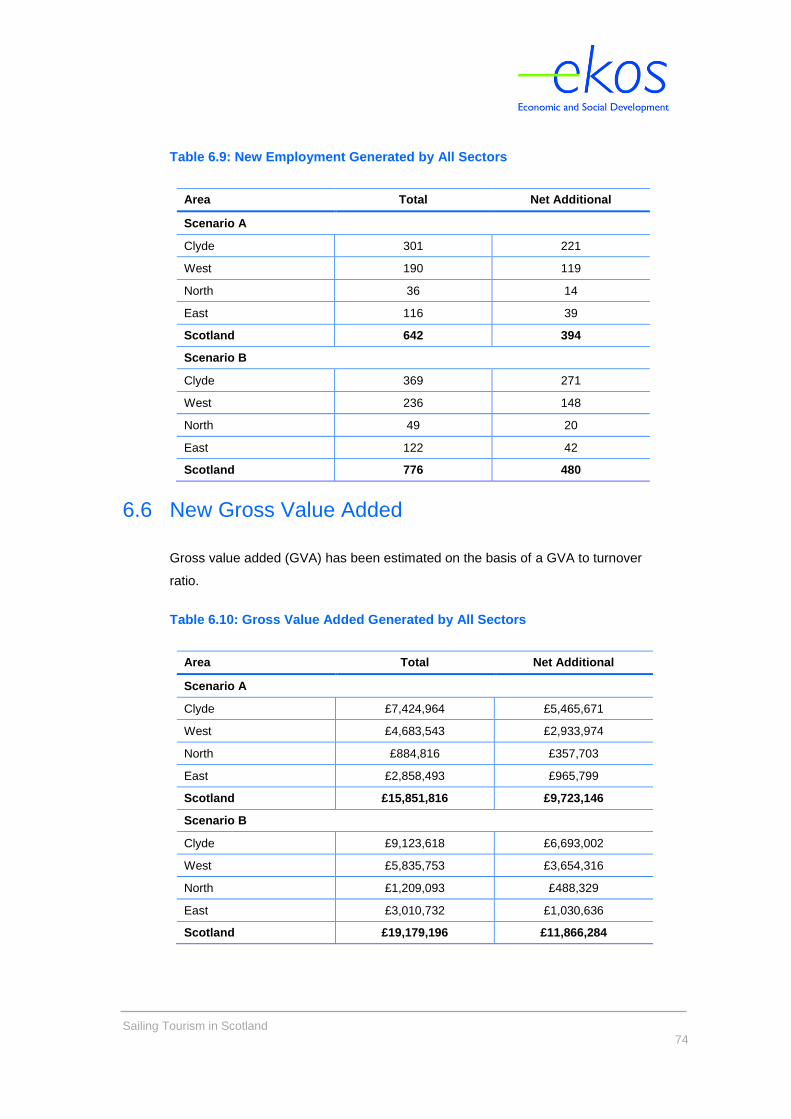
Sailing Tourism in Scotland
74
Table 6.9: New Employment Generated by All Sectors
Area Total Net Additional
Scenario A
Clyde 301 221
West 190 119
North 36 14
East 116 39
Scotland 642 394
Scenario B
Clyde 369 271
West 236 148
North 49 20
East 122 42
Scotland 776 480
6.6 New Gross Value Added
Gross value added (GVA) has been estimated on the basis of a GVA to turnover
ratio.
Table 6.10: Gross Value Added Generated by All Sectors
Area Total Net Additional
Scenario A
Clyde £7,424,964 £5,465,671
West £4,683,543 £2,933,974
North £884,816 £357,703
East £2,858,493 £965,799
Scotland £15,851,816 £9,723,146
Scenario B
Clyde £9,123,618 £6,693,002
West £5,835,753 £3,654,316
North £1,209,093 £488,329
East £3,010,732 £1,030,636
Scotland £19,179,196 £11,866,284
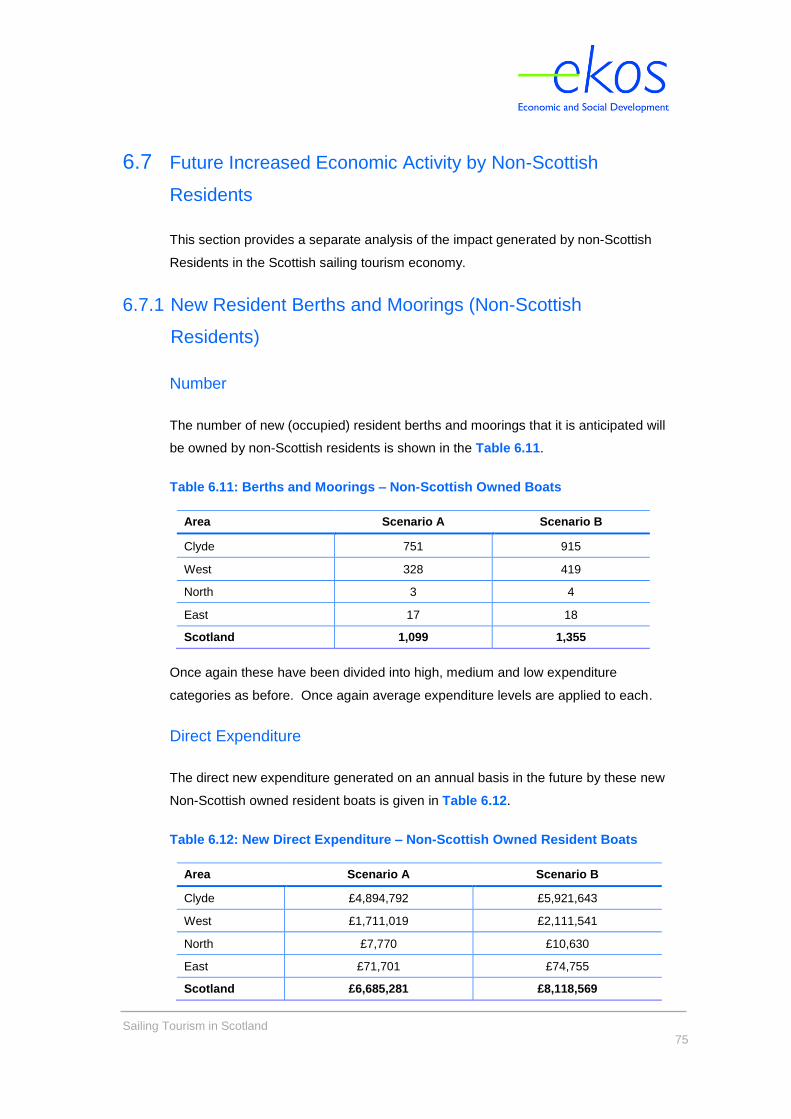
Sailing Tourism in Scotland
75
6.7 Future Increased Economic Activity by Non-Scottish
Residents
This section provides a separate analysis of the impact generated by non-Scottish
Residents in the Scottish sailing tourism economy.
6.7.1 New Resident Berths and Moorings (Non-Scottish
Residents)
Number
The number of new (occupied) resident berths and moorings that it is anticipated will
be owned by non-Scottish residents is shown in the Table 6.11.
Table 6.11: Berths and Moorings – Non-Scottish Owned Boats
Area Scenario A Scenario B
Clyde 751 915
West 328 419
North 3 4
East 17 18
Scotland 1,099 1,355
Once again these have been divided into high, medium and low expenditure
categories as before. Once again average expenditure levels are applied to each.
Direct Expenditure
The direct new expenditure generated on an annual basis in the future by these new
Non-Scottish owned resident boats is given in Table 6.12.
Table 6.12: New Direct Expenditure – Non-Scottish Owned Resident Boats
Area Scenario A Scenario B
Clyde £4,894,792 £5,921,643
West £1,711,019 £2,111,541
North £7,770 £10,630
East £71,701 £74,755
Scotland £6,685,281 £8,118,569
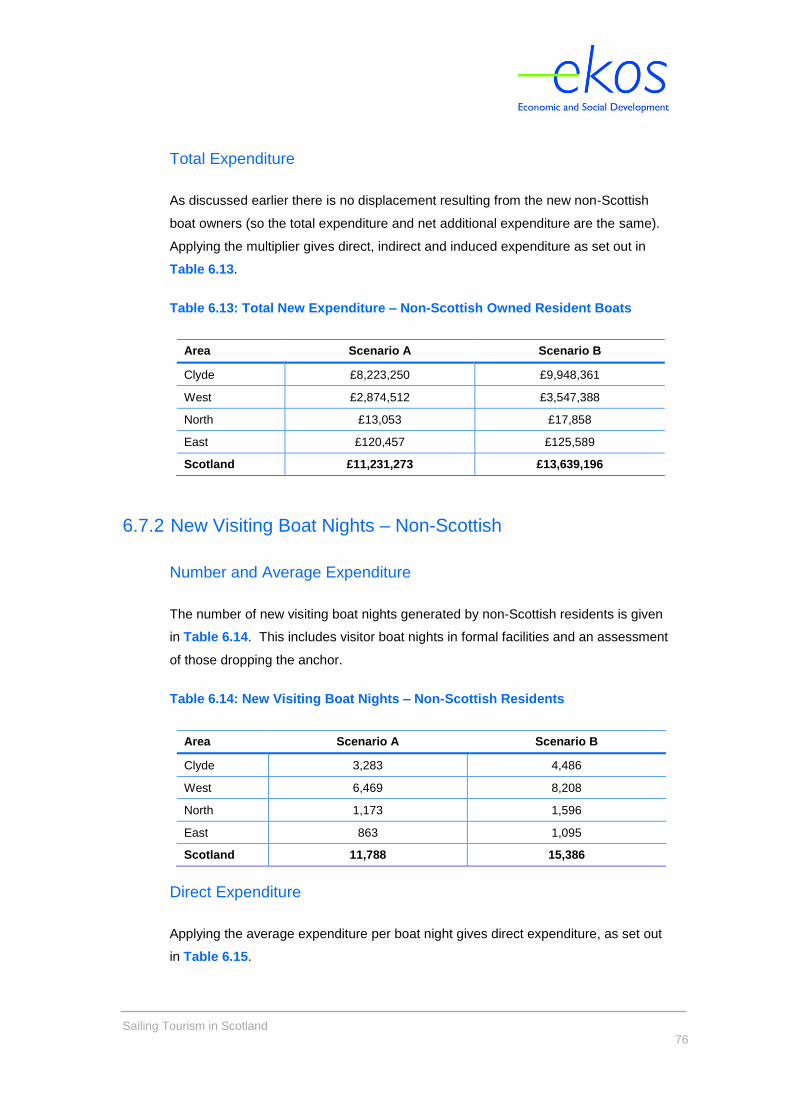
Sailing Tourism in Scotland
76
Total Expenditure
As discussed earlier there is no displacement resulting from the new non-Scottish
boat owners (so the total expenditure and net additional expenditure are the same).
Applying the multiplier gives direct, indirect and induced expenditure as set out in
Table 6.13.
Table 6.13: Total New Expenditure – Non-Scottish Owned Resident Boats
Area Scenario A Scenario B
Clyde £8,223,250 £9,948,361
West £2,874,512 £3,547,388
North £13,053 £17,858
East £120,457 £125,589
Scotland £11,231,273 £13,639,196
6.7.2 New Visiting Boat Nights – Non-Scottish
Number and Average Expenditure
The number of new visiting boat nights generated by non-Scottish residents is given
in Table 6.14. This includes visitor boat nights in formal facilities and an assessment
of those dropping the anchor.
Table 6.14: New Visiting Boat Nights – Non-Scottish Residents
Area Scenario A Scenario B
Clyde 3,283 4,486
West 6,469 8,208
North 1,173 1,596
East 863 1,095
Scotland 11,788 15,386
Direct Expenditure
Applying the average expenditure per boat night gives direct expenditure, as set out
in Table 6.15.
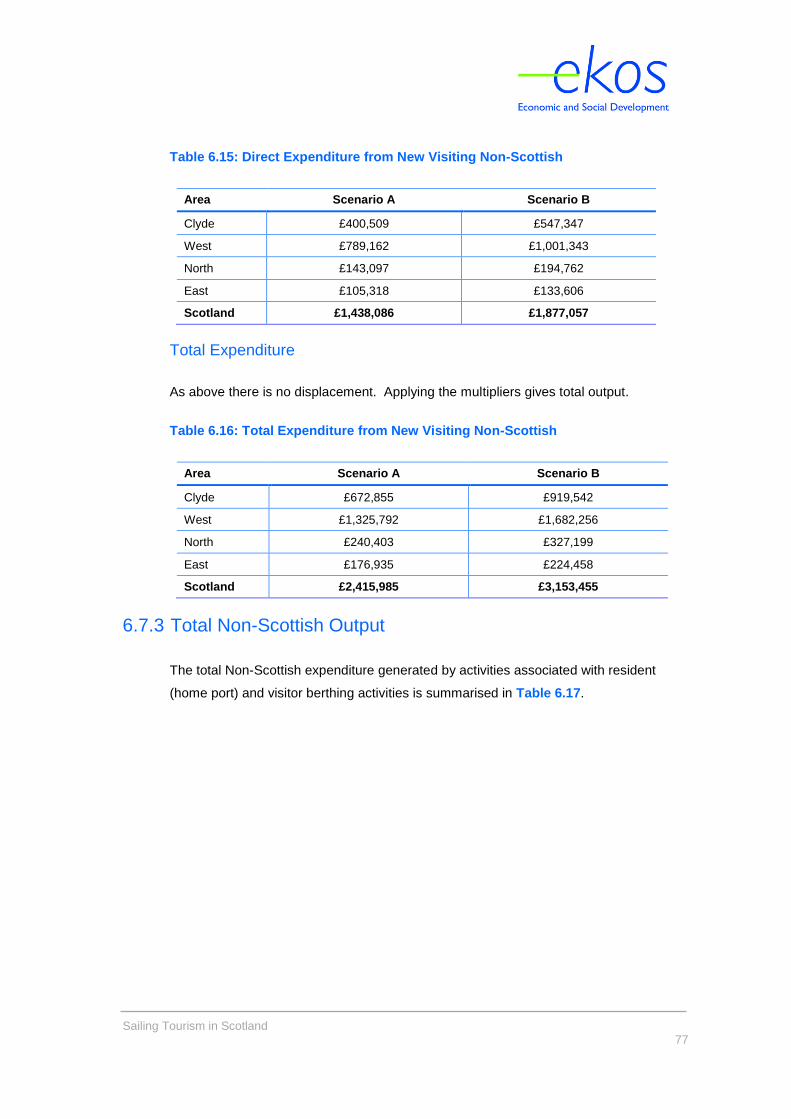
Sailing Tourism in Scotland
77
Table 6.15: Direct Expenditure from New Visiting Non-Scottish
Area Scenario A Scenario B
Clyde £400,509 £547,347
West £789,162 £1,001,343
North £143,097 £194,762
East £105,318 £133,606
Scotland £1,438,086 £1,877,057
Total Expenditure
As above there is no displacement. Applying the multipliers gives total output.
Table 6.16: Total Expenditure from New Visiting Non-Scottish
Area Scenario A Scenario B
Clyde £672,855 £919,542
West £1,325,792 £1,682,256
North £240,403 £327,199
East £176,935 £224,458
Scotland £2,415,985 £3,153,455
6.7.3 Total Non-Scottish Output
The total Non-Scottish expenditure generated by activities associated with resident
(home port) and visitor berthing activities is summarised in Table 6.17.

Sailing Tourism in Scotland
78
Table 6.17: Total New Non-Scottish Output
Area From Resident
(Home Port) Berths From Visitor
Berths Total
Scenario A
Clyde £8,223,250 £672,855 £8,896,105
West £2,874,512 £1,325,792 £4,200,305
North £13,053 £240,403 £253,456
East £120,457 £176,935 £297,392
Total £11,231,273 £2,415,985 £13,647,257
Scenario B
Clyde £9,948,361 £919,542 £10,867,903
West £3,547,388 £1,682,256 £5,229,644
North £17,858 £327,199 £345,058
East £125,589 £224,458 £350,047
Total £13,639,196 £3,153,455 £16,792,652
6.7.4 Employment and Gross Value Added
Applying the output: employment and GVA factors gives employment and gross
value added, from Non-Scottish residents’ activity as set out in Tables 6.18 and
6.19.
Table 6.18: Employment from New Non-Scottish Activity (FTEs)
Scenario A
Clyde 187
West 88
North 5
East 6
Scotland 287
Scenario B
Clyde 229
West 110
North 7
East 7
Scotland 354
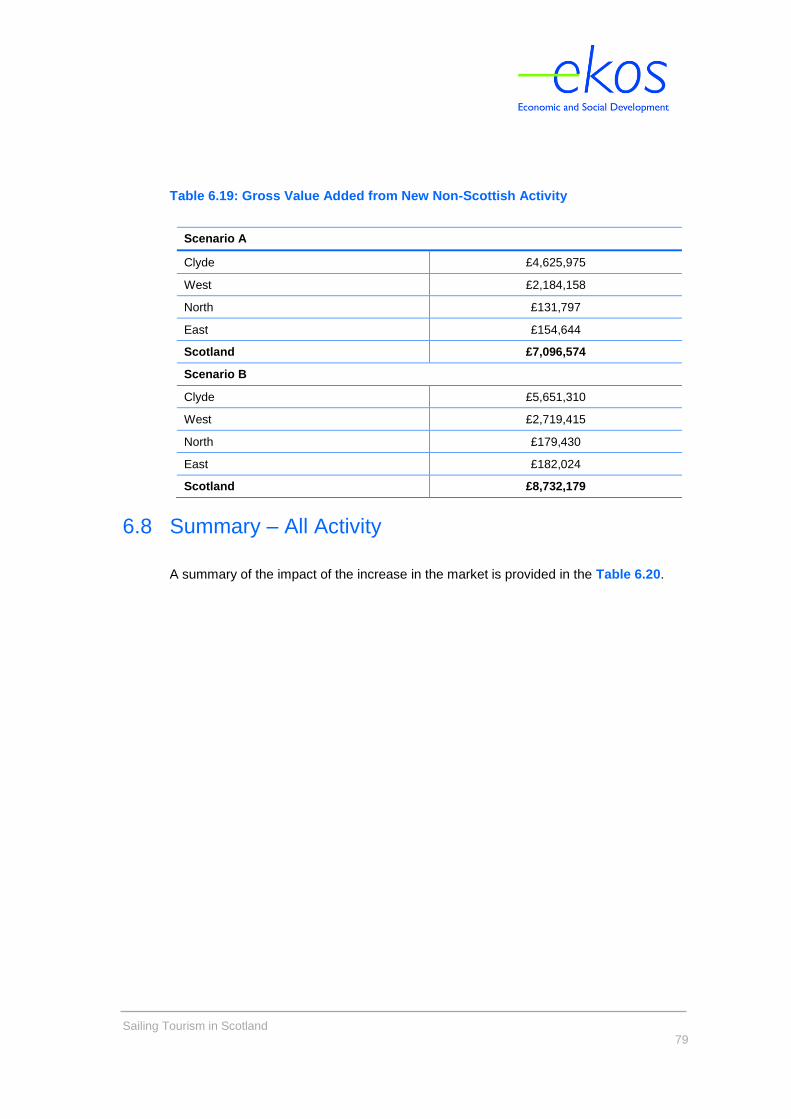
Sailing Tourism in Scotland
79
Table 6.19: Gross Value Added from New Non-Scottish Activity
Scenario A
Clyde £4,625,975
West £2,184,158
North £131,797
East £154,644
Scotland £7,096,574
Scenario B
Clyde £5,651,310
West £2,719,415
North £179,430
East £182,024
Scotland £8,732,179
6.8 Summary – All Activity
A summary of the impact of the increase in the market is provided in the Table 6.20.
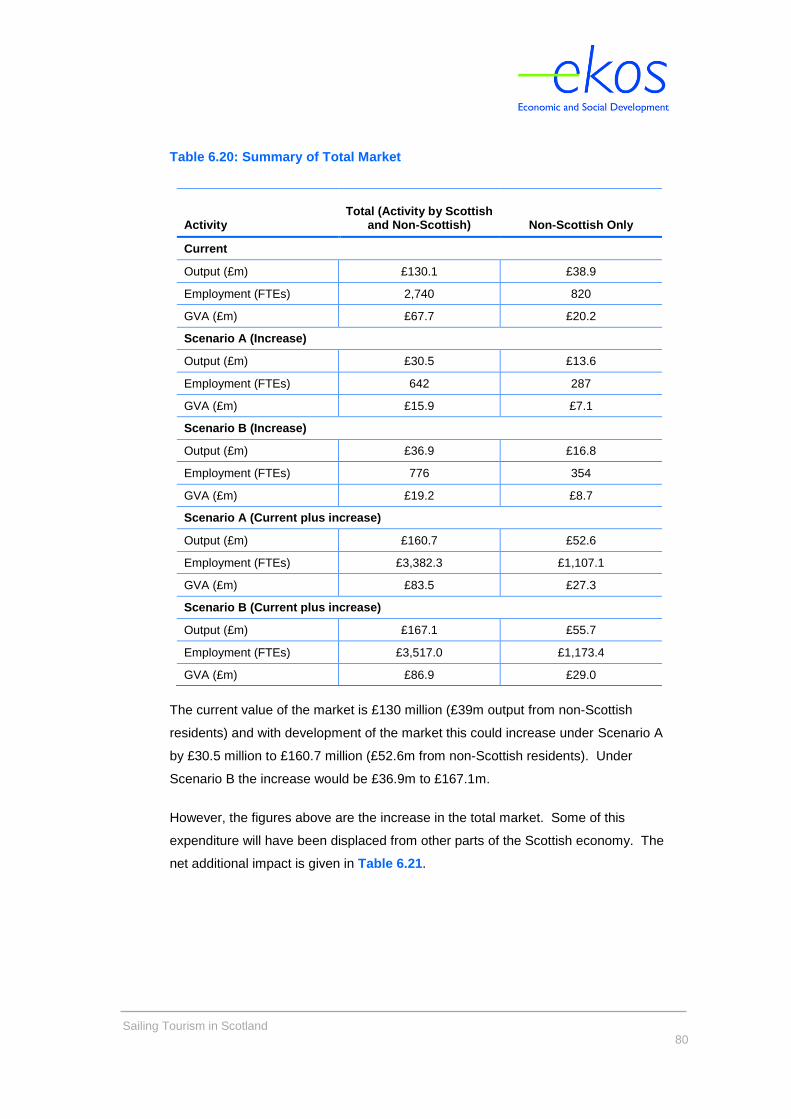
Sailing Tourism in Scotland
80
Table 6.20: Summary of Total Market
Activity Total (Activity by Scottish
and Non-Scottish) Non-Scottish Only
Current
Output (£m) £130.1 £38.9
Employment (FTEs) 2,740 820
GVA (£m) £67.7 £20.2
Scenario A (Increase)
Output (£m) £30.5 £13.6
Employment (FTEs) 642 287
GVA (£m) £15.9 £7.1
Scenario B (Increase)
Output (£m) £36.9 £16.8
Employment (FTEs) 776 354
GVA (£m) £19.2 £8.7
Scenario A (Current plus increase)
Output (£m) £160.7 £52.6
Employment (FTEs) £3,382.3 £1,107.1
GVA (£m) £83.5 £27.3
Scenario B (Current plus increase)
Output (£m) £167.1 £55.7
Employment (FTEs) £3,517.0 £1,173.4
GVA (£m) £86.9 £29.0
The current value of the market is £130 million (£39m output from non-Scottish
residents) and with development of the market this could increase under Scenario A
by £30.5 million to £160.7 million (£52.6m from non-Scottish residents). Under
Scenario B the increase would be £36.9m to £167.1m.
However, the figures above are the increase in the total market. Some of this
expenditure will have been displaced from other parts of the Scottish economy. The
net additional impact is given in Table 6.21.
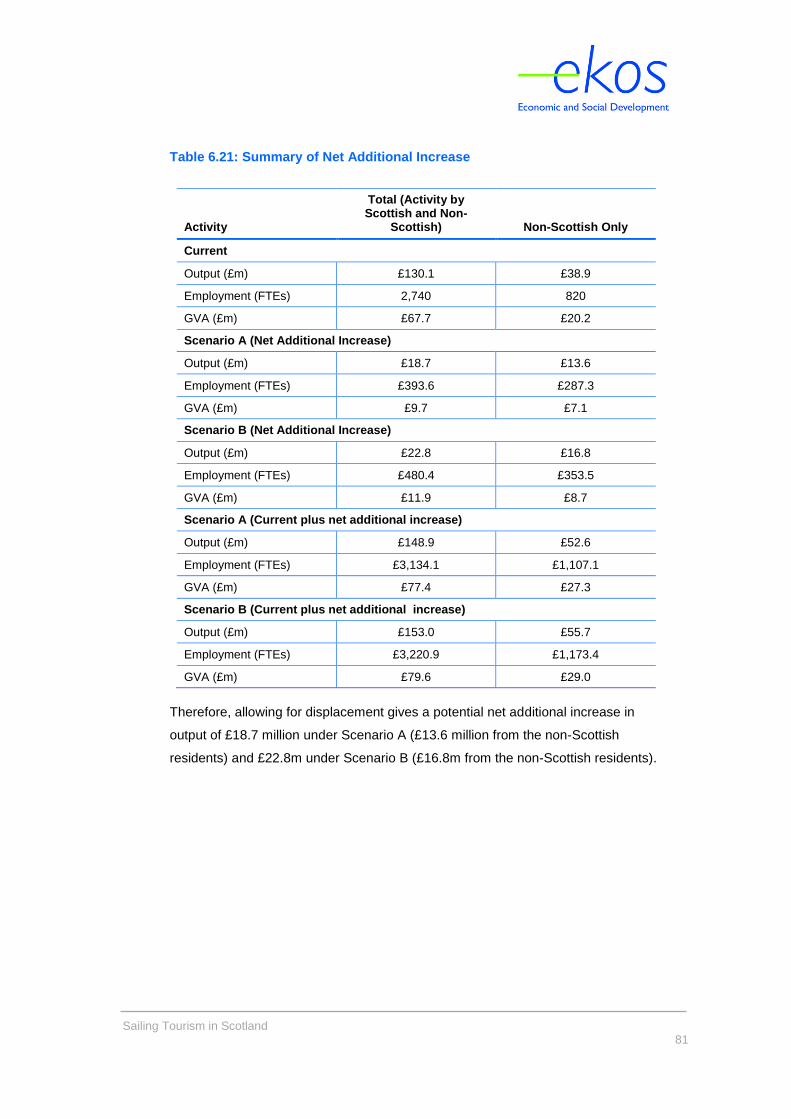
Sailing Tourism in Scotland
81
Table 6.21: Summary of Net Additional Increase
Activity
Total (Activity by Scottish and Non-
Scottish) Non-Scottish Only
Current
Output (£m) £130.1 £38.9
Employment (FTEs) 2,740 820
GVA (£m) £67.7 £20.2
Scenario A (Net Additional Increase)
Output (£m) £18.7 £13.6
Employment (FTEs) £393.6 £287.3
GVA (£m) £9.7 £7.1
Scenario B (Net Additional Increase)
Output (£m) £22.8 £16.8
Employment (FTEs) £480.4 £353.5
GVA (£m) £11.9 £8.7
Scenario A (Current plus net additional increase)
Output (£m) £148.9 £52.6
Employment (FTEs) £3,134.1 £1,107.1
GVA (£m) £77.4 £27.3
Scenario B (Current plus net additional increase)
Output (£m) £153.0 £55.7
Employment (FTEs) £3,220.9 £1,173.4
GVA (£m) £79.6 £29.0
Therefore, allowing for displacement gives a potential net additional increase in
output of £18.7 million under Scenario A (£13.6 million from the non-Scottish
residents) and £22.8m under Scenario B (£16.8m from the non-Scottish residents).
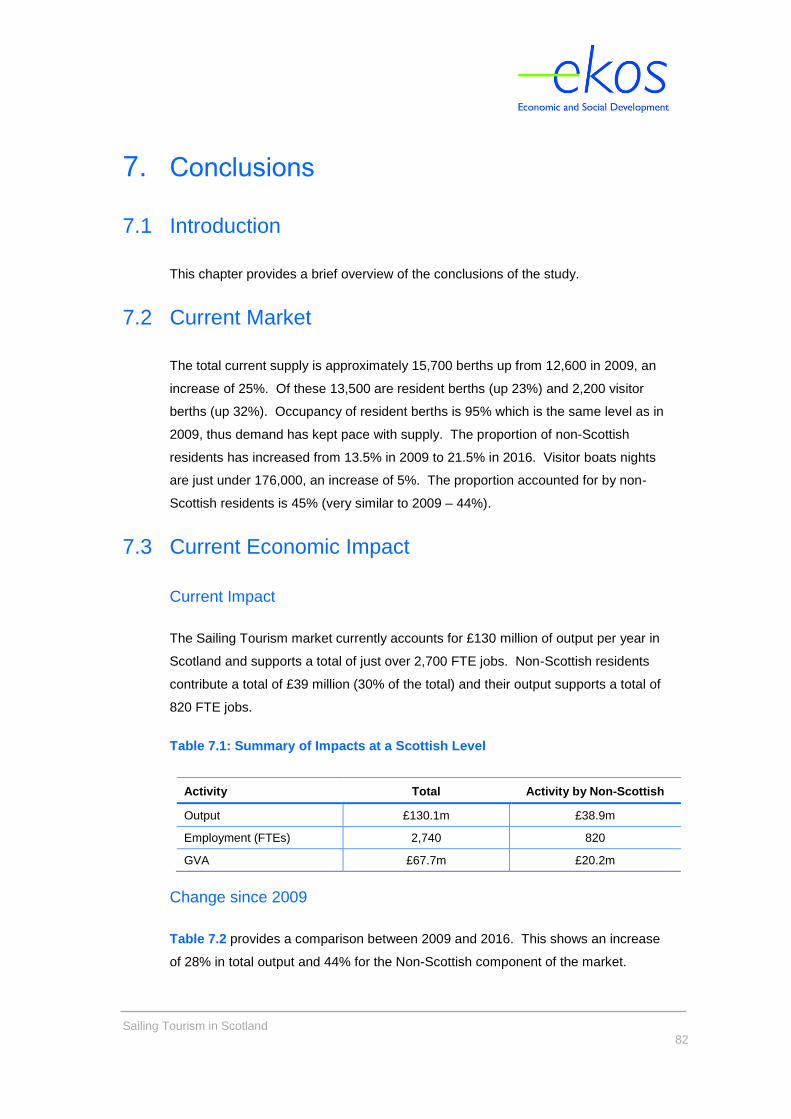
Sailing Tourism in Scotland
82
7. Conclusions
7.1 Introduction
This chapter provides a brief overview of the conclusions of the study.
7.2 Current Market
The total current supply is approximately 15,700 berths up from 12,600 in 2009, an
increase of 25%. Of these 13,500 are resident berths (up 23%) and 2,200 visitor
berths (up 32%). Occupancy of resident berths is 95% which is the same level as in
2009, thus demand has kept pace with supply. The proportion of non-Scottish
residents has increased from 13.5% in 2009 to 21.5% in 2016. Visitor boats nights
are just under 176,000, an increase of 5%. The proportion accounted for by non-
Scottish residents is 45% (very similar to 2009 – 44%).
7.3 Current Economic Impact
Current Impact
The Sailing Tourism market currently accounts for £130 million of output per year in
Scotland and supports a total of just over 2,700 FTE jobs. Non-Scottish residents
contribute a total of £39 million (30% of the total) and their output supports a total of
820 FTE jobs.
Table 7.1: Summary of Impacts at a Scottish Level
Activity Total Activity by Non-Scottish
Output £130.1m £38.9m
Employment (FTEs) 2,740 820
GVA £67.7m £20.2m
Change since 2009
Table 7.2 provides a comparison between 2009 and 2016. This shows an increase
of 28% in total output and 44% for the Non-Scottish component of the market.
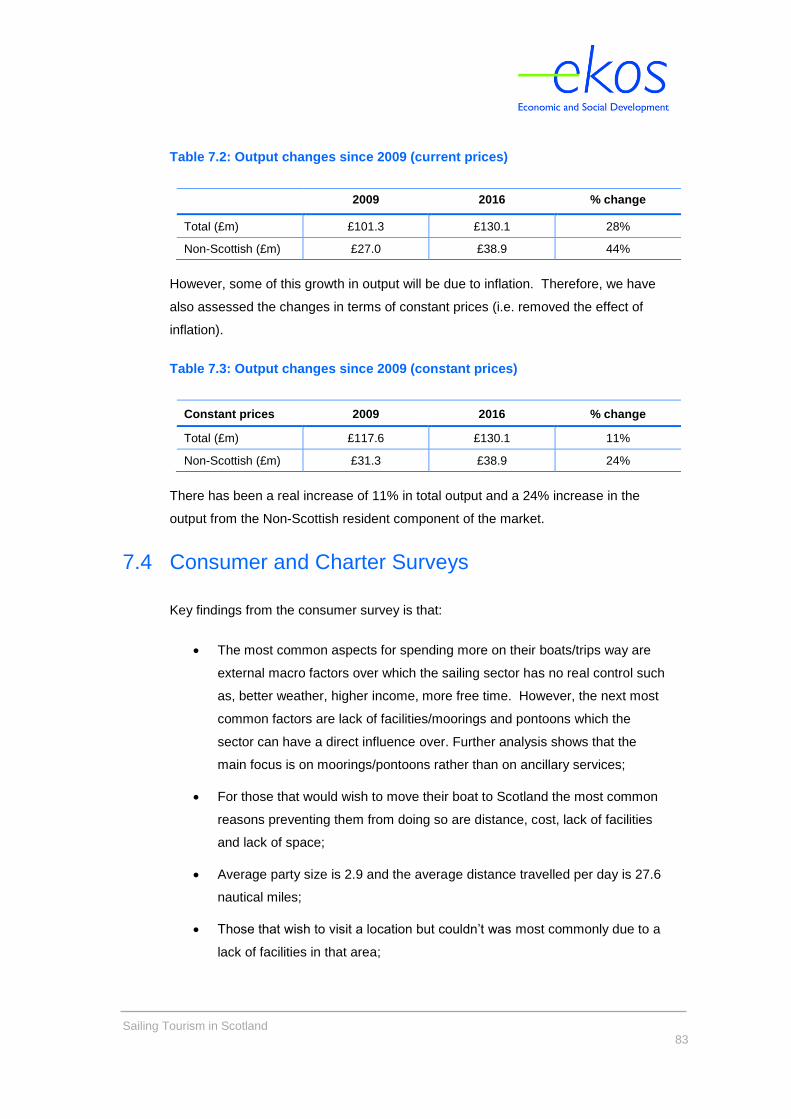
Sailing Tourism in Scotland
83
Table 7.2: Output changes since 2009 (current prices)
2009 2016 % change
Total (£m) £101.3 £130.1 28%
Non-Scottish (£m) £27.0 £38.9 44%
However, some of this growth in output will be due to inflation. Therefore, we have
also assessed the changes in terms of constant prices (i.e. removed the effect of
inflation).
Table 7.3: Output changes since 2009 (constant prices)
Constant prices 2009 2016 % change
Total (£m) £117.6 £130.1 11%
Non-Scottish (£m) £31.3 £38.9 24%
There has been a real increase of 11% in total output and a 24% increase in the
output from the Non-Scottish resident component of the market.
7.4 Consumer and Charter Surveys
Key findings from the consumer survey is that:
The most common aspects for spending more on their boats/trips way are
external macro factors over which the sailing sector has no real control such
as, better weather, higher income, more free time. However, the next most
common factors are lack of facilities/moorings and pontoons which the
sector can have a direct influence over. Further analysis shows that the
main focus is on moorings/pontoons rather than on ancillary services;
For those that would wish to move their boat to Scotland the most common
reasons preventing them from doing so are distance, cost, lack of facilities
and lack of space;
Average party size is 2.9 and the average distance travelled per day is 27.6
nautical miles;
Those that wish to visit a location but couldn’t was most commonly due to a
lack of facilities in that area;
Sailing Tourism in Scotland
84
Of those with boats moored elsewhere 37% would consider moving it to
Scotland with the most popular areas being the Clyde followed closely by
the West and to a much lower extent the East;
Charter sector:
o 35% Scottish, 45% English and 22% other UK and overseas
(customers);
o Most popular areas for visiting are the Clyde and Mull. For those
travelling further afield Outer Hebrides and Orkney;
o Areas for improvement – Inverness/Loch Ness, Moray Firth and
Oban (onshore);
o The focus for growth is in terms of the destinations they offer and
increasing the number of visitors in the shoulder months.
7.5 The Future
Strategic gaps for berthing – pontoons and moorings - have been identified, based
on planned and aspirational developments, the operator’s survey and their
aspirations, evidence of waiting lists at key resident marina, as well as the consumer
survey. In addition the consultants have considered the average daily sailing
distance of approximately 25 miles for the gap analysis.
Strategic resident hubs help to drive demand for sail to and sail through locations,
particularly to island locations where fragile rural economies are boosted by spend
from yachts and their crew.
A scoring matrix was developed and strategic gaps identified in terms of location,
classification (sail from, to or through) and size together with further discussion on
the gaps. The development opportunities in each of the four areas are set out in
Table 7.4.
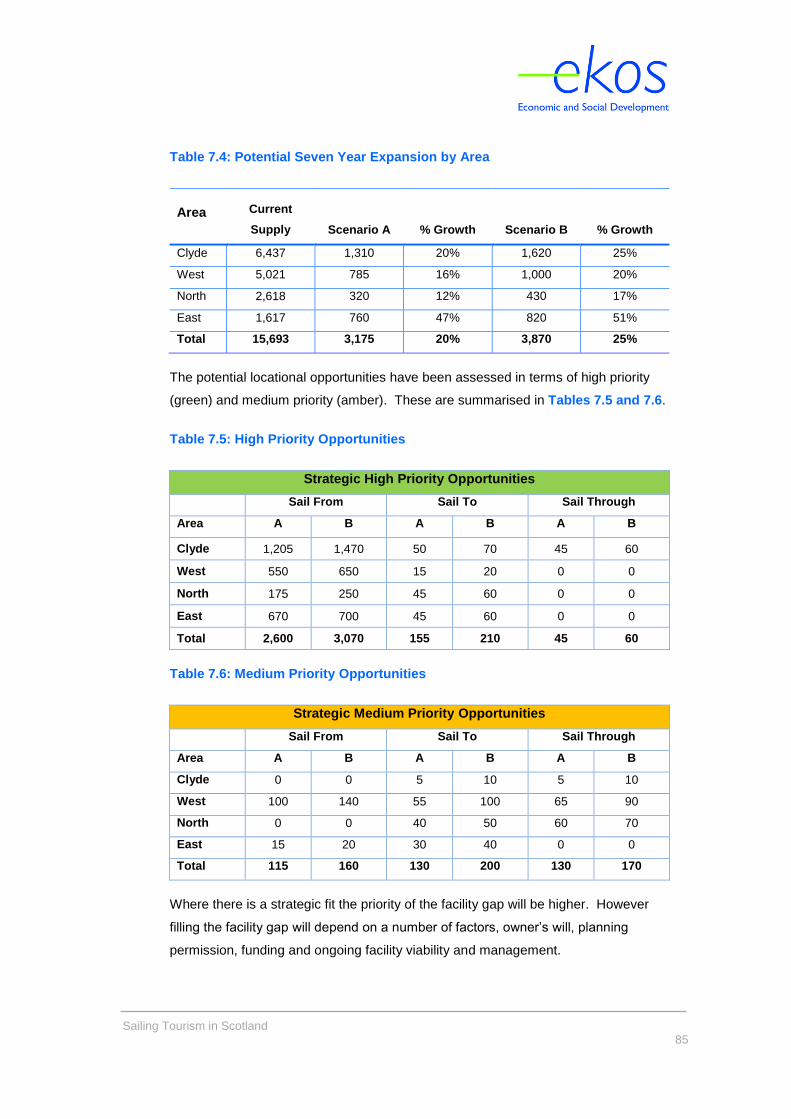
Sailing Tourism in Scotland
85
Table 7.4: Potential Seven Year Expansion by Area
Area Current
Supply Scenario A % Growth Scenario B % Growth
Clyde 6,437 1,310 20% 1,620 25%
West 5,021 785 16% 1,000 20%
North 2,618 320 12% 430 17%
East 1,617 760 47% 820 51%
Total 15,693 3,175 20% 3,870 25%
The potential locational opportunities have been assessed in terms of high priority
(green) and medium priority (amber). These are summarised in Tables 7.5 and 7.6.
Table 7.5: High Priority Opportunities
Strategic High Priority Opportunities
Sail From Sail To Sail Through
Area A B A B A B
Clyde 1,205 1,470 50 70 45 60
West 550 650 15 20 0 0
North 175 250 45 60 0 0
East 670 700 45 60 0 0
Total 2,600 3,070 155 210 45 60
Table 7.6: Medium Priority Opportunities
Strategic Medium Priority Opportunities
Sail From Sail To Sail Through
Area A B A B A B
Clyde 0 0 5 10 5 10
West 100 140 55 100 65 90
North 0 0 40 50 60 70
East 15 20 30 40 0 0
Total 115 160 130 200 130 170
Where there is a strategic fit the priority of the facility gap will be higher. However
filling the facility gap will depend on a number of factors, owner’s will, planning
permission, funding and ongoing facility viability and management.
Sailing Tourism in Scotland
86
In terms of ancillary facilities provision, this is strongly linked to the developments
and their scale. The larger resident hubs would need to offer a range of facilities in
order to attract people to berth their boat there. In terms of smaller developments
the focus is on the provision of berth/moorings and should link into existing onshore
provision where possible rather than building new facilities.
In terms of wider issues such as broadband/Wi-Fi this is something that will become
more of an issue over time. This is a broader issue in the economy than just sailing,
especially in rural areas. Whilst many of us may wish to have good connectivity
wherever we go, there is a new generation that is growing up expecting it to be the
norm, so it is something that not only sailing but all facets of the tourism sector will
need to address.
The proposed opportunities are below the saturation points accepting that the large
scale developments in the East are largely dependent on the realisation of the
associated real estate developments in those areas. Also depending on the pace of
these wider developments in the East it may be that the full impacts from these large
scale developments are not realised within the period forecast.
7.6 Future Economic Impact
A summary of the impact of the potential increase in the market is provided in the
Table 7.7.
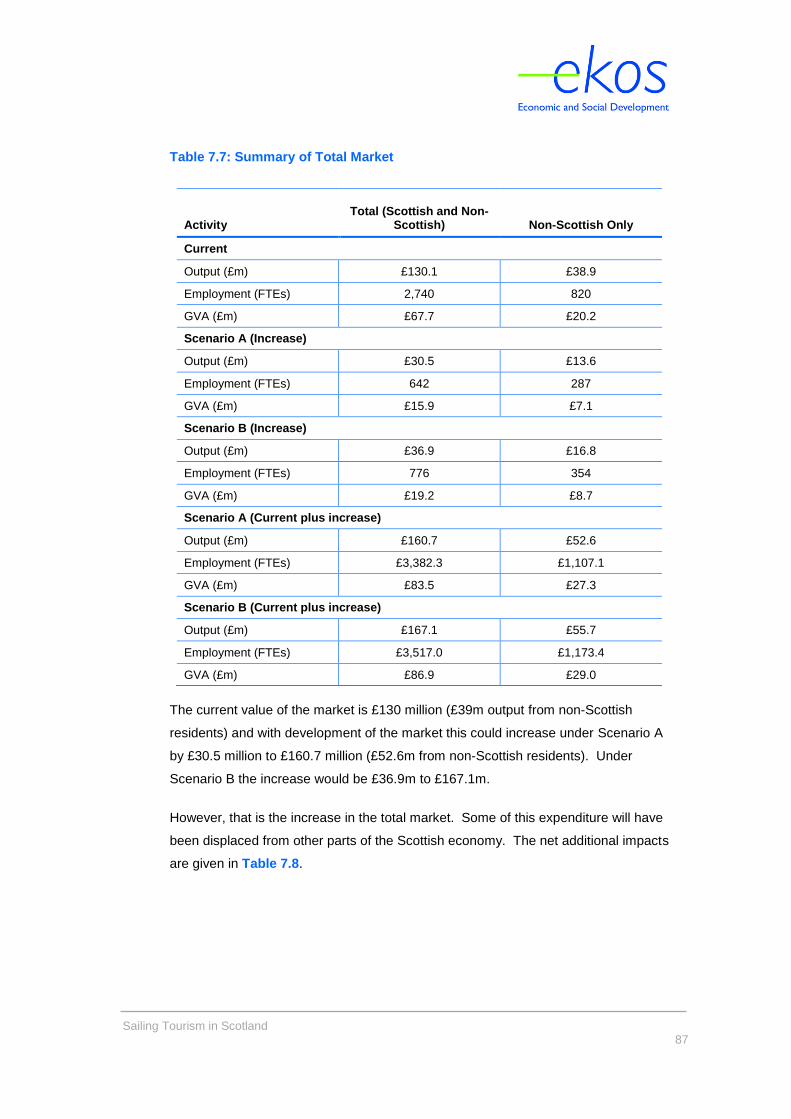
Sailing Tourism in Scotland
87
Table 7.7: Summary of Total Market
Activity Total (Scottish and Non-
Scottish) Non-Scottish Only
Current
Output (£m) £130.1 £38.9
Employment (FTEs) 2,740 820
GVA (£m) £67.7 £20.2
Scenario A (Increase)
Output (£m) £30.5 £13.6
Employment (FTEs) 642 287
GVA (£m) £15.9 £7.1
Scenario B (Increase)
Output (£m) £36.9 £16.8
Employment (FTEs) 776 354
GVA (£m) £19.2 £8.7
Scenario A (Current plus increase)
Output (£m) £160.7 £52.6
Employment (FTEs) £3,382.3 £1,107.1
GVA (£m) £83.5 £27.3
Scenario B (Current plus increase)
Output (£m) £167.1 £55.7
Employment (FTEs) £3,517.0 £1,173.4
GVA (£m) £86.9 £29.0
The current value of the market is £130 million (£39m output from non-Scottish
residents) and with development of the market this could increase under Scenario A
by £30.5 million to £160.7 million (£52.6m from non-Scottish residents). Under
Scenario B the increase would be £36.9m to £167.1m.
However, that is the increase in the total market. Some of this expenditure will have
been displaced from other parts of the Scottish economy. The net additional impacts
are given in Table 7.8.
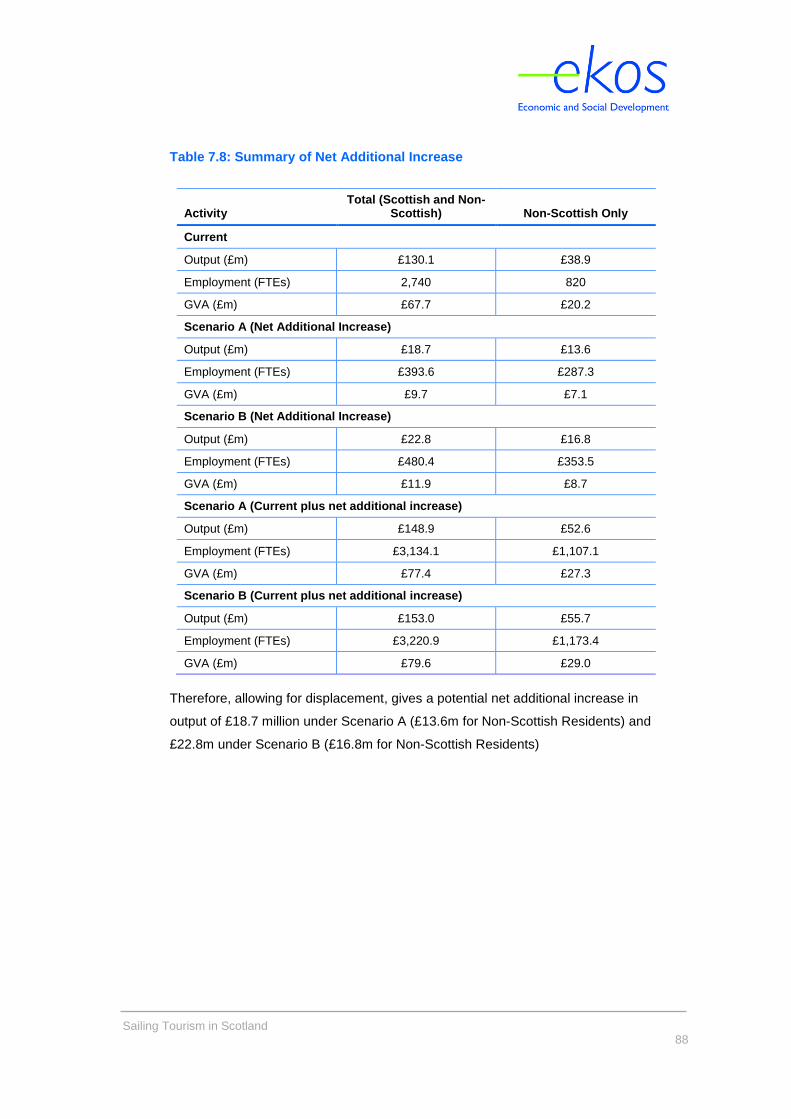
Sailing Tourism in Scotland
88
Table 7.8: Summary of Net Additional Increase
Activity Total (Scottish and Non-
Scottish) Non-Scottish Only
Current
Output (£m) £130.1 £38.9
Employment (FTEs) 2,740 820
GVA (£m) £67.7 £20.2
Scenario A (Net Additional Increase)
Output (£m) £18.7 £13.6
Employment (FTEs) £393.6 £287.3
GVA (£m) £9.7 £7.1
Scenario B (Net Additional Increase)
Output (£m) £22.8 £16.8
Employment (FTEs) £480.4 £353.5
GVA (£m) £11.9 £8.7
Scenario A (Current plus net additional increase)
Output (£m) £148.9 £52.6
Employment (FTEs) £3,134.1 £1,107.1
GVA (£m) £77.4 £27.3
Scenario B (Current plus net additional increase)
Output (£m) £153.0 £55.7
Employment (FTEs) £3,220.9 £1,173.4
GVA (£m) £79.6 £29.0
Therefore, allowing for displacement, gives a potential net additional increase in
output of £18.7 million under Scenario A (£13.6m for Non-Scottish Residents) and
£22.8m under Scenario B (£16.8m for Non-Scottish Residents)
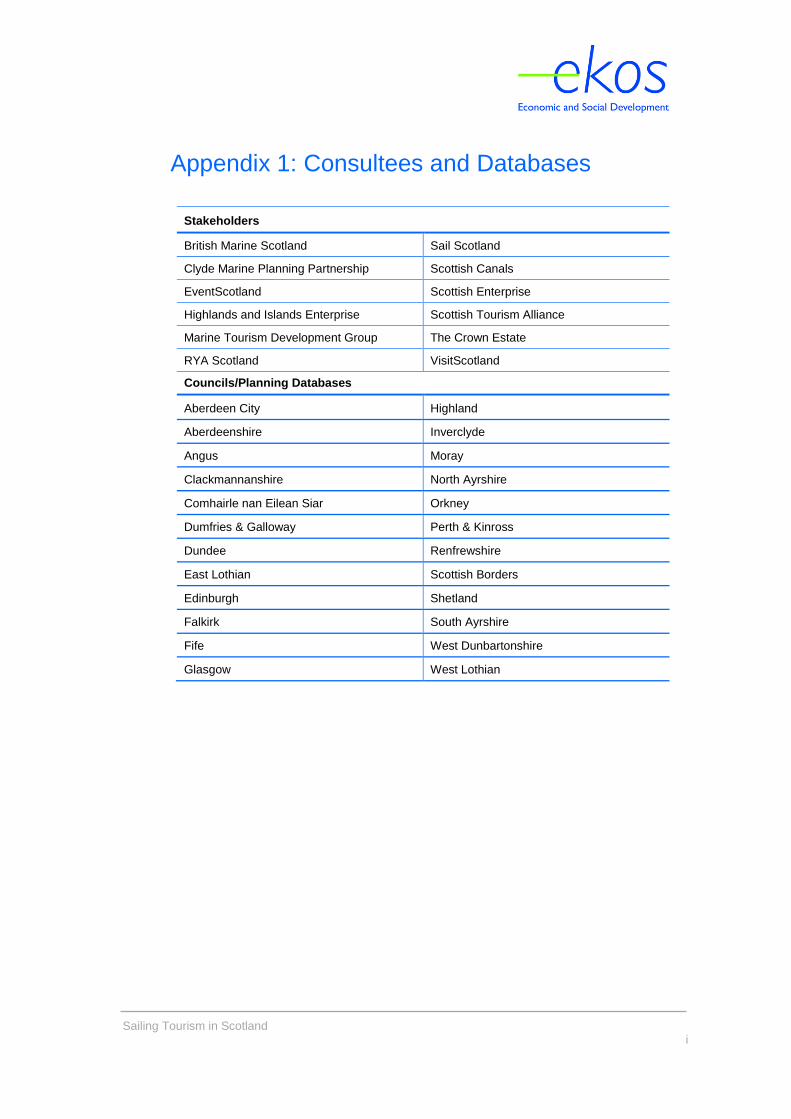
Sailing Tourism in Scotland
i
Appendix 1: Consultees and Databases
Stakeholders
British Marine Scotland Sail Scotland
Clyde Marine Planning Partnership Scottish Canals
EventScotland Scottish Enterprise
Highlands and Islands Enterprise Scottish Tourism Alliance
Marine Tourism Development Group The Crown Estate
RYA Scotland VisitScotland
Councils/Planning Databases
Aberdeen City Highland
Aberdeenshire Inverclyde
Angus Moray
Clackmannanshire North Ayrshire
Comhairle nan Eilean Siar Orkney
Dumfries & Galloway Perth & Kinross
Dundee Renfrewshire
East Lothian Scottish Borders
Edinburgh Shetland
Falkirk South Ayrshire
Fife West Dunbartonshire
Glasgow West Lothian
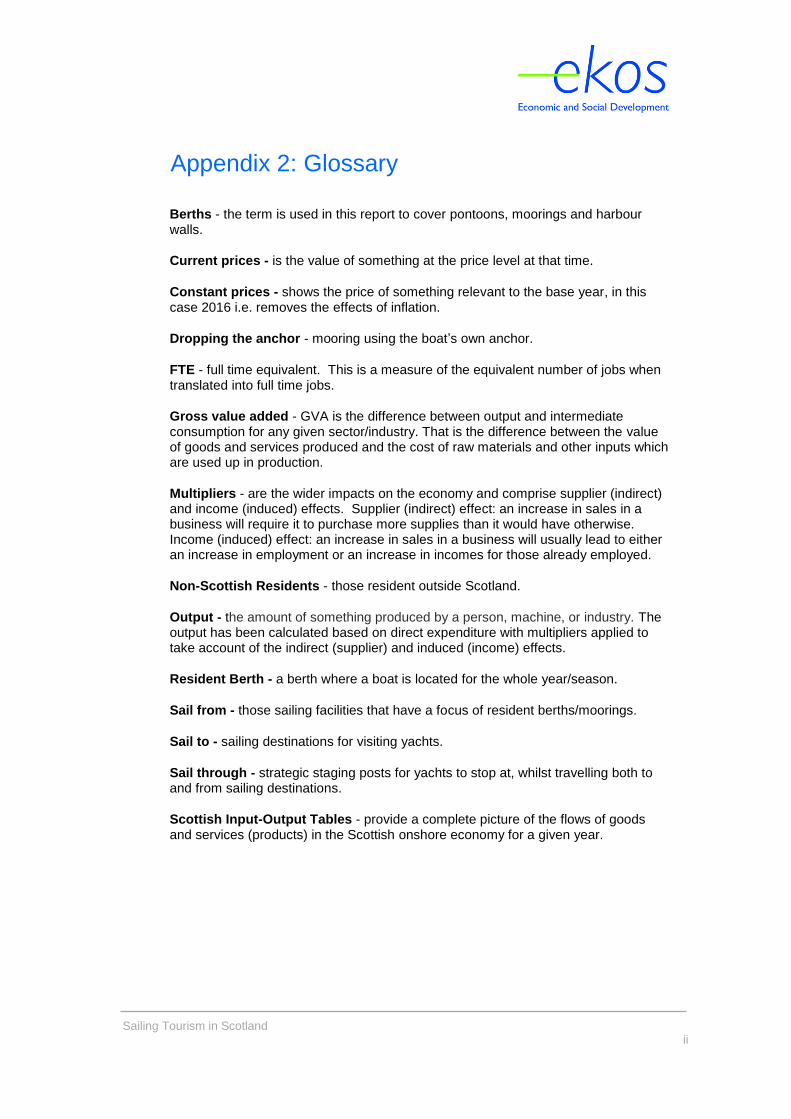
Sailing Tourism in Scotland
ii
Appendix 2: Glossary
Berths - the term is used in this report to cover pontoons, moorings and harbour walls.
Current prices - is the value of something at the price level at that time.
Constant prices - shows the price of something relevant to the base year, in this case 2016 i.e. removes the effects of inflation.
Dropping the anchor - mooring using the boat’s own anchor.
FTE - full time equivalent. This is a measure of the equivalent number of jobs when translated into full time jobs.
Gross value added - GVA is the difference between output and intermediate consumption for any given sector/industry. That is the difference between the value of goods and services produced and the cost of raw materials and other inputs which are used up in production.
Multipliers - are the wider impacts on the economy and comprise supplier (indirect) and income (induced) effects. Supplier (indirect) effect: an increase in sales in a business will require it to purchase more supplies than it would have otherwise. Income (induced) effect: an increase in sales in a business will usually lead to either an increase in employment or an increase in incomes for those already employed.
Non-Scottish Residents - those resident outside Scotland.
Output - the amount of something produced by a person, machine, or industry. The output has been calculated based on direct expenditure with multipliers applied to take account of the indirect (supplier) and induced (income) effects.
Resident Berth - a berth where a boat is located for the whole year/season.
Sail from - those sailing facilities that have a focus of resident berths/moorings.
Sail to - sailing destinations for visiting yachts.
Sail through - strategic staging posts for yachts to stop at, whilst travelling both to and from sailing destinations.
Scottish Input-Output Tables - provide a complete picture of the flows of goods and services (products) in the Scottish onshore economy for a given year.
Sailing Tourism in Scotland
iii
Appendix 3: Bibliography
Arkenford (2015) Watersports Participation Survey 2014
Arkenford (2014) Watersports Participation Survey 2013
Marine Tourism Working Group (2015) Awakening the Giant: A Strategic Framework
for Scotland’s Marine Tourism Sector
Campbell and Macrae Associates (2015) Fife Harbours Strategic Study
Cork Institute of Technology (2016) The Cool Route Cruising Preferences Survey
EKOS and TRC (2009) Sailing in the West Highlands
GVA (2016) Scottish Canals Pricing Strategy
LUC (2016) Scottish Marine Recreation and Tourism Survey 2015
Tourism Intelligence Scotland (2011) Sailing Tourism in Scotland
TRC and EKOS (2009) Sailing Tourism in Scotland
Sail Scotland (2016) Sail Scotland Brochure
Scottish Canals (2015) Caledonian Canal Skipper’s Guide
Scottish Canals (2014) Crinan Canal Skipper’s Guide
Scottish Canals (2015) Forth & Clyde and Union Canals Skipper’s Guide
Welcome Anchorages (2016) Welcome Anchorages 2016