saimm 201412 dec
DESCRIPTION
Journal of the SAIMM December 2014TRANSCRIPT

VOLUME 114 NO. 12 DECEMBER 2014
Delivering a world of expertise
to the African mining industry.

EXPERIENCE
A mining contractor providing innovative full-service quality mining solutions
commitment to maintaining the highest safety standards.
redpathmining.com
| | | | |
Consider it done.
commitment to maintaining the highest safety standards.
mininAA
commitment to maintaining the highest safety standards.
mining contractor providing innovative full-service quality mining solutions
commitment to maintaining the highest safety standards.
mining contractor providing innovative full-service quality mining solutions
commitment to maintaining the highest safety standards.
mining contractor providing innovative full-service quality mining solutions
mining contractor providing innovative full-service quality mining solutions
Consider it done.
Consider it done.
|||
||
redpathmining.com
redpathmining.com

The Southern African Institute of Mining and MetallurgyThe Southern African Institute of Mining and Metallurgy
Seasons greetingsWe point out to anyone who is interested in joining the SAIMM of thebenefits of being a member:
•
•
•
•
•
Visit
www.saimm.co.za
to download the
membership
application form

▲
ii DECEMBER 2014 The Journal of The Southern African Institute of Mining and Metallurgy
OFFICE BEARERS AND COUNCIL FOR THE2014/2015 SESSION
Honorary PresidentMike TekePresident, Chamber of Mines of South Africa
Honorary Vice-PresidentsNgoako RamatlhodiMinister of Mineral Resources, South AfricaRob DaviesMinister of Trade and Industry, South AfricaNaledi PandorMinister of Science and Technology, South Africa
PresidentJ.L. Porter
President ElectR.T. Jones
Vice-PresidentsC. MusingwiniS. Ndlovu
Immediate Past PresidentM. Dworzanowski
Honorary TreasurerC. Musingwini
Ordinary Members on Council
V.G. Duke T. PegramM.F. Handley S. RupprechtA.S. Macfarlane N. SearleM. Motuku A.G. SmithM. Mthenjane M.H. SolomonD.D. Munro D. TudorG. Njowa D.J. van Niekerk
Past Presidents Serving on CouncilN.A. Barcza J.C. NgomaR.D. Beck S.J. Ramokgopa J.A. Cruise M.H. RogersJ.R. Dixon G.L. SmithF.M.G. Egerton J.N. van der MerweG.V.R. Landman W.H. van NiekerkR.P. Mohring
Branch ChairmenDRC S. MalebaJohannesburg I. AshmoleNamibia N. NamatePretoria N. NaudeWestern Cape C. DorflingZambia H. ZimbaZimbabwe E. MatindeZululand C. Mienie
Corresponding Members of CouncilAustralia: I.J. Corrans, R.J. Dippenaar, A. Croll,
C. Workman-DaviesAustria: H. WagnerBotswana: S.D. WilliamsBrazil: F.M.C. da Cruz VieiraChina: R. OppermannUnited Kingdom: J.J.L. Cilliers, N.A. Barcza, H. PotgieterUSA: J-M.M. Rendu, P.C. PistoriusZambia: J.A. van Huyssteen
The Southern African Institute of Mining and Metallurgy
PAST PRESIDENTS*Deceased
* W. Bettel (1894–1895)* A.F. Crosse (1895–1896)* W.R. Feldtmann (1896–1897)* C. Butters (1897–1898)* J. Loevy (1898–1899)* J.R. Williams (1899–1903)* S.H. Pearce (1903–1904)* W.A. Caldecott (1904–1905)* W. Cullen (1905–1906)* E.H. Johnson (1906–1907)* J. Yates (1907–1908)* R.G. Bevington (1908–1909)* A. McA. Johnston (1909–1910)* J. Moir (1910–1911)* C.B. Saner (1911–1912)* W.R. Dowling (1912–1913)* A. Richardson (1913–1914)* G.H. Stanley (1914–1915)* J.E. Thomas (1915–1916)* J.A. Wilkinson (1916–1917)* G. Hildick-Smith (1917–1918)* H.S. Meyer (1918–1919)* J. Gray (1919–1920)* J. Chilton (1920–1921)* F. Wartenweiler (1921–1922)* G.A. Watermeyer (1922–1923)* F.W. Watson (1923–1924)* C.J. Gray (1924–1925)* H.A. White (1925–1926)* H.R. Adam (1926–1927)* Sir Robert Kotze (1927–1928)* J.A. Woodburn (1928–1929)* H. Pirow (1929–1930)* J. Henderson (1930–1931)* A. King (1931–1932)* V. Nimmo-Dewar (1932–1933)* P.N. Lategan (1933–1934)* E.C. Ranson (1934–1935)* R.A. Flugge-De-Smidt
(1935–1936)* T.K. Prentice (1936–1937)* R.S.G. Stokes (1937–1938)* P.E. Hall (1938–1939)* E.H.A. Joseph (1939–1940)* J.H. Dobson (1940–1941)* Theo Meyer (1941–1942)* John V. Muller (1942–1943)* C. Biccard Jeppe (1943–1944)* P.J. Louis Bok (1944–1945)* J.T. McIntyre (1945–1946)* M. Falcon (1946–1947)* A. Clemens (1947–1948)* F.G. Hill (1948–1949)* O.A.E. Jackson (1949–1950)* W.E. Gooday (1950–1951)* C.J. Irving (1951–1952)* D.D. Stitt (1952–1953)* M.C.G. Meyer (1953–1954)
* L.A. Bushell (1954–1955)* H. Britten (1955–1956)* Wm. Bleloch (1956–1957)* H. Simon (1957–1958)* M. Barcza (1958–1959)* R.J. Adamson (1959–1960)* W.S. Findlay (1960–1961)
D.G. Maxwell (1961–1962)* J. de V. Lambrechts (1962–1963)* J.F. Reid (1963–1964)* D.M. Jamieson (1964–1965)* H.E. Cross (1965–1966)* D. Gordon Jones (1966–1967)* P. Lambooy (1967–1968)* R.C.J. Goode (1968–1969)* J.K.E. Douglas (1969–1970)* V.C. Robinson (1970–1971)* D.D. Howat (1971–1972)
J.P. Hugo (1972–1973)* P.W.J. van Rensburg (1973–1974)* R.P. Plewman (1974–1975)
R.E. Robinson (1975–1976)* M.D.G. Salamon (1976–1977)* P.A. Von Wielligh (1977–1978)* M.G. Atmore (1978–1979)* D.A. Viljoen (1979–1980)* P.R. Jochens (1980–1981)
G.Y. Nisbet (1981–1982)A.N. Brown (1982–1983)
* R.P. King (1983–1984)J.D. Austin (1984–1985)H.E. James (1985–1986)H. Wagner (1986–1987)
* B.C. Alberts (1987–1988)C.E. Fivaz (1988–1989)O.K.H. Steffen (1989–1990)
* H.G. Mosenthal (1990–1991)R.D. Beck (1991–1992)J.P. Hoffman (1992–1993)
* H. Scott-Russell (1993–1994)J.A. Cruise (1994–1995)D.A.J. Ross-Watt (1995–1996)N.A. Barcza (1996–1997)R.P. Mohring (1997–1998)J.R. Dixon (1998–1999)M.H. Rogers (1999–2000)L.A. Cramer (2000–2001)
* A.A.B. Douglas (2001–2002)S.J. Ramokgopa (2002-2003)T.R. Stacey (2003–2004)F.M.G. Egerton (2004–2005)W.H. van Niekerk (2005–2006)R.P.H. Willis (2006–2007)R.G.B. Pickering (2007–2008)A.M. Garbers-Craig (2008–2009)J.C. Ngoma (2009–2010)G.V.R. Landman (2010–2011)J.N. van der Merwe (2011–2012)G.L. Smith (2012–2013)
Honorary Legal AdvisersVan Hulsteyns Attorneys
AuditorsMessrs R.H. Kitching
Secretaries
The Southern African Institute of Mining and MetallurgyFifth Floor, Chamber of Mines Building5 Hollard Street, Johannesburg 2001P.O. Box 61127, Marshalltown 2107Telephone (011) 834-1273/7Fax (011) 838-5923 or (011) 833-8156E-mail: [email protected]

ContentsJournal Commentby R.C.W. Webber-Youngman . . . . . . . . . . . . . . . . . . . . . . . . . . . . . . . . . . . . . . . . . . . . . . . . vPresident’s Corner by J.L. Porter . . . . . . . . . . . . . . . . . . . . . . . . . . . . . . . . . . . . . . . . . . . . . . . . . . . . . . . . . . . . . . vii
Special ArticlesSociety of Mining Professors (SOMP)by B. Hebblewhite . . . . . . . . . . . . . . . . . . . . . . . . . . . . . . . . . . . . . . . . . . . . . . . . . . . . . . . . . . . viA new chair in occupational hygiene at Witsby B. Zuma . . . . . . . . . . . . . . . . . . . . . . . . . . . . . . . . . . . . . . . . . . . . . . . . . . . . . . . . . . . . . . . . viii
An evaluation of the effectiveness of teamwork, with an emphasis on peer assessment and peer review, in an introductory engineering courseby C. Daly . . . . . . . . . . . . . . . . . . . . . . . . . . . . . . . . . . . . . . . . . . . . . . . . . . . . . . . . . . . . . . . . . 969The Sasol Engineering Leadership Academyby C. Knobbs, E. Gerryts, T. Kagogo, and M. Neser . . . . . . . . . . . . . . . . . . . . . . . . . . . . . . . . . . 979Mine disaster and mine rescue training courses in modern academic mining engineering programmesby H. Mischo, J.F. Brune, J. Weyer, and N. Henderson . . . . . . . . . . . . . . . . . . . . . . . . . . . . . . . 987New systems for geological modelling—black box or best practice?by C. Birch. . . . . . . . . . . . . . . . . . . . . . . . . . . . . . . . . . . . . . . . . . . . . . . . . . . . . . . . . . . . . . . . . 993Modelling and determining the technical efficiency of a surface coal mine supply chainby M.D. Budeba, J.W. Joubert, and R.C.W. Webber-Youngman . . . . . . . . . . . . . . . . . . . . . . . . . 1001Can artificial intelligence and fuzzy logic be integrated into virtual reality applications in mining?by R. Mitra and S. Saydam . . . . . . . . . . . . . . . . . . . . . . . . . . . . . . . . . . . . . . . . . . . . . . . . . . . . 1009Key performance indicators — a tool to assess ICT applications in underground coal minesby C. Dauber and M. Bendrat . . . . . . . . . . . . . . . . . . . . . . . . . . . . . . . . . . . . . . . . . . . . . . . . . . 1017Geomechanics challenges of contemporary deep mining: a suggested model for increasing future mining safety and productivityby F.T. Suorineni, B. Hebblewhite, and S. Saydam . . . . . . . . . . . . . . . . . . . . . . . . . . . . . . . . . . 1023Efficient use of energy in the ventilation and cooling of minesby J.J.L. Du Plessis, W.M. Marx, and C. Nell . . . . . . . . . . . . . . . . . . . . . . . . . . . . . . . . . . . . . . . 1033Mining off-Earth minerals: a long-term play?by G.A. Craig, S. Saydam, and A.G. Dempster . . . . . . . . . . . . . . . . . . . . . . . . . . . . . . . . . . . . . . 1039The presence of shear stresses in pillars and the effect on factor of safety in a room-and-pillar layoutby J.A. Maritz . . . . . . . . . . . . . . . . . . . . . . . . . . . . . . . . . . . . . . . . . . . . . . . . . . . . . . . . . . . . . . 1049Interventions for ensuring sustainability of the minerals education programmes at the Polytechnic of Namibiaby D. Tesh, H. Musiyarira, G. Dzinomwa, and H. Mischo . . . . . . . . . . . . . . . . . . . . . . . . . . . . . 1055
Development of an atmospheric data-management system for underground coal minesby Z. Agioutantis, K. Luxbacher, M. Karmis, and S. Schafrik . . . . . . . . . . . . . . . . . . . . . . . . . . 1059
International Advisory Board
R. Dimitrakopoulos, McGill University, CanadaD. Dreisinger, University of British Columbia, CanadaE. Esterhuizen, NIOSH Research Organization, USAH. Mitri, McGill University, CanadaM.J. Nicol, Murdoch University, AustraliaH. Potgieter, Manchester Metropolitan University, United KingdomE. Topal, Curtin University, Australia
The Journal of The Southern African Institute of Mining and Metallurgy DECEMBER 2014
VOLUME 114 NO. 12 DECEMBER 2014
Delivering a world of expertise
to the African mining industry.
▲iii
Editorial BoardR.D. BeckJ. Beukes
P. den HoedM. Dworzanowski
M.F. HandleyR.T. Jones
W.C. JoughinJ.A. LuckmannC. MusingwiniR.E. Robinson
T.R. StaceyR.J. Stewart
Editorial ConsultantD. Tudor
Typeset and Published byThe Southern African Instituteof Mining and MetallurgyP.O. Box 61127Marshalltown 2107Telephone (011) 834-1273/7Fax (011) 838-5923E-mail: [email protected]
Printed by Camera Press, Johannesburg
AdvertisingRepresentativeBarbara SpenceAvenue AdvertisingTelephone (011) 463-7940E-mail: [email protected] SecretariatThe Southern AfricanInstitute of Mining andMetallurgyISSN 2225-6253
THE INSTITUTE, AS A BODY, ISNOT RESPONSIBLE FOR THESTATEMENTS AND OPINIONSADVANCED IN ANY OF ITSPUBLICATIONS.Copyright© 1978 by The Southern AfricanInstitute of Mining and Metallurgy. Allrights reserved. Multiple copying of thecontents of this publication or partsthereof without permission is in breach ofcopyright, but permission is hereby givenfor the copying of titles and abstracts ofpapers and names of authors. Permissionto copy illustrations and short extractsfrom the text of individual contributions isusually given upon written application tothe Institute, provided that the source (andwhere appropriate, the copyright) isacknowledged. Apart from any fair dealingfor the purposes of review or criticismunder The Copyright Act no. 98, 1978,Section 12, of the Republic of SouthAfrica, a single copy of an article may besupplied by a library for the purposes ofresearch or private study. No part of thispublication may be reproduced, stored ina retrieval system, or transmitted in anyform or by any means without the priorpermission of the publishers. Multiplecopying of the contents of the publicationwithout permission is always illegal.
U.S. Copyright Law applicable to users Inthe U.S.A.The appearance of the statement ofcopyright at the bottom of the first page ofan article appearing in this journalindicates that the copyright holderconsents to the making of copies of thearticle for personal or internal use. Thisconsent is given on condition that thecopier pays the stated fee for each copy ofa paper beyond that permitted by Section107 or 108 of the U.S. Copyright Law. Thefee is to be paid through the CopyrightClearance Center, Inc., Operations Center,P.O. Box 765, Schenectady, New York12301, U.S.A. This consent does notextend to other kinds of copying, such ascopying for general distribution, foradvertising or promotional purposes, forcreating new collective works, or forresale.
VOLUME 114 NO. 12 DECEMBER 2014
A Southern African Silver Anniversary Meeting, 2014 SOMP
Technical Note

▲
iv DECEMBER 2014 The Journal of The Southern African Institute of Mining and Metallurgy
UUppddaattee ooff MMeemmbbeerrsshhiipp DDeettaaiillssIn order to facilitate effective distribution of notices and journals, please update your contact details regularly.
Please contact: Head of MembershipJacqui E′ Silva on Tel: (011) 834-1273 • email: [email protected] or
Naomi Wernecke: Membership AdministratorTel: (011) 834-1273 • email: [email protected]
5th Sulphur and Sulphuric Acid2015 Conference
8–9 April 2015—CONFERENCE10 April 2015—TECHNICAL VISIT
Southern Sun Elangeni MaharaniKwaZulu-Natal, South AfricaWHO SHOULD ATTEND
>
>
>>
>>
>>>>
BACKGROUND
OBJECTIVES>
>
>
>
For further information contact:
Conference Co-ordinatorCamielah Jardine, SAIMM
P O Box 61127, Marshalltown 2107Tel: (011) 834-1273/7
Fax: (011) 833-8156 or (011) 838-5923E-mail: [email protected]
Website: http://www.saimm.co.za

The Journal of The Southern African Institute of Mining and Metallurgy DECEMBER 2014 ▲v
A Southern African Silver Anniversary

▲
vi DECEMBER 2014 The Journal of The Southern African Institute of Mining and Metallurgy
Society of Mining Professors Societät der Bergbaukunde
T
•••
••••••

The Journal of The Southern African Institute of Mining and Metallurgy DECEMBER 2014 ▲vii
Increase/decrease in conference fees over the past 5 years
Conference Members Non-Members
Presidentʼs
Corner
Increase/decrease in conference fees over the past 5 years

▲
viii DECEMBER 2014 The Journal of The Southern African Institute of Mining and Metallurgy
•
•
•
•
•
•
•

PAPERS IN THIS EDITIONThese papers have been refereed and edited according to internationally accepted standards and
are accredited for rating purposes by the South African Department of Higher Education andTraining
These papers will be available on the SAIMM websitehttp://www.saimm.co.za
A Southern African Silver Anniversary Meeting, 2014 SOMP
by C. Daly. . . . . . . . . . . . . . . . . . . . . . . . . . . . . . . . . . . . . . . . . . . . . . . . . . . . . . . . . . . . . . . . . . . . . . . . . . . . . . . . . . . . . . . 969This paper describes the initiatives trialled, and present some of the challenges encountered, in continually developing and managing an introductory engineering design and innovation course at the University of New South Wales. The course places strong emphasis on group work and peer interaction, which is uncommon in a typical first-year course.
by C. Knobbs, E. Gerryts, T. Kagogo, and M. Neser . . . . . . . . . . . . . . . . . . . . . . . . . . . . . . . . . . . . . . . . . . . . . . . . . . . . . . . 979The SASOL Engineering and Leadership Academy (SELA) at the University of Pretoria consists of a number of interventions designed to address leadership shortcomings among final-year engineering students. The efficacy of the programme is evaluated, and the results show a positive shift in the main leadership elements of self-awareness, communications, and co-operation.
by H. Mischo, J.F. Brune, J. Weyer, and N. Henderson . . . . . . . . . . . . . . . . . . . . . . . . . . . . . . . . . . . . . . . . . . . . . . . . . . . . . 987Mining universities worldwide are developing strategies to train mining engineering students in handling mine emergency situations and to provide hands-on experience for managing potential accident and disaster scenarios underground. Two of these strategies are presented, one from the USA and one from Central Europe, which might serve as case studies for mining schools and universities in other countries.
by C. Birch . . . . . . . . . . . . . . . . . . . . . . . . . . . . . . . . . . . . . . . . . . . . . . . . . . . . . . . . . . . . . . . . . . . . . . . . . . . . . . . . . . . . . . 993The requirements for geological modelling as contained in the outline for the SAMREC Code are considered. A case study of a student mine design exercise suggests that the new implicit geological modelling software is superior to the traditional methods of wireframe creation and should be considered best practice.
by M.D. Budeba, J.W. Joubert, and R.C.W. Webber-Youngman . . . . . . . . . . . . . . . . . . . . . . . . . . . . . . . . . . . . . . . . . . . . . 1001Data Envelopment Analysis (DEA) is used to evaluate the efficiency of the supply chain at a surface coal mine supplying the export market. The results suggests that future research should be focused on creating models to predict the efficiency of new surface mines, enabling them to evaluate their operational variables before spending more capital.
by R. Mitra and S. Saydam. . . . . . . . . . . . . . . . . . . . . . . . . . . . . . . . . . . . . . . . . . . . . . . . . . . . . . . . . . . . . . . . . . . . . . . . . 1009The School of Mining Engineering at the University of New South Wales, Australia is investigating the use of artificial intelligence (AI) and fuzzy logic as tools to be used in future module development. This paper reviews the current position in both these areas and considers some options for applying these technologies.

PAPERS IN THIS EDITIONThese papers have been refereed and edited according to internationally accepted standards and
are accredited for rating purposes by the South African Department of Higher Education andTraining
These papers will be available on the SAIMM websitehttp://www.saimm.co.za
by C. Dauber and M. Bendrat . . . . . . . . . . . . . . . . . . . . . . . . . . . . . . . . . . . . . . . . . . . . . . . . . . . . . . . . . . . . . . . . . . . . . . . 1017Key performance areas are used to assess the effect of the latest information and communication technologies implemented at five underground coal mines under the European Union’s OPTI-MINE demonstration project. The preliminary results give clear evidence that the new technologies will positively impact mine productivity and safety.
by F.T. Suorineni, B. Hebblewhite, and S. Saydam. . . . . . . . . . . . . . . . . . . . . . . . . . . . . . . . . . . . . . . . . . . . . . . . . . . . . . . 1023This paper draws on the challenges and experiences from medicine and science that have been overcome through genuine collaboration, advances in technology and generous funding, that could be adopted by geomechanics to provide solutions to contemporary geomechanics challenges with respect to increased safety and productivity as mines continue to go deeper.
by J.J.L. Du Plessis, W.M. Marx, and C. Nell . . . . . . . . . . . . . . . . . . . . . . . . . . . . . . . . . . . . . . . . . . . . . . . . . . . . . . . . . . . . 1033The use of load clipping and load shifting strategies to reduce ventilation and cooling costs on underground mines is investigated, and the actual and potential savings that can be realized are presented. Methods for reducing energy usage by optimizing cooling and ventilation systems are described, and network simulation models that accurately reflect current and planned ventilation conditions are discussed.
by G.A. Craig, S. Saydam, and A.G. Dempster . . . . . . . . . . . . . . . . . . . . . . . . . . . . . . . . . . . . . . . . . . . . . . . . . . . . . . . . . . 1039A preliminary economic and sensitivity analysis of a possible off-Earth mining business case extracting minerals from an existing asteroid is presented. Although the full- scale extraction of off-Earth minerals appears not to be currently feasible, it is recommended that further research by the mining industry should be undertaken.
by J.A. Maritz . . . . . . . . . . . . . . . . . . . . . . . . . . . . . . . . . . . . . . . . . . . . . . . . . . . . . . . . . . . . . . . . . . . . . . . . . . . . . . . . . . . 1049This theoretical paper investigates the possible influence of shear stresses on pillars in a room-and-pillar layout associated with single reef planes and multi-reef environments, based on elastic numerical modelling methods.
by D. Tesh, H. Musiyarira, G. Dzinomwa, and H. Mischo. . . . . . . . . . . . . . . . . . . . . . . . . . . . . . . . . . . . . . . . . . . . . . . . . . 1055This paper reviews the status of minerals education at the Polytechnic of Namibia, and identifies the strategic actions required to ensure the sustainability of the minerals education programmes.
Technical Noteby Z. Agioutantis, K. Luxbacher, M. Karmis, and S. Schafrik. . . . . . . . . . . . . . . . . . . . . . . . . . . . . . . . . . . . . . . . . . . . . . . 1059This paper presents the concept and design of an integrated system that is under development for real-time atmospheric monitoring and data management in underground coal mines in the USA

BackgroundThe Faculty of Engineering at the University ofNew South Wales (UNSW) in Sydney, thelargest engineering faculty in Australia,comprises nine independent schools. These arethe Graduate School of BiomedicalEngineering, the School of Chemical
fEngineering, the School of Civil andEnvironmental Engineering, the School ofComputer Science and Engineering, the Schoolof Electrical Engineering andTelecommunications, the School of Mechanicaland Manufacturing Engineering, the School ofMining Engineering, the School of PetroleumEngineering, and the School of Photovoltaicand Renewable Energy Engineering. TheSchool of Materials Science and Engineering isbased in the Faculty of Science but offers asimilar first-year programme. Approximately1800 undergraduate students join the Facultyeach year to undertake an essentially commonyear comprising eight courses, including thecore courses of Design, Mathematics, Physics,Computing, and Mechanics plus threeelectives. Most students join a discipline at thecommencement of year 1; however, approxi-mately 15% enrol in what is termed a ‘FlexibleFirst Year’ where in addition the common coreunits, students can choose electives from anyof the 10 school-based disciplines. At thecompletion of their first year, students mustchoose a discipline to commence in year 2.This approach caters for students who on entryhave not decided their discipline. Dual degreeprogrammes can also be selected, ranging induration from 5 to 6 years but still basedessentially on the common first year.
ENGG1000, Engineering Design andInnovation, is an introductory engineeringdesign course offered twice a year. In semester1 approximately 1400 students enrol, witharound 400 in semester 2. I am currentlycourse convenor of the faculty-wide semester1 course. Each school provides a course co-
An evaluation of the effectiveness ofteamwork, with an emphasis on peerassessment and peer review, in anintroductory engineering courseby C. Daly*
SynopsisThe Faculty of Engineering at the University of New South Wales (UNSW)offers a core first-year engineering design and innovation course,ENGG1000, undertaken during the first and second semesters. This courseis highly regarded in the sense that it provides an introduction to manyconcepts and activities that students will experience over the four-yearminimum for which they are undergraduates at UNSW. Approximately1400 students enrol in the semester 1 course across the Faculty, typically80 of which undertake the Mining Engineering stream.
Students in teams of between six and eight design and construct aphysical model to represent an aspect of their chosen discipline. Forexample, in 2013 the mining engineers designed and built a model dragline.
This paper concentrates a major aspect of the course – the involvementof team members in group activities and the development of the associatedskills of peer assessment and peer review as the course progresses over aperiod of 12 weeks.
The term ‘peer assessment’ in this paper refers to the requirement forstudents to assess the design components of their peers. This course has astructured requirement in terms of how a successful design is a result of asound design process rather than a ‘try and see’ approach. Each studentmust describe in detail the process they undertook to achieve their finaldesign – hence the approach is independent of the discipline and/or projectselected.
Peer review is a process whereby students review the contribution oftheir team members to the overall design. This activity encourages teaminvolvement and interaction. The final assessment mark can be moderatedby the outcome of this peer review, although it is run twice during thesemester. The first ‘run’ is for feedback only during week six and hence nomoderation is undertaken.
It was found through consultation with students and from question-naires that both processes are well accepted and highly regarded bystudents, as they give them a degree of ownership of the assessmentprocess. In addition, the processes provide rapid and relevant feedback onthe progress of individual students.
Peer review and peer assessment are also considered to be veryvaluable tools for use in courses in succeeding years. For instance, many ofthe courses in mining engineering rely heavily on group assessment tasks.
Keywordsteamwork, peer assessment, peer review, Moodle, engineering design, firstyear.
* School of Mining Engineering, University of NewSouth Wales, Sydney Australia.
© The Southern African Institute of Mining andMetallurgy, 2014. ISSN 2225-6253. This paperwas first presented at, A Southern African SilverAnniversary, 2014 SOMP Annual Meeting, 26–30June 2014, The Maslow Hotel, Sandton, Gauteng.
969The Journal of The Southern African Institute of Mining and Metallurgy VOLUME 114 DECEMBER 2014 ▲

An evaluation of the effectiveness of teamwork, with an emphasis on peer assessment
f ffordinator for the design project they offer. Projects can rangein size from 40 to 270 students. There are 14 projects offeredby the 10 schools. The course runs centrally for the first 2wweeks and then for 10 weeks it moves to the school level.
What does ENGG1000 set out to achieve?Many tertiary institutions offer a similar course in year 1. Thevvalue of such a course in introducing students to engineeringdesign is well recognized. For example, the University ofQueensland offers ENGG1100, which operates in a verysimilar manner but with slightly less numbers. However, themajor difference is that the course is centrally managed for itsduration rather than schools managing their own projects.This approach is advantageous from an administrative pointof view, and also promotes more cross-disciplinaryinteraction. Students choose from a small number of projectsmanaged centrally. In addition, students attend commonlectures each week – a distinct advantage compared to UNSWwwhere lecture theatre capacity limits this. Other examples ofsuccesses in this approach include the MultidisciplinaryDesign Project at the University of Twente (UT) Netherlands(Vos et al., 2000) and in the USA at the University ofTennessee (Parsons and Klukken, 1995), where a similarcourse was developed to impart the core engineering valuesof being complete problem solvers, innovators, and the abilityto collaborate with peers in solving a team-based problem.
The other major reason for ENGG1000 relates to personaldevelopment. The ability to function as a member of a team istoday considered an almost essential requirement atuniversity and in the workplace, especially in an engineeringdiscipline. However students often enter year 1 of universitywwith little or no experience of team membership (Dutson etal., 1997) and can find the whole process quite daunting.However Dutson also comments that this inexperience canlead to poor leadership, poor communication and procrasti-nation, internal conflicts etc. As I will show later, this doesnot appear to be the current case with ENGG1000. Maybe it isbecause the Australian high school system has changed overthe past 20 years. From personal communications it appearsthat team and group work is quite common in Australianhigh schools. It could also relate to the structure of theENGG1000 groups: a team leader is appointed who iscommitted to being a team leader. The appointment of seniorundergraduate students as mentors, rather than academics,often means that a closer relationship develops between
mentor and team members not only due to the similarity inage, but mentors are seen as colleagues rather than lecturers.However this does not mean that issues and conflicts do notarise. They do, but from my experience in limited numbersand often relating to group members having commitmentsthat limit the time they can devote to their project. All teammeetings are scheduled at mutually convenient times so thatteam members should be able to attend.
In addition, a very successful outcome of this approach toexperiential learning is the wealth of feedback that isavailable from team interaction, from the peer assessment,and the peer review tasks (McAlpine and Reidsema, 2007). Ithas always been recognized that feedback to students is anessential aspect of the learning process, but is something wedo not do well.
Learning outcomes and accomplishments
The learning outcomes of this course are quite extensive andinclude the requirement that students:
➤ Be familiar with the process of engineering design andthe use of design methods for defining an open-endeddesign problem, generating alternative conceptualsolutions, evaluating these solutions, andimplementing them
➤ Understand the basic elements of project managementand be able to plan and schedule work activities inaccordance with standard practice
➤ Understand the dynamics of collaborative teams andhow to work effectively within a team to accomplishtasks within given deadlines
➤ Be able to organize, conduct, and record engineeringmeetings
➤ Be able to effectively convey thoughts and ideas in anengineering design report
➤ Be able to understand the issues of quality, safety,diversity, and equal opportunity as they apply touniversity and professional life
➤ Understand the roles and responsibilities of a profes-sional engineer.
Learning outcomes and the assessment framework
ENGG1000 has been designed to ensure there is equivalenceand alignment between the implementation of the course bythe various schools. Each school operates within an agreedframework of learning outcomes as indicated in Table I. The
▲
970 DECEMBER 2014 VOLUME 114 The Journal of The Southern African Institute of Mining and Metallurgy
Table I
Flexibility of learning outcomes within schools
Learning outcomes Weighting
Development of engineering design skills for creative solutions to open-ended problems 30%–50%
Communication skills in technical report writing, graphical communications, and experience in public presentations. 30%–50%
The development of teamwork and project management skills. 10%–30%
Information gathering and evaluation skills to support the design process 10%–30%
School-selected discipline knowledge component 0–20%

course convenor provides administrative support to eachschool, which is able to modify its offering up to a maximumof 20% in line with the school’s own preferences or expertise.
After completing one week of introductory classes,students select one of 14 projects offered across the Faculty.Students are encouraged to choose a project outside theirselected discipline. For example, a Civil Engineering studentcould choose the mining project and a Mining Engineeringstudent the civil project. A cross-discipline approach is quiteappropriate to this type of course and also provides a basicexperience of another discipline, which is particularlyimportant for students enrolled in the flexible first year andwwho are required to make a discipline selection at the end ofyyear 1.
From the above it is clear that this course emphasizesteamwork, communication skills, and an introduction to whatengineering is all about. Irrespective of the project chosen,these skills are developed and each student is able to easilychange disciplines at the completion of year 1.
Structure of the course
It is a challenge to provide an introductory or welcominglecture to 1400 students on their first day at university. Ourlargest lecture theatre holds 1000 students. We have experi-mented with a few ways of lecturing to all students at onetime. One attempt involved the video distribution of the mainlive lecture to other locations on campus. This entailed manychallenges, including technical issues, and was used onlyonce. Such an approach distances the student from thepresenter.
As a potential solution in 2013, two theatres that hold1000 and 500 students at the same time were used. Thisapproach meant the duplicating of the material presented. Forexample, I would take the larger lecture and a colleaguewwould take the other using exactly same Powerpoint slides.Students were required to enrol in one of two classes withassociated locations to ensuring not all arrived at the samevvenue. Overall, this was quite a satisfactory approach andwwill be used again.
The first challenge – impromptu design
The overall philosophy of Engineering Design and Innovationis to generate scenarios in which students must worktogether in small teams with the ultimate aim of not onlyproducing quality group submissions, but also to gainexperience in working together and becoming comfortablewwith assessing the quality of their peers’ work and contri-butions to a task.
The initiation into the basics of teamwork to achieve acommon goal commences in week 1 with an impromptudesign exercise. This task requires all 1400 students to beinvolved. A three-hour period is set aside and 30 classroomsbooked. There are 700 places available for one hour to createa design and then to demonstrate the design to a judgingpanel. Students work in groups of eight. The groups formspontaneously as they enter the classroom. Each classroomhas two or three staff to supervise the process and presentthe design brief for the first time.
The design brief for semester 1, 2013 – water towerchallengeYou are a team of design engineers and have been appointedby your engineering firm to prepare a bid for tender of a newmulti-million dollar development being put up by ‘SydneyPower’. The development is to design a fully sustainablewater tower/reservoir capable of holding a large volume ofwater at a high elevation, which is pumped up during dayusing a solar powered pump. It can be used as a back-uppower source during peak energy usage times or poweroutages by releasing water into a lower reservoir and past aturbine. The mechanical energy from the flowing water istransferred into electrical energy and diverted back into themain power grid. This is important as a coal-fired powerstation requires around a week’s notice to adjust its poweroutput to meet demand.
To design and build a scale model (1:100) of the watertower structure capable of supporting/holding 100 marbles(water) for 10 seconds. Your aim is to build the talleststructure in order to produce the most potential power fromyour design. Emphasis will be placed on an innovativedesign, the aesthetics of the design and the overallperformance of the structure under loading. Be aware thatyour tower must have some way to hold the marbles. Thetallest tower to support the most marbles for the specifiedtime wins!!’
Figures 1 and 2 represent a typical group working onbuilding the tower from a range of ‘materials’ provided.Figure 1 shows the materials provided including paper cups,drinking straws, ‘paddle pop’ sticks etc. Each team isprovided with the same materials and project specification.
A brief online survey was held after the completion of thetask, in which students were asked to rate their experience.The responses (Figures 3 and 4) are quite positive. The dayis hectic and there are always challenges. One of the mainissues is that despite considerable reinforcement, studentsstill do not know where to go on the day. This means thatsome students are often late, and timing is very important asthey only have 50 minutes to complete the task. Anotherissue has been congestion at the testing ‘station’ due to thenumber of teams arriving simultaneously to be assessed.Next time we will arrange for more assessors.
Team Builder
Once all students have selected their project, most schoolsthen require access to a Moodle application – Team Builder.This application is basically a very brief survey – it asksquestions relating to an individual’s experience with handtools, teamwork experience, interest in being team leader,writing ability etc. The resulting data is used to create groupsthat have an appropriate mix of skills. This approach isregarded an improvement over the more common randomassignment of students to groups. Hence by the second classof week 2 all students are assigned to groups and are askedto meet. When students arrive at this class they are movedinto their groups and a mentor is assigned. A mentor istypically a senior undergraduate student who is paid anhourly rate and meets with their group for an hour or twoeach week.
An evaluation of the effectiveness of teamwork, with an emphasis on peer assessment
971The Journal of The Southern African Institute of Mining and Metallurgy VOLUME 114 DECEMBER 2014 ▲

An evaluation of the effectiveness of teamwork, with an emphasis on peer assessment
Mentors are appointed to act as guides during the designprocess. They are not meant to give suggestions or assist inthe construction of the model, but provide support from theirprevious experience, and are able to comment on the paththat the team may wish to follow and provide guidance if thegroup is not working well together.
A structured overview of the design process
It is widely accepted that engineering design is a systematicprocess of analysing the problem, creatively considering arange of potential solutions, then evaluating the solutions inrelation to the requirements of the task until a final solutionis reached (McAlpine and Reidsema, 2007). In ENGG1000the design process is completed in a series of phasesthroughout the semester (Figure 5):
fPhase 1 Formulating the problem to identify the range ofaspects of the task that may be investigatedfurther. This leads to a statement of the designproblem
Phase 2 Conceptual design – generating a range ofdesign concepts for solving the problem
Phase 3 Evaluation – critique and evaluate the proposedconcepts to select the best solution
Phase 4 Detailed design – refine the solution andconsider implementation issues
Phase 5 Implementation – building and testing thedesign prototype.
The first three phases involve peer assessment where astudent submits their own contribution to each phase. Thestudent then self-assesses their assignment. In addition,
▲
972 DECEMBER 2014 VOLUME 114 The Journal of The Southern African Institute of Mining and Metallurgy
Figure 3—Feedback on the impromptu design activity
Figure 4—Typical feedback from the exercise
Figure 2—The winners
Figure 1—The design phase

three randomly selected students assess the submission.Each phase has an assessment value of 7%, 80% of whichcomes from the averaged assessment of the three peerassessors and 20% from the ‘effort’ a student puts into thepeer assessment – including feedback etc. The assessmentstage of each phase takes approximately one week. Thismeans that quality feedback is received quite rapidly.
Why peer assessment?As this course progresses the active involvement of thestudents in the assessment increases. It becomes a verystudent-centred approach to design, which in many cases isquite appropriate as the course is all about exploring potentialdesigns as well as how to achieve the selection of a finaldesign. It is experiential learning. There is no pre-determinedanswer – students will reach a conclusion at the end of week12. They will have presented a final design and gained fromthe experience of developing this final design. The processcan be chaotic at times – individuals have their own ideas onwwhat is a good design but it is the team’s responsibility to putforward a methodically evaluated design that will have thebest chance of success. The process is also staged in a waythat each student must contribute to the team and to theteam’s project each week. There is no easy way to avoidresponsibilities. The success of the project depends on thecontribution of all team members. In addition, each week astudent must complete a reflective diary entry via a Wiki todocument their contribution for all team members to see.
This course was originally developed to provide a uniquelearning opportunity for students entering into the firstsemester of year 1 engineering. Besides this course, studentsenrol in more traditional courses including mathematics,physics, and an introduction to discipline course. The lattercourses essentially operate by requiring individualassessment tasks to be completed. However, it was felt thatmore realistically, students will be required to operate inteams or groups in the later years of their studies and in theireventual workplace. ENGG1000 was planned not only toprovide an introduction to the design process, but also tointroduce students to teamwork and give them anunderstanding of the assessment process. Along with this, ofcourse, is the added advantage of a unique opportunity forpeer feedback. Lack of meaningful or timely feedback isconsidered one of the major concerns of students. Time-challenged academics often do not return adequate feedbackto students. Often a student will gain, say, 8/10 for anassignment without any comments on why (Race, 2001).
There is considerable literature available on peerinvolvement in the design process – most of which is quitepositive in terms of the students’ and the teachers’experience. Phil Race is regarded as one of the experts in thisfield. Towards the end of this paper I present data gainedfrom a recent survey of students. It is important to state thatassessment is according to a rubric. A rubric is madeavailable to all students very early in the process, allowingthem to prepare their assignment along the lines of the rubricwith clear knowledge that it will be self- and peer-assessed.This removes any concern or confusion over how anassignment will be assessed and at least provides the basicfeedback that students will receive.
What are the advantages of peer involvement?
There are many advantages of this approach discussed in theliterature, but I consider the most important being the factthat it involves the students in the whole process ofcompleting, submitting, and reviewing an assignment. Itgives them more ownership of their learning. It promotes theconcept of deep learning as opposed to surface learning –reflection is basically forced on the student. It appears thatstudents are more concerned that another student will seetheir work compared to their lecturer seeing it, and theyundertake more effort so as not to be potentially embarrassed(Kennedy, 2005)
I feel that a major component of the peer assessmentprocess is the associated self-assessment task that I includein all similar assessment tasks. This really requires a studentto focus on their own contribution before assessing whattheir peers have submitted. This activity further involvesstudents in the assessment process and hence the learningprocess (Gibbs and Simpson, 2004).
In addition, a student can undertake the peer assessmentprocess in their own convenient time, in a suitable placewhere they can essentially spend as much time (withinreason) as they wish completing the assessment task. HenceI really see the advantage of the online assessment process asopposed to a more public class-based environment. From myexperience, students in an online environment givethoughtful and detailed feedback because it is what theywould like to receive themselves. This is of course, notalways the case as there are those that resist this form ofparticipation.
The following comments highlight the strength of thisapproach.
An evaluation of the effectiveness of teamwork, with an emphasis on peer assessment
The Journal of The Southern African Institute of Mining and Metallurgy VOLUME 114 DECEMBER 2014 973 ▲
Figure 5—The phases of design – the learning portfolio

An evaluation of the effectiveness of teamwork, with an emphasis on peer assessment
From a current student:Please give me good marks I need this omg I'm failingplease help me pleaseAnd this response from a peer:‘Nice title. Unlikely to work for actual examiners, but asthis is peer-assessed it's easy to see how you thought itwas worth a shot. Rather than just giving you goodmarks though, I thought I'd be honest but fair and helpexplain why you might be "failing", which is probablymore useful for you in the long run anyway. Resultssection was good. Individual work bit covered how youdiscerned between design ideas, however you didn'tmention your design goals and how you decided whichgoals were the most important. Without that it's hard totell what criteria you used to judge which designs werebetter than others.’
However, the detractors will say that assessment is alecturer’s responsibility, they know best and are able toassess all students independently. Students will also say thatthey are not able to assess. However, as I have oftendiscovered, if the process is explained carefully and thesupport to undertake the assessment is provided via a rubric,students are more accepting, especially when they realize thatthe feedback they will receive is rapid and beneficial. It isimportant that the contribution towards the final assessmentfor the course is reasonable. I recommended and use 21% forthe three phases in this course, and this is probably amaximum for this type of course.
Phase 1 as an examplep
The following is the information provided to the studentsregarding phase 1.
For this module, individually and in teams, you willdevelop a working problem statement that will guide yourdecision as you progress through the design process.There are many structured approaches to formulating theproblem – a number of these approaches are described inChapter 3 of Dym’s Engineering Design textbook. Inpreparation for the first Learning Portfolio exercise, youwill use one or more of the techniques outlined in Chapter3. These include questioning the client (ie the authors ofthe project brief or their representatives) andbrainstorming.Individuals will develop problem statements along withobjectives (goals) and constraints. Then teams will usetechniques described in Chapter 3 to refine the tentativeproblem statements, resulting in one working problemstatement for the team. In the Learning Portfolio entry,you will reflect on this activity.
IIndividual task
RRead the relevant sections of the text (Section 3.1 as well asChapter 1 and 2 if you haven't read them already). Developyyour own tentative problem statement, including objectivesand constraints.
Group work1. Present your refined problem statement to your team.
Note their feedback or suggestions.
2. Break into a few subgroups of 2-3 and select a problemstatement that was not written by a member of thesubgroup. Use brainstorming or another method to refinethe problem statement.
3. As a team, write a working problem statement. Note thedate and time and put a big red box around your problemstatement. Later, you can reflect on your first attempt ata problem statement.
fBe sure to note the date and time, as well as the names ofthe participants, for your entries.
Follow up assignment
When your team has finished the above activity you areready to do the Phase 1 Portfolio submission detailed in theProject Plan.
➤ Learning Portfolio Phase 1 submission—Length: 500 toa maximum of 800 words.
➤ Results—Write the team's problem statement.➤ Reflection—Consider how your thoughts and ideas
about the project have developed during the problemstatement phase of the design project. Include thefollowing headings in your reflection of the process.
➤ My original problem statement—Include under thisheading your original statement, what you understoodabout the problem statement process and how effectivewas the way you developed your statement.
➤ Team problem statement refinement process—Includehow your team went about this process and howeffective the process was in helping the team membersdevelop their ideas.
➤ What I learned about design and teamwork?—Includein your reflection:
– how you think the team will approach the designproblem and
– what experience and ability to learn do you havethat will help you to make a positive contributionto design and teamwork
How is the student assessed?➤ Criterion 1—Does the student clearly show a good
understanding of the techniques available and explainhow the technique was used to generate a problemstatement?� No� Yes
➤ Criterion 2—Does the student include a description ofthe group's application of a recognized approach to thedevelopment of a problem statement?� None� One� More than one
➤ Criterion 3—How clearly does this student demonstrate33an understanding of the problem statement process andthe techniques as applied by the student and thegroup?� Limited understanding and application� Reasonable understanding and application� Clear understanding and application
▲
974 DECEMBER 2014 VOLUME 114 The Journal of The Southern African Institute of Mining and Metallurgy

➤ Criterion 4—Does the student appear to have learned44how to contribute to the team process and how to helpthe team to be effective?� Limited understanding and application� Reasonable understanding and application� Clear understanding and application
➤ Criterion 5—Rate this text from 1 to 10. (With55hindsight this could have more detail).
Typical feedback
‘Overall this was an excellent portfolio as all sections wereanswered clearly and were direct to the point. Youdemonstrated a deep understanding of the problemsstatement, however it was too specific rather than having an‘outline’ like you mentioned’.
A great advantage of this approach is that studentsreceive very rapid feedback (usually within a few days ofsubmission). A student’s final mark is determined by theaverage of three assessments. The total mark for this task is80% of the final average assessment plus a 20% componentfor assessing three other students. This 20% is determinedby how well the assessor assessors a peer’s submissioncompared to how well they assess three exemplarsubmissions previously assessed by the lecturer.
Student opinion on peer assessment
Even though 1400 students were enrolled, not all schoolsagreed to make use of peer assessment in this course. Of allthe schools involved, only one school did not. This meantthat approximately 1000 students undertook the peer reviewtask. This was the first year it was run as a Moodle module.There were a number of technical issues as our installation ofMoodle had problems handling 1000 student submissions.Technical issues always produce a bit of a negative responseto an otherwise good idea. Overall I am happy how it went – Idid, however, have to intervene and assess a fewsubmissions myself. A very few students unfortunately didnot take the task seriously. In addition, each school wasresponsible for introducing the task and presentingessentially the same introduction to the task. This did notnecessarily happen as I had planned.
I received a number of responses to a brief questionnaire.Some of the more favourable responses are as follows:
(Q7) Please provide some feedback on what you thought wasggood about the peer assessment exercise.*
fIt gave me a very good assessment of my own markingstandards, allowing me to be more objective about the tasksrequirements in the future.(Q8) Please provide some feedback on what you think wecan do better next time.*Clearer instructions; I thought that the problem statements iwas reading for my exemplars were for a completely differenttask, and this led to confusion.(Q10) I am really enjoying the group work component of thiscourse.*Agree
There were other similar comments regarding the lack ofclear explanations.
Q7) Please provide some feedback on what you thought wasgood about the peer assessment exercise.*It allowed me to gain an idea of how others approached anobjective in comparison to one another and myself.(Q8) Please provide some feedback on what you think wecan do better next time.*Explain the purpose of peer assessment clearly.(Q10) I am really enjoying the group work component of thiscourse.*Agree
However, the group work is almost universally supportedby students.
A further two responses are summarized in Figures 6and 7.
Some more of the comments regarding the value of peerassessment need reviewing, but I feel that the responserelates to a lack of information provided on this. The ‘Agree’response is quite encouraging.
The final stage – peer review of student contribution
One of the major challenges with group work is in assigningindividual grades from a group project. In general, noteveryone contributes to the group project at the same level, oreven in the same way. Trying to decide what marks to assignto individuals can be difficult – giving all the students thesame mark is also not always fair. I believe that the groupmembers are the best judges of this.
To counter the argument that ’group projects are not fair’,as the course progresses to approximately halfway throughthe semester an exercise is undertaken to provide feedbackon how group members are contributing to the task. The term
An evaluation of the effectiveness of teamwork, with an emphasis on peer assessment
The Journal of The Southern African Institute of Mining and Metallurgy VOLUME 114 DECEMBER 2014 975 ▲
Figure 6—Student comments on peer assessment

An evaluation of the effectiveness of teamwork, with an emphasis on peer assessment
‘peer review’ is generally used to describe this task. The taskis a formative task – it generally provides a very positiveoutcome for all involved, andcan be quite a morale booster. Inthis course I use a commercial site that promotes a specificpeer review approach. SPARKPLUSKK is a web-based self- andpeer-review approach that enables students to confidentiallyrate their own and their peers’ contributions to a team task orindividual submissions (Willey and Freeman, 2006)
Students are required to rate their peers on a scale fromNC (no contribution) to AA (above average) as shown inTable II.
Based on the following criteria, students use a slider scalefrom 0-100 to input their assessment based on the followingcriteria.
RRating criteria
➤ Efficient functioning of group – how does the teammember rate in:
– Helping the group to function well as a team?– Level of enthusiasm and participation ?
➤ Contribution to design groups– Did the team member attend and participate in
team meetings and complete assigned tasks onschedule?
– Was the team member dependable and reliable indoing their share of the work?
– Was the team member effective and valuable inaccomplishing tasks and assignments?
– Did the team member take initiative to seek outtasks and responsibilities?
– Did the team member facilitate the team process,provide valuable direction, and motivate others?
– Did the team member help to create a positiveteam experience and contribute to team morale?
Once the assessment has been completed by all teammembers, individuals receive a score called an SPA.
SPA = SQRT(Total ratings for individualmember/Average of total ratings for all team members)
An SPA of 1.0 would indicate that the team member’scontribution was rated as being equal to the average contri-bution of the team. A major divergence from 1.0 wouldindicate a need for further investigation to determine if therewwere issues within the group.
The main use of the SPA is as an assessment moderatorfor a group submission. For instance, with some pre-set
conditions, an individual’s mark = the team mark × theindividual’s SPA.
In addition, the student is asked to self-assess theircontribution to the project. This second score or factor that isgenerated is termed an SAPA. It is calculated as:
SAPA = SQRT(Self-assessment value/Average rating ofall team members)
This is a powerful feedback option as it compares whatthe student ‘thinks’ their contribution is with their teammembers’ views. Again, the ideal score is 1.0.
Once the task is completed by all students the results arereleased. Students are aware of the implications of the SPAand SAPA scores. Table III and Table IV indicate the resultsfor a group of eight students. Results are not returned tostudents if less than four students complete the task. Table IIIindicates that Student 2 is performing extremely wellalthough they may be somewhat reserved in the assessmentof their own input. Table III also indicates that all studentsexcept the fourth student are contributing strongly to thetask. An SPA of 0.83 is quite low and indicates that thestudent is not performing. However, the SAPA of 1.48indicates that they consider they are contributing far andabove what the other group members believe. Such a high
▲
976 DECEMBER 2014 VOLUME 114 The Journal of The Southern African Institute of Mining and Metallurgy
Table III
Sample SPA and SAPA scores undertaken in week 6
SPA SAPA
0.98 0.981.17 0.91.1 1.030.83 1.480.96 10.96 1.051.01 10.96 -
Table II
Rating options
NC No contribution 0–4WB Well below average 4–28BA Below average 28–52AV Average 52–76AA Above average 76–100
Figure 7—Student reflections on value of peer assessment

score could also indicate the student has just selected 100%in all categories. This student would be interviewed if theSPA was to be used as a moderator.
The feedback given by team members may also help toexplain the SPA of 0.83. The team is concerned regarding thelack of involvement in the project.
➤ Good team member, although a higher attendance rateto meetings would be appreciated.
➤ Has made some solid contributions to the project andthe design. plenty of experience
➤ Whilst not present at meetings, he still providedvaluable insight and experience to the teamenvironment.
➤ Did not come to many of the meetings.➤ Seldom attends to the group meeting due to personal
reason and hardly hear any valuable information fromhim.
➤ Gave effective suggestions on the project.
In addition the last line of Table III indicates that thestudent has not undertaken the SPARK assessment. Thescore of 0.96 is a result of their peers’ review only.
As previously mentioned, all students see their ownscores and feedback. It is expected that students will considerall comments and modify their contribution a little whereneeded. It is very rare that I need to talk to the groupmember.
Table IV represents same process undertaken in week 12after all assessments had been completed. In comparison tothe results published after week 6, the indication is that thegroup contributions have improved, although only slightly insome cases. It is interesting to note that student 4 hasimproved greatly, with their SPA increasing from 0.83 to 1.0and their SAPA dropping to a more acceptable level of 1.04.This illustrates how the peer review process is received bystudents. The comments below on the same student alsoshow the change in effort that appears to have been made.All feedback is released unedited, and I believe is wellaccepted and obviously can be a great morale booster or anearly ‘wake-up call’.
➤ Good team member, great to work with.➤ Great bloke to work with, plenty of innovative ideas
and experience➤ Provided a wealth of experience and advice for the
team.
➤ fProvided fantastic contributions to the group.➤ Contributed a lot in building of the dragline.➤ Good team member, enthusiastic and dedicated.➤ Great team member always sparing much time for
group given his tight schedule
Summary
The data in Table III and Table IV is taken from the 2013offering of this course. The total cohort was 79 students in10 groups. After week 12, 77 student SPA results werecompared to those obtained after week 6. Two students hadbeen removed as their scores were incomplete. Of theremaining 77, 24 students (31%) had a lower SPA in week12 compared to week 6. However, the average decrease inSPA averaged only 0.05 points. I am not too concernedregarding this value as 43 (56%) students showed anincrease in SPA, with 10 remaining the same. The averageoverall improvement in SPA was 0.035. Although it cannotbe formally confirmed, I believe that the increase in studentinvolvement is a result of the feedback gained at the end ofweek 6. Peer review is a powerful tool and can be a greatmorale builder rather than a punishment tool.
Not all courses require this process to be undertakentwice in a semester. However, in ENGG1000 it is run in week6 as a formative exercise, and again in week 12. The SPAvalue from week 12 is used as a moderator of a student’smark. This generally works quite well. However, situationshave arisen where a student receives a very low score, orvery high score that could return a final mark of greater than100%. Typically, in each course outline made available tostudents before commencement of the course a limit isadvised. For example SPAs are limited to between 0.90 and1.10 in the case of ENGG1000. If a score is outside theselimits I would meet with the student to discuss the issues anddetermine if there were any extenuating circumstances. Incases where the SPA is very low I find that other individualassessments are often completed poorly and receiving similarSPAs from other group work. This is a good indicator that thestudent is not coping well with the workload, and the studentis encouraged to discuss their progress with a staff member.
Peer review of group work contributions has been a majorcomponent of UNSW mining courses for a number of years.Overall, I feel that peer review overcomes some of thetraditional issues with group work, particularly being able todetermine the contribution of an individual to an assessmenttask. So often group members receive the group mark, whichis not always appropriate. This often promotes discontentwithin the group and engenders a clear reluctance toundertake further group work assignments.
A clear advantage of introducing peer review and peerassessment in a year 1 course is that students becomeaccustomed to using both approaches in later years, whenthey become more important.
ConclusionsThis paper set out to describe initiatives trialled and presentsome of the challenges of continually developing andmanaging a course for 1400 students with a strong emphasis
An evaluation of the effectiveness of teamwork, with an emphasis on peer assessment
The Journal of The Southern African Institute of Mining and Metallurgy VOLUME 114 DECEMBER 2014 977 ▲
Table IV
Sample SPA and SAPA scores undertaken in week12 for same group
SPA SAPA
1.02 0.971.05 0.941.01 1.051 1.040.99 1.070.97 1.10.99 0.90.97 1.17

An evaluation of the effectiveness of teamwork, with an emphasis on peer assessment
on group work and peer interaction, which is uncommon in atypical year 1 course. The main challenges included theprocess of working together as a team. Many, if not most,students would have had little experience with working in ateam and hence the transition to this type of non-individualstudy can be quite confusing, challenging, and evenconfronting when students have to work together in a smallteam to produce an outcome. In addition, the members of theteam are required to provide feedback to their teamcolleagues on the quality of assessable material submitted aswwell as on commitment to the process of completing it.
I have shown that, overall, the process is a success.Students gain a lot from the experience. However, there areissues that need to be addressed. We need to ensure thatstudents understand the reasons for peer assessment, thatthey are comfortable with the process, know how to givefeedback, are comfortable with assessing another students’submission, and know how to comment on the level ofinvolvement of colleagues in the process. We need to work atshowing students that group projects are fair and are acommon approach across many courses in engineering.
AAcknowledgements
I wish to acknowledge the great team of the nine school co-ordinators who contribute to the success of this course. I amalso grateful for the support of David Clements, the FacultyAssociate Dean Education, and John Paul Posada, the FacultyEducation Technologist for his valuable Moodle Technicalsupport. I would also like to acknowledge the support MiningEducation Australia for continued access to SPARK Plus andto Keith Willey at the University of Technology, Sydney forhis guidance and support in all aspects of SPARK Plus.
References
BEAMISH, B., KIZILKK , M., WILLEYWW , K., and GARDNER, A. 2009. Monitoring mining
engineering undergraduate perceptions of contribution to group project
work. 20th Annual Conference for the Australasian Association for
Engineering Education, Adelaide, 6-9 December 2009. Engineering the
Curriculum. Barton, A.C.T. Engineers Australia. pp. 318–325.
DUTSON, A., TODD, R., MAGLEBY, S., and SORENSEN, C. 1997. Review of literature
on teaching engineering design through project oriented capstone courses.
Journal of Engineering Education, vol. 86, no. 1. pp. 17–25
GIBBS, G. and SIMPSON, C. 2004. Conditions under which assessment supports
student’s learning. Learning and Teaching in Higher Education, no. 1.
2004-05.
HEMER, D. 2008. Peer assessment of group-based software engineering
projects. 19th Australian Conference on Software Engineering, Perth,gg
Western Australia, 26–28 March 2008. pp. 470–478.
KENNEDYKK , J.K. 2005. Peer assessment in group projects: is it worth it?’
Computing Education 2005. Proceedings of the Seventh Australasian
Computing Education Conference (ACE2005), Newcastle, NSW. CRPIT, 42.
Young, A. and Tolhurst, D. (eds.). Australian Computer Society, Sydney.
pp. 59–65.
MCALPINE, I., REIDSEMARR , C., and ALLEN, B. 2006. Educational design and online
support for an innovative project based course in engineering design.
Proceedings of the 23rd Annual Conference of the Australasian Society for
Computers in Learning in Tertiary Education (ASCILITE), University of
Sydney, 3–6 December 2006.
MCALPINE, I. and REIDSEMARR , C. 2007. The role of student peer review and
assessment in an introductory project based engineering design course.
Connect-ed 2007.77 International Conference on Design Education, UNSW,
Sydney, July 2007.
MITRA, R., SAYDAM, S., DALY, C., and HAGAN, P. 2009. Enhanced student collabo-
ration in mining engineering through peer review of major projects.
International Journal of Learning, vol. 16, no. 11. pp. 501–519.gg
http://ijb.cgpublisher.com/product/pub.30/prod.2494.
PARKER, K.R. and CHAO, J.T. 2007. Wiki as a teaching tool, interdisciplinary.
Journal of Knowledge and Learning Objects, vol. 3.
PARSONS, J.R. and KLUKKENKK , P.G. 2005. An introductory design and innovation
course at the University of Tennessee. Frontiers in Education Conference,
Atlanta, GA, November 2005. pp. 3a5, 13–15.
RACERR , P. 2001. A Briefing on Self, Peer and Group Assessment. Assessment
Series no. 9. LTSN Generic Centre, York, UK.
VOS, H.J., FRITS, P. VAN B., and TEN BRUGGENCATE, G.C. 2000. Multidisciplinary
design projects among both engineering and humanities studies.
International Journal of Continuing Engineering Education and Lifelong
Learning, vol. 10, no. 1–4. pp.314–326.gg
WEBB, A. and WILLISWW , L. 2010. Enhancing feedback for engineering students.
Higher Education Academy Engineering Subject Centre, Loughborough
University, UK.
WHITEWW , F., LLOYD, H., KENNEDYKK , G., and STEWART, C. 2004. Effective Management
and Assessment of Group Work. Final Report: Teaching Improvement
Fund 2003, Faculty of Science, University of Sydney.
WILLEYWW , K. and FREEMAN, M. 2006. Improving teamwork and engagement: the
case for self and peer assessment. Australasian Journal of Engineering
Education, vol. 12. http://www.aaee.com.au/journal/2006/willey0106.pdf
WILLEYWW , K. and GARDNER, A. 2006. Improvements in the self and peer
assessment tool SPARK: do they improve learning outcomes? ATN
Assessment 08, UTS; Engaging students with assessment.
WILLEYWW , K. and GARDNER, A. 2008. Using self and peer assessment for profes-
sional and team skill development: do well functioning teams experience
the benefits? ATN Assessment 08, UTS; Engaging students with
assessment. ◆
▲
978 DECEMBER 2014 VOLUME 114 The Journal of The Southern African Institute of Mining and Metallurgy

Introduction–the problemMost engineering schools have been reluctantto get involved in developing soft/leadershipskills in undergraduates, in spite of the factthat it is not possible to neatly and clinicallyseparate technical skills from leadership skills.
Graduates leave university with anabundance of solid technical knowledge, butwwith low leadership indicators (as shown onpsychometric assessments conducted at thebeginning of their final year of study) tosupport this knowledge. It is not possible tofunction optimally as an engineer with onlythe technical knowledge, no matter how hard-wwon and vitally important it is.
fAs an example of these shortcomings, theDepartment of Mining Engineering at theUniversity of Pretoria has assessed emotionalintelligence levels and other behaviouralattributes in final-year students over the pastfew years. The results show markeddeficiencies in certain important intrapersonaland interpersonal constructs. These constructsor skills are vitally necessary in comple-menting technical knowledge in view of howmuch time an engineer spends in associationwith people and in forging effective workingrelationships. This association with peopletakes place from day one. The new graduate isimmediately put to the test on ‘people’ issues,having received meagre instruction or practicein applying basic leadership skills.
Graduates go through a type of identitytransition when they enter the workplace,despite having worked during their vacationsat various companies. Those experiences areephemeral – entering the workplace as apermanent employee is different. Thistransition from student to employee can anddoes cause all sorts of anxieties, justified orotherwise. According to the psychometricassessments for final-year students in theDepartment of Mining Engineering for the lastthree years, many students are not wellequipped to cope with the exigencies of thereal world. In particular they are confrontedwith people/soft issues, either in themselves orin others, that require leadership skills toresolve.
Literature surveyGriesel and Parker (2009) highlight thedifferent positions taken by employers and therole of higher education in meeting the skills’
The Sasol Engineering Leadership Academy(Part of the Sasol Chair in Safety Health and Environment initiative in theDepartment of Mining Engineering, University of Pretoria)
by C. Knobbs*, E. Gerryts*, T. Kagogo*, and M. Neser*
SynopsisContrary to the way it is often portrayed, the average organization orcompany is far from being a cold, calculating machine. It is actually ahighly emotive place where interaction with people is a fundamental partof its ability to perform satisfactorily.
The company, through its employers, expects employees, including newgraduates, to have the ability to cope adequately with this emotiveenvironment. The graduate is frequently unable to meet this expectationbecause he/she has not been developed to do so. Technical knowledge ishis only asset. This deficiency manifests itself in leadership shortcomings,both intrapersonal and interpersonal. Further analysis reveals a deficiencyin three elements of leadership – self-awareness, oral communication, andan ability to work cooperatively in teams.
To address these three elements of leadership, Sasol Coal, a subsidiaryof the big petrochemical company in South Africa, sponsored a leadershipprogramme at the University of Pretoria for their final-year bursarystudents in the faculty of Engineering. This programme, the SasolEngineering and Leadership Academy (SELA), consisted of a number ofinterventions designed to address the three areas of self-awareness, oralcommunication, and cooperative behaviour in teams. These interventionsvaried from an intrapersonal nature to interpersonal aspects. Psychometricassessments were followed by experiential modules dealing with the threeconstructs.
SELA was evaluated at the end of the year. The results showed apositive shift in the main constructs of self-awareness, communications,and cooperation. This was measured quantitatively and qualitatively.Conclusions were drawn and recommendations for improving theprogramme were proposed.
Keywordsleadership, self-awareness, communication, group work.
* University of Pretoria, Pretoria, South Africa.© The Southern African Institute of Mining and
Metallurgy, 2014. ISSN 2225-6253. This paperwas first presented at, A Southern African SilverAnniversary, 2014 SOMP Annual Meeting, 26–30June 2014, The Maslow Hotel, Sandton, Gauteng.
979The Journal of The Southern African Institute of Mining and Metallurgy VOLUME 114 DECEMBER 2014 ▲

The Sasol Engineering Leadership Academy
fneeds of graduates. Employers cite gaps between ‘what theyget’ and ‘what they expect’ in graduates. Communications(written and oral), openness and flexibility, self-motivationand initiative, leadership ability, ability to relate to people,and teamwork are among the attributes showing the largestgaps. In an empirical study of young graduates conducted bythe first author, the absence of soft (leadership) skills orpoorly developed soft skills were frequently mentioned assomething they would have wanted to learn at university(Knobbs, 2012).
Both employers and young engineering graduatesarriving at the workplace for the first time have identified‘gaps’ or ‘deficiencies’ in the graduates’ knowledge andskills. Scott and Yates (2002) asked engineers to rate thoseattributes most important for success and to what extentthese attributes were taught or developed at university.Principally, the gap is in ‘people’ skills and is a consequenceof poorly developed leadership attributes, of both an intrap-ersonal and interpersonal nature.
Male et al. (2010) refer to a ‘skills gap’ when comparingwwhat employees want from engineering graduates with whatgraduates bring to the work place They identify in theirsurvey that the soft skills missing in undergraduateeducation are communications, self-management, attitude,problem solving, and teamwork. Nair et al. (2009) confirmthis and showed that communications and interpersonalskills are the two most significant deficiencies in graduates.
Communications, responsibility, and self-confidence arethe three main challenges that graduate engineers face whenentering the workplace according to Baytiyeh and Naja(2012). The importance of people management skills and oralcommunication skills for success as an engineering manageris demonstrated by Saunders-Smits and De Graaff (2012).Their research shows that ‘technical’ comes last on the list of12 attributes. For engineering specialists the reverse was thecase, although communication skills featured prominently.
In their sample of early-stage chemical engineeringgraduates Martin et al. (2005) identify, through aquestionnaire and interviews, several gaps, not the least ofwwhich are practical knowledge, interpersonal skills, andmanagement/leadership. A survey of skills required foreffective project management singled out six skills, four ofwwhich were soft skills – interpersonal communications, peoplemanagement, team management, and problem solving;leadership skills followed close behind (Tong, 2003).
Martin et al. (2005) investigated non-technicalcompetencies such as communications, teamwork, life-longlearning, and attitude among chemical engineering graduates.The graduates stated that they had acquired good generalcommunications skills from their undergraduate education.Interpersonal skills were highlighted and seen as the vitallink between communications and teamwork. On the matterof teamwork they were divided as to whether the universityhad prepared them well. The graduates in the survey declaredthat the university had not prepared them adequately forleadership roles. In another report from the aerospaceindustry, communications and the ability to function in teamswwere highlighted as part of what the broad engineeringeducation should include (McMasters, 2003).
Sageev and Romanowski (2001) concentrated ontechnical communications among graduates who had
attended a course on this subject as undergraduates. Theyrecommended that communications should be made anintegral part of the engineering degree. The graduates saidthat communication skills had helped to advance theircareers. Oral presentations, group discussions, andpersuasive language were all stressed as important elementsin their technical communications programme. Theprogramme was roundly endorsed by the workplace, whichgave its input into promoting, advancing, and improving thecourse.
Oral communications are recognized as a major attributefor practicing engineers, who spend much time in discussionand conversation (Darling and Dannels, 2003). This study ofpractising engineers reported on the types of communicationand the audiences that engineers have to deal with. Theenvironment was succinctly described as an ‘oral culture’. Aprogramme to teach communication, leadership, andteamwork was instituted at the University of Tennessee inresponse to calls from industry employers and engineeringeducators. Assessment of the efficacy is done by means of apeer evaluation survey, with plans to introduce a longitudinalstudy measuring behavioural changes (Seat et al., 2001).This is another example of where teaching skills (as opposedto inculcating knowledge) and improving self-awareness is aprecursor to developing or influencing leadership capabilities.
A major survey conducted by the National Academy ofEngineers (2005) refers to a number of attributes thatengineers should display to be truly successful. Theseattributes are accredited by the Engineering Council of SouthAfrica and are listed as follows:
1. Strong analytical skills2. Practical ingenuity3. Creativity4. Communication5. Business and management principles6. Leadership7. High ethical standards and a strong sense of profes-
sionalism8. Dynamism, agility, resilience, and flexibility9. Life-long learners.
MotivationThe workplace can be a harsh environment whenrequirements for assimilation and success, as seen byemployers, are not fully met by the knowledge and skills thatyoung graduates bring to the company straight fromuniversity. Apart from a dearth of practical engineeringexperience, students lack soft skills/leadership acumen andthe ability to deal with the people issues that arise in theworkplace. This can lead to unhappiness and frustrationaffecting their incorporation into the culture of the companyand their ability to make meaningful contributions and toadvance their careers. It is postulated that this lack ofleadership skills, principally self-awareness, communications,and cooperation (working in groups) is a gap in their toolboxand its significance is recognized by employers and graduatesalike.
These identified deficiencies or gaps hamper thegraduates’ ability to assimilate and to adapt to life in the ‘realworld’. Furthermore, they can cause anxiety and frustration,and even thwart their career advancement. The ability to
▲
980 DECEMBER 2014 VOLUME 114 The Journal of The Southern African Institute of Mining and Metallurgy

f ffadapt successfully affects retention and motivation, and canbe a serious problem in some sectors of the industry.Sometimes, traumatic entry into the workplace causes younggraduates to seek their fortune elsewhere. And if they arefortunate enough to be appointed or considered for anappointment as a supervisor early in their careers, they areoften ill-equipped to take the position. Early intervention todevelop leadership skills is needed.
In the opinion of the first author it seems reasonable, ifnot essential, to equip these young engineers with thenecessary fundamentals of leadership to make their entryinto the workplace less traumatic and equip them to performadequately. It is postulated that these fundamentals ofleadership, be they intrapersonal or interpersonal skills, canbe developed by concentrating on the three leadershipconstructs of self-awareness, oral communication skills, andgroup co-operation skills.
According to Yorke and Knight (2006) employability isinfluenced by four interrelated components, namely: skills(communications, management of time and self, problem-solving, and life-long learning); a field of knowledge; identityand self-worth; and meta-cognition (self-awareness andreflection).
ObjectivesSELA’s main objective is to instil enhanced leadership skillsinto a group of final-year engineering undergraduates. Self-awareness, oral communications, and working co-operativelyin groups were selected as the main ‘drivers’ of thisleadership development programme. Changes in these threeelements were measured qualitatively and quantitatively.
The model in Figure 1 illustrates the structure of theleadership problem and how SELA addressed this:
MethodologyData was collected at the beginning of the programme inFebruary by means of three psychometric instruments –SShadowmatch (habits and behaviour), EQi (emotionalintelligence), and HBDI (thinking styles). SELA consisted of32 students, mostly final-year undergraduates with SASOLbursaries. They came from a number of different departmentsin the Engineering (EBIT) faculty, with the largest groupfrom chemical and mining engineering. This multidisciplinarycomposition of the participants proved to be one of the realboons of the course.
To measure the possible change in self-awareness,communications, and working cooperatively within smallgroups, a mixed method approach was employed. TheSShadowmatch assessment measuring the behavioural habitsof the group was administered at the beginning of theprogramme and again after the programme to map possiblechanges in the behaviour of the students. A qualitative-quantitative questionnaire was used after the course to detectthe changes in perception from the students aboutthemselves. The other two instruments, EQi and HBDI, wereIInot repeated due to cost constraints.
InterventionThe philosophy adopted for the interventions in theleadership programme was driven by the Harvard model
f ff fderived from the US Army officers’ course of knowing-doing-being (see Figure 2). The knowing part emphasizes thecognitive domain or knowledge about leadership (leastaddressed in SELA). The doing part emphasizes behaviouralaspects and essential skills leaders need – it is about learningby experience. The being part concentrates on the identity,character, and values of leaders. It is essentially about whothey are (self-awareness).
The course was presented in eight contact modules withinthe full group and held on Saturdays (this was the onlyarrangement that could cater for the multidisciplinary
The Sasol Engineering Leadership Academy
981The Journal of The Southern African Institute of Mining and Metallurgy VOLUME 114 DECEMBER 2014 ▲Figure 1—Bridging the gap
Figure 2—The Harvard Model (Snook et al., 2012)

The Sasol Engineering Leadership Academy
fcomposition of the group). Appendix 1 shows the programmeof modules with the various interventions. Between modules,wwhich were approximately one month apart, case studieswwere examined. Smaller groups of four students were formed.These groups discussed the cases among themselves andthen met with the first two authors in a coaching session.Oral communications and group collaboration wereemphasized.
At these sessions, the group presented its findings andthrough discussion and debate students were prompted tofurther tease out hidden issues in the case studies that mayhave been overlooked. Not only were students exposed toreal-life situations of human behaviour, which wasinstructive in itself, they were interacting as a group andexperiencing all the issues associated with group performancelike conflict and communications. An hour was allocated forthe small group discussion and an hour for the coachingsessions.
Groups were changed after every two modules to giveeveryone an opportunity to interact with as many of theirfellow students as possible. This practice mimics the situationin real life, where an individual will probably be a member ofmore than one group and may find himself moved from oneteam to another frequently.
Module 1 concentrated on the completion of threeassessments, which were done in a computer laboratory oncampus. The assessments used were the Herrmann BrainDominance Instrument (HBDI) (Herrmann, 1996),IISShadowmatch™(2009), and the EQ-i (Bar-On, 1996). Theseassessments were selected to assess and develop the mainthree constructs of focus in the leadership programme,namely self-awareness, communications, and co-operation(teamwork). HBDI measures individual thinking styles andlends itself to illustrating all three constructs in a useful way.SShadowmatch measures behavioural habits and calculatesthe similarity or differences in habits of people in a certainenvironment. Shadowmatch also has a team assessmentfunctionality, which enriches teamwork in the smallergroups. Shadowmatch has the ability to generate individualperformance programmes, which some students embracedwwith the help of a mentor. EQi was used mainly for detectingemotional self-awareness and to enhance the appreciation ofemotional concepts, which students are not used to dealingwwith in an engineering curriculum.
Modules 2, 3, and 4 dwelt on the results of theseassessments. The results were discussed with the partic-ipants, who not only learned about themselves (self-awareness) but also about their fellow students with whomthey were interacting on a regular basis, and particularlywwhen sitting in the same small groups together. By the end ofmodule 4, students had an overview of the intrapersonalmatters that made up the foundation of the self-awarenesspart of leadership.
The second four modules concentrated on theinterpersonal aspects of leadership, starting with presentationskills, where two members of the Department of Speech andDrama were brought in as facilitators. Module 5 was spentmainly on communications and watching a case study wherea jury needs to decide on the outcome of a murder case. Thelast module was a simulation exercise covering the contro-
fversial ‘fracking’ process. The small groups representeddifferent stakeholders negotiating fracking in the SouthAfrican context.
ReflectionWriting reflections is an integral part of leadershipdevelopment, and commentary on the facets of self-awareness, oral communication, and cooperation in theprogramme was encouraged. The connection betweenleadership and personal reflection is intended ’to maximiseindividual potential by allowing students to evaluate thesignificance of their experiences from a leadershipperspective’ (Densten and Gray, 2001). Students wereencouraged to reflect on how they felt about the programmeafter each module and to critically explore their feelings andthoughts in a confidential written document of no more thanone page. The facilitators made comments and suggestionsbefore returning the reflection paper to each student.
Some students wrote reflection papers regularly,expressing discovery or anxieties aroused by the programme.Some students wrote sporadically, a few never wrote at all.The multidisciplinary composition of the participants provedto be one of the real virtues of the course according to partic-ipants.
ResultsSELA’s objectives of improving, understanding, anddeveloping skills in the main three tenets of leadership weremeasured qualitatively and quantitatively through aquestionnaire. The questionnaire was used to evaluate thestudents’ perceptions of the changes in self-awareness,communication skills, and their skill in working in smallgroups. Participants completed a comprehensivequestionnaire and the Shadowmatch assessment wasrepeated at the end of SELA.
Qualitative: unstructured questions in questionnaire
Students rated the enjoyment and efficacy of eachintervention. Clearly some interventions were not as highlyregarded as others. The case studies proved to be difficult formany of the participants, who as engineering students wereseeking more structure and solid solutions to the problemsunveiled in the case. There seemed to be a measure ofdiscomfort in examining ‘messy’ human behaviour issues.This probably accounts for the low rating given to casestudies as an intervention.
The unstructured questions solicited many comments, toonumerous to mention in total. The following comments aresamples of some of the questions and statements made bythe participants:
Question 2. What aspects of the course did you enjoy?Students answered this question in favour of group work,being able to learn about and practice presentations, and theopportunity to meet and interact with people they did notknow. Quoted samples of some of the reactions were:
‘Being forced to work in groups and presenting part of acase study’‘Meeting and learning about new people’.
▲
982 DECEMBER 2014 VOLUME 114 The Journal of The Southern African Institute of Mining and Metallurgy

Question 3. What aspects of the course did you notenjoy?In some cases, students found it challenging to balance timefor studies with the contact time to attend monthly meeting,especially at the end of the year as final-year projects had tobe handed in. Quoted examples of their feedback regardingthis question were:
‘Occasional inability to contact and meet with groupmembers’‘Time-consuming in relation to studies and projects thatneed to be done for the University’.
Question 4. What topics should be added to the course?Students mentioned that they wanted more theory on thesubject of leadership. Several students also mentionedaspirations to reach out into the community to apply whatthey had learnt on the programme. Some examples of theirfeedback were:
‘More role-play to practise handling conflict andworkplace meetings’‘Community group work to learn how to interact withengineers in a public environment and not only oncampus’.
Question 5. What topics should be removed (or modified)from the course?No strong trend could be detected, except for a request tochange the selection of case studies. Some of the feedbackfrom students was:
‘The selection of case studies’‘Have more debates than presentations’‘Reduce reading material’.
Question 6. What else can be done to improve thecourse?Several comments were received from individuals on thisquestion, but the only repeated suggestion for improving thecourse was to involve more people from other engineeringdisciplines.
‘Encourage more people to attend the course who are notnecessarily Sasol bursars’.
Question 14. What else do you want to tell us about thecourse or yourself?Students indicated that they enjoyed the programme, thatthey found it helpful personally, and that they wouldrecommend the programme to other students. Somecommented on the fact that the course was recommendableespecially to engineering students because of the skills andvviews presented. It was also mentioned that the courseinfluenced the way they interacted with others.
‘Extremely useful and many engineering students wouldbenefit from the skills and perspectives presented’‘I found out things about my personality which I did notpreviously know’.
Quantitative: Structured questions in questionnaireAppendix 2 shows the responses to the structured part of thequestionnaire that the students completed after the course.From those responses it is clear that students’ perceptions
and skills were changed by their involvement in SELA.Communications, self-awareness, and group work were theconstructs in focus and the course was designed to improveknowledge and skills in these constructs.
➤ Communications—Questions 1, 2, 4, and 5 dealt withsscommunications. Students indicated that theirconfidence to communicate in small and larger groupschanged a lot. They perceived that their ability toeffectively communicate by sharing ideas had changedsignificantly. Students collectively agreed that theirpresentation skills were enhanced through the SELAprogramme
➤ Self-awareness—Questions 3, 7, and 10 dealt with self-ssawareness. Students indicated that their self-awarenesschanged a lot and that the assessments done in theSELA programme helped them to understandthemselves better. Students also indicated that theirpersonal sense of self was enhanced through theinteraction with fellow students and the facilitators inSELA
➤ Group work—Questions 6, 8, and 9 dealt with groupsand teamwork. Students specified that their perceptionsof interpersonal skills were enhanced through theintervention. The assessments proved to be helpful tostudents in understanding other people and fellowstudents. Most students indicated that even asengineering students they enjoyed working in smallgroups.
Shadowmatch resultsAs mentioned previously, students completed theShadowmatch worksheet before the SELA interventionsstarted in February 2013 and again after the interventions inOctober 2013. The average of the full group on each habitwas calculated on both occasions and compared in order tocalculate the biggest differences on each habit (see Appendix3). Shadowmatch measures 25 different habits. The groupshowed significant changes in the following habits (seeFigure 3).
Responsiveness is the individual's reaction speed, in otherwords the habit of acting immediately if and when necessary(De Villiers, 2009). The average profile of students showed a10% increase in responsiveness. To simplify is the habit ofbreaking complex scenarios down to linear challenges thatcan easily be resolved (De Villiers, 2009). Students showedan 11% increase in the habit of simplification.
The Sasol Engineering Leadership Academy
The Journal of The Southern African Institute of Mining and Metallurgy VOLUME 114 DECEMBER 2014 983 ▲
Figure 3—Most significant changes in habits according toShadowmatch

The Sasol Engineering Leadership Academy
f f fThe most significant shift in the habits of SELA studentswwere on propensity to change and innovation. Shadowmatch(De Villiers, 2009) defines propensity to change as the habitof being comfortable with change and the ease with which anindividual adapts to new and different things andenvironments. Students showed a 22% improvement in beingcomfortable with change after the interventions of SELA.IInnovation is defined as the habit of finding new ways andidentifying better processes and methods to improve oncurrent methods of working (De Villiers, 2009). An 18%improvement in attitude towards innovation was seen in theaverage profiles between February and October 2013.
How do these relate to the primary objective of improvingthe leadership elements of self-awareness, oral communi-cation, and cooperative group work? Shadowmatchconstructs correlate well with some of the National Academyof Engineers (2005) attributes, as mentioned earlier, but theconnection with the three elements of leadership under studyis tenuous.
Conclusion
For the graduate, a smooth entry into the workplace andconfidence to perform built on fundamental leadership skillsand capabilities is invaluable; for the employer the graduateis likely to make a more meaningful contribution toimproving the company’s performance. Employers will reapthe profits and individuals will boost their standing in thecompany. In brief:
➤ The responses to the questionnaire showed the strongextent to which skills associated with the three targetedfacets had been enhanced by the SELA interventions
➤ The positive changes in the Shadowmatch profiles onaverage, particularly in respect of certain habitsassociated with leadership, are encouraging. The factthat so many individuals showed marked positivechanges in habits/behaviour on the Shadowmatchresults is gratifying
➤ Some interventions, like case studies, need to berevisited. Cases with more technical bias mightengender more interest and involvement, bearing inmind that the main idea of the case is to stimulate aprocess of vigorous interaction in the group more thanaddress the knowledge or content aspect of the case
➤ The speech and drama intervention to help with self-confidence and making presentations was highlyapplauded, but probably consumed too much time thatcould have been allocated to other interventions
➤ The fracking simulation was a rip-roaring success andmore time needs to be found to do the intervention fulljustice
➤ Too few reflection papers were submitted and moreeffort needs to be put into persuading participants ofthe enormous value that can be gleaned from thispractice.
SELA, as a pilot study, achieved the objective of showinga measurable change in the three main elements of leadershipchosen for the programme. Undoubtedly, these changes canbe amplified by giving careful consideration to thecomposition of the interventions. Shortcomings have beenidentified in certain interventions that could result in modifi-
cations or, indeed, replacement. Spreading SELA’s wings toaccommodate more students must be considered. It isabundantly apparent from surveys that there is a healthydemand from students to participate in SELA, although itscontinuation and expansion is dependent on time, availabilityof funds, and the capacity of the facilitators.
ReferencesBAR-ON, R. Not dated. EQ-I Technical Manual, BarOn Technical Manual edition.
High Performing Systems, Inc., Watkinsville, GA.
BAYTIYEH, H. and NAJA, M. 2012. Identifying the challenging factors in thetransition from college of engineering to employment. fEuropean Journal ofEngineering Education, vol. 37, no. 1, March. pp. 3–14.
DARLING, A.L. and DANNELS, D.P. 2003. Practising Engineer Talk.Communication Education, vol. 52, no. 1. pp. 1–16.
DE VILLIERSVV , P. 2009. Shadowmatch: The Full Story. DBA, Bryanston, SouthAfrica.
ECSA. 2004. Whole Qualification Standard for Bachelor of Science inEngineering (BSc(Eng))/ Bachelors of Engineering (BEng): NQF Level 7,Document : PE-61, Rev-2, Registered on the National QualificationsFramework: NLRD no. 48694.
GRIESEL, H. and PARKER, B. 2009. A Baseline Study on South African Graduatesfrom the Perspective of Employers. South African Qualifications Authority,Pretoria.
KNOBBSKK , C.G. 2012. A Study of Graduates’ Perception of their Deficiencies in theWork Place. Unpublished survey. Department of Mining Engineering.University of Pretoria.
MALE, S.A., BUSH, M.B., and CHAPMAN, E.S. 2010. Perceptions of competencydeficiencies in engineering graduates. Australasian Journal of EngineeringEducation. vol. 16, no. 1. pp. 55–67.
MARTIN, R., MAYTHAM, B., JENNIFER, C., and FRASER, D. 2005. Engineeringgraduates' perception of how well they were prepared for work in industry.European Journal of Engineering Education, vol. 30, no. 2, May.pp. 167–180.
MCMASTERS, J. 2003. Influencing Engineering Education. Mudd DesignWorkshop, Harvey Mudd College, Claremont, CA..
NAIR, C.S., PATIL, A., and MERTOVA, P. 2009 Re-engineering graduate skills - acase study. European Journal of Engineering Education, vol. 34, no. 2,May. pp. 131–139.
NATIONAL ACADEMY OF ENGINEERING. 2005. Educating the Engineer of 2020.Adapting Engineering Education to the New Century. The NationalAcademies Press, Washington, DC.
ROMANOWSKI, C.J. and SAGEEV, P. 2001. A message from recent engineeringgraduates in the workplace. Journal of Engineering Education, vol. 90,no. 4. pp. 685–693.
SAUNDERS-SMITS, G., and DE GRAAFF, E. 2012. Assessment of curriculum qualitythrough alumni research. European Journal of Engineering Education,vol. 37, no. 2, May. pp. 133–142.
SEAT, E., PARSONS, J.R., and POPPEN, W.A. 2001. Enabling EngineeringPerformance Skills. Journal of Engineering Education, vol. 90, no. 1.pp. 7–12
SNOOK, S., NOHRIA, N., and KHURANAKK , R. 2012. The Handbook for TeachingLeadership. Sage, Thousand Oaks, CA.
STEIN, S.J. AND BOOK, H.E. 2006. The EQ Edge: Emotional Intelligence and YourSuccess. Jossey-Bass, Mississauga, Ontario.
TONG, L.F. 2003. Identifying Essential Learning Skills in Student'sEngineering Education. Higher Education Research and DevelopmentSociety of Australasia, Christchurch, New Zealand.
YORKE, M. and KNIGHTKK , P.T. 2006. Embedding Employability into theCurriculum. The Higher Education Academy, Heslington, York, UK. ◆
▲
984 DECEMBER 2014 VOLUME 114 The Journal of The Southern African Institute of Mining and Metallurgy

The Sasol Engineering Leadership Academy
The Journal of The Southern African Institute of Mining and Metallurgy VOLUME 114 DECEMBER 2014 985 ▲
Appendix 1Programme of modules and interventions

The Sasol Engineering Leadership Academy
▲
986 DECEMBER 2014 VOLUME 114 The Journal of The Southern African Institute of Mining and Metallurgy
Appendix 3Shadowmatch results
Appendix 2Responses to structures questions

University mine rescue training coursesat Colorado School of Mines
IIndustrial backgroundThe mining industry in the USA is still a majorcontributor to the primary sector of theeconomy. In 2010, there were a total of 819underground mines actively operating in theUSA (CDC-NIOSH, 2010).
Well-established mine regulations at thefederal and state levels and specializedenforcement authorities provide a high-qualitylegislative and organizational environment for
fthe implementation and organization of minerescue and emergency management. Federalregulations require each underground mine tohave two mine rescue teams available whileminers work underground. Small and isolatedmines may share rescue teams by entering intoagreements with neighbouring mines or theStates. These primary rescue teams must beavailable on-site within ‘reasonable time’following notification (US Code of FederalRegulations. 2014.
The mine rescue training programme atColorado School of Mines
In the early 1980s, Missouri University ofScience and Technology (MST) was the first toinstitute a university mine rescue team toprepare mining engineering students to handlemine emergency response and rescuesituations. In 2009, the Colorado School ofMines (CSM) followed with its ownprogramme. Currently (2014), eight NorthAmerican mining universities operate minerescue programmes fielding one or more minerescue teams.
CSM currently trains three student minerescue teams: an experienced men’s team, anexperienced women’s team, and a co-ed teammade up of first- and second-year students toallow new members to gain exposure and to betrained for the experienced teams. The firstCSM team was formed in 2009, the second in2010, and the third team in 2011. Membershipin the CSM mine rescue programme isvoluntary and open to students of all majors atCSM. The programme is organized and run bystudents, and the participating students do not
Mine disaster and mine rescue trainingcourses in modern academic miningengineering programmesby H. Mischo*, J.F. Brune*, J. Weyer*, and N. Henderson*
SynopsisThe mining industry worldwide is currently facing a significant restructuringprocess. In most underground mines, widespread mechanization of themining processes increases production while reducing staff numbers. At thesame time, mining depths as well as the lateral spread of the mine workingsare increasing. This ever-changing mining environment requires sophis-ticated solutions for the design and operation of underground mines. In fact,a reduced number of mining engineers is taking responsibility for ever-increasing mine operations. This applies not only to the excavation of theminerals, but also to all other aspects of the mining operation, includinghealth and safety, disaster management, and mine rescue organization.
Most mining engineering graduates entering the industry lackexperience in mine emergency management. Young engineer trainees mustlearn mine emergency management and rescue work in addition to theirnormal training experience on the job. Often, and unfortunately, emergencyand rescue training at different mining companies is not carried out to thehighest level and standard and with the best possible training outcomes. Thetasks and challenges a young engineer faces while being trained in a newposition do not leave much room for additional training in mine rescue andemergency management. At the same time, experienced, ’old hands’ areretiring and cannot easily be replaced due to limited graduation numbers.
Strategies are being developed at mining universities worldwide to trainmining engineering students in handling mine emergency situations and toprovide hands-on experience for managing potential accident and disasterscenarios underground. Two of these strategies, from the USA and fromCentral Europe, are presented in this paper. These specific strategies have tobe seen under special consideration of the local and regional boundaryconditions, but might serve as case studies for mining schools and univer-sities in other countries.
Keywordsmine disaster and emergency management, education and training, minerescue training, underground education and training, student education andtraining, internationalization.
* Technical University Bergakademie Freiberg,Freiberg, Germany.
† Colorado School of Mines.© The Southern African Institute of Mining and
Metallurgy, 2014. ISSN 2225-6253. This paperwas first presented at, A Southern African SilverAnniversary, 2014 SOMP Annual Meeting, 26–30June 2014, The Maslow Hotel, Sandton, Gauteng.
987The Journal of The Southern African Institute of Mining and Metallurgy VOLUME 114 DECEMBER 2014 ▲

Mine disaster and mine rescue training courses in modern academic mining engineering
freceive school credit for their participation. Currently, theteams are made up of engineering students from nearly allmajor engineering courses at CSM. The only condition ofmembership is that the students are able to meet basicphysical requirements in order to ensure the personal healthand safety of the team members and of the entire teamduring programme activities. The student team captainsdesign training plans together with the faculty programmecoordinator. The programme’s faculty advisor assists with thelogistics of the trainings and helps organize practices, practicesites, equipment, tools, and supplies. Mine rescue specialistsfrom the mining industry are often called in to help at thesepractices and to teach specific subjects ranging fromequipment maintenance to mine ventilation, first aid,communication, and map work. The teams are organized inthe same way as professional North American mine rescueteams, with each team composed of a minimum of sevenmembers: five members in the underground team and two atthe fresh air base. All team members must be trained to wearbreathing apparatus and in first aid, and many members aretrained as emergency medical technicians. Generally, two ormore members of each team are designated technicians withexpertise in equipment maintenance, while at least threemembers specialize in first aid. Teams are also trained in theoperation of an incident command centre.
Training objectives are established at the beginning ofeach academic year. Practices may include full mine rescueproblems, post-disaster exploration exercises in artificialsmoke, technical rescue training, and specialty practices. Intotal, at CSM the teams practice more than 2000 man-hoursper year. The overarching goal is that each rescue team andevery team member can demonstrate proficiency andunderstand mine rescue procedures, regulations, and minerescue rules. Training is often carried out in a two-stageapproach. In the first stage, rescue teams practice insimulated mine environments installed at a surface facility.Training objectives are to execute mine rescue tasks in asimplified mine layout on surface without the obstacles andenvironmental conditions that rescuers would face in realunderground emergencies. The surface facilities are open sothat teams can see each other and instructors can observeeach team member individually. Mine rescue contests(Figure 1) have been established in many locations and at
fvarious levels of competence as a way to train teams to thinkthrough specific situations and to prepare for realunderground exploration exercises.
In the second stage, CSM mine rescue teams train in areal underground mine environment. These undergroundexercises allow teams to develop advanced team communi-cation skills and to practice realistic mine rescue scenarios.These exercises are held at the Edgar Experimental Mine,which is operated by CSM in Idaho Springs, Colorado (Figures2 and 3). A typical example of such underground exercise isan exploration-focused practice such as a scavenger hunt in asmoke-filled section of the mine. With limited visibilitycreated by theatre smoke, the teams work under breathingapparatus to find and map a specified number of objects andreport their exact location to the fresh air base (FAB). Teamsalso record air quality and damage to ventilation controlequipment, roof falls, and other evidence of a fire orexplosion. Team members stationed at the FAB record allobservations and report them to the incident command centre(ICC). Such exercises not only test the team’s ability to moveand co-operate in smoke, but they are also a great tool topractice communication between the map man, the co-captain, and the FAB. Other types of mine rescue practices
▲
988 DECEMBER 2014 VOLUME 114 The Journal of The Southern African Institute of Mining and Metallurgy
Figure 1—Surface mine rescue contest at CSM
Figure 2—Student underground mine rescue exercises at CSM / EdgarMine
Figure 3—Underground exercises at CSM

may include high- and low-angle technical rope rescue,confined space training, and firefighting both undergroundand at surface locations. The Edgar Mine is equipped with aconfined space maze that is currently being upgraded toprovide a realistic experience for navigating complex, tightspaces in smoke and for carrying out rescue missions wherean injured person must be extracted. The CSM teams are alsogiven access to a large variety of additional firefighting andmedical rescue training courses held at the EdgarExperimental Mine for professional firefighters andemergency management teams from nearby cities and towns.CSM mine rescue teams also develop valuable skills in specialinterest areas that include first aid, mine ventilationmanagement, and rescue equipment maintenance.
Each year, all three CSM mine rescue teams compete inprofessional mine rescue contests. These contests are a greatopportunity for the student teams to test their skills againstprofessional mine rescue teams and to expand their network.The contests evaluate the competitors on their knowledge ofmine rescue rules and regulations, their ability to work as ateam, technical understanding of their equipment, and firstaid abilities. The contests are split into four sections: writtentest, field competition, technician competition, and first aidcompetition. Each section challenges a different aspect of theteam’s mine rescue knowledge and enables judges andtrainers to easily identify areas needing improvement. AllCSM teams compete in state-wide and regional mine rescuecontests, and often attain top placements in competitionswwith professional mine rescue teams.
Every other year, the CSM mine rescue programme hoststhe Biennial Intercollegiate Mine Emergency ResponseDevelopment Exercise (MERD) at the Edgar Mine in IdahoSprings, Colorado (Figure 4). This competition is for studentmine rescue teams only. At the most recent MERD in thespring of 2013, five rescue teams participated; three fromCSM, one from the University of British Columbia inVVancouver, Canada, and one from the Missouri University ofScience and Technology at Rolla, Missouri (Figure 5).
These student MERDs are a great opportunity for miningengineering students to network and learn from each other,wwhile also obtaining advice from professional mine safetyand rescue specialists. Each team is assigned a mentor, anexpert in the mine rescue field, who follows the teamthroughout the competition and provides advice, allowing thestudents to learn as much from the competition as possible.
f f fProfessional mine rescuers bring a wealth of helpfulsuggestions and advice for the student teams, teaching fromtheir real-life experiences. There are also several professionalmine rescue trainers, with years of experience in the field ofmine safety, who attend the student practices andcompetitions, mentor students, and teach classes in theirareas of specialty. These experts serve as role models for thestudents and are a great resource throughout their collegiatecareer and often into their professional lives as well.
Mine rescue and mine disaster management trainingat the Technical University Bergakademie Freiberg
Industrial backgroundDue to the ongoing restructuring and simultaneous decline ofthe number of large underground mining operations, themining industry in Central Europe is experiencing a steadyreduction of staff numbers in the remaining mines. It isfeared that the well-established, centralized mine rescueorganizations may collapse within the next decade. With this,a large number of small mines and underground operationsmay face a lack of skilled and capable mine rescue support.New strategies and organizational efforts for sustainablemine rescue operations in Germany are currently beingdiscussed. German federal mining law requires companies toprovide suitable mine rescue coverage for their undergroundoperations. Mines must either establish their own rescueteams or join and support centralized mine rescue organi-zations or rescue teams. Based on the size and number of theactive underground mining operations in Germany, fivecentral main mine rescue centres are maintained nationwide.Two of these centres are operated by the German hard coalmining industry, while the other three centres are run by theBG RCI, the employers’ workman’s compensation insuranceassociation for the minerals and chemical industries. Thesecentral mine rescue centres are responsible for the educationand certification of mine rescue team members and theongoing education and training of teams and team leaders.The rescue centres are equipped with sophisticated testingequipment for maintaining and calibrating mine rescueequipment. The centres also establish guidelines andrecommendations for the use of the personal protection andrescue equipment, as well as for the execution and coordi-nation of rescue operations, and set the standards and writecontent for mine rescue training courses.
Mine disaster and mine rescue training courses in modern academic mining engineering
989The Journal of The Southern African Institute of Mining and Metallurgy VOLUME 114 DECEMBER 2014 ▲
Figure 4—Student Mine Rescue Teams at MERD 2013 Figure 5—All student teams at the second MERD at Edgar Mine, 2013

Mine disaster and mine rescue training courses in modern academic mining engineering
fIn Germany, every active member of a mine rescue teammust be a minimum of 18 years old and should not be olderthan 40. All members are volunteers, and individuals mayserve as a team member, a team captain, or a chief. Allmembers must be fully cross-trained, experienced minerswwho are familiar with a variety of situations underground. Allrescue team members must have medical clearance underGerman medical standard G26/3, a specially designed,extensive medical examination under physical stress forpeople working under breathing apparatus. This clearancemust be obtained before a rescue team member may bepermitted to wear a breathing apparatus in a mine rescueoperation. This thorough medical examination must bepassed every second year and must also be renewed afterrecovering from illness or accident. The content and durationof the training for rescue team members, team captains,chiefs of rescue teams, and equipment attendants (benchtechnicians) are prescribed in the guidelines of the centralmine rescue stations. These guidelines also govern educationand training for mine rescue teams, organization andpreparation of rescue operations, the minimum number ofrescue teams that must be present on site before a rescueoperation can commence, and a list of equipment required inorder to start the rescue operation. An apprentice maybecome a mine rescue team member after attending a one-wweek basic training course and passing additional theoreticaland practical examinations.
Due to the ongoing restructuring in the mining industry,some changes in the basic structures of mine rescueoperations must be implemented. Generally, a minimum ofthree fully operational mine rescue teams must be on site tostart a mine rescue operation in a non-coal mine, while tenteams must be present at a hard coal mine. Under the newstructure, smaller, three-man teams maybe formed undercertain circumstances at small mines to enter the mine forlife-saving operations only, with a second team on standby.The new regulations, together with other restructuringelements, adapted laws, as well as modified operatingschemes have been presented to the public and are expectedto be implemented during the year 2014. The miningengineering department of the Technische UniversitätBergakademie Freiberg (TU BAF) has been part of therestructuring programme for several years and has hosted anumber of scientific conferences and workshops on thereorganization and restructuring of the mine rescue schemein central Germany.
MMine rescue and disaster management courses atTechnische Universität Bergakademie FreibergOccupational health and safety is a core competence formining engineering graduates. This led to the incorporationof related course content into the mining engineeringcurriculum almost a century ago. Today, a specific coursecovers the subject not only for mining engineering students,but also for all other raw-material majors. For severaldecades, mining engineering students have been trained in asupplementary course in mine rescue provided by the centralmine rescue station of BG RCI in Leipzig (Figure 6). Duringthis block course, students are introduced to the structure,tasks, and responsibilities of mine rescue as well as theorganization of a mine rescue operation.
The course ends with a ’hot’ emergency practice underbreathing apparatus in the BG RCI exercise and trainingcentre, which resembles the confined spaces and obstacles ofan underground mine (Figure 7). Like every other minerescue team member, the students also must obtain themedical certificate G26/3 before being admitted to this course.The course was formerly a mandatory part of miningengineering education, but owing to the constraints of theEuropean harmonization in engineering education, the legalsituation now is that it can be offered on a voluntary basisonly. Nevertheless, the vast majority of students participatein the training.
During a mine emergency, mining engineers often play aleading role in the organization and the technicalmanagement of the disaster instead of going undergroundwith the mine rescue teams. To prepare engineering studentsfor this role, a new course on incident control and
▲
990 DECEMBER 2014 VOLUME 114 The Journal of The Southern African Institute of Mining and Metallurgy
Figure 7—Confined spaces training at BGRCI central mine rescuestation
Figure 6—TU BAF mining students at BG RCI central mine rescuestation

management was added at TU BAF in 2012. This course istaught primarily by guest lecturers, who are also working asexpert consultants in mine emergency management for theGerman mining industry. The course content includesincident command structures (adapted from militarycommand structures – Figure 8), incident management, useof control and software tools, communication, organization ofincident control, as well as public relations in cases withserious and fatal injuries. Students perform several practicalexercises where they assume different roles managing anemergency. The role-playing exercises are designed followingreal incidents and include the necessary internal and externalcommunication as well as public relations management,including press releases and press conferences. This course ismandatory for all mining engineering majors.
In 2013, staff of the mining engineering department ofTU BAF had the chance to participate in the second MERD atthe Colorado School of Mines as external observers.Following this exercise and close interaction and discussionswwith their American colleagues, a similar student mine rescueteam structure has been implemented at TU BAF, making useof the ‘FLB Reiche Zeche’ research and experimental mine oncampus (Figure 9). A member of the CSM student minerescue team was invited to Germany and worked on animplementation project at TU BAF in the summer of 2013.The Freiberg student mine rescue team will be trained like allother professional mine rescue teams in the region and willalso be outfitted with the standardized breathing andtechnical rescue equipment. The goal is to not only operatethis mine rescue team for the training of the students, butalso to support the existing mine rescue structure of the FLB
fexperimental mine with additional forces. An extensivetraining space at the FLB is being modified to be used as anunderground mine rescue training centre not only for minerescuers, but also for underground and confined spacetraining for firefighters, the federal agency for technical relief(THW), and other special rescue teams. Currently, the legalrequirements for the large scale integration of a student minerescue team into the safety and rescue structure of the mineas well as into the overall disaster control structures of theregion are being discussed with the local mining authorities.
Mine disaster and mine rescue training courses in modern academic mining engineering
The Journal of The Southern African Institute of Mining and Metallurgy VOLUME 114 DECEMBER 2014 991 ▲
Figure 8—Incident command structure and set-up in Germany
Figure 9—Mine rescue exercise at FLB Reiche Zeche research andexperimental mine
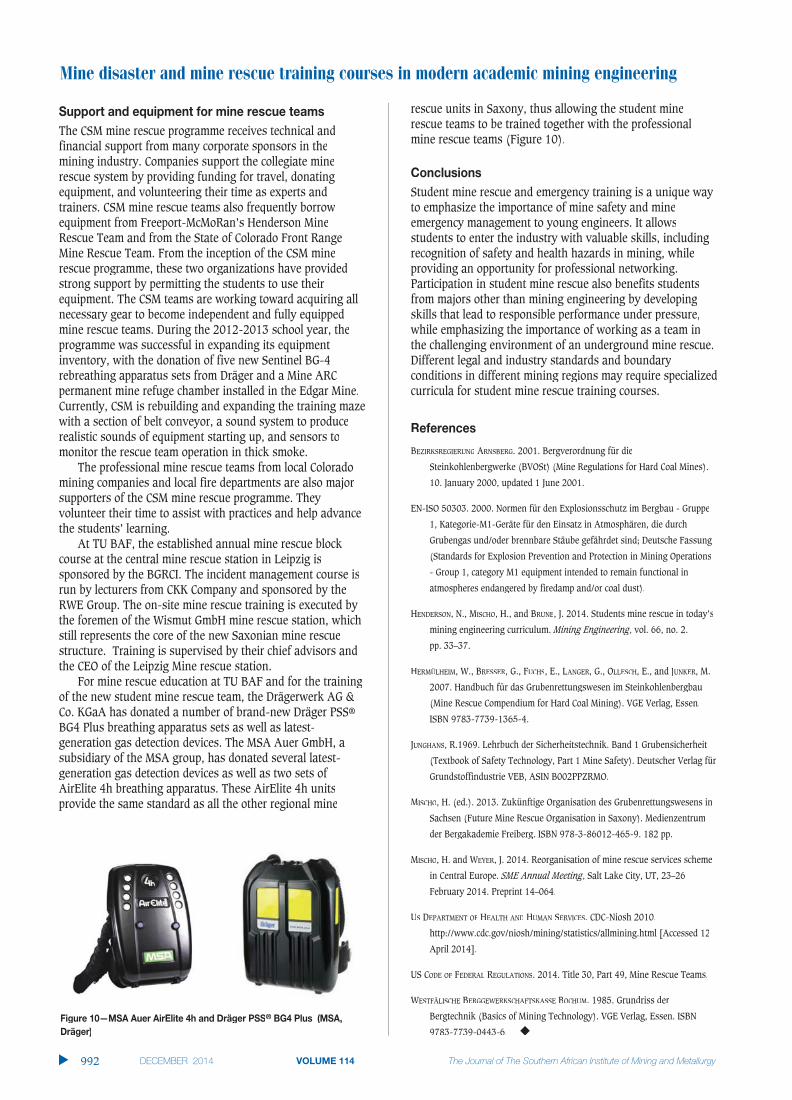
Mine disaster and mine rescue training courses in modern academic mining engineering
Support and equipment for mine rescue teamsThe CSM mine rescue programme receives technical andfinancial support from many corporate sponsors in themining industry. Companies support the collegiate minerescue system by providing funding for travel, donatingequipment, and volunteering their time as experts andtrainers. CSM mine rescue teams also frequently borrowequipment from Freeport-McMoRan’s Henderson MineRescue Team and from the State of Colorado Front RangeMine Rescue Team. From the inception of the CSM minerescue programme, these two organizations have providedstrong support by permitting the students to use theirequipment. The CSM teams are working toward acquiring allnecessary gear to become independent and fully equippedmine rescue teams. During the 2012-2013 school year, theprogramme was successful in expanding its equipmentinventory, with the donation of five new Sentinel BG-4rebreathing apparatus sets from Dräger and a Mine ARCpermanent mine refuge chamber installed in the Edgar Mine.Currently, CSM is rebuilding and expanding the training mazewwith a section of belt conveyor, a sound system to producerealistic sounds of equipment starting up, and sensors tomonitor the rescue team operation in thick smoke.
The professional mine rescue teams from local Coloradomining companies and local fire departments are also majorsupporters of the CSM mine rescue programme. Theyvvolunteer their time to assist with practices and help advancethe students’ learning.
At TU BAF, the established annual mine rescue blockcourse at the central mine rescue station in Leipzig issponsored by the BGRCI. The incident management course isrun by lecturers from CKK Company and sponsored by theRWE Group. The on-site mine rescue training is executed bythe foremen of the Wismut GmbH mine rescue station, whichstill represents the core of the new Saxonian mine rescuestructure. Training is supervised by their chief advisors andthe CEO of the Leipzig Mine rescue station.
For mine rescue education at TU BAF and for the trainingof the new student mine rescue team, the Drägerwerk AG &Co. KGaA has donated a number of brand-new Dräger PSS®
BG4 Plus breathing apparatus sets as well as latest-generation gas detection devices. The MSA Auer GmbH, asubsidiary of the MSA group, has donated several latest-generation gas detection devices as well as two sets ofAirElite 4h breathing apparatus. These AirElite 4h unitsprovide the same standard as all the other regional mine
rescue units in Saxony, thus allowing the student minerescue teams to be trained together with the professionalmine rescue teams (Figure 10).
ConclusionsStudent mine rescue and emergency training is a unique wayto emphasize the importance of mine safety and mineemergency management to young engineers. It allowsstudents to enter the industry with valuable skills, includingrecognition of safety and health hazards in mining, whileproviding an opportunity for professional networking.Participation in student mine rescue also benefits studentsfrom majors other than mining engineering by developingskills that lead to responsible performance under pressure,while emphasizing the importance of working as a team inthe challenging environment of an underground mine rescue.Different legal and industry standards and boundaryconditions in different mining regions may require specializedcurricula for student mine rescue training courses.
References
BEZIRKSREGIERUNG ARNSBERG. 2001. Bergverordnung für die
Steinkohlenbergwerke (BVOSt) (Mine Regulations for Hard Coal Mines).
10. January 2000, updated 1 June 2001.
EN-ISO 50303. 2000. Normen für den Explosionsschutz im Bergbau - Gruppe
1, Kategorie-M1-Geräte für den Einsatz in Atmosphären, die durch
Grubengas und/oder brennbare Stäube gefährdet sind; Deutsche Fassung
(Standards for Explosion Prevention and Protection in Mining Operations
- Group 1, category M1 equipment intended to remain functional in
atmospheres endangered by firedamp and/or coal dust).
HENDERSON, N., MISCHO, H., and BRUNE, J. 2014. Students mine rescue in today’s
mining engineering curriculum. Mining Engineering, vol. 66, no. 2.gg
pp. 33–37.
HERMÜLHEIM, W., BRESSER, G., FUCHS, E., LANGER, G., OLLESCH, E., and JUNKER, M.
2007. Handbuch für das Grubenrettungswesen im Steinkohlenbergbau
(Mine Rescue Compendium for Hard Coal Mining). VGE Verlag, Essen.
ISBN 9783-7739-1365-4.
JUNGHANS, R.1969. Lehrbuch der Sicherheitstechnik. Band 1 Grubensicherheit
(Textbook of Safety Technology, Part 1 Mine Safety). Deutscher Verlag für
Grundstoffindustrie VEB, ASIN B002PPZRMO.
MISCHO, H. (ed.). 2013. Zukünftige Organisation des Grubenrettungswesens in
Sachsen (Future Mine Rescue Organisation in Saxony). Medienzentrum
der Bergakademie Freiberg. ISBN 978-3-86012-465-9. 182 pp.
MISCHO, H. and WEYER, J. 2014. Reorganisation of mine rescue services scheme
in Central Europe. SME Annual Meeting, Salt Lake City, UT, 23–26gg
February 2014. Preprint 14–064.
US DEPARTMENT OF HEALTH AND HUMAN SERVICES. CDC-Niosh 2010.
http://www.cdc.gov/niosh/mining/statistics/allmining.html [Accessed 12
April 2014].
US CODE OF FEDERAL REGULATIONSRR . 2014. Title 30, Part 49, Mine Rescue Teams.
WESTFÄLISCHE BERGGEWERKSCHAFTSKASSE BOCHUM. 1985. Grundriss der
Bergtechnik (Basics of Mining Technology). VGE Verlag, Essen. ISBN
9783-7739-0443-6. ◆
▲
992 DECEMBER 2014 VOLUME 114 The Journal of The Southern African Institute of Mining and Metallurgy
Figure 10—MSA Auer AirElite 4h and Dräger PSS® BG4 Plus (MSA,Dräger)

IntroductionThis paper examines geological modelling fromthe perspective of a lecturer from the School ofMining Engineering with a background inResource Geology as well as Mineral ResourceManagement. The questions that are raisedlook primarily at how geological modelling haschanged recently and whether the newmethods are acceptable for creating resourcestatements that comply with the South AfricanCode for Reporting of Exploration Results,Mineral Resources and Mineral Reserves
(SAMREC Code) or other internationalreporting codes.
The ease with which a student can betaught to do geological modelling isconsidered, as well as how the models that arecreated using implicit geological modellingsoftware compare to those created intraditional ways. This is to answer the broadquestion whether the new modelling methodsare just ‘black boxes’ or if they should beconsidered to be the best practice.
The paper then continues to look at minedesigns and their production schedule-baseddiscounted cash flows with the resultant netpresent value (NPV) and internal rate ofreturns (IRR). These two figures are often thenumbers on which the investment decision isbased, or by which projects are ranked intimes of limited capital. This portion of thestudy was also conducted in the academicenvironment but was based on a real-worldmine. The question was to consider howimportant the geological model is in the minedesign, because so many other factors can alsoinfluence the final investment decision.
The School of Mining Engineering, at theUniversity of the Witwatersrand inJohannesburg, South Africa is recognized asone of the top mining engineering schools anddepartments throughout the world. Miningengineers play a key role in the planning andexploitation of mineral resources. The School’sprogramme is designed to provide the graduatewith the engineering expertise that he or shewill require as a mining engineer. The 4-yearBSc Mining Engineering programme is theschool’s flagship programme and includes
New systems for geological modelling–blackbox or best practice?by C. Birch*
SynopsisA ‘geologically constrained’ orebody model has long been hailed as vital fora Mineral Resource statement that is compliant with the South AfricanCode for Reporting of Exploration Results, Mineral Resources and MineralReserves (SAMREC Code). In this paper, the requirements for geologicalmodelling as contained in the outline for the SAMREC Code are considered,and whether the new modelling software available on the market is a‘black box’ or is better for modelling than traditional methods of wireframecreation.
Implicit geological modelling is a technique that uses a radial basisfunction to establish and update geological models relatively quickly andefficiently from borehole data, outcrop data, manually interpreted verticalor horizontal sections, and structural data. Assays and any coded drill-holedata, such as lithology and alteration, can be interpolated.
Leapfrog Geo software is an example of this new approach togeological modelling. A case study of a short training course in geologicalmodelling for non-geologists at the University of Witwatersrand, as part ofthe Higher Certificate in Mineral Resource Management, is presented. Thebenefits of this type of geological modelling software are considered forthis type of assignment as well as for mining industry applications.
The use of geological models in mine planning is reviewed and a casestudy is presented comparing the variations in mine plan design andfinancial output of 13 final-year Mine Design projects from the Universityof the Witwatersrand School of Mining Engineering. These designs were allbased on the same geological model created in the traditional way, and yetthe resultant mine designs were significantly different, with very differentresulting financial outlooks for the project. This raises questions as to howsignificant a very detailed model in the pre-feasibility and feasibilityphases of projects really is, considering the huge costs involved ingathering the required data to build a SAMREC-compliant geological model.
Keywordsimplicit geological modelling, mine design, software.
* School of Mining Engineering, University of theWitwatersrand.
© The Southern African Institute of Mining andMetallurgy, 2014. ISSN 2225-6253. This paperwas first presented at, A Southern African SilverAnniversary, 2014 SOMP Annual Meeting, 26–30June 2014, The Maslow Hotel, Sandton, Gauteng.
993The Journal of The Southern African Institute of Mining and Metallurgy VOLUME 114 DECEMBER 2014 ▲

New systems for geological modelling–black box or best practice?
findividual and group project work. The final project is a minedesign project completed during the final months of thestudents’ undergraduate year (University of theWWitwatersrand, 2013). The School also has postgraduateprogrammes (MSc and PhD), as well as certificateprogrammes in Mine Planning and Mineral ResourceManagement for people currently in the mining industry. Thisstudy has been conducted considering students in both theirfinal year of the BSc Mining Engineering programme as wellas students on the Mineral Resource Management Certificateprogramme.
Geological modelling
Geological modelling is a computerized representation oflithological, structural, geochemical, geophysical, anddiamond drill-hole data on and below the Earth’s surface(Fallara, et al., 2006).
Geological models are based on limited data for sub-surface interpretation. They simplify the complexity found innature. Traditionally, accuracy of the resultant modelsdepended on the experience and training of the modeller. Inmining, geological models are used to predict the presence ofeconomic quantities of minerals, and then quantify theamount of material available. Models are nowadays afundamental part of mine planning. Prediction has an extrap-olative rather than interpolative character, and thus involvesrisk and leads to decision-making (Hodkiewicz, 2013).
Resource geologists traditionally favoured the use ofsectionally hand-digitized wireframe models for resourceestimation (e.g. those created with Datamine, Gemcom, orggother mining software packages). Automated methods weregenerally not considered appropriate by those traditionallydoing modelling for estimation purposes. They were lookedon as ‘black boxes’ that allowed the computer to do theinterpretation, rather than the geologist. Advances in thesoftware available for the automatic creation of geologicalmodels (implicit geological modelling) have led to thechallenging of the traditional methods. This paper considersthe advantages of these new methods, and asks if they arenot actually the best practice.
The modelling challengeTraditionally, 3D models are built from isolated boreholeintersections as well as other sources of information(sections, surface mapping etc.). Interpretation is required tofill in the gaps between the areas of certainty. The modelsoften simplify real-world complexity due to the lack ofinformation. Owing to the degree of interpretation required,the model builder’s skill, training, as well as personality allaffect the resultant model, making verification of the modelvvery difficult. Auditing the results presented in a resourcestatement could thus be exceedingly difficult as the modelcan never be replicated exactly. The production of thesemodels is very time-consuming, as well as costly, consideringthe labour costs of a skilled geologist required for this task.
The challenges in geological modelling are thus to reducethe time it takes to build these models, to represent real-wworld complexity, and have models that anyone can replicate
f ffor auditing purposes. As new information becomesavailable, the models should be easily updated to reflect thenew data accurately.
The benefits to the individual scientist of improving themethod of building geological models are that the hours spentdoing the boring wireframing are reduced. Due to therepetitive nature of this task it is often left to junior staff.There is then more time to verify the models and interpretspecific aspects which the model has not representedadequately. The throughput of models increases and thusthere is more job satisfaction for staff, more publications, andincreased promotional opportunities. Updating models withnew information can be done as soon as it becomes available,as the model can be linked to the database and thus automat-ically updated as the database is amended.
The benefits to the ‘client’ organizations are that themodels are more consistent. There is less variation betweentheir own in-house models and those created by independentconsultants. This will allow models to be easily audited forinconsistencies and errors and thus give credibility to theresource statements published. The models are createdefficiently and thus are easily updated as the new data isloaded without requiring expensive and time-consumingediting of the current model. This will aid decision-making asall the data available is utilized and the model uses the latestdata.
Traditional wireframingTraditional models are created using wireframes based ongeological logging of boreholes. This type of modelling istime-consuming and a good understanding of the geology isneeded to make it effective. To create this type of model, theorebody is sliced into sections and the orebody intersectionsof the boreholes are linked by strings (Figure 1).
The method is time-consuming, and very repetitive, andrelies on a fair amount of interpretation by the modeller whilelinking the strings. After the entire orebody has beeninterpreted, the strings are linked together to form thewireframes. This process must then be carefully checked toensure there are no cross-over strings or openings as this willprevent the modelling software (e.g. Datamine) from fillingggthe wireframe volumes with blocks that are needed for theevaluation, as shown in Figure 2.
▲
994 DECEMBER 2014 VOLUME 114 The Journal of The Southern African Institute of Mining and Metallurgy
Figure 1—Section showing drill-holes with strings linking the orebodies(hand wireframing) (Birch, 2011)

If the initial borehole logging was done by inexperiencedgeologists who interpret the geology incorrectly, the computermodelling and orebody evaluation will not be effective.
IImplicit geological modelling
Implicit geological modelling is a technique that uses a radialbasis function to establish and update geological modelsrelatively quickly and efficiently from borehole data, outcropdata, manually interpreted vertical or horizontal sections, andstructural data.
The radial basis function allows scattered 3D data pointsto be described by a single mathematical function. Modelscan be isotropic, meaning without any trends or directionalbias, or anisotropic, based on planar, linear, or more complexstructural trends. Assays and any coded drill-hole data, suchas lithology and alteration, can be interpolated (Hodkiewicz,2013).
A commonly used software package for implicit geologicalmodelling is Leapfrog Geo (Leapfrog, 2010).
BBenefits of implicit geological modelling overtraditional wireframingAA comparison of implicit geological modelling and thetraditional method of hand digitization is shown in Table I.
fThis simple comparison of the two methods illustratesthat there is no basis to the claim that traditional digitizationis superior to implicit geological modelling for the generationof geological models. Table II shows that implicit geologicalmodelling methods are in fact superior to hand digitization.
In modelling of true 3D objects, such as orebodies,interpolation methods in implicit geological modelling do notrely on sectional information to produce a 3D model. This isone of the major weaknesses of traditional modelling wherethe 3D model is built up from a series of sectional interpre-tations (Cowan, 2010).
International reporting codesInvestors have become far more circumspect in investing inmineral projects following scandals like Bre-X (Cawood,2004). This has led to the introduction of various reportingcodes, which are essentially aimed at protecting investors andholding professionals responsible for the figures that theyrelease in the public domain. Compliance with these codes isconsidered a prerequisite for public listing on variousinternational stock markets like Toronto (TSX), Australia(ASX), and the Johannesburg Securities Exchange (JSE).Codes, as opposed to laws, allow for professional judgment,and a good guide as to what is acceptable is doing what areasonable person would do. To ensure compliance with thisprinciple, mineral resource practitioners try to follow best-practice principles as far as practically possible, because thismakes it easier to justify the decisions to professional peers ifcalled upon to do so.
There are several classification schemes worldwide,including:
➤ Canadian CIM classification (NI 43-101)➤ Australasian Joint Ore Reserves Committee Code (JORC
Code)➤ South African Code for the Reporting of Mineral
Resources and Mineral Reserves (SAMREC Code).
In this paper, the SAMREC Code has been used forillustration purposes, but the other codes share the samedefinitions and broadly follow the same requirements forcompliance. Figure 3 shows the relationship between mineraloccurrences, Inferred, Indicated, and Measured resources, aswell as the modifying factors required to convert Resourcesinto Reserves.
New systems for geological modelling–black box or best practice?
995The Journal of The Southern African Institute of Mining and Metallurgy VOLUME 114 DECEMBER 2014 ▲
Figure 2—Datamine wireframes manually created from boreholeintersections (Birch, 2011)
Table I
Traditional wireframing compared with implicit geological modelling
Aspect Hand wireframing Implicit modelling
DH contact honouring Yes (manual) Yes (automated)
Minimum curvature fit between points No. Only straight lines. Curvatures are manually digitized Yes
Modelling speed Slow Very fast
True 3D modelling, i.e. drill-hole sectional No. Limited to sectional digitization Yes. Not limited to sectional interpretation
fences are not needed
Models can be replicated No. Manual digitization cannot be replicated Yes, given the same variables
Can multiple models be generated from Yes, but not very practical as it is very time-consuming Yes
the same data?
No. Manual digitization cannot be replicated
Yes, but not very practical as it is very time-consuming

New systems for geological modelling–black box or best practice?
Compliance with the SAMREC Code regarding thedeclaration of resources and reserves requires various aspectsto be recorded and documented in a series of tables. Figure 4is an extract from SAMREC Code Table 4, which deals withinterpretation/modelling and thus is relevant for thisdiscussion on geological modelling techniques.
Before implicit geological modelling can be accepted as avviable technique and be considered compliant with the
SAMREC Code, the issue whether an automated modellingmethod can be considered to comply with the provisions laidout for modelling techniques as described in the SAMRECCode needs to be determined.
Table 4 in the SAMREC Code does not prescribe whatmodelling technique must be used. The Code does not specifywhat specific methods should be used for resource estimationprocess, provided that the geological assumptions are clearlystated and that these assumptions are reasonably consistentwith the data. It is therefore inappropriate to suggest that acertain method (e.g. sectional digitization) is more suitablethan other methods of modelling (Cowan, 2010).
Modelling summaryIt is felt that the benefits of implicit geological modellinginclude faster modelling results, allowing for quickerresponse to new information becoming available. This willallow the exploration team to change their explorationstrategy faster and focus exploration efforts on the areas withthe highest possible returns. Furthermore, compliance withSAMREC has been demonstrated using the implicit geologicalmodelling method. Focused exploration will have an upsidein the tonnage available for mining, which will benefit theclient when it comes to finding investors to progress theproject.
Leapfrog Geo (a well-known example of implicitgeological modelling software) is, however, considered withsuspicion by traditional resource geologists, who still feelmore comfortable with creating wireframes manually. Amethod that models the orebody automatically is perceived as
▲
996 DECEMBER 2014 VOLUME 114 The Journal of The Southern African Institute of Mining and Metallurgy
Figure 4—Table 4 from the Samrec Code regarding interpretation/modelling (SAMREC, 2009)
Figure 3—Relationship between Exploration Results, MineralResources, and Mineral Reserves (SAMREC, 2009)
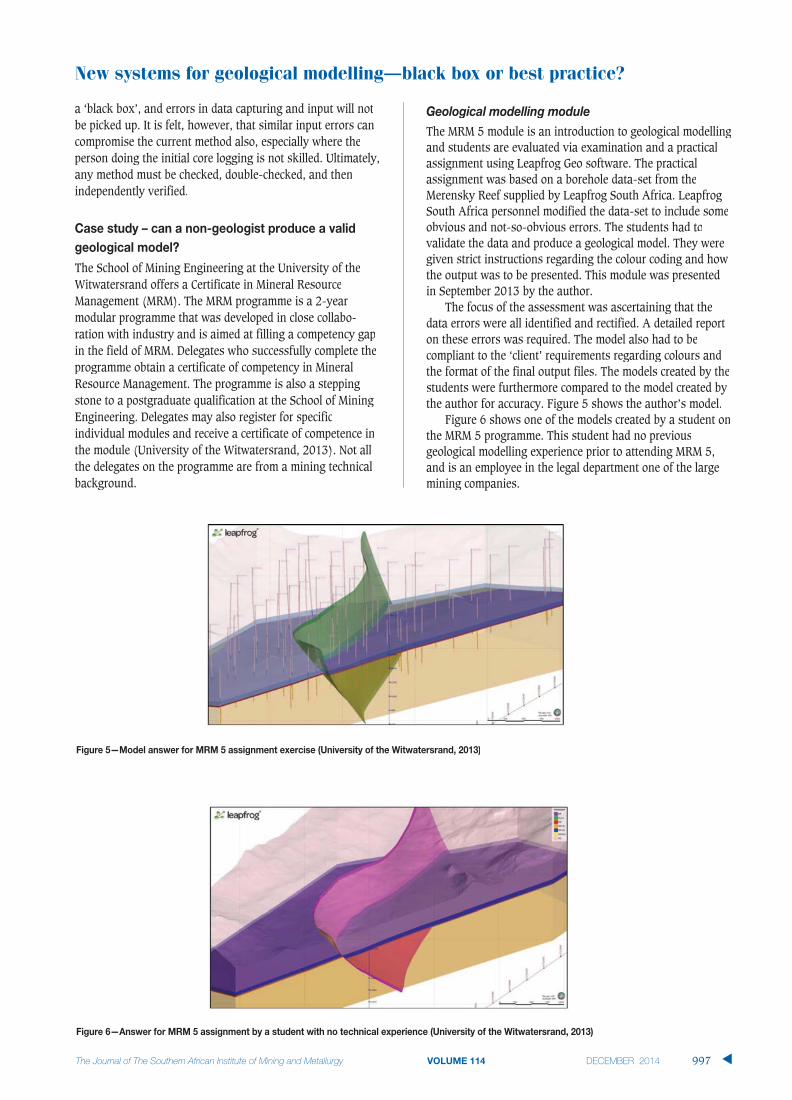
a ‘black box’, and errors in data capturing and input will notbe picked up. It is felt, however, that similar input errors cancompromise the current method also, especially where theperson doing the initial core logging is not skilled. Ultimately,any method must be checked, double-checked, and thenindependently verified.
Case study – can a non-geologist produce a validgeological model?
The School of Mining Engineering at the University of theWWitwatersrand offers a Certificate in Mineral ResourceManagement (MRM). The MRM programme is a 2-yearmodular programme that was developed in close collabo-ration with industry and is aimed at filling a competency gapin the field of MRM. Delegates who successfully complete theprogramme obtain a certificate of competency in MineralResource Management. The programme is also a steppingstone to a postgraduate qualification at the School of MiningEngineering. Delegates may also register for specificindividual modules and receive a certificate of competence inthe module (University of the Witwatersrand, 2013). Not allthe delegates on the programme are from a mining technicalbackground.
Geological modelling moduleThe MRM 5 module is an introduction to geological modellingand students are evaluated via examination and a practicalassignment using Leapfrog Geo software. The practicalassignment was based on a borehole data-set from theMerensky Reef supplied by Leapfrog South Africa. LeapfrogSouth Africa personnel modified the data-set to include someobvious and not-so-obvious errors. The students had tovalidate the data and produce a geological model. They weregiven strict instructions regarding the colour coding and howthe output was to be presented. This module was presentedin September 2013 by the author.
The focus of the assessment was ascertaining that thedata errors were all identified and rectified. A detailed reporton these errors was required. The model also had to becompliant to the ‘client’ requirements regarding colours andthe format of the final output files. The models created by thestudents were furthermore compared to the model created bythe author for accuracy. Figure 5 shows the author’s model.
Figure 6 shows one of the models created by a student onthe MRM 5 programme. This student had no previousgeological modelling experience prior to attending MRM 5,and is an employee in the legal department one of the largemining companies.
New systems for geological modelling–black box or best practice?
The Journal of The Southern African Institute of Mining and Metallurgy VOLUME 114 DECEMBER 2014 997 ▲
Figure 6—Answer for MRM 5 assignment by a student with no technical experience (University of the Witwatersrand, 2013)
Figure 5—Model answer for MRM 5 assignment exercise (University of the Witwatersrand, 2013)

New systems for geological modelling–black box or best practice?
As can be observed, all the major data errors wereidentified and rectified and the resultant model is visuallysimilar to the model created by the module presenter. Thistype of deposit is traditionally difficult to model usingtraditional wireframe methods due to the very thin nature ofthe economic horizon. Leapfrog Geo allows the modeller toidentify the age relationships between the various lithologies,and then creates the stratigraphic sequence automaticallyfrom the borehole intersections. The fault is digitized fromthe surface mapping and when activated, the displacement isautomatically determined.
For an experienced modeller, this assignment could becompleted in a very short period of time. The processfollowed for an entire deposit, would be the same as for thisassignment, but just on a larger scale. As new data is loadedinto the database, the model would be updated automatically.The most important component of the modelling process isdata verification and ensuring the database is accurate. Mosterrors are easily identified in the model and thus the ability toquickly create a model goes a long way towards ensuring thatthe final model is accurate.
How important is the geological model in the minedesign?
The international reporting codes require extensive documen-tation and compliance regarding the quality of the sampledata and how it is collected, stored, and processed. This leadsinto the modelling and evaluation techniques used until theoutput of the classified resource statement is obtained. TheSAMREC Code in South Africa is the guide to what is anacceptable level of detail for this statement (SAMREC, 2009).For the conversion of Mineral Resources to Mineral Reserves,the modifying factors must be stated and justified. Theseinclude the following:
➤ Mining methods➤ Minimum mining dimensions➤ Mining dilution mining method➤ Mine design criteria➤ Infrastructure➤ Capacities➤ Production schedule➤ Mining efficiencies➤ Grade control➤ Geotechnical and hydrological considerations➤ Closure plans➤ Personnel requirements.
The whole scheduling aspect of a mine design is critical inconverting the Mineral Resource into a monetary value due tothe considerations of the time value of money (and resultantnet present value, NPV, and internal rate of return, IRR).
This paper considers how assumptions made during themine design and scheduling process can affect the financialoutlook of a project at the pre-feasibility study (PFS) stage,using the School of Mining Engineering Final Mine DesignProject as a case study. Thirteen groups of students weregiven the same geological model as a starting point for theirmine designs. This model can be considered a perfect
f f frepresentation of the orebody for the purposes of this project,as they were not required to recreate or verify this model aspart of their project. In reality, when a group of consultantsdo pre-feasibility studies on an orebody, each consultantwould create their own geological model, which adds a wholelayer of variation when comparing the results. The minedesign exercise presents a fairly unique opportunity tocompare 13 interpretations of the same geological modeltaken to PFS level. In the corporate world, due to the costsinvolved, a company would never commission 13 differentmine designs.
Final Mine Design ProjectSeventy final-year students were split into 13 groups with 5or 6 members in each group. According to the brief given atthe start of the project, the students had to carry out a minedesign exercise to the level of a PFS based on the mineraldeposit block model supplied to them. They were to utilize theknowledge gained over their previous coursework, as well asexperience gained during vacation work, to complete theproject. They then had to make a substantiated recommen-dation regarding the viability of mining the deposit. Thefinancial aspects of the project were thus critical, as well asthe technical aspects. For 2013, the final mine design projectwas the Lily Gold Mine, close to Barberton in the eastern partof South Africa.
The students were supplied with a high-quality geologicalblock model of the deposit created by the mine geologicalteam (Figure 7). For purposes of this study, this block modelcan be considered to be perfect, as they all were given thesame model and accepted it as a true representation of thedeposit.
Lily Gold Mine
The Lily Mine began as an open pit operation in 2000. Theopen pit closed down in 2008 after producing more than 100000 ounces of gold. The orebody extends for at least 2000 malong strike and has been drilled to a depth of approximately700 m. A detailed geological model was created by the mineand was presented to the students for their mine plan(Figure 7). The current underground mine design has beenconstrained due to available capital, and the students wereexpected to take this into account and thus come up withdesigns significantly different due to the removal of thisconstraint.
Mine Design report
The students were instructed to start their designs at thestage where the mine began underground operations and theplant had a maximum capacity of 37 000 t/month. If theywished to increase the plant capacity, they would have tobudget for this increase in their mine design. The studentswere given the geological model as generated prior to theunderground development; based on the sampling in the pitas well as the surface diamond drill-holes (Figure 7). Thefinal report presented to the School of Mining was to cover allthe aspects of a mine design and was expected to be at a levelof detail that would be acceptable as a PFS. Most of the staff
▲
998 DECEMBER 2014 VOLUME 114 The Journal of The Southern African Institute of Mining and Metallurgy

fin the School were allocated specific chapters in the reportand mentored the students as to what was expected tocomplete their chapters. They then graded those chapters aspart of the final mark. The students also presented their finaldesigns to a panel of staff members, as well as externalexaminers from industry. In 2013, the external examinerswwere staff from Lily Gold Mine.
MMine financial valuation
For this study, the variations between the mine designs andtheir impact on the financial valuation chapter of the reportwwere considered. For this chapter, the students had todetermine the construction/establishment times and costs, aswwell as operating costs for the life-of-mine. They had todetermine appropriate levels and methods of beneficiationand apply the correct royalty and income tax rates. They thenhad to do a full cost-benefit assessment of the project,including a discounted cash flow (DCF) analysis and calculatethe resultant net present value (NPV) and internal rate ofreturn (IRR). Based on these figures, they had to makeappropriate recommendations regarding investment in theproject.
Results
The final financial results from the groups were verydifferent. Only two of the groups chose to increase theirplanned tonnages from the mine above the current plant’smaximum of 37 000 t/month. With these two groups, thecapital costs for construction of the mine varied primarilywwith the plant costs and building extra mining capacity. Thelower resultant mining costs allowed for lower cut-off gradesand higher extraction rates. Some of the groups were veryconservative as to how much of the measured reserve they
f fputt into their life-of-mine plan, and all the groups restrictedtheir designs to only the Measured portion of the MineralResource statement.
The mining profiles (production ramp-up and grade) werevery different between the groups. The capital spendingscheduling was also very different. The relationship betweenhigher initial capital spend and a lower mining cost would beexpected, but this is not always apparent when looking at therelationship between capital and working costs in thesedesigns.
The tons mined, life-of-mine, capital costs, working costs,NPV, and IRR are shown in Table II.
The life-of-mine tonnage profiles vary from 1.7 Mt to 6.7Mt. The life-of-mine varies from 6 to 17 years. The capitalcosts vary from R286 million to R1 045 million. The workingcosts vary from R455 to R900 per ton. The resultant NPVsrange from R45 million to R581 million, and the IRR variesfrom 20% to 61%.
There is thus a three-fold increase from the lowest IRR tothe highest, and an order of magnitude difference betweenthe lowest and highest NPV.
Investors in mining projects often use the NPV and IRR astheir primary decision-making tools. Based on the results ofthe exercise, potential investors would either reject thisproject as being too marginal (IRR of 20%) considering thecurrent financial risks associated with mining gold in SouthAfrica, or be very enthusiastic about the project and willing toinvest (IRR greater than about 40%).
It must be noted that all the groups made errors in theirprojects, but they all produced designs of sufficiently highquality to pass the course. For the chapter on financialvaluation, the lowest mark given was 50% and the highestwas 90%. This chapter counted for 8% of the final MineDesign report mark.
New systems for geological modelling–black box or best practice?
The Journal of The Southern African Institute of Mining and Metallurgy VOLUME 114 DECEMBER 2014 999 ▲
Figure 7—Lily gold mine geological model (Vantage Goldfields, 2013)

New systems for geological modelling–black box or best practice?
Conclusions
New software is speeding up the geological modelling processand giving more consistent results. This allows more time tofocus on interpretation and allows for faster revisions to themodel. The learning curve is far quicker than for traditionalmodelling techniques and the skills set required to producesuccessful models is greatly reduced. This paper presents acase study demonstrating that a student with no previousgeological experience can produce a simple model from aborehole data-set that broadly matches that produced by thelecturer, identifying a range of errors and correcting them. Ithas been shown that the SAMREC Code does not dictate themethod that has to be used to create the model, being morefocused on the correct recording and validation of the dataused in the estimation of the mineral resource. It is thus feltthat implicit geological modelling software like Leapfrog Geois superior to traditional methods and should be consideredbest practice for geological modelling.
The SAMREC Code is very limited when it comes tospecifying how the mine design is created and scheduled,wwhich can have a major impact in the resultant NPV and IRR.All that the Code requires is that the modifying factors aredocumented and justified. Even a single geological model isopen to huge variations in, and interpretations of, the minedesign/scheduling phase, which can make or break theproject’s success. It has been shown that groups of studentmining engineers, using the same geological model, canproduce mine designs that result in significant variations inthe financial outlook of the project.
Investors are often not experienced in mine design andscheduling. Even if they are satisfied with the capital andwworking cost stated in the design, the differences in when thecapital is spent and the revenue obtained from the mining of
fthe orebody are hard to verify. They are thus totally relianton the experience of the mining engineer to optimize thedesign to ensure the highest return on the investment.
References
BIRCH, C. 2011. Mineral Resource Throughput Management Analysis of Otjikoto
Gold Project, Situated near Otavi, Namibia. Masters dissertation,
University of the Free State, Bloemfontein.
CAWOOD, F.T. 2004. Towards a mineral property valuation. Journal of the South
African Institute of Mining and Metallurg, vol. 104, no. 1. pp. 35-43.gg
COWAN, E.J. 2010. Director: Prestologic. Personal communication.
COWAN, E.J., BEATSON, R.K., FRIGHT, W.R., MCLENNAN, T.J., and MITCHELL, T.J.
2002. Rapid geological modelling. Applied Structural Geology for Mineral
Exploration and Mining, Kalgoorie, Western Australia, 23–25 Septembergg
2002. Abstract volume. Vearncombe, S. (ed.). Australian Institute of
Geoscientists Bulletin, vol. 36, pp. 39-44.
FALLARA, F., LEGAULT, M., and RABEAURR , O. 2006. 3-D Integrated geological
modeling in the Abitibi Subprovince (Québec, Canada): techniques and
applications. Exploration and Mining Geology, vol. 15, no. 1–2.
pp. 27–41.
HODKIEWICZ, P. 2013. Leapfrog: new software for faster and better 3D geological
modelling. http://www.srk.com.au [Accessed June 2013].
LEAPFROG. 2010. Leapfrog Geo. http://www.leapfrog3d.com/products/leapfrog-
geo [Accessed 2010].
SAMREC. 2009. South African Mineral Resource Committee. The South African
Code for Reporting of Exploration Results, Mineral Resources and Mineral
Reserves (the SAMREC Code). 2007 Edition as amended July 2009.
http://www.samcode.co.za/downloads/SAMREC2009.pdf [Accessed 10
April 2014].
UNIVERSITY OF THE WITWATERSRANDWW . 2013. School of Mining Engineering.
http://www.wits.ac.za/miningeng/4810/miningeng.html [Accessed
December 2013].
VANTAGEVV GOLDFIELDS. 2013a. Lily Mine. http://www.vantagegoldfields.com/
index.php?option=com_content&view=article&id=73&Itemid=37
[Accessed December 2013].
VANTAGEVV GOLDFIELDS. 2013b. Vantage Goldfields Project Locations.
http://www.vantagegoldfields.com/index.php?option=com_content&view=
article&id=76&Itemid=25 [Accessed December 2013]. ◆
▲
1000 DECEMBER 2014 VOLUME 114 The Journal of The Southern African Institute of Mining and Metallurgy
Table II
Financial valuation results of the mine design
project (University of the Witwatersrand, 2013)
Tons Life of mine Capital Working NPV IRRcost (R/t)
2.7 Mt 8 years R460 million R600 R511 million 43%
6.2 Mt 17 years R350 million R600 R193 million 61%
1.7 Mt 6 years R347 million R535 R81 million 29%
6.1 Mt 12 years R435 million R481 R153 million 27%
4.1 Mt 11 years R440 million R600 R210 million 31%
5.4 Mt 13 years R720 million R684 R50 million 20%
3.9 Mt 11 years R400 million R492 R581 million 61%
2.6 Mt 7 years R375 million R595 R103 million 28%
4.6 Mt 12 years R430 million R900 R190 million 26%
6.7 Mt 11 years R1 045 million R455 R190 million 25%
3.8 Mt 8 years R268 million R736 R184 million 43%
4.3 Mt 10 years R851 million R550 R45 million 23%
3.7 Mt 8 years R411 million R695 R100 million 30%8 years R411 million R695 R100 million

IntroductionCoal is a fossil fuel mineral that has a varietyof uses, including the generation of electricity,metallurgical applications such as steelmaking,cement manufacture, and petroleum fuelproduction. It contributes 25% of the world'sprimary energy needs, after fuel oil whichcontributes 35%. Thermal coal contributesabout 40% of electrical energy, and it isanticipated that this will increase to 46% by2030. The world energy demand, estimated forthe period from 1990 to 2030, is growing at acumulative annual growth rate (CAGR) of1.7% (Schernikau, 2010). This reaffirms theneed for enhanced production from existingmines, and the opening of new mines toincrease the supply of coal and to meetincreasing demand.
However, the demand for coal in the shortterm, estimated for the period from 2010 to2016, is projected to increase by 2.8% perannum. This demand is driven mainly by thecountries outside the Organisation for
Economic Cooperation and Development(OECD), largely dominated by China and India.The demand for coal by China in the sameperiod, for example, is estimated to beescalating at 5.2% per annum (IEA, 2011).
Despite the increasing demand for coal,Höök et al. (2010) emphasize that while coalresources are vast in many countries, thesupply is affected by geology. The depletion ofthe more easily accessed coal could have aneffect similar to the end of abundant and cheapoil. Once the more attractive coal has beendepleted, extraction will become moreexpensive and complicated. In addition, theauthors argue that coal reserves in the worldare unevenly distributed. A few countriescontrol the majority of the world’s supplies,among them the USA, China, Russia, India,Indonesia, Australia, South Africa, Germany,Poland, and Kazakhstan. Together, thesecountries account for 93% of the world’s hardcoal reserves.
Coal is extracted using either surface orunderground mining methods. The mine isrequired to be efficient and cost-effective inorder to be competitive and profitable. Theefficient mine is the one that uses a minimumof resources to deliver maximum output, or atleast uses the same resources to produce amaximum output. Effective cost in particular isthe hallmark of efficient mines. Such minesform the envelope of best practice, and can beused as a benchmark for the improvement ofinefficient mines.
New and currently producing coal minesare subject to challenges that can affect their
Modelling and determining the technicalefficiency of a surface coal mine supply chainby M.D. Budeba*, J.W. Joubert*, and R.C.W. Webber-Youngman*
SynopsisDetermining the efficiency of a surface coal mine operation is an essentialactivity, which can help in deciding on the optimal use of input resources,including effective capital allocation, in generating a desired quantity ofcoal of a specific quality.
Mines operate today in challenging conditions, with diminishingreserves of high-quality coal, remote location of new coal deposits,infrastructure problems, environmental legislation, and the effects ofclimate. All these have an impact on the performance of a mine. Given suchchallenges, a company has to be technically efficient compared to otherexisting coal producers in order to generate profits. It can use themeasurement of its efficiency to evaluate its productivity, benchmarkingthis against the best-performing mines and determining optimal variablesin order to minimize slack and achieve the desired outputs.
This paper discusses the use of Data Envelopment Analysis (DEA) inevaluating the efficiency of a surface coal mine supply chain for the coalexport market. The supply chain is considered to be composed of sub-processes that are modelled as a multistage system. Numeric examples willbe used to illustrate the application of DEA.
KeywordsDEA, technical efficiency, surface coal mine.
* Department of Mining Engineering, University ofPretoria, Pretoria, South Africa.
© The Southern African Institute of Mining andMetallurgy, 2014. ISSN 2225-6253. This paperwas first presented at, A Southern African SilverAnniversary, 2014 SOMP Annual Meeting, 26–30June 2014, The Maslow Hotel, Sandton, Gauteng.
1001The Journal of The Southern African Institute of Mining and Metallurgy VOLUME 114 DECEMBER 2014 ▲

Modelling and determining the technical efficiency of a surface coal mine supply chain
ff fefficiency and cause uncertainties. Some of these challengesare related to the specific features of a deposit, for examplecoal seam thickness, and others such as remoteness, climate,environmental legislation, and the exchange rate. Shafiee,Nehring and Topal (2009) and Shafiee and Topal (2012)highlight factors such as a high stripping ratio, seams withcomplex metallurgical characteristics, mines located inisolated regions, lack of access roads, inadequate electricityand water supplies, unfavourable climate, and the challengesof mountain topography, all of which may cause projectuncertainties. Major factors upon which management has todecide include the stripping ratio, capital allocation, choice ofproduction rate, and the washing rate or crushing rate. Allthese can be divided into controllable (discretionary) or non-controllable (non-discretionary) variables. Thus mines needto be efficient and cost-effective in order to remaincompetitive relative to other producing mines.
Previous research in measuring the efficiency andcompetitiveness of surface coal mines has not considered thechallenges highlighted in this paper. The available modelscan be considered as ‘black boxes’ because they do notincorporate details of supply chain sub-processes of coal forthe export market. There is a need for a model that usesmultiple inputs to generate multiple outputs of the wholesupply chain while considering these challenges that affectthe efficiency of the mine. The model will provide an insightinto the competitiveness of the mine relative to otherproducers of coal for export
This paper applies Data Envelopment Analysis (DEA)methodology, which is a linear programming technique thatis used to determine the envelope of the best practicedecision-making units (DMUs). DEA was used to develop amodel that can be utilized to determine the envelope of thebest-practice surface coal mine, using discretionary variablesand applying linear regression to determining the influence ofnon-discretionary variables on the efficiency score.
The numerical example of eight DMUs that were used forillustration indicated that one DMU is technically efficient,wwhile the remaining seven are technically inefficient. Theseare surface mines that need improvement in order to beefficient. It was also found that distance from the port (Dist-port) and precipitation influence the efficiency score ofsurface coal mines.
The contribution of this work includes development anddemonstration of the application of the DEA model formeasuring the relative efficiency of surface coal minessupplying coal for the export market only. In addition, thepaper develops an understanding of the influence of the non-discretionary variables on efficiency score for a surface coal
fmine, which can help the mine to determine the set ofcontrollable variables that will increase its competitivenessrelative to other producers. For example, coal mining projectscan select optimum technical variables such as capital toincrease their competitiveness.
A literature review on efficiency measurement is firstdiscussed. This is followed by an explanation of the researchmethodology and model formulation, and the application ofthe models is illustrated. Finally, conclusions are drawn andsuggestions offered for further research.
Literature review The concept of efficiency has been defined by variousauthors. In general, it involves the relationship between theinputs and outputs of an organization or a firm. In the workof Markovits-Somogyi (2012), efficiency is defined as thecapacity of a company to realize its stated objectives and touse its available resources cost-effectively. According toJoubert (2010), efficiency analysis offers guidelines andbenchmarks for both public and private enterprises to achievemaximum outputs with minimum inputs.
Figure 1 shows a diagram of a producing unit that couldapply to both a profitable and a non-profitable organization.Referred to as a decision-making unit (DMU), it consumesinputs and transforms them into outputs.
Efficiency can be evaluated using parametric methods,those requiring the use of production functions such asregression and stochastic frontier; and non-parametricmethods, which do not require a predefined function such asDEA. Most of these are used, but DEA in particular is arobust approach compared to the other methods, for thefollowing reasons:
➤ It does not require a predefined function to be specified;hence it avoids error due to mis-specification of thefunction
➤ It can be used even when there is insufficient data➤ It is used to measure efficiency of a unit involving
multiple inputs and outputs.
The major shortcoming of DEA is that it is sensitive tooutliers, which means that the data used needs to be freefrom measurement errors (Kumar and Gulati, 2008). Incontrast, parametric methods need more data and also requirea predefined function to be specified (Markovits-Somogyi,2012). These factors make DEA preferable to other methodsfor measuring the efficiency of DMUs that use similarmultiple inputs to generate similar outputs.
DEA was first introduced by Charnes and Cooper in 1978(Cooper et al., 2007). It is a non-parametric method for
▲
1002 DECEMBER 2014 VOLUME 114 The Journal of The Southern African Institute of Mining and Metallurgy
Figure 1—Decision-making unit transforming inputs into outputs (after Emmanuel, 2011)

ff fmeasuring the efficiency of a DMU. DEA has beensuccessfully applied since its introduction. For example, it hasbeen used to evaluate the performance of various operations,including production planning, research and development,agricultural economics, airport performance, and otherapplications (Li et al., 2012). In particular, DEA has beenused in evaluating the technical efficiency of coal mines, thegrowth in productivity in both opencast and undergroundmines, and in assessing the efficiency of coal mine safetymeasures (Kulshreshtha and Parikh, 2002; Shu-Ming, 2011;Tong and jia Ding, 2008). All these studies, however,consider DEA as a black box. They do not indicate thosedetails of a mine operation that could decide either theefficiency or inefficiency of the mine.
The focus of the applications of DEA in coal mines hasbeen on the general discretionary inputs and outputs; theinfluences of non-discretionary inputs have not beenconsidered. Thus most of the applications consider the inputsand outputs of a mining company without detailing thecomponents of the production system. It is difficult to assessthe required technical levels of inputs in each sub-process ofthe coal supply chain; hence the evaluation views the coalmine as a black box.
DData envelopment analysis for efficiencymmeasurementDEA is based on a linear programming method that is used todetermine a set of best practices regarded as being efficient(Li et al., 2012). The method is used to construct an envelopeof the best-practice DMUs using similar inputs and outputs;the envelope is therefore determined by the pareto-efficientDMUs (Joubert, 2010).
The basic DEA models are those of Charnes-Cooper-Rhodes (CCR) and Banker-Charnes-Cooper (BCC) (Martić etal., 2009). CCR models assume a constant return to scale(CRS), and are based on the assumption that an increase ininputs results in a proportional increase in outputs. The CCRmodel is used to determine the overall efficiency of a DMU.
The BCC model assumes a variable return to scale (VRS),which means that the increase in inputs may result in eithera lesser or greater proportional increase in outputs. The BCCmodel is therefore used for determining the pure technicalefficiency of DMUs.
The pure technical efficiency approach measures theability of management to utilize resources in producingoutputs. CCR efficiency can be decomposed into scaleefficiency and pure technical efficiency. Scale efficiency helpsmanagement to choose the optimal size of the DMU (Kumarand Gulati, 2008).
To illustrate the concept of DEA, consider a set of DMUsA, B, C, Q, and D, using a single input of resource to producea single output (Figure 2). The DMUs A, B, C, and Q areefficient on VRS, thus forming an envelope of best-practiceDMUs, while DMU D is inefficient. Based on CCR, only B isefficient, while the others are inefficient. A DMU isconsidered to be efficient if it has an efficiency score of 1.
Mathematical representation of basic DEA models
Consider a set J = {1...n}, each member of which isconsidered to be a DMU using m inputs of xij for i∈ I andgenerating s outputs yrj for r∈R. The weights assigned toinputs and outputs are vi and ur respectively. The efficiencyscore can therefore be defined by Equation [1] (Talluri,2000). The efficiency of each DMU expressed in a fractionalprogram is then transformed and solved using the linearprogramming method (Cooper et al., 2007). The DMU underevaluation will be DMUj = o and its efficiency score isdenoted by ho.
[1]
[2]
Modelling and determining the technical efficiency of a surface coal mine supply chain
1003The Journal of The Southern African Institute of Mining and Metallurgy VOLUME 114 DECEMBER 2014 ▲
Figure 2—Illustration of CRS- and VRS-efficient DMUs (Kumar and Gulati, 2008)

Modelling and determining the technical efficiency of a surface coal mine supply chain
Subject to
Equation [2] is a fractional program that can betransformed by Charnes-Cooper transformation into a linearprogram (LP):
[3]
subject to
where
The dual of Equation [3] is given by the following linearprogram:
[4]
subject to
Equation [4] is solved n times, with n equal to thenumber of DMUs. If a variable return to scale is considered,
the condition ∑λ = 1 is added in Equation [4]. Taking intoaccount the presence of slack, the dual of Equation [3] isgiven in Equation [5].
[5]
subject to
where s– and s+ are slacks for the input and output respec-tively.
Research methodology and model formulationThe model consists of two stages. The first stage is theformulation of the overall DEA model, comprising the miningoperation, the washing operation, and transport to the port,using discretionary variables. The second stage is the
yregression of the non-discretionary variables on the efficiencyscore to assess the influence of non-discretionary variables.The resulting efficiency scores are dependent on one another,which violates the assumption of the regression models thatthe response and predictor variables should be independent.Xue et al. (1999) suggest that resampling by replacement(bootstrapping) of the efficiency scores to create othersamples of the same size as the original sample will eliminatethis dependency. The formulation approach is indicated inFigure 3.
➤ Discretionary and non-discretionary data were obtainedthrough the Raw Material Group (IntierraRMG)database for coal. Other sources of data includedtechnical articles, reports, and mining company annualreports
➤ Illustration was carried out through solving the modelsusing General Algebra Modelling System (GAMS)software, a free demonstration system with limitedapplication. Regression and bootstrap was carried outin R, which is free and open-source software.
Model formulation
The formulation of the model involved examining the sub-process of surface coal mines that supply coal to the export
▲
1004 DECEMBER 2014 VOLUME 114 The Journal of The Southern African Institute of Mining and Metallurgy
Figure 3—Modelling approach

fmarket. The chain of the process includes mining, thewwashing process, and transportation to the port for export.The structure considered for this research is shown inFigure 4.
According to Cook et al. (2010), the overall efficiency ofthe multistage process is the convex linear combination ofstage-level measures. This can be interpreted as the weightedefficiency of each subsystem of the whole multistage system.The weight assigned for the efficiency of each subsystem ofthe whole chain is the ratio of the input resources used by thesubsystem under evaluation to the total input resource usedby the whole system.
Chen et al. (2009) show that the weight assigned to theefficiency of each sub-process to obtain the overall efficiencyshould be greater than a parameter αα which is chosen toavoid one or two of the weights being zero, and the restbeing equal to 1 upon optimization. These concepts togetherwwere applied in the formulation of the DEA model for thisresearch.
To formulate the model, we considered a set of surfacecoal mines J = {1...n}producing coal and supplying it to theexport market. Each mine is considered as a DMU. Assumingthat input to the mining operation denoted by m is i∈ {1,...,}inputs at the beginning of the washing operation denoted byb is k∈ {1,...,K} inputs at the beginning of port denoted by pis f∈ {,...,F}, intermediate output from mining and as aninput into the washing operation is g∈ {1,...,G}, and theoutput from the washing operation, which is also an input tothe port, is t∈ {1,...,T}.
The following definitions for the symbols were used:xxij
m = the given amount of input i∈ I to the miningoperation m of DMU j∈J
xxkjb = the given amount of input k∈K to the washing plant
b of DMU j∈Jxxfjx
p= the given amount of input f∈F to the port p of
DMU j∈Jzzgi
m = the amount of intermediate output from the miningoperation and is an input to the washing plant of theDMU j∈J
zztjb = the amount of intermediate output from the washing
plant and is an input to the port of the DMU j∈Jyyrj
p= the given amount of output r∈R from the port p of
DMU j∈Jvr
p = weight given to the outputs r∈R from the port p ofDMU j∈J
ufup
= weight given to the inputs f∈F in the port p ofDMU j∈J
ηtb = weight given to the outputs t∈T from the washing
plant b of DMU j∈Juk
b = weight given to the inputs k∈K to the washingplant bof DMU j∈J
uim = weight given to the inputs i∈ I to the washing plant
b of DMU j∈Jηg
m = weight given to the outputs g∈G from mining andis an input to washing plant
ωiωm = weight for the inputs i∈ I to the mining operation m
after transformation to linear program (LP)ωfω
p= weight for the inputs f∈ff F to the port p after
transformation to LPωkω
b = weight for the inputs k∈K to the washing plant bafter transformation to LP
γgm = weight for the outputs g∈G from the mining
operation m after transformation to LPγt
b = weight for the outputs t∈T from the washingoperation b after transformation to LP
μrp = weight for the outputs r∈R from the port p after
transformation to LPεε = an infinitesimal positive number that ensures the
weights are positive.
Convex linear combination of the efficiency of each sub-process was used to generate the overall efficiency of thesupply chain. The resulting mathematical model of thesurface coal mine supply chain for the export marketrepresented by Figure 4 is presented in Equation [6].
[6]
subject to
Modelling and determining the technical efficiency of a surface coal mine supply chain
The Journal of The Southern African Institute of Mining and Metallurgy VOLUME 114 DECEMBER 2014 1005 ▲
Figure 4—Surface coal mine supply structure for the export market
xijm
xkjb
zgim
xfjxp
ztjb
yrjp
Mining operation Washing plant Port

Modelling and determining the technical efficiency of a surface coal mine supply chain
The above linear programming was transformed by theCharnes-Cooper transformation approach in Equation[3] toyyield:
[7]
subject to
where:u1, u2, u3 are added to account for variable return to scale
for the mining operation, washing operation, andport respectively
ε is an infinitesimal number whose value is 10-6. It isused in ensuring that the optimal weights arepositive
β is a parameter that is chosen to avoids the weightsassigned to efficiency score in convex linearcombination being zero upon optimization ofefficiency, and also to ensure that there is aminimum weighted input for each DMU in eachsub-process. In this research optimal value of β = 0.2
Considering the influence of non-discretionary variableson the resulting efficiency score, the linear regression wasapplied, using the efficiency score as a dependent variableand non-discretionary variables as independent variables(thickness, distance to the port, precipitation, life of mine(LOM), and calorific value (CV)). The regression model thatwas applied in this research is shown in Equation [8].
[8]
where θ is the efficiency score and α is the coefficient ofregression.
Illustration of the application
To illustrate the application of the model, data from eightsurface coal mines producing coal for export were extractedfrom RMG database, while the supplementary informationsuch as standards for export tons, number of employees andothers were obtained from media reports, companywebsites, and mining company annual reports.
Data-sets for selected discretionary and non-discretionaryvariables are presented in Table I and Table II respectively. InTable I the revenue is secondary data that was calculatedfrom the product of price and export tonnages. For illustrationpurposes, surface coal mines for this research were givenDMU numbers.
▲
1006 DECEMBER 2014 VOLUME 114 The Journal of The Southern African Institute of Mining and Metallurgy
Table I
Discretionary input variables and output variables
DMU Reserve CAPEX No. Moisture SR Ash (%) ROM (Mt) Carbon tax Recovery Export CV Export FOB Price Revenue (Mt) US$M Employees (%) $/t) (% (Mt) MJ/Kg $/t US$M
DMU1 61.40 750.00 448 2.0 3.00 14.5 3.197 23 0.9 2.09 27.21 103.25 215.79DMU2 25.20 177.00 250 3.5 7.00 6 2.800 23 0.9 2.8 27.21 103.25 289.10DMU3 29.10 45.30 70 6.0 4.60 12 7.640 23 0.9 7.18 23.02 103.25 741.34DMU4 21.30 144.00 400 9.0 5.50 10 2.800 23 0.9 1.4 25.12 03.25 144.55DMU5 172.60 1300.00 170 14.5 3.70 9.5 8.210 23 0.9 27.9 25.12 103.25 2880.68DMU6 66.00 330.00 330 2.2 7.00 10.35 2.612 23 0.9 2.612 25.12 103.25 269.69DMU7 26.31 275.00 300 2 10 8.75 2.900 23 0.9 2.9 25.12 103.25 299.43DMU8 100.00 122.90 400 3.5 10 9 3.779 23 0.9 3.779 23.02 103.25 390.18
Source: RGM, annual mining reports, media and company websites
29.10 45.30 70 6.0 4.60 12 7.640 23 0.9 7.18 23.02 103.25 21.30 144.00 400 9.0 5.50 10 2.800 23 0.9 1.4 25.12 03.25
172.60 1300.00 170 14.5 3.70 9.5 8.210 23 0.9 27.9 25.12 103.25 66.00 330.00 330 2.2 7.00 10.35 2.612 23 0.9 2.612 25.12 103.25 26.31 275.00 300 2 10 8.75 2.900 23 0.9 2.9 25.12 103.25
100.00 122.90 400 3.5 10 9 3.779 23 0.9 3.779 23.02 103.25

The model in Equation [7] was solved using GeneralAlgebraic Modelling system software (GAMS), a freedemonstration system considering discretionary variablesonly. In the second step, multiple regressions were applied onnon-discretionary variables. The regression of the efficiencyscore on non-discretionary variables was done using the Ropen-source software.
The inputs for the sub-processes of the DEA model were:
➤ Mining operation: CAPEX (capital expenditure),stripping ratio (SR), number of employees, andmoisture (%)
➤ Washing plant ROM, ash, and recovery➤ Port: carbon tax.
The overall outputs of the model were revenue and CV-export.
Results
The results of the efficiency scores after solving the model(Equation [7]) using GAMS for each DMU using the data inTable I are presented in Figure 5. DMU 6 is technicallyefficient, with an efficiency score of 1; this DMU define theenvelope of the best practice of all surface mines used in theillustration for the application. DMUs 1–5, 7, and 8) areinefficient surface coal mines with efficiency scores less than1. This implies that in order to be efficient, DMU 1 has toimprove by 4.5%, DMU 2 by 11.2%, DMU 3 by 18.0%, DMU4 by 25.9%, DMU 5 by 1.7%, DMU 7 by 1.2%, and DMU 8 by6.9% in relation to the best-practice mines through reductionof controllable inputs.
The influence of non-discretionary variables (Table II) onefficiency score for each DMU was determined using Rsoftware. The results are summarized in Table III. Thesummary statistics tests in Table III show that theprobabilities (p-value) for t-value for coefficient of Dist-port,precipitation, and thickness variables are lower than the 0.05significance level, while that of LOM is greater than 0.05.This suggests that the Dist-port, precipitation, and thicknessvvariables have an influence on the efficiency scores, whileLOM has no influence on the efficiency scores of the mines.The inclusion of the CV variable in the regression togetherwwith the other discretionary variables in Table II shows norelationship with the efficiency score. This is due to therelationship between the CV and the other predictor variables,wwhich affects the regression results.
ffBootstrap technique was applied to the efficiency scoresobtained for each DMU to avoid dependence among them, soas to generate a random set of efficiency scores. Forillustration purpose the data was resampled with replacementof 1000 samples, with each having eight DMUs, on thevariables indicated in Table II, and then regression wasapplied to each sample. The results of the bootstrapregression are presented in Table IV.
Through observation of the confidence interval 95% (CI)in Table IV, distance to the port (Dist-port) and precipitationaffect the efficiency of a surface coal mine. This is becausethe confidence interval for coefficients of these variables doesnot include zero. This statistical test suggests that thesevariables have influence on the efficiency score. The CIs forthe coefficient of the thickness and LOM include zero value,which indicates that thickness and LOM do not affect theefficiency score.
The major differences between the results presented inTable III and Table IV are in the values of the standard errors.The results in Table III have standard errors obtained fromefficiency scores that are dependent on each other, and those
Modelling and determining the technical efficiency of a surface coal mine supply chain
The Journal of The Southern African Institute of Mining and Metallurgy VOLUME 114 DECEMBER 2014 1007 ▲
Table II
Non-discretionary input variables
DM Thickness Precipitation Dist-port LOM CV (m) (mm) (Km) (Yrs) (MJ/kg)
1 4.0 600 286 20 29.312 3.2 568 407 12 313 3.0 685 250 20 27.24 11.0 789 105 10 28.265 38.0 655 278 17 27.96 5.0 674 164 17 307 0.6 674 161 9 29.38 2.9 568 360 10 28.01
Table III
Regression results for the discretionary variables
Variables Estimate Std. Error t value Pr(>|t|)
Precipitation -0.00293 0.00046 -6.41200 0.00769Thickness 0.00390 0.00120 3.23500 0.04805Dist-port -0.00170 0.00032 -5.35900 0.01272LOM 0.00066 0.00297 0.22300 0.83784
Table IV
Regression results for 1000 bootstrap samples
Variables Estimate Bias Std. Error CI (95%)
Precipitation -0.00293 0.00050 0.00199 (-0.0128, -0.0012)Thickness 0.00390 -0.00187 0.01870 (-0.0062, 0.0885)Dist-port -0.00170 0.00022 0.00126 (-0.0063, -0.0008)LOM 0.00066 -0.00051 0.00835 (-0.0067, 0.0307)
Figure 5—Variable return–to-scale technical efficiency of DMUs forillustration

Modelling and determining the technical efficiency of a surface coal mine supply chain
fin Table IV are obtained from resampling technique thateliminates dependence among the efficiency scores.
In addition, it is observed that the results from bothordinary regression and bootstrap regression are notsufficiently conclusive to confirm that the selected non-discretionary variables for illustration do affect the efficiencyscore of a surface coal mine. More data and more variablescan help to draw conclusions and identify extra non-discre-tionary variables that influence the efficiency of surface coalmines. For example, the ordinary linear regression indicatesthat the thickness of the coal seam has an influence on theefficiency score, while the regression for the bootstrap(resampling) technique indicates that the thickness does notinfluence the efficiency score. This apparent contradiction canbe clarified by including more observations in the study.
Conclusions
Determining the relative efficiency of a surface coal minehelps management to identify inefficient mines and select theoptimal level of the variables that can be used in order toimprove the company’s efficiency and thus its competi-tiveness. It can help the mine to determine the effective costof achieving the desired outputs.
At any given producer, the relative technical efficiency ofthe mine can be determined by comparing it with the best-practice mines. New mines can also determine their positionor can choose the best discretionary variables to help them toincrease their competitiveness in the market.
This study suggests that future research should befocused on creating models to predict the efficiency of newsurface mines, taking into account both the discretionary andnon-discretionary variables from the results of the efficiencyscore. This would help new mines to evaluate theiroperational variables before spending more capital, makingthem competitive in any given business environment.
References
CHEN, Y., COOK, W. D., LI, N., and ZHU, J. 2009. Additive efficiency decompo-
sition in two-stage DEA. European Journal of Operational Research,cc
vol. 196, no. 3. pp. 1170–1176.
COOK, W.D., ZHU, J., BI, G., and YANGYY , F. 2010. Network DEA: additive efficiency
decomposition. European Journal of Operational Research, vol. 207, no. 2.
pp. 1122–1129.
COOPER, W., SEIFORD, L., and TONE, K. 2007. Data Envelopment Analysis: A
Comprehensive Text with Models, Applications, References and DEA-
solver Software. 2nd edn. John Wiley & Sons. p. 2.
EMMANUEL, T. 2011. Alternative methods for measuring efficiency and an
application of DEA in education. Aston Business School.
http://www.slideserve.com/lotus/alternative-methods-for-measuring-
efficiency-and-an-application-of-dea-in-education [Accessed 15 August.
2013].
FANG, H., WUWW , J., and ZENG, C. 2009. Comparative study on efficiency
performance of listed coal mining companies in China and the US. Energy
Policy, vol. 37, no. 12. pp. 5140–5148.
HÖÖK, M., ZITTEL, W., SCHINDLER, J., and ALEKLETT, K. 2010. Global coal
production outlooks based on a logistic model. Fuel, vol. 89, no. 11.
pp. 3546–3558.
IEA. 2011. Medium-Term Coal Market Report, 2011.
http://www.iea.org/topics/coal/publications/ [Accessed 26 July 2013]. p.
52.
JOUBERT, J. 2010. Data envelopment analysis: an overview. Working paper 14.
Optimisation Group, Industrial and Systems Engineering, University of
Pretoria.
KALVELAGENKK , E. 2007. A linear regression solver for GAMS. Amsterdam
Optimization Modeling Group, Washington, DC. http://amsterdamopti-
mization.com/pdf/regression.pdf
KALVELAGENKK , E. 2002. Efficiently solving DEA models with GAMS. GAMS
Development Corporation, Washington DC.
KULSHRESHTHAKK , M. and PARIKH, J.K. 2002. Study of efficiency and productivity-
growth in opencast and underground coal mining in India: a DEA
analysis. Energy Economics, vol. 24, no. 5. pp. 439–453.
KUMARKK , S. and GULATI, R. 2008. An examination of technical, pure technical,
and scale efficiencies in Indian public sector banks using data
envelopment analysis. Eurasian Journal of Business and Economics,
vol. 1, no. 2. pp. 33–69.
LI, Y., CHEN, Y., LIANG, L., and XIE, J. 2012. DEA models for extended two-stage
network structures. Omega, vol. 40, no. 5. pp. 611–618.
MARKOVITS-SOMOGYI, R. 2012. Complex technological and economic efficiency
assessment methods in freight transport and logistics with special
emphasis on data envelopment analysis. PhD thesis, Budapest University
of Technology and Economics.
MARTIć, M., NOVAKOVIć, M., and BAGGIA, A. 2009. Data envelopment analysis –
basic models and their utilization. Organizacija, vol. 42, no. 2. pp. 37–43.
SHAFIEE, S., NEHRING, M., and TOPAL, E. 2009. Estimating average total cost of
open pit coal mines in Australia, 2009. Australian Mining Technology
Conference, Brisbane, 27 October 2009. Australasian Institute of Mining
and Metallurgy, Melbourne.
SHAFIEE, S. and TOPAL, E. 2012. New approach for estimating total mining costs
in surface coal mines. Mining Technology, vol. 121, no. 3. pp. 109–116.
SCHERNIKAU, L. 2010. Economics of the International Coal Trade. Springer,
London.
SHU-MING, W. 2011. Evaluation of safety input-output efficiency of coal mine
based on dea model. Procedia Engineering, vol. 26. pp. 2270–2277.gg
TALLURI, S. 2000. Data envelopment analysis: models and extensions. Decision
Line, vol. 31, no. 3. pp. 8–11.
TONG, L. AND JIA DING, R. 2008. Efficiency assessment of coal mine safety input
by data envelopment analysis. Journal of China University of Mining and
Technology, vol. 18, no. 1. pp. 88–92.
XUEXX , M. and HARKER, P.T. 1999. Overcoming the inherent dependency of DEA
efficiency scores: a bootstrap approach. Unpublished working paper,
Wharton Financial Institutions Center, University of Pennsylvania. ◆
▲
1008 DECEMBER 2014 VOLUME 114 The Journal of The Southern African Institute of Mining and Metallurgy

IntroductionThe School of Mining Engineering at theUniversity of New South Wales (UNSW)Australia has progressively built simulators forthe mining industry in collaboration with theindustry. A project was commenced in 1999wwith seed funding from UNSW and CoalServices Pty Ltd. Subsequently, funding wasprovided from industry in 2002 through theAustralian Coal Association Research Program(ACARP). A flat screen ‘proof of concept’system was deployed at Newcastle MinesRescue Station (NMRS) in Argenton, NewSouth Wales (NSW), Australia.
Stothard et al. (2004) described thedevelopment, deployment, and implementationof a virtual reality (VR) simulation capabilityby the School to address the specific needs ofthe Australian coal mining industry. Thesimulation capability developed is a hybridsystem designed to provide simulationtechnology to both large and small operators.The system was deployed at mine rescue
stations in NSW and is currently in daily usefor training in areas such as unaided self-escape, rib and roof stability, hazardawareness, and isolation. The objective is tosimultaneously train groups of miners in anenvironment where they are exposed to high-resolution, ‘one-to-one’ scale visualization ofthe underground environment in which theywill operate.
From an educator’s point of view, theeffects of simulation and role-playing onstudents ‘involves the whole person - intellect,feeling and bodily senses – it tends to beexperienced more deeply and rememberedlonger’ (Brookfield, 1990). According torrMeyers and Jones (1993), students who usesimulations are forced to think on their feet,‘question their own values and responses tosituations, and consider new ways ofthinking’. The main objectives are to makeggtrainees feel as though they are located in themine and provide them with a fully immersiveexperience (Stothard et al., 2008).
Furthermore, the School has been involvedin UNSW’s award-winning iCinema AdvancedVisualisation and Interaction Environment(AVIE) project – a 3D 360-degree VR facilityand iDOME (proprietary hardware / softwareplatform developed by the iCinema Centre)(Hebblewhite et al., 2013; Mitra and Saydam2011; Saydam et al., 2011). The School hasconstructed an AVIE and an iDOME (a 2Dversion of the AVIE), funded partly by aFederal Capital Development grant in 2007, fordeveloping mine safety training simulations.Figure 1 shows the AVIE and iDOME facilitiesat the School of Mining Engineering.
Can artificial intelligence and fuzzy logic beintegrated into virtual reality applicationsin mining?by R. Mitra* and S. Saydam*
SynopsisThe University of New South Wales (UNSW Australia) has been a worldleader in the development of innovative virtual reality technologies overthe last 15 years. AVIE (Advanced Visualisation and InteractiveEnvironment) was developed by iCinema as a collaborative venturebetween UNSW’s Faculties of Engineering and the College of Fine Arts. Thisis the world’s first 360°-surround, virtual reality (VR) stereo projectiontheatre system.
The School of Mining Engineering at UNSW Australia has developed 18different virtual reality modules aimed at mine safety training and miningengineering education. These modules are being regularly used in both themining industry and the university. The School of Mining Engineering iscontinuously involved in the development of different modules. Research isalso currently being conducted on the implementation of other technologiesinto this environment. Artificial intelligence (AI) and fuzzy logic are toolsthat the authors would like to consider implementing in future moduledevelopment. This paper will review current research in both these areasand consider options for applying these technologies.
Keywordsmining, virtual reality, artificial intelligence, fuzzy logic.
* School of Mining Engineering, University of NewSouth Wales, Australia.
© The Southern African Institute of Mining andMetallurgy, 2014. ISSN 2225-6253. This paperwas first presented at, A Southern African SilverAnniversary, 2014 SOMP Annual Meeting, 26–30June 2014, The Maslow Hotel, Sandton, Gauteng.
1009The Journal of The Southern African Institute of Mining and Metallurgy VOLUME 114 DECEMBER 2014 ▲

Can artificial intelligence and fuzzy logic be integrated into virtual reality applications?
Advances in computing power have enabled greatprogress in artificial intelligence (AI) and fuzzy logic. Thesetechnological breakthroughs can best be utilized with agreater awareness of this technology and what it can achieve.This study will investigate if there is any potential forintegrating fuzzy logic and AI into the VR technology that iscurrently used at the School.
Mining-related virtual reality modules developed atUNSW Apart from developing modules aimed at improving thehealth and safety standards for the mining industry, theSchool has also developed numerous modules using the sametechnology for improving teaching and learning for miningengineering education at UNSW Australia. These modules areused in majority of the courses in both undergraduate andpostgraduate teaching. All the modules are capable ofrunning in the AVIE at the School and also on a standalonePC. Some of these modules are currently being adapted to runon the Internet so that students can access them at theirleisure (Mitra and Saydam, 2011). The following is a list ofthe various modules that have been or are currently being
fdeveloped for both the industry and learning and teaching(Hebblewhite et al., 2013; Mitra and Saydam 2011; Saydamet al., 2011):
1. Hazard awareness2. Isolation (Figure 2)3. Outburst4. Spontaneous combustion5. Deputies inspection6. Self-escape7. Rib stability8. Truck inspection (Figure 3)9. Working at heights10. Laboratory rock testing11. Mining in a global environment (Figure 4)12. Block caving (Figure 5)13. Truck and shovel (Figure 6)14. Longwall top coal caving (Figure 7)15. ViMINE 1 (Figure 8) and ViMINE 2 (Figure 9)16. NorthParkes community awareness17. Coal geology (under development)18. Caving geomechanics data visualization (under
development).
Artificial intelligenceArtificial intelligence (AI) is defined as ‘the study and designof intelligent agents where an intelligent agent is a systemthat perceives its environment and takes actions whichmaximizes its chances of success’. This term was created byMcCarthy (1956), and was defined as the science andengineering of making intelligent machines (ScienceDaily,2014).
Russell and Norvig (1995) define four different categoriesfor AI. These categories include systems that:
➤ Think like humans
▲
1010 DECEMBER 2014 VOLUME 114 The Journal of The Southern African Institute of Mining and Metallurgy
Figure 1—(a) AVIE and (b) iDOME at the School of Mining Engineering,UNSW Australia
Figure 2—Screenshots from the Isolation module
(c) Commencing work after completion of isolation
(a) Placing locks and tags (b) Verifying installation
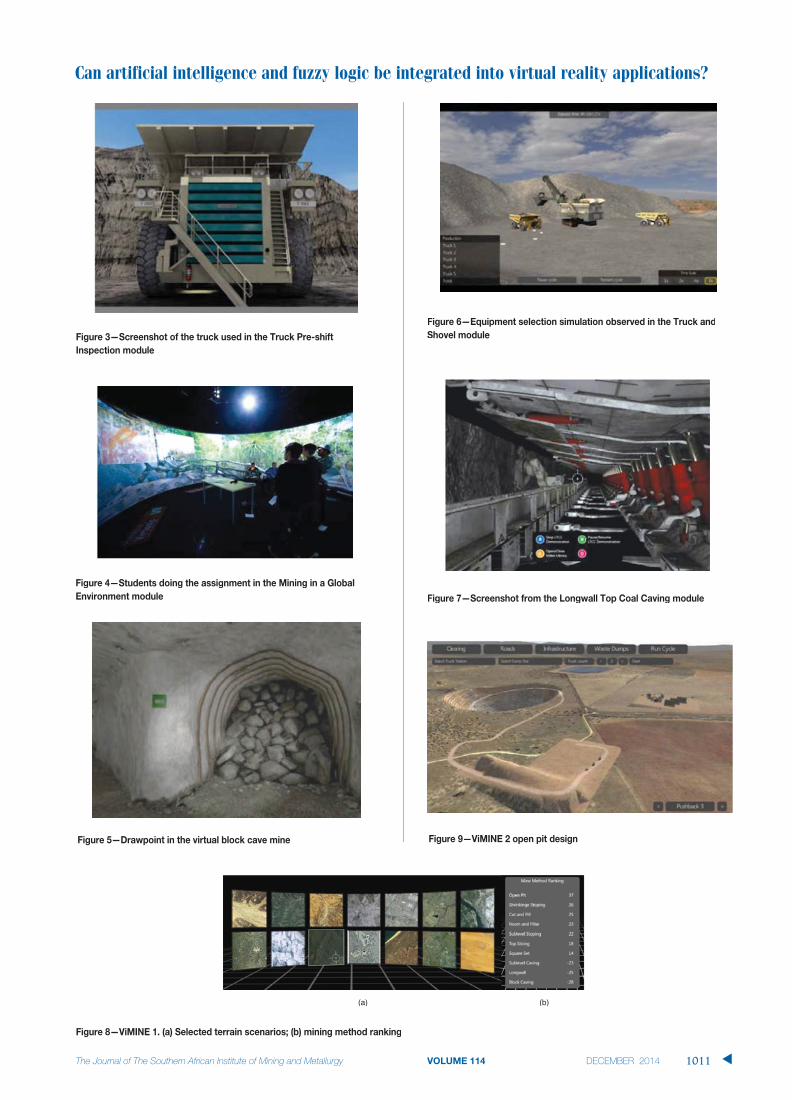
Can artificial intelligence and fuzzy logic be integrated into virtual reality applications?
1011The Journal of The Southern African Institute of Mining and Metallurgy VOLUME 114 DECEMBER 2014 ▲
Figure 3—Screenshot of the truck used in the Truck Pre-shiftInspection module
Figure 4—Students doing the assignment in the Mining in a GlobalEnvironment module
Figure 5—Drawpoint in the virtual block cave mine
Figure 6—Equipment selection simulation observed in the Truck andShovel module
Figure 7—Screenshot from the Longwall Top Coal Caving module
(a) (b)
Figure 8—ViMINE 1. (a) Selected terrain scenarios; (b) mining method ranking
Figure 9—ViMINE 2 open pit design

Can artificial intelligence and fuzzy logic be integrated into virtual reality applications?
➤ Think rationally➤ Act like humans➤ Act rationally.
According to Shapiro and Eckroth (1987), the first AIprograms were developed during the 1950s. These programscould perform tasks such as playing chess. None of theprograms developed in the 1960s were able to solve complexproblems, although they did further the understanding of theintelligent problem-solving process. Gaming programsbecame popular for testing AI as this was the easiest way tocompare two programs and investigate whether simple ruleswwould be able to overcome limited memory problems. Itbecame evident, however, that this was not the case due tothe large number of move sequences to be considered.
During the 1970s, AI systems were used mainly inlaboratories and incorporated specific knowledge based onthe area they were assigned to. Commercial systems thatwwere cost-effective became available during the 1980s forboth government and industry purposes (Shapiro andEckroth, 1987). With increasing use of these new systems, alot of errors became apparent. However, in spite of theseflaws, the systems continued to be used by both companiesand the government. The 1990s and 2000s saw a variety ofmajor developments in AI technology.
AApplications of artificial intelligence in various fieldsAI technology is applied in numerous fields, includingplanning and scheduling, gaming, vehicle control, medicine,robotics, language understanding and problem-solving, andspeech recognition. This section will provide examples ofsome of these areas.
In regard to planning and scheduling, the system consistsof a search engine, which uses a planned database andknowledge base to construct a plan. An example of such asystem was used by the National Aeronautics and SpaceAdministration (NASA) on board its Deep Space Onespacecraft in 1999 (Jonsson et al., 2000). The system wasused to detect, diagnose, and recover from any problemsoccurring on the spacecraft. Plans were generated by thesystem considering limitations in time, resources, and flightsafety rules. Spyropoulos (2000) discusses the application ofAI planning and scheduling for therapy planning and hospitalmanagement.
As mentioned previously, one of the most popularapplications of AI technology is in the area of gaming. Russelland Norvig (2003) discuss Deep Blue, a chess-playingcomputer built by IBM that in 1997 defeated Garry Kasparov,the then world chess champion. Another game, WarCraft, wasthe first game to employ pathfinding algorithms at such agrand scale, for hundreds of units in the game engaged inmassive battles (Grzyb, 2005). SimCity is another examplewwhere AI has been successfully used.
AI can be used to control a vehicle without much humanintervention. The Robotics Institute at Carnegie MellonUniversity (USA) designed the Autonomous Land Vehicle ina Neural Network (ALVINN) with the task of following roads.Successful trials with the test vehicle have indicated that thenetwork can effectively follow real roads under certain fieldconditions (Pomerleau, 1989).
f fIn the field of medicine, AI has the potential to exploitmeaningful relationships within a data-set for use in thediagnosis, treatment, and predicting outcomes in manyclinical scenarios (Ramesh et al., 2004). ‘Pathfinder’ is anexample of an expert system that helps surgical pathologistsin diagnosing lymph-node diseases. It is one of a growingnumber of normative expert systems that use probability anddecision theory to acquire, represent, manipulate, and explainuncertainty in medical knowledge (Heckerman et al., 1992).
AI technology can expand the capabilities of robots.HipNav is an example which uses AI to create a three-dimensional model of a patient’s internal anatomy. Roboticcontrols are then used to guide the insertion of the patient’snew hip replacement (Russell and Norvig, 2003).
In the field of linguistics and problem solving, Littman etal. (1999) discuss PROVERB, a computer program that usesfilters, an archive, and other information sources to solvecrossword puzzles. A solver chooses the best candidate fromsolutions generated by 30 different modules. These modulescan be split into five categories – word list modules,crossword database-specific modules, information retrievalmodules, database modules, and syntactic modules. Word list
ymodules ignore the clue and run every word from a dictionarythat has the correct length. Crossword database modulessearch for similar clues from a database of previouscrosswords. Information retrieval modules search online full-text sources such as encyclopaedias. Domain modules searchspecific domains for solutions based on specific parameterssuch as authors, songwriters, or actors. Syntactic modules areused to solve specific clues where it is required to fill in ablank.
According to Sharples (1996), many tasks could be madeeasier by controlling through speech rather than typing.Modern systems can recognize speech with little or notraining compared to older interfaces, which were limited inregard to input. Stolcke (1997) lists a variety of technologicalareas in which speech recognition is available such asdictation software, medical equipment, and stock trading overthe telephone. Speech recognition technology development ismeasured by the ratio of incorrectly recognized words to thenumber of words spoken, known as the word error rate.While the word error rate can be affected by a number offactors such as the size of the vocabulary, the speaking styleof the user, whether the query is open or task-oriented,whether the system is trained for more than one user, thechannel quality of the system, and background noise, the rateis not affected by the language chosen.
Applications of artificial intelligence in miningFor many years, AI tools have been in use in various mining-related applications. Bandopadhyay andVenkatasubramanian (1986) developed a fault diagnosticexpert system for the longwall shearer. Altman et al. (1988)developed an expert system, Mine Ventilation Manager, tocontrol the operation of a mine ventilation network system.Schofield (1992) developed MINDER, a decision supportsystem capable of assisting the mine planner in the complextask of selecting the optimum surface mining equipment. Oneof the major objectives of this program was to enableintegration with other mining software packages.
▲
1012 DECEMBER 2014 VOLUME 114 The Journal of The Southern African Institute of Mining and Metallurgy

fDenby and Kizil (1991) describe the development of anadvanced computer system for the assessment ofgeotechnical risk in surface coal mines. The authors reviewthe ESDS, an expert system for slope stability assessment.The paper concludes by presenting an example that illustrateshow ESDS may be utilized as a decision support system atthe design stage of a UK surface coal mine. Faure et al.(1991) developed an expert system, XPENT, for slopestability analysis.
There are numerous examples of work done in the area ofmapping minerals. Kruse et al. (1993) used a knowledge-based expert system to automatically produce image mapsshowing the principal surface mineralogy developed fromAirborne Visible/Infrared Imaging Spectrometer (AVIRIS)data. Moore and Sattar (1993) developed a knowledge-basedsystem to assist in the modelling and economic assessmentof potential mineral deposits in Queensland, Australia. Thesystem was able to be readily tailored to address specificmineral commodities and environments.
Bearman and Milne (1992) reviewed the opportunities forexpert systems in the minerals industry, and exploredpotential future developments and applications for theindustry. Romans (1993) provides examples of application ofknowledge-based systems in the minerals industry leading tosubstantial savings. Kizil et al. (1995) also summarized theuse of AI applications in mining. They mentioned Waller andRowsell’s (1993) work on the development of a systemnamed ‘Intelligent Drilling Control’ using AI in petroleumindustry. The system aimed to optimize the drilling process,and measure the real-time pick consumption and calculatethe drilling costs.
Deliormanli et al. (1995) developed an expert systemsoftware named EMQDS (Expert Marble Quarry Design((SSystem) to select appropriate equipment, assess the work-force, and conduct a financial analysis for marble production.
Toll (1996) discusses the application of AI systems forgeotechnical applications. According to the author, asignificant number of systems have been developed for sitecharacterization, classification of soils and rocks,foundations, earth retaining structures, slopes, tunnels andunderground openings, mining, liquefaction, groundimprovement, geotextiles, groundwater/dams, roads, andearthworks.
Morin (2001) discusses the integration of supportelements such as expert systems, numerical models, dataanalysis and visualization tools, and simulation to bringadded functionality and intelligence to the mine design andplanning system. According to the author, the integration ofthese elements, if feasible, would form an intelligent designsystem with decision-support capabilities that exceedanything currently available on the market.
‘Expert and knowledge based systems, probably the mostppopular AI tools, have found their way into a number ofcomputer-based applications supporting everyday miningoperations as well as production of mining equipment’tt(Kapageridis, 2002). This study mentions the use of AI toolsfor exploration and reserve estimation, geophysics, rockengineering, mineral processing, remote sensing, processcontrol and optimization, and equipment selection. Foloronso
et al. f(2012) developed an expert-based mineral identifi-cation system to teach undergraduate students. They wereable to promote effective and meaningful learning of scientificobservation in the area of Earth Science. According toKnobloch et al. (2013), mineral predictive maps can becreated with the help of artificial neural networks (ANNs)which use a comprehensive data-driven modelling approach.Based on a ‘self-learning’ process, this AI technology can beused to interpret almost any geoscientific data for generationof both qualitative (prediction of locations) and quantitative(prediction of locations, grades, tonnages) mineral predictivemaps. By analysing the footprints of known mineralizationin the framework of available geoscientific data, theapproach generates trained ANNs that are further used togenerate predictive maps.
Fuzzy logic
Traditional science is centred on the binary status view that astatement is either entirely true, or entirely false. However,according to Kosko (1999), fuzz‘ ’ includes statements thatare only partially true in order to define vague terms thathave entered human language. This way of thinking hasgenerally not been accepted by modern science. A set is abinary structure to which objects belong. An object eitherbelongs to a set or it does not; sets do not allow for partialmembership. Depending on whether or not they belong to aset, objects are represented by a 1 or 0. However, a fuzzy setallows for partial membership. Fuzzy logic systems use fuzzysets to convert inputs into the correct outputs. Like a humanexpert, a fuzzy logic system uses rules of thumb to determinewhat action must be taken in a certain situation. These arecalled Fuzzy If-Then rules and they follow the form if x is Athen y is B where A and B are linguistic values defined by thefuzzy sets on the universe of disclosure X and Y (Castillo andMelin, 2008). In the above rule, x is A is defined as theantecedent or premise while y is B is called the consequent orconclusion. An example of such a rule in our everyday lifecan be if service is great then tip is greater than 15%. Thecurse of dimensionality says that there will always be a limitto the number of rules that can be used due to the memorylimits of computer chips. A membership function maps theobject values within a set and can take a number of forms.Bezdek (1996) lists the following five basic operations thatare used to manipulate fuzzy sets:
➤ Equality➤ Containment➤ Complement➤ Intersection➤ Union.
Fuzzy logic began in Ancient Greece with the philosopherZeno. According to Kosko (1999), Zeno posed the question:if we remove the grains from a pile of sand one at a time, atwhat point does it cease to be a pile? The fuzzy answer isthat the pile leaves the set of piles of sand as smoothly as theindividual grains are taken away from it. At the turn of the20th century, Bertrand Russell stated that ‘everything isvague to a degree you do not realise it until you try to makeit precise’. Russell said that during the transition phase,
Can artificial intelligence and fuzzy logic be integrated into virtual reality applications?
The Journal of The Southern African Institute of Mining and Metallurgy VOLUME 114 DECEMBER 2014 1013 ▲

Can artificial intelligence and fuzzy logic be integrated into virtual reality applications?
f fobjects would spend the majority of their time in a mix of thetwo states. In the 1920s Jan Lukasiwicz looked at thesetheories as an extension of binary logic. He stated that allstatements are either true or false to some degree, but thatthe ‘true’ and ‘false’ scores must add up to 100%. In 1937,Max Black drew the first graph of a fuzzy set. However, thephilosophical community largely ignored these views due totheir attitude towards logic at the time. The term ‘Fuzzy’ wasintroduced by a paper by Lofti Zadeh, the chairman of theelectrical engineering department at the University ofCalifornia, in 1965. However, it was decades before his workreceived recognition in the form of a medal of honour fromthe Institute of Electrical Engineers in 1995.
According to Kosko (1999), one of the first devices to usefuzzy logic was a kiln for F.L. Schmidt and Co. inCopenhagen, in 1980. The coal feed rate was reduced if bothtemperature and oxygen levels were high within the kiln. Oneof the most notable developments in the use of thistechnology was the Sendai subway railway system developedby Hitachi in 1988. The system replaced train drivers alongthe 13.6 km long, 16-station track. The introduction of thesystem has led to a smoother ride for passengers, with a 10%reduction in energy consumption compared to human drivers(Kisko, 2005).
Many of the earliest applications of fuzzy logic weredesigned to be used by organizations. The first homeappliance to use fuzzy logic was a washing machinedeveloped in 1990 (Wakami et al., 1996). The optimumwwashing time was determined through outputs from awwashing sensor and fuzzy logic technology. The washingsensor used a light-emitting diode and a phototransistor tomeasure the transmittance of the water. The rate at which thelight transmittance decreased indicated whether the dirt inthe machine is muddy or oily, which in turn indicatedwwhether there was a light or heavy amount of dirt in thewwashing machine. Fuzzy logic used these inputs to determinethe optimal washing time.
Fuzzy logic technology has also been used to stabilizevvideos shot with amateur video cameras. As video camerasbecame smaller and lighter, the effect of hand jitters becamemore noticeable. The image stabilizing system consists of amotion detection chip, interpolation processing chip, fieldmemory, and microprocessor to hold the fuzzy interference.The image is sent to the field memory while also beingprocessed by the motion detection chip. The motion detectionchip looks for correlation between images to detect theamount and direction of movement. The field memory thenrepositions the image and uses the electronic zoom functionof the camera to enlarge the compensated image. Fuzzy logicis used to distinguish between a shaking video and a movingsubject. This is determined by whether all objects within theimage are moving in the same direction or if they are movingin different directions.
Fuzzy logic technology, when combined with an infraredray detector, can be used to assist an air conditioner inefficiently cooling the occupants of a room throughknowledge of the current temperature and the number ofoccupants and their positions. The rotating infrared raydetector creates a two-dimensional thermal image with each
felement given a temperature value. The fuzzy logic algorithmthen performs three tasks – removing the background,identifying each occupant, and expanding the region of eachoccupant. In order to isolate the occupants from thebackground, the algorithm identifies areas where the averagetemperature for that group of elements is higher than a setvalue. Given that a peak temperature would represent eachoccupant, the algorithm identifies elements whosetemperature is higher than the eight elements surrounding itand assigns each of these peaks a number to identify thenumber of occupants. The algorithm then expands the areacovered by each occupant by lowering the thresholdtemperature in order to expand the area covered withoutincreasing the number of peaks.
Fairhurst and Lin (1985) discuss the application of fuzzymethodology in tunnel support design. According to theauthors, ‘a decision system for tunnel support design allowsquestions to be posed and answered in relation to theinformation stored in a rafael design knowledge base.’ Suchsystems will be successful depending on their ability toextract information from geology, rock mechanics, and tunneltechnology and translate it into a form or forms that help theuser to make a more intelligent decision for tunnel design.The study presents a preliminary discussion of approaches tothe development of such systems.
Fuzzy logic technology can be used to compensate forfriction in machinery. Friction is based on both the positionand the velocity of an object and is difficult to predict with anaccurate model (Liu et al., 2006). However, due to the largeimpact of friction at low velocities, developing such a model isimportant. Experts designed a fuzzy logic control toapproximate such phenomena. A fuzzy logic system has alsobeen used to identify suitable advisors for call centrecustomers. According to Shah et al. (2006), companies areaware that a happy customer can lead to repeated business. Itis therefore important to match the correct advisor to eachcustomer. There are five behaviour dimensions of the advisorthat can influence customer satisfaction; these include mutualunderstanding, authenticity, extra attention, competence, andmeeting minimum standards. Different customers would reactin different ways to each of these, so it is important to knowwhich will work best for each demographic of customer.Fuzzy logic can be used to infer the goals of the users. Todevelop such a system, the company must collect data, clusterand analyse the data, identify the separate categories,categorize both consumers and advisors, identify the criticalfactors and derive their membership functions, develop if-then rules, implement the fuzzy interference process, test thesystem in a real-world environment, and validate the systemfrom feedback received.
Beynon (2008) discusses the use of fuzzy logic indecision trees. Decision trees allow for greater interpretationof an analysis by humans. The root node of each tree is splitinto leaf nodes to further classify objects. Each leaf node iscreated using fuzzy if-then rules. Decision trees increase theunderstanding of complicated situations and can be applied toa variety of scenarios. Beynon (2008) applies a fuzzydecision tree to the complex situation of company audit feeevaluation.
▲
1014 DECEMBER 2014 VOLUME 114 The Journal of The Southern African Institute of Mining and Metallurgy

Conclusions
The School of Mining Engineering at UNSW Australiaemploys a VR simulator that is used to replicate miningsituations in a comfortable, safe, and forgiving environment.The VR system offers many benefits to its users, includingflexibility in time and place, and the rate and privacy of thelearning experience. The system has a variety of uses,including the development of understanding and theretention of learning, customized on-the-job training, faultfinding, easy communication of complex data, evaluation ofthe consequences of poor decision-making, traineeassessment, identification of flaws in training programmes,and accident identification and reconstruction.
The modules developed at the School can immenselybenefit from the use of both AI and fuzzy logic technologies.In order to improve the interactive feature of the system, theuser must be able to control the system in a more naturalwway. Currently, all the modules are operated in the AVIEthrough an iPad environment. However, speech and gestureare the most natural way in which humans interact withothers. According to iCinema (2012), a motion capturefunction that can recognize the gestures of up to five peopleat once is currently offered by the AVIE system. However, thecurrent mining simulations do not utilize this feature.Integrating this feature will definitely improve the interactionin the AVIE facility and will add more realism required specif-ically for training effectiveness in this environment. Toreduce the word error rate for this new function, the controlcould be initially limited to a number of key phrases.
Using a similar technology as in air conditioners, infrareddetectors can track the movement of people in thisenvironment and then through the use of AI make changes tothe way the module operates. As an example, differentactions by a group of trainees can lead to different outcomes.Another application of this technology is in the ViMINEmodule. This module involves decision-making based oninput from the user.
An overview of the historical and current uses of AI andfuzzy logic technologies, as well as how each form ofcomputing works, has been conducted, and some applicationsof both AI and fuzzy logic provided. From this study, it canbe seen that there is a lot of opportunity for applying AI andfuzzy logic technologies to the current VR technology used atthe School in order to benefit learning and teaching. Furtherdetailed studies will look into the specifics of how thesetechnologies could be integrated into the current system. Apilot study will initially be conducted on one of the modulesto test the feasibility of this integrated technology.
References
ALTMAN, T., HUGHES, T., and WALAWW , A. 1988. Mine ventilation expert system.
Applied Artificial Intelligence, vol. 2, no. 3–4. pp 265–276.
BANDOPADHYAY, S. and VENKATASUBRAMANIANVV , P. 1986. A fault-diagnostic expert
system for longwall – shearer. 21st International Symposium on the
Application of Computers and Operations Research.
BEARMAN, R.A. and MILNE, R.W. 1992. Expert systems: opportunities in the
minerals industry. Minerals Engineering, vol. 5, no. 10–12.gg
pp. 1307–1323.
Beynon, M.J. 2008. The application of fuzzy decision trees in company audit
fee evaluation: a sensitivity analysis. Soft Computing Applications in
Business. Prasad, B. (ed.). Springer, Heidelberg.
BEZDEK, J.C. 1996. A review of probabalistic, fuzzy, and numerical models for
pattern recognition. Fuzzy Logic and Neural Network Handbook. Chen,
C.H. (ed.). McGraw Hill, New York.
BROOKFIELD, S.D. 1990. The Skillful Teacher. Jossey-Bass, San Francisco, USA.
CASTILLO, O. and MELIN, P. 2008. Type-2 Fuzzy Logic: Theory and Applications.
Springer, Berlin.
DELIORMANLı, A.H., KıZıL, M.S., SAYDAM, S., and KÖSE, H. 1995. Marble quarry
design using expert system. y14th International Mining Congress of Turkey
(IMCET 1995), Ankara, Turkey, 6–9 June 1995.
DENBY, B. and KIZILKK , M.S. 1991. Application of expert systems in geotechnical
risk assessment for surface coal mine design. International Journal of
Surface Mining and Reclamation, vol. 5, no. 2. pp. 75–82.
FAIRHURST, C. and LIN, D. 1985. Fuzzy methodology in tunnel support design.
Research and Engineering Applications in Rock Masses. Proceedings of
the 26th US Rock Mechanics Symposium, Accord, MA. Ashworth, E.
(ed.). International Publishers Services. pp. 269–278.
FAURE, R.M., MASCARELLI, D., ZELFANI, M., CHARVERIAT, L., GANDAR, J., and
MOSURE, O. 1991. XPENT – An expert system in slope stability. Artificial
Intelligence and Civil Engineering. Topping, B.H.V. (ed.). Civil-Comp
Press, Edinburgh. pp. 143 – 147.
FOLORUNSO, I.O., ABIKOYE, O.C., JIMOH, R.G., and RAJIRR , K.S. 2012. A rule-based
expert system for mineral identification. Journal of Emerging Trends in
Computing and Information Sciences, vol. 3, no. 2. pp. 205–210.
GRZYB, J. 2005. Artificial intelligence in games. Software Developer’s Journal,
June 2005.
HEBBLEWHITE, B., MITRA, R., and SAYDAM, S. 2013. Innovative mine safety
training and mining engineering education using virtual reality. 23rd
World Mining Congress, Montreal, Canada, 11–15 August 2013.
HECKERMAN, D.E, HORVITZ, E.J., and NATHAWANI, B.N. 1992. Towards normative
expert systems: Part I The Pathfinder Project. Methods of Information
Medicine. http://research.microsoft.com/en-us/um/people/horvitz/
toward_normative_systems_mim.pdf
ICINEMA. 2012. http://www.icinema.unsw.edu.au/
JONSSON, A., MORRIS, P., MUSCETTOLA, N., and RAJANRR , K. 2000. Planning in
interplanetary space: theory and practice. Artificial Intelligence Planning
Systems Conference Proceedings. https://www.aaai.org/Papers/AIPS/
2000/AIPS00-019.pdf
Can artificial intelligence and fuzzy logic be integrated into virtual reality applications?
The Journal of The Southern African Institute of Mining and Metallurgy VOLUME 114 DECEMBER 2014 1015 ▲

Can artificial intelligence and fuzzy logic be integrated into virtual reality applications?
KAPAGERIDISKK f, I.K. 2002. Artificial neural network technology in mining and
environmental applications. Proceedings of the 11th International
Symposium on Mine Planning and Equipment Selection (MPES). VSB
Technical University of Ostrava, Prague.
KISKOKK , S. 2005. Fuzzy logic and its practical use in mass transit systems.
http://www.skisko.blogsport.com.au/2005/06/fuzzy-logic-and-its-
practical-use-in.html
KIZILKK , M.S., KIZILKK , G., TATAR, C., and KOSE, H. 1995. The use of advanced
technology in mining. Madencilik/Mining Magazine, June. pp. 39–47.
KNOBLOCHKK , A., BARTH, A., ROSCHER, M., ETZOLD, S., and NOACK, S. 2013.
Advangeo-creation of mineral prospectivity maps by artificial neural
networks: methodology, experiences, results, applications.
http://www.beak.de/beak/sites/default/files/content/2_Company/10_Publi
cations/43_CAG24_2013_Abstract_advangeo_v.1.0.pdf
KOSKO, B. 1999. The Fuzzy Future. Harmony Books, New York.
KRUSEKK , F.A., LEFKOFF, A.B., and DIETZ, J.B. 1993. Expert system-based mineral
mapping in northern Death Valley, California/Nevada, using airborne
visitble/infrared imaging sprectrometer (AVIRIS). Remote Sensing of
Environment, vol. 44, no. 2–3. pp. 309–336.tt
LITTMAN, M.L., KEIMKK , G.A., and SHAZEER, N.M. 1999. Solving crosswords with
PROVERB. http://www.aaai.org/Papers/AAAI/1999/AAAI99-135.pdf.
LIU, Y., GAO, X.Z., and WANGWW , X. 2006. Soft computing in accuracy
enhancement of machine tools. Applications of Soft Computing: Recent
Trends. Tiwari, A., Knowles, J., Avineri, E., Dahal, K., and Roy, R. (eds.).
Springer, Heidelberg. pp. 57–67.
MEYERS, C. and JONES, T. 1993. Promoting Active Learning: Strategies for the
College Classroom. Jossey-Bass, San Francisco, CA.
MITRA, R. and SAYDAM, S. 2011. Using virtual reality for improving health and
safety of mine workers and improving engineering education in Australia.
Proceedings of the 34th International Conference of the Safety in Mines
Research Institute, New Delhi, India. pp. 625–636.
MORIN, M.A. 2001. Underground Hardrock Mine Design and Planning - A
System’s Perspective. PhD Thesis. Queen’s University. Kingston, Ontario.
POMERLEAU, D. 1989. ALVINN, an autonomous land vehicle in a neural network.
Computer Science Department, Carnegie Mellon University. Paper 1878.
http://repository.cmu.edu/compsci/1875
RAMESHRR , A.N., KAMBHAMPATIKK , C., MONSON, J.R.T., and DREW, P.J. 2004. Artificial
intelligence in medicine. Annals of The Royal College of Surgeons of
England, vol. 85, no. 5, Sep. 2004. pp. 334–338.
ROMANS, B. 1993. The potential knowledge based systems in the mineral
industry. APCOM 93, Applications of Computers and Operations Research
in the Minerals Industries, Montreal, Canada, 31 October – 3 November.
Canadian Institute of Mining, Metallurgy and Petroleum, Montreal.
RUSSELLRR , S.J. and NORVIG, P. 1995. Artificial Intelligence. Prentice-Hall, Upper
Saddle River, New Jersey.
RUSSELLRR , S. and NORVIG f, P. 2003. Artificial Intelligence: A Modern Approach.
2nd edn. Pearson Education, New Jersey.
SAYDAM, S., MITRA, R., and RUSSELLRR , C. 2011. A four dimensional interactive
learning system approach to mining engineering education. fProceedings of
the Second International Future Mining Conference, Sydney, Australia,
22–23 November 2011. Saydam, S. (ed.), pp. 279–286.
SCHOFIELD, D. 1992. Surface mine design using intelligent computer techniques.
PhD thesis, University of Nottingham.
ScienceDaily. 2014 http://www.sciencedaily.com/articles/a/artificial_
intelligence.htm
SHAH, S., ROY, R., and TIWARI, A. 2006. Development of fuzzy expert sysem for
customer and service advisor categorisation within call centre
environment. Applications of Soft Computing: Recent Trends. Tiwari, A.,
Knowles, J., Avineri, E., Dahal, K., and Roy, R. (eds.). Springer,
Heidelberg. pp. 197–206.
SHAPIRO, S.C. and ECKROTH, D. 1987. Encyclopedia of Artificial Intelligence.
Wiley, New York.
SHARPLES, M. 1996. Human - computer interaction. Artificial Intelligence.
Boden, M.A. (ed.). Academic Press, London. pp. 293–323.
STOLCKE, A. 1997. Linguistic knowledge and empirical methods in speech
recognition. AI Magazine, vol. 18, no. 4. http://www.aaai.org/ojs/
index.php/aimagazine/article/view/1319/1220
STOTHARD, P.M., GALVIN J.M., and FOWLER J.C.W. 2004. Development,
demonstration and implementation of a virtual reality simulation
capability for coal mining operations. Proceedings ICCR Conference,
Beijing, China.
STOTHARD, P., MITRA, R., and KOVALEV, A. 2008. Assessing levels of immersive
tendency and presence experienced by mine workers in interactive
training simulators developed for the coal mining industry. SimTecT
2008, Simulation Conference: Simulation – Maximising Organisational
Benefits, Melbourne, Australia, 12–15 May 2008.
STOTTLER HENKE ASSOCIATES INC. 2005. Artificial Intelligence History.
http://www.stottlerhenke.com/ai_general/history.htm
SPYROPOULOS, C.D. 2000. AI planning and scheduling in the medical hospital
environment. Artificial Intelligence in Medicine, vol. 20, no. 2, Oct. 2000.
pp. 101–111.
TOLL, D.G. 1996. Artificial intelligence applications in geotechnical engineering.
Electronic Journal of Geotechnical Engineering, vol. 1. pp. 767–773.gg
WAKAMIWW , N., NOMURA, H., and ARAKI, S. 1996. Fuzzy logic for home appliances.
Fuzzy Logic and Neural Networks Handbook. Chen, C.H. (ed.). (McGraw
Hill, New York.
WALLERWW , M.D. and ROWSELL, P.J. 1993. Intelligent drilling control. Transactions
of the Institution of Mining and Metallurgy, Section A, vol 103, no. 1–4.
pp. 47–51. ◆
▲
1016 DECEMBER 2014 VOLUME 114 The Journal of The Southern African Institute of Mining and Metallurgy

IntroductionThe key performance indicators (KPIs)described below are established within theframework of the project ‘Demonstration ofProcess Optimization for Increasing theEfficiency and Safety by Integrating LeadingEdge Electronic Information and Com-munication Technologies (ICT) in Coal Mines’.The EU Project OPTI-MINE, with a durationfrom July 2011 until June 2014, is subsidizedby the European Union within the frameworkof ‘Research Fund for Coal and Steel (RFCS)’.
‘OPTI-MINE is a demonstration project,which aims at integrating, installing and op-erating the newest Information andCommunication Technologies (ICT)applications at an industrial-scale andbbringing together all the technical andeconomic data in order to make theirEEuropean-wide implementation in the miningindustry possible but at a minimum risk. Notonly the new ICT applications themselves arebbeing demonstrated, but by integrating the ICTssystems into one common Ethernet (TCP-IP)bbased open network platform of highbbandwidth and standardized configuration(internet technology), information can beexchanged between all applications and
processes. Thus the processes as a whole canbe optimised and the efficiency and safety ofmines will increase considerably.
‘The project covers leading edge ICT forunderground mining processes including lo-gistics, transport, personnel communicationand information by voice and data, machinecommunication, staff localisation, guidanceetc. Individual components developed withinthe project will be integrated into a compre-hensive system where possible. The benefitsdemonstrated by this comprehensive optimi-sation of mining processes are related toconsiderable improvements of efficiency, minesafety, occupational safety and health andenvironmental impacts.’ (OPTI-MINE, n.d.)
The participants are:
➤ Project coordinator:– Evonik Degussa GmbH (EVD) on
behalf of RAG-A, Germany➤ Academic partners:
– Silesian University of Technology(SUT), Poland
– Georg Agricola University of AppliedSciences (DMT-TFH), Germany
➤ Underground coal mines:– RAG Anthrazit Ibbenbüren GmbH
(RAG-A), Germany– Premogovnik Velenje d.d. (PRV),
Slovenia– Hulleras del Norte S.A. (HUNOSA),
Spain– OKD a. s. (OKD), Czechia– Kompania Weglowa S.A. (KWSA),
Poland➤ Suppliers of the new technical
equipment:– Minetronics GmbH (MT), Germany– Asoc. Inv. y Des. Ind. Rec. Nat.
(AITEMIN), Spain.
Key performance indicators – a tool toassess ICT applications in underground coalminesby C. Dauber* and M. Bendrat*
SynopsisImplementing new technologies in industrial operations entails the challengeof measuring the improvements gained by the applied technology.Nevertheless, it is absolutely essential to assess the technical and economicbenefits in objective and comprehensible numbers to create a platform forfurther management decisions. Underground coal mines are characterized bynumerous, quite complex procedures which make it difficult to determine thespecific economic benefit of a new machine, technique, or method. In theOPTI-MINE Project funded by the European Union’s RFCS programme, fiveunderground coal mines applied the latest information and communicationtechnologies (ICTs) to improve efficiency, mine safety, occupational health,and environmental impacts. An integral part of the project is the assessmentof these technologies by using key performance indicators (KPIs). The paperwill describe some examples of the selected KPIs and the preliminary findings.
Keywordskey performance indicators, information and communication technology, ICT-applications, network infrastructure, material tracking, wirelesscommunication.
* Georg Agricola University of Applied Science,Germany.
© The Southern African Institute of Mining andMetallurgy, 2014. ISSN 2225-6253. This paperwas first presented at, A Southern African SilverAnniversary, 2014 SOMP Annual Meeting, 26–30June 2014, The Maslow Hotel, Sandton, Gauteng.
1017The Journal of The Southern African Institute of Mining and Metallurgy VOLUME 114 DECEMBER 2014 ▲

Key performance indicators – a tool to assess ICT applications in underground coal mines
fThe proposed activities of the participating mines havebeen allocated to different clusters. Table I presents a map ofthe activity clusters with names of companies participating ineach kind of activity. Because the backbone for anyapplication is an adequate network infrastructure, a commonfield of interest for all mining companies is the developmentof modern network infrastructure (cluster c1). The otherfields of interest are generally site-specific and reflect theareas that require improvement from the point of the view ofmanagement. These fields of interests have been gatheredand identified in a group of activity clusters.
Key performance indicatorsAs stated in the Grant Agreement of the project, theintroduction of KPIs is essential to evaluate the improvementscreated by new ICTs. KPIs are a set of selected parameters,designated to facilitate the ongoing assessment of an activityand its results. Due to the complex nature of an operationalprocess, the parameters have to be selective. It is essential toselect the most important factors to obtain a reliable and clearvview of the operational process.
Implementing new ICT underground covers a multi-layered process and depends on many parameters with adynamic behaviour. Additionally, the operational settingvvaries as coal mining is not always a steady, well-definedproduction process. Therefore the assessment of ICTimplemented underground is quite a complex task andrequires some simplifications.
Prior to the selection of the KPIs, the academic partnersSUT and DMT-TFH had to determine the generalrequirements that suitable KPIs have to fulfil. Theserequirements are not limited to the coal mining sector; theyare commonly agreed upon in the industry.
➤ Key performance indicators must reflect the operationalgoals
➤ Key performance indicators must be quantifiable bynumbers
➤ Key performance indicators must be free of authori-tative judgements
➤ Key performance indicators must depend on data thatis reasonably easy to obtain.
With regard to their scientific and industrial experience,the academic partners designed a number of KPIs applicablefor the new ICTs and fulfilling the above requirements. TheseKPIs covered technical issues of the technology, parameters
fof the monitored machinery, data concerning the logisticsunderground, and process-related figures. Due to the specificICT installations, the varying operational objectives, and thelocal conditions for each mine, individual KPIs have beendesigned. After an intensive discussion with project partners,some of the drafted KPIs were altered in accordance with therecommendations of the mining companies. There was ageneral commitment that the selected KPIs should describethe status before and after implementing the new technol-ogy. At the end, it was commonly agreed that each mineshould adopt at least three indicators that should cover theessential process improvements gained by the new ICTs.
The determination of KPIs requires a number ofoperational data. The basic requirements for data collectionwere set as follows:
➤ In general, data collection consists of two measuringperiods, one before and one after implementing ICT
➤ Between the two periods, a sufficient testing andtroubleshooting time for implementing the technologyhas to be considered
➤ With regard to the time frame of the project, a thirdperiod of data collection should take place six monthafter the second period. The sustainability of theimprovements will be the focus of this activity
➤ A minimum number of 10 data-sets are required foreach KPI
➤ The data-sets must cover at least one month➤ The partners must check whether operational
deviations regarding the KPIs have occurred. If so, adifferential treatment of the raised data and thecalculation of concerned KPIs must be carried out.
KPIs applied by RAG Anthrazit Ibbenbüren GmbH(RAG-A), Germany
Figure 1 outlines the system structure that RAG-A hasapplied in the cluster ‘Material logistics’.
The technology in this cluster consists of a networkstructure expansion with fibre optic cables (FOCs) in theproduction area ‘Beustfeld’. In addition to 5000 m of FOC and20 FOC distributers, 15 industrial-grade PCs (IPCs) and 9mining infrastructure computers (MICs) have been installed.(Mueller, C. and Hübner, R.) The MICs equipped with RFID
▲
1018 DECEMBER 2014 VOLUME 114 The Journal of The Southern African Institute of Mining and Metallurgy
Table I
Activities of the mining companies in the OPTI-MINEProject
Cluster RAG-A HUN PRV OKD KWSA
c1: network infrastructure x x x x x
c2: material logistic x x x
c3: personnel communication x x x& information
c4: personal tracking x x x x
c5: environment monitoring x x
c6: machine communication x
c7: conveyor monitoring x xx Figure 1—Process for tracking transport units and attached material atRAG-A (Kuschel and Misz, 2013)

readers are able to detect and utilize the passive tags. TheRFID tags are affixed to the transport units to enable theirlocation to be tracked.
The informative link between the transport unit, forexample the number ‘370’, and the loaded material isexecuted with an additional barcode label attached to thetransport unit. The information from these two differentlabels is interconnected (marriage) before the transport unitarrives at the shaft.
One KPI is called ‘Specific transport performance indicator(TPI)’ and is aimed at indicating the productivity of thewworkforce engaged in the transport of the material units.
KPI: ‘TPI’ Specific transport performance indicator in1/MS (Man Shift)
[1]
TPI: Specific Transport Performance Indicator [-]nTU: Number of delivered Transport-Units per month [-]nMS: Number of required Man-Shifts per month [-]
Preliminary findingsThe objective of the improved process is increased produc-tivity, i.e. the maximization of TPI. The coal mine RAG-AIbbenbüren has collected the relevant data for the newmining area, the ‘Beustfeld’ (Figure 2), which has beenequipped with the new ICT system. Additionally, this datahas been recorded for the mine in total (Figure 3).
As shown in Figure 3, the specific transport performanceindicator for the mine in total comes to about 2.3, i.e. eachwworker employed for transport (monorail driver, handlingpeople etc.) moves 2.3 transport units per shift. In theBeustfeld area (Figure 2), which is completely equipped withthe new technology, this indicator ranges around 3. Theperformance in the Beustfeld is thus about 30% higher thanin general. Despite some other parameters that may have aninfluence, this is a clear indication that the new ICT systemmakes a valuable contribution to the productivity of thewworkforce underground.
Another applied KPI refers to the amount of informationthe new technology is providing to the operator. Theparameter for this KPI is the location of the transport unit,and the aim is to know the actual position of each unit atevery time.
KPI: ‘IITUII ’ Average Increase of the level of informationabout locations of Transport-Units in percent:
[2]
IIITUII : Average Increase of the level of Information aboutthe locations of Transport Units underground [%]
nTUa: Mean Number of known locations of TransportUnits, referred to the specific mining area, afterimplementation of new ICT
nTUb: Mean Number of known locations of Transport-Units, referred to the specific mining area, beforeimplementation of new ICT
PPreliminary findingsThe objective of optimization is a positive IITUII as this
f findicates an improved level of information about the locationof the transport units underground. Table II represents therecorded data, starting in May 2012 when the newtechnology was not yet in place. In this month the operatorreceived in average of 2.17 known locations of a transportunit underground. After implementing the new ICTtechnology in the Beustfeld area, this figure ranged between3.01 in February 2013 and 5.14 in August 2013.
The IITUII (column 5 of Table II) shows the operatorreceives on average 60% more information about the locationof the transport units. This is a very welcome improvement.A widely branched coal mine is often called a ‘black hole’ dueto the fact that knowledge about numbers of units, theirlocation, and content is often very limited. Less informationleads to failed, missed, or dispensable transports.Furthermore, it will reduce the productivity of monorails andoperators, as their capacity is not properly matched by thedispatching system.
The recorded increase in the level of information is verywell in line with the findings of the previously described KPI‘TPI’ (Specific Transport Performance Indicator). It is a strongindication that the new technology leads to significantimprovements to the operational process of material logistics.
Cost saving, not a KPI, but most important for miningcompanies
Another parameter, which was not selected initially, shouldbe mentioned. Owing to the new ICT, it is possible to locatethe IPC necessary for the control of the longwall faces onsurface. In consequence a flame-proof version is not requiredand maintenance etc. is less complex. The Ibbenbüren coalmine started in 2010 with four IPCs under-ground at anexpenditure of 159.124 Euro (Table III). In 2013 all theseunderground IPCs were replaced by IPCs on surface. These
Key performance indicators – a tool to assess ICT applications in underground coal mines
1019The Journal of The Southern African Institute of Mining and Metallurgy VOLUME 114 DECEMBER 2014 ▲
Figure 2—Specific transport performance indicator TPI for theBeustfeld area (Kuschel and Misz, 2013)
Figure 3—Specific transport performance indicator TPI for the mine intotal (Kuschel and Misz, 2013)

Key performance indicators – a tool to assess ICT applications in underground coal mines
fIPCs come to 5944 Euro each, which is about 15% of theprice of an IPC underground. Consequently, a cost savingindicator, SIPC, was introduced, which indicates a saving of85%. That does not take into account the reduced effort forinstallation, maintenance, and the improved reliability.
KPIs applied by Hulleras del Norte S.A. (HUNOSA),SpainHUNOSA expects that the new ICT system will have aninfluence on the performance of extraction functions,including secondary/auxiliary ventilation and haulage of coalby belt conveyors. The main reasons for production orhaulage disturbances are breakdowns resulting frommechanical or control systems failures. The new ICT systemshould improve extraction, conveying, and lead to better useof time during production shifts. The new networkinfrastructure for communication and information is shownin Figure 4.
HUNOSA stated that KPIs should be related to theaverage time required to rectify a breakdown affecting theextraction process or the horizontal conveying, i.e. mean timeto repair (MTTR). The introduction of the new ICT system will
f fdeliver a level of information at the control room which ismore accurate in time and more detailed than previously. It isexpected that this will facilitate remote diagnostics, which incombination with better communication will reduce theMTTR.
KPI: ‘DMTTR’ Decrease of MTTR (Mean Time to Repair),caused by breakdowns, either mechanical or due toa failure of the control systems
[3]
DMTTR Decrease of MTTR after implementation of the newICT [%]
MTTRa MTTR after implementation of new ICT [h]MTTRb MTTR before implementation of new ICT [h]
MTTR represents the average time required to repair afailed device. The data sampling refers always to one month.
[4]
▲
1020 DECEMBER 2014 VOLUME 114 The Journal of The Southern African Institute of Mining and Metallurgy
Table II
Number of known locations of transport units in the Beustfeld area (Kuschel and Misz, 2013)
Reference value 2012 May
Sum Sum nTUb
Locations AP 13/12 AP > 30 Recorded tags
May-12 941 433 2.17
Sum Sum nTUa IITU (%) Remarks
Locations AP 12/15 AP > 30 Recorded tags
Nov-12 328 154 2.13 -1.99 Software updateDec-12 973 378 2.57 18.45 TestJan-13 1740 613 2.84 30.61 Commissioning and testFeb-13 1799 597 3.01 38.66 AP12: antenna does not sendMar-13 2019 601 3.36 54.58 AP12: antenna does not sendApr-13 2267 591 3.84 76.51 AP: 70 addedMay-13 1962 552 3.55 63.55Jun-13 2924 684 4.27 96.71Jul-13 2657 718 3.70 70.28Aug-13 3576 696 5.14 136.42Sep-13 3272 701 4.67 114.78Oct-13 2522 690 3.66 68.19 AP: 35 addedNov-13 3244 702 4.62 112.64Dec-13 2782 606 4.59 111.24 Optimization shaft entryJan-14 2718 765 3.55 63.49 State 30.01.2014
2782 606 4.59 111.242718 765 3.55 63.49
Table III
Expenditure for IPC underground and on surface (Kuschel and Misz, 2013)
Number of IPC Number of IPC Expenses IPC Expenses IPC Expenses IPC Expenses IPCunderground on surface underground on surface before ICT-Inst. after ICT-Inst.
2010 4 0 39.781 € 5.849 € 159.124 € 159.124 €2011 3 1 43.987 € 5.908 € 159.124 € 137.869 €2012 2 2 43.987 € 5.944 € 159.124 € 99.862 €2013 0 4 43.987 € 5.944 € 159.124 € 23.776 €

PPreliminary findings➤ MTTRb ranges between 3 and 7 hours (when expert
staff necessary must go on the next shift to resolve aproblem), with an average of 5 hours
➤ MTTRa ranges between 2 and 5 hours (when expertstaff help to resolve a problem during the shift with thehelp of ICT technologies), with an average of 3.5 hours
➤ DMTTR ranges between 33% and 28%, with an averageof 30%.
The objective is the maximization of DMTTR, as thisindicates a decrease of the mean time required to repair afailed device. The calculated value of the KPI shows the posi-tive impact of the ICT for a failure-reduced operation.
KPIs applied by Premogovnik Velenje d.d. (PRV),SloveniaAt the current stage of implementing the new ICTinfrastructure at the Velenje mine, a LAN/WLANinfrastructure has been installed in one longwall area. Thespecific objective is to facilitate wireless communicationbetween workforce and staff at all important places at thelongwall, at the head- and tailgate, and in the surroundingwworkings. Some details of this network are shown inFigure 5. Improved personal communication methods areexpected to improve transport performance (in terms ofincreased efficiency or reduce labour consumption) andreduce downtimes as a result of faster response time.
The following described KPI is aimed at measuring thedecrease in time required to reach a person.
KPI: ‘DRT’ Average decrease of time to reach a person,%:
[5]
DDRT Average decrease of time to reach a person [%]tRTbt Mean time to reach a person before implementation
of new ICT [min]
tRTat fMean time to reach a person after implementationof new ICT [min.
➤ Explanation:– Mean values should be determined by two test
series, one for the day shift and one for theafternoon shift
– The central control room should make about 10attempts to contact a fitter or an electrician
– The time from the first request until reaching theperson is to be captured. Both tests should cover aperiod of 5 days minimum.
Preliminary findings
Figure 6 shows the measured response times for twodifferent coal faces:
Key performance indicators – a tool to assess ICT applications in underground coal mines
The Journal of The Southern African Institute of Mining and Metallurgy VOLUME 114 DECEMBER 2014 1021 ▲
Figure 4—Network infrastructure at the Hunosa Mines, Shaft Montsacro and San Nicolas (Garcia José, González Ruisánchez, and Rodri-guez, 2013)
Figure 5—Network infrastructure at the face Fk.-65, Velenje Mine(Krenker and Skarja, 2013)

Key performance indicators – a tool to assess ICT applications in underground coal mines
➤ fCoal face ‘G3/C’ without ICT—Face length was 177 m,total length 675 m, average seam thickness 5.14 m,average efficiency (productivity) was 145 t per manand shift
➤ Coal face ‘Fk.-65’ with ICT‚ Face width was 154 m,length 480 m, average thickness 6.20 m, averageefficiency (productivity) was 112 t per man and shift
The objective is the maximization of DRT, as thisindicates the reduced time required to reach a craftsman inthe longwall area. With regard to the successful attempts, thecalculated value of DTR is 82%, which is a welcomeimprovement
Another KPI is aimed at measuring the ratio of successfulcall attempts. This should indicate the range of the WLANnetwork in the face area and the reliability of the installeddevices.
KPI: ‘RSC’ Average ratio of successful call attempts to aperson equipped with VoIP phone or smartphonewhen within the range of the wireless communi-cation network
[6]
RRSC Average ratio of successful call attempts [%]nSC Number of successful call attemptsnTC Total number of call attempts.
Voice communication within the range of wirelessnetwork should in principle allow immediate contact to aperson equipped with a VoIP phone or smartphone. In realconditions, some gaps may occur and a connection may notbe established at some moments. This factor is incomparablewwith the state-of-the-art before and after implementation, butdescribes the reliability of the system and also reflectscoverage failures of the wireless network. Measuring thisfactor could also help to determine areas where the systemefficiency is low and requires, for instance, a denser node net.
PPreliminary findings
The objective is the maximization of RFCRR . The collected dataindicates a RFCRR of 77%, which shows the positive impact ofthe ICT on the time required to reach a person but alsoindicates that there is room for improvement.
Summary and outlookIn the demonstration project OPTI-MINE, funded by theEuropean Union’s RFCS programme, five underground coalmines have applied the latest information and commu-nication technologies (ICTs) to improve efficiency, minesafety, occupational health, and environmental impacts oftheir operations. The improvements set by these technologies
fhave been assessed with key performance indicators. Some ofthe KPIs cover transport performance, the increase of thelevel of information, the decrease of mean time to repair, theaverage decrease of time to call a person, and cost savings.The preliminary results give clear evidence that the newenhanced ICT will positively impact mine productivity andmine safety.
The research leading to these results was supported bythe European Unions’s Research Fund for Coal and Steel(RFCS) research programme under grant agreement No.RFCP-CT-2011-00001. (Malesza, A. and Szarafinski, M. andStrozik, G.)
References
ALLEKOTTE, K.G. and PAVLIK, R. 2012. Train tracking and driver communication
CSM Mine. 1st OPTI-MINE Industry Forum, Ostrava.
GARCIA JOSÉ, G., GONZÁLEZ RUISÁNCHEZRR , J.R., and RODRIGUEZ, A. 2013.
Demonstration of process optimization for increasing the efficiency and
safety by integrating leading edge electronic information and communi-
cation technologies (ICT) in coal mines. OPTI-MINE, 5th CoordinationMeeting, Madrid.gg
KRENKERKK , M. and SKARJA, B. 2013. Personal communication and mine safety
integration in an underground lignite mine with very thick seam and large
production capacity, OPTI-MINE, 5th Coordination Meeting, Madrid.gg
KUSCHELKK , B. and MISZ, T. 2013. RFID transport capacity tracking and longwall
control underground, OPTI-MINE, 4th Coordination Meeting, Osnabrück.gg
MALESZA, A. and SZARAFINSKI, M. Monitoring of the mine personnel’s
movements in the areas with increased hazard 2013. OPTI-MINE, 5thCoordination Meeting, Madrid.gg
MUELLER, C. and HÜBNER, A. 2013. MineTronics activities by work packages.
OPTI-MINE, 5th Coordination Meeting, Madrid.gg
OPTI-MINE. Not dated. http://www.opti-mine.eu/project_objectives.php
STROZIK, G. 2013. Assessment of performance and project result. OPTI-MINE,4th Co-ordination Meeting, Osnabrück.gg ◆
▲
1022 DECEMBER 2014 VOLUME 114 The Journal of The Southern African Institute of Mining and Metallurgy
Figure 6—Time to reach a person at two different coal faces, Velenje Mine (Krenker and Skarja, 2013)

IntroductionRock mechanics, and therefore geomechanics,is a relatively young subject compared to soilmechanics in geotechnical engineering.Suorineni (2013a) discussed in detail thedifference between geomechanics andgeotechnical engineering. Most failure criteriaand test procedures in rock mechanics areadopted from soil mechanics and themechanics of solids such as steel. The Mohr-Coulomb failure criterion (Mohr, 1900) is onesuch example and remains popular in rockmechanics today. Approaches to rock testing(such as triaxial testing) are adopted from soilmechanics. However, there is a fundamentaldifference between soil, concrete, steel, androck, and in particular between soil and rock.Craig (1982) defines soil as any uncementedor weakly cemented accumulation of mineralparticles formed by the weathering of rocks,the void space between the particles containingparticles and/or air. On the other hand, ingeology, a rock is a naturally occurring solidaggregate of one or more minerals ormineraloids (http://en.wikipedia.org/wiki/Rock(geology)). The key words in these definitionsare ‘uncemented’ and ‘aggregate’ for soil androck respectively. These keywords explain why
f fa failure criterion for soils such as the Mohr-Coulomb failure criterion (Equation [1]) willwork for soils, but is not applicable to rock.
[1]
where τ is the shear strength, c is cohesion,and φ is angle of internal friction.
As noted by others (e.g. Hajiabdolmajidgg etal., 2000) Equation [1] implies that the shearstrength of soil is determined by simultaneousmobilization of its cohesive resistance andfrictional resistance. This is correct for‘uncemented’ materials such as soil, butincorrect for an ‘aggregate’ of particles orminerals as in rocks. In the latter case thebond (cohesion) between the minerals need tobe broken to generate frictional resistance andtherefore the cohesive and frictional strengthcomponents cannot be simultaneouslymobilized. Hence, some adoptions ofexperience in soil mechanics into rockmechanics can be misleading.
While soil and steel can be assumed tosatisfy the criteria of continuity, homogeneity,isotropicity, linearity, and elasticity (CHILE),applying these assumptions to the rock leadsto difficulty. Müller (1966) was first torecognize that the rock mass is a discon-tinuum, and has continuously emphasized theimportance of geology in rock mechanics orgeomechanics throughout his distinguishedlife and career. In 1988, Muller wrote:
‘Geology is the indispensable base of allthe applied geosciences. Therefore, never RockMechanics without Engineering Geology; …But should I become confronted with thealternative: Rock Mechanics withoutEngineering Geology or Engineering Geology
Geomechanics challenges of contemporarydeep mining: a suggested model forincreasing future mining safety andproductivityby F.T. Suorineni*, B. Hebblewhite*, and S. Saydam*
SynopsisThis paper pays tribute to the pioneers in geomechanics, and addressessome of the most pressing issues of our time related to deep mining, andhow to mitigate these issues. Solutions developed by our predecessors seemto have reached their limits as mines continue to go deeper. TheInternational Society for Rock Mechanics (ISRM) guidelines for rock masscharacterization for excavation design also require re-thinking to reflectcurrent knowledge and experience. Thus, a whole new approach is urgentlyrequired to increase mine safety and productivity. The paper will draw onthe challenges and experiences in medicine and science that have beenovercome through genuine collaboration, advances in technology, andimpressive funding, which can be adopted to provide solutions to contem-porary geomechanics challenges for increased safety and productivity asmines continue to go deeper.
Keywordspioneers in geomechanics, pressing issues, new thinking, collaboration.
* UNSW Australia School of Ming Engineering,Australia.
© The Southern African Institute of Mining andMetallurgy, 2014. ISSN 2225-6253. This paperwas first presented at, A Southern African SilverAnniversary, 2014 SOMP Annual Meeting, 26–30June 2014, The Maslow Hotel, Sandton, Gauteng.
1023The Journal of The Southern African Institute of Mining and Metallurgy VOLUME 114 DECEMBER 2014 ▲

Geomechanics challenges of contemporary deep mining
without Rock Mechanics, I would choose the latter being thelesser evil. I am saying so as an Engineer, as a RockMMechanics too.’ Müller (1988).
On the passing of Dr J.A. Franklin in June 2012, ProfessorM.B. Dusseault sent out the following message:
‘… John profoundly understood the intersection betweengeosciences and rock engineering, an attitude that pervadedhis career.’
Franklin (1993) wrote: ‘Empirical methods often prove“closer” to the “truth” than the apparently more precisepredictions of theoretical analysis, … based on real dataempirical methods provide a standard against whichtheoretical predictions are measured and can be judged.’
Similarly, Mathews et al. (1981), in developing thestability graph, stated that empirical methods based on back-analysis are powerful predictive tools, particularly ifcombined with numerical modelling and analysis techniques.Note that this statement regards theoretical predictions assupporting tools rather than stand-alone tools.
The importance of geology in rock mechanics,geomechanics, or geotechnical engineering cannot beoveremphasized. This fact is underlain by the complexity ofthe rock mass as opposed to soil, concrete, or steel. Thecomplexity of the rock mass cannot be fully accounted for inour constitutive models that underlie numerical models.WWhile these numerical models can be tricked into giving usthe answers we want, the rock mass is so idiosyncratic that itwwill behave in the manner it wants. Müller (1988) noted thatthe dominating geological conditions at site do not care whatkind of theoretical ideas we may have and what our economicsituation may be. He continued to state that the rock masswwill act in the way that is predetermined by geologicalconditions on the one hand, as well as by the manner inwwhich we treat it during excavation and support.
Pells (2008) posed the ultimate question: ‘what happenedto the mechanics in rock mechanics and the geology inengineering geology?’ Pells’s question separated rockmechanics and engineering geology and treated themindependently. As shown above, rock mechanics cannot betreated from the purely mechanistic viewpoint without dueconsideration to the underlying geological complexities of therock mass. As rightly pointed out by Peck (see Müller, (1988)‘where has all our judgement gone?’ According to Peck, agood rock mechanics engineer should have good intuition toguide his decisions – a characteristic that the majority of theyyoung generation of engineers today lacks, as a consequenceof deficient knowledge in geology and field experience. Peck’sconcern is re-echoed by Karl Terzaghi: ‘The geotechnicalengineer should apply theory and experimentation but temperthem by putting them into the context of the uncertainty ofnature. Judgement enters through engineering geology.’
At the 44th United States Rock Mechanics Symposium,wwhich was also the 4th United States-Canada Rock MechanicsSymposium, a pre-conference workshop was organized withinvited panellists including Don Banks, William Pariseau,Maurice Dusseault, John Curran, Richard Goodman, andCharles Dowding, with Priscilla Nelson as moderator, topresent their perspectives on the important achievements ofrock mechanics and engineering in the past 50 years, and toidentify what we did not achieve. The most common issueand problem identified was the deficiency in the training of
frock mechanics engineers today. That deficiency is theabsence of sufficient geology in the curricula of civil andmining engineering programmes.
It cannot be overemphasized that the great pioneers ofrock mechanics, geomechanics, and engineering geology(including Karl Terzaghi, Ralph Peck, Leopold Muller, EvertHoek, John Franklin, Denis Laubscher, Nick Barton, Z.T.Bieniawski, and Rimas Pakalnis) recognized the importanceof geology, observed and learnt from the idiosyncratic rockbehaviour, and guided by their intuition managed todiscipline it. Empirical methods are the outcome of patientobservations, intuition, and a keen interest in geology.
This paper pays tribute to these great men, but recognizesthat although their contributions worked well to solve theproblems of their time, they have now reached their limitsand new thinking is urgently required. The paper draws onlessons from medicine and science to suggest that forsignificant breakthroughs in rock mechanics orgeomechanics, genuine multidisciplinary approach supportedby generous funding and rigorous overview is required. Thenext sections address these requirements in detail.
Empirical methods – state-of-the-artThe following empirical methods are discussed in view oftheir popularity and widespread use in geomechanics:
(i) The Rock Mass Rating (RMR) system (Bieniawski,1973)
(ii) The Laubscher rules in block cave mining(Laubscher, 1994)
(iii) The open stope stability graph (Mathews et al.,1981; Clark and Pakalnis, 1997)
(iv) The hard-rock pillar design graph (Lunder andPakalnis, 1997)
(v) The Tunnelling Quality Index (Q) system (Barton etal., 1974)
(vi) The Hoek and Brown failure criterion (Hoek andBrown, 1980).
These methods all depend on proper characterization ofthe rock mass. Critical factors in these methods depend onthe purpose. Such purposes include support selection,caveability prediction, determination of rock mass propertiesfor design, and evaluation of the stability of open stopes. Ineach specific case there are insufficient guidelines from theInternational Society for Rock Mechanics (ISRM) SuggestedMethods for Rock Characterization, Testing and Monitoring(Brown 1981). Obvious difficulties are encountered in thecaveability of rock masses. The ISRM suggestion that inducedfractures be ignored in geotechnical mapping for rock masscharacterization is suspect when the purpose of such amapping is for support selection.
The Rock Mass Rating (RMR) system RMR (Bieniawski 1973) became the most widely acceptedand used rock mass classification system following itsdevelopment in 1973. Its popularity stemmed from the factthat it could be used for excavation design in rock withsignificant capacity to predict excavation stand-up time. RMRwas also adopted by Hoek and Brown (Hoek and Brown,1980) for the determination of the Hoek and Brown failurecriterion parameters. RMR was replaced by the Geological
▲
1024 DECEMBER 2014 VOLUME 114 The Journal of The Southern African Institute of Mining and Metallurgy

Strength Index (GSI) in 1995 (Hoek et al f., 1995) for that rolebecause it became ineffective in performing that function forvvalues of RMR less than about 25.
Various critiques of RMR have been published, out ofwwhich evolved the Modified or Mining Rock Mass Rating(MRMR) system (Laubscher and Taylor, 1976). Milne et al.(1998) outline a chronological development of the methodbetween 1973 and 1989. Within this period the RMR factorshave been modified as more experience in its application wasgained.
Suorineni (2013b) critically re-examined the originalRMR database for its validity, robustness, and applicationindependent of the geological environments or rock types anddepth. The validity of the method with regard to its stand-uptime prediction was also examined. Figure 1 summarizes thecomposition of the RMR database in terms of rock origin aspublished in Bieniawski (1989). The figure shows that theRMR (1989) database consists of 63% sedimentary rocks,17% metamorphic, and 20% igneous rocks. Of the 63%sedimentary rocks, about 45% are shale (Figure 2). Figure 3is a plot of depth against frequency of data points. The figureshows that about 90% of the data came from depths less than500 m below surface.
From Figures 1 to 3 it is obvious that the RMR databasecomprises mainly soft rocks, dominated by shales, fromdepths less than 500 m below surface. The significance ofthis revelation for the composition of the RMR database isdiscussed under the Laubscher block caving rules(Laubscher, 1994, 2001) later in this paper. The implicationof the database as it relates to stand-up time (Figure 4) ofexcavations is discussed here.
Sedimentary rocks, and in particular, shales, aresusceptible to the vagaries of the environment on exposure,depending on their composition. Domination of the RMRdatabase by sedimentary rocks gives logic to the stand-uptime concept. While this may also be true for some igneousrock such as olivine-rich rocks, it is difficult to argue theconcept of stand-up time for excavations in these rocks. Aspointed out by Müller (1988), while timing is important inrock engineering or geomechanics it can hardly be computedor even assessed without deep geological knowledge andintuition. This is further buttressed by the fact that ‘onecannot wait until the rock itself announces its stand-up timeby roof falls and slabbing of the side walls’ (Müller, 1988).One must make decisions before the stand-up time isreached. Isaacson (2007) states that Albert Einstein’s
intelligence and breakthroughs hinged on his ability to mixintuition with a feel for the patterns to be found in experi-mental data. He adds ‘The scientist has to worm thesegeneral principles out of nature by discerning, when lookingat complexes of empirical facts, certain general features.’
Geomechanics challenges of contemporary deep mining
1025The Journal of The Southern African Institute of Mining and Metallurgy VOLUME 114 DECEMBER 2014 ▲
Figure 1—Composition of RMR database by rock type (Suorineni,2013b)
Figure 2—Distribution of RMR database according to sedimentary rocktype (Suorineni, 2013b)
Figure 3—Distribution of RMR database with depth (Suorineni, 2013b)
Figure 4—Stand-up time chart (Barton and Bieniawski, 2008)

Geomechanics challenges of contemporary deep mining
LLaubscher block caving rulesThe Laubscher block caving rules are based on a modifiedRMR, the MRMR. Figure 5 is a chart for predicting the criticalundercut size (hydraulic radius – HR) in a rock mass of givenMRMR quality to induce natural caving under gravity. RMR,and for that matter MRMR, were developed between 1973and 1976 respectively. The recent modification to the MRMRtermed IRMR (Laubscher and Jakubec, 2000) is not signifi-cantly different (Dyke, 2008) from the MRMR. At time ofdevelopment of RMR and MRMR most block caving mineswwere operating at depths less than 450 m (Figure 6). Therocks in the RMR database involved are mainly weak anddominated by shales, with most data coming from depths lessthan 500 m below surface. Block caving mines today arelocated at depths far in excess of 500 m and in metamorphicand/or igneous geological environments. Under theseconditions, stronger rocks at depths will be subjected tohigher confinements and the Laubscher caving rules becomesuspect. It is the opinion of the authors that while the
ffLaubscher caving rules would have been effective at the timeof their development, they have reached their limits incontemporary block caving practice and new thinking isrequired.
The stability graphThe stability graph was developed by Mathews et al. (1981)as a tool for guiding bulk mining methods. It is one of themost discussed empirical methods in geomechanics.Suorineni (2010, 2011, 2012) discusses in detail the modifi-cations to the stability graph since its development in 1981.The paper concludes as follows:
(i) As an empirical method, the reliability of thestability graph method is largely dependent on thesize, quality, and consistency of the database.Hence, there must be consistency in the determi-nation of the stability graph factors and acceptedstope stability state transition zones
(ii) The present tendency for authors to arbitrarilychoose between the original and modified stabilitynumber factors results in incomparable data thatcannot be combined
(iii) The different transition zones produced by differentauthors result in different interpretations of thestability state of stopes
(iv) There is need for factors that account for stopestand-up time, blast damage, and a gravity factorthat is stress-factor dependent
(v) There is a need to develop procedures fordetermining stability of open stope surfaces thatconsist of backfill
(vi) The stability graph should be used with cautionwhen applied to narrow vein orebodies because noversion of the graphs accounts for orebodythickness in the definitions of the stability states.
In addition to these conclusions, some criticisms of thestability graph emanate from authors who do know theassumptions behind the development of the stability graphbut do not know the limits of the database. Suorineni (2010,2011, 2012) discusses in detail the assumptions behind thedevelopment of the stability graph. Obviously, if theunderlying assumptions are understood, there need not becriticism about the stress factor not accounting for tension, orthe stability graph not being applicable to narrow vein stopesand shallow-dipping stopes. Additionally, while open stopemining is limited to good quality rock masses, the methodhas been extended to poor quality rock masses, resulting inunacceptable dilutions for which the method has beenblamed.
A positive contribution to the stability graph is itsquantification by Lunder and Pakalnis (1997). The originaland modified stability graphs are qualitative. A stope isstable, unstable, or caved. The miner is keen to know hisdilution numbers and whether those numbers are acceptableor not. The equivalent linear overbreak slough (ELOS)stability graph introduced by Lunder and Pakalnis (1997)overcame this deficiency. However, it is still uncertain howorebody size is accommodated in the ELOS stability graph.This has implications for the application of the graph to wideand narrow vein situations.
▲
1026 DECEMBER 2014 VOLUME 114 The Journal of The Southern African Institute of Mining and Metallurgy
Figure 5—Laubscher caveability prediction chart (Flores and Karzulovic2003)
Figure 6—Evolution of mining depth with time and RMR and MRMRdatabase (after Brown, 2004)
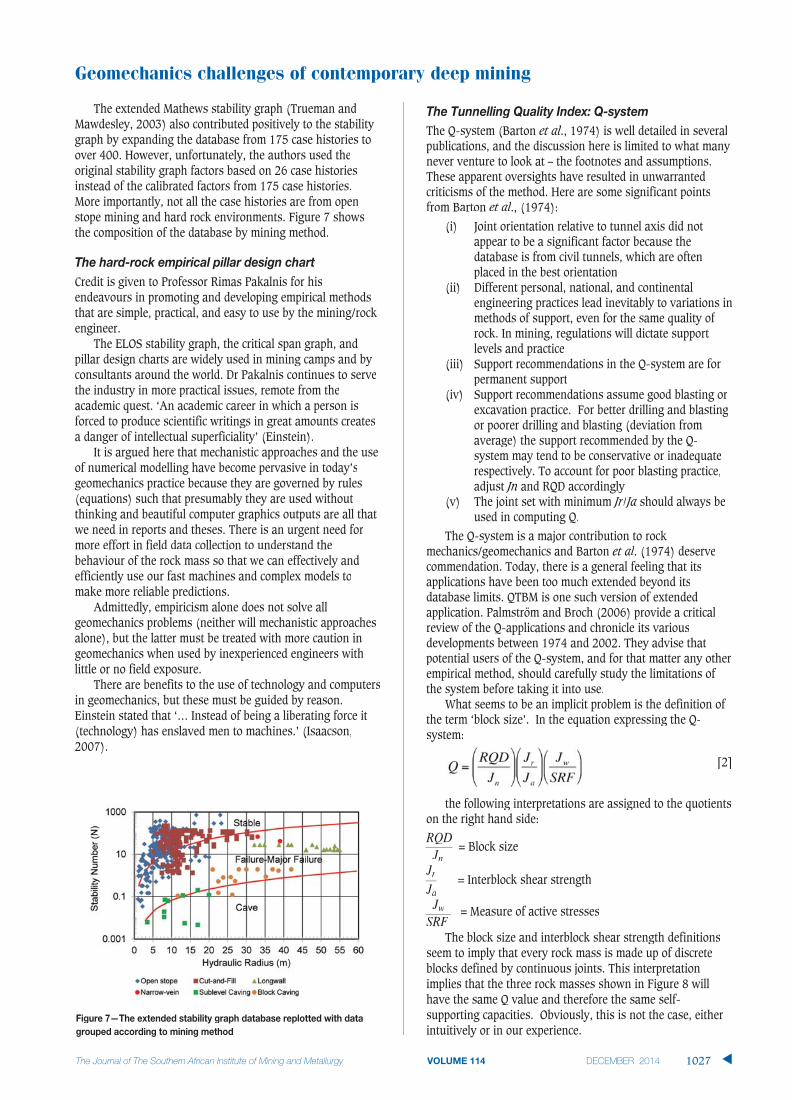
The extended Mathews stability graph (Trueman andMawdesley, 2003) also contributed positively to the stabilitygraph by expanding the database from 175 case histories toover 400. However, unfortunately, the authors used theoriginal stability graph factors based on 26 case historiesinstead of the calibrated factors from 175 case histories.More importantly, not all the case histories are from openstope mining and hard rock environments. Figure 7 showsthe composition of the database by mining method.
The hard-rock empirical pillar design chartCredit is given to Professor Rimas Pakalnis for hisendeavours in promoting and developing empirical methodsthat are simple, practical, and easy to use by the mining/rockengineer.
The ELOS stability graph, the critical span graph, andpillar design charts are widely used in mining camps and byconsultants around the world. Dr Pakalnis continues to servethe industry in more practical issues, remote from theacademic quest. ‘An academic career in which a person isforced to produce scientific writings in great amounts createsa danger of intellectual superficiality’ (Einstein).
It is argued here that mechanistic approaches and the useof numerical modelling have become pervasive in today’sgeomechanics practice because they are governed by rules(equations) such that presumably they are used withoutthinking and beautiful computer graphics outputs are all thatwwe need in reports and theses. There is an urgent need formore effort in field data collection to understand thebehaviour of the rock mass so that we can effectively andefficiently use our fast machines and complex models tomake more reliable predictions.
Admittedly, empiricism alone does not solve allgeomechanics problems (neither will mechanistic approachesalone), but the latter must be treated with more caution ingeomechanics when used by inexperienced engineers withlittle or no field exposure.
There are benefits to the use of technology and computersin geomechanics, but these must be guided by reason.Einstein stated that ‘… Instead of being a liberating force it(technology) has enslaved men to machines.’ (Isaacson,2007).
The Tunnelling Quality Index: Q-systemThe Q-system (Barton et al., 1974) is well detailed in severalpublications, and the discussion here is limited to what manynever venture to look at – the footnotes and assumptions.These apparent oversights have resulted in unwarrantedcriticisms of the method. Here are some significant pointsfrom Barton et al., (1974):
(i) Joint orientation relative to tunnel axis did notappear to be a significant factor because thedatabase is from civil tunnels, which are oftenplaced in the best orientation
(ii) Different personal, national, and continentalengineering practices lead inevitably to variations inmethods of support, even for the same quality ofrock. In mining, regulations will dictate supportlevels and practice
(iii) Support recommendations in the Q-system are forpermanent support
(iv) Support recommendations assume good blasting orexcavation practice. For better drilling and blastingor poorer drilling and blasting (deviation fromaverage) the support recommended by the Q-system may tend to be conservative or inadequaterespectively. To account for poor blasting practice,adjust Jn and RQD accordingly
(v) The joint set with minimum Jr/rr Ja/ should always beused in computing Q.
The Q-system is a major contribution to rockmechanics/geomechanics and Barton et al. (1974) deservecommendation. Today, there is a general feeling that itsapplications have been too much extended beyond itsdatabase limits. QTBM is one such version of extendedapplication. Palmström and Broch (2006) provide a criticalreview of the Q-applications and chronicle its variousdevelopments between 1974 and 2002. They advise thatpotential users of the Q-system, and for that matter any otherempirical method, should carefully study the limitations ofthe system before taking it into use.
What seems to be an implicit problem is the definition ofthe term ‘block size’. In the equation expressing the Q-system:
[2]
the following interpretations are assigned to the quotientson the right hand side:
RQD= Block size
JnJJJrJJ
= Interblock shear strengthJaJJJwJJ = Measure of active stresses
SRFThe block size and interblock shear strength definitions
seem to imply that every rock mass is made up of discreteblocks defined by continuous joints. This interpretationimplies that the three rock masses shown in Figure 8 willhave the same Q value and therefore the same self-supporting capacities. Obviously, this is not the case, eitherintuitively or in our experience.
Geomechanics challenges of contemporary deep mining
The Journal of The Southern African Institute of Mining and Metallurgy VOLUME 114 DECEMBER 2014 1027 ▲
Figure 7—The extended stability graph database replotted with datagrouped according to mining method

Geomechanics challenges of contemporary deep mining
Since most of the initial data came from civil engineeringtunnels, it is not surprising that relative orientation was notconsidered a significant factor for inclusion in the Q-system,since most civil tunnels are aligned in the best orientation forstability. In mining, engineers have no such luxury ofchoosing the drift alignment in the most stable orientation,but often have to deal with the consequences and the effect ofrelative orientation of excavations with geologic structuresthat must be accounted for in stability analysis.
Another implicit problem with the Q-system is thedifficulty in applying it to weak rock masses. In weak rockmasses the Q-system parameters are difficult to determineand excessive deformation may be the mode of failure ratherthan structural or brittle failure. This weakness of the Q-system appears not to be obvious to many users of themethod. Løset (1999) states:
‘The Q-system was primarily suited to hard jointed rocks… but for the classes of poorest rock quality the system hasnot provided detailed description of the supportconstructions. This means that for weak rock masses thedimensioning of the support must usually be verified bynumerical modelling or some other means of calculation.’
Løset (1999) identify six types of weak rock masses asfollows:
(i) Heavily jointed strong rocks (Q<0.01)(ii) Zones with altered or strong rock (squeezing or
swelling may take place)(iii) Weak rocks with joints (young sedimentary rocks
(sandstone) or weakly metamorphic rocks such asshale, slate, or phyllites)
(iv) Weak rocks with excavation-induced fractures (e.g.young homogeneous sedimentary rocks (chalk,sandstone) or low-grade metamorphic rocks (shale,phyllites)
(v) Weak rocks without joints or induced excavationfractures (young homogeneous sedimentary rockssuch as chalk, sandstone, and mudstone)
(vi) Weathered rocks.
The Hoek-Brown failure criterionThe Hoek and Brown failure criterion (Equation [3]) hasdominated the rock mechanics/geomechanics world in termsof use and acceptability.
[3]
where σ1 and σ3σσ are the effective major and minor principalstresses at failure respectively, σcσ is the intact rock uniaxialcompressive strength, and a, mb, and s are constants thatdepend upon the characteristics of the rock mass.
Hoek and Marinos (2007) provide a summary of thevarious modifications to the Hoek and Brown failure criterionand Geological Strength Index (GSI) (Hoek et al. 1995) from1980 to 2006. The most recent version of the Hoek andBrown failure criterion is given in Hoek et al. (2002). In thisupdate, a new parameter referred to as the rock massdisturbance factor (D) is introduced to deal with blast damageand other disturbances. This factor allows for the determi-nation of more appropriate Hoek-Brown parametersdepending on the degree of disturbance inflicted on the rockmass by the excavation method.
The Hoek–Brown failure criterion is based on theassumption that a jointed rock mass is fundamentally weakerin shear than intact rock (Diederichs et al., 2004). Althoughthe Hoek-Brown failure criterion has been widely accepted, itis not free from criticism. Following these criticisms, variousauthors including (Martin, 1994; Pelli et al., 1991; Diederichset al., 2004; Carter et al., 2008) have offered some modifi-cations to the criterion, claiming that it is not universallyapplicable to the full range of rock mass qualities as definedby the GSI.
In 1994 Hoek, in a letter to editor of International Societyfor Rock Mechanics (ISRM) News Journal, wrote:
‘In writing Underground Excavations in Rock 15 yearsago Professor E T Brown and I developed the Hoek-Brownfailure criterion to fill a vacuum which we saw in the processof designing underground excavations. Our approach wasentirely empirical and we worked from very limited data ofrather poor quality. Our empirical criterion and our estimatesof the input parameters were offered as a temporary solutionto an urgent problem.
‘The fact that the criterion works, more by good fortunethan because of its inherent scientific merits, is no excuse forthe current lack of effort or even apparent desire to find abetter way.’
What is surprising is that a flawed ‘temporary solution’has become a permanent solution. As further alluded to bythe authors, instead of engineers of today going back to thefundamentals to develop a better failure criterion based on agood understanding of geology and ‘physics’, more time isspent criticizing the criterion – sometimes without suggestingsolutions. Nor is any effort made to collect field data to backup any criticisms or suggested modifications.
More time is spent on computer modelling, with littlefieldwork to validate such models. The input parameters tothese models mostly cannot be justified, as the currentgeneration of engineers does not understand the significantrole of geology and the resulting uncertainties governing theinput parameters and failure criteria. Hence it is not
▲
1028 DECEMBER 2014 VOLUME 114 The Journal of The Southern African Institute of Mining and Metallurgy
Figure 8—Schematic representation of the influence of rock mass self-support capacity based on joint persistence (Suorineni et al., 2008)

surprising to come across research results like those shownin Figure 9. Ironically, after knowing how the tunnel Figure 9failed, we are then able to capture the failure (as inHadjiabdolmajid 2001; Carter et al., 2008) after manipulatingthe input parameters and failure criterion.
Thus in most cases we are able to correctly predict thebehaviour of excavations in our numerical models only afterthe fact, by manipulating input parameters to matchobservations under the cover of so-called ‘back-analysis’ or‘model calibration’. While we will most often satisfyourselves this way in our offices, the rock mass is so idiosyn-cratic that in our next project it will defy our prediction andbehave again in its own way.
Challenges of our timeOur predecessors made efforts to solve the problems of theirtime. Today we are faced with challenges beyond thesolutions of our predecessors. Those solutions have reachedtheir limits. The challenges in our time include developmentof failure criteria suitable for rock, guidelines for optimizedblock cave mine design based on a deep understanding ofcaving mechanics, predicting rockbursts, and seeing throughthe in situ rockmass.
We need ways to see inside the block cave and to resolveissues like unexpected ground conditions. The prospect ofrockburst prediction still remains remote and all we can do ismonitor, mitigate, and identify potential high-risk areas. Weare also faced with the issue of reducing in situ stressmeasurement errors to acceptable levels. Excavation facefatalities continue to occur.
Recent events in the mining industry, including theNorthparkes airblast fatalities, Grasberg mine disaster,Beaconsfield fatalities, and fatalities in mines in the SudburyBasin, have exposed the limits of our current knowledge. Thereports from these investigations mostly concluded that thecircumstances leading the incidents could not have beenforeseen. Our inability to foresee such circumstancesindicates the limitations of our current knowledge. We needtechnology to see behind total cover surface support systemssuch as shotcrete and thin spray-on liners (TSLs). Ultimately,wwe need technology to see behind the excavation face and tomonitor the inside of block caves in real time. We needtechnology to predict and mitigate rockbursts. The phrase‘unexpected ground conditions’ is an example of an excusethat stifles the urgent need for technology required toovercome our limitations.
There are other valuable applications of technology in themining industry. This is captured by Peterson et al. (2001),wwho states: ‘It is the knowledge management benefits of newIT technology that will provide the greatest benefit to theindustry (Mining). Although mine operations are generatingmore data, such information is rarely well utilized.’
To bridge and expand our knowledge to cope with currentchallenges require new thinking. Lessons learnt from scienceand medicine indicate the path to developing solutions ingeomechanics through core rather than peripheral research.These are discussed next.
Lessons from medicineThe field of medicine faces serious challenges at any one
ftime. However, these challenges are often met with enduringefforts by the medical community to understand their originsand develop the appropriate technologies to offset theirimpact. Until recently these efforts have been generallyindividualistic with various experts working in ‘protectivesilos’.
While the silo approach to research in medicine producedresults, it often took several decades and generous funding toproduce significant results and or breakthroughs. A goodexample is the race for a cancer cure. For several decades, thesearch has been carried out by individuals working in silos.Each individual has been an ‘authority’ in his own right. Thisapproach has not resulted in any major or significantbreakthroughs.
The difficulty in curing cancer lies in the fact that it is notjust one disease. Cancer has potentially thousands of causes,and not all cancers are caused by just one agent. Hence, it isnow recognized the challenge to unravel the cancer myth andfind a cure, cannot be achieved through the ‘silo’ researchapproach.
The Stand Up to Cancer (SU2C) organization (Park, 2013)has brought a paradigm shift to medical research by bringingscience and medicine together, fostering genuine collabo-
Geomechanics challenges of contemporary deep mining
The Journal of The Southern African Institute of Mining and Metallurgy VOLUME 114 DECEMBER 2014 1029 ▲
Figure 9—Tunnel failure – prediction versus reality (Read and Martin1996)
Figure 10—Step change increase in mine productivity from advances intechnology G. Baiden (pers. comm.)

Geomechanics challenges of contemporary deep mining
rative core research by breaking down individual expertresearch silos, and providing generous funding to collabo-rative core research groups.
With this strategy, individual experts working indefensive silos in secrecy on various aspects of cancer arebrought together to form multidisciplinary collaborative core(not peripheral) research groups in which egoistic barriers arebroken and former competitors are working together. Thisapproach brings the best talents together and is seen to leadto significant medical breakthroughs in relatively shorttimeframes.
Park (2013) notes that multidisciplinary collaborativebreakthroughs in medicine are enhanced and accelerated bydevelopment and use of relevant technology. Technologicaladvances in medicine have come from bioengineering,nanotechnology, new drug compounds, data gathering, andcheaper and more powerful computers. Collaboration resultsin strength in numbers, and combined with technology, leadsto dazzling scientific and research advances.
Lesson from scienceLike the lessons in medicine, breakthrough in science inrecent times is also a result of technology and genuine collab-oration.
The recent discovery of the Higgs boson, the so-called‘God particle’ which had eluded physicists for nearly fivedecades since its existence was proposed, was a result ofgenuine multidisciplinary collaboration and availability of therelevant technology backed by generous funding. The AToroidal Large Hadron Collider (LHC) Apparatus (ATLAS)Collaborations (2012) reports that in this project nearly 2000physicists from US institutions (89 universities and sevenDepartment of Energy laboratories) participated in the ATLASand Compact Muon Solenoid (CMS) experiments, making upabout 23 per cent of the ATLAS collaboration and 33 percentof CMS at the time of the Higgs discovery. The LHC apparatuscost US$10 billion.
The LHC is the enabling technology in the project thatwwas built by the Centre Européen de Recherche Nucléaire(CERN) particle physics laboratory on the Swiss-Frenchborder. This was a multinational genuine collaborativeresearch project.
The prediction of the existence of Higgs boson as part ofthe Standard Model (SM) in 1964 and its eventual discovery(proof) through experiments was a demonstration of thestrength of genuine multidisciplinary collaboration backed bypersistence and generous funding. The SM explains theprevailing theory that describes the basic constituents ofmatter and the fundamental forces by which they interact(Veltman, 1986) and is the most successful explanation ofthe universe to date.
Model for progress in geomechanicsIf physics were geomechanics, the Higgs boson would neverhave been predicted, much less discovered. It is alsofrustrating that, unlike in medicine, silo rather than genuinecollaborative research persists in geomechanics. Researchsilos exist and thrive in geomechanics and academia for thefollowing reasons:
(i) Who owns the credit for what is achieved?(ii) Who owns the intellectual property?
f(iii) Who is the lead author of the paper?(iv) How many papers can I publish?(v) How much of the money can I get?(vi) I should be better than all others
The collaboration of the best brains, independent of initialindividual differences, leading to major breakthroughs ingeomechanics is still decades away. Müller (1988) notes thatno doubt much goodwill and intimate collaboration isrequired to translate into reality the synthesis of rockmechanics and engineering geology. Terzaghi had a similarambition, that of a synthesis between soil mechanics andengineering geology. To the contrary, Müller notes:
‘Unfortunately collaboration is rare between humanbeings and is still more rare between specialists. I considerthe lack of real and through going collaboration one of ourdaily problems. Many failures, waste of many and evendisastrous events and loss of life I have experienced by thisreason.’
Müller’s statement, made in 1988, still hold true ingeomechanics and among rock engineers, engineeringgeologists, and geologists. It is sad to note that there is notwo-way communication between ground control engineersand geologists in our mining camps. Such constant communi-cation could alleviate most of the fatalities on record.
The inconvenient truth is that rock is the mostcomplicated material to deal with compared to soil, concrete,or steel. To control or manage this complicated material wehave to understand it. Neither the geologists, rock engineers,nor engineering geologists have sufficient knowledgeindividually to understand rock behaviour. Understandingrock behaviour requires genuine multidisciplinary collabo-ration between the best brains in geoscience and engineering,independent of personal differences, coupled withdevelopment or adoption of the appropriate technology andgenerous funding.
The challenges facing geomechanics practice today can besolved through the following model adopted from theexperiences in science and medicine:
‘Bring the best and most talented possible brains frommultidisciplines in earth science and engineering togetherindependent of personal differences, fund them generously,oversee their progress rigorously in a tight schedule, and theywill unravel the challenges in geomechanics.’
The multidisciplinary collaboration should include theidentification, adoption, and development of appropriatetechnologies for seeing through the rock mass in a mannersimilar to the way in which medical CT scanners can seethrough the human body to diagnose ailments. We need a‘transparent rock mass’.
Rockbursts are the ‘cancer’ in geomechanics. Thephenomenon of rockbursts has been studied for over acentury, and yet the causes remain poorly understood and theprospect of being able to predict them remains remote.Salamon, in 1983, stated ‘A disconcerting feature ofrockbursts is that they defy conventional explanation.’
This statement remains true today. We could solverockbursts and prevent associated fatalities in ourunderground mines through genuine multidisciplinary collab-oration and generous funding. We need to stand -up torockbursts (SU2R), just as the medical scientists are standingup to cancer (SU2C).
▲
1030 DECEMBER 2014 VOLUME 114 The Journal of The Southern African Institute of Mining and Metallurgy

f fWe can remove workers from the work face bydeveloping and adopting appropriate technologies.Technology exists for doing this. If the National Aeronauticsand Space Administration (NASA) can send robots to exploreMars, there is no excuse for the mining industry’s inability toremove workers from the excavation face and mine remotely.Unmanned robots such as the ‘Rover’ could drill, charge,blast, muck, and support. Steve Perry and Larry Knightwwould be alive today.
Current proposed technologies for mining seem to focuson peripheral issues rather than core issues, which if tackledsuccessfully would bring about enormous benefits in terms ofsafety and productivity. Evidence exists (Figure 9) that stepchanges in technology result in equivalent increases inmining productivity.
A suitable failure criterion for rocks remains elusive,wwhile the determination of rock mass properties remains achallenge. Our inability to overcome the myth of ‘unexpectedground conditions’ remains. The ability to see behind totalcover surface support systems (such as shotcrete and TSLsremains daunting. Errors in in situ stress measurementscontinue to be unacceptable, and are continuously becomingwworse as we mine at deeper levels. Hoek (1994) states:
‘Techniques for measuring in situ stress while greatlyimproved from what they were still give an amount of scatterwhich would be unacceptable in almost any other branch ofengineering.’
The solutions to these problems require a multidisci-plinary genuine collaborative research in geoscience andengineering, coupled with the development and adoption ofappropriate technologies.
Conclusions and recommendationsOur predecessors developed solutions to the problems of theirtime that we continue to use, albeit with mixed results. Asour mines continue to go deeper, so do the solutions of ourpredecessors continue to become less adequate in terms oftheir predictive abilities.
Increasing computing power is not accompanied by asimilar ability to collect and determine appropriate rockproperties for our powerful and complex numerical modellingcodes. Indeed, field work and laboratory investigations arenow being replaced with computer simulations and labora-tories are shutting down. We need to reverse course, ascomputer simulations need realistic inputs to be valid.
To control and manage structures in rock, we need tounderstand rock. Geology is the pathway to understandingrock. Geology should be emphasized in mining and civilengineering programmes.
Experience in science and medicine shows that theproblems in geomechanics can be overcome through genuineinterdisciplinary collaboration, generous funding, anddevelopment of appropriate technologies. The future of safeand productive mining lies in the development/adoption ofrelevant technologies that can assist our understanding ofrock behaviour and remove man from the excavation face.
ReferencesBARTON, N., LIEN, R., and LUNDE, J. 1974. Engineering classification of rock
masses for the design of rock support. Rock Mechanics, vol. 6, no. 4.pp. 189–236.
BIENIAWSKI f f, Z.T. 1973. Engineering classification of jointed rock masses.Transactions of the South African Institute of Civil Engineers, vol. 15.pp. 335–344.
BIENIAWSKI, Z.T. 1989. Engineering Rock Mass Classifications. Wiley, New York.
BROWN, E.T. (ed.). 1981. ISRM Suggested Methods for Rock Characterization,Testing and Monitoring. Pergamon, Oxford.
CARTER, T.G., DIEDERICHS, M.S., and CARVALHO, J.L. 2008 Application of modifiedHoek-Brown Transition Relationships for assessing strength and post-yield behaviour at both ends of the rock competence scale. Proceedings ofthe 6th International Symposium on Ground Support in Mining and CivilEngineering Construction, Cape Town, South Africa, 30h March – 3 April2008. Southern African Institute of Mining and Metallurgy, Johannesburg.pp. 325–338.
CLARK, L.M. and PAKALNIS, R.C. 1997. An empirical design approach forestimating unplanned dilution from open stope hangingwalls andfootwalls. Proceedings of the 99th Annual General Meeting, Vancouver,ggCanada. 27 April – 1 May 1997. Canadian Institute of Mining, Metallurgyand Petroleum.
CRAIG, R.F. 1982. Soil Mechanics. 2nd edn. Van Nostrand Reinhold, London.DIEDERICHS, M.S., KAISERKK , P.K., and EBERHARDT, E. 2004. Damage initiation and
propagation in hard rock during tunnelling and the influence of near-facestress rotation. International Journal of Rock Mechanics and MiningSciences, vol. 41. pp. 785–812.
DYKE, G.P. 2008. Rock mass characterization: a comparison of the MRMR andIRMR classification systems. Journal of the Southern African Institute ofMining and Metallurgy, vol. 108. pp. 657–659.
FLORES, G. and KARZULOVICKK , A. 2003. Geotechnical guidelines for a transitionfrom open pit to underground mining. Report to the International CavingStudy Stage II. University of Queensland, Brisbane.
FRANKLIN, J.A. 1993. Empirical design and rock mass characterisation.Comprehensive Rock Engineering. Hudson, J.A. (ed.). Pergamon, NewggYork. vol. 2, pp. 759–806.
HAJIABDOLMAJID, V., MARTIN, C.D., and KAISERKK , P.K. 2000. Modelling brittlefailure. Proceedings of the 4th North American Rock MechanicsSymposium, Seattle, Washington. 31 July – 3 August 2000. AmericanRock Mechanics Association, Alexandria, Virginia. pp. 991–998.
HAJIABDOLMAJID, V.R. 2001. Mobilization of strength in brittle failure of rock,PhD thesis, Department of Mining Engineering, Queen’s University,Kingston. 268 pp.
HOEK, E. AND BROWN, E.T. Underground Excavation in Rock. Institution ofIIMining and Metallurgy, London.
HOEK, E. and MARINOS, P. 2007. A brief history of the development of the Hoek-Brown failure criterion. Soils and Rocks, no. 2. pp. 2–13.
HOEK, E., CARRANZA TORRES, C.T., and CORKUM, B. 2002. Hoek-Brown failurecriterion: 2002 edition. Proceedings of the 5th North American RockMechanics Symposium. Toronto, Canada, 7–10 July 2002. pp. 267-274.
HOEK, E., KAISERKK , P.K., and BAWDEN, W.F. 1995. Support of UndergroundExcavations in Hard Rock. A.A. Balkema, Rotterdam.
ISAACSON, W. 2007. Einstein: His Life and Universe. Simon and Schuster, NewYork.
LAUBSCHER, D.H. 1994. Cave mining-the state of the art. Journal of the SouthAfrican Institute of Mining and Metallurgy, vol. 94, no. 10. pp. 279–293.
LAUBSCHER, D.H. AND TAYLOR, H.W. The importance of geomechanics of jointedrock masses in mining operations. Proceedings of the Symposium onExploration for Rock Engineering, Cape Town, South Africa. 1–5ggNovember 1976, A.A. Balkema, Cape Town. pp. 119–128.
LØSET, F. 1999. Use of the Q-system in weak rock masses, NGI report no.592048-1. NGI, Oslo, Norway.
LUNDER, J. and PAKALNIS, R. 1997. Determining the strength of hard rock minepillars. CIM Bulletin, vol. 90, no. 1013. pp. 51–55.
MATHEWS, K.E., HOEK, E., WYLLIEWW , D.C., and STEWART, S.B.V. 1981. Prediction ofstable excavation spans at depths below 1000m in hard rock mines.CANMET Report, DSS Serial No. OSQ80-00081. 127 pp.tt
MILNE, D., HADJIGEORGIOU, J., and PAKALNIS, R. 1998. Rock mass characterizationfor underground hard rock mines. Tunnelling and Underground SpaceTechnology, vol. 13, no .4. pp. 383–391.
MOHR, O. 1900. Welche Umstände bedingen die Elastizitätsgrenze und denBruch eines Materials? Zeit. Ver Deut. Ing, vol. 44. pp. 1524–1530.gg
MÜLLER, L. 1966. Der progressive bruch in geklufteten median. Proceedings ofthe First Congress of the International. Society of Rock Mechanics, Lisbon,Portugal, 25 September – 1 October 1966. ISRM. pp. 679–686.
Geomechanics challenges of contemporary deep mining
The Journal of The Southern African Institute of Mining and Metallurgy VOLUME 114 DECEMBER 2014 1031 ▲

Geomechanics challenges of contemporary deep mining
MÜLLER f f, L. 1988. The influence of engineering geology and rock mechanics intunnelling. Bulletin of the International Association of EngineeringGeologists, vol. 38. pp. 5–13.
PARK, A. 2013. The hero scientist who defeats cancer will likely never exist.The Times, 1 April 1 2013. pp. 32-38.
PELLI, F., KAISERKK , P.K., and MORGENSTERN, N.R. 1991. An interpretation ofground movements recorded during construction of the Donkin–Morientunnel. Canadian Geotechnical Journal, vol. 28, no. 2. pp. 239–254.
PELLS, P.J.N. 2008. What happened to the mechanics in rock mechanics and thegeology in engineering geology? Journal of the Southern African Instituteof Mining and Metallurgy, vol. 108. pp. 309–323.
PETERSON, D.J., LATOURRTETTE, T., and BARTIS, J.T. 2001. New forces at work inmining. Industry Views of Critical Technologies. RAND, Science andTechnology Policy Institute, Santa Monica, California. pp. 33–52.
READRR , R.S. and MARTIN, C.D. 1996. Technical summary of AECL’s Mine-byExperiment. Phase1 excavation response. Atomic Energy of CanadaLimited Report, AECL-11311. 169 pp.tt
SALAMON, M.D.G. 1983. Rockburst hazard and the fight for its alleviation inSouth African gold mines. Proceedings of the Conference on Rockbursts,Prediction and Control, 20 October 1983. Institute of Mining andMetallurgy, London. pp. 11–52.
SUORINENI f, F.T. 2010. The stability graph after three decades in use –experiences and the way forward. International Journal of Mining,Reclamation and Environment, vol. 24, no. 4. pp. 307–3392.tt
SUORINENI, F.T. 2011. Factors influencing overbreak in the Barkers orebody,Kundana Gold mine: narrow vein case study. Paper by: P.C. Stewart,R. Trueman and I. Brunton, 2011: Mining Technology, vol. 120 (2),pp. 80–89. Letter to the Editor, Transactions of the Institution of Miningand Metallurgy (Section A): Mining Technology.
SUORINENI, F.T. 2012. A critical review of the stability graph method for openstope design. MassMin 2012, Sudbury, Ontario.
SUORINENI, F.T. 2013a. Geomechanics challenges and its future direction – Foodfor thought. Ghana Mining Journal, vol. 14. pp. 14–20.
SUORINENI, F.T. 2013b. The geomechanics challenges of contemporary deepmining: technology as the pathway to increased safety and productivity.16th Kenneth Finlay Lecture, University of New South Wales, Australia.
TRUEMAN, R. and MAWDESLEY, C. 2003. Predicting cave initiation andpropagation. CIM Bulletin, vol. 96. pp. 54–59.
VELTMANVV , M.J.G. 1986. The Higgs Boson. Scientific American, November 1986.pp. 76–84. ◆
▲
1032 DECEMBER 2014 VOLUME 114 The Journal of The Southern African Institute of Mining and Metallurgy

Introduction and backgroundSouth African electrical power costs havetraditionally been low by internationalstandards. However, recent tariff increases andfuture projections of power costs have resultedin a significant rise in operating costs. Powertariff structures vary throughout the day, differon Saturdays and Sundays, and changebetween winter and summer. The differencebetween the lowest and highest tariffs is asmuch as a 1 000% (Eskom, 2013). Althoughdifficult to quantify, the cost of non-delivery ofpower will have an even greater effect on minecosts, productivity, and safety. Eskom (the
fSouth African electricity public utility) hasattempted to alleviate the scarcity of electricityin South Africa by contacting and asking largeusers of electricity, including the mines, toreduce consumption, which could have anadverse impact on mine production.
Internationally, increasing electricity costsare among the largest drivers of expenditure inthe mining industry and the reduction ofenergy use, and thus power costs, can assist inoffsetting lower commodity prices andreducing margins.
Many of the larger corporations andmining houses have identified energy and themanagement thereof as a production and costdriver. One such study (Du Plessis and VanHeeswijk, 2012) showed that energy nowconstitutes over 20% of the mines’ cost base.From this study, an integrated energy andcarbon management strategy was developed tofacilitate a holistic approach to managingenergy and carbon emissions. It coveredgeneration sources and the main fuel- andelectricity-consuming assets, and consideredmining methods and how they affect energyintensity. The strategy arrived at consideredsix key elements, namely:
➤ Understand: measuring, monitoring, andmanaging energy consumption andcarbon emissions
➤ Plan: factoring energy and carbonemissions into operational and life-of-mine plans
➤ Operate: operating core assets moreefficiently to achieve lower energyintensity
Efficient use of energy in the ventilationand cooling of minesby J.J.L. Du Plessis*, W.M. Marx†, and C. Nell‡
SynopsisEscalating energy and electricity costs have become one of the largestdrivers of expenditure in mining operations. Over the last eight years,energy costs have tripled when expressed as a percentage of total expensesin South African mines. In an effort to manage and reduce electricity costs,energy management strategies can be developed, inefficient operating unitsreplaced, and the operation of energy-consuming components ofventilation systems optimized.
Power consumption on mines is controlled mainly by three strategies,namely load clipping, by which energy use is reduced for certain parts ofggthe day; load shifting, by which energy use is shifted to other parts of theggday; and energy efficiency, by which energy use is reduced permanently.
In this paper several projects that were implemented using the first twostrategies of load clipping and load shifting are investigated. The actualand potential savings that can be achieved by implementing such energy-saving interventions are presented.
To reduce the operating costs of ventilating and cooling undergroundmines permanently, system optimization studies must be completed.Methods that can be used to reduce energy usage by optimizing cooling andventilation systems are described, and network simulation models thataccurately reflect the current and planned ventilation conditions arediscussed.
These models are then used to examine various options for improvingthe overall ventilation and cooling strategy. Different optimizationscenarios can be simulated, and this assists the design engineer inobtaining the most energy-efficient system that will satisfy designworkplace conditions. The final outcome is a reduction in operating costs,which can result in better operating margins and an extension of the life ofmine.
Keywordsenergy, electricity costs, efficiency, ventilation, cooling, optimization,simulation, energy management, energy strategy, load clipping, loadshifting.
* Department of Mining Engineering, University ofPretoria.
† BBE Consulting.‡ BBEnergy.© The Southern African Institute of Mining and
Metallurgy, 2014. ISSN 2225-6253. This paperwas first presented at, A Southern African SilverAnniversary, 2014 SOMP Annual Meeting, 26–30June 2014, The Maslow Hotel, Sandton, Gauteng.
1033The Journal of The Southern African Institute of Mining and Metallurgy VOLUME 114 DECEMBER 2014 ▲

Efficient use of energy in the ventilation and cooling of mines
➤ Replace: freplacing carbon-intensive sources of energywith renewable energy
➤ Invest: spending now to reduce energy costs in thefuture
➤ Enable: addressing underlying factors that will enablethe company to reach its energy and carbon goals.
All of these elements must be considered in the life-cycledesign. Furthermore, it is important that mine ventilation andcooling systems operate as efficiently as possible to reducecapital requirements and operating costs, without compro-mising a safe and healthy working environment.
There are several stages during the design, implemen-tation, and operation of mine ventilation and cooling systemswwhere energy efficiency can and should be optimized. Theinitial stage is planning and optimization of primary variablesfor the proposed system. Next, individual system componentsare optimally designed, followed by the efficient integrationof these components. Finally, energy efficiency is furtherimproved during operation through cyclical control of systemsand ultimately by supplying ventilation and cooling ondemand. Any reduction of electrical power cost must beevaluated in relation to the effect on production and theoverall mine operating cost per ton mined.
System optimizationAlthough it is important to ensure that single ventilation andcooling components (fans, pumps, compressors, etc.) areappropriately designed and energy-efficient equipment isprocured, reducing the operating costs significantly requiresoverall system optimization. A typical ventilation system in adeep South African mine consists of downcast and upcastshafts, intake and return airways, and a main exhaust faninstalled at the top of the upcast shaft. A typical coolingsystem includes a refrigeration plant producing cold waterand heat exchangers cooling the mine’s intake air by direct orindirect contact with the cold water. This strategy applies tocurrent ventilation and refrigeration systems in operatingmines, as well as to the designs of future operations.
System energy efficiency is achieved by operating minesat optimum airflow quantities and cooling capacity, and bycyclical and on-demand operation. For instance, largeamounts of power are consumed by refrigeration equipmentin the South African gold and platinum mining industries,wwith total installed refrigeration capacity of the order of 1 400MWR. This relates to about 350 MWE of electrical motorratings for refrigerant compressor drives, with motor sizesgenerally ranging from 0.5 to 2.5 MWE. In addition, thedirect auxiliaries (cooling towers, condenser pumps, etc.) willhave a total electrical rating of approximately 150 MWE, withmotor sizes ranging from small to about 0.3 MWE. Thus, inthe South African gold and platinum mining sectors, the totalelectrical nameplate rating for refrigeration equipment isabout 500 MWE.
The engineering and operation of these systems hasevolved over some decades to the current state of the art andsignificant achievements in energy efficiency have resulted(Gunderson et al., 2005). The integration of energy-efficientsystems (pumping, ventilation, refrigeration, etc.) andvventilation-on-demand (VOD) is still not commonlyimplemented, and there is room for further improvement infuture (Acuña et al., 2014).
Energy saving methods and strategiesPower consumption on mines is controlled mainly by threestrategies, namely load clipping, by which energy use isggreduced for certain parts of the day; load shifting, by whichggenergy use is shifted to other parts of the day; and energyefficiency, by which energy use is reduced permanently.
The typical South African mining cycle in hard rockmining consists of two eight-hour shifts per day, one mainlyfor drilling and charge-up and one for removing the brokenrock from the production zone. The third eight-hour period isdedicated to blasting and the clearing of the blasting fumesand dust, which is normally done in the afternoon.Production zones are thus occupied for a maximum of 16hours per day. Although personnel are underground duringthe blasting shift, they will be in intake airways around theshaft. The conventional approach to mine ventilation andcooling is to ventilate and cool the entire mine all of the time.This approach fails to exploit the cyclical nature of mining,diurnal variations in ambient temperature, and variations inthe cost of electrical power, and does not allow load clippingor shifting tactics to be implemented.
This cyclical schedule is ideal for implementing theoperation of an energy-efficient ventilation and coolingsystem, as there are periods of the day when there are nopersonnel in the production zones. Fan power and refrig-eration can be reduced during these times in a structuredway. The following main methods and strategies have beenimplemented.
Main fans
Major work has been done on the energy optimization ofmain fans in South African mines. In most of the deepermines, load clipping projects are implemented where inletguide vane (IGV) control is used to reduce the load duringperiods of peak power demand (Du Plessis and Marx, 2007,2008). IGV control involves specially designed, adjustablevanes installed in the air stream entering the fan inlet. Thesestatic (angle-adjustable) vanes are used to generate a swirl ofair in the direction of the impeller rotation. As the swirl isincreased by changing the IGV angle setting, the performancecapability of the fan gradually reduces pressure/volume andpower curves. The fan’s characteristic effect is that theoperating point is moved down the system resistance curve,resulting in reduced power consumption (Figure 1).
Improving overall main fan efficiency generally involvesentire impeller replacements or even entire fan replacements.This is required where main fans are operating far off theiroriginal design duty points, due to changes between theplanned and actual mine resistance or wrong specificationduring design. This strategy is still fairly new in South Africa,but it has huge potential as the average efficiency of main fanstations is much lower than it should be. In addition, variablespeed drives (VSDs) can be implemented on secondaryventilation fans and flow can be reduced during certain partsof the day and mining cycle.
Refrigeration
The first line of defence includes the optimization of the pre-cooling towers. These systems cool the warm return water(from underground) to a point close to the ambient surface
▲
1034 DECEMBER 2014 VOLUME 114 The Journal of The Southern African Institute of Mining and Metallurgy

temperature in direct contact cooling towers. This can accountfor a significant portion of the cooling required and isvvirtually free.
Conventional refrigeration machines are switched offduring periods of peak demand, or thermal storage is used tostore cooling for periods of high cooling demand (Roman etal., 2013). In cooling systems, thermal storage that uses icebanks or water storage dams must be considered (Els, 2014).Ice banks produce ice on the outside of submerged heatexchanger coils during periods of low power cost and lowerdiurnal temperatures, and melt this ice during periods of highpower cost and peak demand. Mine ice thermal storage alsoallows for power consumption profiling aimed at shifting theelectrical load out of peak demand periods. Ice is producedduring standard and off-peak power periods, and issubsequently melted by diverting water flow to the ice coils(Figure 2) to provide cooling during peak demand periods,thus reducing the load on all the water chillers.
Water mass is also effective for thermal storage becausewwater has the highest specific heat of all common materials.In water mass thermal storage, the thermal capacity isdependent on the water mass and the temperature differencebetween the stored cold water and the returning warm water.In general, thermal storage will not be economical if thistemperature difference is less than 5°C. However, in thesemine applications this temperature difference is approxi-mately 10°C. The fundamental feature of this storage is thatit separates the cold and warm water volumes. One suchsystem implemented at a South African gold mine wasdescribed by Du Plessis et al. (2005). This system usesammonia refrigeration machines that cool water to 1ºC. Itconsists of a warm water dam (18ºC), a medium temperaturedam (8ºC), and a cold water dam (1ºC).
Thermal stratification is the most common method ofseparating cold and warm water due to its simplicity,reliability, and low cost. In thermally stratified storage, the
f fwarmer, less dense returning water floats on top of the storedchilled water. The water from the storage is supplied andwithdrawn at low velocity so that the buoyancy forcesdominate any other effects. Water is most dense at 4°C and itcannot be stratified below this temperature. This approachhas been used on a number of mines (Wilson et al., 2005)(see below), but it generally requires tanks/dams with aminimum height-to-diameter ratio of 1.0 (Khalifa et al.,2011).
Another method uses multiple compartments andlabyrinth tanks. Pumping is scheduled so that onecompartment is always partially empty for receiving returnwater, and water at different temperatures is thus stored inseparate compartments. Labyrinth tank systems apply coldwater and warm water at either end of a complex paththrough the dam and will generally have both horizontal andvertical traverses. The design commonly takes the form ofsuccessive partitions, with high and low ports.
By understanding the demand for underground coolingconditions in specific areas, control systems can beimplemented on these units (Le Roux et al., 2014). Anyover-supply is inefficient and the goal is to control thecooling units to follow the demand. Besides fixing leaks inwater piping, there are various ways in which energy savingscan be obtained on the chilled water usage underground,such as:
➤ Controlling underground bulk air coolers➤ Controlling underground cooling cars➤ Installing isolation valves on the service water supply.
Saving potentialTo provide a convincing argument for the viability ofventilation and cooling system optimization, it is necessary tolook at the costs of providing ventilation, refrigeration, andcooling. Although these vary significantly from mine to mine,on a deep hot mine the costs can be as much as 15% ofcapital (US$200 million) and 25% of energy costs (e.g.20 MW peak, 12 x 106 kWh/month for a large South Africangold mine) (Gold Fields International internal data). Theworld-wide cost of power ranges from US$0.02 to US$0.10per kilowatt-hour, with instantaneous peak rates being overUS$0.20 per kilowatt-hour. Every 1% saving on theventilation and refrigeration energy costs amounts toUS$80 000 per annum (at US$0.05 per kilowatt-hour).
Efficient use of energy in the ventilation and cooling of mines
1035The Journal of The Southern African Institute of Mining and Metallurgy VOLUME 114 DECEMBER 2014 ▲
Figure 1—Fan curve showing operational points with IGV settings
Figure 2—Ice storage dam

Efficient use of energy in the ventilation and cooling of mines
A case study example (Du Plessis and Marx, 2009)describes the development and implementation of a fanabsorbed power control system using IGVs at a total of 23 fanstations (52 fans) between three mining business units(BUs). A target of 5.6 MW saving out of a 22.8 MW base loadwwas set for BU 1, 7.5 MW saving out of a 30.0 MW base loadfor BU 2, and 7.4 MW out of a 25.5 MW base load for BU 3.
Fan absorbed power was measured at half-hour intervalsand then analysed for the evening peak period (18:00 to20:00) to determine whether the targets had been met.Performance should ideally be above 90% of target.
Figure 3 shows a graph of the actual load clippingachieved at BU 1.
The targeted and achieved power savings for BU 1, 2, and3 were as shown in Table I.
The success of implementing IGV control to reduce airflowand save electricity is evident from the data presented inTable I, which shows that the targeted savings were achievedand exceeded.
Simulation for optimization studies
VVentilation and cooling system energy optimization generallyincludes the development of simulation network models thataccurately reflect the current mining scenario and ventilationconditions. The calibration and verification of the predictionswwith measured environmental conditions are important toensure a high level of confidence. These models are used toexamine various options for improving the overall ventilationand cooling strategy, as well as for determining the effect ofpossible future changes. A number of scenarios, includingdifferent ventilation (fan/airway) and cooling(refrigeration/pumping) configurations, are typicallyexamined to obtain the most energy-efficient system thatsatisfies the design and safe workplace conditions.
Network simulation software is specifically designed anddeveloped to assist underground ventilation control engineersand practitioners in planning, designing, and operating minevventilation systems. Interactive network simulation programsallow the simultaneous modelling of airflow, air thermo-dynamic behaviour, as well as gas and dust emissions in anunderground mine. These programs cater for a wide range ofmining methods and allow the rapid construction ofsimulation networks, thereby enabling online ’what-if’studies to be done to determine system requirements foroptimal design and operation.
A typical integrated optimization system will consist of aproperly calibrated mine model, as mentioned above, and anoptimizer. The optimizer will generate different possible
operational scenarios and pass these to the modellingpackage. The modelling package will model the mine anddetermine whether minimum ventilation and coolingstandards are met. If this is the case, the specific combinationof parameters is considered for control. This iterative processcontinues and the best combination of cost/operationalconditions will be chosen for control purposes. By combiningthis process with time-differentiated set-points, an effectivecooling and VOD system is implemented.
Typically, what-if studies are used to determine theoptimal airflow quantity and cooling duty, and to reduce airleakage to a minimum. The system is then further optimizedby determining the optimal positioning of ventilation andcooling infrastructure. Figure 4 is an example of a typicalsimulation network mine model.
In a case study (Hoffman et al., 2012; Du Plessis et al.,2012) conducted at a deep-level gold mine, a number ofscenarios were simulated. After all the potential ventilationscenarios had been reviewed, the recommended optimizedventilation option was with the surface fans operating at
▲
1036 DECEMBER 2014 VOLUME 114 The Journal of The Southern African Institute of Mining and Metallurgy
Figure 3—Measurement of absorbed power at BU 1
Table I
Targeted and achieved power savings
Target Achieved
Mine Baseline (MW) Savings (MW) % of Baseline Baseline (MW) Savings (MW) % of baseline
BU 1 22.8 5.6 24.6 20.2 5.4 26.7BU 2 30.0 7.5 25.0 19.3 5.3 27.5BU 3 25.5 7.4 29.0 24.5 7.1 29.025.5 7.4 29.0
Figure 4—Simulation network model

f f20%, closed IGVs, and the stopping of some booster fans.Combined with this, the installation of underground refrig-eration machines with energy-recovery turbines wasrecommended due to the shorter implementation time, lowestimplementation cost, and least complexity.
The result of this study proved that, with carefulplanning, changes to current ventilation and refrigerationsystems in deep-level mines can result in major electricityoperating cost savings. At this particular mine, energysavings of 10 400 MWh per annum were achieved, resultingin an energy cost saving of US$2 million per annum, bychanging the IGV setting of the main surface fans. It wouldbe possible for the mine to save an additional 3 300 MWhand effect a further energy cost saving of US$0.5 million perannum by stopping an underground booster fan. The mainpenalty attached to these changes is that the undergroundairflow would be reduced by nominally 7%.
Significant energy savings are attainable by improvingrefrigeration positional efficiency and reducing the volume ofcooling water that is pumped from the bottom of the mine tothe surface. Mackay et al. (2014) investigated the use of hardice and concluded that hard ice as a refrigeration and coolingmeans has become more attractive at lesser depths.
Not only will this also allow greater flexibility, but theadditional refrigeration and cooling water required for futuremining will be produced by an underground plant,eliminating the need to pump 50 l /s over 2 000 m back to thel
surface, and utilizing the existing two energy-recoveryturbine stations. The total operational savings for this systemwwill be approximately US$2.5 million per annum. The cost ofthe required modification will be US$8.5 million, with acapital payback period of just more than three years.
Conclusion
The rising costs of ventilating and cooling mines safely andefficiently dictate that operators have to implement optimizedenergy management and control strategies in mines.VVentilation-on-demand and cooling-on-demand strategieshave the potential to reduce both the capital and operatingcosts of mine ventilation and cooling systems, and themechanisms required are technically feasible.
From several case studies presented in this paper it isclear that a large financial benefit is possible throughoptimizing ventilation and cooling within a mine.
References
ACUÑA, E.I., ÁLVAREZ, R.A., and HARDCASTLE, S.G. 2014. A theoretical
comparison of ventilation on demand strategies for auxiliary mine
ventilation systems. Proceedings of the 10th International Mine
Ventilation Congress, Sun City, South Africa, 2–7 August 2014.
DU PLESSIS, J.J.L. and MARX, W.M. 2007. Main fan power control. Proceedings of
the Mine Ventilation Society of South Africa Conference, Johannesburg,
South Africa.
DU PLESSIS, J.J.L. and MARX, W.M. 2008. Main fan energy management.
Proceedings of the 12th U.S./North American Mine Ventilation
Symposium, Reno, Nevada.
DU PLESSIS, J.J.L. and MARX f, W.M. 2009. Main fan energy management – actual
savings achieved. Proceedings of the Mine Ventilation Society of South
Africa Conference, Johannesburg.
DU PLESSIS, J.J.L. and VANVV HEESWIJK, C. 2012. Integrated energy & carbon
management strategy. Report to the Gold Fields Executive Committee.
August.
DU PLESSIS, J.J.L, HOFFMAN, D., and MARX, W. 2012. Re-engineering the
ventilation and cooling of an existing deep gold mine in the Free State of
South Africa. Proceedings of the International ICMM 2012 Health and
Safety Conference, Peru, Chile.
DU PLESSIS, J.J.L., SCOTT, D., and MOORCROFT, H.E.S. 2005. Modern cooling
strategies for ultra-deep hydropower mines. Proceedings of the 8th
International Mine Ventilation Congress, Brisbane, Australia, June.
Australasian Institute of Mining and Metallurgy.
ELS, R. 2014. Innovative use of bladders for thermal storage to decrease energy
costs. Proceedings of the 10th International Mine Ventilation Congress,
Sun City, South Africa, 2–8 August 2014.
ESKOM. 2013. Eskom tariffs and charges. http://www.eskom.co.za/
CustomerCare/TariffsAndCharges/http://www.eskom.co.za/CustomerCare/
TariffsAndCharges/Pages/Tariffs_And_Charges.aspx [Accessed 14
February 2014].
GUNDERSEN, R.E., VON GLEHN, F.H., and WILSONWW , R.W. 2005. Improving the
efficiency of mine ventilation and cooling systems through active control.
Proceedings of the 8th International Mine Ventilation Congress, Brisbane,
Australia, 6–8 July 2005. Australasian Institute of Mining and Metallurgy.
HOFFMAN, D., MARX, W.M., and VANVV GREUNING, D. 2012. Beatrix Gold Mine, West
Section. Ventilation and cooling planning review. BBE Consulting Report
no. 3412. May.
KHALIFAKK , A., MUSTAFA, A., AND KHAMMASKK , F. 2011. Experimental study of
temperature stratification in a thermal storage tank in the static mode for
different aspect ratios. ARPN Journal of Engineering and Applied Sciences,
vol. 6, no. 2. pp. 53–60.
LE ROUX, D.F., VILJOENVV , C., and RANASINGHERR , K. 2014. Achieving energy savings
by improving the control of underground cooling units according to
demand. Proceedings of the 10th International Mine Ventilation Congress,
Sun City, South Africa, 2–8 August 2014.
MACKAY, L., BLUHM, S., WALTERWW , K., and DE WET, J. 2014. Refrigeration and
ventilation systems for ultra-deep platinum mining in the Bushveld
Igneous Complex. Proceedings of the 10th International Mine Ventilation
Congress, Sun City, South Africa, 2–8 August 2014.
ROMAN, W.N., VON GLEHN, F.H., and MARX, W.M. 2013. Status of ventilation and
cooling in South African mines. Proceedings of the World Mining
Congress, Montreal, Canada.
WILSONWW , R.W, BLUHM, S.J., and VON GLEHN F.H. 2005. Thermal storage and
cyclical control of mine cooling systems. Proceedings of the 8th
International Mine Ventilation Congress, Brisbane, Australia, 6–8 July
2005. ◆
Efficient use of energy in the ventilation and cooling of mines
The Journal of The Southern African Institute of Mining and Metallurgy VOLUME 114 DECEMBER 2014 1037 ▲

•
•
•
••
••
•
••
CONFERENCEAccessing Africa’s Mineral Wealth:
Mining Transport Infrastructure and Logistics
24–25 March 2015Emperors Palace Hotel Casino Convention Resort, Johannesburg
BACKGROUNDSub-Saharan Africa is endowed with vast mineral wealth, yet many of the regionʼsdeposits have remained undeveloped. A key constraint is the lack of suitabletransportation infrastructure from remote locations to the coast.
The scale of infrastructure investment required to support mine developments isoften beyond the funding and institutional ability of any one mining company orgovernment. Governments are also under pressure to leverage these investmentsfor broader social benefit. Properly designed and structured shared-useinfrastructure, by opening up rail, road, river, port, and other transport facilities tomultiple projects and industries, can improve mining project economics while alsopromoting sustained national development.
Who then should design, finance, construct, own, operate, regulate, maintain,access, and fund mining transport infrastructure? Designing, building, and operatinga system-wide shared-use transport corridor which effectively and optimallyaddresses the needs and expectations of all stakeholders, users, and beneficiarieswhile respecting environmental and social concerns is challenging and oftenstretches local capabilities and experience.
The solution will entail collaboration and partnerships between multiplestakeholders, including mining competitors, governments, multilateral organisations,transport planners and operators, engineers and constructors, and the financial andlegal communities. It will require workable frameworks and processes which buildon lessons learnt in more developed jurisdictions while considering the uniquechallenges of the SSA environment.
Conference Announcement
SPONSORS:
ENDORSED BY:
For further information contact:Conference Co-ordinator, Camielah JardineSAIMM, P O Box 61127, Marshalltown 2107
Tel: +27 11 834-1273/7Fax: +27 11 833-8156 or +27 11 838-5923
E-mail: [email protected]: http://www.saimm.co.za
GROUP DISCOUNT
Register three delegates
and the FOURTH
delegate attends free

Background As history has repeatedly shown, where thereare valuable minerals to be mined,adventurous humans will arrive in droves –even if it means battling extreme conditionsand excessive risks. The motivation for off-Earth mining is clear: an abundance ofvvaluable resources that can feed our techno-logically-driven society, the necessity ofdiscovering new places that our society cancolonise, and the development of newtechnologies and processes to enable thesemissions, which will generate spin-offtechnologies that can be used in fully-automated terrestrial mining endeavours.
By widening the scope of miningengineering to incorporate off-Earth opportu-nities, the mining industry can be sustainedfrom an economic standpoint. In a similar way,the increased costs of mining and diminishingnatural resources available close to the surfaceof the Earth may soon support the idea thatoff-Earth resources are more profitable.
Limited research has been conducted inthis area. O’Leary (1988) initiated one of the
f ff ffirst off-Earth mining studies and identifiedthat the surfaces of the Earth’s Moon, Mars’stwo moons, and an asteroid named 1982 DBhave the potential for developing missions forspace mining. However, he focused on amanned mission, which entails highoperational and safety risks. Duke et al.(1997) designed three operational scenarios toextract water ice at the lunar poles, usingmicrowave energy for heating the ice, thermalprocessing and steam pipe transportation, andusing a dragline with thermal processing.Their designs were conceptual and did notconsider the economic feasibility of theoperations.
Sonter (1997) investigated the designprocess for feasibility studies of off-Earthmining operations and developed a net presentvalue (NPV) analysis including variables basedon orbital mechanics, rocket fuel requirements,mining and processing methods, product massreturned, and duration of the return trip. Anew analysis concept was also utilized bySonter (1997; 2001), the ‘mass payback ratio’,which illustrates the need to expend mass inthe form of propellants, rocket bodies, andmining consumables in order to return productmass to the market. Moreover, Sonter (2001)applied a scenario where resources obtainedfrom asteroids are brought into low Earth orbit(LEO) and sold as construction material forLEO infrastructure. These materials includewater to make propellant, nickel and iron for
Mining off-Earth minerals: a long-termplay?by G.A. Craig*, S. Saydam*, and A.G. Dempster†
SynopsisThe Moon, asteroids, and planets of the solar system represent themost distant caches of wealth that humanity has ever consideredrecovering. Yet, in addition to the potentially recoverable valuesrepresented there, harvesting off-Earth resources has a second,almost incalculable sustainable benefit in that they can be retrievedwith absolutely no damage to Earth.
Previous research mostly assessed the potential of asteroids andthe Moon for mining purposes from a theoretical and scientific pointof view. These studies investigated drawbacks that could beexperienced in this type of operation, but no detailed economicevaluation that is meaningful for mining project management hasbeen conducted and the parameters that are most likely to make anoperation feasible are unknown. This paper provides a preliminaryeconomic and sensitivity analysis of a possible off-Earth miningbusiness extracting minerals from an existing asteroid.
Keywordsoff-Earth mining, space mining, in situ resource utilization, futuremining.
* School of Mining Engineering, The University ofNew South Wales, Australia.
† The Australian Centre for Space EngineeringResearch, The University of New South Wales,Australia.
© The Southern African Institute of Mining andMetallurgy, 2014. ISSN 2225-6253. This paperwas first presented at, A Southern African SilverAnniversary, 2014 SOMP Annual Meeting, 26–30June 2014, The Maslow Hotel, Sandton, Gauteng.
1039The Journal of The Southern African Institute of Mining and Metallurgy VOLUME 114 DECEMBER 2014 ▲

Mining off-Earth minerals: a long-term play?
construction, and semiconductors to make solar cells.Sonter’s studies (1997; 2001) were the first that consideredthe economic viability of such missions.
Ross (2001) published a report on the important factorsin determining the feasibility of an asteroid mine. This reportconsiders the extraction of several commodities from asteroidorebodies, including water and volatiles, precious metals, rareearth metals, refractory material, and iron and nickel. Ross’sstudy, like Sonter’s, used NPV analysis as the primary tool.Ross also outlines the market demand, which is subject tocontinual iteration due to its size and nature. Notably,geological characteristics were not mentioned and the actualanalysis stage was not undertaken. This limits the credibilityof the study, in that it suggests principles without testing.However, Blair et al. (2002) from the National Aeronauticsand Space Administration (NASA) Jet Propulsion Laboratory(JPL) investigated the feasibility of off-Earth mining for waterextraction. A simple NPV analysis was found to beinsufficient to make an investment decision, due to the highcapital and research investment required for a start-upoperation, creating unpredictable risks and uncertainties inthe business model.
Erickson (2006) studied asteroid mining with a particularfocus on optimal return on investment (ROI) from near-Earthasteroids (NEAs), and stressed the cost efficiency and risksof a possible operation. He further recommended that themining equipment to be used at such an operation should beflexible, adaptable, and re-usable to handle a variety of NEAconditions. He particularly pointed out that robotics withartificial intelligence is essential to stage such a mission.
Zacharias et al. (2011) compared feasibility studies ofpotential mining projects on asteroids, the Moon, and Marsbased on each of their dynamic locations. They conducted anNPV analysis of possible 10-year mining operations for anarbitrary mineral and found that the Moon returned the mostfavourable NPV compared to Mars and two selected asteroids.Based on their assumptions, both the Moon and Marsprovided positive NPVs, but the asteroids had negative NPVs.However, a possible asteroid-mining operation would beexpected have a much longer lifespan than a typical Earth-based operation, so the economic analysis could be quitedifferent considering all the variables and risks associatedwwith the operation.
Pelech (2013) studied an economic evaluation of miningcomets and the Moon for an off-Earth water market. Hedeveloped four water-mining scenarios to supply a H2/LOxpropellant market in LEO and established a ratio, named’propellant payback ratio’, inspired from Sonter’s studies(1997; 2001), which indicates the economic return on theforgone opportunity to launch the propellant directly from theEarth. He used the opportunity cost concept consideringinfrastructure and equipment launched from Earth. In thisstudy, for every kilogram of mining equipment andinfrastructure launched into LEO, the opportunity to launch akilogram of propellant has been forgone.
Gertsch and Gertsch (2003) applied terrestrial surfacemine design and planning techniques to the production oflunar regolith for extracting gases for life-support for 100people at a lunar base. They discussed various hypotheticalscenarios with basic assumptions for mining regolith fromfive large cold trap craters near south lunar pole. Muff et al.
(2004) conducted a study at NASA that includes a prototypedesign of a bucket wheel excavator to be used on the surfaceof the Moon and Mars to extract surface regolith. Bothstudies focused on using similar excavation techniques andequipment to those that are used in terrestrial miningoperations.
Schmitt et al. (2008) summarized the vision for spaceexploration, determining that the first stage wouldincorporate the development of mining initiatives on theMoon to extract life-sustaining elements such as H, He, C, N,and O. These elements are all available in various concen-trations in the lunar regolith or surface rock. They proposedthat a base would be needed on the Moon to provide anextensive refuelling and life-support system.
Yoshikawa et al. (2007) and Raymond et al. (2012)studied asteroid characteristics providing valuableinformation. Subsequent spacecraft missions reduced thegeological uncertainty surrounding this analysis.
Karr et al. (2012) from NASA studied the potential ofusing ionic liquids (ILs) to dissolve metal-bearing regolith inorder to exploit the water and metal present within it. AcidicIL was used to dissolve small samples of a nickel/ironmeteorite (named Campo del Cielo) and the metals wererecovered by electrowinning. When the voltage was slowlyraised from an initially low level, it was possible to recoverthe different metals separately at the anode. The water wasremoved using a micro-distillation apparatus. This representsthe first extraction of oxygen, in the form of water, from anextraterrestrial source, as well as a possible method ofprocessing metals in space. The authors also mentioned thatthis dissolution technique in prospector drilling could be usedfor the analysis of regolith.
Balla et al. (2012) discussed the use of direct laserfabrication technology to mine off-Earth minerals. Thefeasibility of this method was evaluated through a series ofexperiments using lunar regolith simulant. The experimentswere able to demonstrate that this method is able to producebulk amounts of mineral products through the melting andre-solidification of regolith. The laser absorption of materialsis directly proportional to electrical resistivity, therefore thelunar regolith melted completely with a laser power as low as50 W. However, they noted that more work will be neededbefore the process can be regarded as feasible on a largescale.
Buet et al. (2013) developed a robotic mining system forrapid Earth orbit capture of asteroid resources. They aimed tocapture and bring asteroid regolith to the Earth’s surface.Prado (2013) evaluated terrestrial mining systems such asstrip mining, but the problem in using this system off-Earthin an extremely low-gravity situation is that the dust androck would be expelled into space above the surface,obscuring and inhibiting the mining operation.
Bernold (2013) developed a method and machine to‘vacuum up’ regolith material as a form of material collection.This machine has been tested with the lunar simulantdeveloped by the research team (Creagh, 2013). To overcomethe lack of atmosphere, two concentric tubes were used. Agas is forced through the outermost tube and regolith dust isremoved inside the inner tube, suspended within the gas.
Lucas and Hagan (2014) conducted a study to analyseand compare the feasibility of conventional pick cutting
▲
1040 DECEMBER 2014 VOLUME 114 The Journal of The Southern African Institute of Mining and Metallurgy

ffsystems and pneumatic excavation systems in an off-Earthenvironment. The samples tested were the Australian LunarRegolith Simulant-1 (ALRS-1), designed by Bernold (2013).WWhile more research and development is required on theprototype pneumatic excavation system to determine the rateof excavation and other factors that would assist withassessing the mining efficiency of this system, it wasdetermined that both machines were capable of excavatinglunar regolith at any relative density. It was also concludedthat although neither system was feasible for lunarexcavation with current technology, the pneumaticexcavation system was superior under the lunar conditionsanalysed.
Owing to the rapid development of the private commercialspace industry, continual iteration is required to keep theresults of these investigations relevant. There has not been aconcentrated effort to reduce costs through investigation ofalternative capital expenditure models. None of the previousinvestigations have taken the geological characteristics ofeach deposit into account. Almost all mine design andplanning activity on the Earth is heavily influenced bygeology and the knowledge gained from previous experience.AA lack of sufficient geological information is one of the mostdetrimental uncertainties in making investment decisions.
The previous studies indicate that bodies in NEOs are themost likely to be economically viable, while the more distantcomets are unlikely to support a positive cash flow. Theseresults appear to be heavily dependent on the accessibility ofeach deposit by a spacecraft. Crucially, they also do notquantify the geological characteristics or extractability of eachdeposit as a cost factor in the analysis.
There are some USA-based companies intending to mineasteroids for volatiles and metals (Belfiore, 2013) due to theperceived accessibility. However, the Moon, and importantly(in terms of suitability of human colonization) Mars, must begiven a fair trial and compared with asteroid resources inorder to determine the most economically viable strategicbusiness plans.
AA case study for asteroid mining
Current knowledge of asteroids is derived from meteoritesamples, long-range electromagnetic spectrum observations,and spacecraft observations and sampling. The asteroids arecategorized by the spectral signatures from long-rangeobservations (Price, 2004). The spectral signatures aredivided into the categories given in Table I and referencedwwith respect to different composition characteristics found inmeteorites. It should be noted that there are many moresubclasses within each of these groups.
Launching a payload from the Earth’s surface into spaceis generally considered one of the higher costs in spacedevelopment (Ross, 2001); hence by starting a miningindustry in space early in the space development phase,unnecessary costs can be avoided. To develop such anindustry, a certain level of pre-existing space industry isrequired so as to provide fuelling services and/or energysources for the mining operations, as well as a market for theraw materials so that payload values are not undermined bythe costs of re-entry to Earth to access the terrestrial mineralmarket.
fAstronauts walking on the Moon found that the regolithis very fine grained and possesses an electrostatic charge.This charge causes the dust to stick to equipment andastronaut suits. It is expected that the surface of manyasteroids would be similar (Slezak, 2013).
Sonter (2013) described a typical target asteroid bodyand estimated that this target may contain approximately10% Ni-Fe, 10% magnetite, 10% water, and 50 ppm platinumgroup elements. He further mentioned that in 2020, the valuecontained in this type of material could be over US$1 millionper ton in space, but only US$4 000 per ton if the platinumwas brought to the Earth’s market.
In this case study, an M-type asteroid was chosen as thetarget for the mining operation. A high percentage of nickeland iron, which can be used for construction materials inorbit, was assumed. A number of M-type asteroids wereidentified but the one chosen has higher radar reflectivitycompared to other asteroids (Ostro et al., 1991), hence itsmineral composition is widely accepted in the scientificcommunity. 1986 DA is an NEA that is assumed to be 0.5astronomical units (AU) away from the Earth and has adelta-V (a standard measure of the energy needed tocomplete space manoeuvres) value of 7.195 km.s-1 (Benner,2013). This means that it is only slightly less accessible thanthe Moon – a round trip between the Earth and 1986 DAcould take approximately one year.
It is already known that 1986 DA’s orbit around the Sunpasses within Mars’ orbit, therefore at some points it isrelatively close to the Earth, approaching as close as 0.2 AU(Yeomans et al., 1987), but only for a very short time. Theminimum distance between the asteroid and the Sun (theperihelion) is 1.17 AU, while the maximum distance is4.46 AU. Since the distance between the Earth and the Sun is1 AU, it is assumed that the distance between the Earth andasteroid is between 0.17 AU and 3.46 AU. For the purposesof this study, 1986 DA is assumed to be about 0.5 AU fromthe Earth, or the same distance as Mars from the Earth. Inthis respect, the time to travel to the asteroid would becomparable to the time taken to reach Mars. Figure 1indicates a simplified possible orbital path of 1986 DA andthe Earth. This diagram was constructed based on theabovementioned information and was used to make theassumption of the distance between the Earth and theasteroid.
1986 DA has the composition of naturally occurringstainless steel, or 88% Fe, 10% Ni, and 0.5% Co (Ross, 2001;Ingebretsen, 2001) making it a perfect resource to mine. This
Mining off-Earth minerals: a long-term play?
1041The Journal of The Southern African Institute of Mining and Metallurgy VOLUME 114 DECEMBER 2014 ▲
Table I
Asteroid and meteorite cross-reference (Kowal,1988)
Asteroid Meteorite Descriptionreflectance type sample type
M-Group Metallic 95% Iron, nickel, other metals
S-Group Stony irons Contains silicates with native metalinclusions
Stones Mainly olivine, enstatite, silicates.
C-Group Chondrites Olivine, contains hydrated minerals,carbon, silicates

Mining off-Earth minerals: a long-term play?
composition is assumed to be uniform throughout theasteroid, and hence the entire asteroid is considered as anorebody and therefore the reserve is equal to the resource.The mean density of the asteroid is assumed to be 5 g.cm-3
(Ostro et al., 1991) and this equates to a total reserve of 20 Gt of raw stainless steel. If the minerals were to beprocessed and sold separately, it would be necessary toprovide reserve estimates for each mineral. For 1986 DA,therefore, reserves of 17.6 Gt of iron, 2 Gt of nickel, and 100Mt of cobalt were assumed. The remaining 300 Mt could bemade up of a combination of gold and platinum, whichtogether constitute 1% of the asteroid’s reserve.
PPossible mining methodsSince this study focuses on the economic analysis of such anoperation, it was important to consider possible miningmethods in order to make relevant assumptions. Therefore,two mining methods were investigated for extracting themetal from the asteroid: an open cut method and anunderground method.
The open cut method is similar to terrestrial opencastmethods, apart from any necessary surface securing systems.The near-zero gravity would mean that all equipment needsto be anchored to the surface of the asteroid. Mined materialalso needs to be prevented from leaving the mining area. Thiscould be achieved through the addition of a canopy or‘mining cover’, which is described by Prado (2013). A typicalcanopy system can be seen in Figure 2.
The mining system drills or breaks the ore and thebroken material is released into the space above the surface.This displaced ore is drawn up and out of the system forstorage. The velocity of rock that has been forced into motionby drilling or breakage is unknown, but some considerationwwould have to be given to high-speed projectiles whendesigning a mining cover. A typical diagram of this techniquecan be seen in Figure 3.
The underground mining method involves drilling largeholes from one side of the asteroid through the centre to theother side using some form of tunnel boring machine (TBM),in a similar way to auger mining in terrestrial operations, asshown in Figure 4. This will allow an adequate productionrate for the 1986 DA operation. The machinery is held inplace by pressure against the walls of the drill-holes, thuseliminating the problem of very low gravity. Ore could bedirected up the existing hole with ease due to the low gravityand collected at the top.
The most suitable mining method is to develop a stripmining system that incorporates anchorage to hold theequipment to the surface, as well as a mining cover to containdisturbed metal for storage.
It has been assumed that the entire asteroid will be minedyeventually; however, the envisaged operation will exploit only
one-tenth of the possible resource. In this respect, the finalpit layout must not impede further mining operations.Another factor that should contribute to the design of thefinal pit layout is the effect that extraction could have on1986 DA’s orbit around the Sun. Removing an isolatedsection of the asteroid could change the rotation of 1986 DAand propel it into an altered and potentially dangerous orbit.
It is most appropriate to perform mining operations insuch a way that the final pit layout consists of strips thatencircle the asteroid to maintain its trajectory and minimisechange in rotational kinetic energy.
▲
1042 DECEMBER 2014 VOLUME 114 The Journal of The Southern African Institute of Mining and Metallurgy
Figure 1—Diagram showing approximate orbit of 1986 DA compared toEarth
Figure 2—Canopy around an asteroid (after Prado, 2013)
Figure 3—Open cut mining method
Figure 4—Diagram showing proposed underground mining method

fAll infrastructures would need to be adequatelylightweight to minimize transport costs. Apart from thisconsideration and the additional stability measures requiredin a minimal gravity situation, infrastructure would generallybe similar to equivalent terrestrial operations.
The smelting apparatus could be a stand-alone unit thatuses the Sun’s radiant energy. The smelter would be mobile,using low-powered thrusters to move around the asteroid, soas to always be on the side facing the Sun. This movementwwould depend on the current task of the smelter. Metal couldthen be fashioned into blocks ready for transport or mouldeddirectly into shapes for building material. Because of the lowgravity, soft metal could possibly be shaped in a similar wayto glass-making, by pulling and shaping the metal as itsolidifies (Roesler, 2013).
An economic evaluation of the 1986 DA operation, basedon a typical NPV analysis, was performed to determine thefinancial and technical feasibility of an off-Earth miningproject.
The design assumes that mining would be fullyautomated and that the relevant robotic technologies areavailable. Investigating the feasibility of a robotic operation isrelatively simple; there are no provisions made for sustaininglife. There would need to be a crew on Earth or in aspacecraft or station in orbit to monitor the operation tomaximize productivity and utilization of the equipment fleet.In other words, full automation is not assumed.
EEquipment selection and infrastructure
The main equipment components are machines for rockbreakage and drilling, handling broken ore, and support. Thelatter include fuel replenishing machines, robotic servicemachinery (mobile or fixed), mobile anchorage systems, andmining cover to collect perturbed ore.
There would also need to be other on-site componentsthat are separate from the task of mining, but are included inthe equipment costs, such as the smelting apparatus andstorage system (if payload is transported only when 1986 DAis a short distance from Earth).
On-site infrastructure includes components that are eitherfixed or mobile but are not directly involved in the miningoperation. The other infrastructure components are thestorage systems for both mined ‘run-of-mine’ ore and for thesmelted metal. These have to be lightweight holdingcontainers that are kept in position near the asteroid throughthe use of very low-power thrusters.
EEconomic analysis
The main part of the economic analysis involved a year-by-yyear cash flow analysis, and therefore a detailed financialand technical model was developed. The model includedtransport costs, mining/smelting equipment, mining costs,saleable material, and operating margin.
For capital cost analysis, it was considered unnecessaryto specify the number of spacecraft required to transportpayloads of metal from 1986 DA to Earth orbit. Instead, thecost per ton of payload was used. A spacecraft configurationrule of thumb (Turner, 2010) is that the payload weightaverages about one-third of a spacecraft’s dry weight. Owingto the long transit time, it is assumed that each spacecraft
fwill make one return trip per year. Because of this, the totalweight of the spacecraft is comparable to the annualproduction of the operation. At 20 Mt per year, the totalweight of the payload-bearing spacecraft would be 66.6 Mt.
Capital costs of all spacecraft were based on the Russian-based Angara A3 space vehicle, currently in development byKhrunichev State Research and Production Space Centre(Khrunichev State Research and Production Space Centre,2013). The mass of this vehicle will be 14.6 t and the totaldevelopment cost is US$70 million. In this respect, the costper ton of spacecraft needed is about US$19.4 million.
Capital costs are made up of both the transport equipmentand the mining equipment, which includes the costs of thesmelting, anchorage, and extraction equipment. The transportcapital was benchmarked at US$19 million per ton ofmachinery. Due to the limited level of knowledge aboutmining equipment costs, the assumed value for this elementwas also assumed to be US$19 million per ton. The totalcapital expenditure for the 1986 DA operation would be$1.31 × 10¹⁵.
Operating costs include the fuel costs for operation of allequipment (mining equipment and transportation equipment)as well as consumables for the mining operation. The amountof fuel needed for the transportation between Earth orbit and1986 DA was calculated by using the Tsiolkovsky rocketequation (Equation [1]) (Braeunig, 2012):
[1]
This formula uses the 66.6 Mt for vehicles calculatedpreviously, but this value is varied on each leg of the journeydepending on whether the spacecraft would be empty,carrying payloads, or transporting mining equipment. Thedelta-V is the change in velocity necessary to reach 1986 DAand is known to be 7.195 km/s (Benner, 2013). Cost of fuelwas assumed to be US$10 000 per ton, a relatively high costdue to the remote location of the operation. Consumableswere assumed to be US$5 000 per ton of ore mined. The totaloperating costs associated with the 1986 DA miningoperation equal just less than US$140 ×1012 in present value.This value assumes that a low-cost technology option wouldbe available in the orbit. Fuel costs comprise a major part ofthe total project costs, and will most likely be the parameterthat has the greatest effect on the feasibility of the 1986 DAmining operation. Table II summarizes the assumptions foreconomic analysis.
Assuming that all of the mined material is sold, 20 Mt ofstainless steel will be sold per annum, at a price of $8 millionper ton. This provides a yearly income of just above US$160× 1012, starting in the second year and continuing until the101st year, when the final shipment arrives at the market.The total revenue for steel sales throughout the life of themine (LOM) would be just over $1.45 × 10¹⁵ in presentvalue, before costs.
The NPV of the 1986 DA operation for a 100 year LOM iscalculated as just over US$658 billion. For the scale and thelength of life of the operation, this NPV cannot be consideredfeasible, even with an extremely high profit, since thisoperation has a payback period of 80 years (Figure 5). Theprofit made over the LOM is minimal compared to the initial
Mining off-Earth minerals: a long-term play?
The Journal of The Southern African Institute of Mining and Metallurgy VOLUME 114 DECEMBER 2014 1043 ▲

Mining off-Earth minerals: a long-term play?
capital investment. This evaluation has assumed 100% equityfinance; however, the results indicate that the large capitalinvestment (Table II) will be only marginally repaid. Theproject would therefore not be attractive because of therelatively small profit expected over 100 years in relation tothe large capital investment.
A sensitivity analysis was undertaken to indicate theeffects of different variables on the project NPV. This is animportant aspect of any financial evaluation, and even moreso for an off-Earth operation because of the relativeuncertainty of the NPV. The results of the sensitivity analysiscan be seen in Figure 6, which indicates that a number ofparameters strongly impact the NPV of the operation. Thisanalysis indicates the most important areas where furtherresearch and technology advances are required in order tomake asteroid mining and other forms of off-Earth miningoperations viable.
The metal price was based on the cost of purchasing andlaunching material from Earth to the asteroid’s orbit (NEA).As the NPV is very sensitive to this parameter, it isrecommended that further analysis is done on the expectedvvalue of materials in space. This value would changeconstantly, as it does on Earth, and hence establishing acorrect estimate for metal price would involve cross-disciplinary work beyond the scope of this project. Thisparameter cannot be changed by altering the project scope –the metal price is the cost of sourcing the material on theEarth and launching it into space. The value would increaseas Earth’s reserves of iron ore are diminished, but woulddecrease as space launches become more economical.WWhatever the case, the results indicate that this parameterstrongly affects the NPV of the 1986 DA mining operation.
The NPV is equally sensitive to the percentage of minedmetal that the operation manages to sell. It is assumed that20 Mt will be mined per annum; the market needs to be largeenough to absorb this amount for the project to succeed atcurrent figures. Mining in excess of the demand would bedetrimental to the operation. This parameter would onlynegatively impact the NPV, as it is not possible to sell moreproduct than the operation produces.
Another very critical parameter identified is the transportcapital. Due to the long travel time between 1986 DA andEarth, it is assumed that enough payload shuttles totransport a year’s worth of material are available. Costs fortransport could be reduced by building faster shuttles, so as
to reduce the total number needed, or by using lightweightmaterials to transport run-of-mine more efficiently.
The NPV of the operation is relatively insensitive to thethe fuel cost and the amount of fuel needed fortransportation, although it is still influenced by theseparameters. As for metal, it is hard to assume a value for fuelin space, but fuel costs could be reduced by establishing anin-space fuel industry. More fuel-efficient equipment andvehicles would also reduce the amount of fuel needed for theproject. Further research should be undertaken in thisdirection.
To further analyse the monetary value of the parametersthat have the greatest effect on the NPV, a number ofalternative case studies were developed from the base case.The first alternative assumes that the same mining rate, but
▲
1044 DECEMBER 2014 VOLUME 114 The Journal of The Southern African Institute of Mining and Metallurgy
Table II
Assumptions for the economic analysis
Parameter Value Discussion/source
Composition of 1986 DA 88% Fe; 10% Ni; 0.5% Co Ross, 2001Distance from Earth 0.5 AU Same as Mars, asteroid orbits between and outside Earth/MarsEquipment capital US$19.4 million per ton Russian - Angara A3 space vehicleEquipment mass 3 x payload Spacecraft design 101 (Turner, 2010)Fuel cost US$10 000 tonTransport fuel amount Varies on each trip Tsiolkovsky rocket equation – (Braeunig, 2012)Mining fuel amount 25 MtConsumable cost US$5k/t of ore US$ per ton of ore minedTransport time One year for a round trip This allows product to reach market in the year after it was minedValue of metal US$8 million per ton Cost of buying and launching metalDebt 100% Equity; 0% debt
Figure 6—Sensitivity analysis for 1986 DA mining operation
Figure 5—Discounted cash flow over the life of mine for the 1986 DAoperation

fonly 80% of the ore transported back to Earth orbit is soldeach year. This situation would have dramatic financialconsequences for the 1986 DA operation. The operationwwould not make a profit, as shown in Figure 7.
The second alternative case study assumes that there isan equivalent asteroid that is half as distant from the Earthas 1986 DA. This would halve the transport capital as twotrips could be made per year, utilizing the payload-bearingshuttles more productively. The payback period of thisalternative is 8.5 years and the NPV for this scenario is justover US$630 × 1012, which is much higher than for the basecase (Figure 8). As can be seen, the capital investment is alsogreat deal lower than that of the base case. This allows for aquicker payback and higher profit margin. This alternative istherefore much more feasible as a mining operation than thebase case operation.
The final alternative study assumes that the marketconsumers for the stainless steel product are either mobile orlocated relatively close to the mine site, so that notransportation of the refined material is necessary. The onlyneed for shuttles would be for yearly consumables and theinitial transportation of mining equipment. Because of thissmaller ongoing payload, it is important to spread the weightof the mining equipment transported to site across a numberof years. The first three years will thus involve the transportof increasing amounts of mining equipment to 1986 DA, withproduction rates ramping up to the base case amount. In thefirst year, half of the mining equipment will be taken to 1986DA, along with necessary fuel and consumables; in thesecond year other necessary equipment would be brought,wwith the remainder in the third year. This alternative yields amuch higher return than the base case situation. Thepayback period would be 5.5 years and the NPV for thisscenario would be almost US$916 × 1012 (Figure 9). As canbe seen, this scenario is a much more attractive investmentthan the base case, due to the short payback period and themuch higher NPV.
The risk of this project is that there would need to be asufficient market close to 1986 DA, or that customers wouldhave to collect the product from site themselves. This has thepotential to decrease the value of the product from the currentassumption of US$8 million per ton. As can be seen from thesensitivity analysis (Figure 6) and in Figure 5, the salespercentage is a very sensitive parameter and if this scenariocannot sustain a market of 20 Mt/a, the NPV of the projectwwill suffer dramatically.
ConclusionsThe time is approaching when an industrial market will bedeveloped in orbit around the Earth. Owing to the Earth’sfinite resources and the high costs of launching materialsfrom the Earth’s surface, this market may need an off-Earthminerals industry to supply it with essential raw materials,most importantly water. Before the industrial demand reachesan unmanageable level, relevant research needs to beconducted such that off-Earth mining is an attractiveinvestment for mining companies.
The increased resources could push the terrestrialminerals market into a surplus, damaging mining companies’terrestrial operations and depressing mineral prices. There is,however, a huge opportunity for mining companies to utilizeoff-Earth deposits to support space exploration anddevelopment. The mining industry has valuable experience indeveloping and applying technologies for discovering,extracting, and processing natural resources. This experiencewill allow the space industry to create a permanent and self-sustaining presence in space. The space industry, conversely,can benefit the mining industry through the advancement oftechnologies that will allow mineral extraction in not onlyoff-Earth situations, but also in hostile terrestrialenvironments such as deep oceans. A strategic partnershipbetween mining, space, and research organizations andindustries will be needed to achieve such a goal.
Mining off-Earth minerals: a long-term play?
The Journal of The Southern African Institute of Mining and Metallurgy VOLUME 114 DECEMBER 2014 1045 ▲
Figure 7—Discounted cash flow over the life of mine with 80% ofproduction sold
Figure 8—Discounted cash flow over the life of mine for an asteroid halfthe distance of 1986 DA from Earth
Figure 9—Discounted cash flow over the life of mine with the marketnear 1986 DA

Mining off-Earth minerals: a long-term play?
f f ffThe asteroid chosen to assess the feasibility of off-Earthmining in this study is a large metallic NEA approximately0.5 AU (half the distance between Earth and the Sun) fromEarth. The asteroid has a uniform composition that isessentially naturally-occurring stainless steel. This materialcould be used as a construction material for future satellitesand spacecraft.
A theoretical assessment of 1986 DA as a suitable mininglocation was conducted and, using certain assumptions, of aneconomic model developed to determine the financial value ofa mining operation on the asteroid.
1986 DA has a total reserve of 20 × 109 t of raw stainlesssteel which could be mined using an open cut strip-miningmethod or an underground drilling method. The operationwwould produce 20 Mt of stainless steel per year over a minelife of more than 100 years. This steel will be smelted andtransported by shuttle to an Earth orbit and marketed for off-Earth construction.
The results of the financial and technical model indicatethat the project would have a very high NPV of just overUS$658 × 109. However, due to the relatively large initial costof US$1.3 × 10¹⁵, the project cannot be considered awworthwhile operation.
A number of alternative case studies were investigated,wwith the highest NPV attributed to a scenario in which themined ore would be utilized near the mining operation andwwould not need to be transported to an Earth orbit. It wasconcluded that at current prices and with current technology,even with a number of assumptions such as a pre-existingfuel industry, the risk is too great for an asteroid miningoperation to succeed. The alternative case studies may beeconomically viable, but in reality the likely market for theproducts of a space mining operation will be developed inorbit around the Earth, as in the original case.
The NPV of the 1986 DA operation was found to be mostsensitive to the metal price, capital cost of transport, cost offuel, and the amount of fuel required. It is recommended thatthese parameters be further assessed.
It is recommended that similar analyses should beperformed for other known M-type NEAs. A comparison ofdifferent case studies would illustrate the benefits oftargeting nearby asteroids compared with asteroids with arelatively low delta-V or those with a valuable orebody, as isthe case with 1986 DA.
It is obvious that there is a severe lack of knowledgeabout specific NEAs (in terms of their compositions andsurface properties). It is hence recommended that before anymining company commits to a full-scale operation, physicalexploration be undertaken. This involves flybys and samplereturns from the asteroids. Although the full-scale extractionof off-Earth minerals is not currently feasible, it isrecommended that further research by the mining industry beundertaken, as space mining will eventually be inevitable asthe pace of space exploration and development activityincreases.
AAcknowledgements
The authors would like to acknowledge Dr Gordon Roesler forhis support and guidance during the research.
ReferencesBALLA, V.K., ROBERSON, L.B., O'CONNOR, G.W., TRIGWELL, S., BOSE, S., and
BANDYOPADHYAY, A. 2012. First demonstration on direct laser fabrication oflunar regolith parts. Rapid Prototyping Journal, vol. 18, no. 6.pp. 451–457.
BELFIORE, M. 2013. Deep space industries, a new asteroid-mining hopeful.www.popularmechanics.com/science/space [Accessed 19 May 2013].
BENNER, L.A.M. 2013. Near Earth asteroid delta-V for spacecraft rendezvous.echo.jpl.nasa.gov/~lance/delta_v/delta_v.rendezvous.h.html [Accessed 8September 2013].
BERNOLD, L.E. 2013. An Australian lunar soil simulant to study lunar miningand construction. Off Earth Mining Forum, University of New SouthWales, Sydney Australia, 19-21 February 2013.www.youtube.com/watch?v=yvBVuewGuxs [Accessed 17 May 2013].
BLAIR, B., DIAZ, J., DUKE, M., LAMASSOURE, E., EASTER, R., ODERMAN, M., andVAUCHERVV , M. 2002. Space resource economic analysis toolkit: the case forcommercial lunar ice mining. www.isdc2007.org [Accessed 19 May 2013].
BRAEUNIG, R.A. 2012. Rocket propulsion. www.braeunig.us/space/propuls.htm[Accessed 12 September 2013].
BUET, M., PEARSON, J., BENNETT, D.S., and KOMERATH, N. 2013. ‘CornucopiaMission’ robotic mining system for rapid earth orbit capture of asteroidresources. http://www.csc.caltech.edu/stuff/VoyagerFinalReport.pdf[Accessed 17 Nov 2013].
CREAGH, S. 2013. Moon mining a step closer with new lunar soil simulant. TheConversation. theconversation.com/moon-mining-a-step-closer-with-new-lunar-soil-simulant-12310 [Accessed 16 May 2013].
DUKE, M.B., GUSTAFSON, R.J., and RICERR , E.E. 1997. Mining lunar polar ice.American Institute of Aeronautics and Astronautics, Inc. (AIAA). AIAA-98-1069. pp. 1–10.
ERICKSON, K.R. 2006. Optimal architecture for an asteroid mining mission:equipment details and integration. Proceedings of Space 2006, San Jose,California, 19-21 September 2006. pp. 1–16.
GERTSCH, L.S. and GERTSCH, R.E. 2003. Surface mine design and planning forlunar regolith production. Space Technology and ApplicationsInternational Forum- STAIF 2003: Conference on Thermophysics inMicrogravity; Commercial/Civil Next Generation Space Transportation;Human Space Exploration. AIP Conference Proceedings, vol. 654.pp. 1108–1115.
INGEBRETSEN, M. 2001. Mining asteroids. IEEE Spectrum, vol. 38, no. 8.pp. 34–39.
KARRKK , L.J., PALEY, M.S., MARONE, M.J., KAUKLERKK , W.F., and CURRERI, P.A. 2012.Metals and oxygen mining from meteorites, asteroids and planets usingreusable ionic liquids. 2012 PISCES Conference, Pioneering PlanetarySurface Systems Technologies and Capabilities, Waikoloa, Hawaii, 11–15November 2012. www.ntrs.nasa.gov/search.jsp?R=20130001749[Accessed 17 May 2013].
KOWAL, C. 1988. Asteroids: their nature and utilization. Space ScienceTelescope Institute, Maryland, USA. p. 151.
KHRUNICHEVKK STATE RESEARCH ANDRR PRODUCTION SPACE CENTRE. 2013. Angara launchvehicles family. http://www.khrunichev.ru/main.php?id=44 [Accessed 12September 2013].
LUCAS, M.T. and HAGAN, P.C. 2014. Comparison of two excavation systems forthe mining of lunar regolith. Mining Education Australia Journal ofResearch Projects Review, vol. 3, no 1. Hagan, P. (ed.). AustralasianInstitute of Mining and Metallurgy, Carlton, Victoria, Australia. pp. 39-44.
MUFF, T., JOHNSON, L., KINGKK , R., and DUKE, M.B. 2004. A prototype bucket wheelexcavator for the moon, mars and Phobos. Proceedings of the 2004 SpaceTechnology and Applications International Forum (STAIF-004),Albuquerque, New Mexico, 8–11 February 2004.
O’LEARY, B. 1988. Asteroid mining and the moons of Mars. Acta Astronautica,vol. 17, no. 4. pp. 457–462.
OSTRO, S.J., CAMPBELL, D.B., CHANDLER, J.F., HINE, A.A., HUDSON, R.S., ROSEMA,K.D., and SHAPIRO, I.I. 1991. Asteroid 1986 DA: radar evidence for ametallic composition. Science, vol. 252. pp. 1399–1404.www.echo.jpl.nasa.gov/asteroids/ostro+1991_1986DA_science.pdf[Accessed 12 September 2013].
PELECH, T.M. 2013. Technical and economical evaluation of mining comets andthe moon for an off-earth water market. B. Eng. thesis, UNSW Australia,Sydney Australia.
PRADO, M.E. 2013. Asteroid mining. Projects to employ resources of the Moonand asteroids near Earth in the near term. www.permanent.com/asteroid-geologies.html [Accessed 10 May 2013].
PRICE, S.D. 2004. The surface properties of asteroids. Advances in SpaceResearch, vol. 33, no. 9. pp. 1548–1557.
▲
1046 DECEMBER 2014 VOLUME 114 The Journal of The Southern African Institute of Mining and Metallurgy

RAYMONDRR , C.A., JAUMANN, R., NATHUES, A., SIERKS, H., ROATSCH, T., PREUSKER, F.,SCHOLTEN, F., GASKELL, R.W., JORDA, L., KELLERKK , H.U., ZUBER, M.T., SMITH,D.E., MASTRODEMOS, N., and MOTTOLA, S. 2012. The Dawn topographyinvestigation. Space Science Review, vol. 163. pp. 487–510.
ROESLER, G. 2013. Australian Centre for Space Engineering Research, UNSWAustralia. Personal communication.
Ross, S.D. 2001. Near-earth asteroid mining. www2.esm.vt.edu/~sdross/papers/ross-asteroid-mining-2001.pdf [Accessed 16 May 2013].
SCHMITT, H.H., FARRELLY, C.T., and FRANKLIN, D.C. 2008. Mining and the futureof space exploration. Proceedings of the First International Future MiningConference and Exhibition 2008, Sydney. Saydam, S. (ed.). AustralasianInstitute of Mining and Metallurgy, Melbourne. pp. 91–97.
SLEZAK, M. 2013. Space miners hope to build first off-Earth economy. NewScientist, vol. 217, no. 2906. pp. 8–10.tt
SONTER, M.J. 1997. The technical and economical feasibility of mining the near-earth asteroids. Acta Astronautica, vol. 41, no. 4–10. pp. 637–647.
SONTER, M. 2001. Near earth objects as resources for space industrialization.Solar System Development Journal, vol. 1, no. 1. pp. 1–31.
SONTER f, M. 2013. Project concepts for near-term commercial asteroid mining.Off Earth Mining Forum, University of New South Wales, SydneyAustralia, 19-21 February 2013. www.youtube.com/watch?v=yvBVuewGuxs [Accessed 17 May 2013].
TURNER, M. 2010. Space design 101. Integrated Product Teams Lecture,University of Alabama, Huntsville, 18 January. matthewwturner.com/uah/IPT2010_spring/lectures_videos [Accessed 12 September 2013].
YEOMANSYY , D.K., OSTRO, S.J., and CHODAS, P.W. 1987. Radar astronomy of near-Earth asteroids. The Astronomical Journal, vol. 94, no. 1. pp. 189–200.
YOSHIKAWA, M., FUJIWARA, A., and KAWAGUCHIKK , J. 2007. The nature of asteroidItokawa revealed by Hayabusa. Proceedings of the InternationalAstronomical Union, vol.2, Symposium S236. pp. 401–416.
ZACHARIAS, M., GERTSCH, L., ABBUD-MADRID, A., BLAIR, B., and ZACNY, K. 2011.Real-world mining feasibility studies applied to asteroids, the Moon andMars. AIAA SPACE 2011 Conference & Exposition, Long Beach,California, 27-29 September 2011. ◆
Mining off-Earth minerals: a long-term play?
The Journal of The Southern African Institute of Mining and Metallurgy VOLUME 114 DECEMBER 2014 1047 ▲

MINING BUSINESS OPTIMISATIONCONFERENCE 2015
11 – 12 March 2015Mintek, Randburg, Johannesburg
BACKGROUND
OBJECTIVES
WHO SHOULD ATTEND
For further information contact:Conference Co-ordinator, Camielah Jardine, SAIMM
P O Box 61127, Marshalltown 2107Tel: (011) 834-1273/7 · Fax: (011) 833-8156 or (011) 838-5923
E-mail: [email protected] · Website: http://www.saimm.co.za
EXHIBITION/SPONSORSHIPThere are a number of sponsorship opportunitiesavailable. Companies wishing to sponsor or exhibitshould contact the Conference Co-ordinator.
ConferenceAnnouncement
If I asked them what they wanted,they would have told me:‘We need bigger candles.’
Thomas Edison

IntroductionIn recent times, mining of multi-reef horizonsin hard-rock mines has attracted moreattention. As these multi-reef environmentsare not yet fully understood and complex pillarstress regimes exists in these cases, designmethodologies are adopted from other methodsthat have been successful in the past (e.g.ggHedley and Grant application in single-reefhard-rock situations, adapted from Salamonand Munro for coal pillar designs).
It is known that a rock sample underuniaxial loading conditions will fail in one ofthe possible two modes; either indirect tension,wwhen the ends have a low friction angle, orshear, when the ends (or the complete sample)are confined (Jaeger, Cook, and Zimmerman,2007). A schematic of these two modes offailure is shown in Figure 1.
Furthermore, the uniaxial compressivestrength differs greatly as the loading directionrelative to the schistosity is changed (Salcedo,1983). Hence, if the loading of the pillar is notperpendicular, as is assumed by the tributaryarea theory, and the direction of loading is not
fnormal to the horizontal state of schistosity inthe pillar, the pillar strength will be less thaninitially anticipated (Figure 2).
The purpose of this paper is to determine ifthe mining environment – including the dip ofthe mining horizon, the depth of extraction,and instances where multi-reefing is practiced– materially affects the loading of pillars, andthe resulting influence of a possible shearstress component on the assumed factor ofsafety.
All modelling in this paper was done usingthe TEXAN numerical modelling code (Napierand Malan, 2007).
Complex pillar-loading environment Room-and-pillar layouts for hard-rock minesare commonly designed based on themethodology of creating an environment inwhich the ratio between the pillar strength andpillar load, commonly known as the factor ofsafety (FoS), is satisfactory (Equation [1]).
[1]
‘Stable’ coal designs are considered to havesafety factors of 1.6 and above. Jager andRyder (1999) commented that the sameshould apply to hard rock.
Following the successes of the Salamonand Munro (1967) pillar strength formulation,the same approach was sought in the hard-rock environment. The Hedley and Grant(1972) strength methodology followed a fewyears later, fitting limited information fromfield studies. Equation [2] shows the formulaused in determining the strength of a squarepillar.
The presence of shear stresses in pillars andthe effect on factor of safety in a room-and-pillar layoutby J.A. Maritz*
SynopsisSince the dawn of mining, pillars have been used as primary support toensure stable workings. Early designs were based on trial and error, afterwhich more scientific means developed over time. A vast amount ofprogress has been made, especially in soft-rock room-and-pillar designmethodologies, from which hard-rock design theories developed with minorchanges to constant parameter values. The commonly used Hedley andGrant method for hard rock and Salamon and Munro methodology for softrock draw on the tributary area associated with the pillar, the width-to-height ratio of the pillar, and a back-analysed strength reduction factor. Inthese methods, only the vertical stress, or stress normal to the pillarinfluences the load applied to the pillar. This investigation considers thepossible influence of shear stresses on pillars in a room-and-pillar layout insingle reef planes and multi-reef environments, based on elastic numericalmodelling methods. The possible shear stress poses a safety and financialrisk to the design process, whereby an undersized pillar would lead tounstable working conditions, whereas oversized pillars could lead to anunder-utilized ore resource.
Keywordsnumerical modelling, shear stress, factor of safety.
* Department of Mining Engineering, University ofPretoria, Pretoria, South Africa.
© The Southern African Institute of Mining andMetallurgy, 2014. ISSN 2225-6253. This paperwas first presented at, A Southern African SilverAnniversary, 2014 SOMP Annual Meeting, 26–30June 2014, The Maslow Hotel, Sandton, Gauteng.
1049The Journal of The Southern African Institute of Mining and Metallurgy VOLUME 114 DECEMBER 2014 ▲
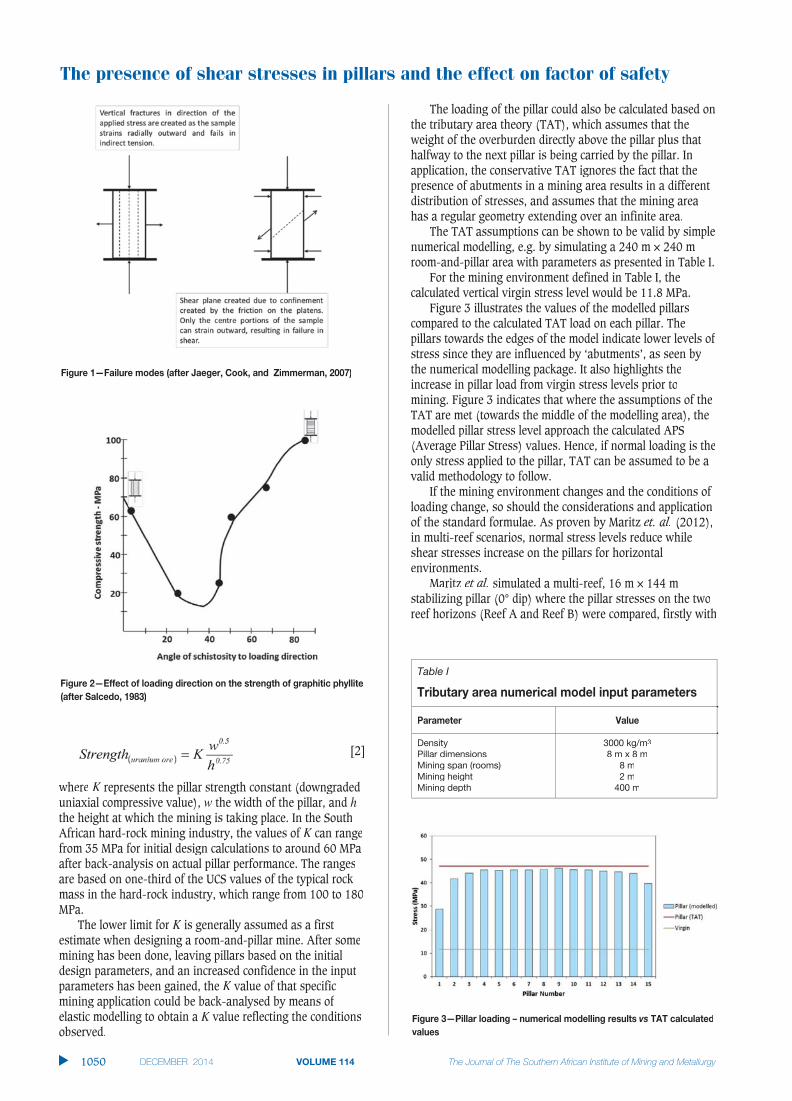
The presence of shear stresses in pillars and the effect on factor of safety
[2]
wwhere K represents the pillar strength constant (downgradeduniaxial compressive value), w the width of the pillar, and hthe height at which the mining is taking place. In the SouthAfrican hard-rock mining industry, the values of K can rangefrom 35 MPa for initial design calculations to around 60 MPaafter back-analysis on actual pillar performance. The rangesare based on one-third of the UCS values of the typical rockmass in the hard-rock industry, which range from 100 to 180MPa.
The lower limit for K is generally assumed as a firstestimate when designing a room-and-pillar mine. After somemining has been done, leaving pillars based on the initialdesign parameters, and an increased confidence in the inputparameters has been gained, the K value of that specificmining application could be back-analysed by means ofelastic modelling to obtain a K value reflecting the conditionsobserved.
fThe loading of the pillar could also be calculated based onthe tributary area theory (TAT), which assumes that theweight of the overburden directly above the pillar plus thathalfway to the next pillar is being carried by the pillar. Inapplication, the conservative TAT ignores the fact that thepresence of abutments in a mining area results in a differentdistribution of stresses, and assumes that the mining areahas a regular geometry extending over an infinite area.
The TAT assumptions can be shown to be valid by simplenumerical modelling, e.g. by simulating a 240 m × 240 mroom-and-pillar area with parameters as presented in Table I.
For the mining environment defined in Table I, thecalculated vertical virgin stress level would be 11.8 MPa.
Figure 3 illustrates the values of the modelled pillarscompared to the calculated TAT load on each pillar. Thepillars towards the edges of the model indicate lower levels ofstress since they are influenced by ‘abutments’, as seen bythe numerical modelling package. It also highlights theincrease in pillar load from virgin stress levels prior tomining. Figure 3 indicates that where the assumptions of theTAT are met (towards the middle of the modelling area), themodelled pillar stress level approach the calculated APS(Average Pillar Stress) values. Hence, if normal loading is theonly stress applied to the pillar, TAT can be assumed to be avalid methodology to follow.
If the mining environment changes and the conditions ofloading change, so should the considerations and applicationof the standard formulae. As proven by Maritz et. al. (2012),in multi-reef scenarios, normal stress levels reduce whileshear stresses increase on the pillars for horizontalenvironments.
Maritz et al. simulated a multi-reef, 16 m × 144 mstabilizing pillar (0° dip) where the pillar stresses on the tworeef horizons (Reef A and Reef B) were compared, firstly with
▲
1050 DECEMBER 2014 VOLUME 114 The Journal of The Southern African Institute of Mining and Metallurgy
Table I
Tributary area numerical model input parameters
Parameter Value
Density 3000 kg/m3
Pillar dimensions 8 m x 8 mMining span (rooms) 8 mMining height 2 mMining depth 400 m
Figure 1—Failure modes (after Jaeger, Cook, and Zimmerman, 2007)
Figure 2—Effect of loading direction on the strength of graphitic phyllite(after Salcedo, 1983)
Figure 3—Pillar loading – numerical modelling results vs TAT calculatedvalues

fonly Reef A being mined, and then comparing the pillarstresses when the second reef had been extracted. Themiddling between the reefs was set at 35 m (Figure 4), withthe pillars on Reef A and Reef B being superimposed.
Figure 5 depicts the reduction in normal stresses onidentical superimposed room-and-pillar layouts from asingle-reef environment to a multi-reef scenario, whereasFigure 6 highlights the shear stresses on the Reef B pillar inthe multi-reef scenario.
The significance of Figure 6 is that when Reef B isanalysed in isolation (Reef A ignored), no shear stresses arepresent on the pillar. Shear stresses appear as soon as Reef Ais considered.
f fAs the complex interaction of stresses in a multi-reefscenario is now apparent, this paper will investigate thechanging ratios between normal and shear stresses on pillarsas the reef dip angles changes and when multi-reef scenariosare introduced.
Simulating the effect of dip and mining depthThe effect of dip and mining depth on shear stress levels on apillar will be investigated using the excess shear stress (ESS)– Equation [3]:
[3]
The simulated shear stress (τmaxττ ) on a plane is resistedby a function of the friction angle (μ=tanμμ φ) and the normalφφ‘clamping’ stress (σn).
Positive ESS values suggest an unstable condition in thesense that shear failure could occur since the driving stress(τmax) exceed that of the shear strength (μσnσσ ). A number ofTEXAN simulations (Table II) were conducted on a standard240 m × 240 m room-and-pillar layout (Figure 7) to ascertainthe effect of dip and mining depth on the shear stress levels.
On a horizontal plane, as the depth increases the‘clamping’ stress increases, hence reducing the ESS levelsand resulting in a more stable shear environment. The planeassumed for the purpose of the ESS calculations was thecontact between the pillar and the hangingwall. Figure 4depicts the increasing level of stability on a horizontal planeat varying depths. ESS is simply a function of normal stress(increasing with depth) times the coefficient of friction, sincethe modelled shear stress component is zero. These ESSvalues are presented graphically in Figure 8.
The presence of shear stresses in pillars and the effect on factor of safety
1051The Journal of The Southern African Institute of Mining and Metallurgy VOLUME 114 DECEMBER 2014 ▲
Table II
List of models simulated with the associatedparameters
Model number Dip of reef plane (°) Depth below surface (m)
Base (BC) 0 400C1 0 600C2 0 800C3 30 400C4 30 600C5 30 800C6 60 400C7 60 600C8 60 800
60 60
Figure 4—Simulated layout with regional pillars (after Maritz et al., 2012)
Maritz et al., 2012)
Figure 6—Contours of shear stress for the Reef B pillar when positioned exactly below the Reef A pillar (after Maritz et al., 2012). The positive andnegative values of the indicated shear stresses are only an indication of the direction

The presence of shear stresses in pillars and the effect on factor of safety
The expected change in ESS becomes more obvious in thecases where the dips change. When the dip increases, thedriving shear stress increases, the normal stress reduces, andtherefore indicates likely instability with ESS valuesapproaching zero. Figure 9 depicts the change in the ESSvalues as the dip of the modelled horizon is increased.
The chances of observing ESS levels such as these in theSouth African context are considered to be very unlikely,since the hard-rock mining industry does not commonly
employ room-and-pillar layouts on reefs with dip anglesexceeding 15°.
Shear stress on stability pillarsRegional stability could be achieved by designing stabilitypillars, either on dip or along strike. These pillars aredesigned to control the energy release rate (ERR) associatedwith the mining span, reducing the incidence of seismicevents and rockbursting at working stope faces (Jager et al.,1999).
The shear stress values have been again scrutinized bymeans of a TEXAN set of numerical models comparing thedip configuration with the strike layout. A schematic of thetwo layouts is presented in Figure 10.
The model was set up with the parameters presented inTable III.
The resulting values are summarized below. From theanalysis it was found that the APS on the strike orientationexceed that of the dip layout by 4% and the shear stress by19%. The values obtained from the numerical modellinganalysis are presented in Table IV.
The shear stresses in the dip direction are presented inFigure 11.
High shear stress peaks are observed on the pillar edges,reducing in magnitude as the core is approached. In Figure 11A the area of the red contour (lower stress levels)far exceeds that of strike pillar presented in Figure 11B.Being an elastic numerical model, the results indicate thereason for dip pillars being a better regional support, takinginto account the K-ratio applicable to the environment andthe ride direction.
▲
1052 DECEMBER 2014 VOLUME 114 The Journal of The Southern African Institute of Mining and Metallurgy
Figure 8—ESS values on the pillars for model with zero dip as afunction of depth (friction angle of 20° on the plane)
Figure 9—ESS values on a plane at constant 400 m depth as a functionof dip with a friction angle of 20°
Figure 10—Schematic of modelled stability pillar layouts (red pillar indicating the pillar analysed)
Figure 7—A portion of the pillar geometry simulated

The plot of the shear and normal stress in the ESS context(Figure 12) leads to similar conclusions with respect to thebetter layout in a dipping environment.
The ESS contours on the strike-orientated pillar indicatelarge areas where the ESS levels are approximately zero,indicating possible areas of instability (a positive ESSdenotes instability). The dip pillar reflects a better tendencytowards stability.
Factor of safetyAs mentioned previously, the ratio between the pillarstrength and pillar load should be designed to a value of 1.6.This entails that an optimal extraction should be pursued thatshows economic value as well as providing the rock massstability needed to ensure a safe working environment.
As discussed earlier in this paper, the loading could becalculated either by the TAT approach, considering thelimitations and applications of the theory, or by means ofnumerical modelling. For the purpose of calculating the FoSin this section, the loading will be taken as that calculatedduring the numerical modelling process.
The foregoing analysis considers only the axial loading(normal stress), whereas Swart et al. (2000) suggested the
strength-to-load ratio representing the FoS should be revisedto include the shear stress levels of the pillar load stressmatrix. A graphical representation is given in Figure 13.
In Figure 13, σnσ depicts the normal stress on the pillar.and PS represents the uniaxial pillar strength. Swart et al.
ysuggest that where the standard FoS equation is calculated byPS/σnσσ the real safety factor should be presented by OE/OF.
The presence of shear stresses in pillars and the effect on factor of safety
The Journal of The Southern African Institute of Mining and Metallurgy VOLUME 114 DECEMBER 2014 1053 ▲
Table III
Stability pillar – TEXAN input parameters
Parameter Unit value
Vertical stress gradient 0.03 MPa/m
Depth below surface 1500 m
Gravitational constant g 9.81 m/s2
K-ratio 1.5
Reef dip 30°
Mined out / model sizeStrike (x(( dir) 250 mDip (y(( dir) 240 m
Poisson’s ratio 0.25
Young’s Modulus 65 GPa
Pillar dimension Dip dimension Strike dimension
Dip stability 40 m 16 m
Strike stability 16 m 40 m
Holings 10 m
Element size (modelling grid) 2 m x 2 m
Table IV
Comparison of average stress levels – dip vs strikestability
Orientation Single normal (MPa) Shear (MPa)
Dip Maximum 670 122Minimum 189 34Average 302 54
Strike Maximum 724 145Minimum 191 39Average 313 64
Figure 11—Simulated shear stresses on stability pillars
Figure 12—Comparatives ESS contours
Figure 13—Mohr circles of stresses acting on a pillar (after Swart et al.,2000)

The presence of shear stresses in pillars and the effect on factor of safety
f fThe suggested FoS equation for inclusion of the shearcomponent is:
[4]
with c being the cohesion and φφ the friction angle. Thestresses are given by σnσ for the normal and τ for the shearcomponent.
Swart et al. also expressed the cohesion in terms of thedowngraded strength of the rock mass (DRMS):
[5]
A TEXAN model had been set up to illustrate the variancein FoS values when including and excluding variousparameters. The model was adjusted to simulate a room-and-pillar layout at various dip angles (0° to 40°) so as to‘generate’ a shear stress component on the pillars. The inputparameters to the model can be read in Table V.
For illustrative purposes, the two versions of the FoS arecalculated for each scenario – firstly, using the Hedley andGrant methodology for hard-rock strength calculation; andsecondly, the Swart methodology, including the shear stress.Table VI summarizes the findings of this comparison.
Table VI shows that the FoS is reduced by around 37 percent on average when the Swart formula is applied,suggesting a reduction in the extraction ratio to accommodatea safe environment. The Swart formula even suggests areduction in the safety factor with no shear stress present,given the same strength constant in both formulae.
ConclusionsThe complex loading environment in a room-and-pillar layoutwwas investigated for both dipping and multiple reef scenarios.The existence of shear stress components as part of the pillarloading in a room-and-pillar layout has been identified bymeans of TEXAN numerical modelling code. From the elasticnumerical modelling results, it can be concluded that thestress and loading regime of pillars is highly influenced byvvarious factors, including the dip of the reef horizon, depthbelow surface, and multi-reef scenarios.
The orientation of larger scale pillar, such as regionalstability pillars, seems to have some significance when theshear component is analysed. It appears that both the normaland the shear component for dip stability pillars are less thanfor the strike counterpart.
If consensus is achieved on which of the pillar strengthformulae applies to the pillars in the extraction area, theinfluence of the shear stress, which reduces the safetyfactors, should be taken into account. It can thus beconcluded that the tributary area theory and formula, whichis believed to be conservative initially, might not be soconservative after all in cases where shear stresses arepresent.
AAcknowledgementsThis work forms part of the author’s MEng studies at theUniversity of Pretoria.
ReferencesBIENIAWSKI, Z.T. 1992. A method revised: coal pillar strength formula based on
field investigations. Workshop on Coal Pillar Mechanics and Design. IC9315. US Bureau of Mines, Pittsburgh, PA. pp. 158–165.
HEDLEY, D.G.F. and GRANT, F. 1972. Stope-and-pillar design for Elliot LakeUranium Mines. CIM Bulletin, vol. 65. pp 37–44.
JAEGER, J.C., COOK, N.G.W., and ZIMMERMAN, R.W. 2007. Fundamentals of RockMechanics. Wiley-Blackwell.
JAGER, A.J. and RYDERRR , J.A. (1999). A Handbook on Rock Engineering Practicefor Tabular Hard Rock Mines. Safety in Mines Research AdvisoryCommittee, Johannesburg.
MADDEN, B., CANBULAT, I., and YORK, G. 1998. Current South African coal pillarresearch. Journal of the South African Institute of Mining and Metallurgy,vol. 98, no. 1. pp. 7–10.
MARITZ, J.A. and MALAN, D.F. 2011. The influence of shear stress and weakcontacts on pillar behaviour. 12th ISRM International Congress on RockMechanics, Beijing, 18–21 October 2011.
MARITZ, J.A., MALAN, D.F., and PIPER, P.S. 2012. Estimating pillar stresses incomplex multi-reef layouts. Southern Hemisphere International RockEngineering Symposium, Sun City, South Africa, 14–17 May 2012.pp. 125–143.
NAPIER, J.A.L. and MALAN, D.F. 2007. The computational analysis of shallowdepth tabular mining problems. Journal of the Southern African Instituteof Mining and Metallurgy, vol. 107, no. 11. pp 725–742.
SALAMON, M.D.G. and MUNRO, A.H. 1967. A study of the strength of coal pillars.Journal of the South African Institute of Mining and Metallurgy,September 1967. pp. 56–67.
SALAMON, M.D.G. and WAGNERWW , H. 1985. Practical experiences in the design ofcoal pillars. Proceedings of the 21st International Conference of Safety inMines Research Institutes, Sydney, 21-25 October 1985. CRC Press.
SALCEDO, D. 1983. Macizos Rocosos: Caracterización, Resistencia al Corte yMecanismos de Rotura. 25 Aniversario Conferencia Soc. Venezolana deMecánica del Suelo e Ingeniería de Fundaciones, Caracas. pp. 143–172.
SWART, A., KEYTERKK , G., WESSELOO, J., STACEY, T., and JOUGHIN, W. 2000. Influenaceof surface topography on the loading of pillar workings in near surfaceand shallow mines. Safety in Mines Research Advisory Committee,Johannesburg. ◆
▲
1054 DECEMBER 2014 VOLUME 114 The Journal of The Southern African Institute of Mining and Metallurgy
Table V
TEXAN numerical modelling input parameters
Parameters Value
Friction angle 30°Extraction ratio 75%Pillar strength (K) 55 MPaPillar width 8 mMining height 1 mK-ratio 1.5Density 3000 kg/m3
Table VI
Factor of safety – Hedley and Grant vs Swartmethods
Dip (°) ττyz (MPa) ττzz (MPa) FoS (HG) FoS (S) Variance
0 - 45.68 3.41 2.20 35%10 -3.98 46.39 3.35 2.15 36%20 -7.27 48.29 3.22 2.02 37%30 -9.89 51.41 3.03 1.88 38%40 -11.22 55.11 2.82 1.77 37%
*Note: other simulation results omitted renderingthe same results on the variance

IntroductionIn the past decade, globalization andfluctuating mineral prices have had asignificant impact on the minerals industryand the suppliers and manufacturers thatservice it. At the same time, the mineralstertiary education institutions in mostcountries have found themselves battling to beself-sustainable (Phillips, 1999; Galvin andMcCarthy, 2001). The sustainability ofminerals education is a worldwide problemand not merely limited to Namibia. Forinstance, in Australia the skills shortage in themineral industry has been identified as one ofthe top risks facing the industry (MineralsCouncil of Australia, 1998; Ernest and Young,
2012). However, in Namibia, the skillsshortage of mineral professionals isaggravated by the fact that the Namibianminerals education institutions are still in theirinfancy, with the first graduates having beenproduced only at the end of 2013. This meansthat the Namibian minerals industry recruitsmost of its skill needs from outside thecountry. Musiyarira et al. (2013) confirmedthat the sustainability of the mineralseducation programmes in Namibia was a majorissue in the country's effort to tackle the skillsshortage. This study looks at the status of theminerals engineering programmes and revealshow the Polytechnic of Namibia has beentackling the threats to the sustainability of itsminerals education. The overall objective ofthis study is to analyse the progress,challenges, and lessons learnt and seek waysof addressing the challenges.
BackgroundThe Namibian economy is heavily dependenton the extraction and processing of mineralsfor export (Namibian Chamber of Mines,2014). Mining accounts for approximately11% of the GDP and for more than 50% offoreign exchange earnings (Namibia StatisticsAgency, 2013). Namibia is a primary source ofgem-quality diamonds and is ranked thefourth-largest producer of uranium in theworld. It also produces large quantities of zinc,gold, acid-grade fluorspar, copper, lead,
Interventions for ensuring sustainability ofthe minerals education programmes at thePolytechnic of Namibiaby D. Tesh*, H. Musiyarira*, G. Dzinomwa†, and H. Mischo‡
SynopsisThe mining industry worldwide is facing a tremendous shortage of mineralsengineers in all fields of specialization. For instance, in Australia the skillsshortage in the mining industry has been identified as one of the top risksfacing the mining industry. In Namibia most minerals engineers employedare expatriates, with some being Namibians who studied abroad. Theminerals engineering programmes at the Polytechnic of Namibia are still intheir infancy. These programmes were designed to meet the miningindustry skills needs. Being young has its advantages in that lessons canbe learnt from older minerals education institutions that went throughsimilar challenges. However, this does not imply just copying andimplementing their approaches, since the context differs and, to ensuresustainability of the minerals education programmes, curricula have to becustomized to the local context. This paper reviews the interventions madeby the Polytechnic of Namibia in order to ensure the sustainability of itsminerals education programmes. The methodology consisted of anextensive literature review, a status quo analysis of the mining andprocess engineering department, identifying the gaps between the currentstate and desired state, and mapping the goals and strategic actionsrequired to progress to the desired state. The following factors wereidentified as major threats to the sustainability of minerals education at thePolytechnic of Namibia: the quality of students, low student enrolmentrates, low pass rates in science and mathematics, shortage of academicstaff, dwindling government funding, and limited involvement of themining industry. The major outcomes of this research comprise the detailedstrategic actions employed by the Polytechnic of Namibia to address thethreats to sustainability of its minerals education programmes.
Keywordsmineral eduction, partnerships, Polytechnic of Namibia, sustainability.
* Department of Mining and Process Engineering,Polytechnic of Namibia, Windhoek, Namibia..
† Paasol Resources (Pty) Ltd, Harare, Zimbabwe.‡ Department of Mining Engineering, Technical
University Bergakademie, Freiberg, Freiberg,Germany.
© The Southern African Institute of Mining andMetallurgy, 2014. ISSN 2225-6253. This paperwas first presented at, A Southern African SilverAnniversary, 2014 SOMP Annual Meeting, 26–30June 2014, The Maslow Hotel, Sandton, Gauteng.
1055The Journal of The Southern African Institute of Mining and Metallurgy VOLUME 114 DECEMBER 2014 ▲

Interventions for ensuring sustainability of the minerals education programmes
cement, salt, dimension stone, and other minerals (NamibianChamber of Mines, 2014). The mining industry worldwide isfacing a tremendous shortage of minerals engineers in allfields of specialization (Fraser Institute, 2013). In Namibiamost mineral engineers employed are expatriates, with somebeing Namibians who studied abroad (Mischo, 2010). Astudy by the Namibian Chamber of Mines (2007) revealedthat there were shortages of mining and metallurgicalengineers in the mining sector. This situation is not unique toNamibia, and Musingwini et al. (2013) made similarobservations for the South African mineral industry.
In response to the mining boom, the University ofNamibia (UNAM) and Polytechnic of Namibia (PON)introduced minerals engineering degree programmes in2008/2009 and are in the process of developing professionaland further education programmes to meet future miningindustry skills needs and build a workforce that incorporatessustainable development into the production environment. Inorder for minerals engineering education to be sustainable, itis important for Namibia to learn from experience and bestpractices all over the world. This paper considers the case ofthe Polytechnic of Namibia which is in the process oftransforming into the Namibia University of Science andTechnology.
The minerals engineering programmes at the Polytechnicof Namibia are still in their infancy, with the first intakehaving graduated in October 2013. These programmes weredesigned to meet the skills needs of the mining industry. Thethreats to minerals education are generic worldwide, but thesolutions have to be context-specific. In a study of thesustainability of minerals education in Namibia, Musiyarira etal. (2013) identified seven interactive factors that may affectthe sustainability of minerals education. These are: (1) thefunding covering the essential needs of the institutions, (2)matching the number of graduates to the need of the miningand related industries, (3) the quality and quantity ofstudents enrolling for the programmes, (4) alliances andpartnerships with other educational institutions, (5) thequality and quantity of academic staff, (6) soundinfrastructure, and (7) well-developed and dynamic curricula.It is important to realize that these factors are not unique tothe Namibian mineral education system, but they arewworldwide trends as noted by other researchers (Cawood,2011; Galvin and McCarthy, 2001; Moudgil, 2006; Wagner,1999). The only difference is that all institutions are affecteddifferently and within the context of their development.
MethodologyAn extensive literature review was conducted, as well as asstatus quo analysis of the Mining and Process EngineeringDepartment at the Polytechnic of Namibia, identifying thegaps between current and desired states and mapping thegoals and actions requires to progress to the desired state.Reports and documents from various stakeholders wereanalysed. Comparative studies with established institutionsregionally and internationally were conducted in a bid tolearn from the experience of others. Since two of the authorsare Polytechnic of Namibia staff members and two arevvisiting academics at the same institution, the data wasreadily available.
Results and discussionThe following sections detail the strategic actions employedby the Department of Mining and Process Engineering(DMPE) at the Polytechnic of Namibia in tackling the threatsto its sustainability. Figure 1 summarizes the elements usedin strategies employed by the DMPE to tackle the threats toits sustainability. It can be seen that this is a holisticapproach, involving different strategies, all of which areequally important.
Funding covering the essential needs of theinstitutionsFigure 2 shows the running costs of the department, whichinclude operational, maintenance, and laboratory equipment(2010–2013). The value for 2014 is a projected figure. It canbe observed from Figure 2 that the running cost has beenincreasing steadily each year. However, the authors note withconcern that the funding is being threatened by a budget cutfrom the government.
The quality and quantity of student enrolments for theprogrammesEnrolment into the programmes has gradually increased from2009 to 2013, as shown in Figure 3. However, from 2013 to2014 the enrolment decreased. This is mainly due to poormatric results, with most of the applicants not meeting theadmission requirements. In order to address this challenge,the Polytechnic of Namibia has taken a proactive approach,which includes the establishment of a preparatory year (Pre-Engineering), with the aim of building up the students’ skillsin the core subjects, namely mathematics, physics, and
▲
1056 DECEMBER 2014 VOLUME 114 The Journal of The Southern African Institute of Mining and Metallurgy
Figure 1—Minerals education strategies used by the DMPE
Figure 2—Operation and maintenance costs

chemistry. Another strategy employed is to organize schoolsoutreach programmes with the aim of encouraging studentsto join the local minerals engineering programmes. Theseoutreach trips are complemented by the annual career fairsthat are held in March of every year. It was found that mostof the best-performing school leavers prefer to study at SouthAAfrican universities, sometimes out of ignorance of what isavailable in their own country.
Staff developmentStaffing levels in the Department of Mining and ProcessEngineering at the Polytechnic of Namibia have been growingsteadily, as shown in Figure 4, but there are still 10vvacancies to be filled. The Department continues to rely onvvisiting academics in order to meet its teaching needs.
The authors noted that 95% of all the DMPE staffmembers who are not PhD holders are undertaking studiestowards higher qualifications (are enrolled for MSc and PhDdegrees); as shown in Figure 5. This will serve to increasethe number of permanent academic staff in order to ensurethat the programmes are sustainable.
AAlliances and partnerships with educationaliinstitutionsAAlliances with international and regional institutions play animportant role in contributing to the sustainability of theDMPE. This has been the case for student and staff (visitingacademics) exchange. It is expected that with time thereliance on visiting lecturers will decrease. Figure 6 showsthe major partners of the DMPE.
Sound infrastructureInvestment for operations, maintenance, laboratoryequipment, and salaries in the Department of Mining andProcess Engineering has been increasing steadily, as shownin Figure 7. A five-storey, 200-million Namibian dollarbuilding is being erected, and the DMPE will occupy 40% ofthe total space. Dedicated laboratories for mining andmetallurgy will be set up and equipment is being acquired.
Sound strategic planning and developmentThe DMPE drafted its strategic plan in 2012. A strategic planis important since it allows an organization to makefundamental decisions or choices by taking a long-rangevview of what it hopes to accomplish and how it will do so.This plan reasserts the department’s vision, mission, andvvalues and establishes eight strategic goals. The plan
frecognizes existing strengths – for example, providing astudent-centred teaching and learning environment – andseeks to reinforce and develop these qualities. It blends bothcontinuity and change, hence identifying niche areas on
Interventions for ensuring sustainability of the minerals education programmes
1057The Journal of The Southern African Institute of Mining and Metallurgy VOLUME 114 DECEMBER 2014 ▲
Figure 4—Academic staff profile of the DMPE
Figure 5—Staffing profile in the DMPE: current and projected
Figure 6—Alliances with external partners
Figure 7—Budget for operational and maintenance

Interventions for ensuring sustainability of the minerals education programmes
wwhich the department needs to concentrate in order to realizeits full potential. This plan articulates a course by which theDepartment of Mining and Process Engineering will build itsreputation as a world-class department, dedicated to makinga difference in the lives of its staff and students.
LLinking staff to companies’ needsFor any country to develop technologically and economicallythere must be a strong link between industry, government,and academic institutions. All courses and programmesoffered by such institutions derive their relevance from theneeds of the nations they serve, and hence should promotedevelopment of existing and future industries. The directionof the research of the DMPE was defined based on a thoroughmapping of the Namibian mineral industry. This has theadvantage of improving the synergy between the DMPE andthe companies within the Namibian mineral industry.
IIndustrial advisory boardIn March 2014, the DMPE set up an industrial advisory boardwwith the primary role of providing strategic direction andadvice to the Department. The Advisory Board is expected tohave an oversight role in curriculum development as well asin ensuring a strong interaction between the department andthe mineral industry. The principle behind the setting up ofthe board is to involve industry in the value chain forproducing ‘mineral-industry-ready’ graduates. From a qualityperspective, process ownership is critical in ensuring goodoutput. This has major advantages for the mining companiessince they get the opportunity to mould the quality ofoutput/graduates instead of having to rework the graduates,wwhich is termed ‘end-of-pipe panelbeating’ and entailsggsignificant costs. The involvement of the minerals industry asadvisors will also allow the timeous provision of feedback tothe university for improvement.
IInternational accreditationAccreditation of engineering programmes is an importantcomponent of the sustainability of any teaching programme,as it ensures that the programme is aligned with interna-tionally recognized bodies. It also serves as a qualitystandard and ensures that engineering graduates will be ableto work in any country and not only in their own country. Insouthern Africa, the most prominent engineering body is theEngineering Council of South Africa (ECSA), which is alignedwwith the Washington Accord. In 2011 ECSA was requested bythe Engineering Council of Namibia (ECN) and thePolytechnic of Namibia to assess the programmes forprovisional accreditation of the degree programme in miningengineering. As everywhere else, there were teethingproblems that could not be overcome in the few years that thedepartment had been in existence. The establishment of theindustrial advisory board, the development of the strategicplan, staff development, acquisition of state-of-the-artlaboratory equipment, and the expansion of the resource basefor the department are some of the efforts to address theconcerns raised by the ECSA delegation.
ConclusionsThe minerals engineering programmes at the Polytechnic ofNamibia are still in their infancy, with the first intake having
graduated in October 2013. This study has looked at thestatus of the minerals engineering programmes and revealshow the Polytechnic of Namibia has been tackling the threatsto their sustainability. The major outcomes of this study werethe detailed strategic actions taken by the Polytechnic ofNamibia to address the threats to the sustainability of itsminerals education programmes. The engagement of localand international partners, coupled with the bridging year toground students in mathematics and science, and staffdevelopment, among others, are regarded as being instru-mental in ensuring the sustainability of the mineralseducation programmes at the Polytechnic of Namibia.
References
CAWOOD, F.T. 2011. Threats to the South African minerals sector–an
independent view on the investment environment for mining. Journal of
the Southern African Institute of Mining and Metallurgy, vol. 111, no. 12.
pp. 469–474.
CHAMBER OF MINES OF NAMIBIA. 2007. Skills and Needs Analysis Report.
Windhoek.
CHAMBER OF MINES OF NAMIBIA. 2012. Annual Review Report 2012. Windhoek.
ERNEST AND YOUNG. 2012. Business Risks facing Mining and Metals 2012-2013.
http://www.ey.com/Publication/vwLUAssets/Business-risk-facing-
mining-and-metals-2012-2013/$FILE/ Business-risk-facing-mining-and-
metals-2012 - 2013.pdf [Accessed 27 March 2013]. pp. 1–48.
GALVIN, J.M. and MCCARTHY, P.J. Mining education: driven by global impacts.
Proceedings of Explo 2001, Hunter Valley, NSW, 28–31 October 2001.
Australasian Institute of Mining and Metallurgy, Carlton, South Victoria,
Australia. pp. 9–14.
MINERALS COUNCIL OF AUSTRALIA. 1998. Back from the Brink: Reshaping Minerals
Tertiary Education. National Tertiary Education Task Force discussion
paper.
MISCHO, H. 2010. Bergbaustudium - Aufbau eines Bergbaustudienganges an
der Polytechnic of Namibia [Development and Implementation of a new
Mining Engineering Programme at the Polytechnic of Namibia]. Glückauf
(Essen), vol. 146, no. 4. pp.168–173.
MOUDGIL, B. 2006. An interview with the 2006 SME President. Mining
Engineering, vol. 58, no. 3. pp. 32–36.gg
MUSINGWINI, C., CRUISE, J.A., and PHILLIPS, H.R. 2013. A perspective on the supply
and utilization of mining graduates in the South African context. Journal
of the Southern African Institute of Mining and Metallurgy, vol. 113,
no. 3. pp. 235–241.
MUSIYARIRA, H., TESH, D., and DZINOMWA, G. Challenges of promoting sustain-
ability in the Namibian minerals education. Proceedings of the 6th
International Conference on Sustainable Development in the Minerals
Industry, Milos Island, Greece, 30 June – 3 July 2013. pp. 25–30.
OECD. 2012. Namibia. OECD Publishing, Paris, France.
http://www.oecd.org/countries/namibia/ [Accessed 27 March, 2013].
p. 477.
PHILLIPS, H.R. 1999. Mining education in South Africa - past, present and
future. CIM Bulletin, vol. 92, no. 1033. pp. 101–106.
WAGNERWW , H. 1999. How to address the crisis of mining engineering education in
the Western World? Mineral Resources Engineering, vol. 8, no. 4.gg
pp. 471–481. ◆
▲
1058 DECEMBER 2014 VOLUME 114 The Journal of The Southern African Institute of Mining and Metallurgy

Introduction The monitoring of atmospheric conditions inunderground coal mines is an important taskthat helps mine operators run the ventilationsystems in a more efficient manner, thereforeensuring a safe environment for all minepersonnel. The layout of the sensors in eachmine depends on mine geometry, the design ofthe ventilation system, the availability ofpower and communication lines to each sensorlocation, and other factors. Currently, severalreal-time monitoring techniques are availablethat allow mine operators to monitor allvventilation parameters, such as air flow, airvvelocity, pressure drop, and gas concentrationat various locations throughout a mine.
Although advances in electronics and datatransmission systems have led to progress inthis field in recent years, monitoring ofatmospheric conditions still presentschallenges due to the limitations in currenttechnologies in terms of accuracy, responsetime, range, sensitivity, and ruggedness ofequipment.
In the USA, atmospheric monitoring inunderground coal mines is not onlymandatory, but systems should be designedand implemented according to existingregulations, i.e., Title 30 of the Code of FederalRegulations (CFR). More specifically, undercurrent atmospheric monitoring system (AMS)regulations (CFR 30 §75.351), data archivingis not required. The regulation states thatrecords must be kept regarding alert or alarmsignals, AMS malfunctions, and seven-daytests of alert and alarm signals conducted. Therecords must note the person that recorded theinformation, and be kept in a secure book orelectronic system that is not susceptible toalteration. These records must be kept for oneyear at a surface location at the mine and beavailable for inspection by miners andauthorized representatives of the Secretary(CFR 30 §75.351). The required records arelimited to alert or alarm signals, malfunctions,system tests, and calibration. Furthermore, inthe case of coal mines, the equipment shouldbe ‘permissible’ i.e. it should meet the specifi-cations by the US Mine Safety and HealthAdministration (MSHA) for the constructionand maintenance of such equipment, to assurethat it will not cause a mine explosion or minefire.
Depending on the size and type of theunderground mine, atmospheric monitoringshould gather data that covers several differentparameters that characterize the atmosphericconditions underground, including (but notlimited to) concentrations of various gases(CO, CO2, CH4, etc.), wet and dry temperature,humidity, barometric pressure, air flow, fanperformance indicators, air velocity, and totalair pressure loss.
Development of an atmospheric data-management system for underground coalminesby Z. Agioutantis*, K. Luxbacher†, M. Karmis†, and S.Schafrik†
SynopsisWith increasing demand for real-time monitoring of mine parameters, therequirement for appropriate data management in many mining applicationsis also increasing. This includes atmospheric monitoring in undergroundcoal and metal mines. Although a number of different (real-time)monitoring systems have been installed in underground mines, they alltypically share the same systems or sub-systems, where each sub-systemmay include both custom hardware and / or software components. Inaddition, monitoring components installed in underground coal mines inthe USA should also be intrinsically safe and approved by the US MineSafety and Health Administration.
Real-time analysis adds complexity to the system since data validationand storage should be completed independently of filtering, data reductionoperations, or visualization. Real-time processing may include statisticalevaluation, trending, cross-correlation, and real-time alarm or warninggeneration.
This paper presents the concept and design of an integrated systemunder development for atmospheric monitoring in US coal mines.
Keywordsmine ventilation, real-time monitoring, data management.
* University of Kentucky, USA.† Virginia Center for Coal and Energy Research,
Virginia Tech, USA.© The Southern African Institute of Mining and
Metallurgy, 2014. ISSN 2225-6253. This paperwas first presented at, A Southern African SilverAnniversary, 2014 SOMP Annual Meeting, 26–30June 2014, The Maslow Hotel, Sandton, Gauteng.
1059The Journal of The Southern African Institute of Mining and Metallurgy VOLUME 114 DECEMBER 2014 ▲

Development of an atmospheric data-management system for underground coal mines
Proper monitoring becomes even more important in thecase of coal mines, where high methane concentrationspresent a hazard and/or high CO indicates development of afire. In addition to everyday operations, atmosphericmonitoring can be used to detect incidents such as explosionsbehind seals, a methane ignition at the face, a belt fire, etc.However, it should be noted that atmospheric monitoringsensors commonly used to detect the parameters of interestmay be currently limited in response time and sensitivity.
Current monitoring technologies in US coal mines
A simplified layout of a typical system currently installed inUS coal mines is shown in Figure 1. Any equipment installedin the mine area should be ‘permissible’. Data transmission iscurrently accomplished mainly via fibre optic lines usingcommercial protocols such as ethernet over TCP/IP. Near-sensor communication is often via copper cable to a fibrejjunction box
The stations that provide power and coordinate datatransmission to the surface are usually driven byprogrammable logic controllers (PLCs) that allow ‘smart’communication between the surface computer(s) and theunderground equipment. PLCs can usually report on thestatus of communications with a sensor, the status of asensor, and keep track of multiple sensors per station. Poweris usually transmitted to sensors via the same cable thatgathers data. Data is usually converted from analog to digitalat the sensor level and is transmitted as digital information tothe surface.
At the surface location, dedicated computer unitscommunicate with the PLCs at mine level and coordinate dataflow to a database and a digital display system available tooperators (Figure 2). These systems are typically calledhuman-machine interfaces (HMIs) or supervisory control anddata acquisition (SCADA) systems. Operators can interfacewith PLCs through these systems, e.g., acknowledge alarms,start / stop equipment, etc.
▲
1060 DECEMBER 2014 VOLUME 114 The Journal of The Southern African Institute of Mining and Metallurgy
Figure 1—Simplified layout of sensor deployment in US coal mines
Figure 2—Data acquisition for atmospheric monitoring in coal mines
fIn terms of hardware, such systems typically includethree basic component groups: (a) the sensors (and dataloggers / converters) responsible for data acquisition, (b) thecommunication sub-system responsible for transmitting datato a central location, and (c) the processing and storage sub-system, comprising one or more computer units, responsiblefor data processing and temporary or permanent data storage.In addition, software operating off the processing and storagesub-system is responsible for coordinating data acquisition,vvalidating collected data, visualization, data analysis, andreport generation.
Such systems are usually built to comply with MSHAregulations as stated above, and lack advanced data analysiscapabilities such as variable cross-correlation, correlationwwith variables external to the database, etc. Furthermore, atypical database system implemented on such systems isconfigured to store data on a moving 7-day or 14-daywwindow, i.e. old data is erased every day.
In some system implementations, data for selectedmonitored parameters is exported to daily, weekly, or otherfiles for archiving and storage. It is obvious that the data insuch files cannot be easily managed and analysed unless it isstored in a common database.
Data management and analysis in mine ventilation isperhaps most heavily utilized in metal and nonmetal minesthat have implemented ventilation on demand (VOD). Manyof the same management and analysis challenges have beenidentified, such as the inherent complexity of minevventilation systems, and development of robust datacollection, storage, and management (e.g. Meyer, 2008;ggTonnos and Allen, 2008). Additionally, these mines havedemonstrated measureable improvements in safety andefficiency through application of such systems (e.g.,ggGunderson et al., 2005; O’Connor, 2008; Karsten andMackay, 2012) Although VOD is not applicable tounderground coal mines in the USA, due to restrictions in theamount of airflow change allowed while people areunderground (CFR 30 §75.324), the data management andanalysis methods developed for application of VOD arecertainly applicable.
Database design
AA relational database application was developed that hasbuilt-in data capture and analysis capabilities. Thisapplication, called ‘Atmospheric Monitoring Analysis andDatabase mAnagement’ (or AMANDA), is specificallydesigned for AMS data. The capabilities of the system arediscussed in this section.
Data management of an AMS should ensure that theintegrity of historical data is maintained. Underground minesgenerate a large range of data, and this presents a challengefor the AMS database system, especially with systems thathave many sensors reporting a large quantity of data. Forinstance, assume that each data record corresponding to asingle measurement value from a given sensor may require astorage space of about 50 bytes (date-time stamp, tagnumber, project number, value, etc.). In typical applications,data may be gathered every few seconds. If one data value issampled every ten seconds, there would be approximately0.412 MB of data generated per sensor per day. For a minewwith 20 sensors, approximately 8.2 MB of data is generated
fdaily. One year of data with only 20 sensors corresponds toapproximately 3.0 GB. Large mining operations andprocessing plants may incorporate several hundreds (eventhousands) of sensors throughout the operation to controland monitor devices. If a large mining operation deploys 300sensors and its processing plant utilizes 400 sensors, with asampling frequency of 10 seconds, those sensors wouldgenerate approximately 288 MB daily and 105 GB each year.This estimate does not include other data that can illuminatetrends further, e.g., measures of loads on mechanized cuttingand hauling equipment, physical locations of people andequipment via tracking technology, and maintenance,surveying, and production data.
Storage of this data presents a set of challenges; thosewith fairly simple solutions are not discussed in this paper.Management and utilization of the data is critical to theoperation. Optimizing the placement of monitoring systems toacquire the most critical information, and transmitting theinformation to a centralized location with a sophisticatedstorage method has value only if the data can be understoodand utilized by a decision-maker.
The AMANDA data management system has a number ofsubsystems, e.g. for data acquisition; data analysis,ggvalidation, and storage; visualization and reporting of thedata; alarm generation; and tools for statistical evaluationand cross-correlation. Thus, the database was designed withthe following characteristics:
➤ Deployable on a 64-bit system to allow for large files➤ Built on a relational database model➤ Implemented as a client / server system➤ Allows multiple indexing of the data records to assure
a quick response to queries.
In addition, the data management application allows:
➤ Data collection for multiple projects; a project is definedas a collection of sensor data as implemented in asingle mine database
➤ A fully parametric definition of the sensor types thatwill be used in a project. Each parameter measured by aPLC-driven sensor is called a tag; multiple user-definedtags can be defined per project, and a unique sensortype can be assigned per tag
➤ Importing of data files exported by current AMSimplementations (Figure 3)
➤ Importing of external data such as barometric pressureor temperature as recorded by weather stationsavailable on the internet (Figure 3)
➤ Identification of missing data➤ Setting of individual warning and alarm thresholds per
tag.Figure 3 presents a simplified diagram that shows data
flow from the sensors to the currently available ‘MineDatabase’. AMANDA is external to this data flow and onlyreads data available by automatic export by the mine system.AMANDA thus cannot directly or indirectly interfere with theinstalled data acquisition system.
Data from a US coal mine was imported to the database(Griffin, 2013). In this coal mine, multiple methane and COsensors have been installed, in addition to the usual sensorsfor fan, belt, and other operations. Data was available in DBFformat on a daily basis. More specifically, for every day twofiles were generated by the existing system: a ‘tag’ file, which
Development of an atmospheric data-management system for underground coal mines
1061The Journal of The Southern African Institute of Mining and Metallurgy VOLUME 114 DECEMBER 2014 ▲

Development of an atmospheric data-management system for underground coal mines
flisted the ‘tags’ or sensors that were monitored, and forwwhich data was collected and saved; and the main data file(also in DBF format), which listed the data in columns. Eachrow represented measurements at a different timestamp. Foreach ‘tag’ two columns were provided, one with the valueread from the sensor and one with the status of the sensor. Atypical daily file included 8600 rows (sampling about every10 seconds) and over 80 columns which correspond to 40sensors. Prior to data import, a project was defined and thesensors were added to the project. When daily data wasimported, each data value and its time stamp were assignedto the corresponding sensor and project.
There was no barometric pressure sensor installed at themine at that time. Data from a nearby publicly availablewweather station was downloaded and imported into thedatabase into a separate ‘tag’, which was assigned to theexternal sensor. During importing, data was not altered inany way. Erroneous values (i.e. negative or extreme values)wwere also imported. The user can isolate these values byflagging them, but the raw data is always available forinspection.
Once data has been imported into the relational database,it is easy to select specific data groups for plotting andanalysis. The program can plot any of the recorded tagsversus time. Data can also be displayed in a continuous modeby displaying a moving window of one or multiple days.
Figure 4 shows an example of ventilation fan motoramperes. The fan motor power consumption variesthroughout daily operation, demonstrating that tracking fanperformance can be just as important as monitoringunderground gas levels. Fluctuations in the fan motoramperes can be due to the motor efficiency, outsidetemperature, air density, movement in mine openings, and awwide variety of other factors. Monitoring fan performance canalso help the mine operator understand if changes in gasconcentrations are related to fan performance. Fanperformance is an example of a variable that can contribute tochanges in gas concentration and must be analysed withother data to allow for the emergence of critical trends.
fFigures 5a and 5b show examples of superimposed datacollected by two methane sensors (right axis, methaneconcentration in per cent) at two different mine locations onreturn airways (green and blue curves) and the surfacebarometric pressure (left axis, inches Hg). It can be seen thatsudden decreases in the barometric pressure coincide with animmediate increase in the methane percentage in these twolocations. The horizontal axis corresponds to a time period of7 days.
Although, the correlation of barometric pressure andmethane concentration has been cited several times(Fauconnier, 1992; Lloyd and Cook 2004), with the newdatabase management system this simple correlation bysuperposition was very easily accomplished.
▲
1062 DECEMBER 2014 VOLUME 114 The Journal of The Southern African Institute of Mining and Metallurgy
Figure 3—Data flow to the mine database and to the AMANDA database
Figure 4—Monitoring of the electrical current on a fan motor over athree-day period

Summary and conclusionsA new database management system was developed in orderto facilitate the massive undertaking of maintaining, storing,reviewing, analysing, and interpreting large amounts of datagenerated daily by sensors installed in underground coalmines. The database is capable of handling multiple projectsand multiple sensor sets per project. Data can also beimported from external sources.
In terms of application development, current work isfocusing on identifying and analysing peaks (or spikes) in agiven time-series. While it is easy to visually identify peaksin a short time window, there is a need to formalize peakdetection to determine whether these peaks correspond tosignificant increases or decreases.
In terms of data analysis, the next step would be tocorrelate other collected parameters with each other, such asproduction and methane emissions, fan performance andbarometric pressure or daily temperature variation, etc. Thisis a primary, but complex function; this data may be utilizedto better characterize the behaviour of a mine environment,wwhich is a complex engineered system. This includesdetermining and verifying causality (e.g. falling barometricggpressure, malfunctioning fan, increased production) when aparameter trends in an alarming manner (e.g. rising methaneggconcentrations), so that high-risk situations can beremediated.
The importance of the human interface will be alsoexamined. The most advanced human-computer interfaces inmining have generally been directed toward the stationaryoperator, or a person who has oversight of all the sensors ina mine. While communication via these interfaces isessential, and has led to improved safety and efficiency,many mine personnel do not have access to data that canallow them to better assess situations and make moreinformed decisions. The challenge is to design technologythat is portable, rugged, and safe for use in underground coalmines, and to design software that rapidly conveys emergingdata trends to mine personnel. These trends should allowpersonnel to anticipate system failure (e.g., ventilation,ground, equipment) or to verify safe conditions. An interface
f f ffor the AMANDA software will be developed and assessed forease of use, knowledge gains to the user, and speed ofinformation uptake.
Implementation of advanced monitoring and analysissystems in mines is challenging due to the dynamic natureand unique attributes of any single mine, but the gains inhealth and safety as a result of more informed decision-making are well worth the investment in resources andtechnology.
References FAUCONNIER, C.J. 1992. Fluctuations in barometric pressure as a contributory
factor to gas explosions in South African mines. Journal of the SouthAfrican Institute of Mining and Metallurgy, vol. 92, no. 5. pp. 131–147.
GRIFFIN, K.R. 2013. Utilization and Implementation of Atmospheric MonitoringSystems in United States Underground Coal Mines and Application of RiskAssessment. Doctoral dissertation. Virginia Tech, Blacksburg, VA.
GUNDERSON, R.E., VON GLEHN, F.H., and WILSONWW , R.W. 2005. Improving theefficiency of mine ventilation and cooling systems through active control.8th International Mine Ventilation Congress, Brisbane, Queensland, 6–8July 2005. Gillies, A.D.S. (ed.). Australasian Institute of Mining andMetallurgy, Carlton, Victoria. 6 pp.
KARSTENKK , M. and MACKAY, L. 2012. Underground environmental challenges indeep platinum mining and some suggested solutions. Platinum 2012, 5thInternational Platinum Conference – ‘A Catalyst for Change’, Sun City,South Africa, 18–20 September 2012. Southern African Institute ofMining and Metallurgy, Johannesburg. pp. 177-192.
LLOYD, P.J.D. and COOK, A. 2004. Methane release from South African coalmines. Journal of the South African Institute of Mining and Metallurgy,vol. 105, no. 8. pp. 483–490.
MEYER, M.A. 2008. Implementing a tracking and ventilation control system atBarrick Goldstrike’s underground division. 12th U.S./North AmericanMine Ventilation Symposium, Reno, Nevada, 9–11 June 2008. Wallace, K.(ed.). Society for Mining, Metallurgy & Exploration, Englewood, CO.pp. 13–18.
O’CONNOR, D.F. 2008. Ventilation on demand (VOD) auxiliary fan project – ValeInco Limited, Creighton Mine. 12th U.S./North American Mine VentilationSymposium, Reno, Nevada, 9–11 June 2008. Wallace, K. (ed.). Society forMining, Metallurgy & Exploration, Englewood, CO. pp. 41–44.
TONNOS, A.M. and ALLEN, C. 2008. Technology convergence for sustainableunderground mine ventilation system control. 12th U.S./North AmericanMine Ventilation Symposium. Reno, Nevada, 9–11 June 2008 Wallace, K.(ed.). Society for Mining, Metallurgy & Exploration, Englewood, CO.pp. 37–40.
US Department of Labor, Mine Safety and Health Administration. 2014. Title30, Code of Federal Regulations, Parts 1-199, Mineral Resources.http://www.msha.gov/30cfr/75.0.htm#.U16F6fldVTx. ◆
Development of an atmospheric data-management system for underground coal mines
The Journal of The Southern African Institute of Mining and Metallurgy VOLUME 114 DECEMBER 2014 1063 ▲
Figure 5—Superposition of barometric pressure and methane concentrations at two different locations for a time period of 7 days

SUBSCRIBEof the SAIMM Journal
For more information please contact:The Southern African Institute of Mining and Metallurgy
Kelly MattheeThe Journal Subscription Department27-11-834-1273/7
OR
In the new world of work, we all have
� to achieve more
� at a faster pace
� with less resources
� against greater competition
� in a global economy tougher than ever before
The SAIMM Journal gives you the edge!� with cutting-edge research
� new knowledge on old subjects
� in-depth analysis
Founded 1894
SAIMMJOURNAL OF THE SOUTHERN AFRICAN INSTITUTE OF MINING AND METALLURGY
VOLUME 111 NO. 1 JANUARY 2011
All papers in this edition were presented at the Second Hardrock Safe
SAFETY CONFERENCE 2010—Zero Harm
Founded 1894
SAIMMJOURNAL OF THE SOUTHERN AFRICAN INSTITUTE OF MINING AND METALLURGY
VOLUME 111 NO. 8 AUGUST 2011
The first four papers published in this edition of the Journal were presented inMay 2010, at the Mine and Occupational Health and Safety Seminar
of Brink Cohen and Le Roux Inc. and LexisNexis
TO 12 ISSUESJanuary to December 2015
per annum per subscription
✫ Less 15% discount to agents only
✫ PRE-PAYMENT is required
✫ The Journal is printed monthly
✫ Surface mail postage included
✫ ISSN 2225-6253
R1 800.00LOCAL
US$486.50OVERSEAS
�
✆
✉ P O Box 61127, MARSHALLTOWN,2107, South Africa
[email protected] [email protected]: http://www.saimm.co.za
The SAIMM Journal—all you need to know!
A serious, ‘must read’ that equips you for your industry—Subscribe today!

The Journal of The Southern African Institute of Mining and Metallurgy DECEMBER 2014 ▲ix
11 – 12 March 2015 —
24–25 March 2015 — Accessing Africa’s Mineral Wealth:Mining Transport Infrastructure and Logistics ConferenceEmperors Palace Hotel Casino Convention Resort, Johannesburg
29 March–3 April 2015 —
E-mail: [email protected]
7–10 April 2015 —
E-mail: [email protected]
12–13 May 2015 —
E-mail: [email protected]
10–11 June 2015 —
24–25 June 2015 —
E-mail: [email protected]
6–8 July 2015 — The 8th Southern African Base MetalsConferenceZambezi Sun Hotel, Victoria Falls, Livingstone, Zambia
E-mail: [email protected]
13–14 July 2015 — School Production of Clean SteelEmperors Palace, Johannesburg
E-mail: [email protected]
15–17 July 2015 —
5–8 August 2015 —
E-mail: [email protected]
11–14 August 2015 —
19–20 August 2015 —
E-mail: [email protected]
28 September – 2 October 2015 —
12–14 October 2015 —
E-mail: [email protected]
20–21 October 2015 — Young Professionals 2015 Conference
28–30 October 2015 —
E-mail: [email protected]
8–13 November 2015 —
E-mail: [email protected]
INTERNATIONAL ACTIVITIES

▲
x DECEMBER 2014 The Journal of The Southern African Institute of Mining and Metallurgy
Company AffiliatesThe following organizations have been admitted to the Institute as Company Affiliates

2015◆ CONFERENCE
Mining Business Optimisation Conference11–12 March 2015, Mintek, Randburg, Johannesburg, South Africa
◆ CONFERENCEAccessing Africa’s Mineral Wealth24–25 March 2015, Emperors Palace Hotel Casino Convention Resort,Johannesburg, South Africa
◆ CONFERENCE5th Sulphur and Sulphuric Acid 2015 Conference7–10 April 2015, Southern Sun Elangeni Maharani, KwaZulu-Natal
◆ CONFERENCEMining, Environment and Society Conference12–13 May 2015, Mintek, Randburg, South Africa
◆ CONFERENCERisks in Mining 2015 Conference10–11 June 2015, Johannesburg, South Africa
◆ CONFERENCEMine to Market Conference 201524 –25 June 2015, South Africa
◆ CONFERENCEThe 8th Southern African Base Metals Conference6–8 July 2015, Zambezi Sun Hotel, Victoria Falls, Livingstone, Zambia
◆ SCHOOLSchool Production of Clean Steel13–14 July 2015, Emperors Palace, Johannesburg, South Africa
◆ CONFERENCEVirtual Reality (VR) and spatial information applications in themining industry Conference15–17 July 2015, University of Pretoria, Pretoria, South Africa
◆ CONFERENCEMinProc 2015 Conference5–8 August 2015, Western Cape, South Africa
◆ CONFERENCEThe Tenth International Heavy Minerals Conference11–14 August 2015, Sun City, South Africa
◆ CONFERENCEThe Danie Krige Geostatistical Conference19–20 August 2015, Johannesburg, South Africa
◆ CONFERENCEWORLDGOLD Conference 201528 September – 2 October 2015, Misty Hills, Gauteng, South Africa
◆ SYMPOSIUMInternational Symposium on slope stability in open pit mining and civil engineering12–14 October 2015, Cape Town Convention Centre, Cape Town
◆ CONFERENCEYoung Professionals 2015 Conference20–21 October 2015, Mintek, Randburg, Johannesburg, South Africa
◆ CONFERENCENuclear Materials Development Network Conference (AMI)28–30 October 2015, Nelson Mandela Metropolitan University, North Campus Conference Centre, Port Elizabeth
◆ SYMPOSIUM23rd International Symposium on Mine Planning & EquipmentSelection MPES 20158–13 November 2015, Sandton Convention Centre, Johannesburg, South Africa
SAIMM DIARY
Forthcoming SAIMM events...
For further information contact:Conferencing, SAIMM
P O Box 61127, Marshalltown 2107Tel: (011) 834-1273/7
Fax: (011) 833-8156 or (011) 838-5923E-mail: [email protected]
For the past 120 years, the SouthernAfrican Institute of Mining andMetallurgy, has promoted technical
excellence in the minerals industry. Westrive to continuously stay at thecutting edge of new developments inthe mining and metallurgy industry.The SAIMM acts as the corporatevoice for the mining and metallurgyindustry in the South African economy.We actively encourage contact andnetworking between members and thestrengthening of ties. The SAIMMoffers a variety of conferences that aredesigned to bring you technicalknowledge and information of interestfor the good of the industry. Here is aglimpse of the events we have lined upfor 2015. Visit our website for moreinformation.
Website: http://www.saimm.co.za
EXHIBITS/SPONSORSHIP
Companies wishing to sponsor
and/or exhibit at any of these
events should contact the
conference co-ordinator
as soon as possible

© New Concept Mining 2014Patents Pending
Integrated systems of support
+27 11 494 6000www.ncm.co.za
Applying Poka Yokesin the mining industry